annual report - blackrock.com · annual report blackrock global ... (except with respect to fixed...
TRANSCRIPT

OCTOBER 31, 2017
ANNUAL REPORT
BlackRock Global Allocation Fund, Inc.
Not FDIC Insured • May Lose Value • No Bank Guarantee

The Markets in Review
Dear Shareholder,
In the 12 months ended October 31, 2017, risk assets, such as stocks and high-yield bonds, continuedto deliver strong performance. These markets showed great resilience during a period with big politicalsurprises, including the aftermath of the U.K.’s vote to leave the European Union and the outcome ofthe U.S. presidential election, which brought only brief spikes in equity market volatility. In contrast,closely watched elections in France, the Netherlands, and Australia countered the isolationist and na-tionalist political developments in the U.K. and the United States.
Interest rates rose, which worked against high-quality assets with more interest rate sensitivity. Con-sequently, longer-term U.S. Treasuries posted negative returns, as rising energy prices, modest wageincreases, and steady job growth led to expectations of higher inflation and further interest rate in-creases by the U.S. Federal Reserve (the “Fed”).
The market’s performance reflected reflationary expectations early in the reporting period, as investorsbegan to sense that a global recovery was afoot. Thereafter, many countries throughout the worldexperienced sustained and synchronized growth for the first time since the financial crisis. Growthrates and inflation are still relatively low, but they are finally rising together.
The Fed responded to these positive developments by increasing short-term interest rates three timesand setting expectations for additional interest rate increases. The Fed also began reducing the vastbalance sheet reserves that had accumulated in the wake of the financial crisis. In October 2017, theFed reduced its $4.5 trillion balance sheet by only $10 billion, while setting expectations for additionalmodest reductions and rate hikes in 2018.
By contrast, the European Central Bank (“ECB”) and the Bank of Japan (“BoJ”) both continued to ex-pand their balance sheets despite nascent signs of sustained economic growth. The Eurozone andJapan are both approaching the limits of central banks’ ownership share of debt issued by their re-spective governments, which is a structural pressure point that limits their capacity to deliver additionalmonetary stimulus. In October 2017, the ECB announced plans to cut the amount of its bond pur-chases in half for 2018, while the BoJ reiterated its commitment to economic stimulus until the inflationrate rises to its target of 2.0%.
Emerging market growth also stabilized, as accelerating growth in China, the second largest economyin the world and the most influential of all developing economies, improved the outlook for corporateprofits and economic growth across most developing nations. Chinese demand for commodities andother raw materials allayed concerns about the country’s banking system, leading to rising equityprices and foreign investment flows.
While escalating tensions between the United States and North Korea and our nation’s divided politicsare significant concerns, benign credit conditions, modest inflation, solid corporate earnings, and thepositive outlook for growth in the world’s largest economies have kept markets relatively tranquil.
High valuations across most assets have laid the groundwork for muted returns going forward. At cur-rent valuation levels, potential equity gains will likely be closely tied to the pace of earnings growth,which has remained solid thus far in 2017, particularly in emerging markets. In this environment,investors need to think globally, extend their scope across a broad array of asset classes, and be nim-ble as market conditions change. We encourage you to talk with your financial advisor and visitblackrock.com for further insight about investing in today’s markets.
Sincerely,
Rob KapitoPresident, BlackRock Advisors, LLC
Rob KapitoPresident, BlackRock Advisors, LLC
Total Returns as of October 31, 2017
6-month 12-month
U.S. large cap equities(S&P 500® Index)
9.10% 23.63%
U.S. small cap equities(Russell 2000® Index)
8.01 27.85
International equities(MSCI Europe, Australasia,Far East Index)
10.74 23.44
Emerging market equities(MSCI Emerging Markets Index)
16.14 26.45
3-month Treasury bills(BofA Merrill Lynch 3-MonthU.S. Treasury Bill Index)
0.49 0.72
U.S. Treasury securities(BofA Merrill Lynch10-Year U.S. TreasuryIndex)
0.15 (2.98)
U.S. investment grade bonds(Bloomberg Barclays U.S.Aggregate Bond Index)
1.58 0.90
Tax-exempt municipal bonds(S&P Municipal Bond Index)
2.22 1.80
U.S. high yield bonds(Bloomberg Barclays U.S.Corporate High Yield 2% IssuerCapped Index)
3.44 8.92
Past performance is no guarantee of future results. Indexperformance is shown for illustrative purposes only. Youcannot invest directly in an index.
2 T H I S P A G E I S N O T P A R T O F Y O U R F U N D R E P O R T

Table of Contents
Page
The Markets in Review . . . . . . . . . . . . . . . . . . . . . . . . . . . . . . . . . . . . . . . . . . . . . . . . . . . . . . . . . . . . . . . . . . . . . . . . . . . . . . . . . . . . . . . . . . . . . . . . . . . . . . . . . . . . . . . . . . . . . . . . 2Annual Report:
Fund Summary . . . . . . . . . . . . . . . . . . . . . . . . . . . . . . . . . . . . . . . . . . . . . . . . . . . . . . . . . . . . . . . . . . . . . . . . . . . . . . . . . . . . . . . . . . . . . . . . . . . . . . . . . . . . . . . . . . . . . . . . . . . . . . 4Portfolio Information . . . . . . . . . . . . . . . . . . . . . . . . . . . . . . . . . . . . . . . . . . . . . . . . . . . . . . . . . . . . . . . . . . . . . . . . . . . . . . . . . . . . . . . . . . . . . . . . . . . . . . . . . . . . . . . . . . . . . . . . . . . 6About Fund Performance . . . . . . . . . . . . . . . . . . . . . . . . . . . . . . . . . . . . . . . . . . . . . . . . . . . . . . . . . . . . . . . . . . . . . . . . . . . . . . . . . . . . . . . . . . . . . . . . . . . . . . . . . . . . . . . . . . . . . . . 7Disclosure of Expenses . . . . . . . . . . . . . . . . . . . . . . . . . . . . . . . . . . . . . . . . . . . . . . . . . . . . . . . . . . . . . . . . . . . . . . . . . . . . . . . . . . . . . . . . . . . . . . . . . . . . . . . . . . . . . . . . . . . . . . . . 8Derivative Financial Instruments . . . . . . . . . . . . . . . . . . . . . . . . . . . . . . . . . . . . . . . . . . . . . . . . . . . . . . . . . . . . . . . . . . . . . . . . . . . . . . . . . . . . . . . . . . . . . . . . . . . . . . . . . . . . . . . . . . 8Financial Statements:
Consolidated Schedule of Investments . . . . . . . . . . . . . . . . . . . . . . . . . . . . . . . . . . . . . . . . . . . . . . . . . . . . . . . . . . . . . . . . . . . . . . . . . . . . . . . . . . . . . . . . . . . . . . . . . . . . . . . . . . . 9Consolidated Statement of Assets and Liabilities . . . . . . . . . . . . . . . . . . . . . . . . . . . . . . . . . . . . . . . . . . . . . . . . . . . . . . . . . . . . . . . . . . . . . . . . . . . . . . . . . . . . . . . . . . . . . . . . . . . 28Consolidated Statement of Operations . . . . . . . . . . . . . . . . . . . . . . . . . . . . . . . . . . . . . . . . . . . . . . . . . . . . . . . . . . . . . . . . . . . . . . . . . . . . . . . . . . . . . . . . . . . . . . . . . . . . . . . . . . . 29Consolidated Statements of Changes in Net Assets . . . . . . . . . . . . . . . . . . . . . . . . . . . . . . . . . . . . . . . . . . . . . . . . . . . . . . . . . . . . . . . . . . . . . . . . . . . . . . . . . . . . . . . . . . . . . . . . . 30
Consolidated Financial Highlights . . . . . . . . . . . . . . . . . . . . . . . . . . . . . . . . . . . . . . . . . . . . . . . . . . . . . . . . . . . . . . . . . . . . . . . . . . . . . . . . . . . . . . . . . . . . . . . . . . . . . . . . . . . . . . . . . 31Notes to Consolidated Financial Statements . . . . . . . . . . . . . . . . . . . . . . . . . . . . . . . . . . . . . . . . . . . . . . . . . . . . . . . . . . . . . . . . . . . . . . . . . . . . . . . . . . . . . . . . . . . . . . . . . . . . . . . . . 37Report of Independent Registered Public Accounting Firm . . . . . . . . . . . . . . . . . . . . . . . . . . . . . . . . . . . . . . . . . . . . . . . . . . . . . . . . . . . . . . . . . . . . . . . . . . . . . . . . . . . . . . . . . . . . . . 51Important Tax Information . . . . . . . . . . . . . . . . . . . . . . . . . . . . . . . . . . . . . . . . . . . . . . . . . . . . . . . . . . . . . . . . . . . . . . . . . . . . . . . . . . . . . . . . . . . . . . . . . . . . . . . . . . . . . . . . . . . . . . 52Disclosure of Investment Advisory Agreement . . . . . . . . . . . . . . . . . . . . . . . . . . . . . . . . . . . . . . . . . . . . . . . . . . . . . . . . . . . . . . . . . . . . . . . . . . . . . . . . . . . . . . . . . . . . . . . . . . . . . . . 53Director and Officer Information . . . . . . . . . . . . . . . . . . . . . . . . . . . . . . . . . . . . . . . . . . . . . . . . . . . . . . . . . . . . . . . . . . . . . . . . . . . . . . . . . . . . . . . . . . . . . . . . . . . . . . . . . . . . . . . . . . 56Additional Information . . . . . . . . . . . . . . . . . . . . . . . . . . . . . . . . . . . . . . . . . . . . . . . . . . . . . . . . . . . . . . . . . . . . . . . . . . . . . . . . . . . . . . . . . . . . . . . . . . . . . . . . . . . . . . . . . . . . . . . . . 60Glossary of Terms Used in this Report . . . . . . . . . . . . . . . . . . . . . . . . . . . . . . . . . . . . . . . . . . . . . . . . . . . . . . . . . . . . . . . . . . . . . . . . . . . . . . . . . . . . . . . . . . . . . . . . . . . . . . . . . . . . . 62
3

Fund Summary as of October 31, 2017 BlackRock Global Allocation Fund, Inc.
Investment Objective
BlackRock Global Allocation Fund, Inc.’s (the “Fund”) investment objective is to provide high total investment return through a fully managed investment policyutilizing United States and foreign equity securities, debt and money market securities, the combination of which will be varied from time to time both with respect to typesof securities and markets in response to changing market and economic trends. Total return means the combination of capital growth and investment income.
Portfolio Management Commentary
How did the Fund perform?
• For the 12-month period ended October 31, 2017, the Fund underperformed both its reference benchmark, which is comprised of the S&P 500® Index (36%), FTSEWorld (ex-U.S.) Index (24%), BofA Merrill Lynch Current 5-Year U.S. Treasury Index (24%) and Citigroup Non-U.S. Dollar World Government Bond Index (16%) (the“Reference Benchmark”), and the broad-based all-equity benchmark, the FTSE World Index. The Fund invests in both equities and bonds; therefore, the ReferenceBenchmark provides a truer representation of the Fund’s composition and a more comparable means for measurement. The following discussion of relativeperformance pertains to the Reference Benchmark. The following commentary (and referenced allocation percentages) are based on the economic exposures of theFund, which reflect adjustments for futures, swaps and options (except with respect to fixed income securities) and convertible bonds, and may vary relative to themarket value.
What factors influenced performance?
• An underweight to broad equities detracted from performance. From a sector perspective, stock selection within and an underweight to information technology (“IT”)negatively impacted returns, as did stock selection in health care. Exposure to commodity-related securities (notably gold) and to cash and cash equivalents detractedfrom performance. Currency management, notably an underweight to the British pound sterling, negatively impacted performance as well.
• Within equities, an overweight to Japan contributed to performance. From a sector perspective, an underweight and stock selection in consumer staples positivelyimpacted performance, as did stock selection in financials, materials, utilities, consumer discretionary and industrials. Within energy, stock selection contributed,although this was partially offset by an overweight to the sector. An underweight in fixed income positively impacted performance, and exposure to credit within fixedincome was additive as well.
• The Fund uses derivatives, which include options, futures, swaps and forward contracts, both to seek to enhance returns of the Fund and to hedge (or protect) againstadverse movements in currency exchange rates, interest rates and movements in the securities markets. During the period, the Fund’s use of derivatives positivelycontributed to the Fund’s performance.
Describe recent portfolio activity.
• During the 12-month period, the Fund’s overall equity allocation increased from 56% to 62% of net assets. Within equities, the Fund increased exposure to the UnitedStates and Europe and decreased exposure to Japan. On a sector basis, the Fund increased exposure to energy, IT, utilities, materials, consumer discretionary, healthcare, telecommunication services (“telecom”) and consumer staples, and reduced exposure to financials, real estate and industrials.
• The Fund’s allocation to fixed income decreased from 32% to 31% of net assets. Within fixed income, the Fund increased exposure to government debt, notably in theUnited States, Brazil and Australia, and reduced exposure to European sovereign debt and corporate bonds.
• The Fund’s overall allocation to commodity-related securities remained unchanged at 4%.
• Reflecting the changes in the Fund’s overall allocations to the equity, fixed income, and commodity-related asset classes during the period, the Fund’s cash and cashequivalent holdings decreased from 8% to 3% of net assets. During the 12-month period, cash was used to help mitigate portfolio volatility and served as a source offunds for new investments.
Describe portfolio positioning at period end
• Relative to its Reference Benchmark, the Fund ended the period overweight in equities, underweight in fixed income, and overweight in commodity-related securitiesand cash and cash equivalents. Within the equity segment, the Fund was overweight in Japan and Europe, and was underweight in the United States. Within Europe,the Fund was overweight in the Netherlands and France, and underweight in Denmark. From a sector perspective, the Fund was overweight in energy, consumerdiscretionary, telecom, utilities and materials, and was underweight in financials, consumer staples, IT and real estate.
• Within fixed income, the Fund was underweight in developed European sovereign debt, US Treasuries and Japanese government bonds, and overweight ingovernment bonds in Brazil, Australia, Poland, Argentina and Mexico. In addition, the Fund was overweight in corporate debt.
• With respect to currency exposure, the Fund was overweight in the U.S. dollar, Indian rupee and Brazilian real, and underweight in the Canadian dollar, euro, andBritish pound sterling.
The views expressed reflect the opinions of BlackRock as of the date of this report and are subject to change based on changes in market, economic or other conditions.These views are not intended to be a forecast of future events and are no guarantee of future results.
4 2 0 1 7 B L A C K R O C K A N N U A L R E P O R T T O S H A R E H O L D E R S

Fund Summary as of October 31, 2017 (continued) BlackRock Global Allocation Fund, Inc.
T O T A L R E T U R N B A S E D O N A $ 1 0 , 0 0 0 I N V E S T M E N T
$15,520$15,233$14,043
$15,931
5,000
10,000
15,000
$20,000
Oct 17Oct 16Oct 15Oct 13 Oct 14Oct 12Oct 11Oct 10Oct 09Oct 08
Investor A Shares(a)(b) Reference Benchmark(d)Institutional Shares(a)(b) FTSE World Index(c)
Oct 07
(a) Assuming maximum sales charges, if any, transaction costs and other operating expenses, including advisory fees. Institutional Shares do not have a sales charge.(b) The Fund invests in a portfolio of U.S. and foreign equity securities, debt and money market securities, the combination of which will be varied from time to time with respect to types of
securities and markets in response to changing market and economic trends.(c) This unmanaged capitalization-weighted index is comprised of 2,584 equities from 35 countries in 4 regions, including the United States.(d) The Reference Benchmark is an unmanaged weighted index comprised as follows: 36% S&P 500® Index; 24% FTSE World (ex-U.S.) Index; 24% BofA Merrill Lynch Current 5-Year U.S.
Treasury Index; and 16% Citigroup Non-U.S. Dollar World Government Bond Index.
Descriptions of these indexes can be found in the footnotes below.
Performance Summary for the Period Ended October 31, 2017
Average Annual Total Returns (e)
1 Year 5 Years 10 Years
6-MonthTotal Returns
w/o salescharge
w/salescharge
w/o salescharge
w/salescharge
w/o salescharge
w/salescharge
Institutional . . . . . . . . . . . . . . . . . . . . . . . . . . . . . . . . . . . . . . . . . . . 5.57% 13.10% N/A 6.66% N/A 4.30% N/AInvestor A . . . . . . . . . . . . . . . . . . . . . . . . . . . . . . . . . . . . . . . . . . . . 5.41 12.77 6.85 6.37 5.23% 4.01 3.45%Investor B . . . . . . . . . . . . . . . . . . . . . . . . . . . . . . . . . . . . . . . . . . . . 4.92 11.72 7.22 5.48 5.15 3.34 3.34Investor C . . . . . . . . . . . . . . . . . . . . . . . . . . . . . . . . . . . . . . . . . . . . 5.04 11.92 10.92 5.59 5.59 3.24 3.24Class K . . . . . . . . . . . . . . . . . . . . . . . . . . . . . . . . . . . . . . . . . . . . . . 5.61 13.20 N/A 6.74 N/A 4.37 N/AClass R . . . . . . . . . . . . . . . . . . . . . . . . . . . . . . . . . . . . . . . . . . . . . . 5.29 12.42 N/A 6.01 N/A 3.66 N/A
FTSE World Index . . . . . . . . . . . . . . . . . . . . . . . . . . . . . . . . . . . . . . 10.12 23.69 N/A 11.66 N/A 4.49 N/AReference Benchmark . . . . . . . . . . . . . . . . . . . . . . . . . . . . . . . . . . . 6.60 13.42 N/A 7.41 N/A 4.77 N/AU.S. Stocks: S&P 500® Index(f) . . . . . . . . . . . . . . . . . . . . . . . . . . . . 9.10 23.63 N/A 15.18 N/A 7.52 N/ANon-U.S. Stocks: FTSE World (ex-U.S.) Index(g) . . . . . . . . . . . . . . . . 11.38 23.49 N/A 8.02 N/A 1.59 N/AU.S. Bonds: BofA Merrill Lynch Current 5-Year U.S.
Treasury Index(h) . . . . . . . . . . . . . . . . . . . . . . . . . . . . . . . . . . . . . 0.06 (1.46) N/A 0.80 N/A 3.68 N/ANon-U.S. Bonds: Citigroup Non-U.S. Dollar World Government
Bond Index(i) . . . . . . . . . . . . . . . . . . . . . . . . . . . . . . . . . . . . . . . . 3.99 0.73 N/A (1.06) N/A 2.41 N/A(e) Assuming maximum sales charges, if any. Average annual total returns with and without sales charges reflect reductions for distribution and service fees. See “About Fund
Performance” on page 7 for a detailed description of share classes, including any related sales charges and fees.(f) This unmanaged index covers 500 leading companies and captures approximately 80% coverage of available market capitalization.(g) This unmanaged capitalization-weighted index is comprised of 1,969 equities from 34 countries, excluding the United States.(h) This unmanaged index is designed to track the total return of the current coupon five-year U.S. Treasury bond.(i) This unmanaged market capitalization-weighted index tracks 22 government bond indexes, excluding the United States.
N/A — Not applicable as share class and index do not have a sales charge.
Past performance is not indicative of future results.
Performance results may include adjustments made for financial reporting purposes in accordance with U.S. generally accepted accounting principles.
F U N D S U M M A R Y 5

Fund Summary as of October 31, 2017 (continued) BlackRock Global Allocation Fund, Inc.
Portfolio Information
OVERALL ASSET EXPOSURE
Percent of Fund’sNet Assets (a)
ReferenceBenchmark (b)
Percentages10/31/17 10/31/16
US Equities . . . . . . . . . . . . . . . . . . . . . . . . . . . . . . . . . . . . . . . . . . . . . . . . . . . . . . . . . . . . . . . . . . . . . . . . . . . . . . . . . . . . . . . . . . . 31% 26% 35%European Equities . . . . . . . . . . . . . . . . . . . . . . . . . . . . . . . . . . . . . . . . . . . . . . . . . . . . . . . . . . . . . . . . . . . . . . . . . . . . . . . . . . . . . . 16 13 13Asia Pacific Equities . . . . . . . . . . . . . . . . . . . . . . . . . . . . . . . . . . . . . . . . . . . . . . . . . . . . . . . . . . . . . . . . . . . . . . . . . . . . . . . . . . . . 14 15 9Other Equities . . . . . . . . . . . . . . . . . . . . . . . . . . . . . . . . . . . . . . . . . . . . . . . . . . . . . . . . . . . . . . . . . . . . . . . . . . . . . . . . . . . . . . . . . 1 2 3
Total Equities . . . . . . . . . . . . . . . . . . . . . . . . . . . . . . . . . . . . . . . . . . . . . . . . . . . . . . . . . . . . . . . . . . . . . . . . . . . . . . . . . . . . . . . . . 62 56 60
US Dollar Denominated Fixed Income Securities . . . . . . . . . . . . . . . . . . . . . . . . . . . . . . . . . . . . . . . . . . . . . . . . . . . . . . . . . . . . . . . 22 20 24U.S. Issuers . . . . . . . . . . . . . . . . . . . . . . . . . . . . . . . . . . . . . . . . . . . . . . . . . . . . . . . . . . . . . . . . . . . . . . . . . . . . . . . . . . . . . . . . 19 16 —Non-U.S. Issuers . . . . . . . . . . . . . . . . . . . . . . . . . . . . . . . . . . . . . . . . . . . . . . . . . . . . . . . . . . . . . . . . . . . . . . . . . . . . . . . . . . . . 3 4 —
Non-U.S. Dollar Denominated Fixed Income Securities . . . . . . . . . . . . . . . . . . . . . . . . . . . . . . . . . . . . . . . . . . . . . . . . . . . . . . . . . . . 9 12 16
Total Fixed Income Securities . . . . . . . . . . . . . . . . . . . . . . . . . . . . . . . . . . . . . . . . . . . . . . . . . . . . . . . . . . . . . . . . . . . . . . . . . . . . . 31 32 40
Commodity-Related . . . . . . . . . . . . . . . . . . . . . . . . . . . . . . . . . . . . . . . . . . . . . . . . . . . . . . . . . . . . . . . . . . . . . . . . . . . . . . . . . . . . . 4 4 —
Cash & Short-Term Securities . . . . . . . . . . . . . . . . . . . . . . . . . . . . . . . . . . . . . . . . . . . . . . . . . . . . . . . . . . . . . . . . . . . . . . . . . . . . . 3 8 —
(a) Exposure based on market value and adjusted for the economic value of futures, swaps and options (except with respect to fixed income securities), and convertible bonds.(b) The Reference Benchmark is an unmanaged weighted index comprised as follows: 36% of the S&P 500 Index®; 24% FTSE World (ex U.S.) Index; 24% BofA Merrill Lynch Current
5-Year U.S. Treasury Index; and 16% Citigroup Non-U.S. Dollar World Government Bond Index. Descriptions of these indexes are found on page 5 of this report to shareholders inthe “Performance Summary” section.
GEOGRAPHIC ALLOCATION
CountryPercent of
Total Investments (a)
United States . . . . . . . . . . . . . . . . . . . . . . . . . . . . . . . . . . . . . 58%Japan . . . . . . . . . . . . . . . . . . . . . . . . . . . . . . . . . . . . . . . . . . . 10United Kingdom . . . . . . . . . . . . . . . . . . . . . . . . . . . . . . . . . . . 4France . . . . . . . . . . . . . . . . . . . . . . . . . . . . . . . . . . . . . . . . . . 3Germany . . . . . . . . . . . . . . . . . . . . . . . . . . . . . . . . . . . . . . . . 3Australia . . . . . . . . . . . . . . . . . . . . . . . . . . . . . . . . . . . . . . . . . 2Brazil . . . . . . . . . . . . . . . . . . . . . . . . . . . . . . . . . . . . . . . . . . . 2Netherlands . . . . . . . . . . . . . . . . . . . . . . . . . . . . . . . . . . . . . . 2India . . . . . . . . . . . . . . . . . . . . . . . . . . . . . . . . . . . . . . . . . . . 2Canada . . . . . . . . . . . . . . . . . . . . . . . . . . . . . . . . . . . . . . . . . 1Other(b) . . . . . . . . . . . . . . . . . . . . . . . . . . . . . . . . . . . . . . . . . 13
(a) Excludes short-term securities, options purchased and options written.(b) Includes holdings within countries and geographic regions that are 1% or less of
long-term investments. Please refer to the Consolidated Schedule of Investments forsuch countries.
TEN LARGEST HOLDINGS (EQUITY INVESTMENTS)
SecurityPercent of
Total Investments (a)
Microsoft Corp. . . . . . . . . . . . . . . . . . . . . . . . . . . . . . . . . . . . . 2%Apple, Inc. . . . . . . . . . . . . . . . . . . . . . . . . . . . . . . . . . . . . . . . 1Alphabet, Inc. . . . . . . . . . . . . . . . . . . . . . . . . . . . . . . . . . . . . . 1Amazon.com, Inc. . . . . . . . . . . . . . . . . . . . . . . . . . . . . . . . . . . 1Bank of America Corp. . . . . . . . . . . . . . . . . . . . . . . . . . . . . . . 1DowDuPont, Inc. . . . . . . . . . . . . . . . . . . . . . . . . . . . . . . . . . . 1Danone SA . . . . . . . . . . . . . . . . . . . . . . . . . . . . . . . . . . . . . . 1Uber Technologies, Inc. . . . . . . . . . . . . . . . . . . . . . . . . . . . . . 1Comcast Corp. . . . . . . . . . . . . . . . . . . . . . . . . . . . . . . . . . . . . 1QUALCOMM, Inc. . . . . . . . . . . . . . . . . . . . . . . . . . . . . . . . . . 1
6 2 0 1 7 B L A C K R O C K A N N U A L R E P O R T T O S H A R E H O L D E R S

About Fund Performance
Institutional and Class K Shares are not subject to any sales charge. These shares bear no ongoing distribution or service fees and are available only to certain eligibleinvestors. Prior to the Class K Shares’ inception date of June 8, 2016, Class K Share performance results are those of Institutional Shares (which have no distribution orservice fees) and were restated to reflect Class K Share fees.
Investor A Shares are subject to a maximum initial sales charge (front-end load) of 5.25% and a service fee of 0.25% per year (but no distribution fee). Certainredemptions of these shares may be subject to a contingent deferred sales charge (“CDSC”) where no initial sales charge was paid at the time of purchase. These sharesare generally available through financial intermediaries.
Investor B Shares are subject to a maximum CDSC of 4.50% declining to 0% after six years. In addition, these shares are subject to a distribution fee of 0.75% per yearand a service fee of 0.25% per year. These shares automatically convert to Investor A Shares after approximately eight years. (There is no initial sales charge forautomatic share conversions.) All returns for periods greater than eight years reflect this conversion. These shares are only available through exchanges and distributionreinvestment by current holders and for purchase by certain employer-sponsored retirement plans. Effective on or about the close of business on December 27, 2017, allissued and outstanding investor B Shares will be converted to investor A Shares.
Investor C Shares are subject to a 1.00% CDSC if redeemed within one year of purchase. In addition, these shares are subject to a distribution fee of 0.75% per year anda service fee of 0.25% per year. These shares are generally available through financial intermediaries.
Class R Shares are not subject to any sales charge. These shares are subject to a distribution fee of 0.25% per year and a service fee of 0.25% per year. These sharesare available only to certain employer-sponsored retirement plans.
Performance information reflects past performance and does not guarantee future results. Current performance may be lower or higher than the performance data quoted.Refer to www.blackrock.com to obtain performance data current to the most recent month end. Performance results do not reflect the deduction of taxes that ashareholder would pay on fund distributions or the redemption of fund shares. Figures shown in the performance table on the previous page assume reinvestment of alldistributions, if any, at net asset value (“NAV”) on the ex-dividend date. Investment return and principal value of shares will fluctuate so that shares, when redeemed, maybe worth more or less than their original cost. Distributions paid to each class of shares will vary because of the different levels of service, distribution and transfer agencyfees applicable to each class, which are deducted from the income available to be paid to shareholders.
BlackRock Advisors, LLC (the “Manager”), the Fund’s investment adviser voluntarily waived a portion of its expenses. Without such waiver, the Fund’s performance wouldhave been lower. The Manager is under no obligation to waive or to continue waiving its fees and such voluntary waiver may be reduced or discontinued at any time. SeeNote 6 of the Notes to Consolidated Financial Statements for additional information on waivers.
A B O U T F U N D P E R F O R M A N C E 7

Disclosure of Expenses BlackRock Global Allocation Fund, Inc.
Shareholders of the Fund may incur the following charges: (a) transactional expenses, such as sales charges; and (b) operating expenses, including investment advisoryfees, service and distribution fees, including 12b-1 fees, acquired fund fees and expenses, and other fund expenses. The expense example shown below (which is basedon a hypothetical investment of $1,000 invested on May 1, 2017 and held through October 31, 2017, is intended to assist shareholders both in calculating expenses basedon an investment in the Fund and in comparing these expenses with similar costs of investing in other mutual funds.
The expense example provides information about actual account values and actual expenses. In order to estimate the expenses a shareholder paid during the periodcovered by this report, shareholders can divide their account value by $1,000 and then multiply the result by the number corresponding to their share class under theheading entitled “Expenses Paid During the Period.”
The expense example also provides information about hypothetical account values and hypothetical expenses based on the Fund’s actual expense ratio and an assumedrate of return of 5% per year before expenses. In order to assist shareholders in comparing the ongoing expenses of investing in the Fund and other funds, compare the5% hypothetical example with the 5% hypothetical examples that appear in shareholder reports of other funds.
The expenses shown in the expense example are intended to highlight shareholders’ ongoing costs only and do not reflect any transactional expenses, such as salescharges, if any. Therefore, the hypothetical example is useful in comparing ongoing expenses only, and will not help shareholders determine the relative total expenses ofowning different funds. If these transactional expenses were included, shareholder expenses would have been higher.
Expense Example
Actual Hypothetical (c)
Expenses Paid During the Period
Including Dividend Expenseand Broker Fees and
Expenses on Short Sales
Excluding Dividend Expenseand Broker Fees and
Expenses on Short Sales
BeginningAccount Value
(05/01/17)
EndingAccount Value
(10/31/17)
IncludingDividend
Expense andBroker Fees and
Expenses onShort Sales (a)
ExcludingDividend
Expense andBroker Fees and
Expenses onShort Sales (b)
BeginningAccount Value
(05/01/17)
EndingAccount Value
(10/31/17)
ExpensesPaid During
thePeriod (a)
EndingAccount Value
(10/31/17)
ExpensesPaid During
thePeriod (b)
Institutional . . . . . . . . . . $ 1,000.00 $ 1,055.70 $ 4.25 $ 4.15 $ 1,000.00 $ 1,021.07 $ 4.18 $ 1,021.17 $ 4.08Investor A . . . . . . . . . . . $ 1,000.00 $ 1,054.10 $ 5.64 $ 5.54 $ 1,000.00 $ 1,019.71 $ 5.55 $ 1,019.81 $ 5.45Investor B . . . . . . . . . . . $ 1,000.00 $ 1,049.20 $ 10.69 $ 10.69 $ 1,000.00 $ 1,014.77 $ 10.51 $ 1,014.77 $ 10.51Investor C . . . . . . . . . . . $ 1,000.00 $ 1,050.40 $ 9.46 $ 9.41 $ 1,000.00 $ 1,015.98 $ 9.30 $ 1,016.03 $ 9.25Class K . . . . . . . . . . . . . $ 1,000.00 $ 1,056.10 $ 3.84 $ 3.78 $ 1,000.00 $ 1,021.48 $ 3.77 $ 1,021.53 $ 3.72Class R . . . . . . . . . . . . . $ 1,000.00 $ 1,052.90 $ 7.35 $ 7.24 $ 1,000.00 $ 1,018.05 $ 7.22 $ 1,018.15 $ 7.12
(a) For each class of the Fund, expenses are equal to the annualized net expense ratio for the class (0.82% for Institutional, 1.09% for Investor A, 2.07% for Investor B, 1.83% forInvestor C, 0.74% for Class K and 1.42% for Class R), multiplied by the average account value over the period, multiplied by 184/365 (to reflect the one-half year period shown).
(b) For each class of the Fund, expenses are equal to the annualized net expense ratio for the class (0.80% for Institutional, 1.07% for Investor A, 2.07% for Investor B, 1.82% forInvestor C, 0.73% for Class K and 1.40% for Class R), multiplied by the average account value over the period, multiplied by 184/365 (to reflect the one-half year period shown).
(c) Hypothetical 5% annual return before expenses is calculated by prorating the number of days in the most recent fiscal half year divided by 365.
Derivative Financial InstrumentsThe Fund may invest in various derivative financial instruments. These instruments are used to obtain exposure to a security, commodity, index, market, and/or otherassets without owning or taking physical custody of securities, commodities and/or other referenced assets or to manage market, equity, credit, interest rate, foreigncurrency exchange rate, commodity and/or other risks. Derivative financial instruments may give rise to a form of economic leverage and involve risks, including theimperfect correlation between the value of a derivative financial instrument and the underlying asset, possible default of the counterparty to the transaction or illiquidity ofthe instrument. The Fund’s successful use of a derivative financial instrument depends on the investment adviser’s ability to predict pertinent market movementsaccurately, which cannot be assured. The use of these instruments may result in losses greater than if they had not been used, may limit the amount of appreciation theFund can realize on an investment and/or may result in lower distributions paid to shareholders. The Fund’s investments in these instruments, if any, are discussed indetail in the Notes to Consolidated Financial Statements.
8 2 0 1 7 B L A C K R O C K A N N U A L R E P O R T T O S H A R E H O L D E R S
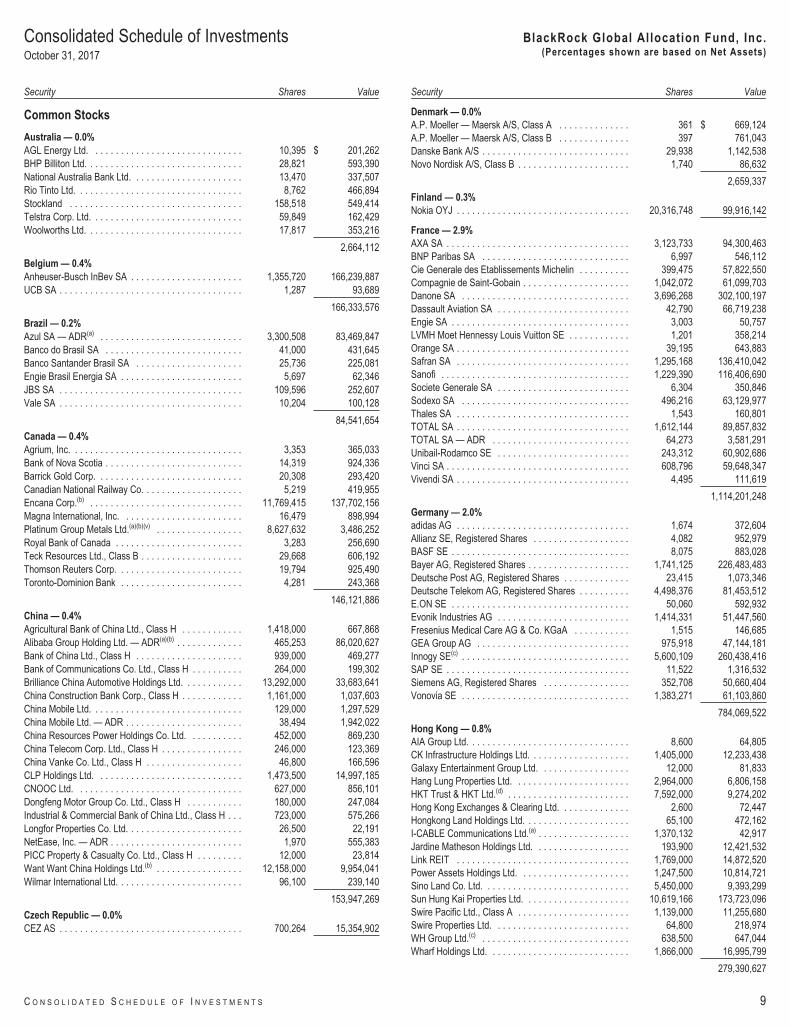
Consolidated Schedule of InvestmentsOctober 31, 2017
BlackRock Global Allocation Fund, Inc.(Percentages shown are based on Net Assets)
Security Shares Value
Common Stocks
Australia — 0.0%
AGL Energy Ltd. . . . . . . . . . . . . . . . . . . . . . . . . . . . . . 10,395 $ 201,262BHP Billiton Ltd. . . . . . . . . . . . . . . . . . . . . . . . . . . . . . . 28,821 593,390National Australia Bank Ltd. . . . . . . . . . . . . . . . . . . . . . 13,470 337,507Rio Tinto Ltd. . . . . . . . . . . . . . . . . . . . . . . . . . . . . . . . . 8,762 466,894Stockland . . . . . . . . . . . . . . . . . . . . . . . . . . . . . . . . . . 158,518 549,414Telstra Corp. Ltd. . . . . . . . . . . . . . . . . . . . . . . . . . . . . . 59,849 162,429Woolworths Ltd. . . . . . . . . . . . . . . . . . . . . . . . . . . . . . . 17,817 353,216
2,664,112
Belgium — 0.4%
Anheuser-Busch InBev SA . . . . . . . . . . . . . . . . . . . . . . 1,355,720 166,239,887UCB SA . . . . . . . . . . . . . . . . . . . . . . . . . . . . . . . . . . . . 1,287 93,689
166,333,576
Brazil — 0.2%
Azul SA — ADR(a) . . . . . . . . . . . . . . . . . . . . . . . . . . . . 3,300,508 83,469,847Banco do Brasil SA . . . . . . . . . . . . . . . . . . . . . . . . . . . 41,000 431,645Banco Santander Brasil SA . . . . . . . . . . . . . . . . . . . . . 25,736 225,081Engie Brasil Energia SA . . . . . . . . . . . . . . . . . . . . . . . . 5,697 62,346JBS SA . . . . . . . . . . . . . . . . . . . . . . . . . . . . . . . . . . . . 109,596 252,607Vale SA . . . . . . . . . . . . . . . . . . . . . . . . . . . . . . . . . . . . 10,204 100,128
84,541,654
Canada — 0.4%
Agrium, Inc. . . . . . . . . . . . . . . . . . . . . . . . . . . . . . . . . . 3,353 365,033Bank of Nova Scotia . . . . . . . . . . . . . . . . . . . . . . . . . . . 14,319 924,336Barrick Gold Corp. . . . . . . . . . . . . . . . . . . . . . . . . . . . . 20,308 293,420Canadian National Railway Co. . . . . . . . . . . . . . . . . . . . 5,219 419,955Encana Corp.(b) . . . . . . . . . . . . . . . . . . . . . . . . . . . . . . 11,769,415 137,702,156Magna International, Inc. . . . . . . . . . . . . . . . . . . . . . . . 16,479 898,994Platinum Group Metals Ltd.(a)(b)(v) . . . . . . . . . . . . . . . . . 8,627,632 3,486,252Royal Bank of Canada . . . . . . . . . . . . . . . . . . . . . . . . . 3,283 256,690Teck Resources Ltd., Class B . . . . . . . . . . . . . . . . . . . . 29,668 606,192Thomson Reuters Corp. . . . . . . . . . . . . . . . . . . . . . . . . 19,794 925,490Toronto-Dominion Bank . . . . . . . . . . . . . . . . . . . . . . . . 4,281 243,368
146,121,886
China — 0.4%
Agricultural Bank of China Ltd., Class H . . . . . . . . . . . . 1,418,000 667,868Alibaba Group Holding Ltd. — ADR(a)(b) . . . . . . . . . . . . . 465,253 86,020,627Bank of China Ltd., Class H . . . . . . . . . . . . . . . . . . . . . 939,000 469,277Bank of Communications Co. Ltd., Class H . . . . . . . . . . 264,000 199,302Brilliance China Automotive Holdings Ltd. . . . . . . . . . . . 13,292,000 33,683,641China Construction Bank Corp., Class H . . . . . . . . . . . . 1,161,000 1,037,603China Mobile Ltd. . . . . . . . . . . . . . . . . . . . . . . . . . . . . . 129,000 1,297,529China Mobile Ltd. — ADR . . . . . . . . . . . . . . . . . . . . . . . 38,494 1,942,022China Resources Power Holdings Co. Ltd. . . . . . . . . . . 452,000 869,230China Telecom Corp. Ltd., Class H . . . . . . . . . . . . . . . . 246,000 123,369China Vanke Co. Ltd., Class H . . . . . . . . . . . . . . . . . . . 46,800 166,596CLP Holdings Ltd. . . . . . . . . . . . . . . . . . . . . . . . . . . . . 1,473,500 14,997,185CNOOC Ltd. . . . . . . . . . . . . . . . . . . . . . . . . . . . . . . . . 627,000 856,101Dongfeng Motor Group Co. Ltd., Class H . . . . . . . . . . . 180,000 247,084Industrial & Commercial Bank of China Ltd., Class H . . . 723,000 575,266Longfor Properties Co. Ltd. . . . . . . . . . . . . . . . . . . . . . . 26,500 22,191NetEase, Inc. — ADR . . . . . . . . . . . . . . . . . . . . . . . . . . 1,970 555,383PICC Property & Casualty Co. Ltd., Class H . . . . . . . . . 12,000 23,814Want Want China Holdings Ltd.(b) . . . . . . . . . . . . . . . . . 12,158,000 9,954,041Wilmar International Ltd. . . . . . . . . . . . . . . . . . . . . . . . . 96,100 239,140
153,947,269
Czech Republic — 0.0%
CEZ AS . . . . . . . . . . . . . . . . . . . . . . . . . . . . . . . . . . . . 700,264 15,354,902
Security Shares Value
Denmark — 0.0%
A.P. Moeller — Maersk A/S, Class A . . . . . . . . . . . . . . 361 $ 669,124A.P. Moeller — Maersk A/S, Class B . . . . . . . . . . . . . . 397 761,043Danske Bank A/S . . . . . . . . . . . . . . . . . . . . . . . . . . . . . 29,938 1,142,538Novo Nordisk A/S, Class B . . . . . . . . . . . . . . . . . . . . . . 1,740 86,632
2,659,337
Finland — 0.3%
Nokia OYJ . . . . . . . . . . . . . . . . . . . . . . . . . . . . . . . . . . 20,316,748 99,916,142
France — 2.9%
AXA SA . . . . . . . . . . . . . . . . . . . . . . . . . . . . . . . . . . . . 3,123,733 94,300,463BNP Paribas SA . . . . . . . . . . . . . . . . . . . . . . . . . . . . . 6,997 546,112Cie Generale des Etablissements Michelin . . . . . . . . . . 399,475 57,822,550Compagnie de Saint-Gobain . . . . . . . . . . . . . . . . . . . . . 1,042,072 61,099,703Danone SA . . . . . . . . . . . . . . . . . . . . . . . . . . . . . . . . . 3,696,268 302,100,197Dassault Aviation SA . . . . . . . . . . . . . . . . . . . . . . . . . . 42,790 66,719,238Engie SA . . . . . . . . . . . . . . . . . . . . . . . . . . . . . . . . . . . 3,003 50,757LVMH Moet Hennessy Louis Vuitton SE . . . . . . . . . . . . 1,201 358,214Orange SA . . . . . . . . . . . . . . . . . . . . . . . . . . . . . . . . . . 39,195 643,883Safran SA . . . . . . . . . . . . . . . . . . . . . . . . . . . . . . . . . . 1,295,168 136,410,042Sanofi . . . . . . . . . . . . . . . . . . . . . . . . . . . . . . . . . . . . . 1,229,390 116,406,690Societe Generale SA . . . . . . . . . . . . . . . . . . . . . . . . . . 6,304 350,846Sodexo SA . . . . . . . . . . . . . . . . . . . . . . . . . . . . . . . . . 496,216 63,129,977Thales SA . . . . . . . . . . . . . . . . . . . . . . . . . . . . . . . . . . 1,543 160,801TOTAL SA . . . . . . . . . . . . . . . . . . . . . . . . . . . . . . . . . . 1,612,144 89,857,832TOTAL SA — ADR . . . . . . . . . . . . . . . . . . . . . . . . . . . 64,273 3,581,291Unibail-Rodamco SE . . . . . . . . . . . . . . . . . . . . . . . . . . 243,312 60,902,686Vinci SA . . . . . . . . . . . . . . . . . . . . . . . . . . . . . . . . . . . . 608,796 59,648,347Vivendi SA . . . . . . . . . . . . . . . . . . . . . . . . . . . . . . . . . . 4,495 111,619
1,114,201,248
Germany — 2.0%
adidas AG . . . . . . . . . . . . . . . . . . . . . . . . . . . . . . . . . . 1,674 372,604Allianz SE, Registered Shares . . . . . . . . . . . . . . . . . . . 4,082 952,979BASF SE . . . . . . . . . . . . . . . . . . . . . . . . . . . . . . . . . . . 8,075 883,028Bayer AG, Registered Shares . . . . . . . . . . . . . . . . . . . . 1,741,125 226,483,483Deutsche Post AG, Registered Shares . . . . . . . . . . . . . 23,415 1,073,346Deutsche Telekom AG, Registered Shares . . . . . . . . . . 4,498,376 81,453,512E.ON SE . . . . . . . . . . . . . . . . . . . . . . . . . . . . . . . . . . . 50,060 592,932Evonik Industries AG . . . . . . . . . . . . . . . . . . . . . . . . . . 1,414,331 51,447,560Fresenius Medical Care AG & Co. KGaA . . . . . . . . . . . 1,515 146,685GEA Group AG . . . . . . . . . . . . . . . . . . . . . . . . . . . . . . 975,918 47,144,181Innogy SE(c) . . . . . . . . . . . . . . . . . . . . . . . . . . . . . . . . . 5,600,109 260,438,416SAP SE . . . . . . . . . . . . . . . . . . . . . . . . . . . . . . . . . . . . 11,522 1,316,532Siemens AG, Registered Shares . . . . . . . . . . . . . . . . . 352,708 50,660,404Vonovia SE . . . . . . . . . . . . . . . . . . . . . . . . . . . . . . . . . 1,383,271 61,103,860
784,069,522
Hong Kong — 0.8%
AIA Group Ltd. . . . . . . . . . . . . . . . . . . . . . . . . . . . . . . . 8,600 64,805CK Infrastructure Holdings Ltd. . . . . . . . . . . . . . . . . . . . 1,405,000 12,233,438Galaxy Entertainment Group Ltd. . . . . . . . . . . . . . . . . . 12,000 81,833Hang Lung Properties Ltd. . . . . . . . . . . . . . . . . . . . . . . 2,964,000 6,806,158HKT Trust & HKT Ltd.(d) . . . . . . . . . . . . . . . . . . . . . . . . 7,592,000 9,274,202Hong Kong Exchanges & Clearing Ltd. . . . . . . . . . . . . . 2,600 72,447Hongkong Land Holdings Ltd. . . . . . . . . . . . . . . . . . . . . 65,100 472,162I-CABLE Communications Ltd.(a) . . . . . . . . . . . . . . . . . . 1,370,132 42,917Jardine Matheson Holdings Ltd. . . . . . . . . . . . . . . . . . . 193,900 12,421,532Link REIT . . . . . . . . . . . . . . . . . . . . . . . . . . . . . . . . . . 1,769,000 14,872,520Power Assets Holdings Ltd. . . . . . . . . . . . . . . . . . . . . . 1,247,500 10,814,721Sino Land Co. Ltd. . . . . . . . . . . . . . . . . . . . . . . . . . . . . 5,450,000 9,393,299Sun Hung Kai Properties Ltd. . . . . . . . . . . . . . . . . . . . . 10,619,166 173,723,096Swire Pacific Ltd., Class A . . . . . . . . . . . . . . . . . . . . . . 1,139,000 11,255,680Swire Properties Ltd. . . . . . . . . . . . . . . . . . . . . . . . . . . 64,800 218,974WH Group Ltd.(c) . . . . . . . . . . . . . . . . . . . . . . . . . . . . . 638,500 647,044Wharf Holdings Ltd. . . . . . . . . . . . . . . . . . . . . . . . . . . . 1,866,000 16,995,799
279,390,627
C O N S O L I D A T E D S C H E D U L E O F I N V E S T M E N T S 9

Consolidated Schedule of Investments (continued)
October 31, 2017
BlackRock Global Allocation Fund, Inc.(Percentages shown are based on Net Assets)
Security Shares Value
India — 1.3%
Coal India Ltd. . . . . . . . . . . . . . . . . . . . . . . . . . . . . . . . 2,401,995 $ 10,629,027GAIL India Ltd. . . . . . . . . . . . . . . . . . . . . . . . . . . . . . . . 30,421 218,606Grasim Industries Ltd. . . . . . . . . . . . . . . . . . . . . . . . . . 17,669 335,045HCL Technologies Ltd. . . . . . . . . . . . . . . . . . . . . . . . . . 4,858 64,200Hero MotoCorp Ltd. . . . . . . . . . . . . . . . . . . . . . . . . . . . 253,273 15,073,263Hindustan Petroleum Corp. Ltd. . . . . . . . . . . . . . . . . . . 23,092 159,509Hindustan Unilever Ltd. . . . . . . . . . . . . . . . . . . . . . . . . 19,986 381,953Indian Oil Corp. Ltd. . . . . . . . . . . . . . . . . . . . . . . . . . . . 30,232 194,114Infosys Ltd. . . . . . . . . . . . . . . . . . . . . . . . . . . . . . . . . . 9,121,929 129,878,566Kotak Mahindra Bank Ltd. . . . . . . . . . . . . . . . . . . . . . . 4,064,800 64,334,782Maruti Suzuki India Ltd. . . . . . . . . . . . . . . . . . . . . . . . . 412,274 52,301,616Oil & Natural Gas Corp. Ltd. . . . . . . . . . . . . . . . . . . . . . 3,635,770 10,743,080Reliance Industries Ltd. . . . . . . . . . . . . . . . . . . . . . . . . 12,062,423 175,370,973SBI Life Insurance Co. Ltd.(a)(c) . . . . . . . . . . . . . . . . . . . 447,299 4,572,348State Bank of India . . . . . . . . . . . . . . . . . . . . . . . . . . . . 7,562,983 35,718,333Tata Motors Ltd.(a) . . . . . . . . . . . . . . . . . . . . . . . . . . . . 8,101 53,644Tata Motors Ltd., Class A(a) . . . . . . . . . . . . . . . . . . . . . 67,385 250,792Tech Mahindra Ltd. . . . . . . . . . . . . . . . . . . . . . . . . . . . 31,280 232,738Vedanta Ltd. . . . . . . . . . . . . . . . . . . . . . . . . . . . . . . . . 51,845 266,157Yes Bank Ltd. . . . . . . . . . . . . . . . . . . . . . . . . . . . . . . . 4,624,413 22,478,396
523,257,142
Indonesia — 0.1%
Siloam International Hospitals Tbk PT(a) . . . . . . . . . . . . 58,702,387 42,207,800
Ireland — 0.0%
Experian PLC . . . . . . . . . . . . . . . . . . . . . . . . . . . . . . . 2,711 57,116Medtronic PLC . . . . . . . . . . . . . . . . . . . . . . . . . . . . . . . 143,705 11,571,127
11,628,243
Israel — 0.0%
Check Point Software Technologies Ltd.(a) . . . . . . . . . . 263 30,958
Italy — 1.0%
Atlantia SpA . . . . . . . . . . . . . . . . . . . . . . . . . . . . . . . . . 5,974 194,756Ei Towers SpA(v) . . . . . . . . . . . . . . . . . . . . . . . . . . . . . 1,163,864 68,057,465Enel SpA . . . . . . . . . . . . . . . . . . . . . . . . . . . . . . . . . . . 16,098,696 99,838,788Luxottica Group SpA . . . . . . . . . . . . . . . . . . . . . . . . . . 991,304 56,858,411RAI Way SpA(c) . . . . . . . . . . . . . . . . . . . . . . . . . . . . . . 7,991,096 48,450,348Snam SpA . . . . . . . . . . . . . . . . . . . . . . . . . . . . . . . . . . 1,392,865 7,111,748Telecom Italia SpA(a)(b) . . . . . . . . . . . . . . . . . . . . . . . . . 110,879,309 95,941,704Telecom Italia SpA, Non-Convertible Savings Shares . . 3,897,526 2,769,083
379,222,303
Japan — 8.4%
Aisin Seiki Co. Ltd. . . . . . . . . . . . . . . . . . . . . . . . . . . . . 897,690 46,502,519Ajinomoto Co., Inc. . . . . . . . . . . . . . . . . . . . . . . . . . . . . 2,944,600 59,235,305Alfresa Holdings Corp. . . . . . . . . . . . . . . . . . . . . . . . . . 384,800 7,352,417Alpine Electronics, Inc. . . . . . . . . . . . . . . . . . . . . . . . . . 268,100 5,948,653Asahi Glass Co. Ltd. . . . . . . . . . . . . . . . . . . . . . . . . . . 16,800 658,395Asahi Kasei Corp. . . . . . . . . . . . . . . . . . . . . . . . . . . . . 4,971,300 60,201,068Astellas Pharma, Inc. . . . . . . . . . . . . . . . . . . . . . . . . . . 6,076,550 80,871,928Bridgestone Corp. . . . . . . . . . . . . . . . . . . . . . . . . . . . . 3,226,400 154,126,306Canon Marketing Japan, Inc. . . . . . . . . . . . . . . . . . . . . 326,000 8,200,252COMSYS Holdings Corp. . . . . . . . . . . . . . . . . . . . . . . . 398,800 10,099,380Dai-ichi Life Holdings, Inc. . . . . . . . . . . . . . . . . . . . . . . 1,300 24,827Daicel Corp. . . . . . . . . . . . . . . . . . . . . . . . . . . . . . . . . . 776,000 9,688,833Daikin Industries Ltd. . . . . . . . . . . . . . . . . . . . . . . . . . . 448,600 49,575,152Denso Corp. . . . . . . . . . . . . . . . . . . . . . . . . . . . . . . . . 2,116,380 116,557,459East Japan Railway Co. . . . . . . . . . . . . . . . . . . . . . . . . 1,950,273 189,136,704Exedy Corp. . . . . . . . . . . . . . . . . . . . . . . . . . . . . . . . . . 227,700 6,827,704Fujitsu Ltd. . . . . . . . . . . . . . . . . . . . . . . . . . . . . . . . . . . 132,000 1,028,609Hino Motors Ltd. . . . . . . . . . . . . . . . . . . . . . . . . . . . . . . 691,900 8,905,447Hitachi Chemical Co. Ltd. . . . . . . . . . . . . . . . . . . . . . . . 1,473,100 42,006,619Hitachi Ltd. . . . . . . . . . . . . . . . . . . . . . . . . . . . . . . . . . 170,000 1,353,769Hoya Corp. . . . . . . . . . . . . . . . . . . . . . . . . . . . . . . . . . 1,228,117 66,724,494Japan Airlines Co. Ltd. . . . . . . . . . . . . . . . . . . . . . . . . . 3,881,600 132,856,689
Security Shares Value
Japan (continued)
Japan Aviation Electronics Industry Ltd. . . . . . . . . . . . . 258,000 $ 4,719,502Japan Tobacco, Inc. . . . . . . . . . . . . . . . . . . . . . . . . . . . 1,900 62,890Kamigumi Co. Ltd. . . . . . . . . . . . . . . . . . . . . . . . . . . . . 362,000 8,665,912Kao Corp. . . . . . . . . . . . . . . . . . . . . . . . . . . . . . . . . . . 5,700 344,480KDDI Corp. . . . . . . . . . . . . . . . . . . . . . . . . . . . . . . . . . 595,900 15,876,347Keyence Corp. . . . . . . . . . . . . . . . . . . . . . . . . . . . . . . . 32,400 17,989,283Kinden Corp. . . . . . . . . . . . . . . . . . . . . . . . . . . . . . . . . 1,187,700 20,057,728Kintetsu Group Holdings Co. Ltd. . . . . . . . . . . . . . . . . . 6,900 265,325Koito Manufacturing Co. Ltd. . . . . . . . . . . . . . . . . . . . . 477,800 32,038,486Komatsu Ltd. . . . . . . . . . . . . . . . . . . . . . . . . . . . . . . . . 2,664,800 87,074,341Kubota Corp. . . . . . . . . . . . . . . . . . . . . . . . . . . . . . . . . 2,791,910 52,531,122Kuraray Co. Ltd. . . . . . . . . . . . . . . . . . . . . . . . . . . . . . . 498,600 9,819,709Kurita Water Industries Ltd. . . . . . . . . . . . . . . . . . . . . . 280,400 8,910,063Kyudenko Corp. . . . . . . . . . . . . . . . . . . . . . . . . . . . . . . 196,300 8,667,180Kyushu Railway Co. . . . . . . . . . . . . . . . . . . . . . . . . . . . 1,143,200 36,538,494Mabuchi Motor Co. Ltd. . . . . . . . . . . . . . . . . . . . . . . . . 286,300 15,023,610Maeda Road Construction Co. Ltd. . . . . . . . . . . . . . . . . 470,000 10,121,357Marubeni Corp. . . . . . . . . . . . . . . . . . . . . . . . . . . . . . . 64,900 435,157Mazda Motor Corp. . . . . . . . . . . . . . . . . . . . . . . . . . . . 37,300 538,452Medipal Holdings Corp. . . . . . . . . . . . . . . . . . . . . . . . . 448,600 8,331,068Mitsubishi Electric Corp. . . . . . . . . . . . . . . . . . . . . . . . . 8,856,900 151,572,493Mitsubishi Tanabe Pharma Corp. . . . . . . . . . . . . . . . . . 7,800 171,673Mitsubishi UFJ Financial Group, Inc. . . . . . . . . . . . . . . . 74,100 502,631MS&AD Insurance Group Holdings, Inc. . . . . . . . . . . . . 900 30,575Murata Manufacturing Co. Ltd. . . . . . . . . . . . . . . . . . . . 624,440 98,138,221Nintendo Co. Ltd. . . . . . . . . . . . . . . . . . . . . . . . . . . . . . 203,800 79,066,567Nippo Corp. . . . . . . . . . . . . . . . . . . . . . . . . . . . . . . . . . 459,000 9,584,194Nippon Telegraph & Telephone Corp. . . . . . . . . . . . . . . 305,700 14,779,837Nippon Television Holdings, Inc. . . . . . . . . . . . . . . . . . . 903,200 16,303,345Nitto Denko Corp. . . . . . . . . . . . . . . . . . . . . . . . . . . . . 766,700 71,293,673NTT DOCOMO, Inc. . . . . . . . . . . . . . . . . . . . . . . . . . . . 23,100 559,453Okumura Corp. . . . . . . . . . . . . . . . . . . . . . . . . . . . . . . 542,124 20,752,459Olympus Corp. . . . . . . . . . . . . . . . . . . . . . . . . . . . . . . . 10,100 375,868Osaka Gas Co. Ltd. . . . . . . . . . . . . . . . . . . . . . . . . . . . 1,200 23,243Otsuka Holdings Co. Ltd. . . . . . . . . . . . . . . . . . . . . . . . 272,000 11,362,693Rakuten, Inc. . . . . . . . . . . . . . . . . . . . . . . . . . . . . . . . . 22,700 242,908Renesas Electronics Corp.(a) . . . . . . . . . . . . . . . . . . . . 2,728,600 35,278,295Resona Holdings, Inc. . . . . . . . . . . . . . . . . . . . . . . . . . 73,700 398,373Rohm Co. Ltd. . . . . . . . . . . . . . . . . . . . . . . . . . . . . . . . 1,101,700 102,554,211Seino Holdings Co Ltd. . . . . . . . . . . . . . . . . . . . . . . . . . 503,000 7,338,470Seven & i Holdings Co. Ltd. . . . . . . . . . . . . . . . . . . . . . 123,800 4,989,691Shimamura Co. Ltd. . . . . . . . . . . . . . . . . . . . . . . . . . . . 70,200 7,820,853Shin-Etsu Chemical Co. Ltd. . . . . . . . . . . . . . . . . . . . . . 1,734,740 182,947,742Shionogi & Co. Ltd. . . . . . . . . . . . . . . . . . . . . . . . . . . . 23,100 1,243,636SHO-BOND Holdings Co. Ltd. . . . . . . . . . . . . . . . . . . . 87,800 5,403,065SKY Perfect JSAT Holdings, Inc. . . . . . . . . . . . . . . . . . 811,000 3,760,400Sony Corp. . . . . . . . . . . . . . . . . . . . . . . . . . . . . . . . . . 37,300 1,560,434Stanley Electric Co. Ltd. . . . . . . . . . . . . . . . . . . . . . . . . 441,900 16,312,481Subaru Corp. . . . . . . . . . . . . . . . . . . . . . . . . . . . . . . . . 1,784,990 61,669,777Sumitomo Electric Industries Ltd. . . . . . . . . . . . . . . . . . 2,934,200 49,955,723Sumitomo Mitsui Financial Group, Inc. . . . . . . . . . . . . . 3,445,800 138,048,111Suzuken Co. Ltd. . . . . . . . . . . . . . . . . . . . . . . . . . . . . . 201,700 7,270,854Suzuki Motor Corp. . . . . . . . . . . . . . . . . . . . . . . . . . . . 3,545,308 194,188,087T&D Holdings, Inc. . . . . . . . . . . . . . . . . . . . . . . . . . . . . 5,200 81,123Toda Corp. . . . . . . . . . . . . . . . . . . . . . . . . . . . . . . . . . 2,816,900 22,949,833Toho Co. Ltd. . . . . . . . . . . . . . . . . . . . . . . . . . . . . . . . . 300,000 9,939,388Tokio Marine Holdings, Inc. . . . . . . . . . . . . . . . . . . . . . 1,849,721 79,736,324Tokyo Electron Ltd. . . . . . . . . . . . . . . . . . . . . . . . . . . . 4,300 757,143Tokyo Gas Co. Ltd. . . . . . . . . . . . . . . . . . . . . . . . . . . . 4,855,657 121,127,484Tokyo Steel Manufacturing Co. Ltd.(b) . . . . . . . . . . . . . . 1,367,400 11,810,312Toray Industries, Inc. . . . . . . . . . . . . . . . . . . . . . . . . . . 5,357,400 54,225,684Toshiba Corp.(a) . . . . . . . . . . . . . . . . . . . . . . . . . . . . . . 236,000 682,855Toyota Industries Corp. . . . . . . . . . . . . . . . . . . . . . . . . 2,387,780 146,971,383Trend Micro, Inc. . . . . . . . . . . . . . . . . . . . . . . . . . . . . . 141,400 7,582,381TV Asahi Holdings Corp. . . . . . . . . . . . . . . . . . . . . . . . 657,000 13,230,673
10 2 0 1 7 B L A C K R O C K A N N U A L R E P O R T T O S H A R E H O L D E R S

Consolidated Schedule of Investments (continued)
October 31, 2017
BlackRock Global Allocation Fund, Inc.(Percentages shown are based on Net Assets)
Security Shares Value
Japan (continued)
Ube Industries Ltd. . . . . . . . . . . . . . . . . . . . . . . . . . . . . 1,385,950 $ 42,576,473Unicharm Corp. . . . . . . . . . . . . . . . . . . . . . . . . . . . . . . 17,100 389,123West Japan Railway Co. . . . . . . . . . . . . . . . . . . . . . . . . 748,300 52,767,082Yamato Kogyo Co. Ltd. . . . . . . . . . . . . . . . . . . . . . . . . 211,600 5,660,097
3,261,880,429
Mexico — 0.0%
Cemex SAB de CV(a) . . . . . . . . . . . . . . . . . . . . . . . . . . 1,112,351 903,957
Netherlands — 1.3%
ABN AMRO Group NV(c) . . . . . . . . . . . . . . . . . . . . . . . . 2,819,275 87,071,467Aegon NV . . . . . . . . . . . . . . . . . . . . . . . . . . . . . . . . . . 7,476 44,137ING Groep NV . . . . . . . . . . . . . . . . . . . . . . . . . . . . . . . 7,151,679 132,159,193Koninklijke Ahold Delhaize NV . . . . . . . . . . . . . . . . . . . 2,363 44,467Koninklijke Philips NV . . . . . . . . . . . . . . . . . . . . . . . . . . 5,984,600 243,889,808Randstad Holding NV . . . . . . . . . . . . . . . . . . . . . . . . . . 790,014 48,603,337RELX NV . . . . . . . . . . . . . . . . . . . . . . . . . . . . . . . . . . . 20,216 456,412Unilever NV CVA . . . . . . . . . . . . . . . . . . . . . . . . . . . . . 154,609 8,981,221
521,250,042
Norway — 0.0%
DNB ASA . . . . . . . . . . . . . . . . . . . . . . . . . . . . . . . . . . 12,507 241,377Statoil ASA . . . . . . . . . . . . . . . . . . . . . . . . . . . . . . . . . 14,483 294,259
535,636
Peru — 0.0%
Credicorp Ltd. . . . . . . . . . . . . . . . . . . . . . . . . . . . . . . . 99 20,735
Poland — 0.0%
Jeronimo Martins SGPS SA . . . . . . . . . . . . . . . . . . . . . 277,784 5,047,098PGE SA(a) . . . . . . . . . . . . . . . . . . . . . . . . . . . . . . . . . . 108,668 389,633Polskie Gornictwo Naftowe i Gazownictwo SA . . . . . . . . 112,598 206,918
5,643,649
Portugal — 0.1%
NOS SGPS SA . . . . . . . . . . . . . . . . . . . . . . . . . . . . . . 5,119,925 30,678,518
Singapore — 0.3%
CapitaLand Ltd. . . . . . . . . . . . . . . . . . . . . . . . . . . . . . . 28,645,300 77,141,576ComfortDelGro Corp. Ltd. . . . . . . . . . . . . . . . . . . . . . . . 6,255,800 9,273,954Genting Singapore PLC . . . . . . . . . . . . . . . . . . . . . . . . 612,100 547,874Singapore Telecommunications Ltd. . . . . . . . . . . . . . . . 6,216,600 17,107,863
104,071,267
South Africa — 0.0%
Barclays Africa Group Ltd. . . . . . . . . . . . . . . . . . . . . . . 28,428 281,609RMB Holdings Ltd. . . . . . . . . . . . . . . . . . . . . . . . . . . . . 67,392 297,935Tiger Brands Ltd. . . . . . . . . . . . . . . . . . . . . . . . . . . . . . 11,817 322,742
902,286
South Korea — 0.6%
Amorepacific Corp. . . . . . . . . . . . . . . . . . . . . . . . . . . . . 126,325 35,445,803Coway Co. Ltd. . . . . . . . . . . . . . . . . . . . . . . . . . . . . . . 140,612 12,224,625Doosan Bobcat, Inc. . . . . . . . . . . . . . . . . . . . . . . . . . . . 1,917,913 62,016,077Hana Financial Group, Inc. . . . . . . . . . . . . . . . . . . . . . . 4,742 202,952Hotel Shilla Co. Ltd.(b) . . . . . . . . . . . . . . . . . . . . . . . . . . 156,438 10,945,608Hyundai Mobis Co. Ltd. . . . . . . . . . . . . . . . . . . . . . . . . 100 23,787Korea Electric Power Corp. . . . . . . . . . . . . . . . . . . . . . 4,314 151,247KT&G Corp. . . . . . . . . . . . . . . . . . . . . . . . . . . . . . . . . . 483,813 45,775,140LG Chem Ltd. . . . . . . . . . . . . . . . . . . . . . . . . . . . . . . . 56,748 20,460,862LG Display Co. Ltd. . . . . . . . . . . . . . . . . . . . . . . . . . . . 20,440 534,722LG Household & Health Care Ltd. . . . . . . . . . . . . . . . . . 16,948 17,804,968Lotte Chemical Corp. . . . . . . . . . . . . . . . . . . . . . . . . . . 234 77,290POSCO . . . . . . . . . . . . . . . . . . . . . . . . . . . . . . . . . . . . 50,499 14,719,722Samsung Electronics Co. Ltd. . . . . . . . . . . . . . . . . . . . . 913 2,250,641SK Hynix, Inc. . . . . . . . . . . . . . . . . . . . . . . . . . . . . . . . 4,775 352,074SK Innovation Co. Ltd. . . . . . . . . . . . . . . . . . . . . . . . . . 3,696 677,997SK Telecom Co. Ltd. . . . . . . . . . . . . . . . . . . . . . . . . . . 60,343 14,245,768
237,909,283
Security Shares Value
Spain — 0.4%
Aena SME SA(c) . . . . . . . . . . . . . . . . . . . . . . . . . . . . . . 8,763 $ 1,607,778CaixaBank SA . . . . . . . . . . . . . . . . . . . . . . . . . . . . . . . 68,443 320,203Cellnex Telecom SAU(c) . . . . . . . . . . . . . . . . . . . . . . . . 4,881,246 121,162,109Gas Natural SDG SA . . . . . . . . . . . . . . . . . . . . . . . . . . 1,206,903 25,824,724Telefonica SA . . . . . . . . . . . . . . . . . . . . . . . . . . . . . . . 25,179 264,014
149,178,828
Sweden — 0.6%
Nordea Bank AB . . . . . . . . . . . . . . . . . . . . . . . . . . . . . 30,955 374,082Skandinaviska Enskilda Banken AB, Class A . . . . . . . . 29,611 364,914SKF AB, Class B . . . . . . . . . . . . . . . . . . . . . . . . . . . . . 7,462,190 173,412,568Svenska Handelsbanken AB, Class A . . . . . . . . . . . . . . 4,325,098 61,988,726Swedbank AB, Class A . . . . . . . . . . . . . . . . . . . . . . . . 1,280 31,767Volvo AB, Class B . . . . . . . . . . . . . . . . . . . . . . . . . . . . 31,469 623,283
236,795,340
Switzerland — 1.2%
ABB Ltd., Registered Shares . . . . . . . . . . . . . . . . . . . . 35,124 917,264Nestle SA, Registered Shares . . . . . . . . . . . . . . . . . . . 3,050,502 256,664,664Novartis AG, Registered Shares . . . . . . . . . . . . . . . . . . 149,190 12,305,076Roche Holding AG . . . . . . . . . . . . . . . . . . . . . . . . . . . . 7,517 1,737,412SGS SA, Registered Shares . . . . . . . . . . . . . . . . . . . . . 197 486,500UBS Group AG, Registered Shares(a) . . . . . . . . . . . . . . 10,987,826 186,937,024Zurich Insurance Group AG . . . . . . . . . . . . . . . . . . . . . 3,775 1,151,998
460,199,938
Taiwan — 0.7%
Catcher Technology Co. Ltd. . . . . . . . . . . . . . . . . . . . . 14,000 149,001Cathay Financial Holding Co. Ltd. . . . . . . . . . . . . . . . . . 7,141,000 11,799,918Cheng Shin Rubber Industry Co. Ltd. . . . . . . . . . . . . . . 10,804,672 21,326,275Chunghwa Telecom Co. Ltd. . . . . . . . . . . . . . . . . . . . . . 18,955,000 64,735,049Far EasTone Telecommunications Co. Ltd. . . . . . . . . . . 10,554,000 24,780,894Formosa Chemicals & Fibre Corp. . . . . . . . . . . . . . . . . 3,115,000 9,463,416Formosa Petrochemical Corp. . . . . . . . . . . . . . . . . . . . 2,226,000 7,792,268Formosa Plastics Corp. . . . . . . . . . . . . . . . . . . . . . . . . 3,323,000 10,130,057Fubon Financial Holding Co. Ltd. . . . . . . . . . . . . . . . . . 7,441,000 11,858,790Hon Hai Precision Industry Co. Ltd. . . . . . . . . . . . . . . . 4,042,700 15,026,485Innolux Corp. . . . . . . . . . . . . . . . . . . . . . . . . . . . . . . . . 616,000 269,996Nan Ya Plastics Corp. . . . . . . . . . . . . . . . . . . . . . . . . . 4,168,000 10,285,840Pegatron Corp. . . . . . . . . . . . . . . . . . . . . . . . . . . . . . . 571,000 1,479,603Taiwan Cooperative Financial Holding Co. Ltd. . . . . . . . 650 351Taiwan Mobile Co. Ltd. . . . . . . . . . . . . . . . . . . . . . . . . . 9,334,000 33,277,766Taiwan Semiconductor Manufacturing Co. Ltd. . . . . . . . 1,638,000 13,242,082Uni-President Enterprises Corp. . . . . . . . . . . . . . . . . . . 8,046,000 16,811,343
252,429,134
Thailand — 0.2%
Advanced Info Service PCL, Foreign RegisteredShares . . . . . . . . . . . . . . . . . . . . . . . . . . . . . . . . . . 3,260,100 19,087,581
Intouch Holdings PCL . . . . . . . . . . . . . . . . . . . . . . . . . . 8,059,800 14,851,987PTT Global Chemical PCL, Foreign Registered
Shares . . . . . . . . . . . . . . . . . . . . . . . . . . . . . . . . . . 6,903,600 16,625,166Siam Cement PCL, Foreign Registered Shares . . . . . . . 1,030,800 15,201,353Thai Oil PCL — NVDR . . . . . . . . . . . . . . . . . . . . . . . . . 3,146,100 9,659,910
75,425,997
Turkey — 0.0%
KOC Holding AS . . . . . . . . . . . . . . . . . . . . . . . . . . . . . 34,080 152,606Tupras Turkiye Petrol Rafinerileri AS . . . . . . . . . . . . . . 4,389 158,134Turkiye Garanti Bankasi AS . . . . . . . . . . . . . . . . . . . . . 97,908 269,746Turkiye Halk Bankasi . . . . . . . . . . . . . . . . . . . . . . . . . . 54,393 158,897
739,383
United Arab Emirates — 0.3%
NMC Health PLC . . . . . . . . . . . . . . . . . . . . . . . . . . . . . 3,391,795 130,329,723
United Kingdom — 3.5%
Aon PLC . . . . . . . . . . . . . . . . . . . . . . . . . . . . . . . . . . . 3,611 517,926
C O N S O L I D A T E D S C H E D U L E O F I N V E S T M E N T S 11

Consolidated Schedule of Investments (continued)
October 31, 2017
BlackRock Global Allocation Fund, Inc.(Percentages shown are based on Net Assets)
Security Shares Value
United Kingdom (continued)
Associated British Foods PLC . . . . . . . . . . . . . . . . . . . 8,818 $ 390,278Aviva PLC . . . . . . . . . . . . . . . . . . . . . . . . . . . . . . . . . . 26,249 176,090BAE Systems PLC . . . . . . . . . . . . . . . . . . . . . . . . . . . . 7,003,537 55,169,215Barclays PLC . . . . . . . . . . . . . . . . . . . . . . . . . . . . . . . . 191,014 471,367Berkeley Group Holdings PLC . . . . . . . . . . . . . . . . . . . 1,048,579 52,099,792BP PLC . . . . . . . . . . . . . . . . . . . . . . . . . . . . . . . . . . . . 5,065,139 34,355,103BP PLC — ADR . . . . . . . . . . . . . . . . . . . . . . . . . . . . . . 3,142,282 127,796,609Centrica PLC . . . . . . . . . . . . . . . . . . . . . . . . . . . . . . . . 167,064 376,757Compass Group PLC . . . . . . . . . . . . . . . . . . . . . . . . . . 1,681 36,905Diageo PLC . . . . . . . . . . . . . . . . . . . . . . . . . . . . . . . . . 4,186 142,947GlaxoSmithKline PLC . . . . . . . . . . . . . . . . . . . . . . . . . . 9,021,784 161,916,943GW Pharmaceuticals PLC, ADR(a)(b) . . . . . . . . . . . . . . . 230,877 24,923,172HSBC Holdings PLC . . . . . . . . . . . . . . . . . . . . . . . . . . 20,592,007 201,083,378Imperial Brands PLC . . . . . . . . . . . . . . . . . . . . . . . . . . 16,435 670,080Legal & General Group PLC . . . . . . . . . . . . . . . . . . . . . 162,741 577,010Liberty Global PLC, Class A(a) . . . . . . . . . . . . . . . . . . . . 583,704 18,007,268Liberty Global PLC, Class C(a) . . . . . . . . . . . . . . . . . . . 6,007 179,549Lloyds Banking Group PLC . . . . . . . . . . . . . . . . . . . . . . 1,385,443 1,255,808Meggitt PLC . . . . . . . . . . . . . . . . . . . . . . . . . . . . . . . . . 6,891,463 47,441,010National Grid PLC . . . . . . . . . . . . . . . . . . . . . . . . . . . . 349,780 4,210,470Prudential PLC . . . . . . . . . . . . . . . . . . . . . . . . . . . . . . . 4,975 122,113Reckitt Benckiser Group PLC . . . . . . . . . . . . . . . . . . . . 2,931 262,227Rio Tinto PLC . . . . . . . . . . . . . . . . . . . . . . . . . . . . . . . 9,637 455,451Royal Dutch Shell PLC — ADR, Class A . . . . . . . . . . . . 2,709,691 170,791,824Royal Dutch Shell PLC, Class A . . . . . . . . . . . . . . . . . . 6,588 207,389Royal Dutch Shell PLC, Class B . . . . . . . . . . . . . . . . . . 40,419 1,301,381Royal Dutch Shell PLC, A Shares . . . . . . . . . . . . . . . . . 3,613,458 113,779,660Smiths Group PLC . . . . . . . . . . . . . . . . . . . . . . . . . . . . 2,824,922 58,944,493Spire Healthcare Group PLC(c) . . . . . . . . . . . . . . . . . . . 4,430,188 17,480,040SSE PLC . . . . . . . . . . . . . . . . . . . . . . . . . . . . . . . . . . . 27,964 513,584TechnipFMC PLC(a) . . . . . . . . . . . . . . . . . . . . . . . . . . . 16,657 456,235Vodafone Group PLC . . . . . . . . . . . . . . . . . . . . . . . . . . 70,833,226 202,606,995Vodafone Group PLC — ADR . . . . . . . . . . . . . . . . . . . . 1,905,638 55,225,389
1,353,944,458
United States — 29.2%
3M Co. . . . . . . . . . . . . . . . . . . . . . . . . . . . . . . . . . . . . 24,632 5,670,040AbbVie, Inc. . . . . . . . . . . . . . . . . . . . . . . . . . . . . . . . . . 75,550 6,818,387Acadia Healthcare Co., Inc.(a)(b) . . . . . . . . . . . . . . . . . . . 1,717,744 53,868,452Accenture PLC, Class A . . . . . . . . . . . . . . . . . . . . . . . . 48,785 6,945,033Activision Blizzard, Inc. . . . . . . . . . . . . . . . . . . . . . . . . . 937,875 61,421,434Adobe Systems, Inc.(a) . . . . . . . . . . . . . . . . . . . . . . . . . 53,238 9,325,168Aetna, Inc.(u) . . . . . . . . . . . . . . . . . . . . . . . . . . . . . . . . 1,254,810 213,355,344Agilent Technologies, Inc. . . . . . . . . . . . . . . . . . . . . . . . 5,413 368,246Air Products & Chemicals, Inc. . . . . . . . . . . . . . . . . . . . 1,438,615 229,358,389Alliance Data Systems Corp. . . . . . . . . . . . . . . . . . . . . 14,949 3,344,540Allstate Corp. . . . . . . . . . . . . . . . . . . . . . . . . . . . . . . . . 994,084 93,304,724Alphabet, Inc., Class A(a) . . . . . . . . . . . . . . . . . . . . . . . 2,475 2,556,774Alphabet, Inc., Class C(a) . . . . . . . . . . . . . . . . . . . . . . . 391,376 397,888,497Altria Group, Inc. . . . . . . . . . . . . . . . . . . . . . . . . . . . . . 6,664 427,962Amazon.com, Inc.(a)(u) . . . . . . . . . . . . . . . . . . . . . . . . . . 342,454 378,507,557Amdocs Ltd. . . . . . . . . . . . . . . . . . . . . . . . . . . . . . . . . . 105,745 6,883,999American Express Co. . . . . . . . . . . . . . . . . . . . . . . . . . 3,775 360,588American International Group, Inc. . . . . . . . . . . . . . . . . 44,812 2,895,303American Tower Corp. . . . . . . . . . . . . . . . . . . . . . . . . . 58,801 8,447,980Ameriprise Financial, Inc. . . . . . . . . . . . . . . . . . . . . . . . 31,573 4,942,437Amgen, Inc. . . . . . . . . . . . . . . . . . . . . . . . . . . . . . . . . . 52,365 9,175,395Anadarko Petroleum Corp. . . . . . . . . . . . . . . . . . . . . . . 2,956,993 145,986,744Anthem, Inc. . . . . . . . . . . . . . . . . . . . . . . . . . . . . . . . . 534,445 111,811,238Apple, Inc.(u) . . . . . . . . . . . . . . . . . . . . . . . . . . . . . . . . . 2,563,227 433,287,892Applied Materials, Inc. . . . . . . . . . . . . . . . . . . . . . . . . . 17,135 966,928Archer-Daniels-Midland Co. . . . . . . . . . . . . . . . . . . . . . 9,616 393,006AT&T, Inc. . . . . . . . . . . . . . . . . . . . . . . . . . . . . . . . . . . 23,504 790,910Automatic Data Processing, Inc. . . . . . . . . . . . . . . . . . . 1,477 171,716Axalta Coating Systems Ltd.(a) . . . . . . . . . . . . . . . . . . . 3,820,868 127,043,861
Security Shares Value
United States (continued)
Axis Capital Holdings Ltd. . . . . . . . . . . . . . . . . . . . . . . . 78,819 $ 4,286,965Bank of America Corp. . . . . . . . . . . . . . . . . . . . . . . . . . 13,785,338 377,580,408Bank of New York Mellon Corp. . . . . . . . . . . . . . . . . . . 72,156 3,712,426Baxter International, Inc. . . . . . . . . . . . . . . . . . . . . . . . . 301,832 19,459,109Berkshire Hathaway, Inc., Class B(a) . . . . . . . . . . . . . . . 861,036 160,962,070Biogen, Inc.(a) . . . . . . . . . . . . . . . . . . . . . . . . . . . . . . . . 57,710 17,985,899Boeing Co. . . . . . . . . . . . . . . . . . . . . . . . . . . . . . . . . . . 35,741 9,220,463Bristol-Myers Squibb Co. . . . . . . . . . . . . . . . . . . . . . . . 2,068 127,513CA, Inc. . . . . . . . . . . . . . . . . . . . . . . . . . . . . . . . . . . . . 28,387 919,171Campbell Soup Co. . . . . . . . . . . . . . . . . . . . . . . . . . . . 1,280 60,634Capital One Financial Corp. . . . . . . . . . . . . . . . . . . . . . 55,506 5,116,543Cardinal Health, Inc. . . . . . . . . . . . . . . . . . . . . . . . . . . . 38,357 2,374,298Carnival Corp. . . . . . . . . . . . . . . . . . . . . . . . . . . . . . . . 15,921 1,056,995Caterpillar, Inc. . . . . . . . . . . . . . . . . . . . . . . . . . . . . . . . 4,828 655,642Celgene Corp.(a) . . . . . . . . . . . . . . . . . . . . . . . . . . . . . . 6,894 696,087CenterPoint Energy, Inc. . . . . . . . . . . . . . . . . . . . . . . . 79,989 2,366,075Charles Schwab Corp. . . . . . . . . . . . . . . . . . . . . . . . . . 1,712,446 76,786,079Charter Communications, Inc., Class A(a) . . . . . . . . . . . 305,928 102,231,960Chevron Corp. . . . . . . . . . . . . . . . . . . . . . . . . . . . . . . . 28,521 3,305,299Chubb Ltd. . . . . . . . . . . . . . . . . . . . . . . . . . . . . . . . . . . 889,359 134,133,124Cisco Systems, Inc. . . . . . . . . . . . . . . . . . . . . . . . . . . . 1,461 49,893Citigroup, Inc. . . . . . . . . . . . . . . . . . . . . . . . . . . . . . . . 3,031,444 222,811,134Cloudera, Inc.(a)(b) . . . . . . . . . . . . . . . . . . . . . . . . . . . . . 3,713,367 56,183,243Coca-Cola Co. . . . . . . . . . . . . . . . . . . . . . . . . . . . . . . . 12,119 557,232Colgate-Palmolive Co. . . . . . . . . . . . . . . . . . . . . . . . . . 182,249 12,839,442Comcast Corp., Class A . . . . . . . . . . . . . . . . . . . . . . . . 7,373,784 265,677,437CommScope Holding Co., Inc.(a)(b) . . . . . . . . . . . . . . . . 3,324,329 106,843,934Conagra Brands, Inc. . . . . . . . . . . . . . . . . . . . . . . . . . . 40,244 1,374,735ConocoPhillips . . . . . . . . . . . . . . . . . . . . . . . . . . . . . . . 2,068 105,778Constellation Brands, Inc., Class A . . . . . . . . . . . . . . . . 33,733 7,390,563Corning, Inc. . . . . . . . . . . . . . . . . . . . . . . . . . . . . . . . . 16,282 509,789Costco Wholesale Corp. . . . . . . . . . . . . . . . . . . . . . . . . 2,174 350,188Crown Holdings, Inc.(a) . . . . . . . . . . . . . . . . . . . . . . . . . 76,686 4,614,197Cummins, Inc. . . . . . . . . . . . . . . . . . . . . . . . . . . . . . . . 17,794 3,147,403CVS Health Corp. . . . . . . . . . . . . . . . . . . . . . . . . . . . . 1,458,720 99,966,082Deere & Co. . . . . . . . . . . . . . . . . . . . . . . . . . . . . . . . . . 1,247 165,701Dell Technologies, Inc., Class V(a) . . . . . . . . . . . . . . . . . 3,036 251,290Delta Air Lines, Inc. . . . . . . . . . . . . . . . . . . . . . . . . . . . 65,417 3,272,812Devon Energy Corp. . . . . . . . . . . . . . . . . . . . . . . . . . . . 1,510 55,719Discover Financial Services . . . . . . . . . . . . . . . . . . . . . 68,086 4,529,762DISH Network Corp., Class A(a)(b) . . . . . . . . . . . . . . . . . 811,671 39,398,510Dominion Energy, Inc. . . . . . . . . . . . . . . . . . . . . . . . . . 205,151 16,645,952DowDuPont, Inc. . . . . . . . . . . . . . . . . . . . . . . . . . . . . . 4,357,683 315,104,058Eaton Corp. PLC . . . . . . . . . . . . . . . . . . . . . . . . . . . . . 12,513 1,001,290eBay, Inc.(a) . . . . . . . . . . . . . . . . . . . . . . . . . . . . . . . . . 32,307 1,216,035Edgewell Personal Care Co.(a) . . . . . . . . . . . . . . . . . . . 1,837,316 119,296,928Electronic Arts, Inc.(a) . . . . . . . . . . . . . . . . . . . . . . . . . . 577,194 69,032,402EQT Corp.(b) . . . . . . . . . . . . . . . . . . . . . . . . . . . . . . . . 915,070 57,228,478Equity Residential . . . . . . . . . . . . . . . . . . . . . . . . . . . . 10,734 721,969Expedia, Inc. . . . . . . . . . . . . . . . . . . . . . . . . . . . . . . . . 203,691 25,392,120Express Scripts Holding Co.(a) . . . . . . . . . . . . . . . . . . . 31,513 1,931,432Exxon Mobil Corp. . . . . . . . . . . . . . . . . . . . . . . . . . . . . 32,637 2,720,294Facebook, Inc., Class A(a) . . . . . . . . . . . . . . . . . . . . . . . 1,444,103 260,025,186Fifth Third Bancorp . . . . . . . . . . . . . . . . . . . . . . . . . . . . 99,034 2,862,083FirstEnergy Corp. . . . . . . . . . . . . . . . . . . . . . . . . . . . . . 3,828 126,133FleetCor Technologies, Inc.(a) . . . . . . . . . . . . . . . . . . . . 243,822 40,296,462Ford Motor Co. . . . . . . . . . . . . . . . . . . . . . . . . . . . . . . . 41,263 506,297Fortune Brands Home & Security, Inc. . . . . . . . . . . . . . 1,294,697 85,527,684Franklin Resources, Inc. . . . . . . . . . . . . . . . . . . . . . . . . 6,060 255,308General Dynamics Corp. . . . . . . . . . . . . . . . . . . . . . . . 30,028 6,095,083General Electric Co. . . . . . . . . . . . . . . . . . . . . . . . . . . . 8,822,159 177,854,725Gilead Sciences, Inc. . . . . . . . . . . . . . . . . . . . . . . . . . . 2,325,767 174,339,494Global Payments, Inc. . . . . . . . . . . . . . . . . . . . . . . . . . 620,580 64,509,291Goldman Sachs Group, Inc. . . . . . . . . . . . . . . . . . . . . . 443,260 107,481,685Goodyear Tire & Rubber Co. . . . . . . . . . . . . . . . . . . . . 70,771 2,164,885
12 2 0 1 7 B L A C K R O C K A N N U A L R E P O R T T O S H A R E H O L D E R S

Consolidated Schedule of Investments (continued)
October 31, 2017
BlackRock Global Allocation Fund, Inc.(Percentages shown are based on Net Assets)
Security Shares Value
United States (continued)
Halliburton Co. . . . . . . . . . . . . . . . . . . . . . . . . . . . . . . . 14,128 $ 603,831Hartford Financial Services Group, Inc. . . . . . . . . . . . . . 215,407 11,858,155HCA Healthcare, Inc.(a) . . . . . . . . . . . . . . . . . . . . . . . . . 2,176,813 164,675,903HCP, Inc. . . . . . . . . . . . . . . . . . . . . . . . . . . . . . . . . . . . 30,891 798,223Helmerich & Payne, Inc. . . . . . . . . . . . . . . . . . . . . . . . . 58,766 3,191,581Hewlett Packard Enterprise Co. . . . . . . . . . . . . . . . . . . 19,867 276,549Home Depot, Inc. . . . . . . . . . . . . . . . . . . . . . . . . . . . . . 531,522 88,115,717Honeywell International, Inc. . . . . . . . . . . . . . . . . . . . . . 1,910 275,346HP, Inc. . . . . . . . . . . . . . . . . . . . . . . . . . . . . . . . . . . . . 65,620 1,414,111Humana, Inc. . . . . . . . . . . . . . . . . . . . . . . . . . . . . . . . . 694 177,213Illinois Tool Works, Inc. . . . . . . . . . . . . . . . . . . . . . . . . 34,534 5,405,262Illumina, Inc.(a) . . . . . . . . . . . . . . . . . . . . . . . . . . . . . . . 919 188,570Ingersoll-Rand PLC . . . . . . . . . . . . . . . . . . . . . . . . . . . 4,169 369,373Intel Corp. . . . . . . . . . . . . . . . . . . . . . . . . . . . . . . . . . . 176,071 8,009,470International Business Machines Corp. . . . . . . . . . . . . . 137,989 21,258,585International Paper Co. . . . . . . . . . . . . . . . . . . . . . . . . . 106,276 6,086,426Intuit, Inc. . . . . . . . . . . . . . . . . . . . . . . . . . . . . . . . . . . . 53,318 8,052,084Jawbone Health Hub, Inc.,
(Acquired 1/24/17, Cost $0)(a)(e)(f) . . . . . . . . . . . . . . . 1,518,232 2,070,261Johnson & Johnson . . . . . . . . . . . . . . . . . . . . . . . . . . . 123,682 17,242,508JPMorgan Chase & Co. . . . . . . . . . . . . . . . . . . . . . . . . 1,681,156 169,141,105Kansas City Southern . . . . . . . . . . . . . . . . . . . . . . . . . . 1,324,894 138,080,453Kimberly-Clark Corp. . . . . . . . . . . . . . . . . . . . . . . . . . . 5,663 637,144Kinder Morgan, Inc. . . . . . . . . . . . . . . . . . . . . . . . . . . . 18,054 326,958KLA-Tencor Corp. . . . . . . . . . . . . . . . . . . . . . . . . . . . . 54,749 5,961,619Kroger Co. . . . . . . . . . . . . . . . . . . . . . . . . . . . . . . . . . . 6,138 127,057Lam Research Corp. . . . . . . . . . . . . . . . . . . . . . . . . . . 889 185,419Las Vegas Sands Corp. . . . . . . . . . . . . . . . . . . . . . . . . 24,127 1,529,169Lear Corp. . . . . . . . . . . . . . . . . . . . . . . . . . . . . . . . . . . 31,181 5,475,072Liberty Broadband Corp., Class A(a) . . . . . . . . . . . . . . . 248,373 21,412,236Liberty Broadband Corp., Class C(a) . . . . . . . . . . . . . . . 606,683 52,957,359Liberty Media Corp. — Liberty SiriusXM, Class A(a) . . . . 890,637 37,148,469Liberty Media Corp. — Liberty SiriusXM, Class C(a) . . . . 1,492,392 62,158,127Lookout, Inc., (Acquired 3/04/15, cost
$2,096,082)(a)(e)(f) . . . . . . . . . . . . . . . . . . . . . . . . . . . 183,495 187,165Lowe’s Cos., Inc. . . . . . . . . . . . . . . . . . . . . . . . . . . . . . 2,480,081 198,282,476LyondellBasell Industries NV, Class A . . . . . . . . . . . . . . 6,356 658,037ManpowerGroup, Inc. . . . . . . . . . . . . . . . . . . . . . . . . . . 28,617 3,527,904Marathon Oil Corp. . . . . . . . . . . . . . . . . . . . . . . . . . . . . 6,326,969 89,969,499Marathon Petroleum Corp. . . . . . . . . . . . . . . . . . . . . . . 3,460,105 206,706,673Marsh & McLennan Cos., Inc. . . . . . . . . . . . . . . . . . . . . 977,431 79,103,491Masco Corp. . . . . . . . . . . . . . . . . . . . . . . . . . . . . . . . . 2,150,540 85,634,503Mastercard, Inc., Class A . . . . . . . . . . . . . . . . . . . . . . . 539,205 80,217,528McDonald’s Corp. . . . . . . . . . . . . . . . . . . . . . . . . . . . . 58,689 9,795,781McKesson Corp. . . . . . . . . . . . . . . . . . . . . . . . . . . . . . 31,159 4,296,203Merck & Co., Inc. . . . . . . . . . . . . . . . . . . . . . . . . . . . . . 11,419 629,073MetLife, Inc. . . . . . . . . . . . . . . . . . . . . . . . . . . . . . . . . . 1,932,062 103,519,882Michael Kors Holdings Ltd.(a) . . . . . . . . . . . . . . . . . . . . 2,373,870 115,868,595Micron Technology, Inc.(a) . . . . . . . . . . . . . . . . . . . . . . . 20,451 906,184Microsoft Corp. . . . . . . . . . . . . . . . . . . . . . . . . . . . . . . 8,260,345 687,095,497Mohawk Industries, Inc.(a) . . . . . . . . . . . . . . . . . . . . . . . 376,261 98,490,079Mondelez International, Inc., Class A . . . . . . . . . . . . . . 343,758 14,241,894Monsanto Co. . . . . . . . . . . . . . . . . . . . . . . . . . . . . . . . 11,527 1,395,920Moody’s Corp. . . . . . . . . . . . . . . . . . . . . . . . . . . . . . . . 7,169 1,020,937Morgan Stanley . . . . . . . . . . . . . . . . . . . . . . . . . . . . . . 4,537,728 226,886,400Motorola Solutions, Inc. . . . . . . . . . . . . . . . . . . . . . . . . 2,331 211,049NextEra Energy Partners LP . . . . . . . . . . . . . . . . . . . . . 1,331,767 52,391,714NextEra Energy, Inc. . . . . . . . . . . . . . . . . . . . . . . . . . . 1,254,560 194,544,619Norfolk Southern Corp. . . . . . . . . . . . . . . . . . . . . . . . . . 2,199 288,993Northern Trust Corp. . . . . . . . . . . . . . . . . . . . . . . . . . . 5,022 469,657Northrop Grumman Corp. . . . . . . . . . . . . . . . . . . . . . . . 24,957 7,375,542O’Reilly Automotive, Inc.(a) . . . . . . . . . . . . . . . . . . . . . . 683,816 144,250,985ONEOK, Inc. . . . . . . . . . . . . . . . . . . . . . . . . . . . . . . . . 5,533 300,276Ocean Rig UDW, Inc.(a) . . . . . . . . . . . . . . . . . . . . . . . . 667,003 17,862,340Oracle Corp. . . . . . . . . . . . . . . . . . . . . . . . . . . . . . . . . 36,339 1,849,655
Security Shares Value
United States (continued)
PACCAR, Inc. . . . . . . . . . . . . . . . . . . . . . . . . . . . . . . . 3,512 $ 251,916Packaging Corp. of America . . . . . . . . . . . . . . . . . . . . . 63,753 7,412,561PepsiCo, Inc. . . . . . . . . . . . . . . . . . . . . . . . . . . . . . . . . 147,820 16,294,199Perrigo Co. PLC . . . . . . . . . . . . . . . . . . . . . . . . . . . . . . 1,100,782 89,152,334Pfizer, Inc. . . . . . . . . . . . . . . . . . . . . . . . . . . . . . . . . . . 7,155,386 250,867,833PG&E Corp. . . . . . . . . . . . . . . . . . . . . . . . . . . . . . . . . . 3,315 191,508Philip Morris International, Inc. . . . . . . . . . . . . . . . . . . . 16,401 1,716,201Phillips 66 . . . . . . . . . . . . . . . . . . . . . . . . . . . . . . . . . . 58,014 5,283,915Pioneer Natural Resources Co. . . . . . . . . . . . . . . . . . . . 575,140 86,081,204Praxair, Inc. . . . . . . . . . . . . . . . . . . . . . . . . . . . . . . . . . 2,437 356,094Priceline Group, Inc.(a) . . . . . . . . . . . . . . . . . . . . . . . . . 14,442 27,612,526Procter & Gamble Co. . . . . . . . . . . . . . . . . . . . . . . . . . 18,612 1,606,960Prudential Financial, Inc. . . . . . . . . . . . . . . . . . . . . . . . 55,120 6,088,555Pure Storage, Inc., Class A(a) . . . . . . . . . . . . . . . . . . . . 4,305,334 70,736,638PVH Corp. . . . . . . . . . . . . . . . . . . . . . . . . . . . . . . . . . . 23,641 2,997,915QUALCOMM, Inc. . . . . . . . . . . . . . . . . . . . . . . . . . . . . 5,176,254 264,040,717Ralph Lauren Corp. . . . . . . . . . . . . . . . . . . . . . . . . . . . 597,307 53,417,165Raytheon Co. . . . . . . . . . . . . . . . . . . . . . . . . . . . . . . . . 29,684 5,349,057Reinsurance Group of America, Inc. . . . . . . . . . . . . . . . 45,652 6,819,496Republic Services, Inc. . . . . . . . . . . . . . . . . . . . . . . . . . 11,658 758,586Rockwell Automation, Inc. . . . . . . . . . . . . . . . . . . . . . . 26,475 5,316,709Royal Caribbean Cruises Ltd. . . . . . . . . . . . . . . . . . . . . 29,269 3,622,624S&P Global, Inc. . . . . . . . . . . . . . . . . . . . . . . . . . . . . . 2,462 385,229Sabre Corp. . . . . . . . . . . . . . . . . . . . . . . . . . . . . . . . . . 342,832 6,705,794Schlumberger Ltd. . . . . . . . . . . . . . . . . . . . . . . . . . . . . 876,588 56,101,632Sempra Energy . . . . . . . . . . . . . . . . . . . . . . . . . . . . . . 657,390 77,243,325Snap, Inc., Class A(a)(b) . . . . . . . . . . . . . . . . . . . . . . . . . 2,879,170 44,166,468St. Joe Co.(a)(v) . . . . . . . . . . . . . . . . . . . . . . . . . . . . . . . 4,900,721 87,232,834Starbucks Corp. . . . . . . . . . . . . . . . . . . . . . . . . . . . . . . 5,154 282,645State Street Corp. . . . . . . . . . . . . . . . . . . . . . . . . . . . . 15,351 1,412,292Stryker Corp. . . . . . . . . . . . . . . . . . . . . . . . . . . . . . . . . 20,837 3,227,026SunTrust Banks, Inc. . . . . . . . . . . . . . . . . . . . . . . . . . . 969,032 58,345,417Symantec Corp. . . . . . . . . . . . . . . . . . . . . . . . . . . . . . . 2,954 96,005Target Corp. . . . . . . . . . . . . . . . . . . . . . . . . . . . . . . . . 1,197,614 70,707,131Tenet Healthcare Corp.(a)(b) . . . . . . . . . . . . . . . . . . . . . . 2,941,993 42,011,660TESARO, Inc.(a)(b) . . . . . . . . . . . . . . . . . . . . . . . . . . . . 302,946 35,072,058Texas Instruments, Inc. . . . . . . . . . . . . . . . . . . . . . . . . 12,441 1,202,920Thermo Fisher Scientific, Inc. . . . . . . . . . . . . . . . . . . . . 70,125 13,592,329Travelers Cos., Inc. . . . . . . . . . . . . . . . . . . . . . . . . . . . 113,388 15,018,241TripAdvisor, Inc.(a)(b) . . . . . . . . . . . . . . . . . . . . . . . . . . . 1,456,250 54,609,375Tyson Foods, Inc., Class A . . . . . . . . . . . . . . . . . . . . . . 49,913 3,639,157Union Pacific Corp. . . . . . . . . . . . . . . . . . . . . . . . . . . . 6,183 715,930United Continental Holdings, Inc.(a) . . . . . . . . . . . . . . . . 2,609,685 152,614,379United Rentals, Inc.(a) . . . . . . . . . . . . . . . . . . . . . . . . . . 42,781 6,052,656United Technologies Corp. . . . . . . . . . . . . . . . . . . . . . . 9,353 1,120,115UnitedHealth Group, Inc. . . . . . . . . . . . . . . . . . . . . . . . 93,587 19,673,859Unum Group . . . . . . . . . . . . . . . . . . . . . . . . . . . . . . . . 836,905 43,552,536Valero Energy Corp. . . . . . . . . . . . . . . . . . . . . . . . . . . . 127,987 10,096,894VeriFone Systems, Inc.(a)(b) . . . . . . . . . . . . . . . . . . . . . . 1,640,162 31,294,291VeriSign, Inc.(a)(b) . . . . . . . . . . . . . . . . . . . . . . . . . . . . . 64,047 6,886,333Verizon Communications, Inc. . . . . . . . . . . . . . . . . . . . 3,633,215 173,922,002Visa, Inc., Class A . . . . . . . . . . . . . . . . . . . . . . . . . . . . 673,091 74,026,548Vistra Energy Corp. . . . . . . . . . . . . . . . . . . . . . . . . . . . 1,011,006 19,653,957VMware, Inc., Class A(a)(b) . . . . . . . . . . . . . . . . . . . . . . 569,088 68,114,143WABCO Holdings, Inc.(a) . . . . . . . . . . . . . . . . . . . . . . . 33,026 4,873,647Wal-Mart Stores, Inc. . . . . . . . . . . . . . . . . . . . . . . . . . . 3,873 338,152Walgreens Boots Alliance, Inc. . . . . . . . . . . . . . . . . . . . 14,542 963,698Waste Management, Inc. . . . . . . . . . . . . . . . . . . . . . . . 12,934 1,062,787Wells Fargo & Co. . . . . . . . . . . . . . . . . . . . . . . . . . . . . 6,685 375,296Western Digital Corp. . . . . . . . . . . . . . . . . . . . . . . . . . . 36,687 3,275,048WestRock Co. . . . . . . . . . . . . . . . . . . . . . . . . . . . . . . . 1,068,917 65,556,680Weyerhaeuser Co. . . . . . . . . . . . . . . . . . . . . . . . . . . . . 14,589 523,891Williams Cos., Inc. . . . . . . . . . . . . . . . . . . . . . . . . . . . . 5,522,059 157,378,681Williams-Sonoma, Inc. . . . . . . . . . . . . . . . . . . . . . . . . . 1,112,731 57,416,920Wyndham Worldwide Corp. . . . . . . . . . . . . . . . . . . . . . 65,407 6,988,738
C O N S O L I D A T E D S C H E D U L E O F I N V E S T M E N T S 13

Consolidated Schedule of Investments (continued)
October 31, 2017
BlackRock Global Allocation Fund, Inc.(Percentages shown are based on Net Assets)
Security Shares Value
United States (continued)
Wynn Resorts Ltd. . . . . . . . . . . . . . . . . . . . . . . . . 37,510 $ 5,532,350Yum China Holdings, Inc.(a) . . . . . . . . . . . . . . . . . . 5,842 235,725Zimmer Biomet Holdings, Inc. . . . . . . . . . . . . . . . . 1,206,874 146,780,016
11,401,024,851
Total Common Stocks — 56.6% . . . . . . . . . . . . . . . . . . . . . . . . . . . . . 22,029,410,175
Corporate Bonds
Australia — 0.2%
Quintis Ltd., 8.75%, 8/01/23(c)(g) . . . . . . . . . . . . . . . USD 120,610 84,427,000
Brazil — 0.0%
Odebrecht Finance Ltd., 4.38%, 4/25/25(c) . . . . . . . 21,269 8,082,220
Chile — 0.0%
Inversiones Alsacia SA, 8.00%, 12/31/18(a)(c)(g) . . . . 34,787 869,680
China — 0.0%
China Milk Products Group Ltd.,0.00%, 1/05/12(a)(e)(g)(h)(i) . . . . . . . . . . . . . . . . . . 39,500 197,500
France — 0.1%
Danone SA, 2.59%, 11/02/23(c) . . . . . . . . . . . . . . . 29,684 29,159,222
Germany — 0.2%
Bayer Capital Corp. BV, 5.63%, 11/22/19(c)(i) . . . . . EUR 59,300 82,458,968Unitymedia Hessen GmbH & Co. KG/Unitymedia
NRW GmbH, 5.50%, 1/15/23(c) . . . . . . . . . . . . . USD 12,406 12,746,754
95,205,722
India — 0.0%
REI Agro Ltd., 5.50%, 11/13/17(a)(e)(g)(i) . . . . . . . . . . 54,787 5
Italy — 0.1%
Telecom Italia SpA, 5.30%, 5/30/24(c) . . . . . . . . . . 26,823 28,901,783
Luxembourg — 0.1%
Actavis Funding SCS, 3.45%, 3/15/22 . . . . . . . . . . 27,962 28,712,888Intelsat Jackson Holdings SA:
7.50%, 4/01/21 . . . . . . . . . . . . . . . . . . . . . . . . . 24,262 22,988,2458.00%, 2/15/24 (c) . . . . . . . . . . . . . . . . . . . . . . 8,522 9,033,320
60,734,453
Mexico — 0.3%
Petroleos Mexicanos:(3 mo. LIBOR US + 3.65%),
4.97%, 3/11/22(c)(j) . . . . . . . . . . . . . . . . . . . . 32,239 35,140,5104.63%, 9/21/23 . . . . . . . . . . . . . . . . . . . . . . . . . 70,540 72,127,150
Trust F/1401, 5.25%, 12/15/24(c) . . . . . . . . . . . . . . 12,400 13,237,000
120,504,660
Netherlands — 0.3%
Bio City Development Co. BV,8.00%, 7/06/18(a)(c)(e)(g)(v) . . . . . . . . . . . . . . . . . . 140,850 36,860,445
Cooperatieve Rabobank UA, 3.95%, 11/09/22 . . . . 8,259 8,711,674Petrobras Global Finance BV:
6.13%, 1/17/22 . . . . . . . . . . . . . . . . . . . . . . . . . 26,895 29,073,4957.38%, 1/17/27 . . . . . . . . . . . . . . . . . . . . . . . . . 31,333 34,795,297
109,440,911
Singapore — 0.1%
CapitaLand Ltd., 1.95%, 10/17/23(c) . . . . . . . . . . . . SGD 35,000 26,755,190
Switzerland — 0.1%
UBS Group Funding Switzerland AG,4.13%, 9/24/25(c) . . . . . . . . . . . . . . . . . . . . . . . USD 20,186 21,289,983
United Arab Emirates — 0.2%
Dana Gas Sukuk Ltd., 7.00%, 10/31/17(a)(c)(g)(i) . . . . USD 86,375 68,581,956
Security Shares Value
United States — 2.0%
Activision Blizzard, Inc., 2.30%, 9/15/21 . . . . . . . . . 7,649 $ 7,546,389AliphCom(a)(e)(f)(g)(i):
(Acquired 11/11/15, cost $11,493,000),15.00%, 4/28/20 . . . . . . . . . . . . . . . . . . . . . . 11,493 99,989
(Acquired 4/27/15 — 7/21/15, cost$204,855,000), 15.00%, 4/28/20 . . . . . . . . . . 204,855 1,782,239
Ally Financial, Inc., 3.50%, 1/27/19 . . . . . . . . . . . . 17,849 18,066,758Apple, Inc.:
3.35%, 2/09/27 . . . . . . . . . . . . . . . . . . . . . . . . . 49,337 50,625,4623.20%, 5/11/27 . . . . . . . . . . . . . . . . . . . . . . . . . 47,407 48,117,363
AT&T, Inc.:3.00%, 6/30/22 . . . . . . . . . . . . . . . . . . . . . . . . . 58,958 59,670,8642.85%, 2/14/23 . . . . . . . . . . . . . . . . . . . . . . . . . 43,328 43,034,2503.40%, 8/14/24 . . . . . . . . . . . . . . . . . . . . . . . . . 70,382 70,325,050
Bank of America Corp.:3.30%, 1/11/23 . . . . . . . . . . . . . . . . . . . . . . . . . 32,504 33,296,6834.00%, 1/22/25 . . . . . . . . . . . . . . . . . . . . . . . . . 15,102 15,640,896
Becton Dickinson & Co.:3.13%, 11/08/21 . . . . . . . . . . . . . . . . . . . . . . . . 29,124 29,765,0872.89%, 6/06/22 . . . . . . . . . . . . . . . . . . . . . . . . . 24,015 24,068,7103.36%, 6/06/24 . . . . . . . . . . . . . . . . . . . . . . . . . 12,584 12,688,708
Citigroup, Inc.:2.70%, 3/30/21 . . . . . . . . . . . . . . . . . . . . . . . . . 29,067 29,321,5132.90%, 12/08/21 . . . . . . . . . . . . . . . . . . . . . . . . 13,366 13,509,090
eBay, Inc., 3.80%, 3/09/22 . . . . . . . . . . . . . . . . . . 14,531 15,210,059Edgewell Personal Care Co.:
4.70%, 5/19/21 . . . . . . . . . . . . . . . . . . . . . . . . . 15,982 16,861,0104.70%, 5/24/22 . . . . . . . . . . . . . . . . . . . . . . . . . 14,893 15,823,812
Forest Laboratories LLC, 5.00%, 12/15/21(c) . . . . . . 14,215 15,430,958General Motors Financial Co., Inc.,
3.45%, 4/10/22 . . . . . . . . . . . . . . . . . . . . . . . . . 12,099 12,369,247Hughes Satellite Systems Corp., 7.63%, 6/15/21 . . 4,968 5,551,740JPMorgan Chase & Co.:
4.35%, 8/15/21 . . . . . . . . . . . . . . . . . . . . . . . . . 12,267 13,110,591(3 mo. LIBOR US + 1.00%), 2.36%, 1/15/23(j) . . 32,732 33,092,548
Santander Holdings USA, Inc., 3.70%, 3/28/22(c) . . 8,170 8,359,426Sherwin-Williams Co., 2.75%, 6/01/22 . . . . . . . . . . 10,469 10,533,508Synchrony Financial, 3.75%, 8/15/21 . . . . . . . . . . . 8,436 8,726,320Verizon Communications, Inc.:
3.13%, 3/16/22 . . . . . . . . . . . . . . . . . . . . . . . . . 141,123 144,199,1772.63%, 8/15/26 . . . . . . . . . . . . . . . . . . . . . . . . . 13,931 13,140,282
769,967,729
Total Corporate Bonds — 3.7% . . . . . . . . . . . . . . . . . . . . . . . . . . . . . . 1,424,118,014
Floating Rate Loan Interests(k)
United States — 0.5%
Fieldwood Energy LLC:1st Lien Last Out Term Loan, (3 mo. LIBOR +
7.12%), 8.45%, 9/30/20 . . . . . . . . . . . . . . . . . 15,642 11,053,9221st Lien Term Loan, (3 mo. LIBOR + 7.00%,
1.00% Floor), 8.33%, 8/31/20 . . . . . . . . . . . . 11,587 10,457,1462nd Lien Term Loan, (3 mo. LIBOR + 7.12%),
8.45%, 9/30/20 . . . . . . . . . . . . . . . . . . . . . . . 26,326 9,411,687Hilton Worldwide Finance LLC, Term Loan B2,
(1 mo. LIBOR + 2.00%), 3.24%, 10/25/23 . . . . . 54,710 55,052,171Neiman Marcus Group, Inc., 2020 Term Loan,
(1 mo. LIBOR + 3.25%, 1.00% Floor),4.49%, 10/25/20 . . . . . . . . . . . . . . . . . . . . . . . . 11,961 9,376,954
Seadrill Partners Finco LLC, Term Loan B, (3 mo.LIBOR + 3.00%, 1.00% Floor),4.33%, 2/21/21 . . . . . . . . . . . . . . . . . . . . . . . . . 54,131 41,061,973
Sheridan Investment Partners II LP:Term Loan A, (3 mo. LIBOR + 3.50%),
4.82%, 12/16/20 . . . . . . . . . . . . . . . . . . . . . . USD 61,204 51,411,114
14 2 0 1 7 B L A C K R O C K A N N U A L R E P O R T T O S H A R E H O L D E R S

Consolidated Schedule of Investments (continued)
October 31, 2017
BlackRock Global Allocation Fund, Inc.(Percentages shown are based on Net Assets)
Security Shares Value
United States (continued)
Term Loan B, (3 mo. LIBOR + 3.50%),4.82%, 12/16/20 . . . . . . . . . . . . . . . . . . . . . . 3,175 $ 2,667,134
Term Loan M, (3 mo. LIBOR + 3.50%),4.82%, 12/16/20 . . . . . . . . . . . . . . . . . . . . . . 8,514 7,151,667
Total Floating Rate Loan Interests — 0.5% . . . . . . . . . . . . . . . . . . . . . 197,643,768
Foreign Agency Obligations
Argentina — 0.7%
Argentine Republic Government InternationalBond:6.88%, 4/22/21 . . . . . . . . . . . . . . . . . . . . . . . . . 36,038 39,281,4205.63%, 1/26/22 . . . . . . . . . . . . . . . . . . . . . . . . . 73,052 76,704,6007.50%, 4/22/26 . . . . . . . . . . . . . . . . . . . . . . . . . 67,784 76,595,9206.88%, 1/26/27 . . . . . . . . . . . . . . . . . . . . . . . . . 47,049 51,283,410
Republic of Argentina, 3.88%, 1/15/22 . . . . . . . . . . EUR 19,363 23,312,828
267,178,178
Australia — 2.0%
Australia Government Bond:5.75%, 5/15/21 . . . . . . . . . . . . . . . . . . . . . . . . . AUD 176,906 152,481,4222.75%, 4/21/24 . . . . . . . . . . . . . . . . . . . . . . . . . 473,682 369,845,4553.00%, 3/21/47 . . . . . . . . . . . . . . . . . . . . . . . . . 118,878 83,476,777Series 133, 5.50%, 4/21/23 . . . . . . . . . . . . . . . . 197,811 176,252,860
782,056,514
Brazil — 1.7%
Brazil Notas do Tesouro Nacional:Series B, 6.00%, 8/15/22 . . . . . . . . . . . . . . . . . BRL 111 109,462,983Series F, 10.00%, 1/01/23 . . . . . . . . . . . . . . . . . 658 204,770,876Series F, 10.00%, 1/01/27 . . . . . . . . . . . . . . . . . 476 146,614,360
Brazilian Government International Bond:4.63%, 1/13/28 . . . . . . . . . . . . . . . . . . . . . . . . . USD 100,574 99,869,9825.00%, 1/27/45 . . . . . . . . . . . . . . . . . . . . . . . . . 73,010 67,562,2365.63%, 2/21/47 . . . . . . . . . . . . . . . . . . . . . . . . . 27,704 28,230,376
656,510,813
Canada — 1.0%
Canadian Government Bond:0.50%, 8/01/18 . . . . . . . . . . . . . . . . . . . . . . . . . CAD 380,119 293,093,2280.75%, 3/01/21 . . . . . . . . . . . . . . . . . . . . . . . . . 94,879 71,762,678
364,855,906
Germany — 0.5%
Bundesrepublik Deutschland, 0.00%, 8/15/26 . . . . EUR 168,606 192,929,548
Hungary — 0.2%
Hungary Government International Bond,6.38%, 3/29/21 . . . . . . . . . . . . . . . . . . . . . . . . . USD 81,410 91,077,438
Indonesia — 0.1%
Indonesia Government International Bond:4.88%, 5/05/21 . . . . . . . . . . . . . . . . . . . . . . . . . 9,336 10,036,6673.70%, 1/08/22(c) . . . . . . . . . . . . . . . . . . . . . . . 13,396 13,904,231
23,940,898
Italy — 0.2%
Italy Buoni Poliennali Del Tesoro,1.85%, 5/15/24 . . . . . . . . . . . . . . . . . . . . . . . . . EUR 49,555 60,304,154
Japan — 1.1%
Japan Government Bond:0.10%, 3/15/18 . . . . . . . . . . . . . . . . . . . . . . . . . JPY 26,525,200 233,497,8100.10%, 10/15/18 . . . . . . . . . . . . . . . . . . . . . . . . 24,956,150 220,028,062
453,525,872
Mexico — 0.7%
Mexican Bonos:8.50%, 12/13/18 . . . . . . . . . . . . . . . . . . . . . . . . MXN 27,236 144,116,8736.50%, 6/09/22 . . . . . . . . . . . . . . . . . . . . . . . . . 26,610 135,766,874
279,883,747
Security Shares Value
New Zealand — 0.4%
New Zealand Government Bond,6.00%, 5/15/21 . . . . . . . . . . . . . . . . . . . . . . . . . NZD 215,038 $ 166,245,530
Poland — 1.2%
Poland Government Bond:3.25%, 7/25/25 . . . . . . . . . . . . . . . . . . . . . . . . . PLN 354,526 97,349,8912.50%, 7/25/26 . . . . . . . . . . . . . . . . . . . . . . . . . 356,739 91,577,3352.50%, 7/25/27 . . . . . . . . . . . . . . . . . . . . . . . . . 1,160,308 294,256,876
Poland Government International Bond,5.00%, 3/23/22 . . . . . . . . . . . . . . . . . . . . . . . . . USD 13,059 14,358,371
497,542,473
Saudi Arabia — 0.1%
Saudi Arabia Government Bond,2.38%, 10/26/21(c) . . . . . . . . . . . . . . . . . . . . . . . 28,234 27,755,151
South Korea — 0.1%
Export-Import Bank of Korea:2.88%, 9/17/18 . . . . . . . . . . . . . . . . . . . . . . . . . 12,426 12,489,5842.63%, 12/30/20 . . . . . . . . . . . . . . . . . . . . . . . . 25,337 25,301,123
37,790,707
Total Foreign Agency Obligations — 10.0% . . . . . . . . . . . . . . . . . . . . 3,901,596,929
Investment Companies(l)
United States — 3.5%
ETFS Gold Trust(a) . . . . . . . . . . . . . . . . . . . . . . . . 1,201,717 149,012,908ETFS Palladium Trust(a) . . . . . . . . . . . . . . . . . . . . 348,916 32,731,810ETFS Platinum Trust(a) . . . . . . . . . . . . . . . . . . . . . 294,567 25,836,472iShares Gold Trust(a)(v) . . . . . . . . . . . . . . . . . . . . . 20,256,855 247,336,199SPDR Gold Shares(a) . . . . . . . . . . . . . . . . . . . . . . 7,407,780 893,896,813
Total Investment Companies — 3.5% . . . . . . . . . . . . . . . . . . . . . . . . . 1,348,814,202
Non-Agency Mortgage-Backed Securities
Commercial Mortgage-Backed Securities — 0.1%
Logistics UK PLC, Series 2015 1-A, Class F, (3 mo.LIBOR GBP + 3.60%), 3.88%, 8/20/25(c)(j) . . . . . GBP 30,423 40,458,836
Preferred Securities
Capital Trusts
Netherlands — 0.0%
ING Groep NV, 6.00%(m)(n) . . . . . . . . . . . . . . . . . . USD 14,653 15,382,719
United Kingdom — 0.4%
HSBC Holdings PLC, 6.38%(m)(n) . . . . . . . . . . . . . . 53,998 58,655,328Lloyds Bank PLC, 13.00%(m)(n) . . . . . . . . . . . . . . . . 29,991 74,645,555
133,300,883
United States — 0.6%
American Express Co., Series C, 4.90%(m)(n) . . . . . 18,721 19,212,426Citigroup, Inc., Series O, 5.88%(m)(n) . . . . . . . . . . . 34,796 36,427,932General Electric Co.(m)(n):
6.38% . . . . . . . . . . . . . . . . . . . . . . . . . . . . . . . 17,475 17,497,718Series D, 5.00% . . . . . . . . . . . . . . . . . . . . . . . . 29,629 30,925,269
Goldman Sachs Group, Inc., Series M,5.38%(m)(n) . . . . . . . . . . . . . . . . . . . . . . . . . . . . 30,081 31,209,037
Morgan Stanley, Series H, 5.45%(m)(n) . . . . . . . . . . 21,230 22,015,510NBCUniversal Enterprise, Inc., 5.25%(c)(n) . . . . . . . USD 22,612 24,138,310Prudential Financial, Inc.:
5.88%, 9/15/42(m) . . . . . . . . . . . . . . . . . . . . . . . 16,174 17,872,2705.63%, 6/15/43(m) . . . . . . . . . . . . . . . . . . . . . . . 11,171 12,137,292
USB Capital IX, 3.50%(m)(n) . . . . . . . . . . . . . . . . . . 7,788 6,993,546
218,429,310
Total Capital Trusts — 1.0% . . . . . . . . . . . . . . . . . . . . . . . . . . . . . . . . 367,112,912
C O N S O L I D A T E D S C H E D U L E O F I N V E S T M E N T S 15

Consolidated Schedule of Investments (continued)
October 31, 2017
BlackRock Global Allocation Fund, Inc.(Percentages shown are based on Net Assets)
Security Shares Value
Preferred Stocks
Brazil — 0.0%
Itau Unibanco Holding SA, Preference Shares . . . . 29,989 $ 385,485Petroleo Brasileiro SA, Preference Shares(a) . . . . . . 10,997 56,375Vale SA, Preference Shares . . . . . . . . . . . . . . . . . . 25,774 234,317
676,177
South Korea — 0.0%
Samsung Electronics Co. Ltd., PreferenceShares . . . . . . . . . . . . . . . . . . . . . . . . . . . . . . . 525 1,051,493
United States — 2.2%
Anthem, Inc., 5.25%(i) . . . . . . . . . . . . . . . . . . . . . . . 1,515,402 80,740,618Crown Castle International Corp., Series A,
6.88%(i) . . . . . . . . . . . . . . . . . . . . . . . . . . . . . . . 49,059 53,857,951Dominion Resources, Inc., Series A, 6.75%(i) . . . . . 1,196,315 62,603,164Domo, Inc., Series D-2, (Acquired 4/01/15,
cost $89,772,577), 0.00%(a)(e)(f) . . . . . . . . . . . . . . 10,647,157 94,546,763DropBox, Inc., Series C (Acquired 1/28/14,
cost $150,070,985), 0.00%(a)(e)(f) . . . . . . . . . . . . . 7,856,626 104,493,126Grand Rounds, Inc., Series C, (Acquired 3/31/15,
cost $27,587,149), 0.00%(a)(e)(f) . . . . . . . . . . . . . . 9,935,944 30,503,348Lookout, Inc., Series F (Acquired 9/19/14,
cost $53,322,391), 0.00%(a)(e)(f) . . . . . . . . . . . . . . 4,667,944 49,900,321Palantir Technologies, Inc., Series I (Acquired
3/27/14, cost $58,747,474), 0.00%(a)(e)(f) . . . . . . . 9,583,601 54,339,018Uber Technologies, Inc., Series D (Acquired
6/01014, cost $90,664,966), 0.00%(a)(e)(f) . . . . . . . 5,844,432 267,674,986Wells Fargo & Co., Series L, 7.50%(i) . . . . . . . . . . . 11,678 15,298,180Welltower, Inc., Series I, 6.50%(i)(n) . . . . . . . . . . . . . 561,548 34,439,739
848,397,214
Total Preferred Stocks — 2.2% . . . . . . . . . . . . . . . . . . . . . . . . . . . . . . 850,124,884
Trust Preferreds
Diversified Financial Services — 0.5%
Citigroup Capital XIII, 7.68%, 10/30/40(k) . . . . . . . . . 1,319,420 35,316,146GMAC Capital Trust I, Series 2,
7.10%, 2/15/40(p) . . . . . . . . . . . . . . . . . . . . . . . . 1,506,882 39,028,035Mandatory Exchangeable Trust, 5.75%(c)(i)(n) . . . . . . 592,921 124,270,312
Total Trust Preferreds — 0.5% . . . . . . . . . . . . . . . . . . . . . . . . . . . . . . 198,614,493
Total Preferred Securities — 3.7% . . . . . . . . . . . . . . . . . . . . . . . . . . . 1,415,852,289
U.S. Treasury ObligationsU.S. Treasury Inflation Protected Security,
0.13%, 4/15/22 . . . . . . . . . . . . . . . . . . . . . . . . . USD 687,956 686,880,617U.S. Treasury Notes:
1.13%, 7/31/21(p) . . . . . . . . . . . . . . . . . . . . . . . . 81,315 79,161,9091.88%, 9/30/22 . . . . . . . . . . . . . . . . . . . . . . . . . 881,123 875,374,7492.00%, 10/31/22 . . . . . . . . . . . . . . . . . . . . . . . . 1,255,713 1,254,977,2272.13%, 9/30/24(p)(r) . . . . . . . . . . . . . . . . . . . . . . . 1,942,757 1,930,463,2992.25%, 8/15/27 . . . . . . . . . . . . . . . . . . . . . . . . . 1,145,561 1,132,942,232
Total U.S. Treasury Obligations — 15.3% . . . . . . . . . . . . . . . . . . . . . . 5,959,800,033
Warrants — 0.0%
Australia — 0.0%
Quintis Ltd. (Issued/exercisable 8/01/11, 1 share for1 warrant, Expires 7/15/18, Strike Price AUD 1.28)(c) 21,267,512 213
Total Long-Term Investments — 93.4%
(Cost — $30,792,355,726) . . . . . . . . . . . . . . . . . . . . . . . . . . . . . . . . 36,317,694,459
Security Shares Value
Short-Term Securities
Time Deposits
Canada — 0.0%
Brown Brothers Harriman & Co.,0.15%, 11/01/17 . . . . . . . . . . . . . . . . . . . . . . . . CAD 19 $ 14,659
Hong Kong — 0.0%
BNP Paribas S.A., 0.01%, 11/01/17 . . . . . . . . . . . . HKD 1,920 246,154
Japan — 0.0%
Sumitomo Bank, (0.24)%, 11/01/17 . . . . . . . . . . . . JPY 7,266 63,900
United Kingdom — 0.0%
Brown Brothers Harriman & Co.,0.50%, 11/01/17 . . . . . . . . . . . . . . . . . . . . . . . . GBP 14 18,632
Total Time Deposits — 0.0% . . . . . . . . . . . . . . . . . . . . . . . . . . . . . . . . 343,345
U.S. Treasury ObligationsU.S. Treasury Bills(q):
1.01%, 11/02/17 . . . . . . . . . . . . . . . . . . . . . . . . USD 65,000 64,998,2530.92% - 1.05%, 11/09/17 . . . . . . . . . . . . . . . . . . 979,281 979,071,8170.97% - 1.00%, 11/16/17 . . . . . . . . . . . . . . . . . . 257,430 257,325,1510.96% - 0.98%, 11/24/17 . . . . . . . . . . . . . . . . . . 402,000 401,751,5120.98% - 1.00%, 11/30/17 . . . . . . . . . . . . . . . . . . 129,000 128,896,8520.95% - 0.96%, 12/07/17 . . . . . . . . . . . . . . . . . . 135,000 134,867,5310.93%, 12/14/17 . . . . . . . . . . . . . . . . . . . . . . . . 125,000 124,855,546
U.S. Treasury Notes, 0.75%, 12/31/17(l) . . . . . . . . . 120,000 119,915,449
Total U.S. Treasury Obligations — 5.7% . . . . . . . . . . . . . . . . . . . . . . . 2,211,682,111
Money Market Funds — 1.0%
BlackRock Liquidity Funds, T-Fund, InstitutionalClass, 0.21%(s)(v) . . . . . . . . . . . . . . . . . . . . . . . . 98,212,840 98,212,840
SL Liquidity Series, LLC, Money Market Series,1.32%(s)(t)(v) . . . . . . . . . . . . . . . . . . . . . . . . . . . . 307,218,218 307,248,940
Total Money Markey Funds — 1.0% . . . . . . . . . . . . . . . . . . . . . . . . . . 405,461,780
Total Short-Term Securities — 6.7%
(Cost — $2,617,538,554) . . . . . . . . . . . . . . . . . . . . . . . . . . . . . . . . . 2,617,487,236
Options Purchased — 0.3%
(Cost — $132,295,218) . . . . . . . . . . . . . . . . . . . . . . . . . . . . . . . . . . . 123,731,279
Total Investments Before Options Written — 100.4%
(Cost — $33,542,189,498) . . . . . . . . . . . . . . . . . . . . . . . . . . . . . . . . 39,058,912,974
Options Written — (0.2)%
(Premiums Received — $90,757,580) . . . . . . . . . . . . . . . . . . . . . . . (65,499,354)
Total Investments, Net of Options Written — 100.2%
(Cost — $33,451,431,918) . . . . . . . . . . . . . . . . . . . . . . . . . . . . . . . . 38,993,413,620
Liabilities in Excess of Other Assets — (0.2)% . . . . . . . . . . . . . . . . . . (69,323,572)
Net Assets — 100.0% . . . . . . . . . . . . . . . . . . . . . . . . . . . . . . . . . . . . . $38,924,090,048
(a) Non-income producing security.(b) Security, or a portion of the security, is on loan.(c) Security exempt from registration pursuant to Rule 144A under the Securities Act of
1933, as amended. These securities may be resold in transactions exempt fromregistration to qualified institutional investors.
(d) A security contractually bound to one or more other securities to form a single saleableunit which cannot be sold separately.
(e) Security is valued using significant unobservable inputs and is classified as Level 3 in thefair value hierarchy.
(f) Restricted security as to resale, excluding 144A securities. As of period end, the Fundheld restricted securities with a current value of $605,597,216 and an original cost of$688,609,624, which was 1.6% of its net assets.
(g) Issuer filed for bankruptcy and/or is in default.
16 2 0 1 7 B L A C K R O C K A N N U A L R E P O R T T O S H A R E H O L D E R S

Consolidated Schedule of Investments (continued)
October 31, 2017
BlackRock Global Allocation Fund, Inc.(Percentages shown are based on Net Assets)
(h) Zero-coupon bond.(i) Convertible security.(j) Floating rate security. Rate shown is the rate in effect as of period end.(k) Variable rate security. Rate shown is the rate in effect as of period end.(l) All or a portion of the security is held by a wholly-owned subsidiary. See Note 1 of the
Notes to Consolidated Financial Statements for details on the wholly-owned subsidiary.(m) Variable rate security. Security may be issued at a fixed coupon rate, which converts to a
variable rate at a specified date. Rate shown is the rate in effect as of period end.(n) Perpetual security with no stated maturity date.(o) Variable or floating rate security, which interest rate adjusts periodically based on
changes in current interest rates and prepayments on the underlying pool of assets. Rateshown is the rate in effect as of period end.
(p) All or a portion of the security has been pledged in connection with outstanding futurescontracts.
(q) Rates are discount rates or a range of discount rates paid at the time of purchase.(r) All or a portion of the security has been pledged as collateral in connection with
outstanding OTC derivatives.(s) Annualized 7-day yield as of period end.(t) Security was purchased with the cash collateral from loaned securities.(u) All or a portion of security has been pledged as collateral in connection with short sales.
(v) During the year ended October 31, 2017, investments in issuers considered to be affiliates of the Fund for purposes of Section 2(a)(3) of the Investment Company Act of 1940, as amended,and/or related parties of the Fund were as follows:
Affiliate Persons and/or Related Parties
Shares/ParHeld at
10/31/16Shares/ParPurchased
Shares/ParSold
Shares/ParHeld at
10/31/17Value at10/31/17 Income
Net RealizedGain (Loss) (a)
Change inUnrealized
Appreciation(Depreciation)
BlackRock Liquidity Funds, T-Fund, Institutional Class . . . 9,025,760 89,187,080(b) — 98,212,840 $ 98,212,840 $ 60,871 $ 62 $ —SL Liquidity Series, LLC, Money Market Series . . . . . . . . 334,360,632 — (27,142,414)(c) 307,218,218 307,248,940 5,811,215(d) 25,928 338Bio City Development Co. BV . . . . . . . . . . . . . . . . . . . . . $140,850,000 — — $140,850,000 36,860,445 — — (13,577,940)Ei Towers SpA . . . . . . . . . . . . . . . . . . . . . . . . . . . . . . . . 1,450,608 — (286,744) 1,163,864 68,057,465 6,951,105 (259,431) 15,552,096Invitae Corp. . . . . . . . . . . . . . . . . . . . . . . . . . . . . . . . . . . 1,735,647 — (1,735,647) — — — (4,018,085) 7,497,995Platinum Group Metals Ltd. . . . . . . . . . . . . . . . . . . . . . . . 8,067,432 2,291,919 (1,731,719) 8,627,632 3,486,252 — (9,490,708) (3,099,848)St. Joe Co. . . . . . . . . . . . . . . . . . . . . . . . . . . . . . . . . . . . 6,735,420 — (1,834,699) 4,900,721 87,232,834 — (7,014,082) 8,740,937iShares Gold Trust . . . . . . . . . . . . . . . . . . . . . . . . . . . . . 11,663,809 12,133,104 (3,540,058) 20,256,855 247,336,200 — (5,807,300) 4,938,614iShares iBoxx USD High Yield Corporate Bond ETF . . . . 493,494 — (493,494) — — 897,275 1,481,866 (1,161,978)
$848,434,976 $13,720,466 $(25,081,750) $ 18,890,214
(a) Includes net capital gain distributions, if applicable.(b) Represents net shares purchased.(c) Represents net shares sold.(d) Represents securities lending income earned from the reinvestment of cash collateral from loaned securities, net of fees and collateral investment expenses, and other payments to
and from borrowers of securities.
Derivative Financial Instruments Outstanding as of Period End
Futures Contracts
DescriptionNumber ofContracts
ExpirationDate
NotionalAmount (000)
Value/Unrealized
Appreciation(Depreciation)
Short ContractsEuro Stoxx 50 Index . . . . . . . . . . . . . . . . . . . . . . . . . . . . . . . . . . . . . . . . . . . . . . . . . . . . . . . . . . . . . (884) 12/15/17 $ 37,873 $ (1,746,868)FTSE 100 Index . . . . . . . . . . . . . . . . . . . . . . . . . . . . . . . . . . . . . . . . . . . . . . . . . . . . . . . . . . . . . . . . (122) 12/15/17 12,100 (185,509)NASDAQ 100 E-Mini Index . . . . . . . . . . . . . . . . . . . . . . . . . . . . . . . . . . . . . . . . . . . . . . . . . . . . . . . . (1,812) 12/15/17 226,491 (8,832,511)S&P 500 E-Mini Index . . . . . . . . . . . . . . . . . . . . . . . . . . . . . . . . . . . . . . . . . . . . . . . . . . . . . . . . . . . . (1,065) 12/15/17 136,996 (2,538,634)Yen Denominated Nikkei 225 Index . . . . . . . . . . . . . . . . . . . . . . . . . . . . . . . . . . . . . . . . . . . . . . . . . . (508) 12/15/17 49,614 (4,228,277)
Total . . . . . . . . . . . . . . . . . . . . . . . . . . . . . . . . . . . . . . . . . . . . . . . . . . . . . . . . . . . . . . . . . . . . . . . . . . . . . . . . . . . . . . . . . . . . . . . . . . . . . . . . . . . . . . . . . . . . . $ (17,531,799)
C O N S O L I D A T E D S C H E D U L E O F I N V E S T M E N T S 17

Consolidated Schedule of Investments (continued)
October 31, 2017
BlackRock Global Allocation Fund, Inc.(Percentages shown are based on Net Assets)
Forward Foreign Currency Exchange Contracts
Currency Purchased Currency Sold Counterparty Settlement Date
UnrealizedAppreciation
(Depreciation)
USD 25,694 BRL 84,000 Brown Brothers Harriman & Co. 11/03/17 $ 17GBP 231,549,000 USD 299,750,600 JPMorgan Chase Bank N.A. 11/16/17 7,899,730USD 137,172,042 EUR 115,675,000 Deutsche Bank AG 11/16/17 2,330,631USD 90,657,425 NZD 125,043,000 UBS AG 12/07/17 5,144,750USD 117,694,868 EUR 99,195,000 UBS AG 12/11/17 1,900,948USD 35,370,548 AUD 44,644,000 Deutsche Bank AG 12/15/17 1,216,648USD 142,937,799 EUR 120,317,000 BNP Paribas S.A. 12/15/17 2,449,097USD 96,294,000 MXN 1,789,498,808 UBS AG 01/11/18 4,052,982USD 77,098,000 MXN 1,472,109,212 Deutsche Bank AG 01/18/18 1,305,938USD 226,472,930 AUD 289,243,000 Goldman Sachs International 01/25/18 5,266,739USD 88,500,085 NZD 123,740,000 JPMorgan Chase Bank N.A. 02/22/18 3,976,820USD 38,881,000 AUD 50,000,000 Citibank N.A. 04/06/18 657,605
36,201,905
EUR 115,675,000 USD 139,556,682 Deutsche Bank AG 11/16/17 (4,715,271)JPY 11,045,869,894 USD 97,917,000 Barclays Bank PLC 12/07/17 (626,334)EUR 114,402,000 USD 137,230,919 UBS AG 12/14/17 (3,658,002)EUR 218,626,890 USD 258,128,396 UBS AG 12/14/17 (2,865,101)JPY 13,291,739,580 USD 118,545,000 Goldman Sachs International 12/14/17 (1,421,078)EUR 81,419,000 PLN 348,872,273 Deutsche Bank AG 12/15/17 (788,839)EUR 120,317,000 USD 143,728,883 BNP Paribas S.A. 12/15/17 (3,240,181)EUR 120,357,000 USD 143,644,876 UBS AG 12/15/17 (3,109,467)NOK 623,181,000 USD 78,088,943 Morgan Stanley International PLC 01/26/18 (1,622,837)
(22,047,110)
Net Unrealized Appreciation . . . . . . . . . . . . . . . . . . . . . . . . . . . . . . . . . . . . . . . . . . . . . . . . . . . . . . . . . . . . . . . . . . . . . . . . . . . . . . . . . . . . . . . . . . . . . . . . $ 14,154,795
OTC Interest Rate Swaptions Purchased
Description CounterpartyExpiration
DateExercise
Rate
Received by the Fund Paid by the Fund NotionalAmount (000) ValueRate Frequency Rate Frequency
Call10-Year Interest Rate
Swap, 12/09/27 . . . . . Bank of America N.A. 12/07/17 2.00% 2.00% Semi-annual 3-Month LIBOR Quarterly USD 504,243 $ 157,0515-Year Interest Rate
Swap, 4/26/23 . . . . . Goldman Sachs International 04/24/18 2.15 2.15 Semi-annual 3-Month LIBOR Quarterly USD 2,512,116 19,041,134
19,198,185
Put5-Year Interest Rate
Swap, 4/06/23 . . . . . Deutsche Bank AG 04/04/18 1.07 6-Month LIBOR Semi-annual 1.07% Semi-annual JPY 12,739,074 1,74930-Year Interest Rate
Swap, 5/04/48 . . . . . Goldman Sachs International 05/02/18 2.75 3-Month LIBOR Quarterly 2.75 Semi-annual USD 120,387 3,057,166
3,058,915
$22,257,100
OTC Options Purchased
Description CounterpartyNumber ofContracts
ExpirationDate
ExercisePrice
NotionalAmount (000) Value
CallEuro STOXX 50 Index . . . . . . . . . . . . . . Citibank N.A. 32,074 12/15/17 EUR 3,650.00 EUR 117,838 $ 2,693,756EUR Currency . . . . . . . . . . . . . . . . . . . . UBS AG — 12/20/17 USD 1.22 EUR 251,305 229,502Topix Index . . . . . . . . . . . . . . . . . . . . . . Morgan Stanley International PLC 14,863,314 01/12/18 JPY 1,785.00 JPY 26,248,018 3,826,650Aflac, Inc. . . . . . . . . . . . . . . . . . . . . . . . Goldman Sachs International 571,594 01/19/18 USD 85.00 USD 47,951 917,408Franklin Resources, Inc. . . . . . . . . . . . . . Goldman Sachs International 972,073 01/19/18 USD 45.00 USD 40,953 388,829MetLife, Inc. . . . . . . . . . . . . . . . . . . . . . . Goldman Sachs International 677,225 01/19/18 USD 52.50 USD 36,286 1,726,924S&P 500 Index . . . . . . . . . . . . . . . . . . . . BNP Paribas S.A. 74,319 01/19/18 USD 2,610.00 USD 191,391 1,649,882S&P 500 Index . . . . . . . . . . . . . . . . . . . . Deutsche Bank AG 74,368 01/19/18 USD 2,615.00 USD 191,517 1,488,408Synchrony Financial . . . . . . . . . . . . . . . . Goldman Sachs International 1,076,685 01/19/18 USD 35.00 USD 35,121 834,431
18 2 0 1 7 B L A C K R O C K A N N U A L R E P O R T T O S H A R E H O L D E R S

Consolidated Schedule of Investments (continued)
October 31, 2017
BlackRock Global Allocation Fund, Inc.(Percentages shown are based on Net Assets)
OTC Options Purchased (continued)
Description CounterpartyNumber ofContracts
ExpirationDate
ExercisePrice
NotionalAmount (000) Value
Travelers Cos., Inc. . . . . . . . . . . . . . . . . Goldman Sachs International 387,703 01/19/18 USD 135.00 USD 51,351 $ 920,795Wells Fargo & Co. . . . . . . . . . . . . . . . . . Goldman Sachs International 1,394,418 01/19/18 USD 55.00 USD 78,283 3,430,268Topix Index . . . . . . . . . . . . . . . . . . . . . . Citibank N.A. 8,926,626 02/09/18 JPY 1,785.00 JPY 15,764,064 3,016,925SPDR Gold Trust ETF(a) . . . . . . . . . . . . . Morgan Stanley International PLC 1,258,820 02/16/18 USD 130.00 USD 151,902 847,941Topix Index . . . . . . . . . . . . . . . . . . . . . . Morgan Stanley International PLC 9,908,876 03/09/18 JPY 1,800.00 JPY 17,498,679 3,377,415SPDR Gold Trust ETF(a) . . . . . . . . . . . . . Morgan Stanley International PLC 1,256,777 03/16/18 USD 127.00 USD 151,655 1,790,907EUR Currency . . . . . . . . . . . . . . . . . . . . UBS AG — 03/27/18 USD 1.20 EUR 1,023,320 11,051,158EUR Currency . . . . . . . . . . . . . . . . . . . . Barclays Bank PLC — 05/18/18 USD 1.19 EUR 507,587 9,917,843Euro STOXX 50 Index . . . . . . . . . . . . . . Deutsche Bank AG 15,600 09/21/18 EUR 3,426.55 EUR 57,314 5,391,529BP PLC . . . . . . . . . . . . . . . . . . . . . . . . . UBS AG 3,155,984 01/18/19 USD 40.00 USD 128,354 8,820,975Chevron Corp. . . . . . . . . . . . . . . . . . . . . UBS AG 1,000,733 01/18/19 USD 125.00 USD 115,975 4,353,189ConocoPhillips . . . . . . . . . . . . . . . . . . . . UBS AG 1,663,706 01/18/19 USD 52.50 USD 85,099 7,944,196Exxon Mobil Corp. . . . . . . . . . . . . . . . . . UBS AG 680,375 01/18/19 USD 95.00 USD 56,709 799,441Occidental Petroleum Corp. . . . . . . . . . . UBS AG 1,462,156 01/18/19 USD 75.00 USD 94,411 2,668,435Royal Dutch Shell PLC . . . . . . . . . . . . . . UBS AG 1,801,473 01/18/19 USD 60.00 USD 113,547 8,917,291Schlumberger Ltd. . . . . . . . . . . . . . . . . . UBS AG 984,842 01/18/19 USD 90.00 USD 63,030 433,330Suncor Energy, Inc. . . . . . . . . . . . . . . . . UBS AG 2,124,878 01/18/19 USD 35.00 USD 72,161 5,896,536TOTAL SA . . . . . . . . . . . . . . . . . . . . . . . UBS AG 2,170,035 01/18/19 USD 60.00 USD 120,914 3,526,307
96,860,271
PutUSD Currency . . . . . . . . . . . . . . . . . . . . BNP Paribas S.A. — 01/12/18 JPY 111.75 USD 498,424 4,613,908
$101,474,179
(a) All or a portion of the security is held by a wholly-owned subsidiary. See Note 1 of the Notes to Consolidated Financial Statements for details on the wholly-owned subsidiary.
OTC Barrier Options Written
Description Type of Option CounterpartyNumber ofContracts
ExpirationDate
ExercisePrice
BarrierPrice/Range
NotionalAmount (000) Value
PutEuro STOXX 50 Index Down-and-In Deutsche Bank AG 15,600 09/21/18 EUR 2,586.07 EUR 2,165.83 EUR 57,314 $(399,061)
OTC Interest Rate Swaptions Written
Description CounterpartyExpiration
DateExercise
Rate
Received by the Fund Paid by the Fund NotionalAmount (000) ValueRate Frequency Rate Frequency
Call5-Year Interest Rate
Swap, 4/26/23 . . . . . . Goldman Sachs International 04/24/18 1.90% 3-Month LIBOR Quarterly 1.90% Semi-annual USD 2,512,116 $ (8,391,522)Put
10-Year Interest RateSwap, 12/09/27 . . . . . Bank of America N.A. 12/07/17 2.40 2.40 Semi-annual 3-Month LIBOR Quarterly USD 504,243 (2,490,479)
MC 5Yx5Y Interest RateSwap, 3/27/28 . . . . . . Goldman Sachs International 03/22/18 2.81 2.81 Semi-annual 3-Month LIBOR Quarterly USD 654,234 (3,233,179)
5-Year Interest RateSwap, 4/26/23 . . . . . . Goldman Sachs International 04/24/18 2.40 2.40% Semi-annual 3-Month LIBOR Quarterly USD 2,512,116 (10,125,334)
5-Year Interest RateSwap, 5/04/23 . . . . . . Goldman Sachs International 05/02/18 2.50 2.50 Semi-annual 3-Month LIBOR Quarterly USD 550,706 (1,690,618)
$(17,539,610)
$(25,931,132)
C O N S O L I D A T E D S C H E D U L E O F I N V E S T M E N T S 19
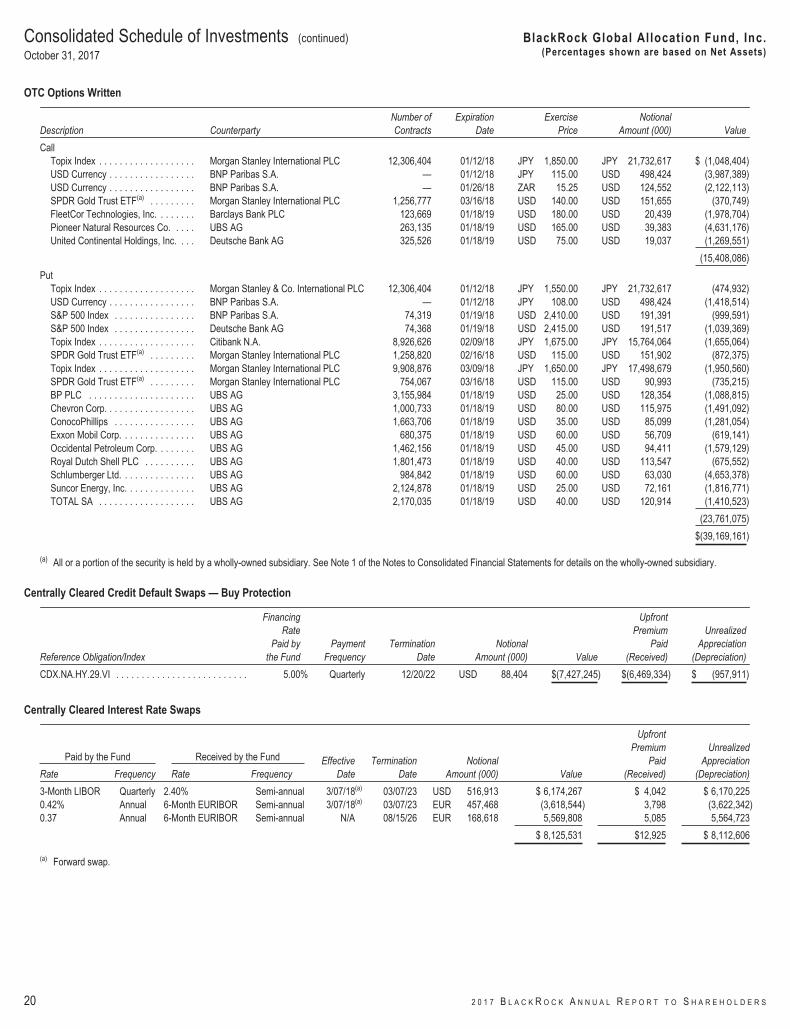
Consolidated Schedule of Investments (continued)
October 31, 2017
BlackRock Global Allocation Fund, Inc.(Percentages shown are based on Net Assets)
OTC Options Written
Description CounterpartyNumber ofContracts
ExpirationDate
ExercisePrice
NotionalAmount (000) Value
CallTopix Index . . . . . . . . . . . . . . . . . . . Morgan Stanley International PLC 12,306,404 01/12/18 JPY 1,850.00 JPY 21,732,617 $ (1,048,404)USD Currency . . . . . . . . . . . . . . . . . BNP Paribas S.A. — 01/12/18 JPY 115.00 USD 498,424 (3,987,389)USD Currency . . . . . . . . . . . . . . . . . BNP Paribas S.A. — 01/26/18 ZAR 15.25 USD 124,552 (2,122,113)SPDR Gold Trust ETF(a) . . . . . . . . . Morgan Stanley International PLC 1,256,777 03/16/18 USD 140.00 USD 151,655 (370,749)FleetCor Technologies, Inc. . . . . . . . Barclays Bank PLC 123,669 01/18/19 USD 180.00 USD 20,439 (1,978,704)Pioneer Natural Resources Co. . . . . UBS AG 263,135 01/18/19 USD 165.00 USD 39,383 (4,631,176)United Continental Holdings, Inc. . . . Deutsche Bank AG 325,526 01/18/19 USD 75.00 USD 19,037 (1,269,551)
(15,408,086)
PutTopix Index . . . . . . . . . . . . . . . . . . . Morgan Stanley & Co. International PLC 12,306,404 01/12/18 JPY 1,550.00 JPY 21,732,617 (474,932)USD Currency . . . . . . . . . . . . . . . . . BNP Paribas S.A. — 01/12/18 JPY 108.00 USD 498,424 (1,418,514)S&P 500 Index . . . . . . . . . . . . . . . . BNP Paribas S.A. 74,319 01/19/18 USD 2,410.00 USD 191,391 (999,591)S&P 500 Index . . . . . . . . . . . . . . . . Deutsche Bank AG 74,368 01/19/18 USD 2,415.00 USD 191,517 (1,039,369)Topix Index . . . . . . . . . . . . . . . . . . . Citibank N.A. 8,926,626 02/09/18 JPY 1,675.00 JPY 15,764,064 (1,655,064)SPDR Gold Trust ETF(a) . . . . . . . . . Morgan Stanley International PLC 1,258,820 02/16/18 USD 115.00 USD 151,902 (872,375)Topix Index . . . . . . . . . . . . . . . . . . . Morgan Stanley International PLC 9,908,876 03/09/18 JPY 1,650.00 JPY 17,498,679 (1,950,560)SPDR Gold Trust ETF(a) . . . . . . . . . Morgan Stanley International PLC 754,067 03/16/18 USD 115.00 USD 90,993 (735,215)BP PLC . . . . . . . . . . . . . . . . . . . . . UBS AG 3,155,984 01/18/19 USD 25.00 USD 128,354 (1,088,815)Chevron Corp. . . . . . . . . . . . . . . . . . UBS AG 1,000,733 01/18/19 USD 80.00 USD 115,975 (1,491,092)ConocoPhillips . . . . . . . . . . . . . . . . UBS AG 1,663,706 01/18/19 USD 35.00 USD 85,099 (1,281,054)Exxon Mobil Corp. . . . . . . . . . . . . . . UBS AG 680,375 01/18/19 USD 60.00 USD 56,709 (619,141)Occidental Petroleum Corp. . . . . . . . UBS AG 1,462,156 01/18/19 USD 45.00 USD 94,411 (1,579,129)Royal Dutch Shell PLC . . . . . . . . . . UBS AG 1,801,473 01/18/19 USD 40.00 USD 113,547 (675,552)Schlumberger Ltd. . . . . . . . . . . . . . . UBS AG 984,842 01/18/19 USD 60.00 USD 63,030 (4,653,378)Suncor Energy, Inc. . . . . . . . . . . . . . UBS AG 2,124,878 01/18/19 USD 25.00 USD 72,161 (1,816,771)TOTAL SA . . . . . . . . . . . . . . . . . . . UBS AG 2,170,035 01/18/19 USD 40.00 USD 120,914 (1,410,523)
(23,761,075)
$(39,169,161)
(a) All or a portion of the security is held by a wholly-owned subsidiary. See Note 1 of the Notes to Consolidated Financial Statements for details on the wholly-owned subsidiary.
Centrally Cleared Credit Default Swaps — Buy Protection
Reference Obligation/Index
FinancingRate
Paid bythe Fund
PaymentFrequency
TerminationDate
NotionalAmount (000) Value
UpfrontPremium
Paid(Received)
UnrealizedAppreciation
(Depreciation)
CDX.NA.HY.29.VI . . . . . . . . . . . . . . . . . . . . . . . . . . 5.00% Quarterly 12/20/22 USD 88,404 $(7,427,245) $(6,469,334) $ (957,911)
Centrally Cleared Interest Rate Swaps
Paid by the Fund Received by the Fund EffectiveDate
TerminationDate
NotionalAmount (000) Value
UpfrontPremium
Paid(Received)
UnrealizedAppreciation
(Depreciation)Rate Frequency Rate Frequency
3-Month LIBOR Quarterly 2.40% Semi-annual 3/07/18(a) 03/07/23 USD 516,913 $ 6,174,267 $ 4,042 $ 6,170,2250.42% Annual 6-Month EURIBOR Semi-annual 3/07/18(a) 03/07/23 EUR 457,468 (3,618,544) 3,798 (3,622,342)0.37 Annual 6-Month EURIBOR Semi-annual N/A 08/15/26 EUR 168,618 5,569,808 5,085 5,564,723
$ 8,125,531 $12,925 $ 8,112,606
(a) Forward swap.
20 2 0 1 7 B L A C K R O C K A N N U A L R E P O R T T O S H A R E H O L D E R S

Consolidated Schedule of Investments (continued)
October 31, 2017
BlackRock Global Allocation Fund, Inc.(Percentages shown are based on Net Assets)
OTC Credit Default Swaps — Buy Protection
Reference Obligation/Index
FinancingRate
Paid bythe Fund
PaymentFrequency Counterparty
TerminationDate
NotionalAmount (000) Value
UpfrontPremium
Paid(Received)
UnrealizedAppreciation
(Depreciation)
Airbus SE . . . . . . . . . . . . . . 1.00% Quarterly Barclays Bank PLC 06/20/22 EUR 25,423 $ (1,023,764) $ (879,204) $ (144,560)Airbus SE . . . . . . . . . . . . . . 1.00 Quarterly Barclays Bank PLC 06/20/22 EUR 12,668 (501,943) (467,432) (34,511)Akzo Nobel NV . . . . . . . . . . 1.00 Quarterly Barclays Bank PLC 06/20/22 EUR 25,423 (744,625) (599,498) (145,127)BASF Schweiz AG . . . . . . . . 1.00 Quarterly Barclays Bank PLC 06/20/22 EUR 25,423 (1,090,189) (949,847) (140,342)BP Capital Markets PLC . . . . 1.00 Quarterly Barclays Bank PLC 06/20/22 EUR 25,423 (851,801) (600,151) (251,650)Barrick Gold Corp. . . . . . . . . 1.00 Quarterly Barclays Bank PLC 06/20/22 USD 25,429 (518,127) (311,809) (206,318)Bayer AG . . . . . . . . . . . . . . 1.00 Quarterly Barclays Bank PLC 06/20/22 EUR 25,423 (1,000,097) (851,027) (149,070)CSX Corp. . . . . . . . . . . . . . . 1.00 Quarterly Barclays Bank PLC 06/20/22 USD 25,423 (806,787) (821,879) 15,092Caterpillar, Inc. . . . . . . . . . . 1.00 Quarterly Barclays Bank PLC 06/20/22 USD 25,429 (907,251) (723,173) (184,078)Caterpillar, Inc. . . . . . . . . . . 1.00 Quarterly Barclays Bank PLC 06/20/22 USD 12,714 (453,625) (378,964) (74,661)Cie de Saint-Gobain . . . . . . . 1.00 Quarterly Barclays Bank PLC 06/20/22 EUR 25,423 (925,885) (739,585) (186,300)Deere & Co. . . . . . . . . . . . . 1.00 Quarterly Barclays Bank PLC 06/20/22 USD 25,429 (924,110) (851,265) (72,845)Dow Chemical Co. . . . . . . . . 1.00 Quarterly Barclays Bank PLC 06/20/22 USD 25,429 (734,987) (578,985) (156,002)General Electric Co. . . . . . . . 1.00 Quarterly Barclays Bank PLC 06/20/22 USD 25,429 (695,900) (723,173) 27,273International Paper Co. . . . . 1.00 Quarterly Barclays Bank PLC 06/20/22 USD 25,423 (724,928) (636,351) (88,577)Norfolk Southern Corp. . . . . 1.00 Quarterly Barclays Bank PLC 06/20/22 USD 25,429 (865,332) (862,966) (2,366)Shell International Finance
BV . . . . . . . . . . . . . . . . . 1.00 Quarterly Barclays Bank PLC 06/20/22 EUR 25,423 (1,011,718) (766,772) (244,946)Shell International Finance
BV . . . . . . . . . . . . . . . . . 1.00 Quarterly Barclays Bank PLC 06/20/22 EUR 12,668 (496,817) (417,398) (79,419)Sherwin-Williams Co. . . . . . . 1.00 Quarterly Barclays Bank PLC 06/20/22 USD 12,714 (279,207) (246,577) (32,630)Southwest Airlines Co. . . . . . 1.00 Quarterly Barclays Bank PLC 06/20/22 USD 25,429 (680,737) (723,173) 42,436Statoil ASA . . . . . . . . . . . . . 1.00 Quarterly Barclays Bank PLC 06/20/22 EUR 25,423 (1,194,035) (964,011) (230,024)Volkswagen International
Finance NV . . . . . . . . . . . 1.00 Quarterly Barclays Bank PLC 06/20/22 EUR 25,423 (635,556) (516,473) (119,083)
$(17,067,421) $(14,609,713) $ (2,457,708)
OTC Currency Swaps
Paid by the Fund Received by the Fund Notional Amount (000)
CounterpartyTermination
Date (a) Value
UpfrontPremium
Paid(Received)
UnrealizedAppreciation
(Depreciation)Rate Frequency Rate Frequency Delivered Received
0.10 JPY Semi-annual 1.84% Semi-annual JPY 10,596,100 USD 94,118 Bank of America N.A. 03/15/18 $ 1,072,400 $ — $ 1,072,4000.10 JPY Semi-annual 1.96 Semi-annual JPY 15,929,100 USD 140,468 Bank of America N.A. 03/15/18 676,222 — 676,2220.10 JPY Semi-annual 2.01 Semi-annual JPY 24,956,150 USD 241,239 Bank of America N.A. 10/15/18 21,588,383 — 21,588,383
$23,337,005 $ — $ 23,337,005
(a) At termination date, the notional amount delivered will be exchanged for the notional amount received.
OTC Total Return Swaps
Reference Entity
Fixed Amount Paid(Received) by theFund (a) Counterparty
TerminationDate
NotionalAmount (000) Value
UpfrontPremium
Paid(Received)
UnrealizedAppreciation
(Depreciation)
SGX Nikkei Stock Average Dividend Point Index FutureApril 2017 . . . . . . . . . . . . . . . . . . . . . . . . . . . . . . . . . . JPY 2,587,893,300 BNP Paribas S.A. 04/02/18 JPY 2,587,893 $2,802,011 $ — $ 2,802,011
SGX Nikkei Stock Average Dividend Point Index FutureApril 2017 . . . . . . . . . . . . . . . . . . . . . . . . . . . . . . . . . . JPY 1,548,600,000 BNP Paribas S.A. 04/02/18 JPY 1,548,600 1,528,235 — 1,528,235
Euro Stoxx 50 Index Dividend Future December 2018 . . . EUR 14,399,978 BNP Paribas S.A. 12/21/18 EUR 14,400 1,718,401 — 1,718,401S&P 500 Index Annual Dividend Future December
2018 . . . . . . . . . . . . . . . . . . . . . . . . . . . . . . . . . . . . . . USD 30,632,937 BNP Paribas S.A. 12/21/18 USD 30,633 3,964,262 — 3,964,262SGX Nikkei Stock Average Dividend Point Index Future
April 2018 . . . . . . . . . . . . . . . . . . . . . . . . . . . . . . . . . . JPY 1,350,937,500 BNP Paribas S.A. 04/01/19 JPY 1,350,938 2,566,312 — 2,566,312SGX Nikkei Stock Average Dividend Point Index Future
April 2018 . . . . . . . . . . . . . . . . . . . . . . . . . . . . . . . . . . JPY 2,680,496,000 BNP Paribas S.A. 04/01/19 JPY 2,680,496 5,247,122 — 5,247,122Euro Stoxx 50 Index Dividend Future December 2019 . . . EUR 7,065,150 BNP Paribas S.A. 12/20/19 EUR 7,065 2,129,112 — 2,129,112Euro Stoxx 50 Index Dividend Future December 2019 . . . EUR 9,746,040 BNP Paribas S.A. 12/20/19 EUR 9,746 2,852,204 — 2,852,204
C O N S O L I D A T E D S C H E D U L E O F I N V E S T M E N T S 21

Consolidated Schedule of Investments (continued)
October 31, 2017
BlackRock Global Allocation Fund, Inc.(Percentages shown are based on Net Assets)
OTC Total Return Swaps (continued)
Reference Entity
Fixed Amount Paid(Received) by theFund (a) Counterparty
TerminationDate
NotionalAmount (000) Value
UpfrontPremium
Paid(Received)
UnrealizedAppreciation
(Depreciation)
Euro Stoxx 50 Index Dividend Future December 2019 . . EUR 13,729,500 BNP Paribas S.A. 12/20/19 EUR 13,730 $ 3,899,916 $ — $ 3,899,916Euro Stoxx 50 Index Dividend Future December 2019 . . EUR 10,557,560 BNP Paribas S.A. 12/20/19 EUR 10,558 2,849,967 — 2,849,967SGX Nikkei Stock Average Dividend Point Index Future
April 2019 . . . . . . . . . . . . . . . . . . . . . . . . . . . . . . . . . JPY 1,825,270,000 BNP Paribas S.A. 04/01/20 JPY 1,825,270 5,004,389 — 5,004,389SGX Nikkei Stock Average Dividend Point Index Future
April 2019 . . . . . . . . . . . . . . . . . . . . . . . . . . . . . . . . . JPY 2,223,600,000 BNP Paribas S.A. 04/01/20 JPY 2,223,600 6,775,533 — 6,775,533Euro Stoxx 50 Index Dividend Future December 2020 . . EUR 3,283,830 BNP Paribas S.A. 12/18/20 EUR 3,284 1,132,059 — 1,132,059Euro Stoxx 50 Index Dividend Future December 2020 . . EUR 4,010,240 BNP Paribas S.A. 12/18/20 EUR 4,010 1,376,200 — 1,376,200Euro Stoxx 50 Index Dividend Future December 2020 . . EUR 3,492,060 BNP Paribas S.A. 12/18/20 EUR 3,492 1,209,323 — 1,209,323Euro Stoxx 50 Index Dividend Future December 2020 . . EUR 2,995,000 BNP Paribas S.A. 12/18/20 EUR 2,995 1,046,687 — 1,046,687Euro Stoxx 50 Index Dividend Future December 2020 . . EUR 4,025,500 BNP Paribas S.A. 12/18/20 EUR 4,026 1,343,887 — 1,343,887Euro Stoxx 50 Index Dividend Future December 2020 . . EUR 12,076,500 BNP Paribas S.A. 12/18/20 EUR 12,077 4,031,661 — 4,031,661Euro Stoxx 50 Index Dividend Future December 2020 . . EUR 11,021,390 BNP Paribas S.A. 12/18/20 EUR 11,021 2,149,718 — 2,149,718S&P 500 Index Annual Dividend Future December
2020 . . . . . . . . . . . . . . . . . . . . . . . . . . . . . . . . . . . . . USD 12,569,450Goldman SachsInternational 12/18/20 USD 12,569 2,246,650 — 2,246,650
SGX Nikkei Stock Average Dividend Point Index FutureApril 2020 . . . . . . . . . . . . . . . . . . . . . . . . . . . . . . . . . JPY 526,875,000 BNP Paribas S.A. 04/01/21 JPY 526,875 579,350 — 579,350
SGX Nikkei Stock Average Dividend Point Index FutureApril 2020 . . . . . . . . . . . . . . . . . . . . . . . . . . . . . . . . . JPY 1,489,920,000 BNP Paribas S.A. 04/01/21 JPY 1,489,920 2,911,112 — 2,911,112
SGX Nikkei Stock Average Dividend Point Index FutureApril 2020 . . . . . . . . . . . . . . . . . . . . . . . . . . . . . . . . . JPY 738,707,500 BNP Paribas S.A. 04/01/21 JPY 738,708 1,552,249 — 1,552,249
SGX Nikkei Stock Average Dividend Point Index FutureApril 2020 . . . . . . . . . . . . . . . . . . . . . . . . . . . . . . . . . JPY 353,080,000 BNP Paribas S.A. 04/01/21 JPY 353,080 689,873 — 689,873
SGX Nikkei Stock Average Dividend Point Index FutureApril 2020 . . . . . . . . . . . . . . . . . . . . . . . . . . . . . . . . . JPY 393,210,000 BNP Paribas S.A. 04/01/21 JPY 393,210 795,691 — 795,691
Euro Stoxx 50 Index Dividend Future December 2021 . . EUR 5,319,950 BNP Paribas S.A. 12/17/21 EUR 5,320 1,085,814 — 1,085,814Euro Stoxx 50 Index Dividend Future December 2021 . . EUR 5,510,880 BNP Paribas S.A. 12/17/21 EUR 5,511 877,551 — 877,551Euro Stoxx 50 Index Dividend Future December 2021 . . EUR 5,690,160 BNP Paribas S.A. 12/17/21 EUR 5,690 499,022 — 499,022S&P 500 Index Annual Dividend Future December
2021 . . . . . . . . . . . . . . . . . . . . . . . . . . . . . . . . . . . . . USD 15,887,988 BNP Paribas S.A. 12/17/21 USD 15,888 3,190,688 — 3,190,688SGX Nikkei Stock Average Dividend Point Index Future
April 2021 . . . . . . . . . . . . . . . . . . . . . . . . . . . . . . . . . JPY 755,250,000 BNP Paribas S.A. 04/01/22 JPY 755,250 1,338,464 — 1,338,464SGX Nikkei Stock Average Dividend Point Index Future
April 2021 . . . . . . . . . . . . . . . . . . . . . . . . . . . . . . . . . JPY 765,120,000 BNP Paribas S.A. 04/01/22 JPY 765,120 1,335,667 — 1,335,667SGX Nikkei Stock Average Dividend Point Index Future
April 2021 . . . . . . . . . . . . . . . . . . . . . . . . . . . . . . . . . JPY 532,500,000 BNP Paribas S.A. 04/01/22 JPY 532,500 567,257 — 567,257SGX Nikkei Stock Average Dividend Point Index Future
April 2021 . . . . . . . . . . . . . . . . . . . . . . . . . . . . . . . . . JPY 1,509,120,000 BNP Paribas S.A. 04/01/22 JPY 1,509,120 2,857,078 — 2,857,078Euro Stoxx 50 Index Dividend Future December 2022 . . EUR 5,584,320 BNP Paribas S.A. 12/16/22 EUR 5,584 440,313 — 440,313Euro Stoxx 50 Index Dividend Future December 2022 . . EUR 2,737,500 BNP Paribas S.A. 12/16/22 EUR 2,738 256,267 — 256,267Euro Stoxx 50 Index Dividend Future December 2022 . . EUR 11,348,860 BNP Paribas S.A. 12/16/22 EUR 11,349 367,533 — 367,533Euro Stoxx 50 Index Dividend Future December 2022 . . EUR 5,466,780 BNP Paribas S.A. 12/16/22 EUR 5,467 549,669 — 549,669SGX Nikkei Stock Average Dividend Point Index Future
April 2022 . . . . . . . . . . . . . . . . . . . . . . . . . . . . . . . . . JPY 528,750,000 BNP Paribas S.A. 04/03/23 JPY 528,750 688,184 — 688,184SGX Nikkei Stock Average Dividend Point Index Future
April 2022 . . . . . . . . . . . . . . . . . . . . . . . . . . . . . . . . . JPY 535,000,000JPMorgan ChaseBank N.A. 04/03/23 JPY 535,000 633,218 — 633,218
$77,088,649 $ — $ 77,088,649
(a) At termination, the fixed amount paid (received) will be exchanged for the total return of the reference entity.
Balances Reported in the Consolidated Statement of Assets and Liabilities for Centrally Cleared Swaps and OTC Derivatives
SwapPremiums
Paid
SwapPremiumsReceived
UnrealizedAppreciation
UnrealizedDepreciation
Centrally Cleared Swaps(a) . . . . . . . . . . . . . . . . . . . . . . . . . . . . . . . . . . . . . . . . . . . . . . . . . . . . . . . . . . $ 12,925 $ (6,469,334) $ 11,734,948 $ (4,580,253)OTC Derivatives . . . . . . . . . . . . . . . . . . . . . . . . . . . . . . . . . . . . . . . . . . . . . . . . . . . . . . . . . . . . . . . . . . $ — $(14,609,713) $100,510,455 $ (2,542,509)
(a) Includes cumulative appreciation (depreciation) on centrally cleared swaps, as reported in the Consolidated Schedule of Investments. Only current day’s variation margin is reportedwithin the Consolidated Statement of Assets and Liabilities and is net of any previously paid (received) swap premium amounts.
22 2 0 1 7 B L A C K R O C K A N N U A L R E P O R T T O S H A R E H O L D E R S

Consolidated Schedule of Investments (continued)
October 31, 2017
BlackRock Global Allocation Fund, Inc.(Percentages shown are based on Net Assets)
Derivative Financial Instruments Categorized by Risk Exposure
As of period end, the fair values of derivative financial instruments located in the Consolidated Statement of Assets and Liabilities were as follows:
CommodityContracts
CreditContracts
EquityContracts
ForeignCurrency
ExchangeContracts
InterestRate
ContractsOther
Contracts Total
Assets — Derivative Financial Instruments
Forward foreign currency exchange contractsUnrealized appreciation on forward foreign currency
exchange contracts . . . . . . . . . . . . . . . . . . . . . . . $ — $ — $ — $36,201,905 $ — $ — $ 36,201,905Options purchased
Investments at value — unaffiliated(a) . . . . . . . . . . . . — — 75,661,768 25,812,411 22,257,100 — 123,731,279Swaps — centrally cleared
Net unrealized appreciation(b) . . . . . . . . . . . . . . . . . . — — — — 11,734,948 — 11,734,948Swaps — OTC
Unrealized appreciation on OTC swaps; Swappremiums paid . . . . . . . . . . . . . . . . . . . . . . . . . . — 84,801 77,088,649 — 23,337,005 — 100,510,455
$ — $ 84,801 $152,750,417 $62,014,316 $57,329,053 $ — $272,178,587
Liabilities — Derivative Financial Instruments
Futures contractsNet unrealized depreciation(b) . . . . . . . . . . . . . . . . . . $ — $ — $ 17,531,799 $ — $ — $ — $ 17,531,799
Forward foreign currency exchange contractsUnrealized depreciation on forward foreign currency
exchange contracts . . . . . . . . . . . . . . . . . . . . . . . — — — 22,047,110 — — 22,047,110Options written
Options written at value . . . . . . . . . . . . . . . . . . . . . . — — 32,040,206 7,528,016 25,931,132 — 65,499,354Swaps — centrally cleared
Net unrealized depreciation(b) . . . . . . . . . . . . . . . . . . — 957,911 — — 3,622,342 — 4,580,253Swaps — OTC
Unrealized depreciation on OTC swaps; Swappremiums received . . . . . . . . . . . . . . . . . . . . . . . — 17,152,222 — — — — 17,152,222
$ — $18,110,133 $ 49,572,005 $29,575,126 $29,553,474 $ — $126,810,738
(a) Includes options purchased at value as reported in the Consolidated Schedule of Investments.(b) Includes cumulative appreciation (depreciation) on futures contracts and centrally cleared swaps, if any, as reported in the Consolidated Schedule of Investments. Only current day’s
variation margin is reported within the Consolidated Statement of Assets and Liabilities.
For the year ended October 31, 2017, the effect of derivative financial instruments in the Consolidated Statement of Operations was as follows:
CommodityContracts
CreditContracts
EquityContracts
ForeignCurrency
ExchangeContracts
InterestRate
ContractsOther
Contracts Total
Net Realized Gain (Loss) from:
Futures contracts . . . . . . . . . . . . . . . . . . . . . . . . . . $ — $ — $(278,871,353) $ — $ — $ — $(278,871,353)Forward foreign currency exchange contracts . . . . . — — — 177,206,336 — — 177,206,336Options purchased(a) . . . . . . . . . . . . . . . . . . . . . . . . — — 117,878,370 14,014,310 (9,349,105) — 122,543,575Options written . . . . . . . . . . . . . . . . . . . . . . . . . . . . — — 48,077,714 73,039,131 (16,388,975) — 104,727,870Swaps . . . . . . . . . . . . . . . . . . . . . . . . . . . . . . . . . . — 8,832,033 15,434,957 — (27,433,265) — (3,166,275)
$ — $ 8,832,033 $ (97,480,312) $264,259,777 $(53,171,345) $ — $ 122,440,153
Net Change in Unrealized Appreciation (Depreciation) on:
Futures contracts . . . . . . . . . . . . . . . . . . . . . . . . . . $ — $ — $ (43,250,257) $ — $ — $ — $ (43,250,257)Forward foreign currency exchange contracts . . . . . — — — 8,991,790 — — 8,991,790Options purchased(b) . . . . . . . . . . . . . . . . . . . . . . . . — — (21,660,252) (5,198,893) (615,402) — (27,474,547)Options written . . . . . . . . . . . . . . . . . . . . . . . . . . . . — — 6,631,170 (14,198,875) 1,744,940 — (5,822,765)Swaps . . . . . . . . . . . . . . . . . . . . . . . . . . . . . . . . . . — (1,508,083) 66,317,309 — 59,683,256 — 124,492,482
$ — $(1,508,083) $ 8,037,970 $ (10,405,978) $ 60,812,794 $ — $ 56,936,703
(a) Options purchased are included in net realized gain (loss) from investments.(b) Options purchased are included in net change in unrealized appreciation (depreciation) on investments.
C O N S O L I D A T E D S C H E D U L E O F I N V E S T M E N T S 23

Consolidated Schedule of Investments (continued)
October 31, 2017
BlackRock Global Allocation Fund, Inc.(Percentages shown are based on Net Assets)
Average Quarterly Balances of Outstanding Derivative Financial Instruments
Futures contracts:Average notional value of contracts — long . . . . . . . . . . . . . . . . . . . . . . . . . . . . . . . . . . . . . . . . . . . . . . . . . . . . . . . . . . . . . . . . . . . . . . . . . . . . . . . . . . . . . . . . $ 50,837,209Average notional value of contracts — short . . . . . . . . . . . . . . . . . . . . . . . . . . . . . . . . . . . . . . . . . . . . . . . . . . . . . . . . . . . . . . . . . . . . . . . . . . . . . . . . . . . . . . . . $ 994,384,172
Forward foreign currency exchange contracts:Average amounts purchased — in USD . . . . . . . . . . . . . . . . . . . . . . . . . . . . . . . . . . . . . . . . . . . . . . . . . . . . . . . . . . . . . . . . . . . . . . . . . . . . . . . . . . . . . . . . . . . $2,066,484,841Average amounts sold — in USD . . . . . . . . . . . . . . . . . . . . . . . . . . . . . . . . . . . . . . . . . . . . . . . . . . . . . . . . . . . . . . . . . . . . . . . . . . . . . . . . . . . . . . . . . . . . . . . . $ 808,252,869
Options:Average value of option contracts purchased . . . . . . . . . . . . . . . . . . . . . . . . . . . . . . . . . . . . . . . . . . . . . . . . . . . . . . . . . . . . . . . . . . . . . . . . . . . . . . . . . . . . . . . $ 249,424,815Average value of option contracts written . . . . . . . . . . . . . . . . . . . . . . . . . . . . . . . . . . . . . . . . . . . . . . . . . . . . . . . . . . . . . . . . . . . . . . . . . . . . . . . . . . . . . . . . . . $ 53,112,257Average notional value of swaption contracts purchased . . . . . . . . . . . . . . . . . . . . . . . . . . . . . . . . . . . . . . . . . . . . . . . . . . . . . . . . . . . . . . . . . . . . . . . . . . . . . . . $4,244,530,460Average notional value of swaption contracts written . . . . . . . . . . . . . . . . . . . . . . . . . . . . . . . . . . . . . . . . . . . . . . . . . . . . . . . . . . . . . . . . . . . . . . . . . . . . . . . . . $6,057,647,339
Credit default swaps:Average notional value — buy protection . . . . . . . . . . . . . . . . . . . . . . . . . . . . . . . . . . . . . . . . . . . . . . . . . . . . . . . . . . . . . . . . . . . . . . . . . . . . . . . . . . . . . . . . . . $ 338,928,358Average notional value — sell protection . . . . . . . . . . . . . . . . . . . . . . . . . . . . . . . . . . . . . . . . . . . . . . . . . . . . . . . . . . . . . . . . . . . . . . . . . . . . . . . . . . . . . . . . . . $ 38,513,835
Interest rate swaps:Average notional value — pays fixed rate . . . . . . . . . . . . . . . . . . . . . . . . . . . . . . . . . . . . . . . . . . . . . . . . . . . . . . . . . . . . . . . . . . . . . . . . . . . . . . . . . . . . . . . . . . $1,265,061,858Average notional amount — receives fixed rate . . . . . . . . . . . . . . . . . . . . . . . . . . . . . . . . . . . . . . . . . . . . . . . . . . . . . . . . . . . . . . . . . . . . . . . . . . . . . . . . . . . . . $1,557,726,753
Currency swaps:Average notional value — pays . . . . . . . . . . . . . . . . . . . . . . . . . . . . . . . . . . . . . . . . . . . . . . . . . . . . . . . . . . . . . . . . . . . . . . . . . . . . . . . . . . . . . . . . . . . . . . . . . $ 483,906,421
Total return swaps:Average notional amounts . . . . . . . . . . . . . . . . . . . . . . . . . . . . . . . . . . . . . . . . . . . . . . . . . . . . . . . . . . . . . . . . . . . . . . . . . . . . . . . . . . . . . . . . . . . . . . . . . . . . . $ 392,769,385
For more information about the Fund’s investment risks regarding derivative financial instruments, refer to the Notes to Consolidated Financial Statements.
Derivative Financial Instruments — Offsetting as of Period End
The Fund’s derivative assets and liabilities (by type) were as follows:
Assets Liabilities
Derivative Financial Instruments:
Futures contracts . . . . . . . . . . . . . . . . . . . . . . . . . . . . . . . . . . . . . . . . . . . . . . . . . . . . . . . . . . . . . . . . . . . . . . . . . . . . . . . . . . . . . . . . . . . . $ — $ 1,839,967Swaps — Centrally cleared . . . . . . . . . . . . . . . . . . . . . . . . . . . . . . . . . . . . . . . . . . . . . . . . . . . . . . . . . . . . . . . . . . . . . . . . . . . . . . . . . . . . . — 512,033Forward foreign currency exchange contracts . . . . . . . . . . . . . . . . . . . . . . . . . . . . . . . . . . . . . . . . . . . . . . . . . . . . . . . . . . . . . . . . . . . . . . . 36,201,905 22,047,110Options . . . . . . . . . . . . . . . . . . . . . . . . . . . . . . . . . . . . . . . . . . . . . . . . . . . . . . . . . . . . . . . . . . . . . . . . . . . . . . . . . . . . . . . . . . . . . . . . . . . . 123,731,279(a) 65,499,354Swaps — OTC(b) . . . . . . . . . . . . . . . . . . . . . . . . . . . . . . . . . . . . . . . . . . . . . . . . . . . . . . . . . . . . . . . . . . . . . . . . . . . . . . . . . . . . . . . . . . . . . 100,510,455 17,152,222
Total derivative assets and liabilities in the Consolidated Statement of Assets and Liabilities . . . . . . . . . . . . . . . . . . . . . . . . . . . . . . . . . . . . . . . $260,443,639 $107,050,686Derivatives not subject to a Master Netting Agreement or similar agreement (“MNA”) . . . . . . . . . . . . . . . . . . . . . . . . . . . . . . . . . . . . . . . . . . . . — (2,352,000)
Total derivative assets and liabilities subject to an MNA . . . . . . . . . . . . . . . . . . . . . . . . . . . . . . . . . . . . . . . . . . . . . . . . . . . . . . . . . . . . . . . . . . $260,443,639 $104,698,686
(a) Includes options purchased at value which is included in Investments at value — unaffiliated in the Consolidated Statement of Assets and Liabilities and reported in the ConsolidatedSchedule of Investments.
(b) Includes unrealized appreciation (depreciation) on OTC swaps and swap premiums (paid/received) in the Consolidated Statement of Assets and Liabilities.
The following table presents the Fund’s derivative assets (and liabilities) by counterparty net of amounts available for offset under a Master Netting Agreement (“MNA”)and net of the related collateral received (and pledged) by the Fund:
Counterparty
DerivativeAssets
Subject toan MNA by
Counterparty
DerivativesAvailablefor Offset (a)
Non-cashCollateralReceived
CashCollateralReceived (b)
Net Amountof Derivative
Assets (c),(d)
Bank of America N.A. . . . . . . . . . . . . . . . . . . . . . . . . . . . . . . . . . . . . . . . . $ 23,494,056 $ (2,490,479) $ — $ (19,905,000) $ 1,098,577Barclays Bank PLC . . . . . . . . . . . . . . . . . . . . . . . . . . . . . . . . . . . . . . . . . 10,002,644 (10,002,644) — — —BNP Paribas S.A. . . . . . . . . . . . . . . . . . . . . . . . . . . . . . . . . . . . . . . . . . . 82,921,668 (11,767,788) — (71,153,880) —Brown Brothers Harriman & Co. . . . . . . . . . . . . . . . . . . . . . . . . . . . . . . . . 17 — — — 17Citibank N.A. . . . . . . . . . . . . . . . . . . . . . . . . . . . . . . . . . . . . . . . . . . . . . . 6,368,286 (1,655,064) — (2,240,771) 2,472,451Deutsche Bank AG . . . . . . . . . . . . . . . . . . . . . . . . . . . . . . . . . . . . . . . . . 11,734,903 (8,212,091) — (2,837,000) 685,812Goldman Sachs International . . . . . . . . . . . . . . . . . . . . . . . . . . . . . . . . . . 37,830,344 (24,861,731) — (9,350,000) 3,618,613JPMorgan Chase Bank N.A. . . . . . . . . . . . . . . . . . . . . . . . . . . . . . . . . . . . 12,509,768 — — (580,000) 11,929,768Morgan Stanley International PLC(f) . . . . . . . . . . . . . . . . . . . . . . . . . . . . . 9,842,913 (7,075,072) — (2,767,841) —UBS AG . . . . . . . . . . . . . . . . . . . . . . . . . . . . . . . . . . . . . . . . . . . . . . . . . 65,739,040 (28,879,201) (10,327,444) (21,775,000) 4,757,395
$260,443,639 $(94,944,070) $(10,327,444) $(130,609,492) $ 24,562,633
24 2 0 1 7 B L A C K R O C K A N N U A L R E P O R T T O S H A R E H O L D E R S

Consolidated Schedule of Investments (continued)
October 31, 2017
BlackRock Global Allocation Fund, Inc.(Percentages shown are based on Net Assets)
Counterparty
DerivativeLiabilities
Subject toan MNA by
Counterparty
DerivativesAvailable for
Offset (a)
Non-cashCollateral
Pledged
CashCollateral
Pledged
Net Amountof Derivative
Liabilities (d),(e)
Bank of America N.A. . . . . . . . . . . . . . . . . . . . . . . . . . . . . . . . . . . . . . . . . . . . . . $ 2,490,479 $ (2,490,479) $ — $ — $ —Barclays Bank PLC . . . . . . . . . . . . . . . . . . . . . . . . . . . . . . . . . . . . . . . . . . . . . . 19,757,260 (10,002,644) (9,754,616) — —BNP Paribas S.A. . . . . . . . . . . . . . . . . . . . . . . . . . . . . . . . . . . . . . . . . . . . . . . . 11,767,788 (11,767,788) — — —Citibank N.A. . . . . . . . . . . . . . . . . . . . . . . . . . . . . . . . . . . . . . . . . . . . . . . . . . . . 1,655,064 (1,655,064) — — —Deutsche Bank AG . . . . . . . . . . . . . . . . . . . . . . . . . . . . . . . . . . . . . . . . . . . . . . 8,212,091 (8,212,091) — — —Goldman Sachs International . . . . . . . . . . . . . . . . . . . . . . . . . . . . . . . . . . . . . . . 24,861,731 (24,861,731) — — —Morgan Stanley International PLC(f) . . . . . . . . . . . . . . . . . . . . . . . . . . . . . . . . . . 7,075,072 (7,075,072) — — —UBS AG . . . . . . . . . . . . . . . . . . . . . . . . . . . . . . . . . . . . . . . . . . . . . . . . . . . . . . 28,879,201 (28,879,201) — — —
$104,698,686 $(94,944,070) $(9,754,616) $ — $ —
(a) The amount of derivatives available for offset is limited to the amount of derivative asset and/or liabilities that are subject to an MNA.(b) Excess of collateral received from the individual counterparty is not shown for financial reporting purposes.(c) Net amount represents the net amount receivable from the counterparty in the event of default.(d) Net amount may also include forward foreign currency exchange contracts and currency options that are not required to be collateralized.(e) Net amount represents the net amount payable due to counterparty in the event of default. Net amount may be offset further by the options written receivable/payable on the
Consolidated Statement of Assets and Liabilities.(f) Includes derivatives owned by the BlackRock Cayman Global Allocation Fund I, Ltd., a wholly-owned subsidiary of the Fund. See Note 1.
Fair Value Hierarchy as of Period End
Various inputs are used in determining the fair value of investments and derivative financial instruments. For information about the Fund’s policy regarding valuation ofinvestments and derivative financial instruments, refer to the Notes to Consolidated Financial Statements.
The following tables summarize the Fund’s investments and derivative financial instruments categorized in the disclosure hierarchy:
Level 1 Level 2 Level 3 Total
Assets:Investments:
Common Stocks:Australia . . . . . . . . . . . . . . . . . . . . . . . . . . . . . . . . . . . . . . . . . . . . . . . . . . . . . . . . . . . . . . . $ — $ 2,664,112 $ — $ 2,664,112Belgium . . . . . . . . . . . . . . . . . . . . . . . . . . . . . . . . . . . . . . . . . . . . . . . . . . . . . . . . . . . . . . . . — 166,333,576 — 166,333,576Brazil . . . . . . . . . . . . . . . . . . . . . . . . . . . . . . . . . . . . . . . . . . . . . . . . . . . . . . . . . . . . . . . . . . 84,541,654 — — 84,541,654Canada . . . . . . . . . . . . . . . . . . . . . . . . . . . . . . . . . . . . . . . . . . . . . . . . . . . . . . . . . . . . . . . . 146,121,886 — — 146,121,886China . . . . . . . . . . . . . . . . . . . . . . . . . . . . . . . . . . . . . . . . . . . . . . . . . . . . . . . . . . . . . . . . . 89,815,561 64,131,708 — 153,947,269Czech Republic . . . . . . . . . . . . . . . . . . . . . . . . . . . . . . . . . . . . . . . . . . . . . . . . . . . . . . . . . . — 15,354,902 — 15,354,902Denmark . . . . . . . . . . . . . . . . . . . . . . . . . . . . . . . . . . . . . . . . . . . . . . . . . . . . . . . . . . . . . . . — 2,659,337 — 2,659,337Finland . . . . . . . . . . . . . . . . . . . . . . . . . . . . . . . . . . . . . . . . . . . . . . . . . . . . . . . . . . . . . . . . — 99,916,142 — 99,916,142France . . . . . . . . . . . . . . . . . . . . . . . . . . . . . . . . . . . . . . . . . . . . . . . . . . . . . . . . . . . . . . . . . 3,632,048 1,110,569,200 — 1,114,201,248Germany . . . . . . . . . . . . . . . . . . . . . . . . . . . . . . . . . . . . . . . . . . . . . . . . . . . . . . . . . . . . . . . — 784,069,522 — 784,069,522Hong Kong . . . . . . . . . . . . . . . . . . . . . . . . . . . . . . . . . . . . . . . . . . . . . . . . . . . . . . . . . . . . . 7,976,673 271,413,954 — 279,390,627India . . . . . . . . . . . . . . . . . . . . . . . . . . . . . . . . . . . . . . . . . . . . . . . . . . . . . . . . . . . . . . . . . . 4,572,348 518,684,794 — 523,257,142Indonesia . . . . . . . . . . . . . . . . . . . . . . . . . . . . . . . . . . . . . . . . . . . . . . . . . . . . . . . . . . . . . . . — 42,207,800 — 42,207,800Ireland . . . . . . . . . . . . . . . . . . . . . . . . . . . . . . . . . . . . . . . . . . . . . . . . . . . . . . . . . . . . . . . . . 11,571,127 57,116 — 11,628,243Israel . . . . . . . . . . . . . . . . . . . . . . . . . . . . . . . . . . . . . . . . . . . . . . . . . . . . . . . . . . . . . . . . . . 30,958 — — 30,958Italy . . . . . . . . . . . . . . . . . . . . . . . . . . . . . . . . . . . . . . . . . . . . . . . . . . . . . . . . . . . . . . . . . . . 173,366,224 205,856,079 — 379,222,303Japan . . . . . . . . . . . . . . . . . . . . . . . . . . . . . . . . . . . . . . . . . . . . . . . . . . . . . . . . . . . . . . . . . 682,855 3,261,197,574 — 3,261,880,429Mexico . . . . . . . . . . . . . . . . . . . . . . . . . . . . . . . . . . . . . . . . . . . . . . . . . . . . . . . . . . . . . . . . 903,957 — — 903,957Netherlands . . . . . . . . . . . . . . . . . . . . . . . . . . . . . . . . . . . . . . . . . . . . . . . . . . . . . . . . . . . . . 44,467 521,205,575 — 521,250,042Norway . . . . . . . . . . . . . . . . . . . . . . . . . . . . . . . . . . . . . . . . . . . . . . . . . . . . . . . . . . . . . . . . — 535,636 — 535,636Peru . . . . . . . . . . . . . . . . . . . . . . . . . . . . . . . . . . . . . . . . . . . . . . . . . . . . . . . . . . . . . . . . . . 20,735 — — 20,735Poland . . . . . . . . . . . . . . . . . . . . . . . . . . . . . . . . . . . . . . . . . . . . . . . . . . . . . . . . . . . . . . . . . — 5,643,649 — 5,643,649Portugal . . . . . . . . . . . . . . . . . . . . . . . . . . . . . . . . . . . . . . . . . . . . . . . . . . . . . . . . . . . . . . . . 30,678,518 — — 30,678,518Singapore . . . . . . . . . . . . . . . . . . . . . . . . . . . . . . . . . . . . . . . . . . . . . . . . . . . . . . . . . . . . . . — 104,071,267 — 104,071,267South Africa . . . . . . . . . . . . . . . . . . . . . . . . . . . . . . . . . . . . . . . . . . . . . . . . . . . . . . . . . . . . . — 902,286 — 902,286South Korea . . . . . . . . . . . . . . . . . . . . . . . . . . . . . . . . . . . . . . . . . . . . . . . . . . . . . . . . . . . . 63,603,895 174,305,388 — 237,909,283Spain . . . . . . . . . . . . . . . . . . . . . . . . . . . . . . . . . . . . . . . . . . . . . . . . . . . . . . . . . . . . . . . . . . — 149,178,828 — 149,178,828Sweden . . . . . . . . . . . . . . . . . . . . . . . . . . . . . . . . . . . . . . . . . . . . . . . . . . . . . . . . . . . . . . . . — 236,795,340 — 236,795,340Switzerland . . . . . . . . . . . . . . . . . . . . . . . . . . . . . . . . . . . . . . . . . . . . . . . . . . . . . . . . . . . . . — 460,199,938 — 460,199,938Taiwan . . . . . . . . . . . . . . . . . . . . . . . . . . . . . . . . . . . . . . . . . . . . . . . . . . . . . . . . . . . . . . . . — 252,429,134 — 252,429,134Thailand . . . . . . . . . . . . . . . . . . . . . . . . . . . . . . . . . . . . . . . . . . . . . . . . . . . . . . . . . . . . . . . 45,372,657 30,053,340 — 75,425,997
C O N S O L I D A T E D S C H E D U L E O F I N V E S T M E N T S 25

Consolidated Schedule of Investments (continued)
October 31, 2017
BlackRock Global Allocation Fund, Inc.(Percentages shown are based on Net Assets)
Level 1 Level 2 Level 3 Total
Turkey . . . . . . . . . . . . . . . . . . . . . . . . . . . . . . . . . . . . . . . . . . . . . . . . . . . . . . . . $ — $ 739,383 $ — $ 739,383United Arab Emirates . . . . . . . . . . . . . . . . . . . . . . . . . . . . . . . . . . . . . . . . . . . . . — 130,329,723 — 130,329,723United Kingdom . . . . . . . . . . . . . . . . . . . . . . . . . . . . . . . . . . . . . . . . . . . . . . . . . 449,997,764 903,946,694 — 1,353,944,458United States . . . . . . . . . . . . . . . . . . . . . . . . . . . . . . . . . . . . . . . . . . . . . . . . . . . 11,398,767,425 — 2,257,426 11,401,024,851
Corporate Bonds . . . . . . . . . . . . . . . . . . . . . . . . . . . . . . . . . . . . . . . . . . . . . . . . . . — 1,385,177,836 38,940,178 1,424,118,014Floating Rate Loan Interests . . . . . . . . . . . . . . . . . . . . . . . . . . . . . . . . . . . . . . . . . . — 197,643,768 — 197,643,768Foreign Agency Obligations . . . . . . . . . . . . . . . . . . . . . . . . . . . . . . . . . . . . . . . . . . — 3,901,596,929 — 3,901,596,929Investment Companies . . . . . . . . . . . . . . . . . . . . . . . . . . . . . . . . . . . . . . . . . . . . . . 1,348,814,202 — — 1,348,814,202Non-Agency Mortgage-Backed Securities . . . . . . . . . . . . . . . . . . . . . . . . . . . . . . . . — 40,458,836 — 40,458,836Capital Trusts . . . . . . . . . . . . . . . . . . . . . . . . . . . . . . . . . . . . . . . . . . . . . . . . . . . . — 367,112,912 — 367,112,912Preferred Stocks . . . . . . . . . . . . . . . . . . . . . . . . . . . . . . . . . . . . . . . . . . . . . . . . . . 247,615,829 1,051,493 601,457,562 850,124,884Trust Preferreds . . . . . . . . . . . . . . . . . . . . . . . . . . . . . . . . . . . . . . . . . . . . . . . . . . . 74,344,181 124,270,312 — 198,614,493U.S. Treasury Obligations . . . . . . . . . . . . . . . . . . . . . . . . . . . . . . . . . . . . . . . . . . . — 5,959,800,033 — 5,959,800,033Warrants . . . . . . . . . . . . . . . . . . . . . . . . . . . . . . . . . . . . . . . . . . . . . . . . . . . . . . . . — — 213 213Short-Term Securities:
Time Deposits . . . . . . . . . . . . . . . . . . . . . . . . . . . . . . . . . . . . . . . . . . . . . . . . . . — 343,345 — 343,345U.S. Treasury Obligations . . . . . . . . . . . . . . . . . . . . . . . . . . . . . . . . . . . . . . . . . . — 2,211,682,111 — 2,211,682,111Money Market Funds . . . . . . . . . . . . . . . . . . . . . . . . . . . . . . . . . . . . . . . . . . . . . 98,212,840 — — 98,212,840
Options PurchasedEquity contracts . . . . . . . . . . . . . . . . . . . . . . . . . . . . . . . . . . . . . . . . . . . . . . . . . — 75,661,768 — 75,661,768Foreign currency exchange contracts . . . . . . . . . . . . . . . . . . . . . . . . . . . . . . . . . — 25,812,411 — 25,812,411Interest rate contracts . . . . . . . . . . . . . . . . . . . . . . . . . . . . . . . . . . . . . . . . . . . . . — 22,257,100 — 22,257,100
Subtotal . . . . . . . . . . . . . . . . . . . . . . . . . . . . . . . . . . . . . . . . . . . . . . . . . . . . . . . . . . . . . $14,280,687,804 $23,828,320,851 $642,655,379 $38,751,664,034
Investments Valued at NAV(a) 307,248,940
Total Investments$39,058,912,974
Derivative Financial Instruments(b)
Assets:Credit contracts . . . . . . . . . . . . . . . . . . . . . . . . . . . . . . . . . . . . . . . . . . . . . . . . . . . $ — $ 84,801 $ — $ 84,801Equity contracts . . . . . . . . . . . . . . . . . . . . . . . . . . . . . . . . . . . . . . . . . . . . . . . . . . . — 77,088,649 — 77,088,649Foreign currency exchange contracts . . . . . . . . . . . . . . . . . . . . . . . . . . . . . . . . . . . — 36,201,905 — 36,201,905Interest rate contracts . . . . . . . . . . . . . . . . . . . . . . . . . . . . . . . . . . . . . . . . . . . . . . . — 35,071,953 — 35,071,953
Liabilities:Credit contracts . . . . . . . . . . . . . . . . . . . . . . . . . . . . . . . . . . . . . . . . . . . . . . . . . . . — (3,500,420) — (3,500,420)Equity contracts . . . . . . . . . . . . . . . . . . . . . . . . . . . . . . . . . . . . . . . . . . . . . . . . . . . (17,531,799) (32,040,206) — (49,572,005)Foreign currency exchange contracts . . . . . . . . . . . . . . . . . . . . . . . . . . . . . . . . . . . — (29,575,126) — (29,575,126)Interest rate contracts . . . . . . . . . . . . . . . . . . . . . . . . . . . . . . . . . . . . . . . . . . . . . . . — (29,553,474) — (29,553,474)
$ (17,531,799) $ 53,778,082 $ — $ 36,246,283
(a) As of October 31, 2017, certain of the Fund’s Investments were fair valued using net asset value (“NAV”) per share and have been excluded from the fair value hierarchy.(b) Derivative financial instruments are swaps, futures contracts, forward foreign currency exchange contracts and options written. Swaps, futures contracts and forward foreign currency
exchange contracts are valued at the unrealized appreciation (depreciation) on the instrument and options written are shown at value.
A reconciliation of Level 3 investments is presented when the Fund had a significant amount of Level 3 investments at the beginning and/or end of the period in relation tonet assets. The following table is a reconciliation of Level 3 investments for which significant unobservable inputs were used in determining fair value:
CommonStocks
CorporateBonds
Floating RateLoan
InterestsPreferredSecurities Warrants Total
Assets:
Opening balance, as of October 31, 2016 . . . . . . . . . . . . . . . . . . . $ 3,391,206 $141,246,994 $111,256,662 $604,588,415 — $ 860,483,277Transfers into Level 3 . . . . . . . . . . . . . . . . . . . . . . . . . . . . . . . . — — — — 4,874,982 4,874,982Transfers out of Level 3 . . . . . . . . . . . . . . . . . . . . . . . . . . . . . . — — (50,082,056) — — (50,082,056)Accrued discounts/premiums . . . . . . . . . . . . . . . . . . . . . . . . . . — (37,954) — — — (37,954)Net realized gain (loss) . . . . . . . . . . . . . . . . . . . . . . . . . . . . . . . (17,322,913) (79,324,002) 259,930 — — (96,386,985)Net change in unrealized appreciation (depreciation)(a),(b) . . . . . . 47,302,757 25,468,808 (1,844,317) (11,082,509) (4,874,769) 54,969,970Purchases . . . . . . . . . . . . . . . . . . . . . . . . . . . . . . . . . . . . . . . . — 8,061,467 — 7,951,656 — 16,013,123Sales . . . . . . . . . . . . . . . . . . . . . . . . . . . . . . . . . . . . . . . . . . . . (31,113,624) (56,475,135) (59,590,219) — — (147,178,978)
Closing Balance, as of October 31, 2017 . . . . . . . . . . . . . . . . . . . . $ 2,257,426 $ 38,940,178 $ — $601,457,562 $ 213 $ 642,655,379
Net change in unrealized appreciation (depreciation) oninvestments still held at October 31, 2017(b) . . . . . . . . . . . . . . . . $ 1,220,680 $ (22,070,569) $ — $ (11,082,509) $(4,874,769) $ (36,807,167)
(a) Included in the related net change in unrealized appreciation (depreciation) in the Consolidated Statement of Operations.(b) Any difference between net change in unrealized appreciation (depreciation) and net change in unrealized appreciation (depreciation) on investments still held at October 31, 2017 is
generally due to investments no longer held or categorized as Level 3 at period end.
26 2 0 1 7 B L A C K R O C K A N N U A L R E P O R T T O S H A R E H O L D E R S

Consolidated Schedule of Investments (continued)
October 31, 2017
BlackRock Global Allocation Fund, Inc.(Percentages shown are based on Net Assets)
The following table summarizes the valuation approaches used and unobservable inputs utilized by the BlackRock Global Valuation Methodologies Committee (the “GlobalValuation Committee”) to determine the value of certain of the Fund’s Level 3 investments as of period end. The table does not include Level 3 investments with valuesbased upon unadjusted third party pricing information in the amount of $197,718. A significant change in the third party information could result in a significantly lower orhigher value of such Level 3 investments.
ValueValuation
Approaches Unobservable Inputs
Range ofUnobservableInputs Utilized
WeightedAverage of
UnobservableInputs
Assets:
Common Stocks(c) . . . . . . . . . . . . . . . . . . . . . . . . . . . . . . . . . . $ 2,257,426 Market Estimated Recovery Value(a) — —Gross Billings Multiple(a) 7.5x —Time to Exit(a) 1 year —Volatility(a) 26% —Billing Growth Rate(a) 30% —
Corporate Bonds . . . . . . . . . . . . . . . . . . . . . . . . . . . . . . . . . . . 38,742,673 Income Discount Rate(b) 18.00% —Market Estimated Recovery Value(a) — —
Preferred Stocks(c)(d) . . . . . . . . . . . . . . . . . . . . . . . . . . . . . . . . 601,457,562 Market Gross Billings Multiple(a) 7.5x —Revenue Growth Rate(a) 39% - 110% 74.26%Billings Growth Rate(a) 30% —Revenue Multiple(a) 8.00x - 11.75x 10.61xTime to Exit(a)(b) 1 year —Volatility(a)(b) 26% - 65% 40.80%Discount Rate(b) 20% —Exit Scenario Probability 5% - 85% —
$642,457,661
(a) Increase in unobservable input may result in a significant increase to value, while a decrease in unobservable input may result in a significant decrease to value.(b) Decrease in unobservable input may result in a significant increase to value, while an increase in unobservable input may result in a significant decrease to value.(c) For the year ended October 31, 2017, the valuation technique changed for certain investments in common stocks and preferred stocks with a total value of $50,087,486 from a hybrid
model using Probability-Weighted Expected Return Model (“PWERM”) and Option Pricing Model (“OPM”) to using only OPM. The change was due to consideration of liquidationpreferences and exit strategy.
(d) For the year ended October 31, 2017, the valuation technique changed for certain investments in preferred stocks with a total value of $94,546,763 from a hybrid model usingPWERM and OPM to using only PWERM. The change was due to consideration of liquidation preferences and exit strategy.
See notes to consolidated financial statements.
C O N S O L I D A T E D S C H E D U L E O F I N V E S T M E N T S 27

Consolidated Statement of Assets and LiabilitiesOctober 31, 2017
BlackRock GlobalAllocation Fund, Inc.
ASSETSInvestments at value — unaffiliated (including securities loaned at value of $301,654,977) (cost — $32,554,403,331) . . . . . . . . . . . . . . . . . . . . . . . . . . . . . . . . . . . . . . . . $38,210,477,998Investments at value — affiliated (cost — $987,786,167) . . . . . . . . . . . . . . . . . . . . . . . . . . . . . . . . . . . . . . . . . . . . . . . . . . . . . . . . . . . . . . . . . . . . . . . . . . . . . . . . . . . . . 848,434,976Cash pledged as collateral for centrally cleared swaps . . . . . . . . . . . . . . . . . . . . . . . . . . . . . . . . . . . . . . . . . . . . . . . . . . . . . . . . . . . . . . . . . . . . . . . . . . . . . . . . . . . . . . . 13,051,000Receivables:
Investments sold . . . . . . . . . . . . . . . . . . . . . . . . . . . . . . . . . . . . . . . . . . . . . . . . . . . . . . . . . . . . . . . . . . . . . . . . . . . . . . . . . . . . . . . . . . . . . . . . . . . . . . . . . . . . . . . . 455,876,224Interest — unaffiliated . . . . . . . . . . . . . . . . . . . . . . . . . . . . . . . . . . . . . . . . . . . . . . . . . . . . . . . . . . . . . . . . . . . . . . . . . . . . . . . . . . . . . . . . . . . . . . . . . . . . . . . . . . . . . 77,167,203Dividends — unaffiliated . . . . . . . . . . . . . . . . . . . . . . . . . . . . . . . . . . . . . . . . . . . . . . . . . . . . . . . . . . . . . . . . . . . . . . . . . . . . . . . . . . . . . . . . . . . . . . . . . . . . . . . . . . . 41,265,926Capital shares sold . . . . . . . . . . . . . . . . . . . . . . . . . . . . . . . . . . . . . . . . . . . . . . . . . . . . . . . . . . . . . . . . . . . . . . . . . . . . . . . . . . . . . . . . . . . . . . . . . . . . . . . . . . . . . . . 19,405,602Options written . . . . . . . . . . . . . . . . . . . . . . . . . . . . . . . . . . . . . . . . . . . . . . . . . . . . . . . . . . . . . . . . . . . . . . . . . . . . . . . . . . . . . . . . . . . . . . . . . . . . . . . . . . . . . . . . . . 14,921,008Securities lending income — affiliated . . . . . . . . . . . . . . . . . . . . . . . . . . . . . . . . . . . . . . . . . . . . . . . . . . . . . . . . . . . . . . . . . . . . . . . . . . . . . . . . . . . . . . . . . . . . . . . . . 353,630Dividends — affiliated . . . . . . . . . . . . . . . . . . . . . . . . . . . . . . . . . . . . . . . . . . . . . . . . . . . . . . . . . . . . . . . . . . . . . . . . . . . . . . . . . . . . . . . . . . . . . . . . . . . . . . . . . . . . . 23,536
Unrealized appreciation on:OTC derivatives . . . . . . . . . . . . . . . . . . . . . . . . . . . . . . . . . . . . . . . . . . . . . . . . . . . . . . . . . . . . . . . . . . . . . . . . . . . . . . . . . . . . . . . . . . . . . . . . . . . . . . . . . . . . . . . . . 100,510,455Forward foreign currency exchange contracts . . . . . . . . . . . . . . . . . . . . . . . . . . . . . . . . . . . . . . . . . . . . . . . . . . . . . . . . . . . . . . . . . . . . . . . . . . . . . . . . . . . . . . . . . . . 36,201,905
Prepaid expenses . . . . . . . . . . . . . . . . . . . . . . . . . . . . . . . . . . . . . . . . . . . . . . . . . . . . . . . . . . . . . . . . . . . . . . . . . . . . . . . . . . . . . . . . . . . . . . . . . . . . . . . . . . . . . . . . . . 313,703
Total assets . . . . . . . . . . . . . . . . . . . . . . . . . . . . . . . . . . . . . . . . . . . . . . . . . . . . . . . . . . . . . . . . . . . . . . . . . . . . . . . . . . . . . . . . . . . . . . . . . . . . . . . . . . . . . . . . . . . . . . 39,818,003,166
LIABILITIESCash collateral on securities loaned at value . . . . . . . . . . . . . . . . . . . . . . . . . . . . . . . . . . . . . . . . . . . . . . . . . . . . . . . . . . . . . . . . . . . . . . . . . . . . . . . . . . . . . . . . . . . . . . 307,194,433Foreign bank overdraft . . . . . . . . . . . . . . . . . . . . . . . . . . . . . . . . . . . . . . . . . . . . . . . . . . . . . . . . . . . . . . . . . . . . . . . . . . . . . . . . . . . . . . . . . . . . . . . . . . . . . . . . . . . . . . 1,422,815Bank overdraft . . . . . . . . . . . . . . . . . . . . . . . . . . . . . . . . . . . . . . . . . . . . . . . . . . . . . . . . . . . . . . . . . . . . . . . . . . . . . . . . . . . . . . . . . . . . . . . . . . . . . . . . . . . . . . . . . . . . 83,080,994Cash received as collateral for OTC derivatives . . . . . . . . . . . . . . . . . . . . . . . . . . . . . . . . . . . . . . . . . . . . . . . . . . . . . . . . . . . . . . . . . . . . . . . . . . . . . . . . . . . . . . . . . . . . 137,257,771Options written at value (premiums received — $90,757,580) . . . . . . . . . . . . . . . . . . . . . . . . . . . . . . . . . . . . . . . . . . . . . . . . . . . . . . . . . . . . . . . . . . . . . . . . . . . . . . . . . 65,499,354Payables:
To broker — short sales . . . . . . . . . . . . . . . . . . . . . . . . . . . . . . . . . . . . . . . . . . . . . . . . . . . . . . . . . . . . . . . . . . . . . . . . . . . . . . . . . . . . . . . . . . . . . . . . . . . . . . . . . . . 71,085,556Capital shares redeemed . . . . . . . . . . . . . . . . . . . . . . . . . . . . . . . . . . . . . . . . . . . . . . . . . . . . . . . . . . . . . . . . . . . . . . . . . . . . . . . . . . . . . . . . . . . . . . . . . . . . . . . . . . 56,224,270Investments purchased . . . . . . . . . . . . . . . . . . . . . . . . . . . . . . . . . . . . . . . . . . . . . . . . . . . . . . . . . . . . . . . . . . . . . . . . . . . . . . . . . . . . . . . . . . . . . . . . . . . . . . . . . . . . 53,232,947Investment advisory fees . . . . . . . . . . . . . . . . . . . . . . . . . . . . . . . . . . . . . . . . . . . . . . . . . . . . . . . . . . . . . . . . . . . . . . . . . . . . . . . . . . . . . . . . . . . . . . . . . . . . . . . . . . 22,489,147Deferred foreign capital gain tax . . . . . . . . . . . . . . . . . . . . . . . . . . . . . . . . . . . . . . . . . . . . . . . . . . . . . . . . . . . . . . . . . . . . . . . . . . . . . . . . . . . . . . . . . . . . . . . . . . . . . 15,223,197Options written . . . . . . . . . . . . . . . . . . . . . . . . . . . . . . . . . . . . . . . . . . . . . . . . . . . . . . . . . . . . . . . . . . . . . . . . . . . . . . . . . . . . . . . . . . . . . . . . . . . . . . . . . . . . . . . . . . 14,140,007Service and distribution fees . . . . . . . . . . . . . . . . . . . . . . . . . . . . . . . . . . . . . . . . . . . . . . . . . . . . . . . . . . . . . . . . . . . . . . . . . . . . . . . . . . . . . . . . . . . . . . . . . . . . . . . . 9,665,354Variation margin on futures contracts . . . . . . . . . . . . . . . . . . . . . . . . . . . . . . . . . . . . . . . . . . . . . . . . . . . . . . . . . . . . . . . . . . . . . . . . . . . . . . . . . . . . . . . . . . . . . . . . . 1,839,967Variation margin on centrally cleared swaps . . . . . . . . . . . . . . . . . . . . . . . . . . . . . . . . . . . . . . . . . . . . . . . . . . . . . . . . . . . . . . . . . . . . . . . . . . . . . . . . . . . . . . . . . . . . 512,033Other affiliates . . . . . . . . . . . . . . . . . . . . . . . . . . . . . . . . . . . . . . . . . . . . . . . . . . . . . . . . . . . . . . . . . . . . . . . . . . . . . . . . . . . . . . . . . . . . . . . . . . . . . . . . . . . . . . . . . . 107,211Officer’s and Directors’ fees . . . . . . . . . . . . . . . . . . . . . . . . . . . . . . . . . . . . . . . . . . . . . . . . . . . . . . . . . . . . . . . . . . . . . . . . . . . . . . . . . . . . . . . . . . . . . . . . . . . . . . . . 74,346Other accrued expenses . . . . . . . . . . . . . . . . . . . . . . . . . . . . . . . . . . . . . . . . . . . . . . . . . . . . . . . . . . . . . . . . . . . . . . . . . . . . . . . . . . . . . . . . . . . . . . . . . . . . . . . . . . . 15,664,384
Swap premiums received . . . . . . . . . . . . . . . . . . . . . . . . . . . . . . . . . . . . . . . . . . . . . . . . . . . . . . . . . . . . . . . . . . . . . . . . . . . . . . . . . . . . . . . . . . . . . . . . . . . . . . . . . . . . 14,609,713Unrealized depreciation on:
Forward foreign currency exchange contracts . . . . . . . . . . . . . . . . . . . . . . . . . . . . . . . . . . . . . . . . . . . . . . . . . . . . . . . . . . . . . . . . . . . . . . . . . . . . . . . . . . . . . . . . . . . 22,047,110OTC derivatives . . . . . . . . . . . . . . . . . . . . . . . . . . . . . . . . . . . . . . . . . . . . . . . . . . . . . . . . . . . . . . . . . . . . . . . . . . . . . . . . . . . . . . . . . . . . . . . . . . . . . . . . . . . . . . . . . 2,542,509
Total liabilities . . . . . . . . . . . . . . . . . . . . . . . . . . . . . . . . . . . . . . . . . . . . . . . . . . . . . . . . . . . . . . . . . . . . . . . . . . . . . . . . . . . . . . . . . . . . . . . . . . . . . . . . . . . . . . . . . . . . 893,913,118
NET ASSETS . . . . . . . . . . . . . . . . . . . . . . . . . . . . . . . . . . . . . . . . . . . . . . . . . . . . . . . . . . . . . . . . . . . . . . . . . . . . . . . . . . . . . . . . . . . . . . . . . . . . . . . . . . . . . . . . . . . . $38,924,090,048
NET ASSETS CONSIST OFPaid-in capital . . . . . . . . . . . . . . . . . . . . . . . . . . . . . . . . . . . . . . . . . . . . . . . . . . . . . . . . . . . . . . . . . . . . . . . . . . . . . . . . . . . . . . . . . . . . . . . . . . . . . . . . . . . . . . . . . . . . $32,276,236,952Undistributed net investment income . . . . . . . . . . . . . . . . . . . . . . . . . . . . . . . . . . . . . . . . . . . . . . . . . . . . . . . . . . . . . . . . . . . . . . . . . . . . . . . . . . . . . . . . . . . . . . . . . . . . 19,713,998Accumulated net realized gain . . . . . . . . . . . . . . . . . . . . . . . . . . . . . . . . . . . . . . . . . . . . . . . . . . . . . . . . . . . . . . . . . . . . . . . . . . . . . . . . . . . . . . . . . . . . . . . . . . . . . . . . 1,000,677,438Net unrealized appreciation (depreciation) . . . . . . . . . . . . . . . . . . . . . . . . . . . . . . . . . . . . . . . . . . . . . . . . . . . . . . . . . . . . . . . . . . . . . . . . . . . . . . . . . . . . . . . . . . . . . . . . 5,627,461,660
NET ASSETS . . . . . . . . . . . . . . . . . . . . . . . . . . . . . . . . . . . . . . . . . . . . . . . . . . . . . . . . . . . . . . . . . . . . . . . . . . . . . . . . . . . . . . . . . . . . . . . . . . . . . . . . . . . . . . . . . . . . $38,924,090,048
NET ASSET VALUEInstitutional — Based on net assets of $16,164,754,462 and 792,764,948 shares outstanding, 2 billion shares authorized, $0.10 par value . . . . . . . . . . . . . . . . . . . . . . . . $ 20.39
Investor A — Based on net assets of $12,809,355,909 and 632,197,338 shares outstanding, 2 billion shares authorized, $0.10 par value . . . . . . . . . . . . . . . . . . . . . . . . . $ 20.26
Investor B — Based on net assets of $2,532,642 and 129,097 shares outstanding, 1.5 billion shares authorized, $0.10 par value . . . . . . . . . . . . . . . . . . . . . . . . . . . . . . . . $ 19.62
Investor C — Based on net assets of $7,545,248,811 and 411,564,351 shares outstanding, 2 billion shares authorized, $0.10 par value . . . . . . . . . . . . . . . . . . . . . . . . . . $ 18.33
Class K — Based on net assets of $1,341,925,244 and 65,815,374 shares outstanding, 2 billion shares authorized, $0.10 par value . . . . . . . . . . . . . . . . . . . . . . . . . . . . . $ 20.39
Class R — Based on net assets of $1,060,272,980 and 54,879,284 shares outstanding, 2 billion shares authorized, $0.10 par value . . . . . . . . . . . . . . . . . . . . . . . . . . . . . $ 19.32
See notes to consolidated financial statements.
28 2 0 1 7 B L A C K R O C K A N N U A L R E P O R T T O S H A R E H O L D E R S

Consolidated Statement of OperationsYear Ended October 31, 2017
BlackRock GlobalAllocation Fund, Inc.
INVESTMENT INCOMEDividends — unaffiliated . . . . . . . . . . . . . . . . . . . . . . . . . . . . . . . . . . . . . . . . . . . . . . . . . . . . . . . . . . . . . . . . . . . . . . . . . . . . . . . . . . . . . . . . . . . . . . . . . . . . . . . . . . . $ 489,404,957Interest — unaffiliated . . . . . . . . . . . . . . . . . . . . . . . . . . . . . . . . . . . . . . . . . . . . . . . . . . . . . . . . . . . . . . . . . . . . . . . . . . . . . . . . . . . . . . . . . . . . . . . . . . . . . . . . . . . . . 369,664,138Dividends — affiliated . . . . . . . . . . . . . . . . . . . . . . . . . . . . . . . . . . . . . . . . . . . . . . . . . . . . . . . . . . . . . . . . . . . . . . . . . . . . . . . . . . . . . . . . . . . . . . . . . . . . . . . . . . . . . 7,909,251Securities lending income — affiliated — net . . . . . . . . . . . . . . . . . . . . . . . . . . . . . . . . . . . . . . . . . . . . . . . . . . . . . . . . . . . . . . . . . . . . . . . . . . . . . . . . . . . . . . . . . . . . 5,811,215Other income . . . . . . . . . . . . . . . . . . . . . . . . . . . . . . . . . . . . . . . . . . . . . . . . . . . . . . . . . . . . . . . . . . . . . . . . . . . . . . . . . . . . . . . . . . . . . . . . . . . . . . . . . . . . . . . . . . . 575,377Foreign taxes withheld . . . . . . . . . . . . . . . . . . . . . . . . . . . . . . . . . . . . . . . . . . . . . . . . . . . . . . . . . . . . . . . . . . . . . . . . . . . . . . . . . . . . . . . . . . . . . . . . . . . . . . . . . . . . (27,231,564)
Total investment income . . . . . . . . . . . . . . . . . . . . . . . . . . . . . . . . . . . . . . . . . . . . . . . . . . . . . . . . . . . . . . . . . . . . . . . . . . . . . . . . . . . . . . . . . . . . . . . . . . . . . . . . . . . . . 846,133,374
EXPENSESInvestment advisory . . . . . . . . . . . . . . . . . . . . . . . . . . . . . . . . . . . . . . . . . . . . . . . . . . . . . . . . . . . . . . . . . . . . . . . . . . . . . . . . . . . . . . . . . . . . . . . . . . . . . . . . . . . . . . 301,394,305Service and distribution — class specific . . . . . . . . . . . . . . . . . . . . . . . . . . . . . . . . . . . . . . . . . . . . . . . . . . . . . . . . . . . . . . . . . . . . . . . . . . . . . . . . . . . . . . . . . . . . . . . 130,123,291Transfer agent — class specific . . . . . . . . . . . . . . . . . . . . . . . . . . . . . . . . . . . . . . . . . . . . . . . . . . . . . . . . . . . . . . . . . . . . . . . . . . . . . . . . . . . . . . . . . . . . . . . . . . . . . 39,133,984Accounting services . . . . . . . . . . . . . . . . . . . . . . . . . . . . . . . . . . . . . . . . . . . . . . . . . . . . . . . . . . . . . . . . . . . . . . . . . . . . . . . . . . . . . . . . . . . . . . . . . . . . . . . . . . . . . . 5,377,726Professional . . . . . . . . . . . . . . . . . . . . . . . . . . . . . . . . . . . . . . . . . . . . . . . . . . . . . . . . . . . . . . . . . . . . . . . . . . . . . . . . . . . . . . . . . . . . . . . . . . . . . . . . . . . . . . . . . . . . 5,244,934Custodian . . . . . . . . . . . . . . . . . . . . . . . . . . . . . . . . . . . . . . . . . . . . . . . . . . . . . . . . . . . . . . . . . . . . . . . . . . . . . . . . . . . . . . . . . . . . . . . . . . . . . . . . . . . . . . . . . . . . . 4,480,553Officer and Directors . . . . . . . . . . . . . . . . . . . . . . . . . . . . . . . . . . . . . . . . . . . . . . . . . . . . . . . . . . . . . . . . . . . . . . . . . . . . . . . . . . . . . . . . . . . . . . . . . . . . . . . . . . . . . 573,087Registration . . . . . . . . . . . . . . . . . . . . . . . . . . . . . . . . . . . . . . . . . . . . . . . . . . . . . . . . . . . . . . . . . . . . . . . . . . . . . . . . . . . . . . . . . . . . . . . . . . . . . . . . . . . . . . . . . . . . 463,880Printing . . . . . . . . . . . . . . . . . . . . . . . . . . . . . . . . . . . . . . . . . . . . . . . . . . . . . . . . . . . . . . . . . . . . . . . . . . . . . . . . . . . . . . . . . . . . . . . . . . . . . . . . . . . . . . . . . . . . . . . 191,212Offering costs . . . . . . . . . . . . . . . . . . . . . . . . . . . . . . . . . . . . . . . . . . . . . . . . . . . . . . . . . . . . . . . . . . . . . . . . . . . . . . . . . . . . . . . . . . . . . . . . . . . . . . . . . . . . . . . . . . . 25,078Miscellaneous . . . . . . . . . . . . . . . . . . . . . . . . . . . . . . . . . . . . . . . . . . . . . . . . . . . . . . . . . . . . . . . . . . . . . . . . . . . . . . . . . . . . . . . . . . . . . . . . . . . . . . . . . . . . . . . . . . 741,570
Total expenses excluding dividends expense, broker fees and expenses on short sales . . . . . . . . . . . . . . . . . . . . . . . . . . . . . . . . . . . . . . . . . . . . . . . . . . . . . . . . . . . . . . 487,749,620Dividends expense — unaffiliated . . . . . . . . . . . . . . . . . . . . . . . . . . . . . . . . . . . . . . . . . . . . . . . . . . . . . . . . . . . . . . . . . . . . . . . . . . . . . . . . . . . . . . . . . . . . . . . . . . . . . . 9,472,919Broker fees and expenses on short sales . . . . . . . . . . . . . . . . . . . . . . . . . . . . . . . . . . . . . . . . . . . . . . . . . . . . . . . . . . . . . . . . . . . . . . . . . . . . . . . . . . . . . . . . . . . . . . . . 338,405
Total expenses . . . . . . . . . . . . . . . . . . . . . . . . . . . . . . . . . . . . . . . . . . . . . . . . . . . . . . . . . . . . . . . . . . . . . . . . . . . . . . . . . . . . . . . . . . . . . . . . . . . . . . . . . . . . . . . . . . . . 497,560,944Less:
Fees waived and/or reimbursed by the Manager . . . . . . . . . . . . . . . . . . . . . . . . . . . . . . . . . . . . . . . . . . . . . . . . . . . . . . . . . . . . . . . . . . . . . . . . . . . . . . . . . . . . . . . . . (31,454,759)Fees paid indirectly . . . . . . . . . . . . . . . . . . . . . . . . . . . . . . . . . . . . . . . . . . . . . . . . . . . . . . . . . . . . . . . . . . . . . . . . . . . . . . . . . . . . . . . . . . . . . . . . . . . . . . . . . . . . . . (45,569)
Total expenses after fees waived . . . . . . . . . . . . . . . . . . . . . . . . . . . . . . . . . . . . . . . . . . . . . . . . . . . . . . . . . . . . . . . . . . . . . . . . . . . . . . . . . . . . . . . . . . . . . . . . . . . . . . 466,060,616
Net investment income . . . . . . . . . . . . . . . . . . . . . . . . . . . . . . . . . . . . . . . . . . . . . . . . . . . . . . . . . . . . . . . . . . . . . . . . . . . . . . . . . . . . . . . . . . . . . . . . . . . . . . . . . . . . . . 380,072,758
REALIZED AND UNREALIZED GAIN (LOSS)Net realized gain (loss) from:
Investments (net of $952,143 foreign capital gain tax) — unaffiliated . . . . . . . . . . . . . . . . . . . . . . . . . . . . . . . . . . . . . . . . . . . . . . . . . . . . . . . . . . . . . . . . . . . . . . . . 1,769,929,365Investments — affiliated . . . . . . . . . . . . . . . . . . . . . . . . . . . . . . . . . . . . . . . . . . . . . . . . . . . . . . . . . . . . . . . . . . . . . . . . . . . . . . . . . . . . . . . . . . . . . . . . . . . . . . . . . (25,081,812)Futures contracts . . . . . . . . . . . . . . . . . . . . . . . . . . . . . . . . . . . . . . . . . . . . . . . . . . . . . . . . . . . . . . . . . . . . . . . . . . . . . . . . . . . . . . . . . . . . . . . . . . . . . . . . . . . . . . (278,871,353)Forward foreign currency exchange contracts . . . . . . . . . . . . . . . . . . . . . . . . . . . . . . . . . . . . . . . . . . . . . . . . . . . . . . . . . . . . . . . . . . . . . . . . . . . . . . . . . . . . . . . . . 177,206,336Foreign currency transactions . . . . . . . . . . . . . . . . . . . . . . . . . . . . . . . . . . . . . . . . . . . . . . . . . . . . . . . . . . . . . . . . . . . . . . . . . . . . . . . . . . . . . . . . . . . . . . . . . . . . . (20,451,703)Options written . . . . . . . . . . . . . . . . . . . . . . . . . . . . . . . . . . . . . . . . . . . . . . . . . . . . . . . . . . . . . . . . . . . . . . . . . . . . . . . . . . . . . . . . . . . . . . . . . . . . . . . . . . . . . . . . 104,727,870Capital gain distributions from investment companies — affiliated . . . . . . . . . . . . . . . . . . . . . . . . . . . . . . . . . . . . . . . . . . . . . . . . . . . . . . . . . . . . . . . . . . . . . . . . . . 62Swaps . . . . . . . . . . . . . . . . . . . . . . . . . . . . . . . . . . . . . . . . . . . . . . . . . . . . . . . . . . . . . . . . . . . . . . . . . . . . . . . . . . . . . . . . . . . . . . . . . . . . . . . . . . . . . . . . . . . . . . (3,166,275)Short sales — unaffiliated . . . . . . . . . . . . . . . . . . . . . . . . . . . . . . . . . . . . . . . . . . . . . . . . . . . . . . . . . . . . . . . . . . . . . . . . . . . . . . . . . . . . . . . . . . . . . . . . . . . . . . . . (68,663,158)
1,655,629,332
Net change in unrealized appreciation (depreciation) on:Investments (including $13,407,795 foreign capital gain tax) . . . . . . . . . . . . . . . . . . . . . . . . . . . . . . . . . . . . . . . . . . . . . . . . . . . . . . . . . . . . . . . . . . . . . . . . . . . . . . 2,683,285,095Investments — affiliated . . . . . . . . . . . . . . . . . . . . . . . . . . . . . . . . . . . . . . . . . . . . . . . . . . . . . . . . . . . . . . . . . . . . . . . . . . . . . . . . . . . . . . . . . . . . . . . . . . . . . . . . . 18,890,214Futures contracts . . . . . . . . . . . . . . . . . . . . . . . . . . . . . . . . . . . . . . . . . . . . . . . . . . . . . . . . . . . . . . . . . . . . . . . . . . . . . . . . . . . . . . . . . . . . . . . . . . . . . . . . . . . . . . (43,250,257)Forward foreign currency exchange contracts . . . . . . . . . . . . . . . . . . . . . . . . . . . . . . . . . . . . . . . . . . . . . . . . . . . . . . . . . . . . . . . . . . . . . . . . . . . . . . . . . . . . . . . . . 8,991,790Foreign currency translations . . . . . . . . . . . . . . . . . . . . . . . . . . . . . . . . . . . . . . . . . . . . . . . . . . . . . . . . . . . . . . . . . . . . . . . . . . . . . . . . . . . . . . . . . . . . . . . . . . . . . 646,554Options written . . . . . . . . . . . . . . . . . . . . . . . . . . . . . . . . . . . . . . . . . . . . . . . . . . . . . . . . . . . . . . . . . . . . . . . . . . . . . . . . . . . . . . . . . . . . . . . . . . . . . . . . . . . . . . . . (5,822,765)Swaps . . . . . . . . . . . . . . . . . . . . . . . . . . . . . . . . . . . . . . . . . . . . . . . . . . . . . . . . . . . . . . . . . . . . . . . . . . . . . . . . . . . . . . . . . . . . . . . . . . . . . . . . . . . . . . . . . . . . . . 124,492,482Short sales — unaffiliated . . . . . . . . . . . . . . . . . . . . . . . . . . . . . . . . . . . . . . . . . . . . . . . . . . . . . . . . . . . . . . . . . . . . . . . . . . . . . . . . . . . . . . . . . . . . . . . . . . . . . . . . (1,709,902)
2,785,523,211
Net realized and unrealized gain . . . . . . . . . . . . . . . . . . . . . . . . . . . . . . . . . . . . . . . . . . . . . . . . . . . . . . . . . . . . . . . . . . . . . . . . . . . . . . . . . . . . . . . . . . . . . . . . . . . . . . . 4,441,152,543
NET INCREASE IN NET ASSETS RESULTING FROM OPERATIONS . . . . . . . . . . . . . . . . . . . . . . . . . . . . . . . . . . . . . . . . . . . . . . . . . . . . . . . . . . . . . . . . . . . . . . . . . . $4,821,225,301
See notes to consolidated financial statements.
F I N A N C I A L S T A T E M E N T S 29

Consolidated Statements of Changes in Net Assets
BlackRock Global Allocation Fund, Inc.
Year Ended October 31,
2017 2016
INCREASE (DECREASE) IN NET ASSETS:
OPERATIONSNet investment income . . . . . . . . . . . . . . . . . . . . . . . . . . . . . . . . . . . . . . . . . . . . . . . . . . . . . . . . . . . . . . . . . . . . . . . . . . . . . . . . . . . . . . . . . . . . . $ 380,072,758 $ 468,936,717Net realized gain . . . . . . . . . . . . . . . . . . . . . . . . . . . . . . . . . . . . . . . . . . . . . . . . . . . . . . . . . . . . . . . . . . . . . . . . . . . . . . . . . . . . . . . . . . . . . . . . . 1,655,629,332 210,191,095Net change in unrealized appreciation (depreciation) . . . . . . . . . . . . . . . . . . . . . . . . . . . . . . . . . . . . . . . . . . . . . . . . . . . . . . . . . . . . . . . . . . . . . . . 2,785,523,211 (319,757,659)
Net increase in net assets resulting from operations . . . . . . . . . . . . . . . . . . . . . . . . . . . . . . . . . . . . . . . . . . . . . . . . . . . . . . . . . . . . . . . . . . . . . . . . . . 4,821,225,301 359,370,153
DISTRIBUTIONS TO SHAREHOLDERS(a)
From net investment income:Institutional . . . . . . . . . . . . . . . . . . . . . . . . . . . . . . . . . . . . . . . . . . . . . . . . . . . . . . . . . . . . . . . . . . . . . . . . . . . . . . . . . . . . . . . . . . . . . . . . . . . (220,641,771) (150,833,470)Investor A . . . . . . . . . . . . . . . . . . . . . . . . . . . . . . . . . . . . . . . . . . . . . . . . . . . . . . . . . . . . . . . . . . . . . . . . . . . . . . . . . . . . . . . . . . . . . . . . . . . . (127,032,734) (101,040,317)Investor B . . . . . . . . . . . . . . . . . . . . . . . . . . . . . . . . . . . . . . . . . . . . . . . . . . . . . . . . . . . . . . . . . . . . . . . . . . . . . . . . . . . . . . . . . . . . . . . . . . . . — (361,563)Investor C . . . . . . . . . . . . . . . . . . . . . . . . . . . . . . . . . . . . . . . . . . . . . . . . . . . . . . . . . . . . . . . . . . . . . . . . . . . . . . . . . . . . . . . . . . . . . . . . . . . . (27,597,872) (45,087,935)Class K . . . . . . . . . . . . . . . . . . . . . . . . . . . . . . . . . . . . . . . . . . . . . . . . . . . . . . . . . . . . . . . . . . . . . . . . . . . . . . . . . . . . . . . . . . . . . . . . . . . . . . (10,107,399) —Class R . . . . . . . . . . . . . . . . . . . . . . . . . . . . . . . . . . . . . . . . . . . . . . . . . . . . . . . . . . . . . . . . . . . . . . . . . . . . . . . . . . . . . . . . . . . . . . . . . . . . . . (8,119,089) (6,158,451)
From net realized gain:Institutional . . . . . . . . . . . . . . . . . . . . . . . . . . . . . . . . . . . . . . . . . . . . . . . . . . . . . . . . . . . . . . . . . . . . . . . . . . . . . . . . . . . . . . . . . . . . . . . . . . . (128,100,603) (1,469,287,713)Investor A . . . . . . . . . . . . . . . . . . . . . . . . . . . . . . . . . . . . . . . . . . . . . . . . . . . . . . . . . . . . . . . . . . . . . . . . . . . . . . . . . . . . . . . . . . . . . . . . . . . . (106,372,279) (1,194,273,866)Investor B . . . . . . . . . . . . . . . . . . . . . . . . . . . . . . . . . . . . . . . . . . . . . . . . . . . . . . . . . . . . . . . . . . . . . . . . . . . . . . . . . . . . . . . . . . . . . . . . . . . . (395,344) (13,742,608)Investor C . . . . . . . . . . . . . . . . . . . . . . . . . . . . . . . . . . . . . . . . . . . . . . . . . . . . . . . . . . . . . . . . . . . . . . . . . . . . . . . . . . . . . . . . . . . . . . . . . . . . (94,425,268) (1,133,669,746)Class K . . . . . . . . . . . . . . . . . . . . . . . . . . . . . . . . . . . . . . . . . . . . . . . . . . . . . . . . . . . . . . . . . . . . . . . . . . . . . . . . . . . . . . . . . . . . . . . . . . . . . . (4,871,233) —Class R . . . . . . . . . . . . . . . . . . . . . . . . . . . . . . . . . . . . . . . . . . . . . . . . . . . . . . . . . . . . . . . . . . . . . . . . . . . . . . . . . . . . . . . . . . . . . . . . . . . . . . (9,462,459) (94,513,578)
Decrease in net assets resulting from distributions to shareholders . . . . . . . . . . . . . . . . . . . . . . . . . . . . . . . . . . . . . . . . . . . . . . . . . . . . . . . . . . . . . . (737,126,051) (4,208,969,247)
CAPITAL SHARE TRANSACTIONSNet decrease in net assets derived from capital share transactions . . . . . . . . . . . . . . . . . . . . . . . . . . . . . . . . . . . . . . . . . . . . . . . . . . . . . . . . . . . . . . (7,554,010,477) (5,446,508,108)
NET ASSETSTotal decrease in net assets . . . . . . . . . . . . . . . . . . . . . . . . . . . . . . . . . . . . . . . . . . . . . . . . . . . . . . . . . . . . . . . . . . . . . . . . . . . . . . . . . . . . . . . . . . . (3,469,911,227) (9,296,107,202)Beginning of year . . . . . . . . . . . . . . . . . . . . . . . . . . . . . . . . . . . . . . . . . . . . . . . . . . . . . . . . . . . . . . . . . . . . . . . . . . . . . . . . . . . . . . . . . . . . . . . . . . . 42,394,001,275 51,690,108,477
End of year . . . . . . . . . . . . . . . . . . . . . . . . . . . . . . . . . . . . . . . . . . . . . . . . . . . . . . . . . . . . . . . . . . . . . . . . . . . . . . . . . . . . . . . . . . . . . . . . . . . . . . . $38,924,090,048 $42,394,001,275
Undistributed net investment income, end of year . . . . . . . . . . . . . . . . . . . . . . . . . . . . . . . . . . . . . . . . . . . . . . . . . . . . . . . . . . . . . . . . . . . . . . . . . . . $ 19,713,998 $ 17,035,515
(a) Distributions for annual periods determined in accordance with U.S. federal income tax regulations.
See notes to consolidated financial statements.
30 2 0 1 7 B L A C K R O C K A N N U A L R E P O R T T O S H A R E H O L D E R S

Consolidated Financial Highlights(For a share outstanding throughout each period)
BlackRock Global Allocation Fund, Inc.
Institutional
Year Ended October 31,
2017 2016 2015 2014 2013
Net asset value, beginning of year . . . . . . . . . . . . . . . . . . . . . . . . . . . . . . . . . . . . . . . . . . . . . $ 18.43 $ 19.88 $ 21.77 $ 21.95 $ 19.54
Net investment income(a) . . . . . . . . . . . . . . . . . . . . . . . . . . . . . . . . . . . . . . . . . . . . . . . . . . . . 0.25 0.25 0.26 0.35 0.28Net realized and unrealized gain (loss) . . . . . . . . . . . . . . . . . . . . . . . . . . . . . . . . . . . . . . . . . . 2.12 (0.05) (0.22) 0.77 2.43
Net increase from investment operations . . . . . . . . . . . . . . . . . . . . . . . . . . . . . . . . . . . . . . . . . . 2.37 0.20 0.04 1.12 2.71
Distributions:(b)
From net investment income . . . . . . . . . . . . . . . . . . . . . . . . . . . . . . . . . . . . . . . . . . . . . . . . . (0.26) (0.15) (0.45) (0.33) (0.30)From net realized gain . . . . . . . . . . . . . . . . . . . . . . . . . . . . . . . . . . . . . . . . . . . . . . . . . . . . . . (0.15) (1.50) (1.48) (0.97) —
Total distributions . . . . . . . . . . . . . . . . . . . . . . . . . . . . . . . . . . . . . . . . . . . . . . . . . . . . . . . . . . . (0.41) (1.65) (1.93) (1.30) (0.30)
Net asset value, end of year . . . . . . . . . . . . . . . . . . . . . . . . . . . . . . . . . . . . . . . . . . . . . . . . . . $ 20.39 $ 18.43 $ 19.88(c) $ 21.77 $ 21.95
Total Return(d)
Based on net asset value . . . . . . . . . . . . . . . . . . . . . . . . . . . . . . . . . . . . . . . . . . . . . . . . . . . . . . 13.10% 1.34% 0.31%(c) 5.35% 13.97%
Ratios to Average Net Assets
Total expenses . . . . . . . . . . . . . . . . . . . . . . . . . . . . . . . . . . . . . . . . . . . . . . . . . . . . . . . . . . . . . 0.90%(e) 0.88%(e) 0.87% 0.87% 0.87%
Total expenses after fees waived and paid indirectly . . . . . . . . . . . . . . . . . . . . . . . . . . . . . . . . . . 0.82%(e) 0.80%(e) 0.78% 0.78% 0.78%
Total expenses after fees waived and paid indirectly and excluding dividend expense, interestexpense, broker fees and expenses on short sales . . . . . . . . . . . . . . . . . . . . . . . . . . . . . . . . . 0.80%(e) 0.79%(e) 0.78% 0.78% 0.78%
Net investment income . . . . . . . . . . . . . . . . . . . . . . . . . . . . . . . . . . . . . . . . . . . . . . . . . . . . . . . . 1.28%(e) 1.39%(e) 1.28% 1.60% 1.35%
Supplemental Data
Net assets, end of year (000) . . . . . . . . . . . . . . . . . . . . . . . . . . . . . . . . . . . . . . . . . . . . . . . . . . . $16,164,754 $16,122,793 $20,210,226 $22,075,330 $20,968,279
Portfolio turnover rate(f) . . . . . . . . . . . . . . . . . . . . . . . . . . . . . . . . . . . . . . . . . . . . . . . . . . . . . . . 110% 131% 84% 75% 50%
(a) Based on average shares outstanding.(b) Distributions for annual periods determined in accordance with U.S. federal income tax regulations.(c) For financial reporting purposes, the market value of certain investments was adjusted as of report date. Accordingly, the NAV per share and total return performance based on NAV
presented herein are different than the information previously published on October 31, 2015.(d) Where applicable, assumes the reinvestment of distributions.(e) Excludes expenses incurred indirectly as a result of investments in underlying funds of approximately 0.01% for the years ending October 31, 2017 and October 31, 2016.(f) Includes mortgage dollar roll transactions (“MDRs”). Additional information regarding portfolio turnover rate is as follows:
Year Ended October 31,
2017 2016 2015 2014 2013
Portfolio turnover rate (excluding MDRs) . . . . . . . . . . . . . . . . . . . . . . . . . . . . . . . . . . . . . . . . 110% 131% 82% 75% 50%
See notes to consolidated financial statements.
F I N A N C I A L H I G H L I G H T S 31

Consolidated Financial Highlights (continued)
(For a share outstanding throughout each period)
BlackRock Global Allocation Fund, Inc.
Investor A
Year Ended October 31,
2017 2016 2015 2014 2013
Net asset value, beginning of year . . . . . . . . . . . . . . . . . . . . . . . . . . . . . . . . . . . . . . . . . . . . . $ 18.29 $ 19.76 $ 21.65 $ 21.83 $ 19.44
Net investment income(a) . . . . . . . . . . . . . . . . . . . . . . . . . . . . . . . . . . . . . . . . . . . . . . . . . . . . 0.19 0.20 0.21 0.29 0.22Net realized and unrealized gain (loss) . . . . . . . . . . . . . . . . . . . . . . . . . . . . . . . . . . . . . . . . . . 2.11 (0.04) (0.23) 0.77 2.41
Net increase (decrease) from investment operations . . . . . . . . . . . . . . . . . . . . . . . . . . . . . . . . . . 2.30 0.16 (0.02) 1.06 2.63
Distributions:(b)
From net investment income . . . . . . . . . . . . . . . . . . . . . . . . . . . . . . . . . . . . . . . . . . . . . . . . . (0.18) (0.13) (0.39) (0.27) (0.24)From net realized gain . . . . . . . . . . . . . . . . . . . . . . . . . . . . . . . . . . . . . . . . . . . . . . . . . . . . . . (0.15) (1.50) (1.48) (0.97) —
Total distributions . . . . . . . . . . . . . . . . . . . . . . . . . . . . . . . . . . . . . . . . . . . . . . . . . . . . . . . . . . . (0.33) (1.63) (1.87) (1.24) (0.24)
Net asset value, end of year . . . . . . . . . . . . . . . . . . . . . . . . . . . . . . . . . . . . . . . . . . . . . . . . . . $ 20.26 $ 18.29 $ 19.76(c) $ 21.65 $ 21.83
Total Return(d)
Based on net asset value . . . . . . . . . . . . . . . . . . . . . . . . . . . . . . . . . . . . . . . . . . . . . . . . . . . . . . 12.77% 1.08% 0.02%(c) 5.10% 13.63%
Ratios to Average Net Assets
Total expenses . . . . . . . . . . . . . . . . . . . . . . . . . . . . . . . . . . . . . . . . . . . . . . . . . . . . . . . . . . . . . 1.18%(e) 1.15%(e) 1.14% 1.13% 1.13%
Total expenses after fees waived and paid indirectly . . . . . . . . . . . . . . . . . . . . . . . . . . . . . . . . . . 1.10%(e) 1.08%(e) 1.05% 1.04% 1.05%
Total expenses after fees waived and paid indirectly and excluding dividend expense, interestexpense, broker fees and expenses on short sales . . . . . . . . . . . . . . . . . . . . . . . . . . . . . . . . . 1.07%(e) 1.07%(e) 1.05% 1.04% 1.05%
Net investment income . . . . . . . . . . . . . . . . . . . . . . . . . . . . . . . . . . . . . . . . . . . . . . . . . . . . . . . . 1.00%(e) 1.10%(e) 1.01% 1.33% 1.08%
Supplemental Data
Net assets, end of year (000) . . . . . . . . . . . . . . . . . . . . . . . . . . . . . . . . . . . . . . . . . . . . . . . . . . . $12,809,356 $13,447,603 $16,016,234 $17,792,885 $18,858,846
Portfolio turnover rate(f) . . . . . . . . . . . . . . . . . . . . . . . . . . . . . . . . . . . . . . . . . . . . . . . . . . . . . . . 110% 131% 84% 75% 50%
(a) Based on average shares outstanding.(b) Distributions for annual periods determined in accordance with U.S. federal income tax regulations.(c) For financial reporting purposes, the market value of certain investments was adjusted as of report date. Accordingly, the NAV per share and total return performance based on NAV
presented herein are different than the information previously published on October 31, 2015.(d) Where applicable, excludes the effects of any sales charges and assumes the reinvestment of distributions.(e) Excludes expenses incurred indirectly as a result of investments in underlying funds of approximately 0.01% for the years ending October 31, 2017 and October 31, 2016.(f) Includes mortgage dollar roll transactions (“MDRs”). Additional information regarding portfolio turnover rate is as follows:
Year Ended October 31,
2017 2016 2015 2014 2013
Portfolio turnover rate (excluding MDRs) . . . . . . . . . . . . . . . . . . . . . . . . . . . . . . . . . . . . . . . . 110% 131% 82% 75% 50%
See notes to consolidated financial statements.
32 2 0 1 7 B L A C K R O C K A N N U A L R E P O R T T O S H A R E H O L D E R S

Consolidated Financial Highlights (continued)
(For a share outstanding throughout each period)
BlackRock Global Allocation Fund, Inc.
Investor B
Year Ended October 31,
2017 2016 2015 2014 2013
Net asset value, beginning of year . . . . . . . . . . . . . . . . . . . . . . . . . . . . . . . . . . . . . . . . . . . . . . . . . . . . . . . . . . . . $17.71 $ 19.25 $ 21.13 $ 21.31 $ 18.96
Net investment income(a) . . . . . . . . . . . . . . . . . . . . . . . . . . . . . . . . . . . . . . . . . . . . . . . . . . . . . . . . . . . . . . . . . . . 0.00(b) 0.06 0.04 0.11 0.06Net realized and unrealized gain (loss) . . . . . . . . . . . . . . . . . . . . . . . . . . . . . . . . . . . . . . . . . . . . . . . . . . . . . . . . 2.06 (0.06) (0.22) 0.76 2.35
Net increase (decrease) from investment operations . . . . . . . . . . . . . . . . . . . . . . . . . . . . . . . . . . . . . . . . . . . . . . . . 2.06 — (0.18) 0.87 2.41
Distributions:(c)
From net investment income . . . . . . . . . . . . . . . . . . . . . . . . . . . . . . . . . . . . . . . . . . . . . . . . . . . . . . . . . . . . . . . . — (0.04) (0.22) (0.08) (0.06)From net realized gain . . . . . . . . . . . . . . . . . . . . . . . . . . . . . . . . . . . . . . . . . . . . . . . . . . . . . . . . . . . . . . . . . . . . (0.15) (1.50) (1.48) (0.97) —
Total distributions . . . . . . . . . . . . . . . . . . . . . . . . . . . . . . . . . . . . . . . . . . . . . . . . . . . . . . . . . . . . . . . . . . . . . . . . . . (0.15) (1.54) (1.70) (1.05) (0.06)
Net asset value, end of year . . . . . . . . . . . . . . . . . . . . . . . . . . . . . . . . . . . . . . . . . . . . . . . . . . . . . . . . . . . . . . . . . $19.62 $ 17.71 $ 19.25(d) $ 21.13 $ 21.31
Total Return(e)
Based on net asset value . . . . . . . . . . . . . . . . . . . . . . . . . . . . . . . . . . . . . . . . . . . . . . . . . . . . . . . . . . . . . . . . . . . . 11.72% 0.21% (0.82)%(d) 4.27% 12.75%
Ratios to Average Net Assets
Total expenses . . . . . . . . . . . . . . . . . . . . . . . . . . . . . . . . . . . . . . . . . . . . . . . . . . . . . . . . . . . . . . . . . . . . . . . . . . . . 2.11%(f) 1.98%(f) 1.92% 1.93% 1.95%
Total expenses after fees waived and paid indirectly . . . . . . . . . . . . . . . . . . . . . . . . . . . . . . . . . . . . . . . . . . . . . . . . 2.03%(f) 1.90%(f) 1.84% 1.84% 1.86%
Total expenses after fees waived and paid indirectly and excluding dividend expense, interest expense, broker feesand expenses on short sales . . . . . . . . . . . . . . . . . . . . . . . . . . . . . . . . . . . . . . . . . . . . . . . . . . . . . . . . . . . . . . . . 2.01%(f) 1.89%(f) 1.84% 1.84% 1.86%
Net investment income . . . . . . . . . . . . . . . . . . . . . . . . . . . . . . . . . . . . . . . . . . . . . . . . . . . . . . . . . . . . . . . . . . . . . . 0.01%(f) 0.31%(f) 0.22% 0.54% 0.28%
Supplemental Data
Net assets, end of year (000) . . . . . . . . . . . . . . . . . . . . . . . . . . . . . . . . . . . . . . . . . . . . . . . . . . . . . . . . . . . . . . . . . $2,533 $57,642 $191,881 $335,683 $500,197
Portfolio turnover rate(g) . . . . . . . . . . . . . . . . . . . . . . . . . . . . . . . . . . . . . . . . . . . . . . . . . . . . . . . . . . . . . . . . . . . . . . 110% 131% 84% 75% 50%
(a) Based on average shares outstanding.(b) Amount is less than $0.005 per share.(c) Distributions for annual periods determined in accordance with U.S. federal income tax regulations.(d) For financial reporting purposes, the market value of certain investments was adjusted as of report date. Accordingly, the NAV per share and total return performance based on NAV
presented herein are different than the information previously published on October 31, 2015.(e) Where applicable, excludes the effects of any sales charges and assumes the reinvestment of distributions.(f) Excludes expenses incurred indirectly as a result of investments in underlying funds of approximately 0.01% for the years ending October 31, 2017 and October 31, 2016.(g) Includes mortgage dollar roll transactions (“MDRs”). Additional information regarding portfolio turnover rate is as follows:
Year Ended October 31,
2017 2016 2015 2014 2013
Portfolio turnover rate (excluding MDRs) . . . . . . . . . . . . . . . . . . . . . . . . . . . . . . . . . . . . . . . . 110% 131% 82% 75% 50%
See notes to consolidated financial statements.
F I N A N C I A L H I G H L I G H T S 33

Consolidated Financial Highlights (continued)
(For a share outstanding throughout each period)
BlackRock Global Allocation Fund, Inc.
Investor C
Year Ended October 31,
2017 2016 2015 2014 2013
Net asset value, beginning of year . . . . . . . . . . . . . . . . . . . . . . . . . . . . . . . . . . . . . . . . . . . . . . $ 16.57 $ 18.11 $ 20.00 $ 20.27 $ 18.06
Net investment income(a) . . . . . . . . . . . . . . . . . . . . . . . . . . . . . . . . . . . . . . . . . . . . . . . . . . . . . 0.04 0.06 0.05 0.12 0.06Net realized and unrealized gain (loss) . . . . . . . . . . . . . . . . . . . . . . . . . . . . . . . . . . . . . . . . . . . 1.91 (0.04) (0.21) 0.71 2.26
Net increase (decrease) from investment operations . . . . . . . . . . . . . . . . . . . . . . . . . . . . . . . . . . . 1.95 0.02 (0.16) 0.83 2.32
Distributions:(b)
From net investment income . . . . . . . . . . . . . . . . . . . . . . . . . . . . . . . . . . . . . . . . . . . . . . . . . . (0.04) (0.06) (0.25) (0.13) (0.11)From net realized gain . . . . . . . . . . . . . . . . . . . . . . . . . . . . . . . . . . . . . . . . . . . . . . . . . . . . . . . (0.15) (1.50) (1.48) (0.97) —
Total distributions . . . . . . . . . . . . . . . . . . . . . . . . . . . . . . . . . . . . . . . . . . . . . . . . . . . . . . . . . . . . (0.19) (1.56) (1.73) (1.10) (0.11)
Net asset value, end of year . . . . . . . . . . . . . . . . . . . . . . . . . . . . . . . . . . . . . . . . . . . . . . . . . . . $ 18.33 $ 16.57 $ 18.11(c) $ 20.00 $ 20.27
Total Return(d)
Based on net asset value . . . . . . . . . . . . . . . . . . . . . . . . . . . . . . . . . . . . . . . . . . . . . . . . . . . . . . . 11.92% 0.36% (0.73)%(c) 4.29% 12.86%
Ratios to Average Net Assets
Total expenses . . . . . . . . . . . . . . . . . . . . . . . . . . . . . . . . . . . . . . . . . . . . . . . . . . . . . . . . . . . . . . 1.92%(e) 1.89%(e) 1.88% 1.87% 1.88%
Total expenses after fees waived and paid indirectly . . . . . . . . . . . . . . . . . . . . . . . . . . . . . . . . . . . 1.84%(e) 1.82%(e) 1.79% 1.79% 1.80%
Total expenses after fees waived and paid indirectly and excluding dividend expense, interestexpense, broker fees and expenses on short sales . . . . . . . . . . . . . . . . . . . . . . . . . . . . . . . . . . 1.82%(e) 1.82%(e) 1.79% 1.79% 1.80%
Net investment income . . . . . . . . . . . . . . . . . . . . . . . . . . . . . . . . . . . . . . . . . . . . . . . . . . . . . . . . 0.27%(e) 0.37%(e) 0.27% 0.59% 0.33%
Supplemental Data
Net assets, end of year (000) . . . . . . . . . . . . . . . . . . . . . . . . . . . . . . . . . . . . . . . . . . . . . . . . . . . . $7,545,249 $11,029,706 $14,085,089 $15,976,240 $16,170,658
Portfolio turnover rate(f) . . . . . . . . . . . . . . . . . . . . . . . . . . . . . . . . . . . . . . . . . . . . . . . . . . . . . . . . 110% 131% 84% 75% 50%
(a) Based on average shares outstanding.(b) Distributions for annual periods determined in accordance with U.S. federal income tax regulations.(c) For financial reporting purposes, the market value of certain investments was adjusted as of report date. Accordingly, the NAV per share and total return performance based on NAV
presented herein are different than the information previously published on October 31, 2015.(d) Where applicable, excludes the effects of any sales charges and assumes the reinvestment of distributions.(e) Excludes expenses incurred indirectly as a result of investments in underlying funds of approximately 0.01% for the years ending October 31, 2017 and October 31, 2016.(f) Includes mortgage dollar roll transactions (“MDRs”). Additional information regarding portfolio turnover rate is as follows:
Year Ended October 31,
2017 2016 2015 2014 2013
Portfolio turnover rate (excluding MDRs) . . . . . . . . . . . . . . . . . . . . . . . . . . . . . . . . . . . . . . . . 110% 131% 82% 75% 50%
See notes to consolidated financial statements.
34 2 0 1 7 B L A C K R O C K A N N U A L R E P O R T T O S H A R E H O L D E R S
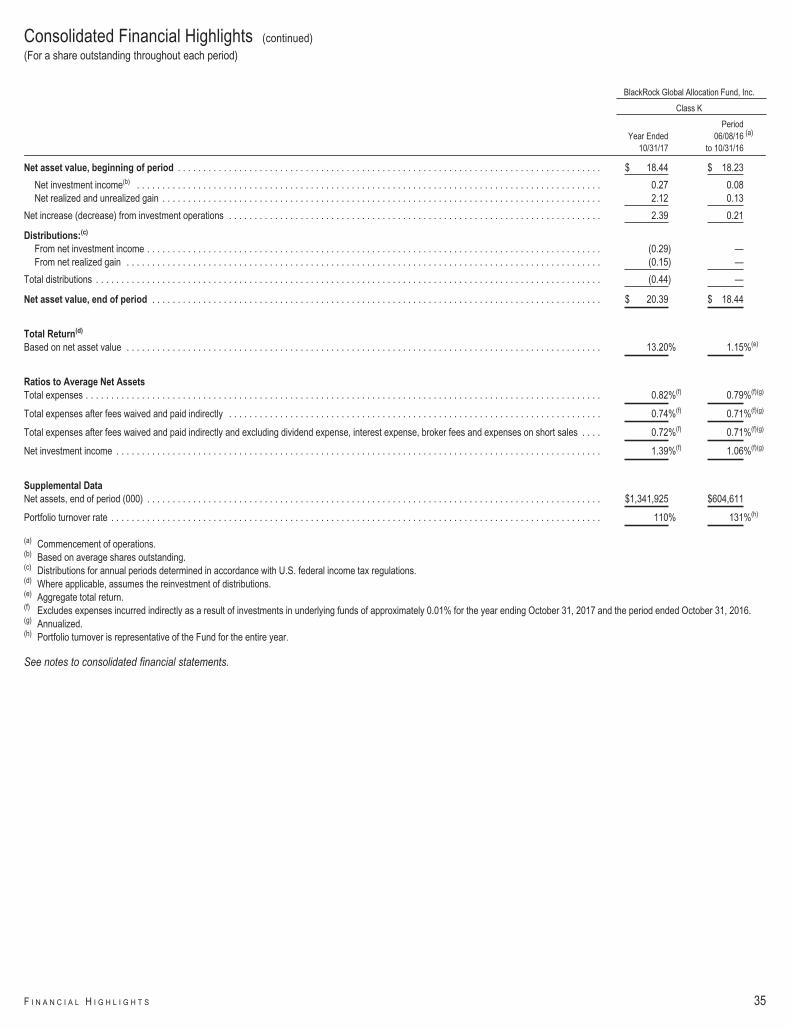
Consolidated Financial Highlights (continued)
(For a share outstanding throughout each period)
BlackRock Global Allocation Fund, Inc.
Class K
Year Ended10/31/17
Period06/08/16 (a)
to 10/31/16
Net asset value, beginning of period . . . . . . . . . . . . . . . . . . . . . . . . . . . . . . . . . . . . . . . . . . . . . . . . . . . . . . . . . . . . . . . . . . . . . . . . . . . . . . . . . . . $ 18.44 $ 18.23
Net investment income(b) . . . . . . . . . . . . . . . . . . . . . . . . . . . . . . . . . . . . . . . . . . . . . . . . . . . . . . . . . . . . . . . . . . . . . . . . . . . . . . . . . . . . . . . . . . . 0.27 0.08Net realized and unrealized gain . . . . . . . . . . . . . . . . . . . . . . . . . . . . . . . . . . . . . . . . . . . . . . . . . . . . . . . . . . . . . . . . . . . . . . . . . . . . . . . . . . . . . . 2.12 0.13
Net increase (decrease) from investment operations . . . . . . . . . . . . . . . . . . . . . . . . . . . . . . . . . . . . . . . . . . . . . . . . . . . . . . . . . . . . . . . . . . . . . . . . . 2.39 0.21
Distributions:(c)
From net investment income . . . . . . . . . . . . . . . . . . . . . . . . . . . . . . . . . . . . . . . . . . . . . . . . . . . . . . . . . . . . . . . . . . . . . . . . . . . . . . . . . . . . . . . . . (0.29) —From net realized gain . . . . . . . . . . . . . . . . . . . . . . . . . . . . . . . . . . . . . . . . . . . . . . . . . . . . . . . . . . . . . . . . . . . . . . . . . . . . . . . . . . . . . . . . . . . . . (0.15) —
Total distributions . . . . . . . . . . . . . . . . . . . . . . . . . . . . . . . . . . . . . . . . . . . . . . . . . . . . . . . . . . . . . . . . . . . . . . . . . . . . . . . . . . . . . . . . . . . . . . . . . . . (0.44) —
Net asset value, end of period . . . . . . . . . . . . . . . . . . . . . . . . . . . . . . . . . . . . . . . . . . . . . . . . . . . . . . . . . . . . . . . . . . . . . . . . . . . . . . . . . . . . . . . . $ 20.39 $ 18.44
Total Return(d)
Based on net asset value . . . . . . . . . . . . . . . . . . . . . . . . . . . . . . . . . . . . . . . . . . . . . . . . . . . . . . . . . . . . . . . . . . . . . . . . . . . . . . . . . . . . . . . . . . . . . 13.20% 1.15%(e)
Ratios to Average Net Assets
Total expenses . . . . . . . . . . . . . . . . . . . . . . . . . . . . . . . . . . . . . . . . . . . . . . . . . . . . . . . . . . . . . . . . . . . . . . . . . . . . . . . . . . . . . . . . . . . . . . . . . . . . . 0.82%(f) 0.79%(f)(g)
Total expenses after fees waived and paid indirectly . . . . . . . . . . . . . . . . . . . . . . . . . . . . . . . . . . . . . . . . . . . . . . . . . . . . . . . . . . . . . . . . . . . . . . . . . 0.74%(f) 0.71%(f)(g)
Total expenses after fees waived and paid indirectly and excluding dividend expense, interest expense, broker fees and expenses on short sales . . . . 0.72%(f) 0.71%(f)(g)
Net investment income . . . . . . . . . . . . . . . . . . . . . . . . . . . . . . . . . . . . . . . . . . . . . . . . . . . . . . . . . . . . . . . . . . . . . . . . . . . . . . . . . . . . . . . . . . . . . . . 1.39%(f) 1.06%(f)(g)
Supplemental Data
Net assets, end of period (000) . . . . . . . . . . . . . . . . . . . . . . . . . . . . . . . . . . . . . . . . . . . . . . . . . . . . . . . . . . . . . . . . . . . . . . . . . . . . . . . . . . . . . . . . . $1,341,925 $604,611
Portfolio turnover rate . . . . . . . . . . . . . . . . . . . . . . . . . . . . . . . . . . . . . . . . . . . . . . . . . . . . . . . . . . . . . . . . . . . . . . . . . . . . . . . . . . . . . . . . . . . . . . . . 110% 131%(h)
(a) Commencement of operations.(b) Based on average shares outstanding.(c) Distributions for annual periods determined in accordance with U.S. federal income tax regulations.(d) Where applicable, assumes the reinvestment of distributions.(e) Aggregate total return.(f) Excludes expenses incurred indirectly as a result of investments in underlying funds of approximately 0.01% for the year ending October 31, 2017 and the period ended October 31, 2016.(g) Annualized.(h) Portfolio turnover is representative of the Fund for the entire year.
See notes to consolidated financial statements.
F I N A N C I A L H I G H L I G H T S 35

Consolidated Financial Highlights (continued)
(For a share outstanding throughout each period)
BlackRock Global Allocation Fund, Inc.
Class R
Year Ended October 31,
2017 2016 2015 2014 2013
Net asset value, beginning of year . . . . . . . . . . . . . . . . . . . . . . . . . . . . . . . . . . . . . . . . . . . . . . . . . . $ 17.46 $ 18.96 $ 20.86 $ 21.08 $ 18.78
Net investment income(a) . . . . . . . . . . . . . . . . . . . . . . . . . . . . . . . . . . . . . . . . . . . . . . . . . . . . . . . . . 0.13 0.14 0.13 0.21 0.15Net realized and unrealized gain (loss) . . . . . . . . . . . . . . . . . . . . . . . . . . . . . . . . . . . . . . . . . . . . . . . 2.01 (0.04) (0.22) 0.74 2.33
Net increase (decrease) from investment operations . . . . . . . . . . . . . . . . . . . . . . . . . . . . . . . . . . . . . . 2.14 0.10 (0.09) 0.95 2.48
Distributions:(b)
From net investment income . . . . . . . . . . . . . . . . . . . . . . . . . . . . . . . . . . . . . . . . . . . . . . . . . . . . . . (0.13) (0.10) (0.33) (0.20) (0.18)From net realized gain . . . . . . . . . . . . . . . . . . . . . . . . . . . . . . . . . . . . . . . . . . . . . . . . . . . . . . . . . . . (0.15) (1.50) (1.48) (0.97) —
Total distributions . . . . . . . . . . . . . . . . . . . . . . . . . . . . . . . . . . . . . . . . . . . . . . . . . . . . . . . . . . . . . . . . (0.28) (1.60) (1.81) (1.17) (0.18)
Net asset value, end of year . . . . . . . . . . . . . . . . . . . . . . . . . . . . . . . . . . . . . . . . . . . . . . . . . . . . . . . $ 19.32 $ 17.46 $ 18.96(c) $ 20.86 $ 21.08
Total Return(d)
Based on net asset value . . . . . . . . . . . . . . . . . . . . . . . . . . . . . . . . . . . . . . . . . . . . . . . . . . . . . . . . . . 12.42% 0.79% (0.37)%(c) 4.73% 13.26%
Ratios to Average Net Assets
Total expenses . . . . . . . . . . . . . . . . . . . . . . . . . . . . . . . . . . . . . . . . . . . . . . . . . . . . . . . . . . . . . . . . . . 1.50%(e) 1.47%(e) 1.48% 1.47% 1.48%
Total expenses after fees waived and paid indirectly . . . . . . . . . . . . . . . . . . . . . . . . . . . . . . . . . . . . . . . 1.42%(e) 1.39%(e) 1.40% 1.38% 1.39%
Total expenses after fees waived and paid indirectly and excluding dividend expense, interest expense,broker fees and expenses on short sales . . . . . . . . . . . . . . . . . . . . . . . . . . . . . . . . . . . . . . . . . . . . . 1.40%(e) 1.39%(e) 1.40% 1.38% 1.39%
Net investment income . . . . . . . . . . . . . . . . . . . . . . . . . . . . . . . . . . . . . . . . . . . . . . . . . . . . . . . . . . . . 0.68%(e) 0.79%(e) 0.67% 0.99% 0.74%
Supplemental Data
Net assets, end of year (000) . . . . . . . . . . . . . . . . . . . . . . . . . . . . . . . . . . . . . . . . . . . . . . . . . . . . . . . . $1,060,273 $1,131,647 $1,186,678 $1,269,833 $1,296,522
Portfolio turnover rate(f) . . . . . . . . . . . . . . . . . . . . . . . . . . . . . . . . . . . . . . . . . . . . . . . . . . . . . . . . . . . . 110% 131% 84% 75% 50%
(a) Based on average shares outstanding.(b) Distributions for annual periods determined in accordance with U.S. federal income tax regulations.(c) For financial reporting purposes, the market value of certain investments was adjusted as of report date. Accordingly, the NAV per share and total return performance based on NAV
presented herein are different than the information previously published on October 31, 2015.(d) Where applicable, assumes the reinvestment of distributions.(e) Excludes expenses incurred indirectly as a result of investments in underlying funds of approximately 0.01% for the years ending October 31, 2017 and October 31, 2016.(f) Includes mortgage dollar roll transactions (“MDRs”). Additional information regarding portfolio turnover rate is as follows:
Year Ended October 31,
2017 2016 2015 2014 2013
Portfolio turnover rate (excluding MDRs) . . . . . . . . . . . . . . . . . . . . . . . . . . . . . . . . . . . . . 110% 131% 82% 75% 50%
See notes to consolidated financial statements.
36 2 0 1 7 B L A C K R O C K A N N U A L R E P O R T T O S H A R E H O L D E R S

Notes to Consolidated Financial Statements
1. ORGANIZATION:
BlackRock Global Allocation Fund, Inc. (the “Fund”) is registered under the Investment Company Act of 1940, as amended (the “1940 Act”), as an open-end managementinvestment company. The Fund is classified as diversified. The Fund is organized as a Maryland Corporation.
The Fund offers multiple classes of shares. All classes of shares have identical voting, dividend, liquidation and other rights and are subject to the same terms andconditions, except that certain classes bear expenses related to the shareholder servicing and distribution of such shares. Institutional and Class K Shares are sold only tocertain eligible investors. Class R Shares are available only to certain employer-sponsored retirement plans. Investor A and Investor C Shares are generally availablethrough financial intermediaries. Investor B Shares are available only through exchanges and distribution reinvestment by existing shareholders, and for purchase bycertain employer-sponsored retirement plans. Each class has exclusive voting rights with respect to matters relating to its shareholder servicing and distributionexpenditures (except that Investor B shareholders may vote on material changes to the Investor A distribution and service plan).
Share Class Initial Sales Charge CDSC Conversion Privilege
Institutional, Class K Shares and Class R Shares . . . . . . . . . . . . . . . . . . . . . . . . . . . . . . . No No NoneInvestor A Shares . . . . . . . . . . . . . . . . . . . . . . . . . . . . . . . . . . . . . . . . . . . . . . . . . . . . . . . Yes No(a) NoneInvestor B Shares . . . . . . . . . . . . . . . . . . . . . . . . . . . . . . . . . . . . . . . . . . . . . . . . . . . . . . . No Yes To Investor A Shares after approximately 8 years(b)
Investor C Shares . . . . . . . . . . . . . . . . . . . . . . . . . . . . . . . . . . . . . . . . . . . . . . . . . . . . . . No Yes None
(a) Investor A Shares may be subject to a Contingent Deferred Sales Charge (“CDSC”) for certain redemptions where no initial sales charge was paid at the time of purchase.(b) Effective on or about the close of business December 27, 2017, all issued and outstanding Investor B Shares will be converted into Investor A Shares.
The Fund, together with certain other registered investment companies advised by BlackRock Advisors, LLC (the “Manager”) or its affiliates, is included in a complex ofopen-end funds referred to as the Equity-Bond Complex.
Basis of Consolidation: The accompanying consolidated financial statements of the Fund include the account of BlackRock Cayman Global Allocation Fund I, Ltd. (the“Subsidiary”), which is a wholly-owned subsidiary of the Fund and primarily invests in commodity-related instruments and other derivatives. The Subsidiary enables theFund to hold these commodity-related instruments and satisfy regulated investment company tax requirements. The Fund may invest up to 25% of its total assets in theSubsidiary. The net assets of the Subsidiary as of period end were $1,468,693,238, which is 3.8% of the Fund’s consolidated net assets. Intercompany accounts andtransactions, if any, have been eliminated. The Subsidiary is subject to the same investment policies and restrictions that apply to the Fund, except that the Subsidiary mayinvest without limitation in commodity-related instruments.
2. SIGNIFICANT ACCOUNTING POLICIES:
The consolidated financial statements are prepared in conformity with accounting principles generally accepted in the United States of America (“U.S. GAAP”), which mayrequire management to make estimates and assumptions that affect the reported amounts of assets and liabilities in the consolidated financial statements, disclosure ofcontingent assets and liabilities at the date of the consolidated financial statements and the reported amounts of increases and decreases in net assets from operationsduring the reporting period. Actual results could differ from those estimates. The Fund is considered an investment company under U.S. GAAP and follows the accountingand reporting guidance applicable to investment companies. Below is a summary of significant accounting policies:
Investment Transactions and Income Recognition: For financial reporting purposes, investment transactions are recorded on the dates the transactions are enteredinto (the “trade dates”). Realized gains and losses on investment transactions are determined on the identified cost basis. Dividend income is recorded on the ex-dividenddate. Dividends from foreign securities where the ex-dividend date may have passed are subsequently recorded when the Fund is informed of the ex-dividend date. Underthe applicable foreign tax laws, a withholding tax at various rates may be imposed on capital gains, dividends and interest. Upon notification from issuers, some of thedividend income received from a real estate investment trust may be redesignated as a reduction of cost of the related investment and/or realized gain. Interest income,including amortization and accretion of premiums and discounts on debt securities, is recognized on an accrual basis. Income, expenses and realized and unrealized gainsand losses are allocated daily to each class based on its relative net assets.
Foreign Currency Translation: The Fund’s books and records are maintained in U.S. dollars. Securities and other assets and liabilities denominated in foreign currenciesare translated into U.S. dollars using exchange rates determined as of the close of trading on the New York Stock Exchange (“NYSE”). Purchases and sales ofinvestments are recorded at the rates of exchange prevailing on the respective dates of such transactions. Generally, when the U.S. dollar rises in value against a foreigncurrency, the investments denominated in that currency will lose value; the opposite effect occurs if the U.S. dollar falls in relative value.
The Fund does not isolate the portion of the results of operations arising as a result of changes in the exchange rates from the changes in the market prices of investmentsheld or sold for financial reporting purposes. Accordingly, the effects of changes in exchange rates on investments are not segregated in the Consolidated Statement ofOperations from the effects of changes in market prices of those investments, but are included as a component of net realized and unrealized gain (loss) from investments.The Fund reports realized currency gains (losses) on foreign currency related transactions as components of net realized gain (loss) for financial reporting purposes,whereas such components are generally treated as ordinary income for U.S. federal income tax purposes.
Segregation and Collateralization: In cases where the Fund enters into certain investments (e.g., TBA sale commitments, futures contracts, forward foreign currencyexchange contracts, options written, swaps and short sales) that would be treated as “senior securities” for 1940 Act purposes, the Fund may segregate or designate on itsbooks and records cash or liquid assets having a market value at least equal to the amount of its future obligations under such investments. Doing so allows theinvestment to be excluded from treatment as a “senior security.” Furthermore, if required by an exchange or counterparty agreement, the Fund may be required to deliver/deposit cash and/or securities to/with an exchange, or broker-dealer or custodian as collateral for certain investments or obligations.
N O T E S T O C O N S O L I D A T E D F I N A N C I A L S T A T E M E N T S 37

Notes to Consolidated Financial Statements (continued)
Distributions: Distributions paid by the Fund are recorded on the ex-dividend date. The character and timing of distributions are determined in accordance with U.S.federal income tax regulations, which may differ from U.S. GAAP.
Net income and realized gains from investments held by the Subsidiary are treated as ordinary income for tax purposes. If a net loss is realized by the Subsidiary in anytaxable year, the loss will generally not be available to offset the Fund’s ordinary income and/or capital gains for that year.
Recent Accounting Standards: In March 2017, the Financial Accounting Standards Board issued Accounting Standards Update “Premium Amortization of PurchasedCallable Debt Securities” which amends the amortization period for certain purchased callable debt securities. Under the new guidance, the premium amortization ofpurchased callable debt securities that have explicit, non-contingent call features and are callable at fixed prices will be amortized to the earliest call date. The guidancewill be applied on a modified retrospective basis and is effective for fiscal years, and their interim periods, beginning after December 15, 2018. Management is currentlyevaluating the impact of this guidance to the Fund.
Indemnifications: In the normal course of business, the Fund enters into contracts that contain a variety of representations that provide general indemnification. The Fund’smaximum exposure under these arrangements is unknown because it involves future potential claims against the Fund, which cannot be predicted with any certainty.
Other: Expenses directly related to the Fund or its classes are charged to the Fund or the applicable class. Other operating expenses shared by several funds, includingother funds managed by the Manager, are prorated among those funds on the basis of relative net assets or other appropriate methods. Expenses directly related to theFund and other shared expenses prorated to the Fund are allocated daily to each class based on its relative net assets or other appropriate methods.
The Fund has an arrangement with its custodian whereby credits are earned on uninvested cash balances, which could be used to reduce custody fees and/or overdraftcharges. The Fund may incur charges on certain uninvested cash balances and overdrafts, subject to certain conditions.
3. INVESTMENT VALUATION AND FAIR VALUE MEASUREMENTS:
Investment Valuation Policies: The Fund’s investments are valued at fair value (also referred to as “market value” within the consolidated financial statements) as of theclose of trading on the NYSE (generally 4:00 p.m., Eastern time). U.S. GAAP defines fair value as the price the Fund would receive to sell an asset or pay to transfer aliability in an orderly transaction between market participants at the measurement date. The Fund determines the fair values of its financial instruments using variousindependent dealers or pricing services under policies approved by the Board of Directors of the Fund (the “Board”). The BlackRock Global Valuation MethodologiesCommittee (the “Global Valuation Committee”) is the committee formed by management to develop global pricing policies and procedures and to oversee the pricingfunction for all financial instruments.
Fair Value Inputs and Methodologies: The following methods and inputs are used to establish the fair value of the Fund’s assets and liabilities:
• Equity investments traded on a recognized securities exchange are valued at the official closing price each day, if available. For equity investments traded on morethan one exchange, the official closing price on the exchange where the stock is primarily traded is used. Equity investments traded on a recognized exchange forwhich there were no sales on that day may be valued at the last available bid (long positions) or ask (short positions) price.
• Fixed-income securities for which market quotations are readily available are generally valued using the last available bid prices or current market quotationsprovided by independent dealers or third party pricing services. Floating rate loan interests are valued at the mean of the bid prices from one or more independentbrokers or dealers as obtained from a third party pricing service. Pricing services generally value fixed-income securities assuming orderly transactions of aninstitutional round lot size, but a fund may hold or transact in such securities in smaller, odd lot sizes. Odd lots often trade at lower prices than institutional roundlots. The pricing services may use matrix pricing or valuation models that utilize certain inputs and assumptions to derive values, including transaction data (e.g.,recent representative bids and offers), credit quality information, perceived market movements, news, and other relevant information. Certain fixed-incomesecurities, including asset-backed and mortgage related securities may be valued based on valuation models that consider the estimated cash flows of eachtranche of the entity, establish a benchmark yield and develop an estimated tranche specific spread to the benchmark yield based on the unique attributes of thetranche. The amortized cost method of valuation may be used with respect to debt obligations with sixty days or less remaining to maturity unless the Managerdetermines such method does not represent fair value.
Generally, trading in foreign instruments is substantially completed each day at various times prior to the close of trading on the NYSE. Occasionally, events affectingthe values of such instruments may occur between the foreign market close and the close of trading on the NYSE that may not be reflected in the computation of theFund’s net assets. Each business day, the Fund uses a pricing service to assist with the valuation of certain foreign exchange-traded equity securities and foreignexchange-traded over-the-counter (“OTC”) options (the “Systematic Fair Value Price”). Using current market factors, the Systematic Fair Value Price is designed tovalue such foreign securities and foreign options at fair value as of the close of trading on the NYSE, which follows the close of the local markets.
• Investments in open-end U.S. mutual funds are valued at net asset value (“NAV”) each business day.
• The Fund values its investment in SL Liquidity Series, LLC, Money Market Series (the “Money Market Series”) at fair value, which is ordinarily based upon its prorata ownership in the underlying fund’s net assets. The Money Market Series seeks current income consistent with maintaining liquidity and preservingcapital. Although the Money Market Series is not registered under the 1940 Act, its investments may follow the parameters of investments by a money market fundthat is subject to Rule 2a-7 under the 1940 Act.
• Futures contracts traded on exchanges are valued at their last sale price.
• Forward foreign currency exchange contracts are valued at the mean between the bid and ask prices and are determined as of the close of trading on the NYSE.Interpolated values are derived when the settlement date of the contract is an interim date for which quotations are not available.
38 2 0 1 7 B L A C K R O C K A N N U A L R E P O R T T O S H A R E H O L D E R S

Notes to Consolidated Financial Statements (continued)
• Exchange-traded options are valued at the mean between the last bid and ask prices at the close of the options market in which the options trade. An exchange-traded option for which there is no mean price is valued at the last bid (long positions) or ask (short positions) price. If no bid or ask price is available, the prior day’sprice will be used, unless it is determined that the prior day’s price no longer reflects the fair value of the option. OTC options and options on swaps (“swaptions”)are valued by an independent pricing service using a mathematical model, which incorporates a number of market data factors, such as the trades and prices of theunderlying instruments.
• Swap agreements are valued utilizing quotes received daily by the Fund’s pricing service or through brokers, which are derived using daily swap curves and modelsthat incorporate a number of market data factors, such as discounted cash flows, trades and values of the underlying reference instruments.
• To-be-announced (“TBA”) commitments are valued on the basis of last available bid prices or current market quotations provided by pricing services.
If events (e.g., a company announcement, market volatility or a natural disaster) occur that are expected to materially affect the value of such investments, or in the eventthat the application of these methods of valuation results in a price for an investment that is deemed not to be representative of the market value of such investment, or if aprice is not available, the investment will be valued by the Global Valuation Committee, or its delegate, in accordance with a policy approved by the Board as reflecting fairvalue (“Fair Valued Investments”). The fair valuation approaches that may be used by the Global Valuation Committee will include Market approach, Income approach andCost approach. Valuation techniques such as discounted cash flow, use of market comparables and matrix pricing are types of valuation approaches and are typicallyused in determining fair value. When determining the price for Fair Valued Investments, the Global Valuation Committee, or its delegate, seeks to determine the price thatthe Fund might reasonably expect to receive or pay from the current sale or purchase of that asset or liability in an arm’s-length transaction. Fair value determinations shallbe based upon all available factors that the Global Valuation Committee, or its delegate, deems relevant and consistent with the principles of fair value measurement.
The Global Valuation Committee, or its delegate, employs various methods for calibrating valuation approaches for investments where an active market does not exist,including regular due diligence of the Fund’s pricing vendors, regular reviews of key inputs and assumptions, transactional back-testing or disposition analysis to compareunrealized gains and losses to realized gains and losses, reviews of missing or stale prices and large movements in market values and reviews of any market relatedactivity. The pricing of all Fair Valued Investments is subsequently reported to the Board or a committee thereof on a quarterly basis. As a result of the inherent uncertaintyin valuation of these investments, the fair values may differ from the values that would have been used had an active market existed.
For investments in equity or debt issued by privately held companies or funds (“Private Company” or collectively, the “Private Companies”) and other Fair ValuedInvestments, the fair valuation approaches that are used by third party pricing services utilize one or a combination of, but not limited to, the following inputs.
Standard Inputs Generally Considered By Third Party Pricing Services
Market approach . . . . . . . . . . . . . . . . . . . . . (i) recent market transactions, including subsequent rounds of financing, in the underlying investment or comparable issuers;(ii) recapitalizations and other transactions across the capital structure; and(iii) market multiples of comparable issuers.
Income approach . . . . . . . . . . . . . . . . . . . . (i) future cash flows discounted to present and adjusted as appropriate for liquidity, credit, and/or market risks;(ii) quoted prices for similar investments or assets in active markets; and(iii) other risk factors, such as interest rates, yield curves, volatilities, prepayment speeds, loss severities, credit risks, recovery rates,
liquidation amounts and/or default rates.
Cost approach . . . . . . . . . . . . . . . . . . . . . . (i) audited or unaudited financial statements, investor communications and financial or operational metrics issued by the PrivateCompany;
(ii) changes in the valuation of relevant indices or publicly traded companies comparable to the Private Company;(iii) relevant news and other public sources; and(iv) known secondary market transactions in the Private Company’s interests and merger or acquisition activity in companies
comparable to the Private Company.
Investments in series of preferred stock issued by Private Companies are typically valued utilizing Market approach in determining the enterprise value of thecompany. Such investments often contain rights and preferences that differ from other series of preferred and common stock of the same issuer. Valuationtechniques such as an option pricing model (“OPM”), a probability weighted expected return model (“PWERM”) or a hybrid of those techniques are used in allocatingenterprise value of the company, as deemed appropriate under the circumstances. The use of OPM and PWERM techniques involve a determination of the exit scenariosof the investment in order to appropriately allocate the enterprise value of the company among the various parts of its capital structure.
The Private Companies are not subject to the public company disclosure, timing, and reporting standards as other investments held by the Fund. Typically, the mostrecently available information by a Private Company is as of a date that is earlier than the date the Fund is calculating its NAV. This factor may result in a differencebetween the value of the investment and the price the Fund could receive upon the sale of the investment.
Fair Value Hierarchy: Various inputs are used in determining the fair value of investments and derivative financial instruments. These inputs to valuation techniques arecategorized into a fair value hierarchy consisting of three broad levels for financial statement purposes as follows:
• Level 1 — Unadjusted price quotations in active markets/exchanges for identical assets or liabilities that the Fund has the ability to access
• Level 2 — Other observable inputs (including, but not limited to, quoted prices for similar assets or liabilities in markets that are active, quoted prices for identical orsimilar assets or liabilities in markets that are not active, inputs other than quoted prices that are observable for the assets or liabilities (such as interest rates, yieldcurves, volatilities, prepayment speeds, loss severities, credit risks and default rates) or other market–corroborated inputs)
• Level 3 — Unobservable inputs based on the best information available in the circumstances, to the extent observable inputs are not available (including the Fund’sown assumptions used in determining the fair value of investments and derivative financial instruments)
N O T E S T O C O N S O L I D A T E D F I N A N C I A L S T A T E M E N T S 39

Notes to Consolidated Financial Statements (continued)
The hierarchy gives the highest priority to unadjusted quoted prices in active markets for identical assets or liabilities (Level 1 measurements) and the lowest priority tounobservable inputs (Level 3 measurements). Accordingly, the degree of judgment exercised in determining fair value is greatest for instruments categorized in Level 3.The inputs used to measure fair value may fall into different levels of the fair value hierarchy. In such cases, for disclosure purposes, the fair value hierarchy classificationis determined based on the lowest level input that is significant to the fair value measurement in its entirety. Investments classified within Level 3 have significantunobservable inputs used by the Global Valuation Committee in determining the price for Fair Valued Investments. Level 3 investments include equity or debt issued byPrivate Companies. There may not be a secondary market, and/or there are a limited number of investors. Level 3 investments may also be adjusted to reflect illiquidityand/or non-transferability, with the amount of such discount estimated by the Global Valuation Committee in the absence of market information.
Changes in valuation techniques may result in transfers into or out of an assigned level within the hierarchy. In accordance with the Fund’s policy, transfers betweendifferent levels of the fair value hierarchy are deemed to have occurred as of the beginning of the reporting period. The categorization of a value determined forinvestments and derivative financial instruments is based on the pricing transparency of the investments and derivative financial instruments and is not necessarily anindication of the risks associated with investing in those securities.
As of October 31, 2017, certain investments of the Fund were valued using NAV per share as no quoted market value is available and therefore have been excluded fromthe fair value hierarchy.
4. Securities and Other Investments:
Asset-Backed and Mortgage-Backed Securities: Asset-backed securities are generally issued as pass-through certificates or as debt instruments. Asset-backedsecurities issued as pass-through certificates represent undivided fractional ownership interests in an underlying pool of assets. Asset-backed securities issued as debtinstruments, which are also known as collateralized obligations, are typically issued as the debt of a special purpose entity organized solely for the purpose of owning suchassets and issuing such debt. Asset-backed securities are often backed by a pool of assets representing the obligations of a number of different parties. The yieldcharacteristics of certain asset-backed securities may differ from traditional debt securities. One such major difference is that all or a principal part of the obligations maybe prepaid at any time because the underlying assets (i.e., loans) may be prepaid at any time. As a result, a decrease in interest rates in the market may result inincreases in the level of prepayments as borrowers, particularly mortgagors, refinance and repay their loans. An increased prepayment rate with respect to an asset-backed security will have the effect of shortening the maturity of the security. In addition, a fund may subsequently have to reinvest the proceeds at lower interest rates. Ifa fund has purchased such an asset-backed security at a premium, a faster than anticipated prepayment rate could result in a loss of principal to the extent of the premiumpaid.
For mortgage pass-through securities (the “Mortgage Assets”) there are a number of important differences among the agencies and instrumentalities of the U.S.Government that issue mortgage-related securities and among the securities that they issue. For example, mortgage-related securities guaranteed by Ginnie Mae areguaranteed as to the timely payment of principal and interest by Ginnie Mae and such guarantee is backed by the full faith and credit of the United States. However,mortgage-related securities issued by Freddie Mac and Fannie Mae, including Freddie Mac and Fannie Mae guaranteed mortgage pass-through certificates, which aresolely the obligations of Freddie Mac and Fannie Mae, are not backed by or entitled to the full faith and credit of the United States, but are supported by the right of theissuer to borrow from the U.S. Treasury.
Non-agency mortgage-backed securities are securities issued by non-governmental issuers and have no direct or indirect government guarantees of payment and aresubject to various risks. Non-agency mortgage loans are obligations of the borrowers thereunder only and are not typically insured or guaranteed by any other person orentity. The ability of a borrower to repay a loan is dependent upon the income or assets of the borrower. A number of factors, including a general economic downturn, actsof God, terrorism, social unrest and civil disturbances, may impair a borrower’s ability to repay its loans.
Inflation-Indexed Bonds: Inflation-indexed bonds (other than municipal inflation-indexed and certain corporate inflation-indexed bonds) are fixed-income securities whoseprincipal value is periodically adjusted according to the rate of inflation. If the index measuring inflation rises or falls, the principal value of inflation-indexed bonds (otherthan municipal inflation-indexed and certain corporate inflation-indexed bonds) will be adjusted upward or downward, and consequently the interest payable on thesesecurities (calculated with respect to a larger or smaller principal amount) will be increased or reduced, respectively. Any upward or downward adjustment in the principalamount of an inflation-indexed bond will be included as interest income in the Consolidated Statement of Operations, even though investors do not receive their principaluntil maturity. Repayment of the original bond principal upon maturity (as adjusted for inflation) is guaranteed in the case of U.S. Treasury inflation-indexed bonds. Forbonds that do not provide a similar guarantee, the adjusted principal value of the bond repaid at maturity may be less than the original principal. With regard to municipalinflation-indexed bonds and certain corporate inflation-indexed bonds, the inflation adjustment is typically reflected in the semi-annual coupon payment. As a result, theprincipal value of municipal inflation-indexed bonds and such corporate inflation-indexed bonds does not adjust according to the rate of inflation.
Zero-Coupon Bonds: Zero-coupon bonds are normally issued at a significant discount from face value and do not provide for periodic interest payments. These bondsmay experience greater volatility in market value than other debt obligations of similar maturity which provide for regular interest payments.
Capital Securities and Trust Preferred Securities: Capital securities, including trust preferred securities, are typically issued by corporations, generally in the form ofinterest-bearing notes with preferred securities characteristics. In the case of trust preferred securities, an affiliated business trust of a corporation issues these securities,generally in the form of beneficial interests in subordinated debentures or similarly structured securities. The securities can be structured with either a fixed or adjustablecoupon that can have either a perpetual or stated maturity date. For trust preferred securities, the issuing bank or corporation pays interest to the trust, which is thendistributed to holders of these securities as a dividend. Dividends can be deferred without creating an event of default or acceleration, although maturity cannot take placeunless all cumulative payment obligations have been met. The deferral of payments does not affect the purchase or sale of these securities in the open market. Thesesecurities generally are rated below that of the issuing company’s senior debt securities and are freely callable at the issuer’s option.
Preferred Stocks: Preferred stock has a preference over common stock in liquidation (and generally in receiving dividends as well), but is subordinated to the liabilities ofthe issuer in all respects. As a general rule, the market value of preferred stock with a fixed dividend rate and no conversion element varies inversely with interest rates
40 2 0 1 7 B L A C K R O C K A N N U A L R E P O R T T O S H A R E H O L D E R S

Notes to Consolidated Financial Statements (continued)
and perceived credit risk, while the market price of convertible preferred stock generally also reflects some element of conversion value. Because preferred stock is juniorto debt securities and other obligations of the issuer, deterioration in the credit quality of the issuer will cause greater changes in the value of a preferred stock than in amore senior debt security with similar stated yield characteristics. Unlike interest payments on debt securities, preferred stock dividends are payable only if declared by theissuer’s board of directors. Preferred stock also may be subject to optional or mandatory redemption provisions.
Warrants: Warrants entitle a fund to purchase a specified number of shares of common stock and are non-income producing. The purchase price and number of sharesare subject to adjustment under certain conditions until the expiration date of the warrants, if any. If the price of the underlying stock does not rise above the strike pricebefore the warrant expires, the warrant generally expires without any value and a fund will lose any amount it paid for the warrant. Thus, investments in warrants mayinvolve more risk than investments in common stock. Warrants may trade in the same markets as their underlying stock; however, the price of the warrant does notnecessarily move with the price of the underlying stock.
Floating Rate Loan Interests: Floating rate loan interests are typically issued to companies (the “borrower”) by banks, other financial institutions, or privately and publiclyoffered corporations (the “lender”). Floating rate loan interests are generally non-investment grade, often involve borrowers whose financial condition is troubled oruncertain and companies that are highly leveraged or in bankruptcy proceedings. In addition, transactions in floating rate loan interests may settle on a delayed basis,which may result in proceeds from the sale not being readily available for a fund to make additional investments or meet its redemption obligations. Floating rate loaninterests may include fully funded term loans or revolving lines of credit. Floating rate loan interests are typically senior in the corporate capital structure of the borrower.Floating rate loan interests generally pay interest at rates that are periodically determined by reference to a base lending rate plus a premium. Since the rates reset onlyperiodically, changes in prevailing interest rates (and particularly sudden and significant changes) can be expected to cause some fluctuations in the NAV of a fund to theextent that it invests in floating rate loan interests. The base lending rates are generally the lending rate offered by one or more European banks, such as the LondonInterbank Offered Rate (“LIBOR”), the prime rate offered by one or more U.S. banks or the certificate of deposit rate. Floating rate loan interests may involve foreignborrowers, and investments may be denominated in foreign currencies. These investments are treated as investments in debt securities for purposes of a fund’sinvestment policies.
When a fund purchases a floating rate loan interest, it may receive a facility fee and when it sells a floating rate loan interest, it may pay a facility fee. On an ongoing basis,a fund may receive a commitment fee based on the undrawn portion of the underlying line of credit amount of a floating rate loan interest. Facility and commitment fees aretypically amortized to income over the term of the loan or term of the commitment, respectively. Consent and amendment fees are recorded to income as earned.Prepayment penalty fees, which may be received by a fund upon the prepayment of a floating rate loan interest by a borrower, are recorded as realized gains. A fund mayinvest in multiple series or tranches of a loan. A different series or tranche may have varying terms and carry different associated risks.
Floating rate loan interests are usually freely callable at the borrower’s option. A fund may invest in such loans in the form of participations in loans (“Participations”) orassignments (“Assignments”) of all or a portion of loans from third parties. Participations typically will result in a fund having a contractual relationship only with the lender,not with the borrower. A fund has the right to receive payments of principal, interest and any fees to which it is entitled only from the lender selling the Participation andonly upon receipt by the lender of the payments from the borrower. In connection with purchasing Participations, a fund generally will have no right to enforce complianceby the borrower with the terms of the loan agreement, nor any rights of offset against the borrower. A fund may not benefit directly from any collateral supporting the loanin which it has purchased the Participation. As a result, a fund assumes the credit risk of both the borrower and the lender that is selling the Participation. A fund’sinvestment in loan participation interests involves the risk of insolvency of the financial intermediaries who are parties to the transactions. In the event of the insolvency ofthe lender selling the Participation, a fund may be treated as a general creditor of the lender and may not benefit from any offset between the lender and the borrower.Assignments typically result in a fund having a direct contractual relationship with the borrower, and a fund may enforce compliance by the borrower with the terms of theloan agreement.
Forward Commitments and When-Issued Delayed Delivery Securities: The Fund may purchase securities on a when-issued basis and may purchase or sell securitieson a forward commitment basis. Settlement of such transactions normally occurs within a month or more after the purchase or sale commitment is made. The Fund maypurchase securities under such conditions with the intention of actually acquiring them, but may enter into a separate agreement to sell the securities before the settlementdate. Since the value of securities purchased may fluctuate prior to settlement, the Fund may be required to pay more at settlement than the security is worth. In addition,the Fund is not entitled to any of the interest earned prior to settlement. When purchasing a security on a delayed delivery basis, the Fund assumes the rights and risks ofownership of the security, including the risk of price and yield fluctuations. In the event of default by the counterparty, the Fund’s maximum amount of loss is the unrealizedappreciation of unsettled when-issued transactions.
TBA Commitments: TBA commitments are forward agreements for the purchase or sale of mortgage-backed securities for a fixed price, with payment and delivery on anagreed upon future settlement date. The specific securities to be delivered are not identified at the trade date. However, delivered securities must meet specified terms,including issuer, rate and mortgage terms. When entering into TBA commitments, a fund may take possession of or deliver the underlying mortgage-backed securities butcan extend the settlement or roll the transaction. TBA commitments involve a risk of loss if the value of the security to be purchased or sold declines or increases,respectively, prior to settlement date.
In order to better define contractual rights and to secure rights that will help a fund mitigate their counterparty risk, TBA commitments may be entered into by a fund underMaster Securities Forward Transaction Agreements (each, an “MSFTA”). An MSFTA typically contains, among other things, collateral posting terms and netting provisionsin the event of default and/or termination event. The collateral requirements are typically calculated by netting the mark-to-market amount for each transaction under suchagreement and comparing that amount to the value of the collateral currently pledged by a fund and the counterparty. Cash collateral that has been pledged to cover theobligations of a fund and cash collateral received from the counterparty, if any, is reported separately on the Consolidated Statement of Assets and Liabilities as cashpledged as collateral for TBA commitments or cash received as collateral for TBA commitments, respectively. Non-cash collateral pledged by a fund, if any, is noted in theConsolidated Schedule of Investments. Typically, a fund is permitted to sell, re-pledge or use the collateral it receives; however, the counterparty is not permitted to do so.To the extent amounts due to a fund is not fully collateralized, contractually or otherwise, a fund bears the risk of loss from counterparty non-performance.
N O T E S T O C O N S O L I D A T E D F I N A N C I A L S T A T E M E N T S 41

Notes to Consolidated Financial Statements (continued)
Short Sale Transactions: In short sale transactions, a fund sells a security it does not hold in anticipation of a decline in the market price of that security. When a fundmakes a short sale, it will borrow the security sold short from a broker/counterparty and deliver the security to the purchaser. To close out a short position, a fund deliversthe same security to the broker and records a liability to reflect the obligation to return the security to the broker. The amount of the liability is subsequentlymarked-to-market to reflect the market value of the short sale. A fund maintains a segregated account of securities or deposits cash with the broker-dealer as collateral forthe short sales. Cash deposited with the broker is recorded as an asset in the Consolidated Statement of Assets and Liabilities. Securities segregated as collateral aredenoted in the Consolidated Schedule of Investments. A fund may pay a financing fee for the difference between the market value of the short position and the cashcollateral deposited with the broker which would be recorded as interest expense. A fund is required to repay the counterparty any dividends received on the security soldshort, which, if applicable, is shown as dividend expense in the Consolidated Statement of Operations. A fund may pay a fee on the assets borrowed from thecounterparty, which, if applicable, is shown as broker fees and expenses on short sales in the Consolidated Statement of Operations. A fund is exposed to market riskbased on the amount, if any, that the market value of the security increases beyond the market value at which the position was sold. Thus, a short sale of a securityinvolves the risk that instead of declining, the price of the security sold short will rise. The short sale of securities involves the possibility of an unlimited loss since there isan unlimited potential for the market price of the security sold short to increase. Gains are limited to the price at which the Fund sold the security short. A realized gain orloss is recognized upon the termination of a short sale if the market price is either less than or greater than the proceeds originally received. There is no assurance that afund will be able to close out a short position at a particular time or at an acceptable price.
Securities Lending: The Fund may lend its securities to approved borrowers, such as brokers, dealers and other financial institutions. The borrower pledges andmaintains with the Fund collateral consisting of cash, an irrevocable letter of credit issued by a bank, or securities issued or guaranteed by the U.S. Government. The initialcollateral received by the Fund is required to have a value of at least 102% of the current value of the loaned securities for securities traded on U.S. exchanges and avalue of at least 105% for all other securities. The collateral is maintained thereafter at a value equal to at least 100% of the current market value of the securities on loan.The market value of the loaned securities is determined at the close of each business day of the Fund and any additional required collateral is delivered to the Fund, orexcess collateral returned by the Fund, on the next business day. During the term of the loan, the Fund is entitled to all distributions made on or in respect of the loanedsecurities, but does not receive interest income on securities received as collateral. Loans of securities are terminable at any time and the borrower, after notice, isrequired to return borrowed securities within the standard time period for settlement of securities transactions.
The market value of any securities on loan, all of which were classified as common stocks in the Fund’s Consolidated Schedule of Investments, and the value of anyrelated collateral are shown separately in the Consolidated Statement of Assets and Liabilities as a component of investments at value-unaffiliated, and collateral onsecurities loaned at value, respectively. As of period end, any securities on loan were collateralized by cash and/or U.S. Government obligations. Cash collateral investedby the securities lending agent, BlackRock Investment Management, LLC (“BIM”), if any, is disclosed in the Consolidated Schedule of Investments.
Securities lending transactions are entered into by the Fund under Master Securities Lending Agreements (each, an “MSLA”), which provide the right, in the event ofdefault (including bankruptcy or insolvency), for the non-defaulting party to liquidate the collateral and calculate a net exposure to the defaulting party or request additionalcollateral. In the event that a borrower defaults, the Fund, as lender, would offset the market value of the collateral received against the market value of the securitiesloaned. When the value of the collateral is greater than that of the market value of the securities loaned, the lender is left with a net amount payable to the defaulting party.However, bankruptcy or insolvency laws of a particular jurisdiction may impose restrictions on or prohibitions against such a right of offset in the event of an MSLAcounterparty’s bankruptcy or insolvency. Under the MSLA, absent an event of default, the borrower can resell or re-pledge the loaned securities, and the Fund can reinvestcash collateral received in connection with loaned securities. Upon an event of default, the parties’ obligations to return the securities or collateral to the other party areextinguished, and the parties can resell or re-pledge the loaned securities or the collateral received in connection with the loaned securities in order to satisfy the defaultingparty’s net payment obligation for all transactions under the MSLA. The defaulting party remains liable for any deficiency.
As of period end, the following table is a summary of the Fund’s securities lending agreements by counterparty which are subject to offset under an MSLA:
CounterpartySecurities
Loaned at ValueCash Collateral
Received (a)Net
Amount
Barclays Capital Inc. . . . . . . . . . . . . . . . . . . . . . . . . . . . . . . . . . . . . . . . . . . . . . . . . . . . . . . . . . . . . . . . . . . . . . . . . . . . . . . . . . . . . $ 11,643,428 $ (11,643,428) $ —BNP Paribas S.A. . . . . . . . . . . . . . . . . . . . . . . . . . . . . . . . . . . . . . . . . . . . . . . . . . . . . . . . . . . . . . . . . . . . . . . . . . . . . . . . . . . . . . . 3,377,101 (3,377,101) —Citigroup Global Markets, Inc. . . . . . . . . . . . . . . . . . . . . . . . . . . . . . . . . . . . . . . . . . . . . . . . . . . . . . . . . . . . . . . . . . . . . . . . . . . . . . 18,309,166 (18,309,166) —Credit Suisse Securities (USA) LLC . . . . . . . . . . . . . . . . . . . . . . . . . . . . . . . . . . . . . . . . . . . . . . . . . . . . . . . . . . . . . . . . . . . . . . . . 21,417,450 (21,417,450) —Deutsche Bank Securities, Inc. . . . . . . . . . . . . . . . . . . . . . . . . . . . . . . . . . . . . . . . . . . . . . . . . . . . . . . . . . . . . . . . . . . . . . . . . . . . . 25,087,466 (25,087,466) —Goldman Sachs & Co. . . . . . . . . . . . . . . . . . . . . . . . . . . . . . . . . . . . . . . . . . . . . . . . . . . . . . . . . . . . . . . . . . . . . . . . . . . . . . . . . . . 84,081,578 (84,081,578) —JP Morgan Securities LLC . . . . . . . . . . . . . . . . . . . . . . . . . . . . . . . . . . . . . . . . . . . . . . . . . . . . . . . . . . . . . . . . . . . . . . . . . . . . . . . 75,863,484 (75,863,484) —Merrill Lynch, Pierce, Fenner & Smith, Inc. . . . . . . . . . . . . . . . . . . . . . . . . . . . . . . . . . . . . . . . . . . . . . . . . . . . . . . . . . . . . . . . . . . . 5,044,685 (5,044,685) —Morgan Stanley & Co. LLC . . . . . . . . . . . . . . . . . . . . . . . . . . . . . . . . . . . . . . . . . . . . . . . . . . . . . . . . . . . . . . . . . . . . . . . . . . . . . . . 42,919,835 (42,919,835) —SG Americas Securities LLC . . . . . . . . . . . . . . . . . . . . . . . . . . . . . . . . . . . . . . . . . . . . . . . . . . . . . . . . . . . . . . . . . . . . . . . . . . . . . . 2,546,379 (2,546,379) —State Street Bank & Trust Co. . . . . . . . . . . . . . . . . . . . . . . . . . . . . . . . . . . . . . . . . . . . . . . . . . . . . . . . . . . . . . . . . . . . . . . . . . . . . . 11,364,405 (11,364,405) —
$ 301,654,977 $ (301,654,977) $ —
(a) Cash collateral with a value of $307,194,433 has been received in connection with securities lending agreements. Collateral received in excess of the value of securities loaned fromthe individual counterparty is not shown for financial reporting purposes in the table above.
The risks of securities lending include the risk that the borrower may not provide additional collateral when required or may not return the securities when due. To mitigatethese risks, the Fund benefits from a borrower default indemnity provided by BIM. BIM’s indemnity allows for full replacement of the securities loaned if the collateralreceived does not cover the value on the securities loaned in the event of borrower default. The Fund could incur a loss if the value of an investment purchased with cashcollateral falls below the market value of loaned securities or if the value of an investment purchased with cash collateral falls below the value of the original cash collateralreceived.
42 2 0 1 7 B L A C K R O C K A N N U A L R E P O R T T O S H A R E H O L D E R S

Notes to Consolidated Financial Statements (continued)
5. DERIVATIVE FINANCIAL INSTRUMENTS:
The Fund engages in various portfolio investment strategies using derivative contracts both to increase the returns of the Fund and/or to manage its exposure to certainrisks such as credit risk, equity risk, interest rate risk, foreign currency exchange rate risk, commodity price risk or other risks (e.g., inflation risk). Derivative financialinstruments categorized by risk exposure are included in the Consolidated Schedule of Investments. These contracts may be transacted on an exchange or OTC.
Futures Contracts: Futures contracts are purchased or sold to gain exposure to, or manage exposure to, changes in interest rates (interest rate risk), changes in thevalue of equity securities (equity risk) or foreign currencies (foreign currency exchange rate risk).
Futures contracts are agreements between the Fund and a counterparty to buy or sell a specific quantity of an underlying instrument at a specified price and on a specifieddate. Depending on the terms of a contract, it is settled either through physical delivery of the underlying instrument on the settlement date or by payment of a cashamount on the settlement date. Upon entering into a futures contract, the Fund is required to deposit initial margin with the broker in the form of cash or securities in anamount that varies depending on a contract’s size and risk profile. The initial margin deposit must then be maintained at an established level over the life of the contract.
Securities deposited as initial margin are designated in the Consolidated Schedule of Investments and cash deposited, if any, is shown as cash pledged for futurescontracts in the Consolidated Statement of Assets and Liabilities. Pursuant to the contract, the Fund agrees to receive from or pay to the broker an amount of cash equalto the daily fluctuation in market value of the contract (“variation margin”). Variation margin is recorded as unrealized appreciation (depreciation) and, if any, shown asvariation margin receivable (or payable) on futures contracts in the Consolidated Statement of Assets and Liabilities. When the contract is closed, a realized gain or loss isrecorded in the Consolidated Statement of Operations equal to the difference between the value of the contract at the time it was opened and the value at the time it wasclosed. The use of futures contracts involves the risk of an imperfect correlation in the movements in the price of futures contracts and interest, foreign currency exchangerates or underlying assets.
Forward Foreign Currency Exchange Contracts: Forward foreign currency exchange contracts are entered into to gain or reduce exposure to foreign currencies(foreign currency exchange rate risk).
A forward foreign currency exchange contract is an agreement between two parties to buy and sell a currency at a set exchange rate on a specified date. These contractshelp to manage the overall exposure to the currencies in which some of the investments held by the Fund are denominated and in some cases, may be used to obtainexposure to a particular market.
The contract is marked-to-market daily and the change in market value is recorded as unrealized appreciation (depreciation) in the Consolidated Statement of Assets andLiabilities. When a contract is closed, a realized gain or loss is recorded in the Consolidated Statement of Operations equal to the difference between the value at the timeit was opened and the value at the time it was closed. Non-deliverable forward foreign currency exchange contracts are settled with the counterparty in cash without thedelivery of foreign currency. The use of forward foreign currency exchange contracts involves the risk that the value of a forward foreign currency exchange contractchanges unfavorably due to movements in the value of the referenced foreign currencies.
Options: The Fund purchases and writes call and put options to increase or decrease its exposure to the risks of underlying instruments, including equity risk, interest raterisk and/or commodity price risk and/or, in the case of options written, to generate gains from options premiums.
A call option gives the purchaser (holder) of the option the right (but not the obligation) to buy, and obligates the seller (writer) to sell (when the option is exercised) theunderlying instrument at the exercise or strike price at any time or at a specified time during the option period. A put option gives the holder the right to sell and obligatesthe writer to buy the underlying instrument at the exercise or strike price at any time or at a specified time during the option period.
Premiums paid on options purchased and premiums received on options written, as well as the daily fluctuation in market value, are included in investments at value —unaffiliated and options written at value, respectively, in the Consolidated Statement of Assets and Liabilities. When an instrument is purchased or sold through theexercise of an option, the premium is offset against the cost or proceeds of the underlying instrument. When an option expires, a realized gain or loss is recorded in theConsolidated Statement of Operations to the extent of the premiums received or paid. When an option is closed or sold, a gain or loss is recorded in the ConsolidatedStatement of Operations to the extent the cost of the closing transaction exceeds the premiums received or paid. When the Fund writes a call option, such option istypically “covered,” meaning that it holds the underlying instrument subject to being called by the option counterparty. When the Fund writes a put option, such option iscovered by cash in an amount sufficient to cover the obligation. As of period end, the value of portfolio securities subject to covered call options written was$91,409,316,033.
• Swaptions — The Fund purchases and writes options on swaps (“swaptions”) primarily to preserve a return or spread on a particular investment or portion of theFund’s holdings, as a duration management technique or to protect against an increase in the price of securities it anticipates purchasing at a later date. Thepurchaser and writer of a swaption is buying or granting the right to enter into a previously agreed upon interest rate or credit default swap agreement (interest raterisk and/or credit risk) at any time before the expiration of the option.
• Foreign currency options — The Fund purchases and writes foreign currency options, foreign currency futures and options on foreign currency futures to gain orreduce exposure to foreign currencies (foreign currency exchange rate risk). Foreign currency options give the purchaser the right to buy from or sell to the writer aforeign currency at any time before the expiration of the option.
• Barrier options — The Fund may purchase and write a variety of options with non-standard payout structures or other features (“barrier options”) that are generallytraded OTC.
The Fund may invest in various types of barrier options, including down-and-out options, down-and-in options, double no-touch options, one-touch options, up-and-outoptions and up-and-in options. Down-and-out options expire worthless to the purchaser if the price of the underlying instrument falls below a specific barrier price level priorto the expiration date. Down-and-in options expire worthless to the purchaser unless the price of the underlying instrument falls below a specific barrier price level prior to
N O T E S T O C O N S O L I D A T E D F I N A N C I A L S T A T E M E N T S 43

Notes to Consolidated Financial Statements (continued)
the expiration date. Double no-touch options provide the purchaser an agreed-upon payout if the price of the underlying instrument does not reach or surpasspredetermined barrier price levels prior to the option’s expiration date. One-touch options provide the purchaser an agreed-upon payout if the price of the underlyinginstrument reaches or surpasses predetermined barrier price levels prior to the expiration date. Up-and-out options expire worthless to the purchaser if the price of theunderlying instrument increases beyond a predetermined barrier price level prior to the expiration date. Up-and-in options can only be exercised when the price of theunderlying instrument increases beyond a predetermined barrier price level.
In purchasing and writing options, the Fund bears the risk of an unfavorable change in the value of the underlying instrument or the risk that it may not be able to enter intoa closing transaction due to an illiquid market. Exercise of a written option could result in the Fund purchasing or selling a security when it otherwise would not, or at a pricedifferent from the current market value.
Swaps: Swap contracts are entered into to manage exposure to issuers, markets and securities. Such contracts are agreements between the Fund and a counterparty tomake periodic net payments on a specified notional amount or a net payment upon termination. Swap agreements are privately negotiated in the OTC market and may beentered into as a bilateral contract (“OTC swaps”) or centrally cleared (“centrally cleared swaps”).
For OTC swaps, any upfront premiums paid and any upfront fees received are shown as swap premiums paid and swap premiums received, respectively, in theConsolidated Statement of Assets and Liabilities and amortized over the term of the contract. The daily fluctuation in market value is recorded as unrealized appreciation(depreciation) on OTC Swaps in the Consolidated Statement of Assets and Liabilities. Payments received or paid are recorded in the Consolidated Statement ofOperations as realized gains or losses, respectively. When an OTC swap is terminated, a realized gain or loss is recorded in the Consolidated Statement of Operationsequal to the difference between the proceeds from (or cost of) the closing transaction and the Fund’s basis in the contract, if any. Generally, the basis of the contract is thepremium received or paid.
In a centrally cleared swap, immediately following execution of the swap contract, the swap contract is novated to a central counterparty (the “CCP”) and the Fund’scounterparty on the swap agreement becomes the CCP. The Fund is required to interface with the CCP through the broker. Upon entering into a centrally cleared swap,the Fund is required to deposit initial margin with the broker in the form of cash or securities in an amount that varies depending on the size and risk profile of the particularswap. Securities deposited as initial margin are designated in the Consolidated Schedule of Investments and cash deposited is shown as cash pledged for centrallycleared swaps in the Consolidated Statement of Assets and Liabilities. Pursuant to the contract, the Fund agrees to receive from or pay to the broker an amount of cashequal to the daily fluctuation in market value of the contract (“variation margin”). Variation margin is recorded as unrealized appreciation (depreciation) and shown asvariation margin receivable (or payable) on centrally cleared swaps in the Consolidated Statement of Assets and Liabilities. Payments received from (paid to) thecounterparty, including at termination, are recorded as realized gains (losses) in the Consolidated Statement of Operations.
• Credit default swaps — Credit default swaps are entered into to manage exposure to the market or certain sectors of the market, to reduce risk exposure todefaults of corporate and/or sovereign issuers or to create exposure to corporate and/or sovereign issuers to which a fund is not otherwise exposed (credit risk).
The Fund may either buy or sell (write) credit default swaps on single-name issuers (corporate or sovereign), a combination or basket of single-name issuers or tradedindexes. Credit default swaps are agreements in which the protection buyer pays fixed periodic payments to the seller in consideration for a promise from the protectionseller to make a specific payment should a negative credit event take place with respect to the referenced entity (e.g., bankruptcy, failure to pay, obligation acceleration,repudiation, moratorium or restructuring). As a buyer, if an underlying credit event occurs, the Fund will either (i) receive from the seller an amount equal to the notionalamount of the swap and deliver the referenced security or underlying securities comprising the index, or (ii) receive a net settlement of cash equal to the notional amount ofthe swap less the recovery value of the security or underlying securities comprising the index. As a seller (writer), if an underlying credit event occurs, the Fund will eitherpay the buyer an amount equal to the notional amount of the swap and take delivery of the referenced security or underlying securities comprising the index or pay a netsettlement of cash equal to the notional amount of the swap less the recovery value of the security or underlying securities comprising the index.
• Total return swaps — Total return swaps are entered into to obtain exposure to a security or market without owning such security or investing directly in suchmarket or to exchange the risk/return of one market (e.g., fixed-income) with another market (e.g., equity or commodity prices) (equity risk, commodity price riskand/or interest rate risk).
Total return swaps are agreements in which there is an exchange of cash flows whereby one party commits to make payments based on the total return (distributions pluscapital gains/losses) of an underlying instrument in exchange for fixed or floating rate interest payments. If the total return of the instrument or index underlying thetransaction exceeds or falls short of the offsetting fixed or floating interest rate obligation, the Fund receives payment from or makes a payment to the counterparty.
• Interest rate swaps — Interest rate swaps are entered into to gain or reduce exposure to interest rates or to manage duration, the yield curve or interest rate(interest rate risk).
Interest rate swaps are agreements in which one party pays a stream of interest payments, either fixed or floating, in exchange for another party’s stream of interestpayments, either fixed or floating, on the same notional amount for a specified period of time. In more complex interest rate swaps, the notional principal amount maydecline (or amortize) over time.
• Currency swaps — Currency swaps are entered into to gain or reduce exposure to foreign currencies (foreign currency exchange rate risk).
Currency swaps are interest rate swaps in which one party pays a stream of interest payments, either fixed or floating, in exchange for another party’s stream of interestpayments, either fixed or floating, based on the notional amounts of two different currencies. The notional amounts are typically determined based on the spot exchangerates at the inception of the trade. Currency swaps may also involve an exchange of notional amounts at the start, during and/or at expiration of the contract, either at thecurrent spot rate or another specified rate.
• Forward swaps — The Fund enters into forward interest rate swaps and forward total return swaps. In a forward swap, the Fund and the counterparty agree tomake periodic net payments beginning on a specified date or a net payment at termination.
44 2 0 1 7 B L A C K R O C K A N N U A L R E P O R T T O S H A R E H O L D E R S

Notes to Consolidated Financial Statements (continued)
Swap transactions involve, to varying degrees, elements of interest rate, credit and market risk in excess of the amounts recognized in the Consolidated Statement ofAssets and Liabilities. Such risks involve the possibility that there will be no liquid market for these agreements, that the counterparty to the agreements may default on itsobligation to perform or disagree as to the meaning of the contractual terms in the agreements, and that there may be unfavorable changes in interest rates and/or marketvalues associated with these transactions.
Master Netting Arrangements: In order to define its contractual rights and to secure rights that will help it mitigate its counterparty risk, the Fund may enter into anInternational Swaps and Derivatives Association, Inc. Master Agreement (“ISDA Master Agreement”) or similar agreement with its counterparties. An ISDA MasterAgreement is a bilateral agreement between the Fund and a counterparty that governs certain OTC derivatives and typically contains, among other things, collateralposting terms and netting provisions in the event of a default and/or termination event. Under an ISDA Master Agreement, the Fund may, under certain circumstances,offset with the counterparty certain derivative financial instruments’ payables and/or receivables with collateral held and/or posted and create one single net payment. Theprovisions of the ISDA Master Agreement typically permit a single net payment in the event of default including the bankruptcy or insolvency of the counterparty.Bankruptcy or insolvency laws of a particular jurisdiction may restrict or prohibit the right of offset in bankruptcy, insolvency or other events. In addition, certain ISDAMaster Agreements allow counterparties to terminate derivative contracts prior to maturity in the event the Fund’s net assets decline by a stated percentage or the Fundfails to meet the terms of its ISDA Master Agreements. The result would cause the Fund to accelerate payment of any net liability owed to the counterparty.
Collateral Requirements: For derivatives traded under an ISDA Master Agreement, the collateral requirements are typically calculated by netting the mark-to-marketamount for each transaction under such agreement and comparing that amount to the value of any collateral currently pledged by the Fund and the counterparty.
Cash collateral that has been pledged to cover obligations of the Fund and cash collateral received from the counterparty, if any, is reported separately on theConsolidated Statement of Assets and Liabilities as cash pledged as collateral and cash received as collateral, respectively. Non-cash collateral pledged by the Fund, ifany, is noted in the Consolidated Schedule of Investments. Generally, the amount of collateral due from or to a counterparty is subject to a certain minimum transferamount threshold before a transfer is required, which is determined at the close of business of the Fund. Any additional required collateral is delivered to/pledged by theFund on the next business day. Typically, the counterparty is not permitted to sell, re-pledge or use cash and non-cash collateral it receives. The Fund generally agreesnot to use non-cash collateral that it receives but may, absent default or certain other circumstances defined in the underlying ISDA Master Agreement, be permitted to usecash collateral received. In such cases, interest may be paid pursuant to the collateral arrangement with the counterparty. To the extent amounts due to the Fund from itscounterparties are not fully collateralized, it bears the risk of loss from counterparty non-performance. Likewise, to the extent the Fund has delivered collateral to acounterparty and stands ready to perform under the terms of its agreement with such counterparty, it bears the risk of loss from a counterparty in the amount of the valueof the collateral in the event the counterparty fails to return such collateral. Based on the terms of agreements, collateral may not be required for all derivative contracts.
For financial reporting purposes, the Fund does not offset derivative assets and derivative liabilities that are subject to netting arrangements, if any, in the ConsolidatedStatement of Assets and Liabilities.
6. INVESTMENT ADVISORY AGREEMENT AND OTHER TRANSACTIONS WITH AFFILIATES:
The PNC Financial Services Group, Inc. is the largest stockholder and an affiliate of BlackRock, Inc. (“BlackRock”) for 1940 Act purposes.
Investment Advisory: The Trust, on behalf of the Fund, entered into an Investment Advisory Agreement with the Manager, the Fund’s investment adviser, an indirect,wholly-owned subsidiary of BlackRock, to provide investment advisory and administrative services. The Manager is responsible for the management of the Fund’s portfolioand provides the personnel, facilities, equipment and certain other services necessary to the operations of the Fund.
For such services, the Fund pays the Manager a monthly fee at an annual rate equal to 0.75% of the average daily value of the Fund’s net assets.
The Manager provides investment management and other services to the Subsidiary. The Manager does not receive separate compensation from the Subsidiary forproviding investment management or administrative services. However, the Fund pays the Manager based on the Fund’s net assets, which includes the assets of theSubsidiary.
Service and Distribution Fees: The Fund entered into a Distribution Agreement and a Distribution and Service Plan with BlackRock Investments, LLC (“BRIL”), anaffiliate of the Manager. Pursuant to the Distribution and Service Plan and in accordance with Rule 12b-1 under the 1940 Act, the Fund pays BRIL ongoing service anddistribution fees. The fees are accrued daily and paid monthly at annual rates based upon the average daily net assets of the relevant share class of the Fund as follows:
Investor A Investor B Investor C Class R
Service Fee . . . . . . . . . . . . . . . . . . . . . . . . . . . . . . . . . . . . . . . . . . . . . . . . . . . . . . . . . . . . . . . . . . . . . . . . . . . . . . . . . . . . . 0.25% 0.25% 0.25% 0.25%Distribution Fee . . . . . . . . . . . . . . . . . . . . . . . . . . . . . . . . . . . . . . . . . . . . . . . . . . . . . . . . . . . . . . . . . . . . . . . . . . . . . . . . . . — 0.75% 0.75% 0.25%
BRIL and broker-dealers, pursuant to sub-agreements with BRIL, provide shareholder servicing and distribution services to the Fund. The ongoing service and/ordistribution fee compensates BRIL and each broker-dealer for providing shareholder servicing and/or distribution related services to the shareholders.
For the year ended October 31, 2017, the following table shows the class specific service and distribution fees borne directly by each share class of the Fund:
Investor A Investor B Investor C Class R Total
$32,289,492 $ 227,235 $92,135,177 $5,471,387 $130,123,291
Transfer Agent: Pursuant to written agreements, certain financial intermediaries, some of which may be affiliates, provide the Fund with sub-accounting, recordkeeping,sub-transfer agency and other administrative services with respect to sub-accounts they service. For these services, these entities receive an asset-based fee or an
N O T E S T O C O N S O L I D A T E D F I N A N C I A L S T A T E M E N T S 45

Notes to Consolidated Financial Statements (continued)
annual fee per shareholder account, which will vary depending on share class and/or net assets. For the year ended October 31, 2017, the Fund paid the followingamounts to affiliates of BlackRock in return for these services, which are included in transfer agent — class specific in the Consolidated Statement of Operations:
Institutional Investor A Investor C Total
$ 269,966 $ 12,619 $ 296 $282,881
The Manager maintains a call center that is responsible for providing certain shareholder services to the Fund. Shareholder services include responding to inquiries andprocessing subscriptions and redemptions based upon instructions from shareholders. For the year ended October 31, 2017, the Fund reimbursed the Manager thefollowing amounts for costs incurred in running the call center, which are included in transfer agent — class specific in the Consolidated Statement of Operations:
Institutional Investor A Investor B Investor C Class K Class R Total
$ 37,214 $223,221 $ 2,232 $143,545 $ 2,016 $6,335 $414,563
For the year ended October 31, 2017, the following table shows the class specific transfer agent fees borne directly by each class of the Fund:
Institutional Investor A Investor B Investor C Class K Class R Total
$13,653,510 $13,910,177 $ 70,182 $9,477,139 $ 4,291 $2,018,685 $39,133,984
Other Fees: For the year ended October 31, 2017, affiliates earned underwriting discounts, direct commissions and dealer concessions on sales of the Fund’s Investor AShares, which totaled $390,351.
For the year ended October 31, 2017, affiliates received CDSCs as follows:
Investor A Investor B Investor C Total
$ 136,292 $ 922 $ 508,018 $ 645,232
Expense Waivers and Reimbursements: Effective June 12, 2017, the Manager contractually agreed to waive a portion of its management fees payable by the Fundthrough February 28, 2019, so that such fee is reduced as a percentage of average daily net assets of the Fund as follows:
Rate Waived to
First $10 Billion . . . . . . . . . . . . . . . . . . . . . . . . . . . . . . . . . . . . . . . . . . . . . . . . . . . . . . . . . . . . . . . . . . . . . . . . . . . . . . . . . . . . . . . . . . . . . . . . . . . . . . . . . . . . . . . . 0.75%$10 Billion — $15 Billion . . . . . . . . . . . . . . . . . . . . . . . . . . . . . . . . . . . . . . . . . . . . . . . . . . . . . . . . . . . . . . . . . . . . . . . . . . . . . . . . . . . . . . . . . . . . . . . . . . . . . . . . . 0.69%$15 Billion — $20 Billion . . . . . . . . . . . . . . . . . . . . . . . . . . . . . . . . . . . . . . . . . . . . . . . . . . . . . . . . . . . . . . . . . . . . . . . . . . . . . . . . . . . . . . . . . . . . . . . . . . . . . . . . . 0.68%$20 Billion — $25 Billion . . . . . . . . . . . . . . . . . . . . . . . . . . . . . . . . . . . . . . . . . . . . . . . . . . . . . . . . . . . . . . . . . . . . . . . . . . . . . . . . . . . . . . . . . . . . . . . . . . . . . . . . . 0.67%$25 Billion — $30 Billion . . . . . . . . . . . . . . . . . . . . . . . . . . . . . . . . . . . . . . . . . . . . . . . . . . . . . . . . . . . . . . . . . . . . . . . . . . . . . . . . . . . . . . . . . . . . . . . . . . . . . . . . . 0.65%$30 Billion — $40 Billion . . . . . . . . . . . . . . . . . . . . . . . . . . . . . . . . . . . . . . . . . . . . . . . . . . . . . . . . . . . . . . . . . . . . . . . . . . . . . . . . . . . . . . . . . . . . . . . . . . . . . . . . . 0.63%$40 Billion — $60 Billion . . . . . . . . . . . . . . . . . . . . . . . . . . . . . . . . . . . . . . . . . . . . . . . . . . . . . . . . . . . . . . . . . . . . . . . . . . . . . . . . . . . . . . . . . . . . . . . . . . . . . . . . . 0.62%$60 Billion — $80 Billion . . . . . . . . . . . . . . . . . . . . . . . . . . . . . . . . . . . . . . . . . . . . . . . . . . . . . . . . . . . . . . . . . . . . . . . . . . . . . . . . . . . . . . . . . . . . . . . . . . . . . . . . . 0.61%Greater than $80 Billion . . . . . . . . . . . . . . . . . . . . . . . . . . . . . . . . . . . . . . . . . . . . . . . . . . . . . . . . . . . . . . . . . . . . . . . . . . . . . . . . . . . . . . . . . . . . . . . . . . . . . . . . . . 0.60%
Prior to June 12, 2017, the contractual waiver was voluntary. For the year ended October 31, 2017, the Manager waived $27,770,623, which is included in fees waivedand/or reimbursed by the Manager in the Consolidated Statement of Operations. This contractual waiver may be terminated upon 90 days’ notice by a majority of the non-interested directors of the Fund or by a vote of a majority of the outstanding voting securities of the Fund.
During the year ended October 31, 2017, the Manager reimbursed the Fund $2,389,679 for certain operating expenses which is included in fees waived and/or reimbursedby the Manager in the Consolidated Statement of Operations.
With respect to the Fund, the Manager voluntarily agreed to waive its investment advisory fees by the amount of investment advisory fees the Fund pays to the Managerindirectly through its investment in affiliated money market funds (the “affiliated money market fund waiver”). The amount of waivers and/or reimbursements of fees andexpenses made pursuant to the expense limitations, as applicable, will be reduced by the amount of the affiliated money market fund waiver. This amount is included infees waived by the Manager in the Consolidated Statement of Operations. For the year ended October 31, 2017, the Manager waived $11,298.
The Manager has contractually agreed to waive its investment advisory fee with respect to any portion of the Fund’s assets invested in affiliated equity and fixed-incomemutual funds and affiliated exchange-traded funds that have a contractual management fee, through February 28, 2019. The contractual agreement may be terminatedupon 90 days’ notice by a majority of the independent trustees who are not “interested persons” of the Fund, as defined in the 1940 Act (“Independent Trustees”) or by avote of a majority of the outstanding voting securities of the Fund. For the year ended October 31, 2017, the Fund waived $1,283,159 in investment advisory fees pursuantto these arrangements.
For the year ended October 31, 2017, the Fund reimbursed the Manager $425,740 for certain accounting services, which is included in accounting services in theConsolidated Statement of Operations.
Securities Lending: The U.S. Securities and Exchange Commission (“SEC”) has issued an exemptive order which permits BIM, an affiliate of the Manager, to serve assecurities lending agent for the Fund, subject to applicable conditions. As securities lending agent, BIM bears all operational costs directly related to securities lending. TheFund is responsible for expenses in connection with the investment of cash collateral received for securities on loan (the “collateral investment expenses”). The cashcollateral is invested in a private investment company managed by the Manager or its affiliates. However, BIM has agreed to cap the collateral investment expenses of theprivate investment company to an annual rate of 0.04%. The investment adviser to the private investment company will not charge any advisory fees with respect toshares purchased by the Fund. The private investment company in which the cash collateral has been invested may, under certain circumstances, impose a liquidity fee of
46 2 0 1 7 B L A C K R O C K A N N U A L R E P O R T T O S H A R E H O L D E R S

Notes to Consolidated Financial Statements (continued)
up to 2% on the value redeemed or temporarily restrict redemptions for up to 10 business days during a 90 day period, in the event that the private investment company’sweekly liquid assets fall below certain thresholds.
Securities lending income is equal to the total of income earned from the reinvestment of cash collateral, net of fees and other payments to and from borrowers ofsecurities, and less the collateral investment expenses. The Fund retains a portion of securities lending income and remits a remaining portion to BIM as compensation forits services as securities lending agent.
Pursuant to a securities lending agreement, the Fund retains 80% of securities lending income, and this amount retained can never be less than 70% of the total ofsecurities lending income plus the collateral investment expenses.
In addition, commencing the business day following the date that the aggregate securities lending income earned across the Equity-Bond Complex in a calendar yearexceeds a specified threshold, the Fund, pursuant to the securities lending agreement, will retain for the remainder of that calendar year securities lending income asfollows: 85% of securities lending income, and this amount retained can never be less than 70% of the total of securities lending income plus the collateral investmentexpenses.
The share of securities lending income earned by the Fund is shown as securities lending income — affiliated — net in the Consolidated Statement of Operations. For theyear ended October 31, 2017, the Fund paid BIM $1,248,620 for securities lending agent services.
Officers and Directors: Certain officers and/or directors of the Fund are officers and/or directors of BlackRock or its affiliates. The Fund reimburses the Manager for aportion of the compensation paid to the Fund’s Chief Compliance Officer, which is included in Officer and Directors in the Consolidated Statement of Operations.
Other Transactions: The Fund may purchase securities from, or sell securities to, an affiliated fund provided the affiliation is due solely to having a common investmentadviser, common officers, or common trustees. For the year ended October 31, 2017, the purchase and sale transactions and any net realized gains (losses) with anaffiliated fund in compliance with Rule 17a-7 under the 1940 Act were as follows:
Purchases SalesNet RealizedGain (Loss)
$13,811,080 $23,599,652 $10,196,054
7. PURCHASES AND SALES:
For the year ended October 31, 2017, purchases and sales of investments, including paydowns and excluding short-term securities, were as follows:
Purchases Sales
Non-U.S. Government Securities . . . . . . . . . . . . . . . . . . . . . . . . . . . . . . . . . . . . . . . . . . . . . . . . . . . . . . . . . . . . . . . . . . . . . . . . . . . . . . . . . . $16,360,277,179 $25,456,248,694U.S. Government Securities . . . . . . . . . . . . . . . . . . . . . . . . . . . . . . . . . . . . . . . . . . . . . . . . . . . . . . . . . . . . . . . . . . . . . . . . . . . . . . . . . . . . . . 23,870,417,124 22,337,477,772
8. INCOME TAX INFORMATION:
It is the Fund’s policy to comply with the requirements of the Internal Revenue Code of 1986, as amended, applicable to regulated investment companies, and to distributesubstantially all of its taxable income to its shareholders. Therefore, no U.S. federal income tax provision is required.
The Fund files U.S. federal and various state and local tax returns. No income tax returns are currently under examination. The statute of limitations on the Fund’s U.S.federal tax returns generally remains open for each of the four years ended October 31, 2017. The statutes of limitations on the Fund’s state and local tax returns mayremain open for an additional year depending upon the jurisdiction.
Management has analyzed tax laws and regulations and their application to the Fund as of October 31, 2017, inclusive of the open tax return years, and does not believethat there are any uncertain tax positions that require recognition of a tax liability in the Fund’s consolidated financial statements.
US GAAP requires that certain components of net assets be adjusted to reflect permanent differences between financial and tax reporting. These reclassifications have noeffect on net assets or net asset values per share. As of October 31, 2017, the following permanent differences attributable to foreign currency transactions, amortizationmethods on fixed income securities, income recognized from wholly owned subsidiary, the accounting for swap agreements, the classification of investment, the use ofequalization, income recognized from pass-through entities and the sale of stock of passive foreign investment companies were reclassified to the following accounts:
Paid-in capital . . . . . . . . . . . . . . . . . . . . . . . . . . . . . . . . . . . . . . . . . . . . . . . . . . . . . . . . . . . . . . . . . . . . . . . . . . . . . . . . . . . . . . . . . . . . . . . . . . . . . . . . . . . . . . . . . . $ 85,048,665Undistributed net investment income . . . . . . . . . . . . . . . . . . . . . . . . . . . . . . . . . . . . . . . . . . . . . . . . . . . . . . . . . . . . . . . . . . . . . . . . . . . . . . . . . . . . . . . . . . . . . . . . . 16,104,590Accumulated net realized gain . . . . . . . . . . . . . . . . . . . . . . . . . . . . . . . . . . . . . . . . . . . . . . . . . . . . . . . . . . . . . . . . . . . . . . . . . . . . . . . . . . . . . . . . . . . . . . . . . . . . . . (101,153,255)
The tax character of distributions paid was as follows:
10/31/17 10/31/16
Ordinary income . . . . . . . . . . . . . . . . . . . . . . . . . . . . . . . . . . . . . . . . . . . . . . . . . . . . . . . . . . . . . . . . . . . . . . . . . . . . . . . . . . . . . . . . . . . . . . . . . $393,498,865 $ 595,281,203Long-term capital gains(a) . . . . . . . . . . . . . . . . . . . . . . . . . . . . . . . . . . . . . . . . . . . . . . . . . . . . . . . . . . . . . . . . . . . . . . . . . . . . . . . . . . . . . . . . . . . 501,867,110 3,613,688,044
$895,365,975 $4,208,969,247
(a) Distribution amounts may include a portion of the proceeds from redeemed shares.
N O T E S T O C O N S O L I D A T E D F I N A N C I A L S T A T E M E N T S 47

Notes to Consolidated Financial Statements (continued)
As of October 31, 2017, the tax components of accumulated net earnings (losses) were as follows:
Undistributed ordinary income . . . . . . . . . . . . . . . . . . . . . . . . . . . . . . . . . . . . . . . . . . . . . . . . . . . . . . . . . . . . . . . . . . . . . . . . . . . . . . . . . . . . . . . . . . . . . . . . . . . . . $ 768,473,947Undistributed long-term capital gains . . . . . . . . . . . . . . . . . . . . . . . . . . . . . . . . . . . . . . . . . . . . . . . . . . . . . . . . . . . . . . . . . . . . . . . . . . . . . . . . . . . . . . . . . . . . . . . . 815,893,065Net unrealized gains(a) . . . . . . . . . . . . . . . . . . . . . . . . . . . . . . . . . . . . . . . . . . . . . . . . . . . . . . . . . . . . . . . . . . . . . . . . . . . . . . . . . . . . . . . . . . . . . . . . . . . . . . . . . . . 5,063,486,084
$6,647,853,096
(a) The difference between book-basis and tax-basis net unrealized gains was attributable primarily to the tax deferral of losses on wash sales and straddles, the realization for taxpurposes of unrealized gains/losses on certain futures, options and foreign currency contracts, the realization for tax purposes of unrealized gains on investments in passive foreigninvestment companies, amortization methods for premiums and discounts on fixed income securities, the accounting for swap agreements, the classification of investments and theinvestment in a wholly owned subsidiary.
As of October 31, 2017, gross unrealized appreciation and depreciation for investments and derivatives based on cost for U.S. federal income tax purposes were asfollows:
Tax cost . . . . . . . . . . . . . . . . . . . . . . . . . . . . . . . . . . . . . . . . . . . . . . . . . . . . . . . . . . . . . . . . . . . . . . . . . . . . . . . . . . . . . . . . . . . . . . . . . . . . . . . . . . . . . . . . . . . . $33,938,549,354
Gross unrealized appreciation . . . . . . . . . . . . . . . . . . . . . . . . . . . . . . . . . . . . . . . . . . . . . . . . . . . . . . . . . . . . . . . . . . . . . . . . . . . . . . . . . . . . . . . . . . . . . . . . . . . . $ 6,528,138,635Gross unrealized depreciation . . . . . . . . . . . . . . . . . . . . . . . . . . . . . . . . . . . . . . . . . . . . . . . . . . . . . . . . . . . . . . . . . . . . . . . . . . . . . . . . . . . . . . . . . . . . . . . . . . . . (1,278,272,491)
Net unrealized appreciation (depreciation) . . . . . . . . . . . . . . . . . . . . . . . . . . . . . . . . . . . . . . . . . . . . . . . . . . . . . . . . . . . . . . . . . . . . . . . . . . . . . . . . . . . . . . . . . . . $ 5,249,866,144
9. BANK BORROWINGS:
The Fund, along with certain other funds managed by the Manager and its affiliates (“Participating Funds”), is a party to a 364-day, $2.1 billion credit agreement with agroup of lenders. Under this agreement, the Fund may borrow to fund shareholder redemptions. Excluding commitments designated for certain individual funds, theParticipating Funds, including the Fund, can borrow up to an aggregate commitment amount of $1.6 billion at any time outstanding, subject to asset coverage and otherlimitations as specified in the agreement. The credit agreement has the following terms: a fee of 0.12% per annum on unused commitment amounts and interest at a rateequal to the higher of (a) one-month LIBOR (but, in any event, not less than 0.00%) on the date the loan is made plus 0.80% per annum or (b) the Fed Funds rate (but, inany event, not less than 0.00%) in effect from time to time plus 0.80% per annum on amounts borrowed. The agreement expires in April 2018 unless extended or renewed.Participating Funds paid administration, legal and arrangement fees, which, if applicable, are included in miscellaneous expenses in the Consolidated Statement ofOperations. These fees were allocated among such funds based upon portions of the aggregate commitment available to them and relative net assets of ParticipatingFunds. During the year ended October 31, 2017, the Fund did not borrow under the credit agreement.
10. PRINCIPAL RISKS:
In the normal course of business, the Fund invests in securities or other instruments and may enter into certain transactions, and such activities subject the Fund tovarious risks, including among others, fluctuations in the market (market risk) or failure of an issuer to meet all of its obligations. The value of securities or otherinstruments may also be affected by various factors, including, without limitation: (i) general economy; (ii) overall market as well as local, regional or global political and/orsocial instability; (iii) regulation, taxation or international tax treaties between various countries; or (iv) currency, interest rate and price fluctuations. The Fund’s prospectusprovides details of the risks to which the Fund is subject.
The Fund may be exposed to prepayment risk, which is the risk that borrowers may exercise their option to prepay principal earlier than scheduled during periods ofdeclining interest rates, which would force the Fund to reinvest in lower yielding securities. The Fund may also be exposed to reinvestment risk, which is the risk thatincome from the Fund’s portfolio will decline if the Fund invests the proceeds from matured, traded or called fixed-income securities at market interest rates that are belowthe Fund portfolio’s current earnings rate.
On October 11, 2016, BlackRock implemented certain changes required by amendments to Rule 2a-7 under the 1940 Act, which governs the operations of U.S. moneymarket funds. The Fund may be exposed to additional risks when reinvesting cash collateral in money market funds that do not seek to maintain a stable NAV per share of$1.00 and which may be subject to redemption gates or liquidity fees under certain circumstances.
Valuation Risk: The market values of equities, such as common stocks and preferred securities or equity related investments, such as futures and options, may declinedue to general market conditions which are not specifically related to a particular company. They may also decline due to factors which affect a particular industry orindustries. The Fund may invest in illiquid investments and may experience difficulty in selling those investments in a timely manner at the price that it believes theinvestments are worth. Prices may fluctuate widely over short or extended periods in response to company, market or economic news. Markets also tend to move incycles, with periods of rising and falling prices. This volatility may cause the Fund’s NAV to experience significant increases or decreases over short periods of time. Ifthere is a general decline in the securities and other markets, the NAV of the Fund may lose value, regardless of the individual results of the securities and otherinstruments in which the Fund invests.
The price the Fund could receive upon the sale of any particular portfolio investment may differ from the Fund’s valuation of the investment, particularly for securities thattrade in thin or volatile markets or that are valued using a fair valuation technique or a price provided by an independent pricing service. Changes to significantunobservable inputs and assumptions (i.e., publicly traded company multiples, growth rate, time to exit) due to the lack of observable inputs may significantly impact theresulting fair value and therefore the Fund’s results of operations. As a result, the price received upon the sale of an investment may be less than the value ascribed by theFund, and the Fund could realize a greater than expected loss or lesser than expected gain upon the sale of the investment. The Fund’s ability to value its investmentsmay also be impacted by technological issues and/or errors by pricing services or other third party service providers.
48 2 0 1 7 B L A C K R O C K A N N U A L R E P O R T T O S H A R E H O L D E R S

Notes to Consolidated Financial Statements (continued)
Counterparty Credit Risk: Similar to issuer credit risk, the Fund may be exposed to counterparty credit risk, or the risk that an entity may fail to or be unable to performon its commitments related to unsettled or open transactions. The Fund manages counterparty credit risk by entering into transactions only with counterparties that theManager believes have the financial resources to honor their obligations and by monitoring the financial stability of those counterparties. Financial assets, which potentiallyexpose the Fund to market, issuer and counterparty credit risks, consist principally of financial instruments and receivables due from counterparties. The extent of theFund’s exposure to market, issuer and counterparty credit risks with respect to these financial assets is approximately their value recorded in the Consolidated Statementof Assets and Liabilities, less any collateral held by the Fund.
A derivative contract may suffer a mark-to-market loss if the value of the contract decreases due to an unfavorable change in the market rates or values of the underlyinginstrument. Losses can also occur if the counterparty does not perform under the contract.
The Fund’s risk of loss from counterparty credit risk on OTC derivatives is generally limited to the aggregate unrealized gain less the value of any collateral held by theFund.
For OTC options purchased, the Fund bears the risk of loss in the amount of the premiums paid plus the positive change in market values net of any collateral held by theFund should the counterparty fail to perform under the contracts. Options written by the Fund do not typically give rise to counterparty credit risk, as options writtengenerally obligate the Fund, and not the counterparty, to perform. The Fund may be exposed to counterparty credit risk with respect to options written to the extent theFund deposits collateral with its counterparty to a written option.
With exchange-traded options purchased and futures and centrally cleared swaps, there is less counterparty credit risk to the Fund since the exchange or clearinghouse,as counterparty to such instruments, guarantees against a possible default. The clearinghouse stands between the buyer and the seller of the contract; therefore, creditrisk is limited to failure of the clearinghouse. While offset rights may exist under applicable law, the Fund does not have a contractual right of offset against a clearingbroker or clearinghouse in the event of a default (including the bankruptcy or insolvency). Additionally, credit risk exists in exchange-traded futures and centrally clearedswaps with respect to initial and variation margin that is held in a clearing broker’s customer accounts. While clearing brokers are required to segregate customer marginfrom their own assets, in the event that a clearing broker becomes insolvent or goes into bankruptcy and at that time there is a shortfall in the aggregate amount of marginheld by the clearing broker for all its clients, typically the shortfall would be allocated on a pro rata basis across all the clearing broker’s customers, potentially resulting inlosses to the Fund.
Concentration Risk: The Fund invests a significant portion of its assets in fixed-income securities and/or uses derivatives tied to the fixed-income markets. Changes inmarket interest rates or economic conditions may affect the value and/or liquidity of such investments. Interest rate risk is the risk that prices of bonds and other fixed-income securities will increase as interest rates fall and decrease as interest rates rise. The Fund may be subject to a greater risk of rising interest rates due to the currentperiod of historically low rates.
The Fund invests a substantial amount of its assets in issuers located in a single country or a limited number of countries. When the Fund concentrates its investments inthis manner, it assumes the risk that economic, political and social conditions in those countries may have a significant impact on their investment performance. Foreignissuers may not be subject to the same uniform accounting, auditing and financial reporting standards and practices as used in the United States. Foreign securitiesmarkets may also be less liquid, more volatile, and less subject to governmental supervision not typically associated with investing in U.S. securities. Investmentpercentages in specific countries are presented in the Consolidated Schedule of Investments.
11. CAPITAL SHARE TRANSACTIONS:
Transactions in capital shares for each class were as follows:
Year Ended October 31,
2017 2016
Shares Amount Shares Amount
InstitutionalShares sold . . . . . . . . . . . . . . . . . . . . . . . . . . . . . . . . . . . . . . . . . . . . . . . . . . . . . . . . . . . . . . . . . . . . . 201,044,432 $ 3,870,155,574 207,256,970 $ 3,737,465,336Shares issued in reinvestment of distributions . . . . . . . . . . . . . . . . . . . . . . . . . . . . . . . . . . . . . . . . . . . . 17,345,735 319,335,255 84,341,321 1,500,432,396Shares redeemed . . . . . . . . . . . . . . . . . . . . . . . . . . . . . . . . . . . . . . . . . . . . . . . . . . . . . . . . . . . . . . . . . (300,404,285) (5,767,287,773) (433,648,405) (7,923,132,542)
Net decrease . . . . . . . . . . . . . . . . . . . . . . . . . . . . . . . . . . . . . . . . . . . . . . . . . . . . . . . . . . . . . . . . . . (82,014,118) $(1,577,796,944) (142,050,114) $(2,685,234,810)
Investor AShares sold . . . . . . . . . . . . . . . . . . . . . . . . . . . . . . . . . . . . . . . . . . . . . . . . . . . . . . . . . . . . . . . . . . . . . 122,059,376 $ 2,370,161,566 85,333,497 $ 1,537,657,237Shares issued in reinvestment of distributions . . . . . . . . . . . . . . . . . . . . . . . . . . . . . . . . . . . . . . . . . . . . 12,020,911 219,022,298 68,832,829 1,218,342,178Shares redeemed . . . . . . . . . . . . . . . . . . . . . . . . . . . . . . . . . . . . . . . . . . . . . . . . . . . . . . . . . . . . . . . . . (237,165,293) (4,540,701,435) (229,485,621) (4,155,813,569)
Net decrease . . . . . . . . . . . . . . . . . . . . . . . . . . . . . . . . . . . . . . . . . . . . . . . . . . . . . . . . . . . . . . . . . . (103,085,006) $(1,951,517,571) (75,319,295) $(1,399,814,154)
Investor BShares sold . . . . . . . . . . . . . . . . . . . . . . . . . . . . . . . . . . . . . . . . . . . . . . . . . . . . . . . . . . . . . . . . . . . . . 10,782 $ 200,009 23,808 $ 425,284Shares issued in reinvestment of distributions . . . . . . . . . . . . . . . . . . . . . . . . . . . . . . . . . . . . . . . . . . . . 20,992 373,456 757,798 13,087,172Shares redeemed . . . . . . . . . . . . . . . . . . . . . . . . . . . . . . . . . . . . . . . . . . . . . . . . . . . . . . . . . . . . . . . . . (3,157,422) (58,100,281) (7,493,425) (130,848,809)
Net decrease . . . . . . . . . . . . . . . . . . . . . . . . . . . . . . . . . . . . . . . . . . . . . . . . . . . . . . . . . . . . . . . . . . (3,125,648) $ (57,526,816) (6,711,819) $ (117,336,353)
N O T E S T O C O N S O L I D A T E D F I N A N C I A L S T A T E M E N T S 49

Notes to Consolidated Financial Statements (continued)
Year Ended October 31,
2017 2016
Shares Amount Shares Amount
Investor CShares sold . . . . . . . . . . . . . . . . . . . . . . . . . . . . . . . . . . . . . . . . . . . . . . . . . . . . . . . . . . . . . . . . . . . . . 16,858,128 $ 292,411,789 47,656,817 $ 776,118,876Shares issued in reinvestment of distributions . . . . . . . . . . . . . . . . . . . . . . . . . . . . . . . . . . . . . . . . . . . . 6,886,593 114,248,755 68,596,464 1,106,462,321Shares redeemed . . . . . . . . . . . . . . . . . . . . . . . . . . . . . . . . . . . . . . . . . . . . . . . . . . . . . . . . . . . . . . . . . (277,935,505) (4,834,568,055) (228,269,479) (3,759,925,232)
Net decrease . . . . . . . . . . . . . . . . . . . . . . . . . . . . . . . . . . . . . . . . . . . . . . . . . . . . . . . . . . . . . . . . . . (254,190,784) $(4,427,907,511) (112,016,198) $(1,877,344,035)
Class K(a)
Shares sold . . . . . . . . . . . . . . . . . . . . . . . . . . . . . . . . . . . . . . . . . . . . . . . . . . . . . . . . . . . . . . . . . . . . . 43,430,054 $ 850,443,402 38,679,074 $ 703,249,511Shares issued in reinvestment of distributions . . . . . . . . . . . . . . . . . . . . . . . . . . . . . . . . . . . . . . . . . . . . 782,469 14,478,283 — —Shares redeemed . . . . . . . . . . . . . . . . . . . . . . . . . . . . . . . . . . . . . . . . . . . . . . . . . . . . . . . . . . . . . . . . . (11,185,907) (221,810,674) (5,890,316) (106,392,764)
Net increase . . . . . . . . . . . . . . . . . . . . . . . . . . . . . . . . . . . . . . . . . . . . . . . . . . . . . . . . . . . . . . . . . . . 33,026,616 $ 643,111,011 32,788,758 $ 596,856,747
Class RShares sold . . . . . . . . . . . . . . . . . . . . . . . . . . . . . . . . . . . . . . . . . . . . . . . . . . . . . . . . . . . . . . . . . . . . . 8,135,005 $ 148,613,616 16,105,650 $ 277,453,802Shares issued in reinvestment of distributions . . . . . . . . . . . . . . . . . . . . . . . . . . . . . . . . . . . . . . . . . . . . 1,008,140 17,561,793 5,935,563 100,548,434Shares redeemed . . . . . . . . . . . . . . . . . . . . . . . . . . . . . . . . . . . . . . . . . . . . . . . . . . . . . . . . . . . . . . . . . (19,075,815) (348,548,055) (19,801,987) (341,637,739)
Net increase (decrease) . . . . . . . . . . . . . . . . . . . . . . . . . . . . . . . . . . . . . . . . . . . . . . . . . . . . . . . . . . (9,932,670) $ (182,372,646) 2,239,226 $ 36,364,497
Total Net Decrease . . . . . . . . . . . . . . . . . . . . . . . . . . . . . . . . . . . . . . . . . . . . . . . . . . . . . . . . . . . . . . (419,321,610) $(7,554,010,477) (301,069,442) $(5,446,508,108)
(a) Commencement of operations on June 8, 2016.
12. SUBSEQUENT EVENTS:
Management has evaluated the impact of all subsequent events on the Fund through the date the consolidated financial statements were issued and has determined thatthere were no subsequent events requiring adjustment or additional disclosure in the consolidated financial statements.
50 2 0 1 7 B L A C K R O C K A N N U A L R E P O R T T O S H A R E H O L D E R S

Report of Independent Registered Public Accounting Firm
To the Shareholders and Board of Directors ofBlackRock Global Allocation Fund, Inc.:
We have audited the accompanying consolidated statement of assets and liabilities of BlackRock Global Allocation Fund, Inc. and Subsidiary (the “Fund”), including theconsolidated schedule of investments, as of October 31, 2017, and the related consolidated statement of operations for the year then ended, the consolidated statementsof changes in net assets for each of the two years in the period then ended, and the consolidated financial highlights for each of the periods presented. These financialstatements and financial highlights are the responsibility of the Fund’s management. Our responsibility is to express an opinion on these financial statements and financialhighlights based on our audits.
We conducted our audits in accordance with the standards of the Public Company Accounting Oversight Board (United States). Those standards require that we plan andperform the audit to obtain reasonable assurance about whether the financial statements and financial highlights are free of material misstatement. The Fund is notrequired to have, nor were we engaged to perform, an audit of its internal control over financial reporting. Our audits included consideration of internal control over financialreporting as a basis for designing audit procedures that are appropriate in the circumstances, but not for the purpose of expressing an opinion on the effectiveness of theFund’s internal control over financial reporting. Accordingly, we express no such opinion. An audit also includes examining, on a test basis, evidence supporting theamounts and disclosures in the financial statements, assessing the accounting principles used and significant estimates made by management, as well as evaluating theoverall financial statement presentation. Our procedures included confirmation of securities owned as of October 31, 2017, by correspondence with the custodian, brokersand agent banks; when replies were not received from brokers or agent banks, we performed other auditing procedures. We believe that our audits provide a reasonablebasis for our opinion.
In our opinion, such consolidated financial statements and consolidated financial highlights referred to above present fairly, in all material respects, the consolidatedfinancial position of BlackRock Global Allocation Fund, Inc. and Subsidiary as of October 31, 2017, the consolidated results of their operations for the year then ended, theconsolidated changes in their net assets for each of the two years in the period then ended, and the consolidated financial highlights for each of the periods presented, inconformity with accounting principles generally accepted in the United States of America.
Deloitte & Touche LLP
Boston, Massachusetts
December 21, 2017
R E P O R T O F I N D E P E N D E N T R E G I S T E R E D P U B L I C A C C O U N T I N G F I R M 51

Important Tax Information (Unaudited)
The following information is provided with respect to the ordinary income distributions paid by BlackRock Global Allocation Fund, Inc. during the fiscal year endedOctober 31, 2017.
Payable Date 12/20/16 07/21/17
Qualified Dividend Income for Individuals(a) . . . . . . . . . . . . . . . . . . . . . . . . . . . . . . . . . . . . . . . . . . . . . . . . . . . . . . . . . . . . . . . . . . . . 85.46% 54.51%Dividends Qualifying for the Dividend Received Deduction for Corporations(a) . . . . . . . . . . . . . . . . . . . . . . . . . . . . . . . . . . . . . . . . . . . 62.53% 21.00%Federal Obligation Interest(b) . . . . . . . . . . . . . . . . . . . . . . . . . . . . . . . . . . . . . . . . . . . . . . . . . . . . . . . . . . . . . . . . . . . . . . . . . . . . . . . 7.41% 11.26%Interest-Related Dividends for Non-US Residents(c ) . . . . . . . . . . . . . . . . . . . . . . . . . . . . . . . . . . . . . . . . . . . . . . . . . . . . . . . . . . . . . . 19.53% 18.19%
(a) The Fund hereby designates the percentage indicated above or the maximum amount allowable by law.(b) The law varies in each state as to whether and what percentage of dividend income attributable to federal obligations is exempt from state income tax. We recommend that you
consult your tax advisor to determine if any portion of the dividends you received is exempt from state income taxes.(c) Represents the portion of the taxable ordinary income dividends eligible for exemption from US withholding tax for nonresident aliens and foreign corporations.
Additionally, the Fund distributed long-term capital gains of $0.149977 to shareholders of record on December 16, 2016.
52 2 0 1 7 B L A C K R O C K A N N U A L R E P O R T T O S H A R E H O L D E R S

Disclosure of Investment Advisory Agreement
The Board of Directors (the “Board,” the members of which are referred to as “Board Members”) of BlackRock Global Allocation Fund, Inc. (the “Fund”) met in person onApril 6, 2017 (the “April Meeting”) and May 9-10, 2017 (the “May Meeting”) to consider the approval of the investment advisory agreement (the “Advisory Agreement” or the“Agreement”) with BlackRock Advisors, LLC (the “Manager” or “BlackRock”), the Fund’s investment advisor.
Activities and Composition of the Board
On the date of the May Meeting, the Board consisted of thirteen individuals, eleven of whom were not “interested persons” of the Fund as defined in the InvestmentCompany Act of 1940, as amended (the “1940 Act”) (the “Independent Board Members”). The Board Members are responsible for the oversight of the operations of theFund and perform the various duties imposed on the directors of investment companies by the 1940 Act. The Independent Board Members have retained independentlegal counsel to assist them in connection with their duties. The Chair of the Board is an Independent Board Member. The Board has established five standing committees:an Audit Committee, a Governance and Nominating Committee, a Compliance Committee, a Performance Oversight Committee and an Executive Committee, each ofwhich is chaired by an Independent Board Member and composed of Independent Board Members (except for the Performance Oversight Committee and the ExecutiveCommittee, each of which also has one interested Board Member).
The Agreement
Pursuant to the 1940 Act, the Board is required to consider the continuation of the Agreement on an annual basis. The Board has four quarterly meetings per year, eachextending over two days, a fifth one-day meeting to consider specific information surrounding the consideration of renewing the Agreement and additional in-person andtelephonic meetings as needed. In connection with this year-long deliberative process, the Board assessed, among other things, the nature, extent and quality of theservices provided to the Fund by BlackRock, BlackRock’s personnel and affiliates, including (as applicable): investment management; administrative and shareholderservices; the oversight of fund service providers; marketing; risk oversight; compliance; and ability to meet applicable legal and regulatory requirements.
The Board, acting directly and through its committees, considers at each of its meetings, and from time to time as appropriate, factors that are relevant to its annualconsideration of the renewal of the Agreement, including the services and support provided by BlackRock to the Fund and its shareholders. BlackRock also furnishedadditional information to the Board in response to specific questions from the Board. This additional information is discussed further below in the section titled “BoardConsiderations in Approving the Agreement.” Among the matters the Board considered were: (a) investment performance for one-year, three-year, five-year, ten-year,and/or since inception periods, as applicable, against peer funds, applicable benchmark, and performance metrics, as applicable, as well as senior management’s andportfolio managers’ analysis of the reasons for any over-performance or underperformance relative to its peers, benchmarks, and other performance metrics, asapplicable; (b) fees, including advisory, administration, if applicable, and other amounts paid to BlackRock and its affiliates by the Fund for services; (c) Fund operatingexpenses and how BlackRock allocates expenses to the Fund; (d) the resources devoted to, risk oversight of, and compliance reports relating to, implementation of theFund’s investment objective(s), policies and restrictions, and meeting regulatory requirements; (e) the Fund’s adherence to its compliance policies and procedures; (f) thenature, cost and character of non-investment management services provided by BlackRock and its affiliates; (g) BlackRock’s and other service providers’ internal controlsand risk and compliance oversight mechanisms; (h) BlackRock’s implementation of the proxy voting policies approved by the Board; (i) the use of brokerage commissionsand execution quality of portfolio transactions; (j) BlackRock’s implementation of the Fund’s valuation and liquidity procedures; (k) an analysis of management fees forproducts with similar investment mandates across the open-end fund, exchange-traded fund (“ETF”), closed-end fund, sub-advised mutual fund, separately managedaccount, collective investment trust, and institutional separate account product channels, as applicable, and the similarities and differences between these products andthe services provided as compared to the Fund; (l) BlackRock’s compensation methodology for its investment professionals and the incentives and accountability itcreates, along with investment professionals’ investments in the fund(s) they manage; and (m) periodic updates on BlackRock’s business.
Board Considerations in Approving the Agreement
The Approval Process: Prior to the April Meeting, the Board requested and received materials specifically relating to the Agreement. The Board is continuously engagedin a process with its independent legal counsel and BlackRock to review the nature and scope of the information provided to better assist its deliberations. The materialsprovided in connection with the April Meeting included (a) information independently compiled and prepared by Broadridge Financial Solutions, Inc. (“Broadridge”) on Fundfees and expenses as compared with a peer group of funds as determined by Broadridge (“Expense Peers”) and the investment performance of the Fund as comparedwith a peer group of funds as determined by Broadridge(a); (b) information on the profits realized by BlackRock and its affiliates pursuant to the Agreement and adiscussion of fall-out benefits to BlackRock and its affiliates; (c) a general analysis provided by BlackRock concerning investment management fees charged to otherclients, such as institutional clients, sub-advised mutual funds, ETFs, closed-end funds, and separately managed accounts, under similar investment mandates, as well asthe performance of such other clients, as applicable; (d) review of non-management fees; (e) the existence, impact and sharing of potential economies of scale; (f) asummary of aggregate amounts paid by the Fund to BlackRock; and (g) sales and redemption data regarding the Fund’s shares.
At the April Meeting, the Board reviewed materials relating to its consideration of the Agreement. As a result of the discussions that occurred during the April Meeting, andas a culmination of the Board’s year-long deliberative process, the Board presented BlackRock with questions and requests for additional information. BlackRockresponded to these requests with additional written information in advance of the May Meeting.
At the May Meeting, the Board, including the Independent Board Members, approved the continuation of the Advisory Agreement between the Manager and the Fund for aone-year term ending June 30, 2018. In approving the continuation of the Agreement, the Board considered: (a) the nature, extent and quality of the services provided byBlackRock; (b) the investment performance of the Fund; (c) the advisory fee and the cost of the services and profits to be realized by BlackRock and its affiliates from theirrelationship with the Fund; (d) the Fund’s costs to investors compared to the costs of Expense Peers and performance compared to the relevant performance metrics aspreviously discussed; (e) the sharing of potential economies of scale; (f) fall-out benefits to BlackRock and its affiliates as a result of its relationship with the Fund; and(g) other factors deemed relevant by the Board Members.
(a) Funds are ranked by Broadridge in quartiles, ranging from first to fourth, where first is the most desirable quartile position and fourth is the least desirable.
D I S C L O S U R E O F I N V E S T M E N T A D V I S O R Y A G R E E M E N T 53

Disclosure of Investment Advisory Agreement (continued)
The Board also considered other matters it deemed important to the approval process, such as other payments made to BlackRock or its affiliates, securities lending andcash management, services related to the valuation and pricing of Fund portfolio holdings, and materials submitted for the Board’s review. The Board noted the willingnessof BlackRock personnel to engage in open, candid discussions with the Board. The Board did not identify any particular information as determinative, and each BoardMember may have attributed different weights to the various items considered.
A. Nature, Extent and Quality of the Services Provided by BlackRock: The Board, including the Independent Board Members, reviewed the nature, extent and qualityof services provided by BlackRock, including the investment advisory services and the resulting performance of the Fund. Throughout the year, the Board compared Fundperformance to the performance of a comparable group of mutual funds, a relevant benchmark, and performance metrics, as applicable. The Board met with BlackRock’ssenior management personnel responsible for investment activities, including the senior investment officers. The Board also reviewed the materials provided by the Fund’sportfolio management team discussing the Fund’s performance and the Fund’s investment objective(s), strategies and outlook.
The Board considered, among other factors, with respect to BlackRock: the number, education and experience of investment personnel generally and the Fund’s portfoliomanagement team; BlackRock’s research capabilities; investments by portfolio managers in the funds they manage; portfolio trading capabilities; use of technology;commitment to compliance; credit analysis capabilities; risk analysis and oversight capabilities; and the approach to training and retaining portfolio managers and otherresearch, advisory and management personnel. The Board engaged in a review of BlackRock’s compensation structure with respect to the Fund’s portfolio managementteam and BlackRock’s ability to attract and retain high-quality talent and create performance incentives.
In addition to investment advisory services, the Board considered the quality of the administrative and other non-investment advisory services provided to the Fund.BlackRock and its affiliates provide the Fund with certain administrative, shareholder and other services (in addition to any such services provided to the Fund by thirdparties) and officers and other personnel as are necessary for the operations of the Fund. In particular, BlackRock and its affiliates provide the Fund with administrativeservices including, among others: (i) preparing disclosure documents, such as the prospectus, the summary prospectus (as applicable), the statement of additionalinformation and periodic shareholder reports; (ii) oversight of daily accounting and pricing; (iii) preparing periodic filings with regulators; (iv) overseeing and coordinating theactivities of other service providers; (v) organizing Board meetings and preparing the materials for such Board meetings; (vi) providing legal and compliance support;(vii) furnishing analytical and other support to assist the Board in its consideration of strategic issues such as the merger, consolidation or repurposing of certain open-endfunds; and (viii) performing other administrative functions necessary for the operation of the Fund, such as tax reporting, fulfilling regulatory filing requirements and callcenter services. The Board reviewed the structure and duties of BlackRock’s fund administration, shareholder services, and legal & compliance departments andconsidered BlackRock’s policies and procedures for assuring compliance with applicable laws and regulations.
B. The Investment Performance of the Fund and BlackRock: The Board, including the Independent Board Members, also reviewed and considered the performancehistory of the Fund. In preparation for the April Meeting, the Board was provided with reports independently prepared by Broadridge, which included a comprehensiveanalysis of the Fund’s performance. The Board also reviewed a narrative and statistical analysis of the Broadridge data that was prepared by BlackRock. In connectionwith its review, the Board received and reviewed information regarding the investment performance of the Fund as compared to other funds in its applicable Broadridgecategory. The Board was provided with a description of the methodology used by Broadridge to select peer funds and periodically meets with Broadridge representativesto review its methodology. The Board was provided with information on the composition of the Broadridge performance universes and expense universes. The Board andits Performance Oversight Committee regularly review, and meet with Fund management to discuss, the performance of the Fund throughout the year.
In evaluating performance, the Board recognized that the performance data reflects a snapshot of a period as of a particular date and that selecting a differentperformance period could produce significantly different results. Further, the Board recognized that it is possible that long-term performance can be adversely affected byeven one period of significant underperformance so that a single investment decision or theme has the ability to affect long-term performance disproportionately.
The Board noted that for the one-, three- and five-year periods reported, the Fund ranked in the fourth, third and third quartiles, respectively, against its BroadridgePerformance Universe through December 31, 2016. The Board and BlackRock reviewed the Fund’s underperformance during these periods. The Board noted that theFund’s performance against its Broadridge Performance Universe improved, and the Fund’s Sharpe Ratio ranked in the second quartile for the one-year period against itsCompetitor Sampling, through February 28, 2017.
The Board and BlackRock discussed BlackRock’s strategy for improving the Fund’s investment performance. Discussions covered topics such as: investment risksundertaken by the Fund; performance attribution; the Fund’s investment personnel; and the resources appropriate to support the Fund’s investment processes.
C. Consideration of the Advisory/Management Fees and the Cost of the Services and Profits to be Realized by BlackRock and its Affiliates from their
Relationship with the Fund: The Board, including the Independent Board Members, reviewed the Fund’s contractual management fee rate compared with the otherfunds in its Broadridge category. The contractual management fee rate represents a combination of the advisory fee and any administrative fees, before taking intoaccount any reimbursements or fee waivers. The Board also compared the Fund’s total expense ratio, as well as its actual management fee rate, to those of other funds inits Broadridge category. The total expense ratio represents a fund’s total net operating expenses, including any 12b-1 or non 12b-1 service fees. The total expense ratiogives effect to any expense reimbursements or fee waivers that benefit a fund, and the actual management fee rate gives effect to any management fee reimbursementsor waivers that benefit a fund. The Board considered the services provided and the fees charged by BlackRock and its affiliates to other types of clients with similarinvestment mandates, as applicable, including institutional accounts and sub-advised mutual funds (including mutual funds sponsored by third parties).
The Board received and reviewed statements relating to BlackRock’s financial condition. The Board reviewed BlackRock’s profitability methodology and was also providedwith a profitability analysis that detailed the revenues earned and the expenses incurred by BlackRock for services provided to the Fund. The Board reviewed BlackRock’sprofitability with respect to the Fund and other funds the Board currently oversees for the year ended December 31, 2016 compared to available aggregate profitabilitydata provided for the prior two years. The Board reviewed BlackRock’s profitability with respect to certain other U.S. fund complexes managed by the Manager and/or itsaffiliates. The Board reviewed BlackRock’s assumptions and methodology of allocating expenses in the profitability analysis, noting the inherent limitations in allocatingcosts among various advisory products. The Board recognized that profitability may be affected by numerous factors including, among other things, fee waivers andexpense reimbursements by the Manager, the types of funds managed, precision of expense allocations and business mix. As a result, calculating and comparingprofitability at individual fund levels is difficult.
54 2 0 1 7 B L A C K R O C K A N N U A L R E P O R T T O S H A R E H O L D E R S

Disclosure of Investment Advisory Agreement (continued)
The Board noted that, in general, individual fund or product line profitability of other advisors is not publicly available. The Board reviewed BlackRock’s overall operatingmargin, in general, compared to that of certain other publicly-traded asset management firms. The Board considered the differences between BlackRock and these otherfirms, including the contribution of technology at BlackRock, BlackRock’s expense management, and the relative product mix.
In addition, the Board considered the cost of the services provided to the Fund by BlackRock, and BlackRock’s and its affiliates’ profits relating to the management anddistribution of the Fund and the other funds advised by BlackRock and its affiliates. As part of its analysis, the Board reviewed BlackRock’s methodology in allocating itscosts of managing the Fund, to the Fund. The Board may receive and review information from independent third parties as part of its annual evaluation. The Boardconsidered whether BlackRock has the financial resources necessary to attract and retain high quality investment management personnel to perform its obligations underthe Agreement and to continue to provide the high quality of services that is expected by the Board. The Board further considered factors including but not limited toBlackRock’s commitment of time, assumption of risk, and liability profile in servicing the Fund in contrast to what is required of BlackRock with respect to other productswith similar investment mandates across the open-end fund, ETF, closed-end fund, sub-advised mutual fund, separately managed account, collective investment trust, andinstitutional separate account product channels, as applicable.
The Board noted that the Fund’s contractual management fee rate ranked in the third quartile, and that the actual management fee rate and total expense ratio eachranked in the second quartile, relative to the Fund’s Expense Peers. The Board also noted that the Fund previously had an advisory fee arrangement that includedvoluntary breakpoints, in the form of an advisory fee waiver, that adjusted the fee rate downward as the size of the Fund increased above certain contractually specifiedlevels. In addition, after discussion between the Board, including the Independent Board Members, and BlackRock, the Board agreed to convert the advisory fee waiverfrom voluntary to contractual. The conversion was implemented on June 12, 2017.
D. Economies of Scale: The Board, including the Independent Board Members, considered the extent to which economies of scale might be realized as the assets of theFund increase, as well as the existence of expense caps, as applicable. The Board also considered the extent to which the Fund benefits from such economies in a varietyof ways, and whether there should be changes in the advisory fee rate or breakpoint structure in order to enable the Fund to more fully participate in these economies ofscale. The Board considered the Fund’s asset levels and whether the current fee schedule was appropriate. In its consideration, the Board Members took into account theexistence of any expense caps and further considered the continuation and/or implementation, as applicable, of such caps.
E. Other Factors Deemed Relevant by the Board Members: The Board, including the Independent Board Members, also took into account other ancillary or “fall-out”benefits that BlackRock or its affiliates may derive from their respective relationships with the Fund, both tangible and intangible, such as BlackRock’s ability to leverage itsinvestment professionals who manage other portfolios and risk management personnel, an increase in BlackRock’s profile in the investment advisory community, and theengagement of BlackRock’s affiliates as service providers to the Fund, including for administrative, distribution, securities lending and cash management services. TheBoard also considered BlackRock’s overall operations and its efforts to expand the scale of, and improve the quality of, its operations. The Board also noted thatBlackRock may use and benefit from third party research obtained by soft dollars generated by certain registered fund transactions to assist in managing all or a number ofits other client accounts.
In connection with its consideration of the Agreement, the Board also received information regarding BlackRock’s brokerage and soft dollar practices. The Board receivedreports from BlackRock which included information on brokerage commissions and trade execution practices throughout the year.
The Board noted the competitive nature of the open-end fund marketplace, and that shareholders are able to redeem their Fund shares if they believe that the Fund’s feesand expenses are too high or if they are dissatisfied with the performance of the Fund.
Conclusion
The Board, including the Independent Board Members, approved the continuation of the Advisory Agreement between the Manager and the Fund for a one-year termending June 30, 2018. Based upon its evaluation of all of the aforementioned factors in their totality, as well as other information, the Board, including the IndependentBoard Members, was satisfied that the terms of the Agreement were fair and reasonable and in the best interest of the Fund and its shareholders. In arriving at its decisionto approve the Agreement, the Board did not identify any single factor or group of factors as all-important or controlling, but considered all factors together, and differentBoard Members may have attributed different weights to the various factors considered. The Independent Board Members were also assisted by the advice of independentlegal counsel in making this determination. The contractual fee arrangements for the Fund reflect the results of several years of review by the Board Members andpredecessor Board Members, and discussions between such Board Members (and predecessor Board Members) and BlackRock. As a result, the Board Members’conclusions may be based in part on their consideration of these arrangements in prior years.
D I S C L O S U R E O F I N V E S T M E N T A D V I S O R Y A G R E E M E N T 55

Director and Officer Information
Independent Directors (a)
Name (b)
Year of Birth
Position(s) Held
(Length of Service) (c) Principal Occupation(s) During Past Five Years
Number of BlackRock-Advised
Registered Investment Companies
(“RICs”) Consisting of Investment
Portfolios (“Portfolios”) Overseen Public Directorships
Robert M. Hernandez
1944Chair of the Boardand Director(Since 2007)
Director, Vice Chairman and Chief Financial Officer ofUSX Corporation (energy and steel business) from 1991 to2001; Director, RTI International Metals, Inc. from 1990 to2015; Director, TE Connectivity (electronics) from 2006 to2012.
27 RICs consisting of 98 Portfolios Chubb Limited(insurance company);Eastman ChemicalCompany
James H. Bodurtha
1944Director(Since 2007)
Director, The China Business Group, Inc. (consulting andinvesting firm) from 1996 to 2013 and Executive VicePresident thereof from 1996 to 2003; Chairman of theBoard, Berkshire Holding Corporation since 1980; Director,ICI Mutual since 2010.
27 RICs consisting of 98 Portfolios None
Bruce R. Bond
1946Director(Since 2007)
Trustee and Member of the Governance Committee, StateStreet Research Mutual Funds from 1997 to 2005; BoardMember of Governance, Audit and Finance Committee,Avaya Inc. (computer equipment) from 2003 to 2007.
27 RICs consisting of 98 Portfolios None
Donald W. Burton
1944Director(Since 2007)
Managing General Partner, The Burton Partnership, LP(an investment partnership) from 1979 to 2017; ManagingGeneral Partner, The Burton Partnership (QP), LP (aninvestment partnership) since 2000; Managing GeneralPartner, The South Atlantic Venture Funds from 1983 to2012; Director, IDology, Inc. (technology solutions) since2006; Director, Knology, Inc. (telecommunications) from1996 to 2012; Director, Capital Southwest (financial) from2006 to 2012; Director, Burtons Grill (restaurant) since2013; Director, PDQ South Texas (restaurant) since 2013;Director, ITC/Talon (data) since 2015.
27 RICs consisting of 98 Portfolios None
Honorable Stuart E. Eizenstat
1943Director(Since 2007)
Partner and Head of International Practice, Covington andBurling LLP (law firm) since 2001; International AdvisoryBoard Member, The Coca-Cola Company from 2002 to2011; Advisory Board Member, Veracity Worldwide, LLC(risk management) from 2007 to 2012; Member of theInternational Advisory Board GML Ltd. (energy) since2003.
27 RICs consisting of 98 Portfolios Alcatel-Lucent(telecommunications);Global SpecialtyMetallurgical; UPSCorporation (deliveryservice); Ferroglobe(metals)
Henry Gabbay
1947Director(Since 2007)
Consultant, BlackRock, Inc. from 2007 to 2008; ManagingDirector, BlackRock, Inc. from 1989 to 2007; ChiefAdministrative Officer, BlackRock Advisors, LLC from1998 to 2007; President of BlackRock Funds andBlackRock Allocation Target Shares (formerly, BlackRockBond Allocation Target Shares) from 2005 to 2007 andTreasurer of certain closed-end funds in the BlackRockfund complex from 1989 to 2006.
27 RICs consisting of 98 Portfolios None
Lena G. Goldberg
1949Director(Since 2016)
Senior Lecturer, Harvard Business School since 2008;Executive Vice President, FMR LLC/Fidelity Investments(financial services) from 2007 to 2008, Executive VicePresident and General Counsel thereof from 2002 to 2007,Senior Vice President and General Counsel thereof from1999 to 2002, Vice President and General Counsel thereoffrom 1997 to 1999, Senior Vice President and DeputyGeneral Counsel thereof in 1997, and Vice President andCorporate Counsel thereof from 1996 to 1997; Partner,Sullivan & Worcester LLP from 1985 to 1996 andAssociate thereof from 1979 to 1985.
27 RICs consisting of 98 Portfolios None
56 2 0 1 7 B L A C K R O C K A N N U A L R E P O R T T O S H A R E H O L D E R S

Director and Officer Information (continued)
Independent Directors (a)
Name (a)
Year of Birth
Position(s) Held
(Length of Service) (c) Principal Occupation(s) During Past Five Years
Number of BlackRock-Advised
Registered Investment Companies
(“RICs”) Consisting of Investment
Portfolios (“Portfolios”) Overseen
Public
Directorships
Henry R. Keizer
1956Director(Since 2016)
Director, Park Indemnity Ltd. (captive insurer) since 2010;Director, MUFG Americas Holdings Corporation andMUFG Union Bank, N.A. (financial and bank holdingcompany) from 2014 to 2016; Director, Montpelier ReHoldings, Ltd. (publicly held property and casualreinsurance) from 2013 to 2015; Director, AmericanInstitute of Certified Public Accountants from 2009 to2011; Director, KPMG LLP (audit, tax and advisoryservices) from 2004 to 2005 and 2010 to 2012; Director,KPMG International in 2012, Deputy Chairman and ChiefOperating Officer thereof from 2010 to 2012 and U.S. ViceChairman of Audit thereof from 2005 to 2010; Global Headof Audit, KPMGI (consortium of KPMG firms) from 2006 to2010; Director, YMCA of Greater New York from 2006 to2010.
27 RICs consisting of 98 Portfolios Hertz GlobalHoldings (carrental);WABCO(commercialvehicle safetysystems)
John F. O'Brien
1943Director(Since 2007)
Trustee, Woods Hole Oceanographic Institute since 2003and Chairman thereof from 2009 to 2015; Co-Founder andManaging Director, Board Leaders LLC (directoreducation) since 2005.
27 RICs consisting of 98 Portfolios CabotCorporation(chemicals);LKQCorporation(auto partsmanufacturing);TJXCompanies,Inc. (retailer)
Donald C. Opatrny
1952Director(Since 2015)
Trustee, Member of the Executive Committee and Chair ofthe Investment Committee, Cornell University since 2004;Member of the Board and Investment Committee,University School since 2007; Member of the InvestmentCommittee, Mellon Foundation from 2009 to 2015;President and Trustee, the Center for the Arts, JacksonHole since 2011; Director, Athena Capital Advisors LLC(investment management firm) since 2013; Trustee andChair of the Investment Committee, CommunityFoundation of Jackson Hole since 2014; Trustee, Artstor(a Mellon Foundation affiliate) from 2010 to 2015;President, Trustee and Member of the InvestmentCommittee, The Aldrich Contemporary Art Museum from2007 to 2014.
27 RICs consisting of 98 Portfolios None
Roberta Cooper Ramo
1942Director(Since 2007)
Shareholder and Attorney, Modrall, Sperling, Roehl, Harris& Sisk, P.A. (law firm) since 1993; Director, ECMC Group(service provider to students, schools and lenders) since2001; President, The American Law Institute (non-profit)since 2008; Vice President, Santa Fe Opera (non-profit)since 2011; Chair, Think New Mexico (non-profit) since2013; Chairman of the Board, Cooper’s Inc. (retail) from1999 to 2011.
27 RICs consisting of 98 Portfolios None
D I R E C T O R A N D O F F I C E R I N F O R M A T I O N 57

Director and Officer Information (continued)
Interested Directors (d)
Name (b)
Year of Birth
Position(s) Held
(Length of Service) (c) Principal Occupation(s) During Past Five Years
Number of BlackRock-Advised
Registered Investment Companies
(“RICs”) Consisting of Investment
Portfolios (“Portfolios”) Overseen
Public
Directorships
Robert Fairbairn
1965Director(Since 2015)
Senior Managing Director of BlackRock, Inc. since2010; Global Head of BlackRock’s Retail and iShares®
businesses since 2012; Member of BlackRock’sGlobal Executive and Global Operating Committees;Head of BlackRock’s Global Client Group from 2009 to2012; Chairman of BlackRock’s internationalbusinesses from 2007 to 2010.
27 RICs consisting of 98 Portfolios None
John M. Perlowski
1964Director(Since 2015),President and ChiefExecutive Officer(Since 2010)
Managing Director of BlackRock, Inc. since 2009;Head of BlackRock Global Fund & AccountingServices since 2009; Managing Director and ChiefOperating Officer of the Global Product Group atGoldman Sachs Asset Management, L.P. from 2003to 2009; Treasurer of Goldman Sachs Mutual Fundsfrom 2003 to 2009 and Senior Vice President thereoffrom 2007 to 2009; Director of Goldman SachsOffshore Funds from 2002 to 2009; Advisory Directorof Family Resource Network (charitable foundation)since 2009.
127 RICs consisting of 316 Portfolios None
(a) The address of each Director is c/o BlackRock, Inc., 55 East 52nd Street, New York, NY 10055.(b) Each Independent Director holds office until his or her successor is duly elected and qualifies or until his or her earlier death, resignation, retirement or removal as provided by the Fund’s
by-laws or charter or statute, or until December 31 of the year in which he or she turns 75. The Board may determine to extend the terms of Independent Directors on a case-by-case basis,as appropriate. Interested Directors serve until their successor is duly elected and qualifies or until their earlier death, resignation, retirement or removal as provided by the Trust’s/Fund’s by-laws or statute, or until December 31 of the year in which they turn 72.
(c) Following the combination of Merrill Lynch Investment Managers, L.P. (“MLIM”) and BlackRock, Inc. in September 2006, the various legacy MLIM and legacy BlackRock fund boards wererealigned and consolidated into three new fund boards in 2007. As a result, although the chart shows certain Independent Directors as joining the Board in 2007, those Directors first becamemembers of the boards of other legacy MLIM or legacy BlackRock funds as follows: James H. Bodurtha, 1995; Bruce R. Bond, 2005; Donald W. Burton, 2002; Honorable Stuart E. Eizenstat,2001; Robert M. Hernandez, 1996; John F. O’Brien, 2005; and Roberta Cooper Ramo, 1999.
(d) Messrs. Fairbairn and Perlowski are both “interested persons,” as defined in the 1940 Act, of the Fund based on their positions with BlackRock, Inc. and its affiliates. Mr. Perlowski is also aboard member of the BlackRock Closed-End Complex and the BlackRock Equity-Liquidity Complex.
58 2 0 1 7 B L A C K R O C K A N N U A L R E P O R T T O S H A R E H O L D E R S

Director and Officer Information (continued)
Officers Who Are Not Directors (a)
Name (b)
Year of Birth
Position(s) Held
(Length of Service) Principal Occupation(s) During Past Five Years
Jennifer McGovern
1977Vice President(Since 2014)
Managing Director of BlackRock, Inc. since 2016; Director of BlackRock, Inc. from 2011 to 2015; Head of Product Structureand Oversight for BlackRock’s U.S. Wealth Advisory Group since 2013; Vice President of BlackRock, Inc. from 2008 to 2010.
Neal J. Andrews
1966Chief Financial Officer(Since 2007)
Managing Director of BlackRock, Inc. since 2006; Senior Vice President and Line of Business Head of Fund Accountingand Administration at PNC Global Investment Servicing (U.S.) Inc. from 1992 to 2006.
Jay M. Fife
1970Treasurer(Since 2007)
Managing Director of BlackRock, Inc. since 2007; Director of BlackRock, Inc. in 2006; Assistant Treasurer of the MLIM andFund Asset Management, L.P. advised funds from 2005 to 2006; Director of MLIM Fund Services Group from 2001 to 2006.
Charles Park
1967Chief Compliance Officer(Since 2014)
Anti-Money Laundering Compliance Officer for the BlackRock-advised Funds in the Equity-Bond Complex, the Equity-Liquidity Complex and the Closed-End Complex from 2014 to 2015; Chief Compliance Officer of BlackRock Advisors, LLCand the BlackRock-advised Funds in the Equity-Bond Complex, the Equity-Liquidity Complex and the Closed-End Complexsince 2014; Principal of and Chief Compliance Officer for iShares® Delaware Trust Sponsor LLC since 2012 andBlackRock Fund Advisors (“BFA”) since 2006; Chief Compliance Officer for the BFA-advised iShares® exchange tradedfunds since 2006; Chief Compliance Officer for BlackRock Asset Management International Inc. since 2012.
Fernanda Piedra
1969Anti-Money LaunderingCompliance Officer(Since 2015)
Director of BlackRock, Inc. since 2014; Anti-Money Laundering Compliance Officer and Regional Head of Financial Crimefor the Americas at BlackRock, Inc. since 2014; Head of Regulatory Changes and Remediation for the Asset WealthManagement Division of Deutsche Bank from 2010 to 2014; Vice President of Goldman Sachs (Anti-Money Laundering/Suspicious Activities Group) from 2004 to 2010.
Benjamin Archibald
1975Secretary(Since 2012)
Managing Director of BlackRock, Inc. since 2014; Director of BlackRock, Inc. from 2010 to 2013; Secretary of the iShares®
exchange traded funds since 2015; Secretary of the BlackRock-advised mutual funds since 2012.(a) The address of each Officer is c/o BlackRock, Inc., 55 East 52nd Street, New York, NY 10055.(b) Officers of the Fund serve at the pleasure of the Board.
Further information about the Fund's Directors and Officers is available in the Fund's Statement of Additional Information, which can be obtained without charge by calling (800) 441-7762.
Investment Adviser Custodian
BlackRock Advisors, LLC Brown Brothers Harriman & Co.Wilmington, DE 19809 Boston, MA 02109
Accounting Agent Transfer Agent
State Street Bank and Trust Company BNY Mellon Investment Servicing (U.S.) Inc.Boston, MA 02111 Wilmington, DE 19809
Independent Registered Public Accounting Firm
Deloitte & Touche LLPBoston, MA 02116
Distributor
BlackRock Investments, LLCNew York, NY 10022
Legal Counsel
Willkie Farr & Gallagher LLPNew York, NY 10019
Address of the Fund
100 Bellevue ParkwayWilmington, DE 19809
D I R E C T O R A N D O F F I C E R I N F O R M A T I O N 59

Additional Information
General Information
Householding
The Fund will mail only one copy of shareholder documents, including prospectuses, annual and semi-annual reports and proxy statements, to shareholders with multipleaccounts at the same address. This practice is commonly called “householding” and is intended to reduce expenses and eliminate duplicate mailings of shareholderdocuments. Mailings of your shareholder documents may be householded indefinitely unless you instruct us otherwise. If you do not want the mailing of these documentsto be combined with those for other members of your household, please call the Fund at (800) 441-7762.
Availability of Quarterly Schedule of Investments
The Fund files its complete schedule of portfolio holdings with the SEC for the first and third quarters of each fiscal year on Form N-Q. The Fund’s Forms N-Q are availableon the SEC’s website at http://www.sec.gov and may also be reviewed and copied at the SEC’s Public Reference Room in Washington, DC. Information on the operationof the Public Reference Room or how to access documents on the SEC’s website without charge may be obtained by calling (800) SEC-0330. The Fund’s Forms N-Q mayalso be obtained upon request and without charge by calling (800) 441-7762.
Availability of Proxy Voting Policies and Procedures
A description of the policies and procedures that the Fund uses to determine how to vote proxies relating to portfolio securities is available upon request and withoutcharge (1) by calling (800) 441-7762; (2) at http://www.blackrock.com; and (3) on the SEC’s website at http://www.sec.gov.
Availability of Proxy Voting Record
Information about how the Fund voted proxies relating to securities held in the Fund’s portfolio during the most recent 12-month period ended June 30 is available uponrequest and without charge (1) at http://www.blackrock.com or by calling (800) 441-7762 and (2) on the SEC’s website at http://www.sec.gov.
BlackRock’s Mutual Fund Family
BlackRock offers a diverse lineup of open-end mutual funds crossing all investment styles and managed by experts in equity, fixed income and tax-exempt investing. Visithttp://www.blackrock.com for more information.
Shareholder Privileges
Account Information
Call us at (800) 441-7762 from 8:00 AM to 6:00 PM ET on any business day to get information about your account balances, recent transactions and share prices. Youcan also reach us on the Web at http://www.blackrock.com/funds.
Automatic Investment Plans
Investor Class shareholders who want to invest regularly can arrange to have $50 or more automatically deducted from their checking or savings account and invested inany of the BlackRock funds.
Systematic Withdrawal Plans
Investor Class shareholders can establish a systematic withdrawal plan and receive periodic payments of $50 or more from their BlackRock funds, as long as their accountbalance is at least $10,000.
Retirement Plans
Shareholders may make investments in conjunction with Traditional, Rollover, Roth, Coverdell, Simple IRAs, SEP IRAs and 403(b) Plans.
60 2 0 1 7 B L A C K R O C K A N N U A L R E P O R T T O S H A R E H O L D E R S

Additional Information (continued)
BlackRock Privacy Principles
BlackRock is committed to maintaining the privacy of its current and former fund investors and individual clients (collectively, “Clients”) and to safeguarding their non-publicpersonal information. The following information is provided to help you understand what personal information BlackRock collects, how we protect that information and whyin certain cases we share such information with select parties.
If you are located in a jurisdiction where specific laws, rules or regulations require BlackRock to provide you with additional or different privacy-related rights beyond what isset forth below, then BlackRock will comply with those specific laws, rules or regulations.
BlackRock obtains or verifies personal non-public information from and about you from different sources, including the following: (i) information we receive from you or, ifapplicable, your financial intermediary, on applications, forms or other documents; (ii) information about your transactions with us, our affiliates, or others; (iii) informationwe receive from a consumer reporting agency; and (iv) from visits to our websites.
BlackRock does not sell or disclose to non-affiliated third parties any non-public personal information about its Clients, except as permitted by law or as is necessary torespond to regulatory requests or to service Client accounts. These non-affiliated third parties are required to protect the confidentiality and security of this information andto use it only for its intended purpose.
We may share information with our affiliates to service your account or to provide you with information about other BlackRock products or services that may be of interestto you. In addition, BlackRock restricts access to non-public personal information about its Clients to those BlackRock employees with a legitimate business need for theinformation. BlackRock maintains physical, electronic and procedural safeguards that are designed to protect the non-public personal information of its Clients, includingprocedures relating to the proper storage and disposal of such information.
A D D I T I O N A L I N F O R M A T I O N 61

Glossary of Terms Used in this Report
Portfolio Abbreviations
ADR American Depositary Receipts
AUD Australian Dollar
BRL Brazilian Real
CAD Canadian Dollar
CLP Chilean Peso
ETF Exchange-Traded Fund
EUR Euro
EURIBOR Euro Interbank Offered Rate
GBP British Pound
HKD Hong Kong Dollar
JPY Japanese Yen
LIBOR London Interbank Offered Rate
MXN Mexican Peso
NOK Norwegian Krone
NVDR Non-voting Depository Receipts
NZD New Zealand Dollar
OTC Over-the-Counter
PLN Polish Zloty
REIT Real Estate Investment Trust
SGD Singapore Dollar
USD U.S. Dollar
ZAR South African Rand
62 2 0 1 7 B L A C K R O C K A N N U A L R E P O R T T O S H A R E H O L D E R S

THIS PAGE INTENTIONALLY LEFT BLANK.

This report is intended for current holders. It is not authorized for use as an offer of sale or a solicitation of an offer to
buy shares of the Fund unless preceded or accompanied by the Fund’s current prospectus. Past performance results
shown in this report should not be considered a representation of future performance. Investment returns and
principal value of shares will fluctuate so that shares, when redeemed, may be worth more or less than their original
cost. Statements and other information herein are as dated and are subject to change.
Go paperless. . .It’s Easy, Economical and Green!Go to www.blackrock.com/edelivery
GA-10/17-AR