annual report - sgs.com · 2016 has been a productive year for ... anticipated in last year’s...
TRANSCRIPT
ANNUAL REPORT

SGS IS THE WORLD’S LEADING INSPECTION, VERIFICATION, TESTING AND CERTIFICATION COMPANY. BY WORKING WITH OUR CUSTOMERS AT EVERY STAGE OF THE SUPPLY CHAIN, WE HELP ENSURE THAT CONSUMERS ENJOY PRODUCTS AND SERVICES THAT ARE SAFE, COMPLIANT AND OF THE HIGHEST QUALITY.Our influence is all around you; from checking where the food on your plate is sourced, to ensuring the paint on your children’s toys is non-toxic. Our scope is enormous too: from bridges, buildings and engines to shoes, e-commerce and pharmaceuticals – we work quietly behind the scenesto ensure that everything is as it should be.
We pioneer cutting-edge technology and develop innovative new services to help our customers stay one step ahead of the competition. We create customised solutions to drive efficiency, optimise processes and enhance value propositions so that our customers and their clients benefit from the best expertise on the market.
Thanks to our work, the world we live in gets just a little bit better, safer and more sustainable every day.

SGS SERVICE
> Footwear and Leather Product Testing
CONSUMER BENEFIT
> Knowing that your shoes are really as good as they look

CONTENTS
2016 has been a productive year for SGS. The Group has successfully undertaken a major realignment of its business lines and regional structure, as anticipated in last year’s Annual Report.
The Group has also successfully begun to rebalance its portfolio, diversifying away from energy-related markets and substantially growing its revenues from non-energy-related services.
The digitalisation of SGS’ service offering continued to gather steam, with initiatives under the TIC 4.0 umbrella (e.g. e-commerce and data analytics) progressing well.
Even with these exciting changes, the fundamentals of SGS’ business model, which is firmly rooted in the Testing Inspection and Certification (TIC) industry, remain the same. What has been perceived however, in continually evolving market circumstances, is the opportunity for SGS to leverage its existing network in new and exciting ways.
Finally, you will notice that the Group’s journey towards a fully integrated report continues. Having integrated the Business Review and Corporate Sustainability Performance into last year’s Annual Report, the development of SGS’ Business Materiality Matrix brings the goal of integrated reporting a step closer this year (see page 101).
The complete Corporate Sustainability Report will be available online from 21 March 2017 at www.sgs.com/cs-report2016.

1. CHAIRMAN’S AND CEO’S LETTER TO SHAREHOLDERS 4
2. HIGHLIGHTS 10Financial Highlights 10
Revenue and Adjusted Operating Income by Business 11
Revenue by Region 11
Group Achievements 12
Business Highlights 12
Sustainability Highlights 13
Sustainability Ambitions 2020 13
3. SGS AT A GLANCE 16The World Leader 16
Our Vision 16
Our Values 16
Our Position in the Value Chain 18
SGS by Industry 20
The Business Benefits We Deliver 22
The Expert Services We Offer 23
4. BUSINESS LEADERSHIP 26Group Outlook 28
SGS BUSINESS MODEL 30
Strategic Focus 32
BRAND 36
GROWTH 38
Agriculture, Food and Life 41
Minerals 43
Oil, Gas and Chemicals 45
Consumer and Retail 47
Certification and Business Enhancement 49
Industrial 51
Environment, Health and Safety 53
Transportation 55
Governments and Institutions 57
Acquisitions 58
Strategic Partnerships 58
2016 Acquisitions and Strategic Partnerships 59
INNOVATION 60
EXPERTISE 62
INVESTMENT 64
OPERATIONAL EXCELLENCE 66
PROFESSIONAL EXCELLENCE 68Compliance and Integrity 69
SGS Human Rights Policy 70
Procurement 72
Customer Relationship Management 73
PEOPLE 74Talent Acquisition 75
Employee Retention 76
Diversity and Equal Opportunities 77
Operational Integrity 78
ENVIRONMENT 82
Emissions and Climate Change 83
Water and Waste Management 85
Energy Efficiency 86
COMMUNITY 88Community Programmes 89
SGS BUSINESS PRINCIPLES 92
SGS ADDED VALUE 94
Our Stakeholders 94
What Makes Us Stand Out? 96
Market Positioning 96
The TIC Industry Unmasked 96
Our Value to Society 97
5. MARKET RISKS 100Risk Management and Material Topics 100
Business Materiality Matrix 101
Risk Management Overview 102
6. GOVERNANCE 108Group Structure and Shareholders 109
Capital Structure 110
Board of Directors 110
Operations Council 117
Compensation, Shareholdings and Loans 121
Shareholders’ Participation Rights 122
Change of Control and Defence Measures 122
Auditors 122
Information Policy 123
7. REMUNERATION REPORT 126Introduction by the Nomination and Remuneration Committee 127
Company’s Remuneration Policy and Governance 128
Remuneration Model 131
Remuneration Awarded to the Board of Directors 138
Remuneration Awarded to the CEO, Senior Management and Other Members of the Operations Council 139
8. SGS GROUP RESULTS 146
9. SGS SA RESULTS 202
10. DATA 214
11. SHAREHOLDER INFORMATION 224

SGS SERVICE
> Supplier Quality Engineering
CONSUMER BENEFIT
> Products at the quality you expect

AT THE CUTTING EDGE OF QUALITY
New products always face challenges. Even when the design and performance of the prototypes is perfect, a lack of oversight in the manufacturing process can easily result in inconsistent quality in the end product. That can leave customers frustrated and companies with their reputations in tatters.
Our Supplier Quality Engineering (SQE) Solution for electrical and electronic products helps global brands and retailers minimise quality risks. At every stage, from the initial R&D and product development, to mass manufacturing, continuous improvement and the after-sales market, our engineers, auditors and inspectors identify and correct quality defects using advanced production monitoring techniques.
Moving deeper into the supply chain with cutting-edge technology, we can monitor the performance of our customers’ own suppliers. This allows us to lead improvements where necessary to ensure that these suppliers are consistently meeting our customers’ quality and production requirements.
This preventive upstream action can save significant costs later on. Meanwhile, for the consumer, it means they get the kind of quality they deserve and expect.

4
The SGS Group performed solidly in 2016. Total revenues reached CHF 6.0 billion, and SGS is on track to deliver the revenue growth projected in the 2020 strategic plan. The Group realised a revenue growth of 6.0% on a constant currency basis, of which 2.5% was organic and 3.5% was contributed by recent acquisitions. On a historical reported basis, Group revenue increased by 4.8%.
A new business structure was successfully implemented at the beginning of 2016, with the newly created Agriculture, Food and Life and Transportation business lines performing above expectations.
Representing 72% of the Group’s earnings, the non-energy businesses achieved strong organic revenue growth of 6.2%, driving Group performance. Environment, Health and Safety, with a revenue growth of 23.6% (of which 6.9% organic), enjoyed rapid growth in the hospitality segment. Transportation also performed strongly with double-digit growth at 12.9% (of which 7.9% organic), broadening its scope in the mobility sector through new programmes and the acquisition of new expertise. Governments and Institutions showed a notable performance with organic revenue growth of 10.0% on the back of solid Product Conformity Assessment performance. Certification
Dear Shareholders,
OVERVIEW
and Business Enhancement grew at 9.1% (entirely organic) while continuing to diversify its service portfolio with strong growth in training. Agriculture, Food and Life delivered solid revenue growth of 6.1% (of which 4.5% organic), significantly increasing its market share to become one of the world’s largest service providers through the creation of a complete supply chain solution. Consumer and Retail benefited from growth in the Chinese domestic market and e-commerce services.
However, energy-related markets remained challenging. Low oil prices, ongoing difficulties in the global gas markets and soft demand for minerals continued to impact demand, creating pricing pressure on services for Minerals, Industrial and Oil, Gas and Chemicals. In light of this, the Group undertook a number of restructuring measures, resulting in one-off expenses, including asset impairments, amounting to CHF 48.8 million (CHF 39.8 million net of taxes).
Adjusted EBITDA increased by 2.5% to reach CHF 1 198 million versus prior year on a constant currency basis. Adjusted operating income reached CHF 919 million versus CHF 898 million in prior year, an increase of 2.4% (constant currency basis). The adjusted operating income margin declined compared to prior year level (15.4%
versus 15.9% at constant currency). This was primarily attributable to pressure on energy-related business and the impact of investments in IT systems for laboratory operations and human resource management, as well as the development of new shared services infrastructure. Whilst initially dilutive to margins, these undertakings are expected to significantly improve the Group’s operating efficiency, and are an integral part of the transformation initiatives, which are at the heart of the 2016-2020 plan. The Group also achieved procurement savings in line with the strategic plan. In addition, the acquisitions of Accutest and Bateman generated lower short-term profitability, but will become margin accretive in the mid term.
Net financial expenses increased to CHF 45 million. The overall effective tax rate for the period was 24.0%.
Net income reached CHF 586 million, an increase of 4.5% (constant currency basis).
Profit attributable to equity holders reached CHF 543 million for the period, an increase of 3.0% over prior year (constant currency basis) and a decrease of 1.1% compared with the CHF 549 million disclosed in 2015 (historical reported basis).
The Group generated solid operating cash flow at CHF 1 014 million,
1. CHAIRMAN’S AND CEO’S LETTER TO SHAREHOLDERS

5
supported by strong Net Working Capital performance. Net Working Capital is at a historical low despite a shift to more capital intensive project-related work. Net investments in fixed assets were CHF 276 million and the Group completed 19 acquisitions during the period for a total cash consideration payable of CHF 193 million. In 2016, the Group paid a dividend of CHF 517 million and financed a share buyback for a net amount of CHF 161 million.
At 31 December 2016, the Group’s net debt position amounted to CHF 736 million, compared with a net debt position of CHF 482 million at 31 December 2015.
ACQUISITIONS AND STRATEGIC PARTNERSHIPS
The Group completed 19 acquisitions and made two strategic investments in 2016. Business and services expansion continued worldwide with a particular focus on growing operations in China and North America to align with strategic growth objectives. These acquisitions span several business lines, including: Agriculture, Food and Life; Transportation; Industrial; Oil, Gas and Chemicals; Minerals; Environment, Health and Safety; and Consumer and Retail. When combined, these acquisitions added CHF 135 million to the Group’s revenue and CHF 10 million to the operating income in 2016.
Acquisitions completed in 2016 include: Accutest Laboratories in the USA, the fifth largest full service environmental testing company in the United States; Bateman Projects in Africa, specialists in process plant design and site engineering services; Compliance Certification Services Inc., one of China’s leading Electro Magnetic Compatibility (EMC) testing laboratories, with operations across Taiwan and China; CyberMetrix Inc. in the USA, providing test cells, equipment, and services to meet the complex testing requirements of engine and power systems; and Laboratorios Contecon Urbar in Colombia and Panama, an independent materials testing business focusing on quality control for the construction industry.
The Group continued to pursue smaller equity stakes in certain strategic technology companies as illustrated by the recent partnerships with Transparency-One, which provides a platform for supply chain visibility and business risk management, and AgFlow SA, which operates an innovative trade intelligence platform, aggregating over-the-counter (OTC) market data on global grains, oilseeds/proteins and edible oils.
SIGNIFICANT MILESTONES
During the year, the Group made significant strides in the assessment
of its business portfolio to bring greater transparency on new growth projects and to identify non-performing business segments. The development of a strategic dashboard to assess business segments based on growth, margin, cash flow and strategic significance allows the Group to identify strengths and weaknesses more effectively.
SGS continued to develop its integrated reporting in support of its sustainability efforts with the creation of an enhanced materiality matrix, incorporating the assessment and findings of the annual risk review. The members of the Operations Council played an important role in this process by assessing the relative impacts of the materiality and business risks.
To benefit from economies of scale, a transformation of the support functions was launched in 2016. A governance model was established as a standard for future replication, the major financial back-office streams were identified and related processes redesigned to align with the new financial standard processes.
The year also witnessed the strengthening of the Group’s Business Principles and the evolution of policies that address a continually changing market and regulatory environment. An example is the anticipated introduction of the new SGS Human
1. CHAIRMAN’S AND CEO’S LETTER TO SHAREHOLDERS

6
Rights Statement and Code of Conduct for Suppliers. The new guidance will ensure that human rights are respected across all operations and at every step of the supply chain.
SUBSEQUENT EVENTS
The following acquisitions and strategic investments were completed after 31 December 2016: BF Machinery PTY LTD and CBF Engineering PTY LTD, providing testing, repair, engineering and maintenance services for pumps, valves, hydraulics and plastics systems in Australia; and Laboratoire LCA, offering analytical services, including soil fertility testing, to the agricultural sector in Morocco.
In support of the Testing, Inspection and Certification (TIC) 4.0 strategic initiative on digitalisation and data, the Group granted a loan of CHF 3 million to Sensima Inspection in Switzerland. The business provides testing services and equipment using a proprietary core technology based on electromagnetic response measurements (eddy currents) for non-destructive testing applications.
MANAGEMENT
Dominique Ben Dhaou, Senior Vice President of Human Resources, has decided to leave the Group after 15 years. Her replacement will be announced in due course.
SIGNIFICANT SHAREHOLDERS
As at 31 December 2016, Groupe Bruxelles Lambert acting through Serena SARL held 16.20% (2015: 15.00%). Mr. August von Finck and members of his family acting in concert held 15.03% (2015: 15.03%), the Bank of New York Mellon Corporation held 3.35% (2015: 3.35%), BlackRock, Inc. held 3.03% (2015: 3.03%) and MFS Investment Management held 3.01% (2015: 3.01%) of the share capital and voting rights of the Company.
At the same date, the SGS Group held 3.63% of the share capital of the Company (2015: 2.77%).
DISTRIBUTION TO SHAREHOLDERS
The SGS Board of Directors will recommend to the Annual General Meeting, to be held on 21 March 2017, the approval of a dividend of CHF 70 per share.
NEW SHARE BUYBACK PROGRAMME
The SGS Board of Directors has authorised a new share buyback programme of up to CHF 250 million. Details will be announced in due time.
SUSTAINABILITY
Sustainable development is undergoing a pivotal change. The success of the Paris Agreement, the United Nation’s 17 Sustainable Development Goals and the UK’s Modern Slavery Act 2015,
provides a clear pathway for future global development, and the corporate sector is uniquely placed to help lead this process.
In 2016, significant improvements in the Group’s global safety performance, its CO2 emissions and investment in local communities served to highlight the major strides made towards its Sustainability Ambitions 2020. In addition, the Group maintained its status as a carbon neutral company, and began working towards its goal of having at least 30% of women in leadership positions.
For the third consecutive year, SGS was named the leading company in its industry by the Dow Jones Sustainability Indices (DJSI World and DJSI Europe). The Group has consolidated its position in financial sustainability indices and was also recognised as a global leader in responding to climate change, with a position on CDP’s Climate A List. CDP also named SGS as Industrials Sector Leader and Country Leader in the DACH (Germany, Austria and Switzerland) region.
The Leadership team continued to be actively engaged in the Group’s sustainability performance and participated extensively in key policy issues. For instance, the new Vehicle Emissions Policy will engage managers across the Group in helping to minimise CO2 emissions through their choice of fleet car.
1. CHAIRMAN’S AND CEO’S LETTER TO SHAREHOLDERS

7
It is only by leading by example through actions such as these that SGS can help the corporate sector build a more sustainable economy.
GUIDANCE 2017
The Group expects to deliver solid organic revenue growth and higher adjusted operating income on a constant currency basis, and generate robust cash flow.
OUTLOOK 2020
The Group remains committed to the aims of its 2020 plan, which are:
• To average mid single-digit organic growth, with improvement over the period underpinned by the new structure and new strategic initiatives.
• To accelerate Mergers and Acquisitions activities with acquired revenue in the range of CHF 1 billion over the period.
• To achieve an adjusted operating income margin of at least 18% by the end of the period bolstered by the new structure, efficiency improvement initiatives and improved pricing.
• To ensure strong cash conversion.
• To see solid returns on invested capital.
• To offer solid dividend distributions, in line with the improvement in net earnings.
23 January 2017
Sergio Marchionne Chairman of the Board
Frankie Ng Chief Executive Officer

SGS SERVICE
> Productivity Management Services
CONSUMER BENEFIT
> Lower prices at the checkout

FINE-TUNING CLASSIC RECIPES
Sometimes products that look easy to produce, like simple food oils, can actually be surprisingly complex to manufacture. Often the technology behind the delivery of these goods is so complicated and nuanced that even experts need a second opinion in order to optimise the process.
It is this kind of assistance that SGS supplies. SGS experts have worked at hundreds of plants, and this gives them broad industry exposure, putting them in a unique position to deliver solutions.
For example, at one European oilseed crushing plant, our experts provided guidance to local employees on how to optimise their existing technology to maximise productivity. The changes unearthed by our team increased the plant’s efficiency and significantly reduced waste, which lowered the costs of production.
Seemingly small changes, such as adjustments to temperature settings at various stages of the process, resulted in annual savings that went into six figures, all without compromising quality. By performing these services, consumers benefit too, not just from more consistent quality products, but often also from more competitive pricing in the supermarket.

20152016
2015201620152016
20152016
20152016
20152016
20152016
20152016
20152016
10
1. Constant currency basis.
2. Before amortisation of acquisition intangibles, restructuring and other non-recurring items.
3. Profit for the period / (Non-current assets + Net Working Capital).
2. HIGHLIGHTS
FINANCIAL HIGHLIGHTS
CHF 70
CHF 919MIO+2.4%1
CHF 6.0BN+6.0%1
CHF 71.54 +3.4%1
CHF 1.0BN+5.7%
CHF 586MIO+4.5%1
19.3%
19
15.4%
5.66.0 898919
561586
69.1771.54
19.7 19.3
10
19
15.91 15.4
68 70
9591 014
REVENUEADJUSTED OPERATING INCOME2
ADJUSTED OPERATING MARGIN2 PROFIT FOR THE PERIOD
BASIC EARNINGS PER SHARE PROPOSED DIVIDEND
RETURN ON INVESTED CAPITAL3
ACQUISITIONS COMPLETED IN 2016
CASH FLOW FROM OPERATING ACTIVITIES

11
2. HIGHLIGHTS
REVENUE AND ADJUSTED OPERATING INCOME BY BUSINESS
REVENUE BY REGION
REVENUE
ADJUSTED OPERATING INCOME1
1. Before amortisation of acquisition intangibles, restructuring and other non-recurring items.
4.6%GIS
15.6%AFL
18.3%OGC
10.6%MIN
8.2%TRP
7.8%EHS
14.9%IND
5.4%CBE
14.6%CRS
7.2%GIS
16.0%AFL
12.7%OGC
9.9%MIN
8.5%TRP
6.0%EHS
9.1%IND
6.3%CBE
24.3%CRS
30.0%Asia / Pacific
25.6%Americas
44.4%Europe / Africa / Middle East

12
2. HIGHLIGHTS
AGRICULTURE FOOD AND LIFE
Double-digit growth in life laboratory activities
MINERALS
Five new coal contracts in South Africa extended SGS’ presence in the country
OIL GAS AND CHEMICALS
Contract awarded to provide services to Shell’s Prelude floating liquefied natural gas (LNG) project
CONSUMER AND RETAIL
The rapidly developing e-commerce business recorded triple-digit growth
CERTIFICATION AND BUSINESS ENHANCEMENT
The business line saw 9.1% organic growth
INDUSTRIAL
Two strategic acquisitions in the quality control testing sector increased our footprint in Latin America
ENVIRONMENT HEALTH AND SAFETY
Strong revenue growth of 23.6%
TRANSPORTATION
Awarded contract to deliver all driving theory examinations in France
GOVERNMENT AND INSTITUTIONS
SGS D-TECT®, a revolutionary 100% border scanning solution, launched in Cameroon
GROUP ACHIEVEMENTS
BUSINESS HIGHLIGHTS
SUCCESSFULLY IMPLEMENTED IN 2016
STRENGTHENED CUTTING-EDGE CAPABILITIES THROUGH THE ACQUISITION OF 5 INNOVATIVE COMPANIES
COMPLETED IN 2016 (see Acquisitions section page 58)
IN NET WORKING CAPITAL IN 2016
FOSTERING PERFORMANCE AND COLLABORATION THROUGH DIGITALISATION
UNDER DEVELOPMENT ACROSS THE WORLD TO IMPROVE BACK-OFFICE EFFICIENCY
DIGITALISATION OF SERVICES
NEW STRUCTURE SECOND CONSECUTIVE REDUCTION
DIGITALISATION OF THE WORKPLACE
19 ACQUISITIONS 3 SHARED SERVICE CENTRES

13
PROFESSIONAL EXCELLENCE
• Link management incentive plan to sustainability
• Deliver measurable sustainable value to society
PEOPLE
• Maintain a natural turnover rate of no more than 10%
• 30% of leadership positions will be held by women
• Reduce our TRIR and LTIR by 50%*
ENVIRONMENT
• Reduce our annual CO2 emissions (per FTE) by 20%*
• Reduce our annual CO2 emissions (by revenue) by 20%*
COMMUNITY
• Increase our investment in communities around the world by 30%*, with a focus on volunteering
* Against 2014 baseline.
SUSTAINABILITY HIGHLIGHTS
SUSTAINABILITY AMBITIONS 2020
SGS RECEIVED THE ROBECOSAM INDUSTRY LEADER GOLD CLASS SUSTAINABILITY AWARD FOR THE THIRD CONSECUTIVE YEAR
EQUAL OPPORTUNITIES RATIO INCREASED OVER THE LAST 5 YEARS BY 15%
SGS DEVELOPED A HUMAN RIGHTS POLICY AND LAUNCHED A CODE OF CONDUCT FOR SUPPLIERS
TOTAL RECORDABLE INCIDENT RATE (TRIR) AND LOST TIME INJURY RATE (LTIR) DECREASED BY MORE THAN 18% AND 29% RESPECTIVELY IN 2016
SGS ACHIEVED A LEADING POSITION IN ITS REGION AND WAS INCLUDED IN THE “A-LIST” AND NEW “SUPPLIER A-LIST” BY THE CARBON DISCLOSURE PROJECT
SGS RECEIVED A GOLD RATING FOR THE SECOND CONSECUTIVE YEAR FROM ECOVADIS FOR ITS SUSTAINABILITY PERFORMANCE
SGS MAINTAINED ITS STATUS AS A CARBON NEUTRAL COMPANY
SGS RECEIVED THE ROBECOSAM 2017 INDUSTRY MOVER SUSTAINABILITY AWARD FOR EXCELLENT PERFORMANCE IN THE DOW JONES SUSTAINABILITY INDEX

BUILDING THE PERFECT HOLIDAY
In today’s fast-growing, increasingly regulated global travel industry, among other issues, tour operators need to ensure that no stone is left unturned when it comes to consumer health and safety. Even with hundreds of thousands of customers a year, a single incident could permanently damage a travel brand’s reputation.
SGS is helping the world’s leading tour operators to rise to this challenge. Using our expertise and global footprint, we have created a cutting-edge, industry-specific health and safety compliance audit system, with innovative SGS mobile technology at its heart.
Our local auditors use a bespoke audit app on their smartphones and tablets to review hotels, waterparks, excursions and overland transportation operations for our customers. The results are automatically uploaded to a central database. From this online hub, our customers can access detailed reports on the performance of thousands of resorts at the click of a button.
By helping tour operators to efficiently assess compliance and manage risk – in 2016 alone, we physically audited over 5 000 resorts worldwide – SGS is improving environmental health and safety standards in the hospitality sector, and making resorts safer places for visitors.

SGS SERVICE
> Health and Safety Compliance Audits
CONSUMER BENEFIT
> Holiday destinations that are as safe as they are beautiful

16
3. SGS AT A GLANCE
We provide competitive advantage, drive sustainability and deliver trust. At SGS, we are continually pushing ourselves to deliver innovative services and solutions that help our customers move their businesses forward.
At SGS, our sustainability approach is about more than just reducing carbon emissions. We maintain the highest professional standards and ensure our employees are able to lead fulfilling working lives. We also seek to maximise the positive impacts our business has on society.
We aim to be the most competitive and the most productive service organisation in the world. Our core competencies in inspection, verification, testing and certification are being continuously improved to be best-in-class. They are at the heart of what we are. Our chosen markets are and will be determined by our ability to be the most competitive and to consistently deliver unequalled service to our customers.
We seek to be characterised by our passion, integrity, entrepreneurialism and our innovative spirit, as we continually strive to fulfil our vision. These values guide us in all that we do and are the bedrock upon which our organisation is built.
THE WORLD LEADER OUR VISION OUR VALUES
EMPLOYEES OFFICES AND LABORATORIES GLOBAL NETWORK
90 000 2 000 1

17
3. SGS AT A GLANCE
SGS IS THE WORLD’S LEADING INSPECTION, VERIFICATION, TESTING AND CERTIFICATION COMPANY. SGS IS RECOGNISED AS THE GLOBAL BENCHMARK FOR QUALITY AND INTEGRITY. WITH MORE THAN 90 000 EMPLOYEES, SGS OPERATES A NETWORK OF OVER 2 000 OFFICES AND LABORATORIES AROUND THE WORLD.

MININGImproving speed to market, optimising recoveries
ENERGYPowering processes from renewables to conventional energy
CONSUMER GOODS AND RETAILGenerating trust throughout the supply chain
TRANSPORTATIONEnhancing safety, quality, reliability and trust
AGRICULTURE AND FOODEnsuring safe, sustainable and high-quality products
3. SGS AT A GLANCE
We provide services at all stages of the value chain, from extraction and primary production to manufacturing, transportation and retail.
OUR POSITION IN THE VALUE CHAIN
18

PUBLIC SECTORFacilitating international trade and sustainable development
OIL AND GASEnriching quality and value in exploration, extraction and distribution
LIFE SCIENCESProtecting quality, safety and costs in product development
INDUSTRIAL MANUFACTURING Making manufacturing more productive and profitable
CHEMICALInnovation, safety and efficiency in everything from perfumes to paints
CONSTRUCTIONEnsuring safety and performance where we live
19

20
OUR SPECIALIST TEAMS DELIVER TRUSTED RESULTS IN WORLD-LEADING SERVICES, COVERING VIRTUALLY ALL INDUSTRIES. We audit across the entire value chain, providing benefits to all business sectors. We ensure our customers’ projects, products, processes and operations meet and exceed regulations and standards, and we provide the verification and certification they need to trade in target markets around the world. Our consultancy services inform organisations on market demands, while our outsourcing solutions provide the expertise, experience and resources that enable our customers to meet their goals. We use state-of-the-art examination methodologies with unsurpassed accuracy to perform inspections that reduce risk and control quality and quantity. At the same time, we conduct testing of raw materials, components and products in our global network of facilities. Our industry experts also deliver world-class training, specifically designed for the precise needs of our customers, providing the right skills and knowledge to maximise efficiency and improve productivity.
Through our unique global network, we deliver independent results tailored to the precise needs of the industry or sector. Our customers trust our expertise, experience and resources to support them. We help our customers achieve outstanding performance in everything they do.
SGS offers services across 11 major industries through our nine business lines. Each business line develops and maintains world-class expertise to support the evolving needs of our customers. Thanks to our capabilities we are able to provide solutions to the challenges they face across the globe. SGS’ industries are outlined below.
AGRICULTURE AND FOOD
Ensuring safe, sustainable and high-quality products.
Consumers want assurance of safety and quality at every stage of the food production process. Our services build trust, reduce risk and maintain efficiency across diverse agriculture and food supply chains. We offer solutions for agrochemicals, seed, biofuels, fertilisers, food and forestry. Our services protect the integrity of our customers’ brands by assessing quality, adding value and securing safe and sustainable global supply chains. From primary production to consumption, we assist with legislation compliance, correct storage, shipping, packing and distribution as well as import and export product inspection.
CHEMICAL
Innovation, optimisation and efficiency in everything from feedstocks to finished products.
Industrial chemical companies utilise our services to optimise their production, reduce risk and control potential health hazards. We work with our partners to establish and maintain quality, safety and compliance throughout the custody chain, from feedstocks,
through chemical intermediates and into finished products. Our consultancy services offer our partners laboratory design, commissioning and operations assistance, including procurement and optimisation of equipment. We support customer operations using established benchmarks and techniques to improve productivity and efficiency through training, our asset integrity management services, optimisation programmes and project lifecycle services.
CONSTRUCTION
Ensuring safety and performance in the environment where we work and live.
Safe, efficient and trusted processes are essential when constructing buildings or infrastructure. Our construction industry experience means our customers can maximise energy efficiency and public safety. We support our customers in implementing effective scheduling, budgeting, site safety and logistics by utilising modern asset virtualisation tools. We conduct studies in construction feasibility and risk assessment and management. Our services ensure quality in global supply chains by performing chemical and physical testing of materials. Our asset management systems are increasingly based on real-time sensor technology, which tracks machines and equipment, while our inspection services provide facility, waste and energy audits.
CONSUMER GOODS AND RETAIL
Generating trust throughout the supply chain.
Our services enable manufacturers, importers, exporters and retailers to gain a competitive edge. We ensure trusted, ethical and environmentally conscious goods, such as electronics, textiles, toys, footwear, housewares and cosmetics, reach consumers. Our laboratories conduct material, chemical and performance testing to verify and certify that products are safe and perform as our customers claim. We inspect processes at every stage of production and undertake retail store audits to ensure our customers’ brands are represented correctly. We help our customers develop products, processes and supply chains that consumers trust every day.
3. SGS AT A GLANCE
SGS BY INDUSTRY

21
ENERGY
Powering processes from renewables to conventional energy.
As the energy sector evolves to meet emerging regulations, we offer a portfolio of services to our partners focused on efficiency, optimisation and asset integrity. We provide support across the entire energy sector with a comprehensive range of independent inspections, audits and business enhancement services. Whatever the industry – petroleum, gas, electrical power, coal or renewable energy – we offer solutions to our partners. We enable each customer to better assess and manage risk in all operations. In renewables, we consult on sustainability across hydroelectric, geothermal, wind and solar power. Our solutions help the energy sector innovate to find tomorrow’s energy today.
INDUSTRIAL MANUFACTURING
Making manufacturing more productive and profitable.
Our expertise allows manufacturers to improve productivity, follow best practices and streamline operational processes and logistics. Industrial manufacturers in sectors ranging from pharmaceuticals to farm machinery and from aerospace to automotive trust in our independent testing and conformity services. Our advice on the fabrication of components, using digital information from real-time sensor-based technology, along with our finished product assessments, enable our customers to achieve high performance standards throughout manufacturing. We support manufacturers in complying with all national and international quality, health and safety legislation, at the same time as providing advice on minimising environmental impact.
LIFE SCIENCES
Safeguarding the quality and efficacy of medicines.
In the pharmaceutical, biopharmaceutical and medical device industries, products must conform to all national and international regulations, as well as industry best practices. Our services enable high-quality, safe and compliant products to reach the market in
the shortest possible timescales. We provide vital support and expertise for medicines and medical devices throughout every stage of development, testing, production and distribution. With a wholly-owned network of contract analytical laboratories and state-of-the-art clinical trials facilities around the world, our customers trust in our expert knowledge to support them with reliable results.
MINING
Delivering effective services to improve speed to market, manage risks and maximise returns.
Mining is an industry driven by the need to optimise recovery without compromising on safety, environmental sustainability and integrity. We are a strategic partner in the mining industry providing testing, process engineering, technology and trade support, as well as production optimisation services. We deliver sustainable solutions across exploration, production, industrial applications, decommissioning and closure. We help to enhance asset value and optimise recoveries in industrial minerals and precious and base metals extraction. We offer technical expertise in steel manufacturing processes and fertiliser, coal and coke trading. Our expansive global footprint allows our customers to take full advantage of our network to service their project needs across the globe.
OIL AND GAS
Innovative solutions that add up along the value chain.
The oil and gas industry constantly seeks improved efficiency. We offer a portfolio of services across the entire value chain in the oil and gas industry. We give our partners access to independent expertise in both the upstream and downstream sectors, providing tailored solutions for exploring, extracting, refining, transporting and marketing oil, gas and other hydrocarbons. Our values, with an emphasis on health and safety, excellence and transparency, are known and trusted. In a market undergoing radical change, we are driven by data. Our specialist advice and knowledge support upstream
activities such as applied mineralogy, metering, measuring and hydrocarbons allocation. Our downstream services support distribution and retail as well as the design and execution of optimised processes and global trade inspection.
PUBLIC SECTOR
Facilitating international trade and sustainable development.
Public sector organisations require solutions designed to work in harmony with the processes and policies they already have in place. Our unrivalled border control services for scanner installation, transit monitoring and risk profiling support the public sector in reducing risk worldwide. Our e-government solutions enhance international trade and revenue processing. We improve public infrastructure through independent road safety services that increase the efficiency of transportation systems. Our customers trust our knowledge of quality, health, safety and environmental issues to comply with complex regulations. We improve quality and maximise productivity across the public sector.
TRANSPORTATION
Driving a safer, cleaner and more efficient industry.
For governments, manufacturers and financial institutions improving performance and reducing risk in the transportation industry is essential. From the automotive industry, through rail and shipping to the aerospace industry, we guide quality improvements and verify that efficiency is maximised. We support our customers in achieving shorter delivery times, safer products and reduced costs. Our experts help our customers minimise the environmental impact of their products and ensure their conformity and compliance to standards and regulations. We also ensure that brand guidelines are met throughout aftermarket and distribution operations. Our global network of offices, laboratories and testing centres offers a truly unique and independent service.

22
3. SGS AT A GLANCE
QUALITY
Our customers rely on our independent third-party inspection, testing and auditing solutions to ensure products, services and processes comply with the latest quality standards. Our global network of state-of-the-art facilities provides information to certify and verify quality worldwide.
REDUCED RISK
We provide our customers with independent and impartial services that enable them to identify, manage and reduce risk. Our experts deliver risk management solutions, drawing on our testing and inspection capabilities, to verify risk prevention measures are in place. We assist with compliance with international risk management standards across a wide range of industries.
PRODUCTIVITY
Our training and outsourcing solutions ensure productivity keeps pace with developments in our customers’ organisations. In the short term, we offer the knowledge of our world-class productivity experts. In the long term, we deliver focused training to develop specialist skills in our customers’ personnel.
TRUST
Our global reputation for independence and integrity enables us to build trust wherever needed. We provide transparent and unbiased inspection, testing, verification and certification solutions so our customers can give assurance in their products, processes, systems and services.
SAFETY
We help organisations develop effective health and safety systems to protect employees, generate consumer confidence and enhance trust in business operations. We support our customers in adhering to best practices and complying with local, national and international regulations.
EFFICIENCY
Our tailored business solutions help our customers implement processes and systems that make business operations faster, simpler and more efficient. We deliver unrivalled efficiency results from our local experts, who draw on the global experience of the entire SGS network.
SPEED TO MARKET
Compliance with the requirements of target markets is key to increasing speed to market. Our consultancy, testing and certification services help our customers overcome the complex challenges of understanding and meeting market demands anywhere in the world, whatever the industry or sector.
THE BUSINESS BENEFITS WE DELIVER
SUSTAINABILITY
We help our customers take ownership of building a more responsible and sustainable future. We encourage environmental responsibility and reduce the risk of corruption in our customers’ projects. Our services assist in developing sustainable facilities and production, as well as better working and social environments.

23
INSPECTION
All organisations need trusted independent inspection to ensure that legal obligations and high standards are met at every stage. Our comprehensive range of world-leading inspection services helps to reduce risk, control quality and quantity, and meet all relevant regulatory requirements across different regions and markets.
VERIFICATION
Whatever the industry, compliance with the latest regulations and standards is mandatory. We can help ensure that products, services and processes follow the latest national and international standards – wherever our customers are in the world.
TRAINING
Providing a workforce with skills and knowledge enhances organisational agility, maximises efficiency, motivates employees, improves productivity and boosts the bottom line. We offer world-class training and courses from industry experts that address the precise needs of organisations and industry.
OUTSOURCING
We offer unrivalled expertise, experience, resources and a unique global network. As a result, we can provide the specialised skills our customers need to achieve their goals, for any industry, anywhere in the world.
TESTING
We provide the broadest range of product testing to customers around the world. Our global network of testing facilities, staffed by knowledgeable and experienced personnel, helps reduce risks, shorten time to market and demonstrate the quality and safety of raw materials, components and products.
CERTIFICATION
We enable our customers to demonstrate that their products, processes, systems and services are compliant with national and international regulations and standards.
CONSULTANCY
To ensure full market access, goods must comply with the requirements of target markets. Identifying those requirements and meeting them is a complex challenge. Our consultancy services help our customers to understand and meet market demands anywhere in the world, whatever the industry or sector.
ANALYTICS
Our data analytics services ensure the quality of automated data input and analysis. We manage streams of big data, using it to provide our customers with innovative insights and ideas. We also create cutting-edge predictive operations tools, increasing transparency and efficiency across all the industries we operate in.
THE EXPERT SERVICES WE OFFER

A LIGHT BULB MOMENT FOR REE RECOVERY
From flat-screen TVs and smartphones, to wind turbines, electric vehicles and lasers, Rare Earth Elements (REEs) have become a critical part of modern technology. Take energy saving light bulbs for example. To function properly the bulb normally requires five different REEs: cerium, europium, lanthanum, terbium and yttrium.
Although the demand for REEs will continue to grow, the problem is that they are extremely difficult to recover and purify after they are mined, leading to global concerns about assuring an adequate supply.
Firstly, there are issues around the complexity of deposits. For instance, cerium is believed to be as abundant as copper but it is rarely found in deposits that can be economically mined. Secondly, more than 90% of global REE production occurs in a single country: China.
There are only a handful of operating REE mines in the rest of the world, which has meant that technical development has been limited and efficiency impaired.
SGS offers a suite of specialised metallurgical research and testing services, focused on improving the recovery of these vital but complex metals. Our work means that REEs remain available and affordable to consumers so that they can continue to enjoy all the technological advantages that REEs bring.

CONSUMER BENEFIT
> Increasingly available and affordable modern technology
SGS SERVICE
> High Definition Mineralogy

26
THE FOLLOWING SECTION ON SGS BUSINESS LEADERSHIP REPORTS ON EACH COMPONENT OF OUR BUSINESS MODEL, HIGHLIGHTS OUR BUSINESS PRINCIPLES AND EXPLAINS HOW WE ADD VALUE TO ALL OF OUR STAKEHOLDERS.
HOW WE BUILD OUR BUSINESS DYNAMICALLY AND SUSTAINABLY
HOW WE MAINTAIN OUR POSITION AS A WORLD LEADER AND MAKE SGS A GREAT PLACE TO WORK
HOW WE ENSURE THE SUCCESS OF OUR STAKEHOLDERS
Our business leadership comes from our unique global network, our expertise and our attitude towards innovation and development.
It comes from our financial strength and our ability to invest wisely.
It comes from our agility and creativity, and our integrity as an independent third-party.
It comes from our uncompromising approach to sustainability and health and safety.
It comes from our ability to provide our customers with a competitive advantage and offer our investors a strong return on investment.
That is what we mean when we talk about business leadership.
SGS BUSINESS MODELPAGE 30
SGS BUSINESS PRINCIPLESPAGE 92
SGS ADDED VALUEPAGE 94
4. BUSINESS LEADERSHIP

SGS ADDED VALUE
SGS BUSINESS PRINCIPLES
SGS BUSINESS MODELINNOVATION
GROWTH
BRAND
PROFESSIONALISM
HEALTH AN
D SAFETY
INTEGRITY
OUR INVESTORS
OUR CUSTOMERS
INVE
STM
ENT
EXPERTISE
OPERATIONAL
EXCELLENCE
LEADERSHIP
SUST
AIN
ABI
LITY
RESPECT
OUR INDUSTRIES
OUR
PART
NER
S
OUR COMMUNITIES
OUR EMPLOYEES
27
4. BUSINESS LEADERSHIP

28
MARKET
SGS expects market conditions to remain challenging in the short term, but nonetheless expects to deliver solid organic revenue growth and higher adjusted operating income on a constant currency basis, and generate robust cash flow.
In the energy markets, the Organization of the Petroleum Exporting Countries (OPEC) announced in December 2016 that it will cut production for the first time in eight years. This will see 1.2 million less barrels per day on the market for the first six months of 2017. This announcement came in tandem with simultaneous cuts announced in Russian production. The anticipated subsequent increase in global oil prices during 2017 will nonetheless still take some time to work through before we see an increased demand for energy-related services. Consequently, while continuing to invest in our energy-related activities, we will predominantly focus on growing our non-energy business in 2017. A particular emphasis will be placed on enhancing our presence in key markets, such as North America and China.
Over the longer term (2017-2020), SGS anticipates mid-single digit
organic growth on average, which will be supported by the new structure implemented in 2016 and several strategic initiatives. We also expect an acceleration in merger and acquisition activities, CHF 1 bn of revenues over the period, an adjusted operating income margin of at least 18% by the end of the period, strong cash conversion and solid returns on capital.
STRUCTURE
Following the successful implementation of structural changes in 2016 (as previously reported), further changes to our regional organisation will be made in 2017.
In order to continue to drive efficiencies, adjustments will be made to our geographical organisation with the number of our regions being reduced from nine to eight. As part of this, the Eastern Asia region will be incorporated into our China and Hong Kong region.
Once completed, our regional structure will therefore be as follows: Western Europe; Northern Central and Southern Europe; Eastern Europe and Middle East; Africa, North America; South and Central America; North East Asia; and Southern Eastern Asia and Pacific.
4. BUSINESS LEADERSHIP
GROUP OUTLOOK
DELIVER BOLT-ON ACQUISITIONS WITH ATTRACTIVE BUSINESS SYNERGIES
DELIVER A SOLID RETURN ON INVESTMENT
193ACQUISITION CASH CONSIDERATION (CHF MIO: # OF TRANSACTIONS)
70DIVIDEND PER SHARE (CHF) AND PAYOUT RATIO1 (%)
201520142013201220112010
103108103
176
104
302
10
22
18
12
10 10
2014 2015201320122
79.5%82.9%
94.5%
68 686558
Jan. 14: new dividend policy setting CHF 65 as a dividend floor for 2013 – 16
1. Payout ratio: Dividend per share / Basic earnings per share
2. Dividend per share including ordinary and special dividends
82.9%
2016
193
19
2016
97.8%
70

29
FINANCE
As a key objective for the year ahead, the Group will continue to focus on both organic and inorganic growth, along with solid cash flow and stable profitability.
SGS will also continue to place a strong emphasis on structural improvements to its Net Working Capital as a priority during 2017. This will include the standardisation and optimisation of Net Working Capital for each activity within our portfolio.
Our Procurement function will continue to add value to the organisation through optimising strategic sourcing and enhancing supply chain management, while the Real Estate function will optimise our real estate portfolio.
Another important aspect going forward will be the deployment of our Global Business Services Strategy. This will seek to simplify, streamline and optimise the organisation, processes and systems of our back office functions as well as leveraging best practices across our internal business services. One of the main aspects of this will be the phasing in of four Shared Service Centres.
In Poland and the Philippines, the implementation of the European and Asian Shared Service Centres that
began in 2016 will continue into next year as the centres are optimised. In Costa Rica meanwhile, the implementation of the Americas Shared Service Centre is due to begin in 2017. An additional centre exclusively focused on the growing Chinese market is also expected to be identified in 2017, with its implementation anticipated later in the year and into 2018.
STRATEGIC INITIATIVES
We will continue to drive innovation through our dedicated department and by encouraging and recognising individual employee achievements. This initiative will further cement the culture of innovation within SGS as we continually push ourselves to remain ahead of the curve with regard to our services, processes, technology and thinking.
Our TIC 4.0 initiative, which focuses on the increasing digitalisation of our services, will continue to develop as a key driver of potential future growth.
With this digitalisation will come a significant inflow of data, particularly given the scale of SGS’ global footprint. Big data analytics will therefore increasingly become a key aspect of SGS’ service offering (see page 223 for
an example). This data can be used to study historical trends, to provide a deep understanding of current operations and even to form predictive modelling to support future strategic direction.
In other instances, we will continue to leverage our understanding of disruptive technology, such as sensors, to provide additional added value to our customers. In addition to the analysis mentioned above, SGS can install and maintain sensors, and most importantly verify the veracity of the data that they are producing.
In e-commerce, we will continue to move towards a Business to Business to Consumer (B2B2C) model (see page 36), particularly in Asia, where SGS certified products are already available on major commercial websites.
In the case of each Strategic Initiative, our traditional core skills can be used to offer offline-to-online services that ensure our customers are confident in the products that they are offering. The scale of our physical footprint will be a key differentiator for SGS across these initiatives, representing a high barrier to entry to potential competitors in these high margin activities.
MAINTAIN AN ATTRACTIVE SHAREHOLDER RETURN POLICY
INVEST IN ORGANIC GROWTH PROJECTS AND TECHNOLOGY-DRIVEN PARTNERSHIPS
288CAPEX (CHF MIO, % OF SALES)
750SHARE BUYBACK PROGRAMME (CHF MIO)
201520142013201220112010
5.5%7.2% 6.9% 6.1% 5.2% 5.3%
301305
357386
345
261
JAN 15 TO DEC 16
250
500
750CHF 250 million for employee equity participation plans and/or utilisable as underlying securities for debt-like issuance
CHF 500 million for shares cancellation
2016
4.8%
288

30
BRANDA brand not only differentiates a company, it unites it. The SGS brand offers our customers the peace of mind that comes from knowing they are working with the market leaders. It means our employees are rallying behind the same cause and pulling in the same direction. Finally, it means that we are bound by a shared commitment to provide the highest quality services.
EXPERTISEA business’ ability to attract and retain the best talent is a cornerstone of its success. At SGS we believe in our people and we are serious in supporting their long-term development.
INNOVATIONThe world changes. Markets move. People move on. A world-class business like SGS needs to stay ahead of these changes and to continuously stretch the boundaries of the TIC industry in order to retain our position as market leaders.
GROWTHProfitable growth is a fundamental aspect in the success of any business and SGS is no exception. For us however, the continued growth of our global network and its unrivalled physical footprint is a key competitive advantage, both to our business and to our shareholders.
INVESTMENTInertia is not an option for a market leader like SGS. We need to anticipate changes in market conditions and customer demand in order to seize opportunities as they arise. This means that investment in research, innovation, talent and technology has to be at the core of our business model.
4. BUSINESS LEADERSHIP
OPERATIONAL EXCELLENCEHow do businesses ensure world-class performance? Through assuring genuine operational excellence across business functions, improving margins and performance, and through utilising the best possible sustainable business practices.

SGS ADDED VALUE
SGS BUSINESS PRINCIPLES
SGS BUSINESS MODELINNOVATION
GROWTH
BRAND
PROFESSIONALISM
HEALTH AN
D SAFETY
INTEGRITY
OUR INVESTORS
OUR CUSTOMERS
INVE
STM
ENT
EXPERTISE
OPERATIONAL
EXCELLENCE
LEADERSHIP
SUST
AIN
ABI
LITY
RESPECT
OUR INDUSTRIES
OUR
PART
NER
S
OUR COMMUNITIES
OUR EMPLOYEES
31
THE SGS BUSINESS MODEL IS BUILT ON THE SIX CORE PILLARS OF BRAND, GROWTH, INNOVATION, EXPERTISE, INVESTMENT AND OPERATIONAL EXCELLENCE. THESE ARE THE BASIC INGREDIENTS FOR OUR BUSINESS SUCCESS AND IT IS BECAUSE OF OUR FOCUS ON CONTINUALLY IMPROVING THESE FUNDAMENTALS THAT WE ARE LEADERS IN OUR FIELD.

4. BUSINESS LEADERSHIP
32
SGS IS THE MARKET LEADER IN THE TESTING INSPECTION AND CERTIFICATION INDUSTRY. THE GROUP HAS IDENTIFIED A NUMBER OF KEY GOALS MOVING FORWARD AS PART OF ITS AMBITION 2020. THE STRATEGIC FOCUS INFORMATION PRESENTED BELOW PROVIDES GUIDANCE ON THESE GOALS, WHICH ARE EXPLAINED IN THE CONTEXT OF THE SIX ELEMENTS OF THE SGS BUSINESS MODEL. THIS SECTION ALSO REPORTS ON SELECTED ACHIEVEMENTS ATTAINED TOWARDS AMBITION 2020 GOALS DURING 2016.
STRATEGIC FOCUS
BRAND
THEMES SELECTED ACHIEVEMENTS IN 2016 AMBITION 2020
CUSTOMER SATISFACTION • Bosch Supplier Award: North America
• Industry Appreciation Award: Canadian Special Crops Association
• High customer retention and satisfaction
INTEGRITY AND HUMAN RIGHTS • Creation of Human Rights Policy
• Rollout of Code of Conduct
• No major integrity or human rights breaches
MARKET LEADERSHIP • Diversification of SGS' reach and expertise
• Strengthened digital presence
• Social media: strong brand positioning and audience engagement
• Leading position in strategic markets and geographies
SUSTAINABILITY • Dow Jones sustainability Indices Leading Position
• Carbon neutral company
• Member of the “A-List” and “Supply Chain A-List” by the Carbon Disclosure Project
• Industry sustainability leadership
• Link Management Incentive Plan to sustainability
• Deliver measurable sustainable value to society

33
THEMES SELECTED ACHIEVEMENTS IN 2016 AMBITION 2020
ACQUISITIONS AND STRATEGIC PARTNERSHIPS
• 19 acquisitions
• 2 strategic partnerships
• Inorganic growth of 3.5%
• Build scale
• Buy capabilities
• Fill geographic gaps
• Enhance financial metrics
• Maintain strategic significance
BALANCED PORTFOLIO • Successful implementationof Dashboard Review
• Non-energy related organic revenuegrowth of 6.2%
• Diversify non-energy-relatedportfolio of services
ORGANIC GROWTH • Organic growth of 2.5% • Mid-single digit averageorganic growth
REGIONAL FOCUS • Strategic regional realignment in progress • Enhance presence in key markets
THEMES SELECTED ACHIEVEMENTS IN 2016 AMBITION 2020
E-COMMERCE • Positioning of SGS brand on majore-commerce sites
• Triple-digit growth of e-commercebusiness in China
• Expand to B2B2C
TIC 4.0 • Information, system andplatform development
• New Cyber Security service
• Digitalisation of services
OTHER INITIATIVES • Development of INNO programme:encouraging employees to driveinternal innovation
• Strengthen and invigorate theculture of innovation at SGS
GROWTH
INNOVATION

4. BUSINESS LEADERSHIP
34
THEMES SELECTED ACHIEVEMENTS IN 2016 AMBITION 2020
CAPEX • Implementation of new IT platform
• Development of EquipNet(internal equipment marketplace)
• Investment in technology-drivenpartnerships
• Invest in cutting-edge technologyand optimise existing technologyperformance and usage
COMMUNITY INVOLVEMENT • Invested CHF 1 177 000 in communitiesaround the world
• Increase investment incommunities around the worldby 30%*
INVESTOR RELATIONS • An attractive shareholder return policyof CHF 34
• Awarded a solid investment grade
• Be a best-in-classinvestment opportunity
THEMES SELECTED ACHIEVEMENTS IN 2016 AMBITION 2020
PEOPLE • 2 546 043 hours of training
• Over 20 500 employees integratedthrough our onboarding programme
• Natural turnover rate of 12.10%
• 26.31% of senior management positionsheld by women
• Enhance our reputation asan employer of choice
• Employ the industry’sleading experts
• Maintain natural staff turnoverrate at no more than 10%*
• 30% of senior managementpositions to be held by women
QUALITY AND PROFESSIONALISM • First in the industry to receive Investorin People Gold Award: Philippines
• Be the leading brand for accuracy,quality and professionalism
EXPERTISE
INVESTMENT

35
THEMES SELECTED ACHIEVEMENTS IN 2016 AMBITION 2020
ENVIRONMENT • New Vehicle Emissions Policy
• Reduced CO2 emissions (per FTE)by 2.08%*
• Reduced CO2 emissions (by revenue)by 31.22%*
• Reduce our annual CO2 emissions(per FTE) by 20%*
• Reduce our annual CO2 emissions(by revenue) by 20%*
HEALTH AND SAFETY • Total Recordable Incident Rate (TRIR)and Lost Time Injury Rate (LTIR)reduced by 18% and 29% respectively*
• Reduce TRIR and LTIR by 50%*
NET WORKING CAPITAL INITIATIVE • Decreased Net Working Capitalby CHF 75 million
• Ensure efficient use of capital
OPERATIONAL EFFICIENCY • Shared Service Centres launched
• Procurement savingsof CHF 57 million
• Maximise internal efficiencies
* Against a 2014 baseline.
OPERATIONAL EXCELLENCE

36
4. BUSINESS LEADERSHIP
BRAND
COMMUNICATING SGS BRAND VALUES WILL ONLY BECOME MORE IMPORTANT IN THE FUTURE.
It is an exciting time for SGS as a brand. As the TIC industry evolves through programmes like our TIC 4.0 initiative, we are increasingly finding ourselves presenting our brand to a new kind of audience.
Traditionally, we could comfortably describe ourselves as a B2B business, but over recent years we have increasingly seen a partial migration of some services up the supply chain, which puts us squarely in front of the end consumer. In that sense, we are now – at least partially – operating in a B2B2C environment.
Take e-commerce for example, when customers buy from online retailers they need to be confident in the products they are purchasing. Consequently, SGS now provides services for major e-commerce sites where we verify the quality of products being sold by vendors on the site.
The result is that products ranging from colouring books to 25 ton galvanised
steel coils are now being sold with the SGS brand clearly displayed. In some markets and notably in Asia, SGS is rapidly becoming a go-to solution to reassure online consumers about issues ranging from sustainability to product quality.
This means that SGS’ brand equity is now openly being used as a product differentiator. Vendors using the SGS logo in this way are implicitly aligning their products to some or all of the benefits that SGS’ services bring: speed to market, reduced risk, efficiency, productivity, sustainability, trust, quality and safety.
This marks a real evolution, not just for SGS, but for the entire TIC industry. Previously operating behind the scenes, the important role the TIC industry plays in ensuring product quality and safety is gradually easing its way into the public consciousness.
As it does so, communicating clearly on what the SGS brand stands for and continuing to deliver on the promise that it represents, will only become more important.

37
CONSUMER BENEFIT
> Trusting that purchases made online are up to scratch
SGS SERVICE
> E-Commerce Quality Control Service

38
WHETHER THROUGH ACQUISITIONS, STRATEGIC PARTNERSHIPS OR BY ORGANIC EXPANSION, THE CONTINUED GROWTH OF OUR GLOBAL NETWORK AND ITS UNRIVALED PHYSICAL FOOTPRINT IS A KEY COMPETITIVE ADVANTAGE.
4. BUSINESS LEADERSHIP
There is an obvious temptation for companies to rush towards becoming larger, stronger and more influential. Yet pushing a company to grow as an aim unto itself is not necessarily a smart move. Growth shouldn’t drive strategy. The opposite is true: strategy should drive growth.
At SGS, our strategy is pushing us towards growth in two key geographies: North America and China.
In North America, both economic and regulatory drivers are incentivising a rebalancing of our portfolio. Consequently, we are putting less emphasis on the energy-related business space. This shift is entirely in-line with changes across the wider US economy. For the first time in the US, energy has decoupled from economic growth: over the last decade, while the country has witnessed economic growth of 10%, energy consumption has dropped by 2.4%. At the same time, there have been significant increases in budgets in areas such as biopharmaceutical R&D, and for both the US Food and Drug Administration and The Environmental Protection Agency.
These drivers have led us to acquire six new companies in the continent in 2016 (with 700+ new service professionals and 20 additional facilities). The outcome has been clear: we are seeing a sustainable 6% organic growth rate in the North
American region. Transportation delivered 11% organic growth in the US in 2016, while Minerals achieved 58% top-line growth in Mexico.
In China, we believe that despite the widely discussed slowdown of the economy, the increasing liberalisation of the Chinese domestic market offers opportunities that can more than offset it. With a TIC market size of RMB 180 bn (approx. CHF 26 bn) and an anticipated compound annual growth rate of 13%, it is an inviting market; more so, because of its high level of fragmentation. With over 31 000 players (90% of which are SMEs), there is certainly space for market consolidation.
In addition to fostering organic growth, our strategy in China has therefore been to acquire companies or partner with state-owned interests with the necessary regulatory permissions and licences to allow us to leverage our national and global network to the maximum, giving us an early-mover advantage.
The results of this strategy can already be clearly seen: we have achieved close to double-digit growth in the country and our rapidly expanding e-commerce business enjoyed triple-digit growth in 2016.
Therefore, it is strategy that drives growth at SGS, not the reverse. Whether through acquisitions, strategic partnerships or by organic expansion, the continued growth of our global network in key markets represents a competitive advantage that SGS is highly focused on.
GROWTH

39
SGS SERVICE
> Polymer Testing
CONSUMER BENEFIT
> More responsive carbon fibre products

40
4. BUSINESS LEADERSHIP
SGS SERVICE
> Laboratory Fleece Testing
CONSUMER BENEFIT
> Woollen products that are as comfy as they are supposed to be
20162015
41
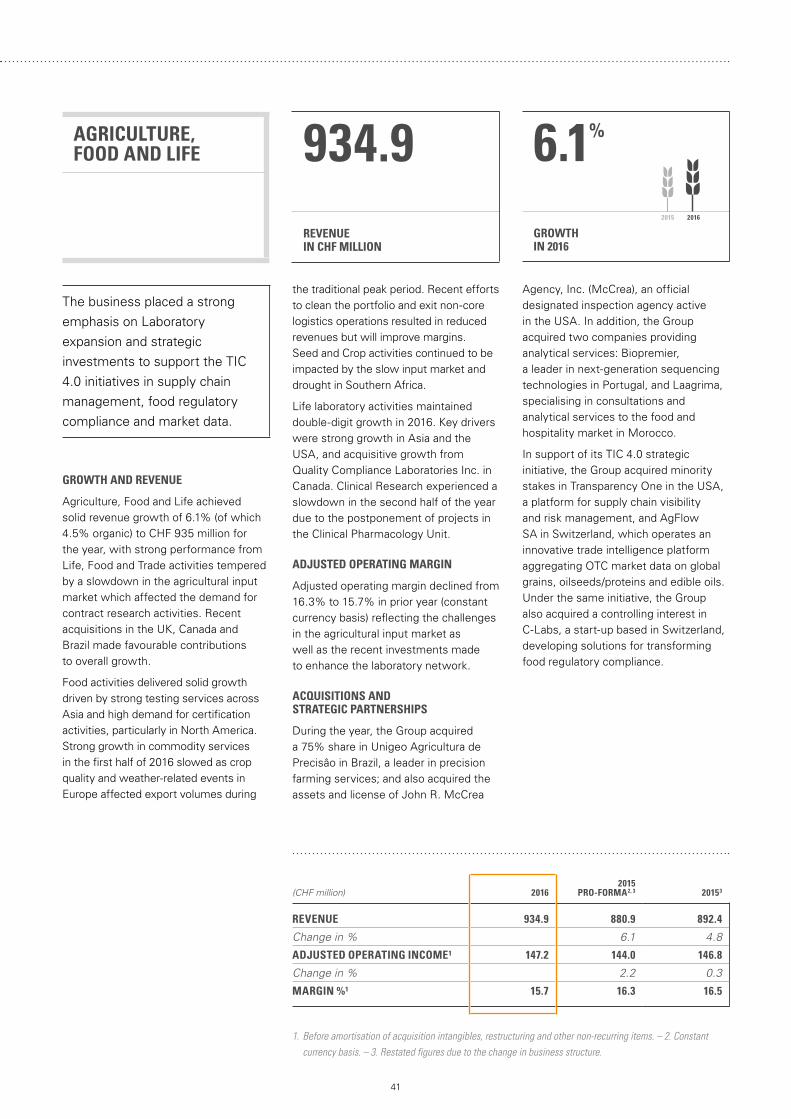
The business placed a strong emphasis on Laboratory expansion and strategic investments to support the TIC 4.0 initiatives in supply chain management, food regulatory compliance and market data.
GROWTH AND REVENUE
Agriculture, Food and Life achieved solid revenue growth of 6.1% (of which 4.5% organic) to CHF 935 million for the year, with strong performance from Life, Food and Trade activities tempered by a slowdown in the agricultural input market which affected the demand for contract research activities. Recent acquisitions in the UK, Canada and Brazil made favourable contributions to overall growth.
Food activities delivered solid growth driven by strong testing services across Asia and high demand for certification activities, particularly in North America. Strong growth in commodity services in the first half of 2016 slowed as crop quality and weather-related events in Europe affected export volumes during
the traditional peak period. Recent efforts to clean the portfolio and exit non-core logistics operations resulted in reduced revenues but will improve margins. Seed and Crop activities continued to be impacted by the slow input market and drought in Southern Africa.
Life laboratory activities maintained double-digit growth in 2016. Key drivers were strong growth in Asia and the USA, and acquisitive growth from Quality Compliance Laboratories Inc. in Canada. Clinical Research experienced a slowdown in the second half of the year due to the postponement of projects in the Clinical Pharmacology Unit.
ADJUSTED OPERATING MARGIN
Adjusted operating margin declined from 16.3% to 15.7% in prior year (constant currency basis) reflecting the challenges in the agricultural input market as well as the recent investments made to enhance the laboratory network.
ACQUISITIONS AND STRATEGIC PARTNERSHIPS
During the year, the Group acquired a 75% share in Unigeo Agricultura de Precisâo in Brazil, a leader in precision farming services; and also acquired the assets and license of John R. McCrea
Agency, Inc. (McCrea), an official designated inspection agency active in the USA. In addition, the Group acquired two companies providing analytical services: Biopremier, a leader in next-generation sequencing technologies in Portugal, and Laagrima, specialising in consultations and analytical services to the food and hospitality market in Morocco.
In support of its TIC 4.0 strategic initiative, the Group acquired minority stakes in Transparency One in the USA, a platform for supply chain visibility and risk management, and AgFlow SA in Switzerland, which operates an innovative trade intelligence platform aggregating OTC market data on global grains, oilseeds/proteins and edible oils. Under the same initiative, the Group also acquired a controlling interest in C-Labs, a start-up based in Switzerland, developing solutions for transforming food regulatory compliance.
AGRICULTURE, FOOD AND LIFE
REVENUE IN CHF MILLION
GROWTH IN 2016
934.9 6.1%
(CHF million)
20162015
PRO-FORMA2, 3 20153
REVENUE 934.9 880.9 892.4
Change in % 6.1 4.8
ADJUSTED OPERATING INCOME¹ 147.2 144.0 146.8
Change in % 2.2 0.3
MARGIN %¹ 15.7 16.3 16.5
1. Before amortisation of acquisition intangibles, restructuring and other non-recurring items. – 2. Constant currency basis. – 3. Restated figures due to the change in business structure.

42
4. BUSINESS LEADERSHIP
SGS SERVICE
> Diamond Classification and Evaluation
CONSUMER BENEFIT
> Knowing your diamond is ethically sourced

20162015
43
MINERALS
REVENUE IN CHF MILLION
GROWTH IN 2016
635.0 2.6%
(CHF million)
20162015
PRO-FORMA2
2015
REVENUE 635.0 618.9 632.8
Change in % 2.6 0.3
ADJUSTED OPERATING INCOME¹ 90.9 86.6 89.6
Change in % 5.0 1.5
MARGIN %¹ 14.3 14.0 14.2
1. Before amortisation of acquisition intangibles, restructuring and other non-recurring items. – 2. Constant Currency basis.
The outlook for Energy Minerals in South Africa remains strong. The new world-class sampling and laboratory facility at the Richards Bay Coal Terminal started a seven-year contract, and has won five new onsite coal laboratory contracts.
GROWTH AND REVENUE
Minerals delivered revenue growth of 2.6% (of which -0.2% organic) to CHF 635 million for the year, performing above expectations, in a market that continues to experience reduced exploration expenditures.
Geochemistry laboratories delivered strong growth with global sample volumes increasing 11% over prior year as a result of improved efficiencies and integrated service packages.
Demand for laboratory outsourcing continued to grow, with five new contracts starting during the year. A further six new contracts are expected to begin in 2017.
Energy Minerals delivered exceptional growth in South Africa, Russia, Colombia and Vietnam and a more stable performance in Australia and the USA despite market contraction.
The commencement of a seven-year contract in the new world-class sampling and laboratory facility at the Richards Bay Coal Terminal in 2016, along with the award of five onsite coal contracts, has provided the base for a strong energy minerals outlook in South Africa for 2017.
Trade services achieved solid performance in steel and raw materials and fertiliser trading activities, with Russia, Mexico and China driving growth. However, these results were partially offset by flat performance in non-ferrous activities.
The business added mine and plant services to its portfolio in 2016. This expansion has led to the securing of plant optimisation contracts in Russia and Mexico, with a solid pipeline of opportunities for 2017.
Metallurgy continued to be impacted by reduced exploration expenditure in 2016, although performance showed improvement in the second half of the year.
ADJUSTED OPERATING MARGIN
The adjusted operating margin for the period increased to 14.3% from 14.0% in prior year (constant currency basis), as a result of gains achieved from efficiency and optimisation initiatives across the global network.
ACQUISITIONS
During the first quarter, the Group concluded the acquisition of Bateman Projects in Africa, which specialises in process plant design and site engineering services. The acquisition has further strengthened the Group’s position as the leading one-stop-shop service provider.

44
4. BUSINESS LEADERSHIP
SGS SERVICE
> Statutory and Voluntary Inspection Services
CONSUMER BENEFIT
> A safe gas supply to your home

20162015
45
OIL, GAS AND CHEMICALS
REVENUE IN CHF MILLION
GROWTH IN 2016
1 098.4 -2.1%
(CHF million)
20162015
PRO-FORMA2, 3 20153
REVENUE 1 098.4 1 122.2 1 126.4
Change in % (2.1) (2.5)
ADJUSTED OPERATING INCOME¹ 116.4 126.5 128.6
Change in % (8.0) (9.5)
MARGIN %¹ 10.6 11.3 11.4
1. Before amortisation of acquisition intangibles, restructuring and other non-recurring items. – 2. Constant currency basis. - 3. Restated figures due to the change in business structure.
SGS will provide offshore inspectors and third-party laboratory services for Shell’s Prelude floating liquefied natural gas (LNG) project, ensuring expert support in independent quantity and quality measurements for one of the most significant projects of its kind ever undertaken.
GROWTH AND REVENUE
Oil, Gas and Chemicals reported a decline in revenue of -2.1% (of which -2.5% organic) to CHF 1 098 million for the year. Performance was affected by continued low oil prices and further market deterioration.
Trade-related services remained flat. Despite some customer-driven procurement activities leading to volume splits and a reduced number of physical transactions, the business remained resilient to industry-wide price adjustment pressure and increased its market share in most regions.
Plant and Terminal Operations remained stable compared to the prior year. North America, the strongest region, delivered low single-digit growth, while performance in Europe was impacted by procurement-driven volume splits and the loss of important contracts as a result of pricing.
Upstream Services experienced a decline, mainly in the exploration sector in Australia and the Sub-Surface Consultancy segment. The deterioration of the security situation in some regions also resulted in the withdrawal of teams. This decline was marginally offset by several contract wins in the Production segment.
Oil Condition Monitoring delivered single-digit growth driven by strong performance across the laboratory network from international and local customers. The Non-Inspection Related Testing business declined slightly, impacted by industry in-sourcing trends and reduced investment in laboratories.
Cargo Treatment Services and Fuel Integrity Programmes (FIP) were impacted by the cessation of FIPs in Saudi Arabia and Ghana. The rest of the business remained flat.
The Sample Management segment delivered high double-digit growth. Measurements and Instrumentation operations posted high single-digit growth in all regions, with performance driven by an improved execution platform and stable statutory calibration requirements.
ADJUSTED OPERATING MARGIN
The adjusted operating margin decreased from 11.3% in prior year (constant currency basis) to 10.6%. The decrease can be attributed to revenue decline, which was partially offset by strict cost-control measures and an improvement in revenue quality as a result of strong contract performance reviews.
ACQUISITIONS
During the year, the Group acquired Cargo Compliance Company in the Netherlands, active in packing, storage, consulting, classification and professional training for the handling of dangerous goods. This has established SGS as the Dutch market leader in this growing segment.

46
4. BUSINESS LEADERSHIP
SGS SERVICE
> REACH Testing Services
CONSUMER BENEFIT
> Chemicals present in your accessories limited to safe levels

20162015
47
CONSUMER AND RETAIL
REVENUE IN CHF MILLION
GROWTH IN 2016
872.8 6.3%
(CHF million)
20162015
PRO-FORMA2, 3 20153
REVENUE 872.8 821.2 826.1
Change in % 6.3 5.7
ADJUSTED OPERATING INCOME¹ 223.6 212.0 215.7
Change in % 5.5 3.7
MARGIN %¹ 25.6 25.8 26.1
1. Before amortisation of acquisition intangibles, restructuring and other non-recurring items. – 2. Constant currency basis. - 3. Restated figures due to the change in business structure.
During 2016, the business successfully launched a new Supplier Quality Engineering Service, a turnkey solution to support global Electrical and Electronics clients with activities ranging from supplier selection and research and development to regulatory compliance and onsite production monitoring. This high-value service is already proving to be a success, especially for clients launching products in multiple markets.
GROWTH AND REVENUE
Consumer and Retail delivered revenue growth of 6.3% (of which 4.7% organic) to CHF 873 million for the year. High single-digit growth was achieved in Northern Central and Southern Europe, Eastern Europe and Middle East, Africa, China and Hong Kong and South East Asia.
Softlines reported robust growth over the year. This was attributable to the acquisition of new global accounts,
improved market share in Footwear Testing and Consulting, as well as the expansion of its footprint in emerging markets. Softlines also benefited from increased activity related to Detox and zero discharge of hazardous chemicals (ZDHC) campaigns.
Despite difficult market conditions for Wireless testing due to the reduction in the number of mobile phone models, Electrical and Electronics achieved solid growth and benefited from high volume in Restrictive Substance Testing as well as in Electrical Magnetic Compatibility, Safety and Reliability testing activities.
Cosmetics, Personal Care and Household delivered high growth throughout the year, especially in China, Germany and North America.
High single-digit growth in Hardlines was driven by the acquisition of new global customers in both the toys and juvenile products segment and the hardgoods segment, as well as an increased level of activity in the e-market sector.
ADJUSTED OPERATING MARGIN
The adjusted operating margin for the period decreased from 25.8% in prior year (constant currency basis) to 25.6% as a result of difficult market conditions in Wireless.
ACQUISITIONS
During 2016, the Group acquired Integrated Paper Services Inc. (IPS Testing) in the USA, an independent testing laboratory offering physical and analytical testing in both the consumer and supplier environments, and Compliance Certification Services Inc., one of the China’s leading Electro Magnetic Compatibility testing laboratories with operations throughout Taiwan and China.
48
4. BUSINESS LEADERSHIP
SGS SERVICE
> BS 8555 Certification
CONSUMER BENEFIT
> Your favourite coffee being environmentally friendly

20162015
49
CERTIFICATION AND BUSINESS ENHANCEMENT
REVENUE IN CHF MILLION
GROWTH IN 2016
324.1 9.1%
(CHF million)
20162015
PRO-FORMA2, 3 20153
REVENUE 324.1 297.0 298.6
Change in % 9.1 8.5
ADJUSTED OPERATING INCOME¹ 57.5 48.2 48.7
Change in % 19.3 18.1
MARGIN %¹ 17.7 16.2 16.3
1. Before amortisation of acquisition intangibles, restructuring and other non-recurring items. – 2. Constant currency basis. - 3. Restated figures due to the change in business structure.
With the aim of building its profile as a leading solution provider, the business won a contract to develop e-learning courses for a leading brewing company in Peru. The contract win has given the business a foothold in the solution provision market in Peru.
GROWTH AND REVENUE
Certification and Business Enhancement delivered solid revenue growth of 9.1% (entirely organic) to CHF 324 million for the year. Training activities focused on the adoption of new standards and regulations were a key driver.
The business experienced strong client demand for the new ISO 9001:2015 and ISO 14001 standards driving double-digit growth in Training Services. In addition, the development of technical training dedicated to specific industries in China and the gradual rollout of new online courses around the network also contributed significantly to growth.
Performance Management delivered double-digit growth as a result of a combination of factors, including significant contract wins from Spanish and British tour operators in hospitality excellence services along with the development of local initiatives to meet the increasing demand from customers to create customised programmes.
ADJUSTED OPERATING MARGIN
The adjusted operating margin for the year increased to 17.7% from 16.2% in prior year (constant currency basis). Growth was driven by improved efficiency along with the recent opening of a second global business centre in Asia. In addition, restructuring completed at the end of 2015 helped Germany to return to growth and profitability.

50
4. BUSINESS LEADERSHIP
SGS SERVICE
> Feasibility Study
CONSUMER BENEFIT
> Efficient and appropriate use of taxpayers’ money

20162015
51
INDUSTRIAL
REVENUE IN CHF MILLION
GROWTH IN 2016
890.9 5.5%
(CHF million)
20162015
PRO-FORMA2, 3 20153
REVENUE 890.9 844.2 852.4
Change in % 5.5 4.5
ADJUSTED OPERATING INCOME¹ 83.6 93.9 95.5
Change in % (11.0) (12.5)
MARGIN %¹ 9.4 11.1 11.2
1. Before amortisation of acquisition intangibles, restructuring and other non-recurring items. – 2. Constant currency basis. - 3. Restated figures due to the change in business structure.
The recently acquired business in South Africa has developed a solid relationship with the South Africa National Roads Agency Ltd (SANRAL) through its onsite laboratories. The network, currently consisting of 50 onsite laboratories and generating a significant portion of revenues, boasts a solid growth pipeline.
GROWTH AND REVENUE
Industrial delivered revenue growth of 5.5% (of which -2.6% organic) to CHF 891 million for the year, despite an organic decline in the Energy and Construction markets impacting the TIC sector.
The slowdown in the Energy market was primarily related to depressed oil and gas activities. A reduction in capital investment and spending continued to put pressure on volumes and prices in North America, South Eastern Asia Pacific and Africa. The pressure was partially offset by solid downstream activity in the Middle East and organic
growth in the energy market in China and the nuclear market in Western Europe.
Infrastructure and Construction activities were affected by reduced public investment in some South American countries and Europe. However, this decline was mitigated by the growth in construction testing activities in Africa and in project supervision in Chile.
The Group continued to extend its laboratory testing network, adding new capabilities in construction and calibration testing, which delivered double-digit growth.
ADJUSTED OPERATING MARGIN
The adjusted operating margin for the period declined from 11.1% in prior year (constant currency basis) to 9.4%. The performance was impacted by difficult market conditions in oil and gas, in addition to overall price pressure.
ACQUISITIONS
During the year, the Group acquired Matrolab Group in South Africa, Laboratorios Contecon Urbar in Panama and Colombia, and Laboratorio de Control Técnico de Calidad de Construcción Eecolab Limitada in Chile.
These South American acquisitions focus on quality control testing in the construction industries. The Group also acquired Roos+Bijl in the Netherlands, which provides engineering and consulting, project management, asset management and legal services for all types of underground infrastructure.

52
4. BUSINESS LEADERSHIP
SGS SERVICE
> Ballast Water Sampling
CONSUMER BENEFIT
> The long-term protection of our oceans

20162015
53
ENVIRONMENT, HEALTH AND SAFETY
REVENUE IN CHF MILLION
GROWTH IN 2016
464.3 23.6%
(CHF million)
20162015
PRO-FORMA2, 3 20153
REVENUE 464.3 375.7 375.6
Change in % 23.6 23.6
ADJUSTED OPERATING INCOME¹ 54.9 48.0 48.0
Change in % 14.4 14.4
MARGIN %¹ 11.8 12.8 12.8
1. Before amortisation of acquisition intangibles, restructuring and other non-recurring items. – 2. Constant currency basis. - 3. Restated figures due to the change in business structure.
The adoption of the International Maritime Organization Ballast Water Management Convention and new vessel emission standards are expected to accelerate Marine services revenue.
GROWTH AND REVENUE
Environment, Health and Safety delivered strong revenue growth of 23.6% (of which 6.9% organic) to CHF 464 million for the year. Growth was driven by the expansion of environment testing services in North America, increased volumes from global health and safety contracts (mainly in Europe), and strong trends in the dioxins market in Brazil, China and Taiwan.
Europe delivered strong results from high-volume and high-margin laboratory contracts, particularly in Germany, Italy and the Benelux countries. Health and safety contract wins in the hospitality and real estate sectors were also a factor. North America benefited from the acquisition of Accutest Laboratories and AXYS Analytical Services Ltd.,
expanding the footprint and service portfolio. China and Taiwan delivered significant growth from high demand for testing services due to increased enforcement and environmental regulations. In South America, high single-digit growth came from a rapidly developing dioxins market in Brazil and 2015 acquisitions that performed in line with expectations. In Australia, slower economic activities in the oil and mining sectors continued to hamper growth.
ADJUSTED OPERATING MARGIN
The adjusted operating margin for the year decreased from 12.8% in prior year (constant currency basis) to 11.8%. The decline can be attributed to a temporary margin dilutive effect from the integration of the Accutest acquisition which was partially offset by the completion of several large projects in Europe.
ACQUISITIONS
During the year, the Group acquired the assets of Accutest Laboratories, the fifth largest full-service environmental testing company in the United States, and AXYS Analytical Services Ltd., the North American leader in ultra trace analysis of Persistent Organic Pollutants, Contaminants of Emerging Concerns
and the early development stages of the fast-growing metabolomics business. These acquisitions enhanced the geographical footprint and boosted its service portfolio in North America.

54
4. BUSINESS LEADERSHIP
SGS SERVICE
> Aviation Fuel Testing
CONSUMER BENEFIT
> Peace of mind when flying

20162015
55
TRANSPORTATION
REVENUE IN CHF MILLION
GROWTH IN 2016
489.8 12.9%
(CHF million)
20162015
PRO-FORMA2, 3 20153
REVENUE 489.8 433.7 447.6
Change in % 12.9 9.4
ADJUSTED OPERATING INCOME¹ 78.5 80.4 82.1
Change in % (2.4) (4.4)
MARGIN %¹ 16.0 18.5 18.3
1. Before amortisation of acquisition intangibles, restructuring and other non-recurring items. – 2. Constant currency basis. - 3. Restated figures due to the change in business structure.
SGS opened a state-of-the-art facility in Michigan capable of performing servo-hydraulic, shock and vibration testing. This facility provides an increase in capacity in close proximity to many of our automotive customers, and expands our capabilities to cover a wider transportation market.
GROWTH AND REVENUE
Transportation delivered strong revenue growth of 12.9% (of which 7.9% organic) to CHF 490 million for the year. Growth was driven by all activities of the business.
Regulated services strengthened its position in the Americas, Europe and Africa, with solid growth in Vehicle Inspection Services along with a new contract awarded and successfully deployed in France to administer driving theory tests. This contract generated strong results in the second half of the year. In Mauritius, the Group started inspections in the fourth quarter following the award of a contract for the
management of a test station in 2013. In Uganda, inspections started at the end of the second half of the year and implementation is on schedule. In Argentina, the first inspections relating to a new contract were performed in the fourth quarter at two new stations in Buenos Aires.
In the USA, a contract extension, including increased scope, was signed with the State of California to run the next generation electronic transmission data management service for the California Smog Check programme. In addition, Field Inspection activities delivered solid results, supported by increased inspection volumes from existing clients in Europe and the USA.
Testing Services for materials, components and vehicles and engines continued to grow with solid contributions from operations in China, France, India and the USA. The business also expanded its services to include lightweight materials testing for aerospace and automotive applications in France.
Field Services’ supply chain operations began to focus on the new quality standard IATF 16949 for the automotive industry, which will come into effect in 2018 and will oblige clients to adapt their quality management systems.
Services delivered by recently acquired companies have been replicated successfully in new regions.
ADJUSTED OPERATING MARGIN
The adjusted operating margin for the period declined from 18.5% in prior year to 16.0% (constant currency basis). The decrease can be attributed to investments in the development of testing activities and start-up costs for the new contracts signed in the Americas and Africa.
ACQUISITIONS
The Group acquired CyberMetrix Inc. in the USA, providing high horsepower engine testing services to meet the complex emission standard requirements on engines.

56
4. BUSINESS LEADERSHIP
SGS SERVICE
> Forest Management Certification
CONSUMER BENEFIT
> Forests for our grandchildren to enjoy

20162015
57
GOVERNMENTS AND INSTITUTIONS
REVENUE IN CHF MILLION
GROWTH IN 2016
274.7 10.0%
(CHF million)
20162015
PRO-FORMA2 2015
REVENUE 274.7 249.8 260.0
Change in % 10.0 5.7
ADJUSTED OPERATING INCOME¹ 66.6 58.0 62.3
Change in % 14.8 6.9
MARGIN %¹ 24.2 23.2 24.0
1. Before amortisation of acquisition intangibles, restructuring and other non-recurring items. – 2. Constant Currency basis.
During the year, the Group launched SGS Renovo, a unique, trademarked e-waste management solution, with four contracts secured around the world.
GROWTH AND REVENUE
Governments and Institutions delivered solid growth of 10.0% (entirely organic) to CHF 275 million for the year, with a continued trend of solid performance from Product Conformity Assessments (PCA).
The PCA market share strengthened remarkably during the period. In addition, two new programmes were implemented in Cameroon and Gabon, with the contract in Cameroon coming online in the second half of 2016.
The Business delivered exceptional organic growth with the completion of the e-Gov programme (Inland Revenue Management platform) deployment in Ghana and a new 100% scanning programme which was launched using SGS D-TECT®, a revolutionary remote inspection solution in Cameroon in 2016.
Single Window solutions growth was driven by strong performance in Ghana and Madagascar, where increased import volumes had a significant impact.
The new valuation solution, SGS E-Valuator™, was successfully launched in Haiti and fully implemented in Cameroon. The solution corresponds with the Group’s strategy of implementing World Trade Organization and World Customs Organization recommendations to discontinue pre-shipment inspections.
ADJUSTED OPERATING MARGIN
The adjusted operating margin for the year significantly increased to 24.2% from 23.2% in prior year (constant currency basis), driven by strong trade volume from PCA and Single Window solutions.

58
In addition to our traditional acquisition strategy, which saw us focusing on outright purchases to complete networks or supply chains, we have also begun to create strategic partnerships. We define these as the purchase of minority stakes (5-25%) in businesses that operate in areas in which we are not generally active.
We take these positions particularly in the technology sector where they allow us to secure and enhance our position in the face of the disruption of the traditional service-based industry marketplace. An example of this is our strategic partnership with AgFlow, the innovative Swiss-based trade intelligence platform in which we own a 15% stake.
Located in the global commodities trading hub of Geneva, AgFlow aggregates Over-The-Counter (OTC) market data on global grains, oilseeds, proteins and edible oils from market participants worldwide. SGS’ existing research studies will enrich the AgFlow market intelligence platform, while AgFlow will broaden its technological expertise in data analytics to transform its raw data into actionable information for SGS’ customers in the agricultural supply chain.
This partnership is an excellent example of how we leverage our strategic partnerships to drive innovation and improve our service offering.
In addition to growing organically, SGS has long benefited from making strategic acquisitions to help us achieve our goals. This is particularly true for geographical areas where we have service gaps, or where we want to acquire leading skills, capabilities and technological capacities. On other occasions, it also makes sense for us to acquire targets that offer similar services to SGS and where by joining forces, we can benefit from economies of scale and technical synergies.
Careful thought is given to every acquisition. For example, Accutest, a leading environmental testing company in the United States, with seven strategically located laboratories and over 600 employees, presented a unique opportunity to us. The move immediately allowed us to position SGS as one of the top environmental laboratory players in the country.
This is particularly significant as the US still represents the world’s largest environmental testing market. Moreover, it provides us with access to a significant and diverse customer base, offering an additional potential upside for our global network.
In China meanwhile, our 51% stake in Suzhou Safety-Tech Valve Testing Co., Ltd., an independent safety valve testing laboratory, gives us an early-mover advantage in a growing market. Although the laboratory only operates locally, it has a number of nationwide accreditations, allowing us to fully leverage the SGS national network across China.
These examples provide a good overview of our acquisition strategy. We do not see much value in acquiring isolated businesses that are disconnected from the activities of the remainder of the Group, irrespective of the price point. We prefer to acquire companies that allow us to realise synergies across the Group while building scale, enhancing our capabilities, filling geographic gaps, and improving our financial metrics, whilst always maintaining strategic significance.
Ultimately, the decision of whether or not to make an acquisition comes down to experience. And our experience in the field of acquisitions is one of the main reasons behind our successful growth over the last 138 years.
4. BUSINESS LEADERSHIP
ACQUISITIONS STRATEGIC PARTNERSHIPS

59
2016 ACQUISITIONS AND STRATEGIC PARTNERSHIPS
SUZHOU SAFETY-TECH VALVE TESTING CO., LTD. * (51% stake) China
ACCUTEST LABORATORIES (Assets) USA
CARGO COMPLIANCE COMPANY Netherlands
THE LAB (ASIA) LTD. (51% stake) Hong Kong
MATROLAB GROUP * South Africa
CYBERMETRIX INC. USA
SHENZHEN FIRSTRANK INDUSTRIAL DEVELOPMENT CO. LTD. * (75% stake) China
BATEMAN PROJECTS * (Assets) South Africa
TRANSPARENCY-ONE (20% stake) USA
INTEGRATED PAPER SERVICES INC. (IPS TESTING) USA
LABORATORIOS CONTECON URBAR Colombia and Panama
SPECHUB Panama
AGFLOW (15% stake) Switzerland
EECOLAB LTDA. Chile
UNIGEO AGRICULTURA DE PRECISÃO (75% stake) Brazil
COMPLIANCE CERTIFICATION SERVICES INC. Taiwan
ROOS+BIJL Netherlands
AXYS ANALYTICAL SERVICES LTD. Canada
BIOPREMIER (70% stake) Portugal
C-LABS SA Switzerland
LAAGRIMA Morocco
Acquisition
Asset
Strategic partnership
* Transaction secured in 2015 and closed in 2016

4. BUSINESS LEADERSHIP
60
THE WORLD CHANGES. PEOPLE MOVE ON. MARKETS EVOLVE. AND WORLD-CLASS BUSINESSES LIKE SGS NEED TO STAY AHEAD OF THE CURVE IN ORDER TO RETAIN THEIR POSITIONS AS MARKET LEADERS INTO THE FUTURE.
INNOVATION
Having been founded in 1878, SGS has a long track record of providing outstanding service to its customers. We are proud of this history and the hard work that has gone into making SGS the leading brand in the TIC industry. Yet we know that market leaders do not hold onto the top spot by clinging to past glories. That’s why we are evoking the same spirit that helped us pioneer the industry, to enable us to move it forward.
For us the key to this is innovation. Often the best innovation is driven by market demand. Our customers are operating in highly competitive environments, where marginal gains make all the difference. Moreover, as circumstances change and new segments appear, they need to remain agile enough to exploit the opportunities these present.
This means they are looking for innovative tools and services that can help them gain an edge. It is our
job to make that happen. Customer-driven innovation comes from a deep understanding of processes, pain points, markets, technology and fundamental business strategy.
But that is not our only source of inspiration. We are a company with a great belief in our own people. They are the ones who are working on the proverbial coalface and who are often closest to the problem. Our internal innovation initiative currently has over 300 approved suggestions from employees in the pipeline for further research. This constantly reminds us that sometimes the answers you need can be found on your own doorstep.
On other occasions, strategic partnerships or acquisitions provide the insight we need. That is why ensuring full knowledge sharing is so important during the integration process, as is allowing acquired companies to retain their freedom and entrepreneurial spirit.
The world changes. People move on. Markets evolve. And world-class businesses like SGS need to innovate, to adapt and realign in order to retain their positions as market leaders into the future.

61
SGS SERVICE
> Persistent Organic Pollutant Testing
CONSUMER BENEFIT
> Living in a world with fewer toxins

4. BUSINESS LEADERSHIP
62
OUR ABILITY TO OFFER WORLD-CLASS EXPERTISE IS DIRECTLY LINKED TO THE QUALITY OF OUR PEOPLE.
EXPERTISE
Trusted all over the world, SGS is a market leader because we put passion and pride into everything we do. Our business touches nearly every part of the world and reaches across a huge range of industries. Our international experts help our customers operate in more efficient and sustainable ways by streamlining processes, improving quality and productivity, reducing risk, verifying compliance and increasing speed to market. Therefore, having the best people is not only a benefit for SGS, it is essential.
For example, thanks to our experts, in August 2016 we received the Industry Appreciation Award from the Canadian Special Crops Association for our contribution to the Canadian pulse crop industry. In the same month, we also received the Bosch
North America Supplier Award for our role in the design, build and ongoing operation of Bosch’s dedicated state-of-the-art testing centre in Lapeer, Michigan.
Our position as a top employer has also been recognised: in 2016 we won an Investors in People (IiP) Gold Award in the Philippines (see page 226 for more details).
Such successes can only occur in an environment where our employees are given the freedom to exercise their judgement and make decisions. Crucially though, they also have the skills and ability to work in that way. Brimming with passion and energy, they are confident in their own abilities and in the capabilities of the wider network.
Consequently, we are mindful of the fact that recruiting and retaining the best talent is important for us (see pages 75 and 76). New and bold thinking is the lifeblood of our business - it is part of what keeps us ahead of the competition.

63
SGS SERVICE
> Leadership and Management Training
CONSUMER BENEFIT
> Access to world-class training globally

4. BUSINESS LEADERSHIP
64
INERTIA IS NOT AN OPTION FOR BUSINESSES LIKE SGS. WE MUST CONSTANTLY ADAPT TO CHANGING CUSTOMER DEMANDS AND MARKET CONDITIONS.
INVESTMENT
Investment is vital. Having the right talent, assets, technology and R&D in place are fundamental to the long-term success and profitability of any organisation.
This is particularly true for SGS, which must not only stay ahead of developments in the TIC industry, but also keep abreast of the technologies, markets, regulations and dynamics of the extremely diverse industries we service.
Moreover, in order to offer our customers a first-class service, our own processes and capabilities must also be optimal. That’s why in 2016 we invested in the implementation of a new IT platform. SGS Connect, as the project is called, includes a number of features such as Office365, Skype for Business, and Yammer that enable our staff to work collaboratively across the globe whether they are in the field, the lab or the office. The overall IT system upgrade significantly improves efficiency across the entire Group.
However, investing in technology doesn’t always mean buying brand
new equipment. Our new EquipNet programme serves as an internal marketplace, where SGS teams can save money by buying equipment from other areas of the business. This can result in hundreds of thousands of Francs in savings across the Group and significantly reduce waste.
Of course, technology is not our only area of investment. We invest in our people, their onboarding and ongoing learning and development. We also invest in acquisitions and in innovation with an emphasis on supporting new business areas with long-term growth potential. In 2016, we also invested CHF 1 177 000 in the communities we work in around the world as part of our sustainability work (see pages 89-90 for more details).
Naturally, despite being in a strong financial position, SGS will only invest in areas where we feel we will see significant returns. Thus, Capital Expenditure (Capex) investments are focused on the strongest areas of the business, and those with the best growth record or long-term growth potential.
Standing still is not an option for a business that intends to retain its status as an industry leader, and SGS has no intention of doing so.

65
SGS SERVICE
> Project Finance Services
CONSUMER BENEFIT
> More projects meeting environmental and social standards

66
HOW DO BUSINESSES ENSURE WORLD-CLASS PERFORMANCE? BY ASSURING GENUINE OPERATIONAL EXCELLENCE ACROSS BUSINESS AND FUNCTIONS. THIS INCLUDES USING THE BEST POSSIBLE SUSTAINABLE BUSINESS PRACTICES.
OPERATIONAL EXCELLENCE
For SGS, an important aspect of operational excellence is ensuring our business is sustainable. As well as delivering services that promote sustainable development, we manage our sustainability performance through our global management system and accompanying processes, which are aligned to ISO 26000, ISO 14064 (for emissions inventories and verification), the Global Reporting Initiative’s G4 Guidelines and the AA1000 Principles.
Our four sustainability pillars – Professional Excellence, People, Environment and Community – are supported by Group-wide policies, global programmes linked to our Sustainability Ambitions 2020 and multiple local initiatives.
Strong governance structures underpin the delivery of our sustainability strategy. Our Sustainability Steering Committee, a sub-group of the Operations Council (see page 117), oversees and approves our sustainability strategy and monitors performance against our policies and objectives. Our Corporate Sustainability team oversees and reviews our sustainability management and reporting. Progress is tracked using more than 90 sustainability indicators,
which are captured at country level as part of our financial reporting system. Our sustainability performance and associated financial impacts are presented in our Green Book, which is prepared for senior managers every six months to pinpoint where actions are required to mitigate risk or maximise opportunities across our affiliates.
After eight years of developing and deploying our global sustainability programme, we are transitioning its focus from delivering transactional value - achieving operating efficiencies and cost savings through programmes that engage employees in action – to one that has the power to deliver transformational change on a global scale. Our aim is to engage internal and external stakeholders in actions that deliver value to society, while our Leadership team will become increasingly engaged in championing sustainability and demonstrating its value to our business and wider society.
In 2016, we updated our sustainability policies and guidelines to ensure that they were aligned with the SGS Business Principles, the SGS Human Rights Policy, our Sustainability Ambitions 2020 and our Business Materiality Matrix. A detailed account of our sustainability governance, management and performance, together with our sustainability policies and good practice case studies can be found in our online report: www.sgs.com/cs-report2016.
4. BUSINESS LEADERSHIP

67
SGS SERVICE
> ISO 26000 Performance Assessment
CONSUMER BENEFIT
> More socially responsible businesses

68
PROFESSIONAL EXCELLENCE
Trust lies at the heart of the value we deliver to our customers and society. We have a responsibility to maintain the highest levels of professional integrity.
SGS SERVICE
> Supply Chain Security Management
CONSUMER BENEFIT
> Corporations working against corruption, bribery and human trafficking
4. BUSINESS LEADERSHIP

20162015201420132012 20162015201420132012 20162015201420132012
20162015201420132012
69
EMPLOYEES SIGNING THE CODE OF INTEGRITY
CODE OF INTEGRITY NON-COMPLIANCES CODE OF INTEGRITY REPORTS
CODE OF INTEGRITY INVESTIGATIONS
100 100
22TOTAL NUMBER OF BREACHES OF THE CODE OF INTEGRITY IDENTIFIED THROUGH CORPORATE INTEGRITY HELPLINES
“Helplines” means channels used by employees and external parties to report suspected violations of the Code of Integrity and submitted online, by phone call, sent via fax, email or post.
46
36
42
22
207TOTAL NUMBER OF INTEGRITY ISSUES REPORTED THROUGH CORPORATE INTEGRITY HELPLINES
“Helplines” means channels used by employees and external parties to report suspected violations of the Code of Integrity and submitted online, by phone call, sent via fax, email or post.
245
198 200
241
207
155TOTAL NUMBER OF VALID REPORTS INVESTIGATED CONCLUDING IN NO BREACHES
169
91
141
109
155
Business ethics, integrity and respect for human rights have been identified as material issues, as defined in our Business Materiality Matrix (see page 101).
The SGS Code of Integrity defines the main principles of professional integrity for the SGS Group and is an expression of the values that are shared throughout the organisation. The Code applies to all SGS employees, officers and directors, affiliated companies, contractors, joint-venture partners, agents, subcontractors and anyone acting on behalf of or representing SGS.
It addresses issues such as conflicts of interest, bribery and corruption, facilitation payments and the use of intermediaries and consultants. Violations of the Code result in disciplinary action, including termination of employment and criminal prosecution for serious violations.
Training forms part of a continuous process of learning and reinforcement, which includes employees signing the Code, completing integrity e-learning as part of their onboarding programme, and attending annual integrity training.The content of our annual integrity training is refreshed each year using case studies drawn from the business as well as emerging issues. As of 2017, the training programme will feature a mandatory case study on human rights. Training is typically delivered face to face
and in teams by trained managers using scenarios adapted to employees’ areas of work. New employees must sign the Code of Integrity at the start of their employment with SGS and are expected to complete an integrity e-learning module within three months of joining.
A Professional Conduct Committee ensures implementation of the Code within our organisation and advises Management on all issues of business ethics. The Committee consists of five members: the Chairman of the Board of Directors, two other Board members, the Chief Executive Officer and the Chief Compliance Officer.
A Human Rights Committee, chaired by the Chief Executive Officer, and comprising the Chief Compliance Officer and Vice President Corporate Sustainability met the first time in January 2017 to plan activities associated with the deployment of our new Human Rights Policy and employee training on the issue.
OUTLOOK 2017
We will be working on extending the scope of our reporting in order to include breaches occurring locally and pending cases which are still under review at the time of the reporting. We expect to report on these figures in the coming years.
PERFORMANCE
100%
% OF EMPLOYEES SIGNING THE CODE OF INTEGRITY
100 100
COMPLIANCE AND INTEGRITY
100
31

70
The SGS Human Rights Policy elaborates on the requirements within the SGS Code of Integrity, the SGS Business Principles and associated policies to treat everyone with whom we come into contact with fairness, dignity and respect. It consolidates our existing commitments and brings increased clarity on our approach to respecting human rights across our global business.
The Sustainability Steering Committee was involved in reviewing and proposing modifications to the draft policy, and employees on the SGS European Works Council were consulted on it and were given the opportunity to question the CEO and Vice President, Corporate Sustainability on what this Policy means for SGS and for its employees worldwide. The Policy will be approved by the Operations Council in early 2017 and will be deployed across the business during the year.
OUR HUMAN RIGHTS COMMITMENTS
• We are committed to conducting our business in a manner that respects the rights and dignity of everyone affected by our business activities, acting with due diligence, and addressing the adverse impacts of our global operations.
• We honour the principles and guidance contained in the United Nations Guiding Principles on Business and Human Rights.
• We comply with all applicable laws and we respect internationally recognised human rights wherever we operate. Where national law and international human rights standards differ, we follow the higher standard; where they are in conflict, we adhere to national law and we seek ways to respect international human rights to the greatest extent possible.
• We treat the right of causing or contributing to gross human rights abuses as a legal compliance issue.
• In the course of its activities, SGS will not willingly be complicit of human rights violations.
• SGS policies and codes are informed by the International Bill of Human Rights and the International Labour Organization’s declaration on Fundamental Principles and Rights at Work; the Children’s Rights and Business Principles; UN Women’s Empowerment Principles; and the UN Global Compact.
• We strive to treat everyone with whom we come into contact fairly and without discrimination. Our employees, sub-contractors, business partners and suppliers are entitled to work in an environment and under conditions that respect their rights and their dignity.
• We respect freedom of association. Where our employees wish to be represented by trade unions or works councils, we will cooperate in good faith with the bodies that our employees collectively choose to represent them within the appropriate national legal frameworks.
• We respect the rights of people in communities impacted by our activities. We will seek to identify adverse human rights impacts and take appropriate steps to address and remedy them.
• Our actions are guided by transparency, fact-based decision-making and based on a preventative, precautionary and integrated approach to environmental management. This means conforming to or exceeding the requirements of national or international regulations as well as investing in environmental technologies and engaging in continuous and informed dialogue with relevant stakeholders.
• In our business dealings we expect our partners to adhere to standards of conduct and business principles that are consistent with our own. We are also committed to working collaboratively with state and non-state actors to inform our approach, share experiences and help address shared challenges and influence systemic positive change.
SGS HUMAN RIGHTS POLICY
4. BUSINESS LEADERSHIP

71
SGS FRAMEWORK FOR MANAGING HUMAN RIGHTS
MANAGEMENT COMMITMENT
Human rights commitments are embedded in the SGS Code of Integrity, the SGS Human Rights Policy and the SGS Business Principles and its related policies. We evaluate and review our approach to ensure that it reflects developments in laws and societal expectations.
GOVERNANCE
The Operations Council assesses the scope of SGS involvement in particular regions and evaluates the risks to individuals, communities and SGS assets. The SGS Human Rights Committee oversees implementation of our human rights commitments across the Group. Senior managers are expected to demonstrate visible and explicit support for human rights as defined in the SGS Code of Integrity and the SGS Business Principles. The Chief Compliance Officer manages compliance with the SGS Code of Integrity, while the SGS Corporate Security team ensures that security arrangements adequately protect our people and assets and respect human rights.
INTERNAL CONTROLS
Impact and risk assessments, supplier screening, audits of local security arrangements and other due diligence processes are used to identify, prevent, mitigate and account for how SGS addresses its human rights impacts. Due diligence is an ongoing process, requiring particular attention at certain stages in our business activities, such as when forming new partnerships or when our operating conditions change. We also conduct, as appropriate, additional due diligence in countries where there are particularly high, systemic risks of human rights abuses.
COMMUNICATION AND TRAINING
All managers and employees receive mandatory training on the SGS Code of Integrity, which includes human rights aspects. We also provide specific training to relevant business functions. We recognise the importance of dialogue with our stakeholders and we pay particular attention to individuals and groups at greater risk of adverse human rights impacts due to their vulnerability or marginalisation.
MONITORING COMPLIANCE
The SGS Code of Integrity and the SGS Code of Conduct for Suppliers contain clear requirements and guidance on grievance mechanisms. Suspected violations are reported via an Integrity Helpline or directly to the corporate and local Compliance teams. We encourage employees and other stakeholders to report any concerns without retribution. Performance against the SGS Code of Integrity is reported to the Professional Conduct Committee. Internal reports and briefings on global security risks and human rights impacts are regularly prepared for senior managers.
REMEDIATIONWe cooperate with the relevant authorities to identify, mitigate and remedy adverse human rights impacts that our business operations cause or contribute to.
TRANSPARENCYWe are committed to the transparent reporting of our human rights commitments and performance through our Annual Report and our online Sustainability Report.

72
ACHIEVEMENTS
Procurement’s global efforts in 2016 have led to a number of major achievements. Worldwide, the function reported CHF 57 million in new savings in 2016 as part of a three-year savings programme for 2015-2017. In 2016, the function developed a solid methodology to monitor the impact of procurement savings in the Profit and Loss Account. Our supplier incentive programme experienced significant growth during 2016, further focusing our procurement volume on strategic suppliers.
We have also reduced the number of suppliers worldwide by 24%, brought rationalisation to our invoicing, delivery and transaction volumes, increased the use of our internal catalogues by 20% and created a streamlined procurement community.
As part of our supply chain strategy, we have launched a pilot transportation management tool to optimise efficiency and ease demand planning. 2016 also saw the establishment of a Real Estate team to review our leasing and tenure arrangements. As part of this initiative, all our portfolio data have been uploaded into a centralised management system, giving us transparency across all countries.
2016 was also a remarkable year for our sustainability and innovation-based initiatives. Supply chain sustainability was identified by SGS stakeholders as being a material issue for the Company, as defined in our 2016 Business Materiality Matrix (see page 101).
We launched the SGS Code of Conduct for Suppliers, setting out the basis of our responsible sourcing approach. We also launched our Supplier Self-Assessment Questionnaire, designed to align our suppliers’ management approach to our defined standards on integrity, human rights, health and safety, environment and community.
We further strengthened our supplier innovation programme with three new strategic suppliers joining. The supplier innovation programme is an integral part of our supplier strategy to drive closer collaboration and supplier partnerships. The programme has now been integrated within our Global Innovation initiative. To date, we have completed seven innovation days at supplier R&D
centres and have five ongoing revenue projects, along with a solid pipeline of innovative ideas.
Case study
EquipNet is a web-based platform that enables our procurement and lab managers to redeploy fixed assets across the SGS network and sell them externally. Using the tool, equipment can be sourced at a 25%–75% discount, which saves money and minimises waste through re-use. Since its implementation in October 2015, EquipNet has attracted around 840 internal users and in December 2016 had an inventory of more than 400 pieces of equipment. During 2016, 318 pieces of equipment were redeployed in the business and 40 sold externally.
OUTLOOK 2017
We have reviewed and updated our three-year savings plan and set up new targets for the 2017-2019 period. We will continue to standardise and automate our Source to Pay processes by promoting online tendering and launching an electronic invoicing programme through a supplier’s portal. Once the pilot is completed, the global rollout of the new transportation management tool will start.
Additionally, we have planned a further five supplier innovation days and expect to see project revenue generated in the first half of the year.
Finally, we will continue deploying our Code of Conduct for Suppliers and Self-Assessment Questionnaire, targeting areas for improvement and measuring our levels of success. In 2017, we will launch a supplier performance scorecard, ranking our suppliers on six dimensions: quality, service, responsiveness, competitiveness, innovation and sustainability.
PROCUREMENT
MILLION OF NEW SAVINGS
57
REDUCTION IN THE NUMBER OF SUPPLIERS
22%
4. BUSINESS LEADERSHIP

73
Customer relationship management and customer satisfaction has been identified as one of our material issues, as defined in our Business Materiality Matrix (see page 101).
We are committed to ensuring the highest levels of service excellence across our business. It is important that we have the necessary skills, competencies and processes in place to anticipate and adequately respond to our customers’ particular needs. Each of our business lines has developed mechanisms to formally and informally seek feedback from clients. These could include surveys (such as our Voice of the Customer survey, which is used by various business lines across multiple geographies), periodic review meetings, customer seminars and workshops. In addition, our Compliance team works with Executive Vice Presidents and Managing Directors at country level on specific issues raised by customers through our hotlines.
In 2014, a single Customer Relationship Management System started to be deployed across the Group. This system gives us better visibility on customer information, sales, operational activities and business opportunities.
Case studies involving customer relationship management can be found in our online Sustainability Report: www.sgs.com/cs-report2016.
CUSTOMER RELATIONSHIP MANAGEMENT

74
4. BUSINESS LEADERSHIP
PEOPLE
Our people are our most important asset. We must ensure that our employees are safe and healthy at work, are treated fairly and with respect, and are able to fulfil their potential.
SGS SERVICE
> Health, Safety and Environment Management
CONSUMER BENEFIT
> A safer and more thoughtful society

75
ACHIEVEMENTS
Talent acquisition and retention have been identified as material issues, as defined in our Business Materiality Matrix (see page 101).
Our strength lies in our people. In a competitive business environment, our global footprint, variety of business lines and approach to sourcing talent locally wherever possible relies on our ability to attract, develop and retain exceptional people from diverse backgrounds, cultures and geographies.
Competition for talent is growing, with companies, industry sectors and markets seeking to attract the same pool of highly skilled people. A feature of this is the increased mobility of highly skilled workers, particularly in science and technology-based industries. The migration of talent plays an important role in shaping skilled labour forces in both developed and developing countries, diffusing knowledge, boosting innovation and enhancing career opportunities locally. We are also acutely aware that the global workforce is becoming more diversified, with younger workers – millennials – predicted to represent at least one-third of the global workforce by 2020.
Meeting these challenges demands a dynamic talent sourcing strategy, the successful integration of employees from business acquisitions, and processes that are tailored to employees' needs. During 2016, our workforce increased by 5 000 employees, representing a 5.9% increase on 2015. Our talent sourcing strategy is characterised by programmes linked to e-recruitment, employer branding, competency-based assessments and the efficient onboarding of people into our values, culture and business processes. Increasingly, these programmes rely on the innovative use of digital tools and social media to help keep communities of employees, candidates and prospective candidates connected.
2016 also saw us optimising our Finance support function through programmes linked to the assessment and development of critical competencies, enhanced analytics and improved transactional productivity to support our growing global organisation.
A HIGHLIGHT IN 2016 WAS THE EVOLUTION OF OUR EMPLOYER BRAND, WHICH FOCUSES ON EMPLOYEES AS INDIVIDUALS, ATTRACTING THE RIGHT PEOPLE TO SUPPORT OUR BUSINESS GROWTH. THE BRANDING ‘BE 100% YOU’ LAUNCHES IN 2017.
OUTLOOK 2017
Building on the success of our e-recruitment strategy, which saw at least 3 600 new recruits join through e-recruitment channels in 2016, we will continue to deploy digital solutions for talent sourcing. In addition, we plan to encourage employee referrals through a programme called ‘Be 100% You’. We will also focus on optimising our HR, Finance and IT support functions to ensure that we have an agile, sustainable operating model to effectively support our Sustainability Ambitions 2020.
TALENT ACQUISITION

76
4. BUSINESS LEADERSHIP
ACHIEVEMENTS
Our aim is to help our people to reach their full potential by working in various parts of the organisation and by creating opportunities for them to work in different countries and business lines.
This provides them with access to our global portfolio of customers and exposure to different cultures and ways of thinking.
Managing employee turnover in a dynamic and often volatile employment market is a challenge for any company. At SGS, improving retention remains important. In 2016, we focused our efforts on performance management, defining new leadership competencies and working with leaders to develop career path planning. In addition, we redefined our employee engagement strategy. As part of this, we are transitioning our employee survey, Catalyst, to a biennial survey, to allow teams adequate time to put in place qualitative action plans and focus efforts on increasing the visibility of these plans between surveys.
Since our last survey in 2015, more than 1 300 action plans have been launched, with a primary focus on building up confidence and trust, increasing growth and development opportunities for employees, and
enhancing communications. Managing Directors are responsible for monitoring progress against these plans and updating their teams on the actions that have been taken.
OUTLOOK 2017
We will continue to focus on maintaining a natural employee turnover of 10% or less, in line with our Sustainability Ambitions 2020. To this end, we will reinforce our talent management programmes and ensure that engagement remains at the heart of our team activities at local and global levels. We will conduct a revised Catalyst survey that is aligned to market trends and our Group vision, and we will ensure that our employees continue to play a key role in making SGS a great place to work.
NATURAL TURNOVER1 TRAINING RATIO2
ACTION PLANS LAUNCHED IN 2016
12.10%
11.9312.25
14.2012.77 12.10
2.07%
2.222.182.35
2.51
2.07
PERFORMANCE
1 300
EMPLOYEE RETENTION
PEOPLE LEAVING BY THEIR OWN WILL
1. As of 2016, this KPI is calculated based on permanent (fix-term and open-ended) contracts.
TRAINING COST (INCLUDING HOURS) AS A PERCENTAGE OF EMPLOYMENT COST
2. On a constant currency basis.
20162015201420132012 20162015201420132012

77
ACHIEVEMENTS
Diversity and equal opportunities are among our most important material issues, as defined in our Business Materiality Matrix (see page 101).
SGS is a diverse and inclusive business where ambitious people at every level are encouraged to realise their potential. The SGS Business Principles, Code of Integrity and new Human Rights Policy all underline our commitment to diversity and equal opportunities, and our employees and managers are trained in the principles of non-discrimination in our mandatory annual integrity training. As a part of this, SGS recognises the significant contributions that women make to business success. Our Operations Council now includes two female members and we have many women managers across our business lines, corporate functions and operations who represent an intrinsic and essential part of our leadership capabilities.
During 2016, we interviewed women in leadership positions across the business to capture their personal insights on the qualities needed for those seeking a leadership role within SGS.
OUTLOOK 2017
We are encouraged to see that our equal opportunities ratio is improving year-on-year and we expect the number of women in leadership positions (CEO-3) to increase in line with our Sustainability Ambitions 2020. During 2017, Management’s attention will be focused on creating the best opportunities to promote and recruit women to these roles.
We also plan to raise the profile of women leaders within SGS and provide support to women who would like to take such roles within the Company. While reviewing our career development and leadership competency frameworks, we will ensure that we are supporting the advancement of women across our global network, as well as enabling employees to develop their leadership skills and behaviours at every level of the Company.
ENGAGEMENT INDEX
PERFORMANCE EXCELLENCE INDEX
EQUAL OPPORTUNITY RATIO
PERFORMANCE
68%1
71%2
0.88(FEMALE MANAGERS/FEMALE EMPLOYEES)/(MALE MANAGERS/MALE EMPLOYEES)
0.870.76 0.75
0.84 0.88
DIVERSITY AND EQUAL OPPORTUNITIES
WOMEN IN LEADERSHIP POSITIONS (CEO -3)
26.31%
1. As measured in the 2015 Catalyst Survey.
2. As measured in the 2015 Catalyst Survey.
20162015201420132012
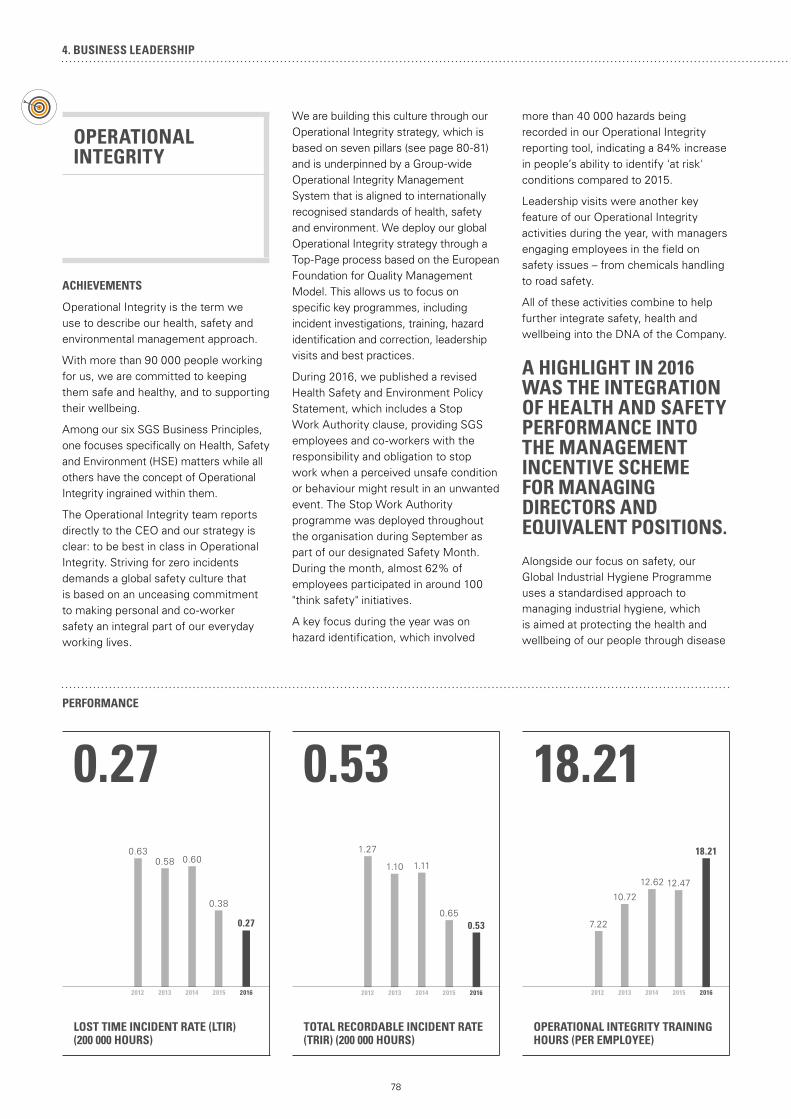
2016201520142013201220162015201420132012 20162015201420132012
78
4. BUSINESS LEADERSHIP
LOST TIME INCIDENT RATE (LTIR) (200 000 HOURS)
OPERATIONAL INTEGRITY TRAINING HOURS (PER EMPLOYEE)
TOTAL RECORDABLE INCIDENT RATE (TRIR) (200 000 HOURS)
ACHIEVEMENTS
Operational Integrity is the term we use to describe our health, safety and environmental management approach.
With more than 90 000 people working for us, we are committed to keeping them safe and healthy, and to supporting their wellbeing.
Among our six SGS Business Principles, one focuses specifically on Health, Safety and Environment (HSE) matters while all others have the concept of Operational Integrity ingrained within them.
The Operational Integrity team reports directly to the CEO and our strategy is clear: to be best in class in Operational Integrity. Striving for zero incidents demands a global safety culture that is based on an unceasing commitment to making personal and co-worker safety an integral part of our everyday working lives.
We are building this culture through our Operational Integrity strategy, which is based on seven pillars (see page 80-81) and is underpinned by a Group-wide Operational Integrity Management System that is aligned to internationally recognised standards of health, safety and environment. We deploy our global Operational Integrity strategy through a Top-Page process based on the European Foundation for Quality Management Model. This allows us to focus on specific key programmes, including incident investigations, training, hazard identification and correction, leadership visits and best practices.
During 2016, we published a revised Health Safety and Environment Policy Statement, which includes a Stop Work Authority clause, providing SGS employees and co-workers with the responsibility and obligation to stop work when a perceived unsafe condition or behaviour might result in an unwanted event. The Stop Work Authority programme was deployed throughout the organisation during September as part of our designated Safety Month.During the month, almost 62% of employees participated in around 100 "think safety" initiatives.
A key focus during the year was on hazard identification, which involved
more than 40 000 hazards being recorded in our Operational Integrity reporting tool, indicating a 84% increase in people’s ability to identify 'at risk' conditions compared to 2015.
Leadership visits were another key feature of our Operational Integrity activities during the year, with managers engaging employees in the field on safety issues – from chemicals handling to road safety.
All of these activities combine to help further integrate safety, health and wellbeing into the DNA of the Company.
A HIGHLIGHT IN 2016 WAS THE INTEGRATION OF HEALTH AND SAFETY PERFORMANCE INTO THE MANAGEMENT INCENTIVE SCHEME FOR MANAGING DIRECTORS AND EQUIVALENT POSITIONS.
Alongside our focus on safety, our Global Industrial Hygiene Programme uses a standardised approach to managing industrial hygiene, which is aimed at protecting the health and wellbeing of our people through disease
0.53
0.53
1.27
1.10 1.11
0.65
0.270.63
0.58 0.60
0.38
PERFORMANCE
OPERATIONAL INTEGRITY
0.27
18.21
7.22
10.72
12.62 12.47
18.21

2016201520142013 20162015201420132012
79
PARTICIPANTS IN THE SAFETY MONTH INITIATIVE
SEVERITY RATE (LOST DAYS / LOST TIME DUE TO INCIDENTS)
and fatality prevention, increased quality of life, improved health and the promotion of healthy and safe living.
During 2016, we conducted Environmental, Health and Safety and Industrial Hygiene pilot schemes in Australia, China, India and New Zealand aimed at increasing the visibility of industrial hygiene and occupational health issues at SGS sites and ensuring legislative compliance.
We conducted Industrial Hygiene surveillance at selected sites in Australia, Bangladesh, Malaysia and New Zealand, with the findings informing the launch of a global rollout in 2017.
We also initiated a global programme to check the status of personal protective equipment implementation, covering the selection, procurement, deployment and monitoring of personal protective equipment across our operations.
In conclusion, 2016 was a significant year for Operational Integrity, with us achieving our Sustainability Ambitions 2020 to halve our Lost Time Incident Rate and Total Recordable Incident Rate figures based on a 2014 baseline. The fact that this goal has been achieved four years early means that we must maintain, and hopefully further improve, our Operational Integrity performance year-on-year.
OUTLOOK 2017
Our Sustainability Ambitions 2020 for Operational Integrity are to reduce our Total Recordable Incident Rate and our Lost Time Incident Rate by 50%, based on a 2014 baseline. As such, we will continue our focus on embedding a safety culture throughout the Company using the seven pillars of our Operational Integrity strategy.
We will further invest in Operational Integrity training, Industrial Hygiene programme deployment, hazard identification and risk assessments. Also we will extend the deployment of our Rules for Life e-learning module across our network and support our team of 23 Global Operational Integrity Auditors with their work. Finally, we will deploy behaviour-based safety pilots in all regions where safety performance remains a particular focus.
55 34255 342
39 381
50 00554 963
PERFORMANCE
16.64
16.6418.40 18.77
22.17
18.86

80
4. BUSINESS LEADERSHIP
LEADERSHIP
is overseen by an Executive Operational Integrity Steering Committee, which is chaired by the Chief Executive Officer and composed of Chief Operating Officers and Senior Vice Presidents. The Committee meets quarterly to review our Operational Integrity (OI) strategy and performance. It is supported by an extended OI Steering Committee that brings managers, regional businesses and corporate functions together to collaborate on OI management across the network. Our Chief Operating Officers, Managing Directors and site/laboratory managers provide active leadership on OI across our global network. In 2016, 22 leadership visits were conducted per one hundred employees compared to 12 leadership visits per 100 employees in the previous year. During the year, a mobile OI app was introduced to assist managers in making leadership visits, by accessing HSE guidelines and recording their observations in real time.
COMMUNICATION
is managed via a Top-Page initiative, which ensures that information is consistently cascaded through the network and actions are systematically tracked. We raise awareness of safety issues in a variety of ways, such as through our Rules for Life, which are 15 non-negotiable rules that help save lives. During 2016, more than 39 500 employees completed our updated Rules for Life e-learning module, which is available in eight languages.
TRAINING AND AWARENESS
is targeted at all levels of the organisation and includes briefings for Chief Operating Officers and Executive Vice Presidents on leadership site visits, as well as dedicated Operational Integrity training days and e-learning for all business and site managers. In addition, we provide generic and specific training for employees across all functional operations and corporate sites, which is delivered in a range of formats, including manager-led toolbox meetings, Safe Talks on key safety topics and e-learning modules, which are available in local languages. During 2016, the average number of training hours per employee was 18, which exceeded our target of 14.
Road safety, driver behaviour and driving habits remain critical risks associated with the territories and driving cultures in which our employees and subcontractors are required to work. We continue to run quarterly campaigns on in-vehicle monitoring with our Eastern Europe and Middle East and South America regions pioneering the programme. To date, more than 2 400 vehicles have been equipped with In Vehicle Monitoring Systems, resulting in significant improvements in driver behaviour and a reduction in our vehicle incident rate, which fell by 16% in 2016.
RESOURCES AND SKILLS
have been strengthened at the global Operational Integrity team level as well as at regional and affiliate levels. During 2016, we allocated additional resources to hazard identification and risk assessments.
OUR SEVEN OPERATIONAL INTEGRITY PILLARS

81
KEY PERFORMANCE INDICATORS
are captured via our reporting tool, which provides a standardised, multilingual and data-driven incident management and reporting interface to expedite regulatory and client-mandated incident reporting. Following its implementation and the simplification of the reporting functionality, we have detected a significant increase in the reporting of hazards. Also, our Safety Data Sheet Management System provides consolidated and up-to-date information on potential hazards associated with the chemicals used in our laboratories, and how to manage them.
AUDITS AND COMPLIANCE
reviews health risks, environmental and chemical impacts, and safety risks.The audits are conducted by an internal team of 23 certified Health, Safety and Environment auditors and the findings are reported to the Executive Management team.
HEALTH, SAFETY AND ENVIRONMENTAL (HSE) SELF-ASSESSMENTS
are conducted annually using a specially designed online tool, which provides a comprehensive overview of potential risks for each site and the controls in place for managing them. This tool uses around 400 questions covering 15 categories to enable the classification of sites as low, medium or high risk. In total, 1 085 sites completed the self-assessment and were benchmarked globally.

82
4. BUSINESS LEADERSHIP
ENVIRONMENT
We are committed to achieving sustainable growth while managing our impact on the environment, through our Do More With Lëss. We recognise our role in helping our customers to improve their own environmental performance and to participating in the global effort to reduce climate risk in accordance with the COP21 Paris Agreement. We are also committed to measuring and reducing our carbon footprint through operational eco-efficiency measures and to maintaining our status as a carbon neutral company.
SGS SERVICE
> Sustainable Building Certification
CONSUMER BENEFIT
> Living and working in greener cities

83
I-RECs: International Renewable Energy Certificates.
ACHIEVEMENTS
Energy and climate change are among the most important issues for SGS, as defined by our 2016 Business Materiality Matrix (see page 101).
As a global company, we are concerned about the potential impact of climate change on the regions and communities in which we operate. Although our industry is not a major emitter of greenhouse gases, our employees, customers and other stakeholders expect SGS to show leadership on climate change, both in terms of our own energy consumption and by helping our customers and suppliers to reduce their emissions.
Our Green Book, launched in 2012, is a six-monthly environmental profit and loss account prepared for senior managers, to help assess and monitor the financial impact of our sustainability performance, including our carbon footprint. This innovative model helps us to understand how sustainability can detect operational efficiencies in order to achieve our Sustainability Ambitions 2020 and ultimately to reduce our environmental impact.
We continue to work to reduce our carbon emissions and have achieved carbon neutral status through carbon offsets and Guarantees of Origin solutions (investments in renewable energy projects), energy efficiency measures and renewable electricity supply in some of our affiliates.
We have over 73 projects and investigations underway worldwide to optimise operational efficiency in our laboratories and offices.
Since 2014, we have offset our CO2 emissions through projects located in the regions SGS operates in, thus making
a positive contribution in areas where we have impact. We annually offset any residual CO2 emissions associated with our operations in major countries.
In addition to the renewable energy and carbon credits purchased above, SGS invested in three voluntary offset schemes, in China, South America and India, which support the development of local enterprise through power generation from wind and biomass.These credit purchases, which have been verified by the Clean Development Mechanism, provide important opportunities to support sustainable economic growth, provide clean energy to regions and local communities, and protect the environment by reducing the reliance on fossil fuels for energy.
Since December 2014, when SGS became one of the first companies in the world to sign the RE100 initiative, we have pledged to use 100% power from renewable sources by 2020. Led by The Climate Group and in partnership with the Carbon Disclosure Project, RE100 is collaborating with the International Renewable Energy Agency
EMISSIONS AND CLIMATE CHANGE
INVESTMENT IN RENEWABLE ENERGY INITIATIVES (TO MITIGATE OUR 2015 CO2 EMISSIONS)
VIETNAM, INDONESIA, MALAYSIA, THAILAND
12.0 GWH
from Vietnamese and Malaysian I-RECs
TURKEY
7.0 GWH
I-RECs from Turkish Hydropower
NORTH AMERICA
62.0 GWH
US-RECs
EUROPE
74.5 GWH
guarantees of origin
MEXICO
1.3 GWH
I-RECs from Solar PV in Honduras
CHINA AND HONG KONG
65.5 GWH
from chinese I-RECs
TAIWAN
33.0 GWH
from Taiwanese I-RECs

20162015201420132012 20162015201420132012 20162015201420132012
84
4. BUSINESS LEADERSHIP
CARBON INTENSITY BY REVENUE1 (TONNES CO2e/ MILLION CHF)
and others to get 100 of the world’s largest companies to commit to 100% renewable power by 2020.
Alongside these initiatives, we realise that SGS can make a greater contribution by helping our customers to respond to climate change challenges through our services linked to energy efficiency and alternative energy. These include energy management services and multiple services related to the energy efficiency of buildings, including renewable energy feasibility studies, energy audits, energy performance certificates and ISO 50001 certification. We also offer a range of specialist advisory services and engineering expertise on sustainable buildings through SGS Search, based in the Netherlands. These services include cradle-to-cradle product certifications for companies committed to the development of a circular economy.
Over the past two years, we have conducted a study to examine our role in helping our customers to reduce their carbon intensity. We began by estimating the CO2 emissions of our customers in our Industrial and Agriculture business lines and considered how much our customers had reduced their emissions. We then calculated the extent to which our services had contributed to these reductions in CO2. The study estimated
that our customers’ fertiliser usage resulted in the emission of 4.5 million tonnes of CO2. As a result of our precision farming services, in 2016 we helped our customers to reduce their CO2 emissions by 2.3%.
BUSINESS LEADERSHIP
For the third year running, SGS was recognised in the Carbon Disclosure Project Climate Performance Leadership Index, a global ranking of listed companies on their approach to climate change mitigation. We are committed to being part of the solution, using our scale and our expertise to enable a more responsible, balanced and sustainable future. We recognise that ambitious action on climate change is necessary and that companies must play an active role in bringing solutions to the table that support the global economy and the global climate agenda.
We are particularly pleased to have enhanced our environmental capabilities in 2016, with the acquisition of Accutest Laboratories, the fifth largest full-service environmental testing company in the United States. This acquisition will enable us to further our focus on helping customers to enhance their environmental reputation, manage risk and increase business efficiency.
OUTLOOK 2017
In line with our Sustainability Ambitions 2020, we plan to reduce our annual CO2 emissions (by revenue and by headcount) by 20%, against our 2014 baseline. We aim to achieve this through improved energy efficiency and by switching to low-carbon options, including renewable energy sources, web conferencing and the ongoing deployment of mandatory low-emission fleet cars. In addition, we will continue to work across our business lines and functions to show the tangible value of our services and our people in contributing efforts against climate change. In particular, we will continue to maximise our contribution by ensuring the integrity and safety of existing energy supply and storage systems, and ensuring that our customers have accurate and reliable data to manage their reduction strategies. In addition, new lower-carbon technologies will challenge us to think about how we combine our skills and competencies and test our technologies and services to generate new ideas and insights that will enable us to actively contribute to a lower-carbon future.
TOTAL GHG EMISSIONS (THOUSAND TONNES CO2e)
CARBON INTENSITY BY EMPLOYEE (TONNES CO2e / FTE)
PERFORMANCE
187
187
278291
214203
31.2256.40 55.98
39.20
31.22
2.083.61 3.61
2.572.36
2.0836.02
Historical data restated due to changes in renewable energy accounting. Historical data restated due to changes in renewable energy accounting.Historical data restated due to changes in renewable energy accounting.
1. On a constant currency basis.

2016201520142013201220162015201420132012
85
TOTAL WASTE GENERATED (THOUSAND TONNES)
TOTAL WATER PURCHASED (MILLION M3)
ACHIEVEMENTS
Water and waste management were not among the most material issues identified by stakeholders in our 2016 materiality assessment. However, we recognise that these issues are increasingly important in a wider sustainability context, as the potential impacts of climate change and other factors on water supplies and waste streams become more apparent.
Protecting our water resources and managing waste are both important to the long-term health and wellbeing of our employees and the communities where SGS operates. Our commitment is to manage finite natural resources more effectively, and develop innovative ways to reuse, recycle and prevent waste. As a service company, our water consumption is relatively low. We use water in our laboratories and for drinking, food preparation, cleaning and sanitation. We also produce relatively small quantities of hazardous and non-hazardous (e.g. mixed paper, mixed plastics and mixed organic) waste. A standard operating procedure for water and waste management and minimisation is established as part of the SGS Operational Integrity Management System. Audits are conducted regularly by the Operational Integrity team, which assesses conformity to the procedure to ensure best practices are applied.
A detailed account of water and waste management and performance, and good practice case studies, can be found in our online report: www.sgs.com/cs-report2016.
OUTLOOK 2017
We will continue to monitor our water performance using our new building rating tool, as well as other specific projects managed at affiliate level, and we will report new data relating to water and waste from 2017.
1.81.81.8 1.8
2.01.9
42.942.942.6
49.2
43.5 43.2
PERFORMANCE
WATER AND WASTE MANAGEMENT

2016201520142013201220162015201420132012
86
4. BUSINESS LEADERSHIP
TOTAL ENERGY (GWH) VEHICLES FUELS (GWH)
ACHIEVEMENTS
SGS is not an energy intensive company. However, with over 90 000 employees working in more than 2 000 offices and laboratories with a floor area of approximately 2 million square metres, targeting energy consumption at our offices and laboratories is the most direct and effective way we can contribute to tackling climate change. The energy used in our buildings accounts for almost 60% of our global energy consumption.
SGS is a signatory to the World Business Council for Sustainable Development (WBCSD) Energy Efficiency in Buildings Manifesto. Under this manifesto, we have committed to a 20% reduction in CO2 emissions for all offices and laboratories we own that are larger than 2 000 m2 by 2020, against a 2010 baseline.
Progress against our Energy Efficiency in Buildings targets is tracked via the SGS Energy Rating Tool for Offices and Laboratories, and reported to the WBCSD. As part of our target to reduce CO2 emissions intensity by 20%, we conducted 47 energy audits and self-assessments in our Energy Efficiency in Buildings Programme in 2016. During the year, the Austrian SGS head office in Vienna, relocated
to a German Sustainable Building Council Gold certified building, offering improved energy efficiency, high-level indoor quality standards and enhanced transport connections for our employees.
Case study
In August 2016, SGS hosted the launch of the new Swiss Sustainable Building Standard (SNBS) in Bern, which was attended by more than 400 participants. The SNBS 2.0 is a new building certification product for the Swiss market, to which SGS has contributed as part of its role in the Network for Sustainable Construction in Switzerland. The first SNBS certificate was awarded the Credit Suisse Real Estate Fund Green Property for its “Twist Again” project in Bern.
Across our network, we increasingly use video, audio and web conferencing to reduce travel costs, cut CO2 emissions and improve work-life balance. In 2016, we implemented Skype for Business as our primary web conferencing platform. During the year we placed more than 158 000 conference and video calls that helped us save more than 7 900 flights.
360360
316335 332
354
886886
772 795 809846
PERFORMANCE
RENEWABLE ENERGY
ENERGY EFFICIENCY

20162015201420132012 20162015201420132012
87
ELECTRICITY AND NON-TRANSPORT FUELS (GWH)
526526
456477 492
460
RENEWABLE ENERGY
Recognising that energy efficiency is driven by behaviour as much as by technological intervention, our Do More With Lëss - Spot the Orange Dot behaviour change campaign uses strategically positioned orange stickers to remind employees to take concerted action to improve energy and resource efficiency. Since 2013, around 40 000 employees in 22 affiliates across our network have participated in the campaign, resulting, over the years, in tangible improvements in their energy efficiency and waste management impacts.
Case study
The SGS Energy Challenge was a picture contest that was launched across our global network in November 2016 to encourage employees to upload images of themselves engaged in actions that address climate change and other sustainability issues in the workplace. The images were then uploaded onto the Corporate Sustainability Yammer group. At the end of November, nine images were selected based on the number of ‘likes’ they received, and the employees were awarded with sustainable apparel. A special prize was awarded to the participant with the most creative and sustainable picture.
Examples of case studies linked to Energy Efficiency in Buildings Programme and Do More With Lëss campaigns can be found in our 2016 Corporate Sustainability Report: www.sgs.com/cs-report2016.
OUTLOOK 2017
As part of our Sustainability Ambitions 2020, we are aiming to reduce our annual CO2 emissions by 20% against a 2014 baseline. We also plan to reduce CO2 emissions at all company-owned offices and laboratories of 2 000 square metres or more by 20% within the same time period. We plan to achieve this through our Energy Efficiency in Buildings programme and Do More With Lëss campaign. We will report on our progress in our online Sustainability Report, which is available at www.sgs.com/cs-report2016.
RENEWABLE ENERGY (GWH)
333333
60
219
266
64
PERFORMANCE

88
4. BUSINESS LEADERSHIP
COMMUNITY
We welcome local talent and knowledge to our business. We want to give back to our communities through employee volunteering and investment in projects linked to education, empowerment and the environment. We monitor the impact of our community investment using qualitative and quantitative indicators based on the London Benchmarking Group measurement framework and an annual community survey.
SGS SERVICE
> SGS Community Projects
CONSUMER BENEFIT
> A better and more empowered community

89
PROGRAMMES
Investment in local communities was identified as an important issue by stakeholders in our 2016 materiality assessment.
In all of SGS' operations we continually strive to conduct our business in a manner that reduces our impact while conducting our business in a way that respects the rights and dignity of individuals and communities affected by our business activities. Beyond this, we want to apply our skills and innovation to help address the most pressing sustainable development challenges around the world.
Our Community Programme is led by our affiliates who encourage employees to engage in local volunteering and fundraising activities. Across our global network, we support around 360 community initiatives that are initiated by employees and leadership teams in our affiliates in response to local challenges. Our community actions are focused around three community pillars: Education, Empowerment and Environmental Sustainability.
During 2016, we revised our Community Policy and Guidelines to bring them in line with the SGS Business Principles, the SGS Human Rights Policy and our Sustainability Ambitions 2020. The new policy and guidelines, which were approved by the Sustainability Steering Committee, will be deployed globally in early 2017.
We have also revised our annual community survey to provide us with qualitative and quantitative indicators of the impact of our community investment. The survey, which is aligned to our refreshed Community Policy and Guidelines as well as to the London Benchmarking Group, will enable us to evaluate our community contributions through cash donations and sponsorships, employee volunteering time, pro bono services and in-kind support. In addition, this survey helps us to evaluate the projects’ impacts in our communities and environment. The results of the survey are presented in our online Sustainability Report: www.sgs.com/cs-report2016.
ACHIEVEMENTS
In line with our Sustainability Ambitions 2020, we aim to increase our investment in local communities by 30% (against a 2014 baseline). All affiliates are encouraged to engage employees in volunteering and to invest in local community projects. In addition, selected countries (based on revenue and historical community investment levels) have been assigned specific investment objectives until 2020 to invest in projects that support the United Nations' Sustainable Development Goals. A particular feature of these investments is the provision of scholarships to people with limited economic resources and restricted access to education.
Case study
In August 2016, our Chief Executive Officer and four members of the Operations Council engaged in a programme of tree planting in India at SGS sites in Manesar, Navi (Mumbai), Chennai and Pune.
COMMUNITY PROGRAMMES
EDUCATION PROJECTS are aimed at improving access to elementary, primary, secondary, higher and further education, as well as informal education in the form of employment training schemes and skills workshops.
EMPOWERMENT PROJECTS focus on promoting physical, emotional, intellectual and economic empowerment through access to healthcare, counselling, mentoring, enterprise schemes and micro credit.
ENVIRONMENTAL SUSTAINABILITY PROJECTSare aimed at reducing or eliminating the reliance on non-renewable or scarce resources such as fossil fuels and water.

20162015201420132012 20162015201420132012
90
4. BUSINESS LEADERSHIP
INVESTMENT IN COMMUNITY1 (THOUSAND CHF) COMMUNITY PROJECTS
PERFORMANCE
1 1771 177
956844
753
1 037
356356
303
352
217 222
The United Nations' Sustainable Development Goals define global sustainable development priorities and aspirations for 2030 and seek to mobilise global efforts around a common set of goals and targets. They call for worldwide action among governments, businesses and civil society to end poverty and create a life of dignity and opportunity for all. SGS will work with an advisory company to map our existing community activities against the Sustainable Development Goals and to develop action plans focused on integrating them into our management and reporting processes at affiliate level.
OUTLOOK 2017
We will deploy our revised Community Policy and Guidelines globally, and work with our affiliates to support employee volunteering projects linked to our community pillars. We will also work with the affiliates to develop local action plans to ensure that community actions are aligned, where possible, to the United Nations' Sustainable Development Goals and volunteering activities.
During 2017, we will focus our effort on promoting local economic development by providing scholarships to low-income youths. These scholarships will enable local people to access vocational skills training and acquire qualifications aimed at improving their employment prospects. Qualifications will be offered across a number of professional disciplines, ranging from lead auditor certification for specified ISO standards, certificates in good agricultural practices, health and safety audit qualifications, and certificates in environmental management. All training will be provided through the SGS Academy network, our professional training support structure.
1. Including cost of volunteering hours.

91
SGS SERVICE
> SGS Scholarships
CONSUMER BENEFIT
> Career development through education

92
4. BUSINESS LEADERSHIP
INTEGRITYMAKING SURE WE BUILD TRUST
We act with integrity and behave responsibly. We abide by the rules, laws and regulations of the countries we are operating in. We speak up: we are confident enough to raise concerns and smart enough to consider any that are brought to us.
RESPECTMAKING SURE WE TREAT ALL PEOPLE FAIRLY
We respect human rights. We all take responsibility for creating a working environment that is grounded in dignity, equal opportunities and mutual respect. We promote diversity in our workforce and do not tolerate discrimination of any kind.
QUALITY AND PROFESSIONALISMMAKING SURE WE ACT AND COMMUNICATE RESPONSIBLY
We embody the SGS brand and its independence in our everyday behaviour and attitude. We are customer-focused and committed to excellence. We are always clear, concise and accurate. We strive to continually improve quality and promote transparency.We respect client confidentiality and individual privacy.
LEADERSHIPMAKING SURE WE WORK TOGETHER AND THINK AHEAD
We are passionate entrepreneurial people with a relentless desire to learn and innovate. We work in an open culture, where smart work is recognised and rewarded. We foster teamwork and commitment.
HEALTH AND SAFETYMAKING SURE WE ESTABLISH SAFE AND HEALTHY WORKPLACES
We fully protect all SGS employees, contractors, visitors, stakeholders, physical assets and the environment from any work-related incident, exposure and any kind of damage.
SUSTAINABILITYMAKING SURE WE ADD LONG-TERM VALUE TO SOCIETY
We use our scale and expertise to enable a more sustainable future. We ensure that we minimise our impact on the environment throughout the value chain. We are good corporate citizens and invest in the communities in which we operate.

SGS ADDED VALUE
SGS BUSINESS PRINCIPLES
SGS BUSINESS MODELINNOVATION
GROWTH
BRAND
PROFESSIONALISM
HEALTH AND SAFETY
INTEGRITY
OUR INVESTORS
OUR CUSTOMERS
INVE
STM
ENT
EXPERTISE
OPERATIONAL
EX
CELLENCE
LEADERSHIP
SUST
AIN
ABIL
ITY
RESPECT
OUR INDUSTRIES
OUR
PART
NER
S
OUR COMMUNITIES
OUR EMPLOYEES
93
SGS’ BUSINESS PRINCIPLES ARE THE CORNERSTONE ON WHICH ALL OF OUR ACTIVITY RESTS. THEY ARE HELD TO BE FUNDAMENTAL, OVERARCHING BELIEFS AND BEHAVIOURS THAT GUIDE OUR DECISIONS AND ALLOW US TO EMBODY THE SGS BRAND IN EVERYTHING WE DO.

94
4. BUSINESS LEADERSHIP
OUR EMPLOYEESWe add value to our employees by offering them training, nurturing their potential and encouraging them to work across multiple functions and geographies during their careers.
We offer flexible working conditions and equal opportunities to all.
STAKEHOLDERSExisting employees
Potential employees
Subcontractors
OUR COMMUNITIESWe currently support close to 360 community initiatives in response to local challenges. Many of these are aligned the United Nations’ Sustainable Development Goals. We also support disaster relief and environmental sustainability by sharing our expertise and network with non-profit organisations.
STAKEHOLDERSPeople
Environment
Community programmes
Special interest groups
NGOs and academics
OUR INDUSTRIESWe help advance the industries we operate in through the services we offer. We help our customers improve the safety and quality of global supply chains and to drive innovation. This in turn establishes new industry benchmarks for efficiency, sustainability and operational best practices.
STAKEHOLDERSIndustry peers, trade bodies and associations
Authorities, governments and regulators
Unions and work councils
OUR PARTNERSWe provide value to our partners by sharing our expertise and support and by helping them to refine their product offerings. In this way we help them develop their businesses.
STAKEHOLDERSSuppliers
Business partners
Consultants
OUR INVESTORSWe add value to our investors by being a robust, sustainable business with a 138-year track record. Our transparency, strong leadership and commitment to long-term sustainability make us a sound investment.
STAKEHOLDERSShareholders
Financial community
Socially responsible investors
OUR CUSTOMERSWe add value to our customers by providing them with leading services, which helps make their businesses more efficient, profitable and sustainable. This value is passed on to society in the form of job security for employees, higher quality products and better environmental management.
STAKEHOLDERSExisting customers
Potential customers
OUR STAKEHOLDERS

SGS ADDED VALUE
SGS BUSINESS PRINCIPLES
SGS BUSINESS MODELINNOVATION
GROWTH
BRAND
PROFESSIONALISM
HEALTH AND SAFETY
INTEGRITY
OUR INVESTORS
OUR CUSTOMERS
INVE
STM
ENT
EXPERTISE
OPERATIONAL
EX
CELLENCE
LEADERSHIP
SUST
AIN
ABIL
ITY
RESPECT
OUR INDUSTRIES
OUR
PART
NER
S
OUR COMMUNITIES
OUR EMPLOYEES
95
THROUGH OUR EMPLOYEES, CUSTOMERS, INVESTORS, COMMUNITIES AND INDUSTRIES, WE ADD A TREMENDOUS AMOUNT OF VALUE TO SOCIETY. PERHAPS MORE IMPORTANTLY, THANKS TO THE SERVICES WE PROVIDE, WE EMPOWER AND INSPIRE OTHERS TO DO SO TOO.

96
4. BUSINESS LEADERSHIP
As an independent service provider, we offer our customers an impartial view through service offerings that span all industries and encompass full supply chains. Our services enable our customers to operate in a more sustainable manner, by reducing their impact on the environment, ensuring product safety, safeguarding trade and helping to bring new technologies to market.
Our market position is:
THE WORLD’S LEADING INSPECTION, VERIFICATION, TESTING AND CERTIFICATION COMPANY
THE LEADING PROVIDER OF COMPETITIVE ADVANTAGE, DRIVING SUSTAINABILITY AND DELIVERING TRUST
THE GLOBALLY RECOGNISED BENCHMARK FOR QUALITY AND INTEGRITY
At SGS, we are continually pushing ourselves to deliver innovative services and solutions that help our customers move their businesses forward.
THE TIC INDUSTRY IS AN ESTIMATED USD 200 BILLION MARKET. BY GROUP REVENUE AND MARKET SHARE, SGS IS THE LARGEST INSPECTION, VERIFICATION, TESTING AND CERTIFICATION COMPANY IN THE WORLD.
The Testing, Inspection and Certification (TIC) Industry is not widely understood by the general public, yet our activities as members of this industry interweave with almost everything that a consumer touches.
The breadth and reach of the industry is perhaps unrivalled. Look around you. The furniture that you are using, the clothes that you are wearing, even the paper you are holding have most likely all been touched at some stage by the TIC industry.
From verifying that the olive oil in your cupboards is unadulterated extra virgin to ensuring that the paint on a toy will not be harmful to your children’s health, the TIC industry is involved in assuring safety, quality and sustainability in a way most people have never considered.
But it is not just individuals that rely on the TIC industry to provide assurance services. Governments and businesses need companies like SGS to provide assurance services for everything from precision farming to offshore oil rig management.
The market has two main driving mechanisms. The first is the ever more demanding regulatory and legal environment faced by many firms, who not only need to understand and conform to their respective market regulations but also need to demonstrate to their customers and the relevant authorities that the necessary steps have been taken to ensure compliance. Moreover, the increasingly complex nature of global supply chains have made it even harder for firms to ensure conformity (or even quality) for all the component parts in any given product.
This can have quite serious consequences if left unchecked. For example, there have been instances where firms have inadvertently breached international sanctions because they failed to consider the place of manufacture of a particular component part. As a result of this, companies and governments have often found it preferable to outsource these services to an expert and independent third-party firm in the TIC industry. Indeed firms are often required to do so. In reality, pressure is often passed down the supply chain by larger companies, that need to gain greater control over the actions of their own suppliers.
The second market mechanism is often simply financial, with firms finding that specialist companies such as SGS are able to offer more efficient and effective services than they are capable of reproducing in-house. This is because businesses like SGS benefit from having a global network, a deep pool of expertise and the necessary technological capabilities to draw upon. Thus our services become a cornerstone of innovation and operational excellence for our clients, as well as giving them greater control over their risk.
THE TIC INDUSTRY UNMASKED
WHAT MAKES US STAND OUT?
MARKET POSITIONING

97
Value2Society (V2S) is the mechanism that we use to demonstrate the value that SGS creates beyond financial return.
It quantifies the impact of our business activities, positive and negative, direct and indirect, across six types of capital stock: natural, human, intellectual, social, built and financial. Each capital stock is conceived as a store of economic benefits. For example, human capital is the store of labour / work within SGS employees. Throughout the year, each capital stock (and its store of benefits) undergoes change, quantitatively and qualitatively, according to levels of use and subsequent investment, depreciation and appreciation. It is the inter-relationship of these four capital flows that
determine capital stock enhancement or deterioration. For example, if employees work excessive hours (use), fatigue (depreciation) sets in, which eventually leads to reduced labour productivity.
Each capital flow can be distilled into measurable indicators and when relevant, further subjected to economic valuation.
Economic valuation translates indicator performance into financial terms. Negative flows (i.e. depreciation) are translated into costs and positive flows (i.e. investment and appreciation) are translated into benefits. Both the costs and the benefits are comprised of company, individual and governmental components. For example, one human capital (depreciation) indicator is employee workplace injury. The potential costs of an employee workplace injury to SGS include administration, compensation and finding replacement staff. The potential costs to the injured employee include reduced wellbeing and associated medical costs. The potential costs to government include medical costs and lost tax revenues.
Translation of indicator performance into financial terms allows for indicator comparison, indicator aggregation and indicator integration with conventional management, and in the future with financial accounting systems. The subtraction of all depreciation indicator values, plus the sum of all investment and appreciation indicators yields the V2S figure. Therefore, V2S reveals a broader, richer view on the contribution SGS makes to the global economy.
CAPITAL FLOWS - INTEGRATED REPORTING FRAMEWORK
OUR VALUE TO SOCIETY
VALUE TO SOCIETY FRAMEWORK
Negative flows
Positive flows
Negative flows
Positive flows
Negative flows
Positive flows
Negative flows
Positive flows
Negative flows
GVA Natural capital Human capital Intellectual capital Manufactured capital Social and relationship capital
Value to society
+ + + + +- - -- -
VALUE TO SOCIETY
PROCUREMENT DIRECT OPERATIONS PRODUCT IN USE
Positive flows
NATURAL CAPITAL
HU
MAN
CAPITAL SOCIAL CA
PITAL
INTELLECTUAL CAPITAL
C A PI TA L
F IN A N C I A L
CAPITALM
ANUFACTURED

OPPORTUNITIES THAT HOLD WATER
Sustainability is one of today’s hottest topics. In the face of massive media coverage and huge public interest, finding ways to operate in a responsible manner has never been so important.
For decades, SGS has been providing sustainability solutions and services for companies and organisations around the world. At the same time, we’ve been leading by example.
Community is one of our four sustainability pillars. Supporting projects that have the potential to change lives in communities where SGS employees live and work is an integral part of our sustainability commitment. In 2016, SGS donated a water tower and solar panels to the Présence-Madagascar association. As a result, its Fanantenana Centre, which helps abandoned children by offering them education and training, now has water and electricity for a workshop.
Also during the year, in South Africa, the SGS Black Economic Empowerment initiative helped Baitsanape Lab Supplies to develop its presence in our national supply chain. The local company supplies high-quality consumables and equipment, and provides employment for nearby communities.
By investing in the communities that we work in, we aim to make a positive impact on society and achieve greater economic sustainability.

SGS SERVICE
> Ground Water wells Analysis
CONSUMER BENEFIT
> Cleaner, fresher water

Every year the SGS Board of Directors assesses the risks that the Group faces. This process is conducted with the active participation and input of the Management. Once identified, risks are assessed according to their likelihood, severity and mitigation.
The Board of Directors deliberates on the adequacy of measures in place to mitigate and manage risks, and assigns responsibility to designated managers for implementing these measures.
As part of this process, ownership and accountability for identified risks are approved by the Board of Directors. The implementation of these actions is audited by Internal Audit. The findings are communicated to the Board of Directors so that progress and identified risks can be monitored objectively and independently from Management.
The risks identified and monitored by the Board fall broadly into four categories:
• Strategy and Planning Risks – arise when the company’s strategy selection and execution is inadequate and when there are external factors that can affect the company’s performance.
• Governance and Integrity Risks – arise when the corporate governance structure and controls are inadequate and when the ethical culture and procedures are weak.
• Global Support Risks – arise when core functions of the company do not operate effectively and do not support the business performance.
• Operations Risks – arise when business processes do not achieve the objectives they were designed to achieve in supporting the company’s business model.
During 2016, we reached a significant milestone in our journey towards integrated reporting by merging the outputs of our materiality and business risk assessment processes. The journey began with an extensive materiality assessment process, involving a consultation of around 850 stakeholders, including customers, senior managers, employees, suppliers, NGOs, ratings agencies, sustainability professionals and academics, in 52 countries. Alongside the survey, we conducted a detailed benchmark review of globally relevant and sector-specific sustainability issues and trends.
Having conducted a weighted analysis of the outputs of our materiality assessment by stakeholder type, we then integrated the business risks identified in our annual Board of Directors risk review to provide a more complete picture of the most salient issues for SGS. This resulted in a consolidated list of environmental, social and governance topics. Next we conducted an impact assessment, which involved over 80% of Operations Council members participating in an online survey to rank each topic according to its relative impact on the business (covering business continuity, economic performance, reputation and legal compliance) as well as their assessment of the controls in place to manage the impacts.
The outcome of the processes described above was the development of our first Business Materiality Matrix.
Having conducted such a robust exercise to assess our material and business issues, we are reassured to find that our business objectives and our Sustainability Ambitions 2020 remain focused on the most important issues for our stakeholders and for the business.
We plan to conduct a high-level materiality review every year, and to conduct a comprehensive assessment of our materiality and business risks every three years.
5. MARKET RISKS
RISK MANAGEMENT AND MATERIAL TOPICS
100

5. MARKET RISKS
Security of Company assets
Water and waste management
Business standardisation
Investment in local communities
Market presence
Technical developments
Employee engagement
Professional excellence People Environment Community
Role in public policy developments
Protection of biodiversity
Services development and innovation
Brand and brand protection
Diversity and equal opportunities
Energy and climate change
Indigenous rights protection
Business ethics and integrity
Talent development and recognition
IT operations
Business and economic performance
Operational Integrity
Sustainability of supply chain
Pricing
Customer privacy and data protection
Fair and equal remuneration
Materials consumed
Investment strategy / M&A
Tax strategy
Regulatory compliance
Risk and crisis management
CRM / Customer satisfaction
Respect for human rights
Talent acquisition and retention
Corporate governance
LOW HIGH
IMPACT ON SGS
IMPO
RTA
NCE
TO
STA
KEH
OLD
ERS
LOW
H
IGH
BUSINESS MATERIALITY MATRIX
101

RISK AREA RISK DESCRIPTION MEASURES IN PLACE
STRATEGY AND PLANNING
INVESTMENT Investment is required for SGS to remain responsive to market and technological advances.
• Solid individual business strategies and development plans
EXTERNAL FACTORS / COMPETITION
The SGS Group operates in volatile markets and needs to sustain and/or develop market share with innovation and technical developments.
• Market intelligence (TIC industry trends)
• Innovation team
• Organic growth initiatives by individual business
BUSINESS PERFORMANCE
The success of the SGS Group relies on achieving our strategic objectives linked to growth and margin.
• Continuous evaluation of assets and businesses
MERGERS AND ACQUISITIONS
Inorganic growth has a significant impact on achieving the Groups strategic objectives. Inefficient integration of new companies may lead to suboptimal synergies.
• Specific policy on mergers and acquisitions (key organisational criteria and financial metrics)
• Operations Council review/approval of projects against admissibility criteria
• Integration guidelines and platform to monitor integration status
PRICING Pricing strategies to ensure that the SGS Group remains competitive in market sectors and geographies.
• Benchmarking of services and pricing tariffs
• Customer engagement and formal reviews
POLITICAL ACTIVITIES
Political instability is a risk in some of the countries where SGS Group operates.
• Collaboration with experts to maintain local legal, political and fiscal knowledge
• Diversification of activities and countries to limit geopolitical risk
GOVERNANCE AND INTEGRITY
CORPORATE GOVERNANCE
The quality of governance affects the management of risk and the value of a corporation. Effective, strong corporate governance is essential for the efficient functioning of markets.
• The SGS Board of Directors has overall responsibility for key business policies, operational management and strategic oversight of the Group's business activities. It is also responsible for ensuring regulatory compliance, effective internal controls and standards of professional conduct
• The SGS Board is assisted by the Audit Committee, Professional Conduct Committee and Operations Council to ensure appropriate quality of governance
BUSINESS ETHICS
SGS operates in countries that are recognised as having higher bribery and corruption risks. Non-compliance with related laws, such as anti-bribery or fair competition legislation, could lead to litigation or loss of accreditations.
• The SGS Code of Integrity and Code of Conduct for Suppliers
• Integrity rules (from integrity of services to compliance with legislation)
• Training for all employees
• Whistle-blowing process
• SGS Human Rights Policy (as of 2017)
RISK MANAGEMENT OVERVIEW
102
5. MARKET RISKS

REPUTATION SGS relies on its reputation for integrity and independence. In the event of poor service delivery or a health and safety-related incident, crisis management may not be sufficient to mitigate any resulting brand and reputational damage.
• Business operating procedures
• Health and safety standards
• SGS Code of Integrity and whistle-blowing process
• Risk (annual risk assessment) and control framework
• Business Continuity Plan
REGULATORY COMPLIANCE
The SGS Group is subject to a wide variety of laws, regulations and government policies. SGS is exposed to litigation, which could lead to payment of damages and affect the reputation of the Group.
• Claim reporting system
• Insurance coverage and policies
• Continued government scrutiny
GLOBAL SUPPORT
IT INTEGRITY AND DATA SECURITY
Information systems and technology infrastructure are key to supporting SGS' strategy and growth. The IT architecture and the new technologies chosen could expose SGS Group to new threats.
• Information Technology Service Delivery Model
• Security systems and applications
• Identification and prioritisation of strategic projects through the IT Committee
• IT security strategy
• Security operations centre development
• Customer privacy and data protection controls
FINANCE The SGS Group could suffer from failing to present reliable financial statements. SGS Group is also exposed to risks of fraud or financial misstatements.
• Review of annual and half-year results by independent external auditors
• Financial and management controls
• The Internal Control organisation at SGS expanded in 2016, strengthening the control framework.
• Various policies are being revisited and updated, such as the Group Tax Policy and the Group Treasury Policy
SECURITY OF COMPANY ASSETS
SGS businesses and assets (covering our people, physical assets, equipment, intellectual property and funds) can be exposed to a range of security risks.
• SGS Corporate Security team
• SGS Global Security Standard and Security Guidelines
• Security Intelligence Hub collates internal and external data on threats and controls in place
RESPECT FOR HUMAN RIGHTS
Business should be conducted in a manner that respects the rights and dignity of everyone affected by our business activities.
• SGS Business Principles, Code of Integrity and SGS Human Rights Policy
• SGS Code of Conduct for Suppliers and Supplier Self-Assessment Questionnaire
• SGS Human Rights Committee
• SGS Professional Conduct Committee
• Whistle-blowing process
SUSTAINABLE PROCUREMENT
As a major purchaser, SGS must ensure a sustainable supply of goods and services.
• Rationalisation of supply base and efficiency savings
• SGS Code of Conduct for Suppliers
• SGS Supplier Self-Assessment Questionnaire
RISK AREA RISK DESCRIPTION MEASURES IN PLACE
103

TALENT ACQUISITION AND RETENTION
The SGS Group relies on key personnel, from operations to executive level. SGS needs to retain employees with relevant experience. Skilled employees may leave to join competitors. Loss of key personnel may impact quality, reputation and customer confidence.
• Succession planning to ensure effective continuation of leadership and expertise
• Geographic mobility to ensure continuity
• Employer branding initiative to attract talent
• New HR strategy focusing on talent management and recruitment
• Employee engagement via CATALYST survey and employee representation and collective bargaining systems
DIVERSITY AND EQUAL OPPORTUNITIES
All workers must be treated equally and be given the same set of opportunities regardless of their race, age, gender, sexuality, disability, culture or anything else that might be discriminated against.
• The SGS Business Principles, Code of Integrity, Employment Policy and the SGS Human Rights Policy underline our commitment to diversity and equal opportunities
• Employees and managers are trained in the principles of non-discrimination as part of our mandatory annual integrity training
INVESTMENT IN LOCAL COMMUNITIES
Businesses are expected to reduce their impact and respect the rights and dignity of individuals and communities affected by business activities.
• Revised SGS Community Policy and Guidelines from early 2017
• SGS sponsorship and investment in community programmes
• Annual community survey monitors performance in local community projects around the world
OPERATIONS
INNOVATION CAPABILITY
Failure to innovate new services and ways of delivering them could prevent SGS from maximising revenue.
• Monitoring of operational KPIs to allow rapid up/down- scaling of variable costs
• Diversified service offering to a wide range of industries and geographies
• Increasing digitalisation of services
CUSTOMER RELATIONSHIP MANAGEMENT
A lack of focus on customer needs may lead to customer dissatisfaction and customer loss.
• Key account management structure and dedicated sales people
• Tracking on-time delivery
• Customer satisfaction surveys
ENERGY AND CLIMATE CHANGE
Mismanaged energy consumption and greenhouse gas emissions could lead to increased costs, interrupted supply, safety risks, business disruption and regulatory fines.
• Sustainability management system and external verification of sustainability data
• Carbon neutral strategy, Energy Efficiency in Building programme and commitment to RE100 to purchase 100% renewable energy
• Employee awareness campaigns
• Fleet Vehicle Emissions Policy
RISK AREA RISK DESCRIPTION MEASURES IN PLACE
104
5. MARKET RISKS

REPORT ON THE INTERNAL ASSURANCE OF THE SUSTAINABILITY CONTENT IN THE 2016 SGS ANNUAL REPORTNATURE AND SCOPE OF THE ASSURANCE
The scope of this assurance included examining the performance data and its supporting text, and reviewing the management of this data.
The Sustainability content in the 2016 SGS Annual Report has been assured using SGS’ own protocols to ensure consistency with the service offered to customers. The assurance comprised reviewing all relevant documentation and conducting interviews with relevant employees at the Head Office in Geneva and at affiliate level. Audit reviews of data samples and management were also carried out onsite and through conference calls.
Financial data drawn directly from independently audited financial accounts has not been checked back to source as part of this assurance process, including the financial data related to procurement on page 72 (paragraph 1 to 3 included). As it was not related to sustainability reporting, page 96 (in its entirety) was not included in the scope of the assurance process. Case studies in the report were also not included in the assurance process. Assurance of claims by SGS that are statements of commitments or forward looking in nature was not provided. In SGS, the materiality evaluation forms part of the risk evaluation and management process. Consequently, the Business Materiality Matrix lay beyond the scope of this assurance process.
The assurance team was assembled based on their knowledge, experience and qualifications for this assignment, and comprised auditors with the following qualifications: Lead Quality, Health and Safety, Environmental and SA8000 Auditor and assurance practitioner.
The responsibility of the assurance team is to express an opinion on the text, data, graphs and statements within the scope of verification, with the intention to inform all SGS stakeholders and to form the basis of improvements in the process for future reporting.
This report has been assured at a moderate level of scrutiny using our protocols for:
• Evaluation of veracity of the reported text, graphs and statements and performance data (including data on the web) with a focus on text, graphs and statements and performance data related to the identified material issues.
ASSURANCE OPINION
In 2015, SGS extended its CO2 emission scope to the full SGS Group. In 2016, part of the focus of the CO2 data collation was to improve capture of the CO2 emissions related to district heating, which were however not included in the 2016 Total GHG emissions. This was noted by the assurors, who are satisfied that the underestimation stays within a range (4% to 6%), which will not bias the stakeholders’ opinion.
On the basis of the methodology described and the verification work performed, we are satisfied that the information and data contained within the Sustainability Content in the 2016 SGS Annual Report is reliable and provides a fair and balanced representation of SGS activities in 2016 within the limitations of the stated reporting scope. However, in our opinion, the measurement of purchased water consumption could be improved.
RECOMMENDATIONS
It is recommended in future reporting that SGS use the materiality evaluation to identify case studies which highlight activities around high priority issues.
A report has been prepared for SGS Management, which includes a detailed set of recommendations to help identify areas for future improvement.
Rita Godfrey Michel Mooser
Lead SRA Assuror SRA Assuror
Geneva, 9 February 2017
ASSURANCE STATEMENT
105

SGS SERVICE
> Strategic Thinking and Planning Training
CONSUMER BENEFIT
> Better senior managers leading better companies

UNLOCKING NEW SKILLS
Talent Management is crucial for SGS given the emphasis we place on the high calibre of our people. This manifests itself across our entire business. For example, led by our CFO, the transformation of our Finance function is well underway and is set to deliver world-class efficiency and effectiveness whilst bringing further added-value to the business. Yet, this strategic change also needs to be considered from a talent management perspective.
Our senior Finance leaders, together with Human Resources, are taking a very active role in helping employees transition smoothly as the financial transformation initiative takes place. Doing this effectively will ensure the optimisation of operations in our three global service centres and allow us to develop closer business partnerships with our local Finance teams, who will provide guidance and ensure compliance.
In 2016, numerous activities have led to a strengthening of open communication, employee engagement and talent management. People development plans and learning solutions are being aligned to the core competencies, which are at the heart of this transformation. Career-pathing, development tools and tips are being shared by Finance leaders with all employees to encourage further professional growth.

108
This Corporate Governance Report informs shareholders, prospective investors and the public at large on SGS policies in matters of corporate governance, such as the structure of the Group shareholders' rights, composition roles and duties of the Board of Directors and its Committees and Management and internal controls and audits. This report has been prepared in compliance with the Swiss Exchange (SIX) Directive on Information Relating to Corporate Governance of 1 January 2016 and with the Swiss Code of Best Practice for Corporate Governance.
The SGS Corporate Governance framework aims to achieve an efficient allocation of resources and clear mechanisms for setting strategies and targets, in order to maximise and protect shareholder value. SGS strives to attain this goal by defining clear and efficient decision-making processes, fostering a climate of performance and accountability among managers and employees alike, and aligning employees’ remuneration with the long-term interests of shareholders.
1. GROUP STRUCTURE AND SHAREHOLDERS
1.1. Group Structure
1.2. Significant Shareholders
1.3. Cross-Shareholdings
2. CAPITAL STRUCTURE
2.1. Issued Share Capital
2.2. Authorised and Conditional Share Capital
2.3. Changes in Capital
2.4. Shares and Participation Certificates
2.5. Dividend-right Certificates
2.6. Limitations on Transferability and Admissibility of Nominee Registrations
2.7. Convertible Bonds and Warrants/Options
3. BOARD OF DIRECTORS
3.1. Members of the Board of Directors
3.2. Cross Involvement
3.3. Elections and Terms of Office
3.4. Limits on External Mandates
3.5. Internal Organisational Structure
3.5.1. Allocation of Tasks within the Board of Directors
3.5.2. Committees
3.5.3. Working Methods of the Board and its Committees
3.6. Definition of Areas of Responsibility
3.7. Information and Control Instruments vis-à-vis the Management
4. OPERATIONS COUNCIL
4.1. Members of the Operations Council
4.2. Other Activities and Functions
4.3. Limits on External Mandates
4.4. Management Contracts
5. COMPENSATION, SHAREHOLDINGS AND LOANS
5.1. Content and Method of Determining the Compensation and the Shareholding Programmes
5.1.1. Rules on Performance-Related Pay and Allocation of Equity-Linked Instruments
5.1.2. Rules on Loans, Credit Facilities and Post-Employment Benefits
5.1.3. Rules on Vote on Pay
6. SHAREHOLDERS’ PARTICIPATION RIGHTS
6.1. Voting Rights and Representation Restrictions
6.2. Statutory Quorums
6.3. Convocation of General Meetings of Shareholders
6.4. Agenda
6.5. Registration in the Share Register
7. CHANGE OF CONTROL AND DEFENCE MEASURES
7.1. Duty to Make an Offer
7.2. Clauses on Change of Control
8. AUDITORS
8.1. Duration of the Mandate and Term of Office
8.2. Audit Fees
8.3. Additional Fees
8.4. Supervisory and Control Instruments vis-à-vis the Auditors
9. INFORMATION POLICY
6. GOVERNANCE

109
1. GROUP STRUCTUREAND SHAREHOLDERS
1.1. GROUP STRUCTURE
SGS SA, registered in Geneva (CH), also referred to as the “Company”, controls directly or indirectly all entities worldwide belonging to the SGS Group, which provides independent inspection, verification, testing, certification and quality assurance services. The shares of SGS SA are listed on the SIX Swiss Exchange and are traded on SIX Europe (Swiss Security Number: 249745; ISIN: CH0002497458).
On 31 December 2016, market capitalisation was approximately CHF 16 208 million (2015: CHF 14 949 million). Shares are quoted on the SIX Swiss Exchange.
None of the companies under the direct or indirect control of SGS SA has listed its shares or other securities on any stock exchange.
The principal legal entities consolidated within the Group are listed on pages 218 to 221 of the Annual Report, with details of the share capital, the percentage of shares controlled directly or indirectly by SGS SA and the registered office or principal place of business.
Details of acquisitions made by the SGS Group during 2016 are provided in note 3 of the consolidated financial statements included in the section SGS Group Results (pages 156 to 157) of this Annual Report.
The operations of the Group are divided into nine regions, each led by a Chief Operating Officer who is responsible for the SGS businesses in that region and for the local implementation of Group policies and strategies.
At 31 December 2016, geographic operations were organised as follows:
Europe, Africa, Middle East
• Western Europe
• Northern, Central and Southern Europe
• Eastern Europe and Middle East
• Africa
Americas
• North America
• South and Central America
Asia Pacific
• East Asia
• China and Hong Kong
• South Eastern Asia and Pacific
The Group is also structured into nine lines of business. Each business line is responsible for the global development of Group activities within its own sphere of specialisation and for the execution of strategies with the support of the Chief Operating Officers.
At 31 December 2016, the business lines were organised as follows:
• Agriculture, Food and Life
• Minerals
• Oil, Gas and Chemicals
• Consumer and Retail
• Certification andBusiness Enhancement
• Industrial
• Environmental, Health and Safety
• Transportation
• Governments and Institutions
Each line of business is led by an Executive Vice President. Chief Operating Officers and Executive Vice Presidents are members of the Operations Council, the Group's most senior management body.
1.2. SIGNIFICANT SHAREHOLDERS
As at 31 December 2016, Groupe Bruxelles Lambert acting through Serena SARL held 16.20% (2015: 15.00%). Mr. August von Finck and members of his family acting in concert held 15.03% (2015: 15.03%), the Bank of New York Mellon Corporation held 3.35% (2015: 3.35%), BlackRock, Inc. held 3.03% (2015: 3.03%) and MFS Investment Management held 3.01% (2015: 3.01%) of the share capital and voting rights of the Company.
At the same date, SGS Group held 3.63% of the share capital of the Company (2015: 2.77%).
During 2016, the Company has published regularly on the electronic platform of the Disclosure Office of the SIX Swiss Exchange Ltd. all disclosure notifications received from shareholders of transactions subject to the disclosure obligations of Article 20 SESTA. Such disclosure notifications can be accessed at: www.six-swiss-exchange.com/ shares/companies.
1.3. CROSS-SHAREHOLDINGS
Neither SGS SA nor its direct and indirect subsidiaries have any cross-shareholding in any other entity, whether publicly traded or privately held.
6. GOVERNANCE

110
2. CAPITAL STRUCTURE
2.1. ISSUED SHARE CAPITAL
The share capital of SGS SA is CHF 7 822 436 and comprises 7 822 436 fully, paid-in, registered shares of a par value of CHF 1. On 31 December 2016, SGS SA held 283 929 treasury shares (2015: 216 976). The shares related to the shares buyback programme are directly held by SGS SA, the shares to cover the equity compensation plan are held by a subsidiary company.
In 2016, 49 162 treasury shares were sold to cover the equity compensation plans and 6 315 were purchased for an average price of CHF 2 127. As part of the shares buyback programme, 109 800 shares were purchased in 2016 for an average price of CHF 1 961. In 2015, the Group Initiated a share buyback programme for a total of up to CHF 750 million. Up to CHF 500 million is designated for cancellation and the remainder for employee equity participation plans and/or for utilisation as underlying securities for potential issuances of convertible bonds. The programme started on 20 January 2015 and ended on 31 December 2016.
2.2. AUTHORISED AND CONDITIONAL SHARE CAPITAL
The Board of Directors has the authority to increase the share capital of the Company by a maximum of 500 000 registered shares with a par value of CHF 1 each, corresponding to a maximum increase of CHF 500 000 in share capital. The Board is authorised to issue the new shares at the market conditions prevailing at the time of issue. In the event that the new shares are issued for the purpose of an acquisition, the Board is authorised to waive the shareholders’ preferential right of subscription or to allocate such subscription rights to third parties. The authority delegated by the shareholders to the Board of Directors to increase the share capital is valid until 12 March 2017. The shareholders have conditionally approved an increase of share capital by an amount of CHF 1 100 000 divided into 1 100 000 registered shares with a par value of CHF 1 each. This conditional
share capital increase is intended to obtain the shares necessary to meet the Company’s obligations with respect to employee share option plans and option or conversion rights of convertible bonds or similar equity-linked instruments that the Board is authorised to issue.
The right to subscribe to such conditional capital is reserved to beneficiaries of employee share option plans and holders of convertible bonds or similar debt instruments and therefore excludes shareholders’ preferential rights of subscription. The Board is authorised to determine the timing and conditions of such issues, provided that they reflect prevailing market conditions. The term of exercise of the options or conversion rights may not exceed ten years from the date of issuance of the equity-linked instruments.
2.3. CHANGES IN CAPITAL
There have been no changes to the Company’s share capital in the last nine years.
2.4. SHARES AND PARTICIPATION CERTIFICATES
All shares, other than treasury shares held by SGS SA, have equal rights to the dividends declared by the Company and have equal voting rights. The Company has not issued any participation certificates (bons de participation/Partizipationsscheine).
2.5. DIVIDEND-RIGHT CERTIFICATES
The Company has not issued any dividend-right certificates.
2.6. LIMITATIONS ON TRANSFERABILITY AND ADMISSIBILITY OF NOMINEE REGISTRATIONS
SGS SA does not limit the transferability of its shares. The registration of shares held by nominees is not permitted by the Company’s Articles of Association, except by special resolution of the Board of Directors. By decision of the Board, the Company’s shares can be registered in the name of a nominee acting in a fiduciary capacity for an undisclosed principal, provided however that shares registered in the names of nominees or fiduciaries may not exercise voting rights
above a limit of 5% of the aggregate share capital of the Company. This rule was made public on 23 March 2005.
The Company has a single class of shares and no preferential rights, statutory or otherwise, have been granted to any shareholder.
2.7. CONVERTIBLE BONDS AND WARRANTS/OPTIONS
No convertible bonds have been issued by the Company or by any entity under its direct or indirect control. Options and other share based remuneration granted to senior managers of the Group are detailed in the SGS Remuneration Report. Details of all options outstanding are provided in note 31 of the consolidated financial statements of the Group.
No other options or similar instruments have been issued by the Company nor by any of the Group’s subsidiaries.
3. BOARD OF DIRECTORS
The Board of Directors is the highest governing body within the Group. It is the ultimate decision-making authority except for those decisions reserved by law to the General Meeting of Shareholders.
3.1. MEMBERS OF THE BOARD OF DIRECTORS
This section presents the Members of the Board of Directors of the Company, with their functions in the Group, their professional backgrounds and all their material positions held outside the Group in governing and supervisory boards, management positions and consultancy functions, official tenures and political commitments, both in Switzerland and abroad, as at 31 December 2016 (an * denotes a listed company).
Each Board member brings particular skills, leadership and experience, acquired through their respective careers spanning many industries. Together they enable the Board to provide leadership, strategic overview and guidance, which contribute to setting ambitious targets for the Group and meeting long-term value creation objectives.
6. GOVERNANCE

111
SERGIO MARCHIONNE (1952)
Canadian/Italian
Function in SGS
Chairman:
• Board of Directors
• Audit Committee
• Professional Conduct Committee
Initial appointment to the Board
May 2001
Professional Background
Chief Executive Officer of *Fiat Chrysler Automobiles N.V.
Chairman of *CNH Industrial N.V.
Chairman and CEO of *Ferrari N.V.
Sergio Marchionne holds a BA in Philosophy from the University of Toronto, and an LLB degree from Osgoode Hall Law School, York University, in Toronto. He also has an MBA and B.Com from the University of Windsor, in Canada.
A barrister, solicitor and chartered accountant, Mr. Marchionne began his career in Canada in 1983.
In 2004, he became CEO of Fiat S.p.A., headquartered in Turin. In addition, in June 2009, he was appointed CEO of Chrysler Group LLC and, in September 2011, also assumed the role of Chairman.
In October 2014, he became Chairman of Ferrari S.p.A. and CEO of *Fiat Chrysler Automobiles N.V. (FCA), the company resulting from the merger of Fiat S.p.A. and Chrysler Group LLC. As of September 2013, he is also Chairman of *CNH Industrial N.V., the company resulting from the mergers of CNH Global N.V. and Fiat Industrial S.p.A. He served as Chairman of CNH Global N.V. from 2006 and Fiat Industrial S.p.A. from 2011, becoming Chairman of *CNH Industrial N.V., the company resulting from the merger of CNH Global N.V. and Fiat Industrial S.p.A. in 2013.
Other Activities and Functions
*Philip Morris International SA,Lausanne (CH), Member of the Board
*Exor N.V., Amsterdam (NL), Memberof the Board
Peterson Institute for International Economics, Member of the Board
Council for the United States and Italy, Chairman
European Automobile Manufacturers’ Association (ACEA), Brussels (BE), Member of the Board
J.P. Morgan International Council, Member
PAUL DESMARAIS, JR (1954)
Canadian
Function in SGS
Member:
• Board of Directors
Initial appointment to the Board
July 2013
Professional Background
Chairman and Co-Chief Executive Officer, * Power Corporation of Canada.
Paul Desmarais, Jr. has a Bachelor of Commerce Degree from McGill University, Montréal and an MBA from the Institut Européen d'Administration des Affaires (INSEAD), France.
He has received honorary doctorates from various Canadian universities.
He joined Power Corporation of Canada in 1981 and assumed the position of Vice-President the following year. In 1984, he led the creation of Power Financial Corporation to consolidate Power’s major financial holdings, as well as Pargesa Holding SA, under a single corporate entity. Mr. Desmarais served as Vice-President from 1984 to 1986, as President and Chief Operating Officer of Power Financial from 1986 to 1989, as Executive Vice Chairman from 1989 to 1990, as Executive Chairman from 1990 to 2005, as Chairman of the Executive Committee from 2006 to 2008 and as Executive Co Chairman from 2008 until today. He was named Chairman and Co-CEO with Power Corporation in 1996. After Power
Financial and the Frère Group of Belgium took control of Pargesa in 1990, Mr. Desmarais moved to Europe from 1990 to 1994, to develop the partnership with the Frère Group and to restructure the Pargesa group.
From 1982 to 1990, he was a member of the Management Committee of Pargesa, in 1991, Executive Vice Chairman and then Executive Chairman of the Committee, in 2003, he was appointed Co-Chief Executive Officer and in 2013 named Chairman of the Board. He is a Director of many Power Group companies in North America.
Other Activities and Functions
*Groupe Bruxelles Lambert,Brussels (BE), Vice-Chairman ofthe Board of Directors
*Great-West Lifeco Inc., Winnipeg(Can), Member of the Board (includingthose of its major subsidiaries)
*IGM Financial Inc., Winnipeg (Can),Member of the Board (including thoseof its major subsidiaries)
*LafargeHolcim, Zürich (CH),Board Member
*Pargesa Holding SA, Geneva (CH),Board Member since 1992, Chairmanof the Board since 2013
*Total SA, Paris (F), Member of the Board
Member of the Advisory Council of the European Institute of Business Administration (INSEAD)
Trustee of the Brookings Institution and a Co-Chair of the Brookings International Advisory Council (USA)
Past Chairman and a Member of
the Business Council of Canada (Can).

112
AUGUST VON FINCK (1930)
German
Function in SGS
Member:
• Board of Directors
• Nomination and Remuneration Committee
Initial appointment to the Board
October 1998
Professional Background
August von Finck is an Industrialist. He descends from the banking family von Finck. His grandfather, Wilhelm von Finck, founded Merck, Finck and Co. in 1870, the private bank which was at the origin of companies including Munich Re, Allianz insurance and the Löwenbräu breweries, among others.
Based in Munich, this third generation member of the von Finck family holds interests in a number of German, Swiss and Austrian companies as well as in groups from other countries. In Switzerland, August von Finck's participations include Mövenpick Holding A.G. and Von Roll Holding A.G.
AUGUST FRANÇOIS VON FINCK (1968)
Swiss
Function in SGS
Member:
• Board of Directors
• Audit Committee
Initial appointment to the Board
May 2002
Professional Background
François Von Finck holds a Master of Business Administration from Georgetown University, Washington D.C. He has a banking background and is currently Managing Director of Carlton Holding in Basel.
Other Activities and Functions
*Custodia Holding, Munich (DE), Member of the Board since 1999
Carlton Holding, Allschwil (CH), Member of the Board since 2001
*Staatl. Mineralbrunnen AG, Bad Brückenau (DE), Member of the Board since 2001
Bank von Roll, Zürich (CH), Vice-President of the Board since 2009
*Von Roll Holding AG, Breitenbach (CH), Member of the Board since 2010
IAN GALLIENNE (1971)
French
Function in SGS
Member:
• Board of Directors
• Nomination and Remuneration Committee
Initial appointment to the Board
July 2013
Professional Background
Co-CEO of *Groupe Bruxelles Lambert, since 2012, Ian Gallienne has a degree in Management and Administration, with a specialisation in Finance from Ecole Supérieure des Dirigeants d'Entreprises (ESDE) in Paris and an MBA from INSEAD in Fontainebleau. He began his career in 1992 in Spain as co-founder of a commercial company. From 1995 to 1997, he managed a consulting firm specialised in the reorganisation of ailing companies in France. From 1998 to 2005, he was Director at the private equity funds Rhône Capital LLC in New York and London. In 2005, he founded the private equity fund Ergon Capital Partners in Brussels and was its Managing Director until 2012. In 2012, he became Co-CEO of *Groupe Bruxelles Lambert of which he had been a Board Member since 2009.
Other Activities and Functions
*adidas (D), Member of the Supervisory Board
*Imerys, Paris (F), Member of the Board and Chairman of the Strategic Committee, Member of the Compensation Committee, Member of the Appointments Committee
*Pernod Ricard SA, Paris (F), Member of the Board, Member of the Strategic Committee and Member of the Remuneration Committee
* Umicore NV, (BE), Member of the Board
Erbe SA (BE), Member of the Board
CORNELIUS GRUPP (1947)
Austrian
Function in SGS
Member:
• Board of Directors
• Professional Conduct Committee
Initial appointment to the Board
March 2011
Professional Background
Dr. Grupp holds a Doctorate in Law and a Master in Business Administration.
He is the Owner and General Manager of Tubex Holding GmbH, Stuttgart, Germany, a company active in the packaging industry and of CAG Holding GmbH, Lilienfeld, Austria which is active in the field of aluminum, glass and fibres.
Other Activities and Functions
Schoellerbank AG, Vienna (AT), Member of the Board since 1999
Stölzle Oberglas, Koeflach (AT), Member of the Board since 1989
Honorary General Consul of Austria to the Land of Baden-Württemberg
6. GOVERNANCE

113
PETER KALANTZIS (1945)
Swiss/Greek
Function in SGS
Member:
• Board of Directors
• Audit Committee
Initial appointment to the Board
March 2009
Professional Background
Peter Kalantzis holds a Ph.D. in Economics and Political Sciences from the University of Basel and engaged in research as a member of the Institute for Applied Economics Research at the University of Basel between 1969 and 1971.
Prior to 2000, Peter Kalantzis was responsible for Alusuisse-Lonza Group's corporate development and actively involved in the de-merger and stock market launch of Lonza, as well as the merger process of Alusuisse and Alcan. Dr. Kalantzis served as head of the Chemicals Division of Alusuisse-Lonza Group from 1991 until 1996. In 1991, Dr. Kalantzis was appointed Executive Vice-President and Member of the Executive Committee of the Alusuisse-Lonza Group.
Dr. Kalantzis has worked as an independent consultant since 2000.
Other Activities and Functions
Mövenpick/Holding AG, Baar (CH), Chairman of the Board from 2000 to 2014, Member since 2014
Clair AG, Cham (CH), Chairman of the Board since 2004
*CNH Industrial NV, Amsterdam (NL), Member of the Board since 2013
Degussa Sonne/Mond Goldhandel AG, Cham (CH), Chairman of the Board since 2012
Consolidated Lamda Holdings Ltd., Luxembourg (LU), Member of the Board since 2002
Paneuropean Oil and Industrial Holdings SA, Luxembourg (LU), Member of the Board since 2001
*Von Roll Holding AG, Breitenbach (CH), Chairman of the Board since 2010, Member of the Board since 2007
Hardstone Services SA, Geneva (CH), Chairman of the Board since 2014, Member since 2009
Gnosis Foundation, Vaduz (FL), President of the Foundation Board since 2008
John S. Latsis Public Benefit Foundation, Vaduz (FL), President of the Executive Board since 2015
CHRISTOPHER KIRK (1956)
British
Function in SGS
Member
• Board of Directors
Initial appointment to the Board
March 2015
Professional Background
Chris Kirk holds a BSc (Hons) degree in Zoology. He began his career at SGS in 1981 in New Zealand. From 1981 to 1987 he undertook a range of different roles in the company, including Operations Manager, Business Development Manager and General Manager for SGS New Zealand.
Between 1987 and 1999, Chris held a number of senior positions in Thailand, Ghana, Singapore and Australia. He was appointed as Chief Operating Officer of the South East Asia/Pacific region in 2002 and was then appointed Vice President for Minerals and Environmental Services, a role he held for three years.
Chris was Chief Executive Officer for SGS between 2006 and 2015 before being elected to the Board of Directors at the 2015 Annual Shareholders Meeting. He brings to the Board his unparalleled experience in the industry and in-depth knowledge of the Group.
Other Activities and Functions
Compass Limited, Hamilton, Bermuda, Chairman since 2016, Member of the Board since 2011
GÉRARD LAMARCHE (1961)
Belgian
Function in SGS
Member:
• Board of Directors
• Audit Committee
Initial appointment to the Board
July 2013
Professional Background
Co-CEO of *Groupe Bruxelles Lambert, since 2012.
Gérard Lamarche is a graduate in Economic Sciences from the University of Louvain-la-Neuve and the INSEAD Business School (Advanced Management Program for Suez Group Executives). He also trained at the Wharton International Forum in 1998-99 (Global Leadership Series).
He began his professional career with Deloitte Haskins and Sells in Belgium in 1983, and was appointed as an M&A Consultant in the Netherlands in 1987. In 1988, he joined Société Générale de Belgique as an Investment Manager. He was promoted to Controller in 1989 before becoming an Advisor to the Strategy and Planning Department from 1992 to 1995.
He joined Compagnie Financière de Suez as Special Advisor to the Chairman and Secretary to the Suez Executive Committee (1995-1997); he was later appointed Senior Vice President in charge of Planning, Control and Accounting.
In 2000, Gérard Lamarche joined NALCO (the US subsidiary of the Suez Group and world leader in industrial water treatment) as General Managing Director. He was appointed CFO of the Suez Group in 2003.
He has been a Director of *Groupe Bruxelles Lambert since 2011 and Co-CEO since 2012.

114
Other Activities and Functions
*LafargeHolcim, Zurich (CH), Member of the Board, Member of the Strategy and Sustainability Committee, Chairman of the Finance and Audit Committee
*Total SA, Paris (F), Member of the Board, Member of the Audit Committee and Chairman of the Remuneration Committee
SHELBY R. DU PASQUIER (1960)
Swiss
Function in SGS
Member:
• Board of Directors
• Professional Conduct Committee
• Nomination and Remuneration Committee, Chairman
Initial appointment to the Board
March 2006
Professional Background
Attorney at Law, Partner Lenz and Staehelin Law firm, Geneva.
Shelby R. du Pasquier holds degrees from Geneva University Business School and School of Law as well as from Columbia University School of Law (LLM). He was admitted to the Geneva Bar in 1984 and to the New York Bar in 1989. He became a partner of Lenz and Staehelin in 1994.
Other Activities and Functions
*Swiss National Bank, Member of the Board since 2012
Stonehage Trust Holdings (Jersey) Limited, Member of the Board since 2012
Pictet and Cie Group SCA, Chairman of the Supervisory Board since 2013
The Directors bring a wide range of experience and skills to the Board. They participate fully in decisions on key issues facing the Group. Their combined expertise in the areas of finance, commercial law and strategy, and their respective positions of leadership in various industrial sectors are important contributing factors to the successful governance of an organisation of the size and complexity of SGS.
The Board undertakes a periodic review of the Directors’ interests in which all potential or perceived conflicts of interests and issues relevant to their independence are considered. Based on this review, the Board has concluded that, with the exception of Christopher Kirk who was Group CEO immediately before his nomination to the Board, all the non-executive Directors (including the Chairman) are independent from Management and free of any relationship that could materially interfere with the exercise of their independent judgement.
Other than Sergio Marchionne (Group Chief Executive Officer between February 2002 and June 2004, and Christopher Kirk (Group Chief Executive Officer between November 2006 and March 2015), none of the Directors or their close relatives has or had any management responsibility within the SGS Group.
None of the Members of the Board of Directors or their close relatives has or had any material business connections with the Company or its affiliated companies. The remuneration of the Members of the Board of Directors is detailed in the Remuneration Report.
The Chairman of the Board, jointly with members of the Board of Directors, reviews periodically the performance of the Board as a whole, of its Committees and of each of its individual members.
On the basis of this periodic assessment, changes to the composition of the Board membership are regularly proposed to the Company's Annual General Meeting of Shareholders.
This periodic performance evaluation is designed to ensure that the Board is always in a position to provide an effective oversight and leadership role to the Group.
3.2. CROSS INVOLVEMENT
No member of the Board of Directors or of the Operations Council is also a member of the executive bodies of entities or organisations with which the Group has material business or commercial relations.
3.3. ELECTIONS AND TERMS OF OFFICE
The Articles of Association of SGS SA provide that each Member of the Board of Directors, and among them the Chairman of the Board of Directors and the Members of the Nomination Remuneration Committee, is elected each year by the shareholders for a period ending at the next Annual General Meeting. Each Member of the Board is individually elected. There is no limit to the number of terms a Director may serve. The initial date of appointment of each Board Member is indicated in section 3.1.
3.4. LIMITS ON EXTERNAL MANDATES
In compliance with the Ordinance against Excessive Compensation at Listed Joint-Stock Companies (OaEC), the Company’s Articles of Association limit the number of mandates permissible to Board members. These rules limit the number of mandates that board members can accept to no more than ten board memberships in entities outside the Group, out of which a maximum of five memberships in board of companies whose shares are traded on a stock exchange. Mandates assumed at the request of a controlling entity do not count towards the maxima defined in the Articles of Association. In addition, the Articles of Association set similar limits to participations in board of associations and other non for profit organisations. All Board members have confirmed that they comply with these rules.
3.5. INTERNAL ORGANISATIONAL STRUCTURE
The duties of the Board of Directors and its Committees are defined in the Company’s Articles of Association and in its internal regulations, which are reviewed periodically. They set out all matters for which a decision by the Board of Directors is required.
6. GOVERNANCE

115
In addition to the decisions required by Swiss company law, the Board of Directors approves the Group’s strategies and key business policies, investments, acquisitions, disposals and commitments in excess of delegated limits.
3.5.1. Allocation of Tasks within the Board of Directors
The Chairman of the Board is elected by the Annual Meeting of Shareholders. He plans and chairs the Board meetings, defines the agenda of the meetings and conducts the deliberations of the Board of Directors. All Members of the Board of Directors participate in deliberations of the Board and participate equally in its decisions. Within the limits permitted by law or by the Articles of Association, the Board of Directors can decide to delegate certain of its tasks to standing or ad-hoc committees. With the exception of the members of the Nomination and Remuneration Committee, who are elected by the Shareholders, the members of other Committees are appointed by the Board.
3.5.2. Committees
The following Committees have been established within the Board of Directors:
• Nomination and Remuneration
• Audit
• Professional Conduct
Each Committee acts within terms of reference established by the Board of Directors and set out in the internal regulations of the Company. The minutes of their meetings are available to all Directors.
Nomination and Remuneration Committee
The Committee acts in part in an advisory capacity to the Board, and in part as a decision-making body on matters that the Board has delegated to the Committee. The Committee advises the Board of Directors on matters regarding the remuneration of the Members of the Board of Directors and Management, and on general policies relating to remuneration applicable to the Group. The Committee defines the conditions of share-based remuneration
plans or other plans for the allocation of shares, issued from time to time by the Company. The Committee reviews and approves the contractual terms of the employment of the Chief Executive Officer and the other members of the Management. The Committee reviews regularly, at least once a year, the compensation of each member of the Operations Council. The Committee drafts the SGS Remuneration Report.
In 2016, the following Directors served on the Nomination and Remuneration Committee:
• August von Finck
• Ian Gallienne
• Shelby du Pasquier (Chairman)
In 2016, the Committee held one meeting. Meetings of the Nomination and Remuneration Committee were attended by all members and had a duration of two hours.
Audit Committee
The Audit Committee supports the Board of Directors in discharging its duties in relation to financial reporting and internal controls. Such duties include consideration of the appropriateness of accounting policies, the adequacy of internal controls, risk management and regulatory compliance. It is also responsible for the supervision of the internal and external auditors of the Group, each of which provides regular reports to the Committee on findings arising from their work. The Committee reports regularly to the Board of Directors on its findings.
In 2016, the following Directors served on the Audit Committee:
• Sergio Marchionne (Chairman)
• August François von Finck
• Gérard Lamarche
• Peter Kalantzis
In 2016, the Audit Committee held four meetings, with an average duration of one and a half hours. Meetings were attended by all members.
Professional Conduct Committee
The Professional Conduct Committee assists the Board of Directors and Management in establishing policies relating to professional conduct and oversees their implementation. The Group’s professional conduct policies are embodied in the Code of Integrity, which sets out the principles governing business conduct, which are applied across the whole SGS Group. These principles reflect the Business Principles for Countering Bribery issued by Transparency International and Social Accountability International, and incorporate the rules adopted by the International Federation of Inspection Agencies (IFIA), the professional association for the inspection industry.
In 2016, the following Directors served on the Professional Conduct Committee:
• Sergio Marchionne (Chairman)
• Shelby du Pasquier
• Cornelius Grupp
In addition to the Board Members, the Professional Conduct Committee also comprises the Chief Executive Officer and the General Counsel and Chief Compliance Officer (General Counsel). The head of Internal Audit attends all meetings of the Professional Conduct Committee. The Committee met twice in 2016, with an average duration of one hour and passed several resolutions in writing. All meetings were attended by all members.
3.5.3. Working Methods of the Board and its Committees
The Board of Directors and each Committee convene regularly scheduled meetings with additional meetings held as and when required, in person or by phone conference. The Board and the Committees may pass resolutions by written consent. Each Board Member has the right to request that a meeting be held or that an item for discussion and decision be included in the agenda of a meeting. Board and Committee members receive supporting documentation in advance of the meetings and are entitled to request further information from the Management in order to assist them to prepare for the meetings. The Board and each of the Committees can

116
request the attendance of members of the management of the Group. The Board and each of the Committees are authorised to hire external professional advisors to assist them in matters within their sphere of responsibility. To be adopted, resolutions need a majority vote of the members of the Board or Committee, with the Chairman having a casting vote. The Board of Directors held five physical meetings in 2016. Meetings of the Board of Directors had an average duration of three hours. All members of the Board of Directors attended every meeting of the Board in 2016, with the exception of one Board member being excused for one meeting.
3.6. DEFINITION OF AREAS OF RESPONSIBILITY
The Board of Directors is responsible for the ultimate direction of the Group. The Board discharges all duties and responsibilities that are attributed to it by law. In particular, the Board:
• Leads and oversees the conduct, management and supervision of the Group
• Determines the organisation of the Group
• Assesses risks facing the business and reviews risk management and mitigation policies
• Appoints and removes the Group’s Chief Executive Officer and other members of Management
• Defines the Group’s accounting and control principles
• Decides on major acquisitions, investments and disposals
• Discusses and approves the Group’s strategy, financial statements and annual budgets
• Prepares the General Meetings of Shareholders and implements shareholders’ resolutions
• Notifies the judicial authorities in the event of insolvency of the Company, as required by Swiss law
In accordance with the Company’s internal regulations, operational management of the Group, a function which the Board of Directors has delegated, is the responsibility of the Operations Council. The Operations
Council has the authority and responsibility to decide on all issues that are not attributed to the Board of Directors. In the event of uncertainty on a particular issue regarding the separation of responsibility between the Board of Directors and the Management, the final decision is taken by the Chairman of the Board. The Chairman is regularly informed of the activities of the Operations Council by the Chief Executive Officer, Chief Financial Officer and General Counsel.
The Operations Council is chaired by the Chief Executive Officer and consists of those individuals entrusted with the operational management of the Group’s activities, as follows:
• The Chief Operating Officers (COOs) are responsible for operations in the Group’s nine regions (see section 1.1.)
• The Executive Vice Presidents (EVPs) are entrusted with the management and development of the Group’s nine business lines (see section 1.1.)
• The Senior Vice Presidents (SVPs) represent the principal Group support functions (Finance, Human Resources, IT, Communications and Investor Relations, Corporate Development, Legal and Compliance, and Strategic Transformation).
The composition, role and organisation of the Operations Council are detailed in section 4.
3.7. INFORMATION AND CONTROL INSTRUMENTS VIS-À-VIS THE MANAGEMENT
A. Responsibility of the Board
The Board of Directors has ultimate responsibility for the system of internal controls established and maintained by the Group and for periodically reviewing its effectiveness. Internal controls are intended to provide reasonable assurance against financial misstatement and/or loss, and include the safeguarding of assets, the maintenance of proper accounting records, the reliability of financial information and the compliance with relevant legislation, regulation and industry practice.
B. Governance Framework
The Group has an established governance framework, which is designed to oversee its operations and assist the Company in achieving its objectives. The main principles of this framework include the definition of the role of the Board and its Committees, an organisational structure with documented delegated authority from the Board to Management and procedures for the approval of major investments, acquisitions and other capital allocations.
The Chief Executive Officer and the Chief Financial Officer participate in the meetings of the Board of Directors and of the Audit Committee.
The Group Controller and the Head of the Internal Audit Function participate in the meetings of the Audit Committee.
The Head of Human Resources participates in the meetings of the Nomination and Remuneration Committee and the General Counsel and Chief Compliance Officer attends all meetings of the Board of Directors and its Committees.
The other members of the Operations Council and other members of Management only participate in the Board and Committee meetings by invitation.
C. Information to the Board
The Board of Directors is constantly informed about the operational and financial results of the Group by way of detailed monthly management reports, which describe the performance of the Group and its divisions.
During each Board meeting, the Chief Executive Officer and the Chief Financial Officer present a report to the Board of Directors on the operations and financial results, with an analysis of deviations from prior year and from current financial targets.
During Board Meetings, the Board is updated on important issues facing the Group. The Chief Executive Officer, the Chief Financial Officer and the General Counsel and Chief Compliance Officer (hereafter “Senior Management”) attend all of the Board of Directors meetings, while other Operations
6. GOVERNANCE

117
Council members attend from time to time to discuss matters under their direct responsibility. The Board of Directors meets regularly with the members of the Operations Council.
During Board Meetings or Committee Meetings, Board members can require any information concerning the Group. The Board reviews and monitors regularly and formally previous acquisitions and large investments as well as the implementation of related Group strategies.
The Group has a dedicated Internal Audit function, reporting to the Chairman of the Board and the Audit Committee, which assesses the effectiveness and appropriateness of the Group’s risk management, internal controls and governance processes as well as the reliability of internal financial and operational information, and ensures that the standards and policies of the Group are respected. Internal Audit reviews and identifies areas of potential risk associated with the key business activities performed by a particular office, highlights opportunities for improvement and proposes constructive control solutions to reduce any exposures. All key observations are communicated to the Operations Council and the Chairman of the Board through formal and informal reports.
The Audit Committee is regularly informed about audits performed and important findings, as well as the progress in implementing the agreed actions by Management.
D. General Counsel andChief Compliance Officer
Furthermore, the Group has a Compliance Function, headed by the General Counsel and Chief Compliance Officer, who is a member of the Professional Conduct Committee and has direct access to the Chairman of the Board. The Compliance Function supports the implementation of a compliance programme based on the SGS Code of Integrity, available in 30 languages. The goal of the programme is to ensure that the highest standards of integrity are applied to all of the Group’s activities worldwide in accordance with
international best practices. The General Counsel and Chief Compliance Officer reports violations of compliance rules every semester to the Professional Conduct Committee.
The Committee monitors disciplinary actions taken and the implementation of corrective actions.
E. Other
In addition, the main business lines have specialised technical governance units, which ensure compliance with internally set quality standards and industry best practices. Formal procedures are in place for both internal and external auditors to report their findings and recommendations independently to the Board’s Audit Committee.
F. Risk Assessment
The Board conducts on a yearly basis an assessment of the risks facing the Group. This process is conducted with the active participation and input of the Management. Once identified, risks are assessed according to their likelihood, severity and mitigation. The Board deliberates on the adequacy of measures in place to mitigate and manage risks and assigns responsibility to designated managers for implementation of such measures. As part of this process, the ownership of and accountability for identified risks are approved by the Board. The implementation of such actions is audited by Internal Audit. These findings are communicated to the Board of Directors so that progress and identified risks can be monitored objectively and independently from Management. The risks identified and monitored by the Board fall broadly into three categories: first, environment risk which includes circumstances outside the Group's direct sphere of influence, such as competition and economic or political landscape, second, process risks which include risks linked to the operations of the business, the management of the Group and the integrity of its reputation in the market place, and thirdly, risks associated with information and decision-making.
4. OPERATIONS COUNCIL
The Operations Council (as defined in section 1.1 meets on a regular basis, in principle at least five times a year. Between meetings, it holds regular phone conferences and may make decisions on such calls or by electronic voting.
4.1. MEMBERS OF THE OPERATIONS COUNCIL
Members of the Operations Council bring to the Group years of experience and expertise in their respective fields. They come from a wide range of backgrounds that reflects the multiple aspects of the Group. The Group strives to promote talent internally and encourages women to assume senior leadership positions. The members of the Operations Council at 31 December 2016 were as follows:
FRANKIE NG (1966)
Swiss/Chinese
Chief Executive Officer
SVP Human Resources, ad interim
BA in Economics and Electronics Engineering
Joined SGS in 1994
Previous responsibilities
2011 – 2015: EVP, Industrial Services
2005 – 2011: EVP, Consumer Testing Services
2002 – 2004: Managing Director, US Testing
2000 – 2002: Director, Consumer Testing Services, China and Global Hardlines
1997 – 2000: Operations Manager, Consumer Testing Services, China

118
CARLA DE GEYSELEER (1968)
Belgian
Chief Financial Officer
EMBA, Executive Master in Business Administration IMD, 2005
Master in Economics and Finance, 1991
Joined SGS in 2014
Previous work experience
2012 – 2014: Chief Financial Officer, Vodafone Libertel, BV, The Netherlands
2010 – 2012: Director Financial Controlling, Vodafone GmbH, Germany
2007 – 2010: Chief Financial Officer DHL Express Benelux, The Netherlands
1995 – 2007: Various finance positions, DHL Express
1991 – 1995: Senior Auditor, Ernst and Young, Belgium
OLIVIER MERKT (1962)
Swiss
General Counsel and Chief Compliance Officer
Doctorate in Law, admitted to the bar in Switzerland
Joined SGS in 2001
Previous responsibilities
2006 – 2008: VP, Corporate Development
2001 – 2006: Senior Counsel
Other work experience
1993 – 2001: Senior Manager Legal, Ernst and Young, Geneva
TEYMUR ABASOV (1972)
Azerbaijani
COO, Eastern Europe and Middle East
Degree in Electrical Engineering
Joined SGS in 1994
Previous responsibilities
2006 – 2007: Managing Director, Kazakhstan and Caspian Sub-Region
2004 – 2006: Managing Director, Azerbaijan and Georgia
2003 – 2004: Managing Director, Georgia
2001 – 2003: Operations Manager, Oil Gas and Chemicals Services, Azerbaijan
JEAN-LUC DE BUMAN (1953)
Swiss
SVP, Corporate Communications, Investor Relations and Corporate Development
Legal studies
Joined SGS in 1998
Other work experience
1978 – 1998: Country Head Switzerland, Sales Fixed Income, UBS
HELMUT CHIK (1966)
Chinese
COO, China and Hong Kong
Master in Business Administration
Joined SGS in 1991
Previous responsibilities
2003: Managing Director, Hong Kong
2002: Global Business Manager, Softline, Consumer Testing Services
2000 – 2001: Director Greater China, SBU Softline, Consumer Testing Services
1999: Director, Hong Kong, Consumer Testing Services
OLIVIER COPPEY (1972)
Swiss
EVP, Agriculture, Food and Life
MSc Economics
Joined SGS in 1994
Previous responsibilities
2009 – 2013: Vice President Seed and Crop, Agricultural Services
2006 – 2008: Vice President North America, Agricultural Services, USA
1994 – 2006: Managerial positions, Agricultural Services, Switzerland/ India/Cameroon
PAULINE EARL (1961)
British
COO, Western Europe
BSc in Food Science
Joined SGS in 1995
Previous responsibilities
2007 – 2010: Managing Director, United Kingdom
2004 – 2007: SSC Business Manager, United Kingdom
ALEJANDRO GOMEZ DE LA TORRE (1959)
Peruvian
COO, South and Central America
Degree in Business Administration, Postgraduate Specialisation in International Commerce
Joined SGS in 1986
Previous responsibilities
1996 – 2001: National Chief Executive, Peru and Manager Central Sub-Region, Latin America (1998 – 2001)
6. GOVERNANCE

119
DERICK GOVENDER (1970)
South African
EVP, Minerals (since October 2015)
Diploma in Analytical Chemistry
Post graduate in Business Management
Joined SGS in 2002
Previous responsibilities
2014 – 2015: Minerals Manager, Chile
2010 – 2014: VP Minerals Africa
2007 – 2010: Regional Minerals Manager SGS Southern Africa
KIMMO FULLER (1967)
American
COO, North America
Bachelor of Science degree in Civil Engineering; Masters in Business Administration
Joined SGS in 2014
Previous responsibilities
2014 – 2015: Managing Director, USA
Other work experience
2013 – 2014: Regional Director, Rolls Royce Plc
2011 – 2013: Regional Director, Elliott Group
2007 – 2011: Business Unit Director, Wood Group
1999 – 2007: General Manager, General Electric
DIRK HELLEMANS (1958)
Belgian
COO, Northern, Central and Southern Europe
Degree in Chemical Engineering and Master in Business Administration
Joined SGS in 1988
Previous responsibilities
2004 – 2012: COO, Central and North West Europe
2002 – 2004: COO, North West Europe
1997 – 2002: Managing Director, Belgium
FRÉDÉRIC HERREN (1955)
Swiss
COO, Africa
Master in Economics
Initially joined SGS in 1986, rejoined in 1999
Previous responsibilities
2006 – 2014: EVP, Governments and Institutions Services
2003 – 2006: EVP, Automotive Services
1999 – 2003: Head of Global Marketing, Trade Assurance Services (now Governments and Institutions Services)
Other work experience
1995 – 1998: CEO, Unilabs International
ROGER KAMGAING (1966)
Swiss
EVP, Governments and Institutions
Master in Commercial Law and Tax
Master in Auditing and Consulting
Initially joined SGS in 1997, rejoined in 2014
Previous responsibilities
2000 – 2012: Governments and Institutions Services, Global Head Business Development
1997 – 2000: Governments and Institutions Services, Sales Manager
Other work experience
2012 – 2014: Kamgaing Associates (Consulting) and Time (African Business Incubator)
THOMAS KLUKAS (1965)
German
EVP, Transportation
PhD Engineering Science, Master Business Administration
Joined SGS in 2006
Previous responsibilities
2008 – 2010: VP Automotive Services
2006 – 2008: Automotive Services Regional Manager, North America
Other work experience
2000 – 2006: Senior Manager DEKRA SE (Germany and USA)
FRANÇOIS MARTI (1968)
Swiss
EVP, Industrial (since October 2015)
Degree in International Relations
Initially joined SGS in 2003, rejoined in 2011
Previous responsibilities
2012 – 2015: EVP Systems and Services Certification
2011 – 2015: SVP, Strategic Transformation
2003 – 2005: VP Continuous Improvement
Other work experience
2005 – 2011: CEO Fiat Services 1994 – 2003: Senior Manager PWC and IBM

120
JEFFREY MCDONALD (1964)
Australian
EVP, Systems and Services Certification (since October 2015)
Postgraduate Diploma in Education
Joined SGS in 1995
Previous responsibilities
2007 – 2015: COO, North America
2004 – 2007: EVP, Systems and Services Certification
2003: Global Project Manager, Systems and Services Certification
1995 – 2003: Systems and Services Certification, South Eastern Asia and Pacific, Regional Manager (Bangkok)
PETER POSSEMIERS (1962)
Australian and Belgian
EVP, Environmental, Health and Safety
BSc Chemistry and Microbiology
Joined SGS in 1983
Previous responsibilities
2007 – 2012: Global Sales, OGC
2005 – 2007: Managing Director, Korea
2003 – 2005: OGC Business Development Manager Asia Pacific, China
2001 – 2003: OGC Business Development Manager Asia Pacific, Australia
1998 – 2000: OGC Manager, Singapore
MALCOLM REID (1963)
British
COO South East Asia and Pacific
BSc Chemistry
Joined SGS in 1987
Previous responsibilities
2012 – 2015: EVP, Consumer Testing Services
2008 – 2011: EVP, Systems and Services Certification
2005 – 2007: Managing Director, Australia
2000 – 2005: Managing Director, Thailand
1997 – 2000: Managing Director, Philippines
ALIM SAIDOV (1964)
Azerbaijani and Canadian
EVP, Oil, Gas and Chemicals
PhD in Science
Joined SGS in 1993
Previous responsibilities
2007 – 2013: EVP, Oil, Gas and Chemicals Services and Environmental Services
2005 – 2007: COO, Eastern Europe and Middle East
2004: COO, North America and Managing Director, Canada
2001 – 2004: Managing Director, Kazakhstan and Manager Caspian Region
RICHARD SHENTU (1968)
Chinese
EVP, Consumer and Retail
Textile Engineer, Masters in Business Administration, PhD in Management Science
Joined SGS in 1990
Previous responsibilities
2010 – 2015: Managing Director, China
2005 – 2011: Vice President CTS, CTS Director and Executive Director China
2012 – 2015: Vice President Industrial Services
2002 – 2004: CTS Hardline SBU director China and Hong Kong
DENNIS YANG (1949)
Taiwanese
COO, East Asia
Master in Business Administration
Joined SGS in 1975
Previous responsibilities
2000 – 2002: Managing Director, Taiwan
1992 – 2000: Assistant General Manager, Taiwan
In 2016, Dominique Ben-Dhaou, SVP Human Resources resigned from her position and left the Group.
4.2. OTHER ACTIVITIES AND FUNCTIONS
The following list presents all material activities in governing and supervisory boards, management positions and consultancy functions, official tenures and political positions held by each member of the Operations Council outside the Group, both in Switzerland and abroad.
JEAN-LUC DE BUMAN
Association pour le Développement des Compétences Bancaires, Geneva (CH), Member of the Board since 1999
Hyposwiss Private Bank Genève SA, Geneva (CH), Member of the Board since 2006
Federal Accreditation Commission, Bern (CH), Member since 2012
ALEJANDRO GOMEZ DE LA TORRE
Swiss-Peruvian Chamber of Commerce, Lima (Peru), Director
DERICK GOVENDER
Member of IMPI (International Precious Metals Institute)
THOMAS KLUKAS
CITA, International Motor Vehicle Inspection Committee, Brussels (BE), Member of the Bureau Permanent since 2011
FRANÇOIS MARTI
Swiss Philanthropy Foundation, Member of the Board since 2013
6. GOVERNANCE

121
4.3. LIMITS ON EXTERNAL MANDATES
At the 2015 Annual General Meeting, the shareholders modified the Articles of Association of the Company in compliance with the Ordinance against Excessive Compensation at Listed Joint-Stock Companies (OaEC), for the purpose of introducing limits on the number of mandates permissible to members of the Operations Council.
The new rules limit the number of mandates that members of the Operations Council can accept, with the prior consent of the Board of Directors, to no more than four board memberships in entities outside the Group, out of which a maximum of one membership in board of companies whose shares are traded on a stock exchange. Mandates assumed at the request of a controlling entity do not count towards the maxima defined in the Articles of Association. In addition, the Articles of Association set limits to participations in board of associations and other non for profit organisations to no more than ten such memberships.
4.4. MANAGEMENT CONTRACTS
The Company is not party to any management contract delegating management tasks to companies or individuals outside the Group.
5. COMPENSATION, SHAREHOLDINGS AND LOANS
5.1. CONTENT AND METHOD OF DETERMINING THE COMPENSATION AND THE SHAREHOLDING PROGRAMMES
The Group’s overriding compensation policies are defined by the Board of Directors. The objectives of these policies are twofold: a) to attract and retain the best talent available in the industry and b) to motivate employees and managers to create and protect value for shareholders by generating long-term sustainable financial achievements.
In line with these principles, Board members are entitled to a fixed fee, which takes into account their level of responsibility. Members of the Operations Council receive a fixed remuneration and are entitled to a performance-related annual bonus and a Long-Term Incentive plan.
In compliance with the requirements of the Ordinance against Excessive Compensation at Listed Joint-Stock Companies (OaEC), the Annual General Meeting approves the compensation payable to the Board and to the Operations Council. The rules on the vote on pay applicable in the Group are explained below.
The ultimate responsibility for defining remuneration policies and deciding on all matters relating to remuneration rests with the Board of Directors, subject to decisions that require binding resolutions of the Annual General Meeting. The Board of Directors is assisted in its work by a Nomination and Remuneration Committee, which is elected by the Annual General Meeting.
5.1.1. Rules on Performance-Related Pay and Allocation of Equity-Linked Instruments
The Company's Articles of Association define the principles of the variable remuneration and the allocation of shares or equity-linked instruments to the members of the Operations Council (please refer to the Remuneration Report for a description of the Company’s rules in the matter).
5.1.2. Rules on Loans, Credit Facilities and Post-Employment Benefits
Loans granted to members of the governing bodies of the Company may not exceed one year of remuneration and must be granted at market conditions. As at 31 December 2016, two members of the Operations Council have received loans for a combined amount equivalent to CHF 28 365 (no loan, credit or outstanding advance was due to the Group from members or former members of its governing bodies the prior year).
5.1.3. Rules on Vote on Pay
The Annual General meeting approves the following matters related to the compensation of the Board and Operations Council:
• It approves the fixed fees payable to the Board of Directors until the next Annual General meeting;
• It approves in advance the fixed remuneration payable to the Operations Council during the next financial year;
• It approves the total aggregate amount payable to the Operations Council for the performance-related annual bonus related to the prior year;
• It approves the maximum amount payable under Long-Term Incentive
plans to be introduced by the Company.
Resolutions of such matters are binding on the Board of Directors. In addition, the Annual General Meeting is invited to cast a non-binding vote on the Remuneration Report that describes the Company’s remunerations policies.

122
6. SHAREHOLDERS’ PARTICIPATION RIGHTS
All registered shareholders receive a copy of the half-year and full-year results upon the publication of such results by the Company. They can request a copy of the Company’s Annual Report and are personally invited to attend the Annual General Meeting of Shareholders.
6.1. VOTING RIGHTS AND REPRESENTATION RESTRICTIONS
All registered shareholders can attend the General Meetings of Shareholders and exercise their right to vote. A shareholder may also elect to grant power of attorney to an independent proxy appointed by the Company or to any other registered shareholder. There are no voting restrictions, subject to the exclusion of nominee shareholders representing undisclosed principals, as detailed in section 2.6. Shareholders have the opportunity to give general or specific voting instructions to the independent proxy. The voting of resolutions by electronic votes is authorised by the Articles of Association, within the modalities defined by the Board of Directors.
6.2. STATUTORY QUORUMS
The General Meeting of Shareholders can validly deliberate regardless of the number of shares represented at the meeting. Resolutions are adopted by the absolute majority of votes cast. If a second ballot is necessary, a relative majority is sufficient, unless Swiss company law mandates a special majority.
6.3. CONVOCATION OF GENERAL MEETINGS OF SHAREHOLDERS
The rules regarding the convocation of General Meetings of Shareholders are in accordance with Swiss company law.
6.4. AGENDA
The Agenda of the General Meeting of Shareholders is issued by the Board of Directors. Shareholders representing shares with a minimum par value of
CHF 50 000 may request the inclusion of an item on the agenda of the General Meetings, provided that such a request reaches the Company at least 40 days prior to the General Meeting.
6.5. REGISTRATION IN THE SHARE REGISTER
The Company does not impose any deadline for registering shares prior to a General Meeting. However, a technical notice of two business days is required to process the registration.
7. CHANGE OF CONTROL AND DEFENCE MEASURES
No restriction on changes in control is included in the Company’s Articles of Association.
7.1. DUTY TO MAKE AN OFFER
In the absence of any specific rules in the Company’s Articles of Association, any investor or group of investors acquiring more than 33.3% of the shares and voting rights of the Company has the duty to make a public offer in compliance with the applicable Swiss takeover rules.
7.2. CLAUSES ON CHANGE OF CONTROL
There are no general plans or standard agreements offering specific protection to Board Members, Senior Management or employees of the Group in the event of a change of control, subject to the standard rules regarding termination of employment.
8. AUDITORS
8.1. DURATION OF THE MANDATE AND TERM OF OFFICE
Following a competitive process in 2000, Deloitte SA was appointed auditor of the Company and of the SGS Group by the Annual General Meeting of Shareholders
upon recommendation of the Board of Directors. The auditors of the Company are subject to re-election at the Annual General Meeting every year. The current lead auditor, James Baird, has acted in this capacity since 2012. He assumed this position after agreement by the Company's Audit Committee
8.2. AUDIT FEES
Total audit fees paid to Deloitte for the audit of the Company and the Group financial statements in 2016 amounted to CHF 5.8 million (2015: CHF 5.3 million).
8.3. ADDITIONAL FEES
An aggregate amount of CHF 1.0 million (2015: CHF 1.3 million) was paid to Deloitte for other professional services, unrelated to the statutory audit activity. This amount includes CHF 0.6 million (2015: CHF 0.7 million) for tax compliance services and CHF 0.4 million (2015: CHF 0.6 million) for non-statutory and other assurance services.
8.4. SUPERVISORY AND CONTROL INSTRUMENTS VIS-A-VIS THE AUDITORS
The Audit Committee is responsible for evaluating the external auditor on behalf of the Board of Directors, and conducts assessments of the audit services provided to the Group during its regular meetings. It meets with the auditor at least three times per year (four times in 2016), including private sessions without the presence of Management.
The duties of the Committee include consideration of the audit plan, regular assessment of the performance of the auditor and approval of audit fees on the basis of the amount of work required in order to perform the audit.
The Audit Committee reviews with the Group auditors the significant financial statement risk areas arising from the audit, including the key audit matters referred to in the statutory auditor’s report.
The auditor regularly presents his findings, both during the deliberations of the Audit Committee and in written reports, to the attention of the Board of Directors that summarise key findings. The Group strives to safeguard and support the independence of the auditor by avoiding
6. GOVERNANCE

123
conflicts of interests. In applying this policy, the attribution of other consultancy assignments is carefully reviewed to ensure that such assignments do not endanger the auditor’s independence.
9. INFORMATION POLICY
The policy of the Group is to provide individual and institutional investors, directly or through financial analysts, business journalists or investment consultants (financial community) and the employees with financial and business information in a consistent, broad, timely and transparent manner.
The Group website has a section fully dedicated to investor relations, www.sgs.com/ir, where all financial information and presentations are available. This includes an updated version of the Articles of Association, current information on share buyback programmes and minutes of shareholders’ meetings. SGS meets regularly with institutional investors, holds results presentations, road shows, presentations at broker-sponsored country or industry conferences as well as one-on-one meetings.
The Group publishes consolidated half-year unaudited and yearly audited results in print and online formats. The Annual Report is published in English and is available upon order from the Group's website. The current list of publication dates is available on the Group's website.
The Group acknowledges the directives on the independence of financial research issued by the Swiss Bankers Association, particularly articles 26 and 29-32. In addition, the Group complies with rules regarding information and reporting of the federal act on stock exchange and securities trading, and the ordinance on stock exchanges and securities trading.

SGS SERVICE
> Portable Emissions Measurement System (PEMS) Testing
CONSUMER BENEFIT
> Fairer and more accurate vehicle emissions information

THE ROAD TO REAL WORLD DATA
In August 2016, SGS introduced Portable Emissions Measurement System (PEMS) testing to its comprehensive portfolio of transportation testing services in the US.
PEMS testing is used to assess emissions for vehicles and other engine operated machines in real-world conditions. This is important because on-road vehicle emissions are often higher than what is shown in a laboratory setting, and fuel efficiency can be significantly lower. Being able to see real-world emissions data will allow the transportation industry to work towards measurable emissions reductions while also providing an avenue of accountability to manufacturers.
Attaching to a vehicle’s exhaust pipe, the PEMS system sends information in real-time to a monitoring device. This allows testers to focus on driving the vehicle naturally around a given terrain (e.g. driving at altitude, on a motorway, or even off-road), while the PEMS system automatically logs emissions data.
PEMS technology is lightweight and flexible in its use, meaning it can be taken anywhere it is needed and used on a variety of vehicles and equipment. This makes it an efficient and flexible solution for engine manufacturers that want to provide real-world data to their customers.

126
The SGS Remuneration Report provides an overview of the SGS remuneration model, its principles and programmes and the related governance framework. The report also includes details on the remuneration of the Board of Directors and of the Operations Council related to the 2016 business year.
The SGS Remuneration Report has been prepared in compliance with the Ordinance against Excessive Compensation in Stock Exchange listed Companies ("the Ordinance"), the Swiss Exchange (SIX) Directive on Information relating to Corporate Governance of 1 September 2014 and the principles of the Swiss Code of Best Practice for Corporate Governance of economiesuisse.
1. INTRODUCTION BY THE NOMINATION AND REMUNERATION COMMITTEE
2. COMPANY’S REMUNERATION POLICY AND GOVERNANCE
2.1. Remuneration Policy and Principles
2.2. Remuneration Governance
2.2.1. Nomination and Remuneration Committee
2.2.2. Shareholders' Engagement
2.2.3. Method of Determination of Compensation – Benchmarking
3. REMUNERATION MODEL
3.1. Structure of Remuneration of the Board of Directors
3.2. Structure of Remuneration of the Operations Council
3.2.1. Base Salary
3.2.2. Short-Term Incentive
3.2.3. Long-Term Incentive
3.2.4. Shareholding Ownership Guideline
3.2.5. Benefits
3.2.6. Employment Contracts
3.2.7. Timeline of Remuneration
4. REMUNERATION AWARDED TO THE BOARD OF DIRECTORS
5. REMUNERATION AWARDED TO THE CEO, SENIOR MANAGEMENT AND OTHER MEMBERS OF THE OPERATIONS COUNCIL
5.1. Performance in 2016
5.2. Cash Compensation
5.3. Share-Based Compensation
5.3.1. Restricted Shares
5.3.2. Long-Term Incentive Plan
5.3.3. Discontinued Share Option Plans
5.4. Total Compensation to the Operations Council, Senior Management and Chief Executive Officer
5.5. Other Compensation
5.5.1. Severance Payments
5.5.2. Other Compensation to Members or Former Members of Governing Bodies
5.5.3. Loans to Members or Former Members of Governing Bodies
7. REMUNERATION REPORT

127
1. INTRODUCTION BY THE NOMINATION AND REMUNERATION COMMITTEE
The Nomination and Remuneration Committee is pleased to present its 2016 Remuneration Report.
During the year, the Committee focused its attention on the monitoring and assessment of the implementation of the remuneration system introduced in 2015, and its alignment to the business strategy of profitable growth and to the expectations of the shareholders.
Following the provisions of the Ordinance issued by the Swiss Federal Council, we have implemented the consultative vote on the Remuneration Report and the binding vote on compensation amounts at the Annual General Meeting as of 2015.
The Committee has received significant support in its activities and direction through positive votes at the Annual General Meeting 2016, and will continue with the same "say-on-pay" vote structure at the forthcoming Annual General Meeting 2017:
• Consultative vote on the Remuneration Report;
• Binding vote on the prospective remuneration amount of the Board of Directors until the next Annual General Meeting;
• Binding vote on the retrospective variable remuneration amount of the Operations Council members of the previous business year;
• Binding vote on the prospective fixed remuneration amount of the Operations Council members for 2018.
On the following pages, you will find detailed information about our remuneration model, its principles and programmes and the remuneration awarded to the Board of Directors and to the Operations Council related to the business year 2016.
We hope that you find this report informative and are confident that our approach to executive pay is fully aligned with the strategy, wider competitive market benchmarks, the performance of the Company and with the interests of our shareholders.
Shelby du Pasquier Chairman
7. REMUNERATION REPORT

128
7. REMUNERATION REPORT
2. COMPANY’S REMUNERATION POLICY AND GOVERNANCE
2.1. REMUNERATION POLICY AND PRINCIPLES
Remuneration of the Board of Directors
In order to guarantee their independence in exercising their supervisory duties
towards the Executive Management, the members of the Board of Directors receive a fixed remuneration only.
Remuneration of the Executive Management
The Company's remuneration policy applicable to the Executive Management (Operations Council) is defined by the Board of Directors with two main objectives: to attract and retain the best talent available in the industry, and to motivate them to create and protect
value for our shareholders by driving long-term sustainable financial success. The remuneration policy is built on core principles that are aligned with the Company’s business strategy of profitable growth and the aim to drive and support the Company’s core values of passion, integrity, entrepreneurialism and innovative spirit.
Our remuneration system operates according to the four principles described below.
•DI
FFER
ENTI
ATIO
N IS B
ASED ON IN
DIVIDUAL CONTRIBUTIONS
LIN
KED
TO B
USIN
ESS A
ND INDIVIDUAL PERFORMANCE
• PART OF REMUNERATION IS DELIVERED IN EQUITY COMPEN
SATION
• REMUNERATION LEVELS ARE IN LIN
E WITH COM
PETI
TIVE
MAR
KET
PRAC
TICE
SUBJECT TO A MULTI-YEAR VESTING PERIOD
RESPONSIBILITY AND THE SKILL-SET REQUIRED TO PERFORM THE ROLE
• REMUN
ERATION PROGRAMM
ES LINK REMUNERATION TO THE LEVEL OF
PAY
FOR
PERFORMANCELONG-TERM VALUE CREATION
SHAREHOLDERS’ INTERESTS
ALIGNMENT TO •A
SUBS
TANT
IAL P
ORTION OF R
EMUNERATION IS DIRECTLY
INTERNAL EQUITYMARKET COMPETI
TIVE
NES
S

129
2.2. REMUNERATION GOVERNANCE
2.2.1. Nomination and Remuneration Committee
The Board of Directors is responsible for determining the remuneration of the Chairman and the Directors of the Board. It also decides on the remuneration and terms of employment of the Chief Executive Officer. In addition, the Board of Directors defines general executive remuneration policies, including the implementation and terms and conditions of Long-Term Incentive plans, as well as the financial targets relevant to any incentive plan.
The Board of Directors is assisted in its work by a Nomination and Remuneration Committee (“the Committee”), which consists of independent non-executive Directors. The Committee acts in part in an advisory capacity to the Board of Directors, and in part as a decision-making body on matters that the Board of Directors has delegated to the Committee. The Committee reviews regularly, at least once a year, the compensation of each member of the Operations Council (including the Chief Executive Officer), and decides on all matters relating to the remuneration of these executives.
The following charts summarise the authorisation levels for the main decisions relating to the compensation of the Board of Directors and the Operations Council members. When reviewing and deciding on executive remuneration policies, the Committee and the Board of Directors have access to Group Human Resources staff and may use third-party consultants specialised in compensation matters. In 2016, neither the Committee nor the Board of Directors had recourse to such external advisors.
Authorisation levels:
SUBJECT MATTER CEO
NOMINATION AND REMUNERATION COMMITTEE
BOARD OF DIRECTORS AGM
Aggregate remuneration amount of the Board of Directors
Recommendation Binding vote
Individual remuneration of the members of the Board of Directors including the Chairman of the Board of Directors
Recommendation Approval
Aggregate fixed remuneration amount of the Operations Council
Recommendation Binding vote
Aggregate variable remuneration amount of the Operations Council
Recommendation Binding vote
Individual remuneration of the CEO Recommendation Approval
Individual remuneration of the Operations Council members
Recommendation Approval
Establishment of Long-Term Incentive plans
Recommendation Approval
Aggregate value of the grants awarded under the Long-Term Incentive plan for Operations Council members
Recommendation Binding vote
Setting of annual financial targets for variable remuneration of Operations Council members
Recommendation Approval
Remuneration report Recommendation Consultative vote
The following Directors served on the Committee in 2016:
• Shelby du Pasquier (Chairman)
• Ian Gallienne
• August von Finck
In 2016, the Committee met in one meeting, attended by all members and handled several matters pertaining to nominations and remunerations outside scheduled meetings. The Chairman
of the Nomination and Remuneration Committee reports to the Board of Directors after each meeting on the activities of the Committee. The minutes of the Committee meetings are available to the members of the Board of Directors. As a general rule, the Chairman of the Board attends the meetings of the Committee, except when matters pertaining to his own compensation are being discussed. Selected members of the Operations
Council, the CEO and the Senior VP for HR may be asked to attend the meetings in an advisory capacity. They do not attend the meeting when their own compensation and/or performance are being discussed.
2.2.2. Shareholders’ Engagement
In recent years, based on the feedback received from our shareholders and their representatives, we have made

130
7. REMUNERATION REPORT
The binding votes on the aggregate compensation amounts combined with a consultative vote on the remuneration report reflect our true commitment to provide our shareholders with a far-reaching “say-on-pay”.
As required by the Ordinance, the Articles of Association of SGS have been revised and approved by the shareholders at the Annual General Meeting in 2015.
The Articles of Association include provisions on principles of remuneration for the Board of Directors (Art. 28) and for the members of the Operations Council. These include principles on fixed remuneration, variable remuneration, long-term incentives
and allocation of equity instruments (Art. 29); on additional amount for payments to members of the Operations Council appointed after the vote on remuneration at the Annual General Meeting (Art. 31); on loans, credit facilities and post-employment benefits for members of the Board of Directors and of the Operations Council (Art. 32); and on the votes on pay at the Annual General Meeting (Art. 31).
Details are available on the SGS’ website: www.sgs.com/en/our-company/investor-relations/corporate-governance.
2.2.3. Method of Determination of Compensation – Benchmarking
As a global business in a broad range of sectors, SGS’ business success is driven by the commitment and engagement of its employees. Our remuneration policy must take into account both global and local practices. We therefore compare our practices with those of other similar global organisations. The Group performs periodic benchmarks against companies that satisfy the following criteria:
• Competitors in the Testing, Inspection and Certification industry, such as Bureau Veritas, Intertek, DNV-GL and TÜVs;
• All SMI-listed companies;
SHAREHOLDER VOTE AT THE 2017 AGM 2016 2017 2018
Consultative vote on 2016 Remuneration report
Remuneration Policy and Principles
Binding vote on remuneration of the Board of Directors
Binding vote on fixed remuneration of the Operations Council
Fixed remuneration
Binding vote on variable remuneration of the Operations Council
Variable remuneration
AGM 2017 AGM 2018
Remuneration
significant efforts to improve the disclosure of remuneration in terms of transparency and level of detail provided about the remuneration principles and programmes. The positive outcome of the consultative vote on the 2014 and 2015 Remuneration Reports indicates that shareholders welcome the progress made. We will continue to submit the Remuneration Report to a consultative shareholders’ vote at the Annual General Meeting, so that shareholders have an
opportunity to express their opinion about our remuneration model.
In addition, as required by the Ordinance, the aggregate amounts of remuneration to be paid to members of the Board of Directors and to the Operations Council are subject to the approval of the shareholders in form of a binding vote on remuneration. The procedure on the vote is defined in the Articles of Association that were approved at the 2015 Annual
General Meeting and foresees separate votes on (i) the remuneration of the Board of Directors for the period until the next Annual General Meeting (ii) the fixed remuneration of the Operations Council for the next calendar year (iii) the variable compensation awarded to the Operations Council in respect to the previous calendar year and (iv) any award to be granted to the Operations Council under the Long-Term Incentive plan.

131
• Internationally active companies within and outside Switzerland that operate in the business-to-business services sector, such as Adecco and Sodexo;
• Internationally active companies within and outside Switzerland that operate in one or more of the industry sectors in which SGS is active, including the energy, mining, industrial, chemical, medical goods, pharmaceutical, durable and non-durable goods, and food sectors, such as Alstom, Glencore-Xstrata, Siemens, DuPont, Baxter, Actelion, Schindler and Amcor.
The elements of executive remuneration benchmarked include annual base salary, allowances, short-term and long-term incentive compensation and benefits. To ensure proper benchmarking, we use a proprietary job evaluation methodology. Since more than one-third of our Operations Council members are based outside Switzerland, we utilise information published by reputable data providers, including Mercer and Willis Towers Watson, which are able to supply information on both a local and global basis.
The compensation elements of the Governing Bodies of the Company are benchmarked normally every three years, with the support of one of the services providers quoted above. The most recent analysis has been performed in 2015, with the support of Mercer.
As a reference point, SGS targets the median compensation level of the peer group.
3. REMUNERATION MODEL
3.1. STRUCTURE OF REMUNERATION OF THE BOARD OF DIRECTORS
In order to guarantee their independence in exercising their supervisory duties towards the Executive Management, the members of the Board of Directors receive a fixed remuneration only, paid in cash. They are entitled to a fixed annual board membership fee and additional annual fees for the participation in board committees. They do not receive additional compensation for attending meetings and do not receive any variable remuneration, options or shares.
The Chairman of the Board receives a fixed annual fee and additional fixed fees for chairing the Audit Committee and the Professional Conduct Committee.
Directors of the Board receive an annual fixed fee of CHF 150 000 whilst the Chairman of the Board receives CHF 300 000. In addition, members of a board committee receive CHF 30 000 for each committee. The remuneration is paid in cash in two instalments, in June and in December for the calendar year. Social charges are applied to the above amounts.
Members of the Board of Directors do not hold service contracts and are not entitled to any termination or severance payments. They do not participate in the Company’s benefit schemes and the Company does not make any pension contributions on their behalf.
3.2. STRUCTURE OF REMUNERATION OF THE OPERATIONS COUNCIL
The remuneration earned by the Chief Executive Officer and by members of the Operations Council comprises: (i) a fixed base salary, (ii) an annual Short-Term Incentive, settled partly in cash and partly in restricted shares, (iii) a Long-Term Incentive, and (iv) other benefits such as retirement, insurances and perquisites.
The Group’s long-term strategic plan drives all the activities in the business and is reflected in the remuneration strategy that will assist the Group in achieving its financial and other business
goals. Each year, an annual business plan is derived from the long-term strategic plan and sets the business objectives to be achieved during the year. The annual Short-Term Incentive is used to reward the annual achievements against the business plan, while the Long-Term Incentive is used to drive sustained performance aligned with the Group’s long-term strategic plan.
The Company considers that the payment of variable remuneration in the form of shares subject to restriction and/or vesting period is a key mechanism to align the Management’s incentives to the long-term interests of shareholders.
REMUNERATION OF THE BOARD OF DIRECTORS
300 000 30 000
FIXED ANNUAL FEECOMMITTEE FEE
(PER COMMITTEE)
150 000 30 000+
Chairman
Board members

132
7. REMUNERATION REPORT
The table below summarises the various components of the compensation of Operations Council members, including the Chief Executive Officer.
3.2.1. Base Salary
The base salaries of the Chief Executive Officer and each Operations Council member are reviewed annually on the basis of market data for similar positions in those companies and geographies against which the Group benchmarks itself. In addition to individual performance and contribution, business performance and results, the deciding body takes into account the scope and complexity of the areas of responsibility of the position, skill sets and experience required to perform the role, and relevant market practice in the industry.
3.2.2. Short-Term Incentive
Members of the Operations Council, including the Chief Executive Officer, are entitled to a performance-related annual incentive (the “Short-Term Incentive”). The Short-Term Incentive is designed to reward the executives for the annual financial performance of the Group
and its businesses, as well as for the demonstration of leadership behaviours in line with the SGS competency model.
The target incentive is expressed as a percentage of the annual base salary and varies depending on the role. For the CEO, the target incentive amounts to 100% of annual base salary, while the target incentive for the other members of the Operations Council varies between 55% and 65% of annual base salary.
Financial Performance
The key performance indicators used to measure the annual financial performance of the Group and its businesses include a measurement of growth (top-line contribution), profitability (bottom-line contribution) and efficient use of capital, and thus reflect the financial performance of the Company in a balanced manner. Those financial metrics are cascaded
consistently throughout the organisation in order to ensure collective alignment. The CEO and the heads of corporate functions (SVPs) are measured on the financial performance of the Group, while the other members of the Operations Council are measured 50% on the financial performance of the Group and 50% on the financial performance of their own business line (EVPs) or region (COOs).
REMUNERATION ELEMENT
REMUNERATION VEHICLE DRIVERS
PERFORMANCE MEASURES PURPOSE PLAN PERIOD
Base Salary Monthly cash salary
Position and experience, market practice (benchmarking)
n/a Attract and retain key executives
Continuous
Short-Term Incentive
50% cash
50% restricted shares
Annual financial performance, individual performance against leadership behavioural model
Group revenue, Group NPAT, Group ROIC1, regional and business-line profit, regional NWC2, leadership multiplier
Pay for performance
1-year performance period
3-year deferral period
Long-Term Incentive
Performance Share Units (PSU)
Long-term financial performance
Relative organic revenue growth, relative NPAT improvement, relative TSR3, absolute free cash flow
Reward for long-term performance, align compensation with the interests of the shareholders
3-year performance period
Benefits Retirement benefits and insurances, perquisites
Market practice n/a Protect executive against risks, attract and retain
Continuous
1. NPAT: Net Profit After Tax, ROIC: Return On Invested Capital. 2. NWC: Net Working Capital. 3. TSR: Total Shareholder Return.

133
GROUP'S FINANCIAL PERFORMANCE ROLE-SPECIFIC FINANCIAL PERFORMANCE
PROFITABILITY (BOTTOM-LINE)
GROWTH (TOP-LINE)
EFFICIENT USE OF CAPITAL
PROFITABILITY (BOTTOM-LINE)
EFFICIENT USE OF CAPITAL
CEO Group NPAT 25%
Group Revenue 25%
Group ROIC 50%
- -
SVPs Group NPAT 65%
Group Revenue 25%
Group ROIC 10%
- -
EVPs Group NPAT 25%
Group Revenue 25%
- Business-line profit 40%
Group ROIC 10%
COOs Group NPAT 25%
Group Revenue 25%
- Regional profit 40%
Regional NWC 10%
At the beginning of the performance year, the objective for each financial metric is set by the Board of Directors on the basis of a recommendation by the CEO and in line with the annual budget. For each financial metric, the payout curve is predetermined as follows: a target (expected level of performance), a threshold (minimum level of performance to trigger a payout) and a cap (maximum level of performance above which the payout factor is capped at 200%). The payout factor between the threshold, the target and the maximum is calculated by linear interpolation.
50%
150% CAP
TARGET
THRESHOLD
200%
100%
0%
80% 100% 133.3%
PAYO
UT
%
ACHIEVEMENT %
The payout curve is structured on a leverage of one to three for over-achievement and one to five for under-achievement:
• Every percentage achievement above 100% of the objective (budget) increases the payout factor by 3%. The payout factor is capped at 200%. Therefore a performance above 133.3% achievement level (cap) provides a 200% payout factor.
• Every percentage achievement below 100% of the objective (budget) reduces the payout factor by 5%. Therefore a performance below 80% achievement level (threshold) provides a 0% payout factor.
At the end of the performance period, the results for each objective are assessed against the pre-defined targets and the payout curve to determine a payout factor. The weighted average of the payout factors of each objective corresponds to the overall financial performance payout factor. Below you will find an example of calculation for an Executive Vice President.
100% x 0.25
GROUP REVENUE
WEIGHT 25%
80% x 0.25
GROUP NPAT
WEIGHT 25%
150% x 0.40
BUSINESS PROFIT
WEIGHT 40%
150% x 0.10
GROUP ROIC
WEIGHT 10%
120%
FINANCIAL PERFORMANCE
PAYOUT
+ + + =

134
7. REMUNERATION REPORT
Leadership Multiplier
To determine the final incentive amount to be paid, the financial performance payout factor is multiplied by a leadership multiplier. This combination of financial objectives and leadership multiplier has been chosen in order to balance between rewarding the financial performance of the Group and its businesses, and rewarding wider leadership behaviours of the executives.
The leadership multiplier is determined for each executive on the basis of an assessment of their behaviours against sixteen pre-defined dimensions of the competency model of SGS in the areas of change management and people management. The assessment of the members of the Operations Council is conducted at year end by the CEO. The assessment leads to an overall leadership performance rating that is directly linked to the leadership multiplier as follows:
• “Needs improvement” rating corresponds to a leadership multiplier of 70%
• “Meets expectations” rating corresponds to a leadership multiplier of 100%
• “Exceeds expectations” rating corresponds to a leadership multiplier of 125%
Below is an example of the calculation of a final incentive actual payout.
100 000 120% 125% 150 000
TARGET INCENTIVEFINANCIAL
PERFORMANCE PAYOUT FACTOR
LEADERSHIP MULTIPLIER ACTUAL PAYOUT
X X =
Short-Term Incentive Calculation
The calculations and the corresponding Short-Term Incentive amounts for the CEO and the other members of the Operations Council are confirmed by the Nomination and Remuneration Committee, and approved by the Board of Directors. Their aggregate amount is subject to a binding vote at the Annual General Meeting.
Specific Short-Term Incentive Rules for the CEO
The Board of Directors decided to adapt the rules of the Short-Term Incentive plan to the specific position of CEO, as follows:
• The CEO performance assessment is purely based on the financial performance of the Company and the leadership multiplier does not apply to the CEO;
• Because of the absence of leadership multiplier, the payout curve for the CEO is adjusted: for the threshold level of performance, the payout starts at 25% (instead of 0%); there is no accelerator for performance above target; and a cap at 250% payout apply.
TARGET
THRESHOLD
200%
100%
0%
80% 100% 300%
PAYO
UT
%
ACHIEVEMENT %
25%
50%
150%
250%
200% 250%
CAP
150%
• Strong governance practices and the retrospective binding vote of the AGM on the aggregate variable compensation of the Operations Council (including CEO), combined with the practice to set challenging targets, make sure that the incentive payout level of the CEO falls in an acceptable range and is strongly aligned to the annual financial performance of the Group. The table below summarises the CEO’s historical annual incentive payout against target for the past five years.

135
2016
CEO ANNUAL INCENTIVE PAYOUT
78.0%
2015 107.1%
2014 123.6%
2013 128.5%
2012 20.5%
Target 100%
Settlement of the Short-Term Incentive
Once the Short-Term Incentive amount is determined, it is settled 50% in cash and 50% in restricted shares, in order to strengthen the link between the compensation of the executives and the future company share price performance.
The cash component and the shares are paid out after the shareholders’ approval at the Annual General Meeting of the following year. The shares are allocated at the value defined as the average closing share price during the 20-day period following the payment of the dividends after the Annual
General Meeting. They are restricted for a period of three years during which they may not be sold, transferred or pledged. In case of change of control or liquidation or termination of employment following retirement, death or disability, the restriction period of the shares lapses. The shares remain blocked in all other instances.
Clawback provisions
A clawback policy applies to any variable remuneration awarded to the members of the Operations Council. Under this policy, the Company may reclaim the
value of any variable incentives paid, in cash or in shares, in the following cases: i) any fraud, negligence or intentional misconduct was a significant contributing factor to the Company having to restate all or a portion of its financial statements; ii) a serious violation of the SGS internal regulations and/or Code of Integrity; iii) any violation of law within the scope of employment at the Company.
The table below summarises the Annual Incentive opportunity for the CEO and for the members of the Operations Council.
SHORT-TERM INCENTIVE CEOOTHER OPERATIONS COUNCIL MEMBERS
Incentive frequency Annual Annual
Payout vehicle50% cash
50% restricted shares
50% cash
50% restricted shares
Minimum incentive opportunityas % of base salary
as % of target incentive opportunity
0%
0%
0%
0%
Target incentive opportunity as % of base salary 100% 55% – 65%
Maximum incentive opportunityas % of target incentive opportunity
as % of base salary
250%
250%
250%
137.5% – 162.5%
3.2.3. Long-Term Incentive
In 2015, the Board of Directors implemented a Long-Term Incentive plan designed to motivate the Leadership team to realise the long-term objectives of the Group. The plan consists of Performance Share Units (PSUs) granted in Q4 2015 to a selected number of senior executives of the Group, including the members of the Operations Council. The PSUs vest after a performance period of three years (2015-2017) conditionally upon the achievement of pre-defined
performance objectives and the executive being employed by the Group at the vesting date (31 December 2017).
In order to balance the Short-Term Incentive plan, which is based on absolute financial performance and on leadership behaviours, relative performance measures have been introduced in the Long-Term Incentive plan, which includes both relative performance compared to a peer group of companies, and absolute performance against budget:
• Relative total shareholder return (TSR, value delivered to shareholders), 40% weight
• Relative organic revenue growth (top-line performance), 20% weight
• Relative NPAT improvement (bottom-line performance), 20% weight
• Free cash flow (absolute measure against SGS annual budget), 20% weight

136
7. REMUNERATION REPORT
The relative performance on revenue growth, NPAT and TSR are measured by an independent consulting company, Obermatt. Obermatt compares and ranks SGS against the performance of a selected peer group of companies that have been approved by the Board of Directors because they have a comparable range of services,
technology, customers, suppliers or investors, and thus are exposed to similar market cycles. The intention of indexing performance against a peer group of companies is to reward the relative performance of the company, where market factors that are outside the control of the executives are neutralised. For each relative objective,
the target is to reach at least the median performance of the peer group, which corresponds to 100% vesting level. There is no vesting for a performance below the median of the peer group and the vesting level is capped at 150% for performance at the upper quartile of the peer group. Any vesting level in between is interpolated linearly.
PEER GROUP
Adecco ALS Applus+ Bureau Veritas Eurofins
Exova Intertek ISS Mistras Rentokil
SAI Global Securitas Sodexo Team
For the free cash flow objective, the vesting level is predetermined as follows: for every percentage point of achievement below the target, the vesting level is reduced by 5%; for every percentage point of achievement above target, the vesting level is increased by 3%, to a maximum of 150%.
50%
150%
100%
0%
Q1 MEDIAN Q3
VESTING LEVEL RELATIVE OBJECTIVES
50%
150%
100%
0%
80% 100% 116.7%
VESTING LEVEL FREE CASH FLOW
The overall vesting level of the PSUs granted will be calculated as a weighted average of each of the respective vesting levels for relative TSR (40%), relative NPAT improvement (20%), relative organic revenue growth (20%) and free cash flow against budget (20%) and ranges between 0% and 150%.
Number of shares allocated at vesting
=Number of PSUs originally granted
to the participantX Overall vesting level (0-150%)
In case of termination of employment, all unvested PSUs are immediately forfeited without value and without any compensation, except in the following cases:
• In case of termination of employment as a result of disability or retirement, unvested PSUs vest on a pro rata basis, based on the number of full months of the performance period that have expired until the termination date. The shares are allocated after the regular vesting date and the vesting level is determined based on the performance during the entire regular performance period. There is no early allocation of the shares.
• Upon termination of employment as a result of death, unvested PSUs will vest immediately on a pro rata basis, based on the number of full months of the performance period that have expired until the termination date. The vesting level is based on an estimation of performance by the Board of Directors.
• In the event of a corporate transaction or liquidation, unvested PSUs vest immediately. The vesting level is based on an estimation of performance by the Board of Directors.
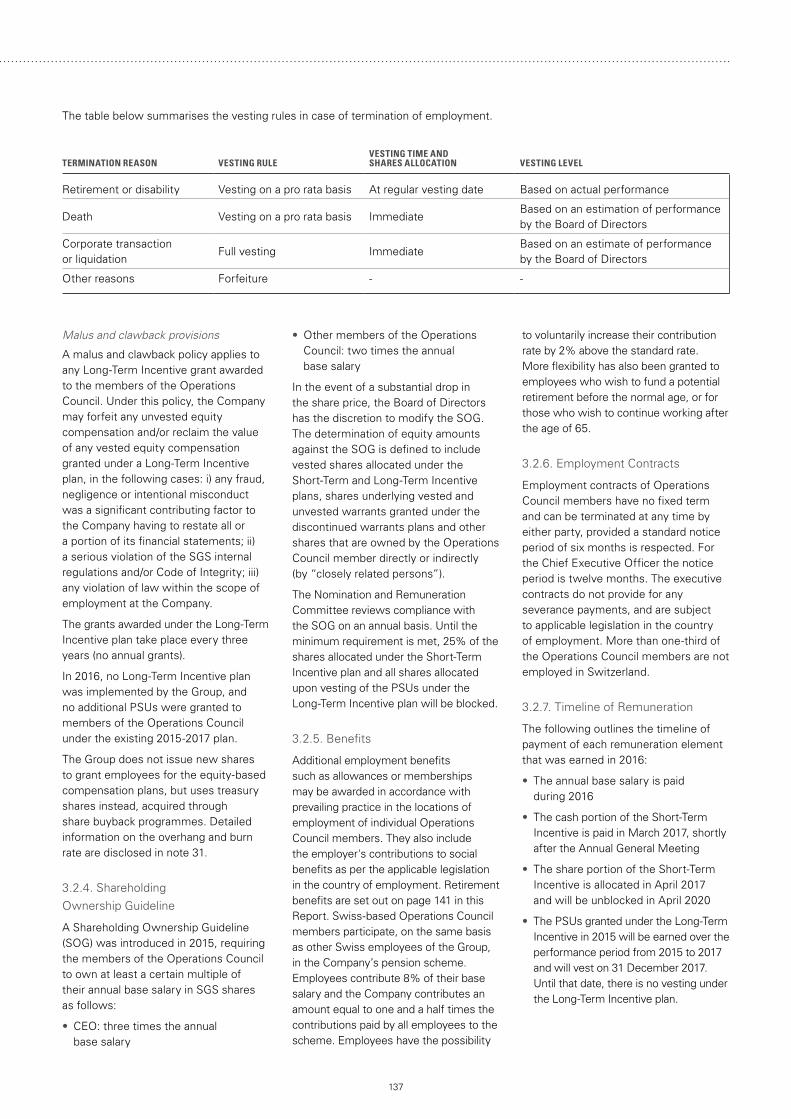
137
The table below summarises the vesting rules in case of termination of employment.
TERMINATION REASON VESTING RULEVESTING TIME AND SHARES ALLOCATION VESTING LEVEL
Retirement or disability Vesting on a pro rata basis At regular vesting date Based on actual performance
Death Vesting on a pro rata basis ImmediateBased on an estimation of performance by the Board of Directors
Corporate transaction or liquidation
Full vesting ImmediateBased on an estimate of performance by the Board of Directors
Other reasons Forfeiture - -
Malus and clawback provisions
A malus and clawback policy applies to any Long-Term Incentive grant awarded to the members of the Operations Council. Under this policy, the Company may forfeit any unvested equity compensation and/or reclaim the value of any vested equity compensation granted under a Long-Term Incentive plan, in the following cases: i) any fraud, negligence or intentional misconduct was a significant contributing factor to the Company having to restate all or a portion of its financial statements; ii) a serious violation of the SGS internal regulations and/or Code of Integrity; iii) any violation of law within the scope of employment at the Company.
The grants awarded under the Long-Term Incentive plan take place every three years (no annual grants).
In 2016, no Long-Term Incentive plan was implemented by the Group, and no additional PSUs were granted to members of the Operations Council under the existing 2015-2017 plan.
The Group does not issue new shares to grant employees for the equity-based compensation plans, but uses treasury shares instead, acquired through share buyback programmes. Detailed information on the overhang and burn rate are disclosed in note 31.
3.2.4. Shareholding Ownership Guideline
A Shareholding Ownership Guideline (SOG) was introduced in 2015, requiring the members of the Operations Council to own at least a certain multiple of their annual base salary in SGS shares as follows:
• CEO: three times the annual base salary
• Other members of the Operations Council: two times the annual base salary
In the event of a substantial drop in the share price, the Board of Directors has the discretion to modify the SOG. The determination of equity amounts against the SOG is defined to include vested shares allocated under the Short-Term and Long-Term Incentive plans, shares underlying vested and unvested warrants granted under the discontinued warrants plans and other shares that are owned by the Operations Council member directly or indirectly (by “closely related persons”).
The Nomination and Remuneration Committee reviews compliance with the SOG on an annual basis. Until the minimum requirement is met, 25% of the shares allocated under the Short-Term Incentive plan and all shares allocated upon vesting of the PSUs under the Long-Term Incentive plan will be blocked.
3.2.5. Benefits
Additional employment benefits such as allowances or memberships may be awarded in accordance with prevailing practice in the locations of employment of individual Operations Council members. They also include the employer's contributions to social benefits as per the applicable legislation in the country of employment. Retirement benefits are set out on page 141 in this Report. Swiss-based Operations Council members participate, on the same basis as other Swiss employees of the Group, in the Company’s pension scheme. Employees contribute 8% of their base salary and the Company contributes an amount equal to one and a half times the contributions paid by all employees to the scheme. Employees have the possibility
to voluntarily increase their contribution rate by 2% above the standard rate. More flexibility has also been granted to employees who wish to fund a potential retirement before the normal age, or for those who wish to continue working after the age of 65.
3.2.6. Employment Contracts
Employment contracts of Operations Council members have no fixed term and can be terminated at any time by either party, provided a standard notice period of six months is respected. For the Chief Executive Officer the notice period is twelve months. The executive contracts do not provide for any severance payments, and are subject to applicable legislation in the country of employment. More than one-third of the Operations Council members are not employed in Switzerland.
3.2.7. Timeline of Remuneration
The following outlines the timeline of payment of each remuneration element that was earned in 2016:
• The annual base salary is paid during 2016
• The cash portion of the Short-Term Incentive is paid in March 2017, shortly after the Annual General Meeting
• The share portion of the Short-Term Incentive is allocated in April 2017 and will be unblocked in April 2020
• The PSUs granted under the Long-Term Incentive in 2015 will be earned over the performance period from 2015 to 2017 and will vest on 31 December 2017. Until that date, there is no vesting under the Long-Term Incentive plan.

138
7. REMUNERATION REPORT
PERFORMANCE OBJECTIVES
Vest
ing
31.1
2.20
17
Sha
res
allo
catio
n
TIMELINE (PERFORMANCE PERIOD, TIME OF PAYMENT)
LONG-TERM INCENTIVE 2015
GRANT
SHORT-TERM INCENTIVE
ANNUAL BASE SALARY AND
BENEFITS
SHAREHOLDING OWNERSHIP GUIDELINE
2015 2016 2017 2018 2020
Un
- bl
ocki
ng
50%
in
rest
ricte
d sh
ares
50%
in
cash
Fixed remuneration
Group revenue (25%)
Group NPAT (25%)
Role specific P&L (50%)
Multiplied by leadership multiplier
Relative organic revenue growth (20%)
Relative NPAT improvement (20%)
Relative TSR (40%)
Absolute free cash flow (20%)
2019
4. REMUNERATION AWARDED TO THE BOARD OF DIRECTORS
In 2016, the annual board membership fee was CHF 150 000 for all Board of Directors members, unchanged from the prior year. Members of the Board of Directors serving on a committee were entitled to an additional fee of CHF 30 000 per committee, unchanged from last year. The annual fee payable to the Chairman of the Board was CHF 300 000, unchanged from the prior year.
The remuneration is disclosed on a fiscal year basis and the actual amounts paid correspond to pre-approved amounts at the last Annual General Meeting.
The following chart details the fees and other cash benefits granted to each of the Directors for their tenure in 2016:
(CHF thousand)BOARD
FEECOMMITTEE
FEEOTHER
BENEFITSTOTAL CASH
COMPENSATIONTOTAL
COMPENSATION
S. Marchionne 300 60 56 416 416
P. Desmarais 150 - 13 163 163
A. von Finck 150 30 8 188 188
A.F. von Finck 150 30 16 196 196
I. Gallienne 150 30 16 196 196
C. Grupp 150 30 9 189 189
P. Kalantzis 150 30 8 188 188
G. Lamarche 150 30 16 196 196
S.R. du Pasquier 150 60 18 228 228
C. Kirk 150 - 13 163 163
TOTAL 1 650 300 173 2 123 2 123

139
The following chart details the fees and other cash benefits and share options granted to each of the Directors for their tenure in 2015:
(CHF thousand)BOARD
FEECOMMITTEE
FEEOTHER
BENEFITSTOTAL CASH
COMPENSATION TOTAL
COMPENSATION
S. Marchionne 300 60 56 416 416
P. Desmarais 150 - 13 163 163
A. von Finck 150 30 14 194 194
A.F. von Finck 150 30 16 196 196
I. Gallienne 150 30 16 196 196
C. Grupp 150 23 13 186 186
P. Kalantzis 150 30 14 194 194
G. Lamarche 150 30 16 196 196
S.R. du Pasquier 150 60 18 228 228
C. Kirk 113 - 9 122 122
TOTAL 1 613 293 185 2 091 2 091
The overall compensation paid to the Board of Directors in 2016 increased compared to 2015. This was due to one member, Chris Kirk, not serving a full year in 2015, as he was appointed on 13 March 2015.
The following table shows the details of the options granted to the Chairman of the Board under the discontinued Annual Share Option Plans and Long-Term Incentive plans. Note: options have no longer been granted to the Chairman of the Board since 2014 year end.
TYPE OF OPTIONS1 (YEAR OF ISSUE)
STRIKE PRICE2 (CHF)
TOTAL NUMBER OF OPTIONS GRANTED UNDER EACH PLAN
MARKET VALUE AT GRANT
(CHF THOUSAND)NUMBER VESTED ON
31 DECEMBER 2016NUMBER VESTED ON
31 DECEMBER 2015
SGSKF (2012) 1 497 50 000 133 50 000 50 000
SGSWS (2013) 2 013 40 000 89 40 000 26 667
SGSPF (2014) 2 059 75 000 189 50 000 50 000
1. One hundred options give the right to acquire one share.2. Before Adjustment for capital reductions and special dividends.
5. REMUNERATION AWARDED TO THE CEO, SENIOR MANAGEMENT AND OTHER MEMBERS OF THE OPERATIONS COUNCIL
This section sets out the remuneration that was paid to the Operations Council as a whole, to the three Operations Council members who make up Senior Management and to the Chief Executive Officer for 2016. All amounts disclosed in this section include the Short-Term Incentive cash amount and restricted shares that will be granted in April 2017 with respect to performance in 2016 (disclosure according to the accrual principle).

140
7. REMUNERATION REPORT
5.1. PERFORMANCE IN 2016
The chart below summarises the 2016 performance achievements against targets for the financial objectives (revenue, profitability, capital efficiency) used in the Short-Term Incentive:
GROUP REVENUE
REGIONAL NWC
Threshold
GROUP NPAT
GROUP ROIC
REGIONAL AND BUSINESS LINE PROFIT
MaximumTarget
PERFORMANCE LEVEL
Achievement Median achievement Performance range
5.2. CASH COMPENSATION
(CHF thousand) 2016 2015
To the Operations Council (including Senior Management) 11 259 13 305
To Senior Management (including Chief Executive Officer) 2 304 3 143
To the Chief Executive Officer 1 263 1 943
Former Incumbent, Mr. Chris Kirk (pro rata) - 852
Current Incumbent, Mr. Frankie Ng (pro rata) 1 263 1 091
The total cash compensation paid to the Operations Council includes the annual base salaries, the cash portion of the Short-Term Incentive, and any other cash allowances, including allowances paid to individual members in respect of vehicle, housing and schooling. Post-employment benefits of CHF 1 072 thousand are not included (2015: CHF 1 081 thousand). Employer's contributions to social benefits are excluded as well. The total cash compensation in 2016 was lower than in 2015 because there was no overlap of former and current CEO, and because the Short-Term Incentive payout was lower.
The achievement of financial targets at Group level, in the businesses and in the regions ranges from 73.8% to 110.8% (2015: 79.3% to 138.2%). The overall Short-Term Incentive payout amounts to 78.0% of the target incentive opportunity for the CEO (2015: 107.1%) and ranges from 26.6% to 124.1% of the target incentive opportunity for the members of the Operations Council (2015: 53.9% to 158.9%). For the purpose of the Short-Term Incentive, targets and performance achievement are measured at constant currency exchange rates.
5.3. SHARE-BASED COMPENSATION
5.3.1. Restricted Shares
In settlement of 2016 Short-Term Incentive, SGS restricted shares will be allocated to the Operations Council (including Senior Management) in April 2017 (2015: 1 315 restricted shares were granted in April 2016). The shares are allocated at their fair market value, being defined as the average closing price of the share during a 20-day period following the payment of the dividends after the Annual General Meeting, and are restricted for a period of three years.
5.3.2. Long-Term Incentive Plan
In 2016, the Group did not implement any Long-Term Incentive plan, and the Operations Council members did not receive any Long-Term Incentive grant.
Under the 2015 Long-Term Incentive plan, a total of 14 570 PSUs were granted to the Operations Council members (including Senior Management). Senior Management was awarded a total of 3 772 PSUs, which included 2 346 PSUs awarded to the Chief Executive Officer. The vesting date of such PSUs is 31 December 2017. The vesting is conditional upon the Group achieving or exceeding its financial targets over the three-year performance period (2015-2017) relating to relative organic revenue growth, relative NPAT improvement, relative TSR and absolute free cash flow.
The value of the PSUs granted in 2015 measured at the grant date fair value did not exceed the maximum amount of CHF 30 million approved at the Annual General Meeting 2015.

141
5.3.3. Discontinued Share Option Plans
The following table presents details of the share options awarded to members of the Operations Council, Senior Management and the CEO, active at 31 December 2016, and shows those options that have been granted, vested and/or became exercisable in 2016.
TYPE OF OPTIONS1 (YEAR OF ISSUE)
STRIKE PRICE2 (CHF)
TOTAL NUMBER OF OPTIONS GRANTED UNDER EACH PLAN
MARKET VALUE AT GRANT
(CHF THOUSAND)NUMBER VESTED ON
31 DECEMBER 2016NUMBER VESTED ON
31 DECEMBER 2015
OPERATIONS COUNCIL (INCLUDING SENIOR MANAGEMENT AND CHIEF EXECUTIVE OFFICER)SGSKF (2012) 1 497 628 862 1 673 628 862 628 862
SGSWS (2013) 2 013 776 970 1 733 776 970 517 980
SGSPF (2014) 2 059 589 746 1 486 393 164 393 164
SGSBB (2015) 1 798 878 993 1 951 585 995 292 998
SENIOR MANAGEMENT (INCLUDING CHIEF EXECUTIVE OFFICER)SGSKF (2012) 1 497 102 676 273 102 676 102 676
SGSWS (2013) 2 013 89 895 200 89 895 59 930
SGSPF (2014) 2 059 89 928 227 59 952 59 952
SGSBB (2015) 1 798 145 545 323 97 030 48 515
CHIEF EXECUTIVE OFFICERSGSKF (2012) 1 497 61 621 164 61 621 61 621
SGSWS (2013) 2 013 46 632 104 46 632 31 088
SGSPF (2014) 2 059 23 464 59 15 643 15 643
SGSBB (2015) 1 798 82 727 184 55 151 27 576
1. One hundred options give the right to acquire one share.2. Before adjustment for capital reductions and special dividends.
5.4. TOTAL COMPENSATION TO THE OPERATIONS COUNCIL, SENIOR MANAGEMENT AND CHIEF EXECUTIVE OFFICER
The tables below present all components of the remuneration earned in 2016 and 2015 by the Operations Council, by the Senior Management and by the Chief Executive Officer.
Total compensation for 2016:
(CHF thousand)BASE
SALARY
CONTRIBUTION TO PENSION
BENEFITS
OTHER EMPLOYMENT
BENEFITS
ANNUAL CASH
INCENTIVE
ANNUAL GRANT OF
RESTRICTED SHARES1
LONG TERM INCENTIVE
PSUS GRANT
TOTAL 2016 COMPENSATION
(INCLUDING RESTRICTED SHARES)
To the Operations Council (including Senior Management)2 7 768 1 072 2 731 1 839 1 839 - 15 249
To Senior Management (including Chief Executive Officer)3 1 610 225 539 458 458 - 3 290
To the Chief Executive Officer 800 100 303 312 312 - 1 827
1. Restricted Shares that will be granted in April 2017.2. 23 FTE (Full Time Equivalent).3. 3 FTE.

142
7. REMUNERATION REPORT
Total compensation for 2015:
(CHF thousand)BASE
SALARY
CONTRIBUTION TO PENSION
BENEFITS
OTHER EMPLOYMENT
BENEFITS
ANNUAL CASH
INCENTIVE
ANNUAL GRANT OF
RESTRICTED SHARES
LONG TERM INCENTIVE
PSUS GRANT1
TOTAL 2015 COMPENSATION
(INCLUDING RESTRICTED
SHARES AND LTI)
To the Operations Council (including Senior Management)2 8 205 1 081 3 508 2 944 2 680 13 468 31 886
To Senior Management (including Chief Executive Officer)3 1 950 260 841 731 731 3 487 8 000
To the Chief Executive Officer 1 140 148 614 438 438 2 169 4 947
Former Incumbent, Mr. Chris Kirk (pro rata) 496 50 404 93 93 - 1 136
Current Incumbent, Mr. Frankie Ng (pro rata) 644 98 210 345 345 2 169 3 811
1. Valuation of the Performance Share Units (PSUs) granted under the 2015-2017 Long-Term Incentive plan (LTI) according to IFRS2. PSUs vesting is subject to company performance conditions. As per Swiss law requirements, the total valuation of the 3-year period has to be disclosed when PSUs are granted contrary to IFRS (valuation disclosed over the LTIP 3-year period).
2. 24 FTE (Full Time Equivalent).3. 3 FTE.
In the year under review, the highest compensation paid by the Group was awarded to the Chief Executive Officer.
The following charts illustrate the ratio between fixed and variable remuneration for the CEO and for the other members of the Operations Council on average (without CEO). The ratio depends on the extent to which pre-defined objectives have been achieved and is being shown at target (assuming performance at the required level), at minimum (no payout under the Short-Term Incentive due to underperformance), at maximum (maximum payout under the Short-Term Incentive plan) and at actual levels achieved in 2016. The charts exclude Long-Term Incentive grants.
OPERATION COUNCIL (EXCLUDING CEO) REMUNERATION MIX (ON AVERAGE)CEO REMUNERATION MIX
Annual base salary Annual incentive (cash) Annual incentive (shares)
4 000
3 500
3 000
2 500
2 000
1 500
1 000
500
0Target Minimum Maximum Actuals
2016
(CHF thousand)
Annual base salary Annual incentive (cash) Annual incentive (shares)
900800700600500400300200100
0Target Minimum Maximum Actuals
2016
(CHF thousand)
In 2016, the variable actual remuneration of the Chief Executive Officer represented 44% of the total actual compensation (2015: 44%), split in cash (22%) and restricted shares (22%). For the Operations Council, including Senior Management, the variable remuneration amounted to 31% of the total compensation on average (2015: 41%), split in cash (15%) and options (15%). Total compensation includes the fixed remuneration (base salary) and the variable remuneration paid out for 2016 (Short-Term Incentive in cash and restricted shares). It excludes fringe and social benefits and Long-Term Incentive grants.
5.5. OTHER COMPENSATION
5.5.1. Severance Payments
No severance payment has been paid in 2016 for members of the Operations Council (2015: CHF 350 000 to one member).
5.5.2. Other compensation to members or former members of governing bodies
No additional compensation or fees were paid to any member or former member of the governing bodies (unchanged from prior year).
5.5.3. Loans to members or former members of governing bodies
As at 31 December 2016, two members of the Operations Council have received loans for a combined amount equivalent to CHF 28 365 (no loan, credit or outstanding advance was due to the Group from members or former members of its governing bodies the prior year).

143
STATUTORY AUDITOR’S REPORT
To the General Meeting of
SGS SA, GENEVA
REPORT OF THE STATUTORY AUDITOR IN RELATION TO SECTIONS 4 AND 5 OF THE REMUNERATION REPORT IN ACCORDANCE WITH
THE ORDINANCE AGAINST EXCESSIVE COMPENSATION IN STOCK EXCHANGE LISTED COMPANIES (ORDINANCE)
We have audited sections 4 and 5 of the Remuneration Report of SGS SA for the year ended 31 December 2016, presented on pages 138 to 142.
Board of Directors’ Responsibility
The Board of Directors is responsible for the preparation and overall fair presentation of the Remuneration Report in accordance with Swiss law and the Ordinance against Excessive compensation in Stock Exchange Listed Companies (Ordinance). The Board of Directors is also responsible for designing the remuneration system and defining individual remuneration packages.
Auditor’s Responsibility
Our responsibility is to express an opinion on the Remuneration Report. We conducted our audit in accordance with Swiss Auditing Standards. Those standards require that we comply with ethical requirements and plan and perform the audit to obtain reasonable assurance about whether sections 4 and 5 of the Remuneration Report comply with Swiss law and articles 14 – 16 of the Ordinance.
An audit involves performing procedures to obtain audit evidence on the disclosures made in the Remuneration Report with regard to compensation, loans and credits in accordance with articles 14 – 16 of the Ordinance. The procedures selected depend on the auditor’s judgment, including the assessment of the risks of material misstatements in the Remuneration Report, whether due to fraud or error. This audit also includes evaluating the reasonableness of the methods applied to value components of remuneration, as well as assessing the overall presentation of the Remuneration Report.
We believe that the audit evidence we have obtained is sufficient and appropriate to provide a basis for our opinion.
Opinion
In our opinion, sections 4 and 5 of the Remuneration Report of SGS SA for the year ended 31 December 2016 comply with Swiss law and articles 14 – 16 of the Ordinance.
DELOITTE SA
James Baird Joëlle Herbette
Licensed Audit Expert Licensed Audit Expert Auditor in Charge
Geneva, 9 February 2017

INTEGRATED THINKING INCLUDED
More and more consumers are opting against purchasing genetically engineered (GE) foodstuffs and major food companies are responding to this trend. How though, with the globalisation of supply chains and the corresponding multitude of producers, can multinational companies ensure that all of their suppliers are conforming to No–GE regulations?
One multinational company found that SGS’ global footprint can ensure a consistent quality of No–GE auditing internationally. This helps ensure compliance. Moreover, the depth of service available from SGS means that we can draw on the experience of multiple business lines to drive improvements through the supply chain.
In this instance, our experts from Agriculture, Food and Life provided technical insight to our auditors in Certification and Business Enhancement, while our training department began educating our customer’s teams around the world on No–GE standard requirements. Meanwhile, communications channels were established with an integrated, fully dedicated SGS team at country and corporate levels to ensure the highest possible level of customer service.
It is this ability to offer a range of complementary services from across our business lines, and to deliver them in such an integrated fashion, that is increasingly drawing customers to SGS.

SGS SERVICE
> Non-GMO Certification
CONSUMER BENEFIT
> Accurate labelling for non-genetically modified (GMO) foods

146
CONSOLIDATED INCOME STATEMENTFOR THE YEARS ENDED 31 DECEMBER
(CHF million) NOTES 2016 2015
REVENUE 5 985 5 712
Salaries and wages (3 009) (2 849)
Subcontractors’ expenses (368) (345)
Depreciation, amortisation and impairment 10 to 12 (336) (322)
Other operating expenses 5 (1 456) (1 374)
OPERATING INCOME (EBIT)¹ 816 822
Financial income 6 8 13
Financial expenses 7 (53) (56)
PROFIT BEFORE TAXES 771 779
Taxes 8 (185) (195)
PROFIT FOR THE YEAR 586 584
Profit attributable to:
Equity holders of SGS SA 543 549
Non-controlling interests 43 35
BASIC EARNINGS PER SHARE (IN CHF) 9 71.54 71.99
DILUTED EARNINGS PER SHARE (IN CHF) 9 71.47 71.95
1. Refer to note 4 for analysis of non-recurring items.
CONSOLIDATED STATEMENT OF COMPREHENSIVE INCOMEFOR THE YEARS ENDED 31 DECEMBER
(CHF million) 2016 2015
Actuarial losses on defined benefit plans (3) (40)
Income tax on actuarial losses taken directly to equity 3 9
Items that will not be subsequently reclassified to income statement - (31)
Exchange differences and other¹ (29) (254)
Items that may be subsequently reclassified to income statement (29) (254)
OTHER COMPREHENSIVE INCOME FOR THE YEAR (29) (285)
Profit for the year 586 584
TOTAL COMPREHENSIVE INCOME FOR THE YEAR 557 299
Attributable to:
Equity holders of SGS SA 519 266
Non-controlling interests 38 33
1. In 2016, exchange differences and other include net exchange loss of CHF 23 million on long-term loans treated as net investment in a foreign entity according to IAS 21 (2015: gain of CHF 40 million).
8. SGS GROUP RESULTS

147
CONSOLIDATED BALANCE SHEETAT 31 DECEMBER
(CHF million) NOTES 2016 2015¹
ASSETS
NON-CURRENT ASSETS
Land, buildings and equipment 10 972 964
Goodwill 11 1 195 1 088
Other intangible assets 12 246 218
Investments in joint-ventures, associates and other companies 38 32
Deferred tax assets 8 165 173
Other non-current assets 13 122 142
TOTAL NON-CURRENT ASSETS 2 738 2 617
CURRENT ASSETS
Unbilled revenues and inventories 14 290 288
Trade accounts and notes receivable 15 997 917
Other receivables and prepayments 16 252 272
Current tax assets 88 66
Marketable securities 17 9 244
Cash and cash equivalents 18 975 1 490
TOTAL CURRENT ASSETS 2 611 3 277
TOTAL ASSETS 5 349 5 894
EQUITY AND LIABILITIES
CAPITAL AND RESERVES
Share capital 22 8 8
Reserves 2 243 2 222
Treasury shares 22 (478) (324)
EQUITY ATTRIBUTABLE TO EQUITY HOLDERS OF SGS SA 1 773 1 906
Non-controlling interests 80 75
TOTAL EQUITY 1 853 1 981
NON-CURRENT LIABILITIES
Loans and obligations under finance leases 23 1 719 1 723
Deferred tax liabilities 8 42 60
Defined benefit obligations 24 154 181
Provisions 25 93 97
TOTAL NON-CURRENT LIABILITIES 2 008 2 061
CURRENT LIABILITIES
Loans and obligations under finance leases 23 1 494
Trade and other payables 26 641 526
Provisions 25 19 19
Current tax liabilities 166 159
Other creditors and accruals 27 661 654
TOTAL CURRENT LIABILITIES 1 488 1 852
TOTAL LIABILITIES 3 496 3 913
TOTAL EQUITY AND LIABILITIES 5 349 5 894
1. Restated figures (notes 2 and 23).
8. SGS GROUP RESULTS

148
CONSOLIDATED STATEMENT OF CASH FLOWSFOR THE YEARS ENDED 31 DECEMBER
(CHF million) NOTES 2016 2015
Profit for the year 586 584
Other non-cash items 19.1 560 541
Decrease in working capital 19.2 75 160
Taxes paid (207) (223)
Pension funds special contribution1 - (103)
CASH FLOW FROM OPERATING ACTIVITIES 1 014 959
Purchase of land, buildings, equipment and other intangible assets 10 and 12 (289) (301)
Acquisition of businesses 3 and 19.3 (172) (104)
Decrease in other non-current assets 3 -
Decrease/(increase) in marketable securities and other 236 (248)
Interest and dividends received 8 13
Sales of land, buildings and equipment 13 15
CASH FLOW FROM INVESTING ACTIVITIES (201) (625)
Dividends paid to equity holders of SGS SA (517) (522)
Dividends paid to non-controlling interests (39) (34)
Transaction with non-controlling interests (4) (2)
Cash received on treasury shares 70 81
Cash paid on treasury shares (231) (228)
(Reimbursements)/proceeds of corporate bonds (491) 549
Interest paid (58) (55)
Net cash flows related to interest rate swaps - 16
Decrease in borrowings (3) (15)
CASH FLOW FROM FINANCING ACTIVITIES (1 273) (210)
Currency translation (55) 25
(DECREASE)/INCREASE IN CASH AND CASH EQUIVALENTS (515) 149
CASH AND CASH EQUIVALENTS AT BEGINNING OF YEAR 1 490 1 341
(Decrease)/increase in cash and cash equivalents (515) 149
CASH AND CASH EQUIVALENTS AT END OF YEAR 18 975 1 490
1. See note 24.
8. SGS GROUP RESULTS

149
STATEMENT OF CHANGES IN CONSOLIDATED EQUITY ATTRIBUTABLE TO
(CHF million)SHARE
CAPITALTREASURY
SHARESCAPITAL RESERVE
CUMULATIVE TRANSLATION
ADJUSTMENTS
CUMULATIVE GAINS/LOSSES
ON DEFINED BENEFIT PLANS1
RETAINED EARNINGS
AND GROUP
RESERVES
EQUITY HOLDERS
OF SGS SA
NON- CONTROLLING
INTERESTSTOTAL
EQUITY
BALANCE AT 1 JANUARY 2015 8 (154) 121 (670) (207) 3 229 2 327 76 2 403
Profit for the year - - - - - 549 549 35 584
Other comprehensive income for the year
- - - (252) (31) - (283) (2) (285)
Total comprehensive income for the year
- - - (252) (31) 549 266 33 299
Dividends paid - - - - - (522) (522) (34) (556)
Share-based payments - - 9 - - - 9 - 9
Movement in non-controlling interests
- - - - - (1) (1) - (1)
Deferred tax on special pension fund contribution
- - - - - (24) (24) - (24)
Movement on treasury shares - (170) - - - 21 (149) - (149)
BALANCE AS AT 31 DECEMBER 2015
8 (324) 130 (922) (238) 3 252 1 906 75 1 981
BALANCE AT 1 JANUARY 2016 8 (324) 130 (922) (238) 3 252 1 906 75 1 981
Profit for the year - - - - - 543 543 43 586
Other comprehensive income for the year
- - - (24) - - (24) (5) (29)
Total comprehensive income for the year
- - - (24) - 543 519 38 557
Dividends paid - - - - - (517) (517) (39) (556)
Share-based payments - - 16 - - - 16 - 16
Movement in non-controlling interests
- - - - - 5 5 6 11
Movement on treasury shares - (154) (1) - - (1) (156) - (156)
BALANCE AS AT 31 DECEMBER 2016
8 (478) 145 (946) (238) 3 282 1 773 80 1 853
1. Net of tax.

150
NOTES
1. ACTIVITIES OF THE GROUP
SGS SA and its subsidiaries (the “Group”) operate around the world under the name SGS. The head office of the Group is located in Geneva, Switzerland.
SGS is the global leader and innovator in inspection, verification, testing and certification services supporting international trade in agriculture, minerals, petroleum and consumer products. It also provides these services to governments, international institutions and customers engaged in the industrial, environmental and life science sectors.
2. SIGNIFICANT ACCOUNTING POLICIES AND EXCHANGE RATES
BASIS OF PREPARATION OF THE FINANCIAL STATEMENTS
The consolidated financial statements of the Group are stated in millions of Swiss Francs. They are prepared from the financial statements of the individual companies within the Group with all significant companies having a year-end of 31 December 2016. The consolidated financial statements comply with the accounting and reporting requirements of the International Financial Reporting Standards (IFRS) as issued by the International Accounting Standards Board (IASB).
The accounting conventions and accounting policies are the same as those applied in the 2015 consolidated financial statements, except for the Group’s adoption of new IFRSs effective 1 January 2016.
The financial statements are prepared on an accruals basis and under the historical cost convention, modified as required for the revaluation of certain financial instruments.
ADOPTION OF NEW AND REVISED INTERNATIONAL FINANCIAL REPORTING STANDARDS
The adoption of new or amended standards and interpretations, which are effective for the financial year beginning on 1 January 2016, did not have a material impact on the Group’s consolidated financial statements.
Based on an internal analysis, the following new, but not yet applicable, IFRS standards will be of significance to the Group but have not been early adopted:
• IFRS 9 Financial Instruments will substantially change the classification and measurement of financial instruments, will require impairments to be based on a forward-looking model and will change the approach to hedging financial exposures and related documentation as well as the recognition of certain fair value changes. The Group does not expect IFRS 9 to have a significant impact on its consolidated financial statements and will implement the new standard on 1 January 2018;
• IFRS 15 Revenue from Contracts with Customers amends revenue recognition requirements and establishes principles for reporting information about the nature, amount, timing and uncertainty of revenue and cash flows arising from contracts with customers. The standard replaces IAS 18 Revenue and IAS 11 Construction Contracts and related interpretations. A working group is in place to review and analyse the impact of the application of IFRS15 on the different businesses. While the timing in the recognition of the revenue and the related costs for specific activities might be affected, the impact will depend on the mix of activities but is not expected to be significant on the consolidated financial statements. The Group will implement the new standard on 1 January 2018;
• IFRS 16 Leases may impact the Group’s consolidated financial statements the financial statements as the majority of leases and corresponding right of use, will become on-balance sheet liabilities
and assets respectively. The standard replaces IAS 17 Leases and is effective on 1 January 2019. A working group is in place and is currently assessing the future impact of this new standard.
There are no other IFRS standards or interpretations, which are not yet effective and which would be expected to have a material impact on the Group.
BASIS OF CONSOLIDATION
Subsidiaries
The consolidated financial statements incorporate the financial statements of the Company and the entities controlled by the Group. Control is achieved when the Group:
• has power over the investee;
• is exposed, or has the right, to variable return from its involvement with the investee; and
• has the ability to use its power to affect its return.
The Company reassesses whether or not the Group controls an investee if facts and circumstances indicate that there are changes to one or more of the three elements of control listed above.
Consolidation of a subsidiary begins when the Group obtains control over the subsidiary and ceases when the Group loses control of the subsidiary.
The principal operating companies of the Group are listed on pages 218 to 221.
Associates
Associates are entities over which the Group has significant influence but no control or joint control over the financial and operating policies. The consolidated financial statements include the Group’s share of the earnings of associates on an equity accounting basis from the date that significant influence commences until the date that significant influence ceases.
Joint Ventures
A joint venture is a jointly controlled entity or operation where the parties have joint rights to the net assets. The consolidated financial statements include the Group’s share of the earnings and net assets on an equity
8. SGS GROUP RESULTS

151
accounting basis of joint ventures that it does not control, effective from the date that joint control commences until the date that joint control ceases.
Joint Operations
A joint operation is an arrangement whereby the parties that have joint control have separable specific rights to the assets and the liabilities within the arrangement. When a Group entity undertakes its activities under joint operations, the Group as a joint operator recognises in relation to its interest in a joint operation:
• its assets, including its share of any assets held jointly;
• its liabilities, including its share of any liabilities incurred jointly;
• its revenue from the sale of its share of the output arising from the joint operation;
• its share of the revenue from the sale of the output by the joint operation; and
• its expenses, including its share of any expenses incurred jointly.
Investments in Companies not Accounted for as Subsidiaries, Associates or Jointly Controlled Entities
Investments in companies not accounted for as subsidiaries, associates or jointly controlled entities (normally below 20% shareholding levels) are stated at cost less any provision for impairment. The fair value of these investments cannot be reliably measured. Dividends received from these investments are included in financial income.
Transactions Eliminated on Consolidation
All intra-group balances and transactions, and any unrealised gains and losses arising from intra-group transactions, are eliminated in preparing the consolidated financial statements. Unrealised gains and losses arising from transactions with associates and jointly controlled entities are eliminated to the extent of the Group’s interest in those entities.
Foreign Currency Transactions
Transactions in foreign currencies are recorded at the foreign exchange rate prevailing at the date of the transaction. Monetary assets and liabilities denominated in foreign currencies at the balance sheet date are translated at the foreign exchange rate prevailing at that date. Exchange differences arising on the settlement of monetary items or on reporting monetary items at rates different from those at which they were initially recorded during the period or in previous financial statements, are recognised in the income statement.
Consolidation of Foreign Companies
All assets and liabilities of foreign companies that are consolidated are translated using the exchange rates in effect at the balance sheet date. Income and expenses are translated at the average exchange rate for the year. Translation differences resulting from the application of this method are classified as equity until the disposal of the investment.
Average exchange rates are used to translate the cash flows of foreign subsidiaries in preparing the consolidated statement of cash flows.
REVENUE RECOGNITION
Revenue is recognised to the extent that it is probable that the economic benefits will flow to the Group and the revenue can be reliably measured.
Revenues represent fees for services rendered to third parties after the deduction of discounts and are recognised when the service has been completed. In certain circumstances, revenue is recognised in proportion to the stage of completion, normally determined by reference to costs incurred to date in comparison with the total estimated costs of the transaction at the balance sheet date. No margin is recognised on work in progress. Completed, but unbilled, services are recorded at net selling prices.
RESTATEMENT
Two bonds with a face value of CHF 492 million indicated in note 23 of the 2015 Annual Report were incorrectly disclosed as “Non-current” instead of “Current” Loans & obligations under finance leases. As a result, the Non-current versus the Current part of the Loans & obligations under finance leases were respectively over and understated by CHF 491 million as at 31 December 2015. The restated 2015 balance sheet figures take into account these adjustments.
There is no impact on previously reported net debt, total liabilities or profit for the period.
SEGMENT INFORMATION
The Group reports its operations by business segment, according to the nature of the services provided.
The Group operates in nine business segments. The Chief Operating Decision Maker evaluates segment performance and allocates resources based on several factors, of which revenue, adjusted operating income and return on capital are the main criteria.
For the Group, the Chief Operating Decision Maker is the Senior Management, which is composed of: the Chief Executive Officer, the Chief Financial Officer and the General Counsel.
All segment revenues reported are from external customers. Segment revenue and operating income are attributed to countries based on the location in which the services are rendered.
Capital additions represent the total cost incurred to acquire land, buildings and equipment as well as other intangible assets.

152
LAND, BUILDINGS AND EQUIPMENT
Land is stated at historical cost and is not depreciated. Buildings and equipment are stated at historical cost less accumulated depreciation. Subsequent expenditures are capitalised only if they increase the future economic benefits embodied in the related item of property and equipment. All other expenditures are expensed as incurred. Depreciation is calculated on a straight-line basis over the estimated useful life of the assets as follows:
• Buildings 12 – 40 years
• Machinery and equipment 3 – 10 years
• Other tangible assets 3 – 10 years
LEASES
Assets acquired under finance lease agreements, which provide the Group with substantially all the risks and rewards of ownership, are capitalised at fair value or, if lower, at amounts equivalent to the estimated present value of the underlying minimum lease payments. The corresponding liabilities are included in long and short-term loans. These leased assets are depreciated over the lease period or their estimated useful lives, whichever is shorter.
Leases where the lessor retains substantially all the risks and rewards of ownership of the assets are classified as operating leases. Operating lease expenditures are expensed on a straight-line basis over the lease term.
GOODWILL
In the case of acquisitions of businesses, the acquired identifiable assets, liabilities and contingent liabilities are recorded at fair value. The difference between the purchase price and the fair value is classified as goodwill and recorded in the balance sheet as an intangible asset.
Goodwill arising from business combinations is measured at cost less any accumulated impairment losses.
If the initial accounting for a business combination is incomplete by the end of the reporting period in which the combination occurs, the Group reports provisional amounts for the items for which the accounting is incomplete. Those provisional amounts are adjusted during the measurement period, or additional assets or liabilities are recognised, to reflect new information obtained about facts and circumstances that existed at the acquisition date that, if known, would have affected amounts recognised at that date.
Goodwill arising on the acquisition of a foreign entity is recorded in the relevant foreign currency and is translated using the end of period exchange rate.
On disposal of part or all of a business that was previously acquired and which gave rise to the recording of acquisition goodwill, the relevant amount of residual goodwill is included in the determination of the gain or loss on disposal.
Goodwill and other intangible assets with indefinite useful lives acquired as part of business combinations are tested for possible impairment annually and whenever events or changes in circumstances indicate their value may not be fully recoverable.
For the purpose of impairment testing, the Group has adopted a uniform method for assessing goodwill and other intangibles recognised under the acquisition method of accounting. These assets are allocated to the Cash Generating Unit (CGU) which is expected to benefit from the business combination. The recoverable amount of a CGU is determined through a value-in-use calculation. The key assumptions for the value-in-use calculations are those regarding the discount rates, growth rates, operating margins and expected changes to selling prices or direct costs during the period. Pre-tax discount rates used are based on the Group’s weighted average cost of capital, adjusted for specific risks associated with the CGU’s cash flow projections. The growth rates are based on industry growth forecasts.
Expected changes in selling prices and direct costs are based on past practices and expectations of future changes in the market.
For all CGUs, a value-in-use calculation is performed using cash flow projections covering the next five years. These cash flows projections take into account the most recent financial results and outlook approved by Management, while the subsequent five years are extrapolated based on the estimated long-term growth rate for the relevant activity.
If the recoverable amount of the CGU is less than the carrying amount of the unit's net operating assets, the impairment loss is allocated first to reduce the carrying amount of any goodwill allocated to the unit and then to the other assets of the unit. An impairment loss recognised for goodwill is not reversed in a subsequent period.
Even if the initial accounting for an intangible asset acquired in the reporting period is only provisional, this asset is tested for impairment.
OTHER INTANGIBLE ASSETS
Intangible assets, including software, licences, trademarks and customer relationships are capitalised and amortised on a straight-line basis over their estimated useful lives, normally not exceeding 20 years. Indefinite life intangible assets are not amortised but are subject to an annual impairment test. The following useful lives are used in the calculation of amortisation:
• Trademarks 5 – 20 years
• Customer relationships 5 – 20 years
• Computer software 1 – 4 years
Other intangible assets acquired as part of an acquisition of a business are capitalised separately from goodwill if their fair value can be measured reliably. Internally generated intangible assets are recognised if the asset created can be identified, it is probable that future economic benefits will be generated from it, the related development costs can be measured reliably and sufficient financial resources are available to complete the development. These assets are amortised on a straight-line basis over their useful lives, which usually do not exceed four years. All other development costs are expensed as incurred.
8. SGS GROUP RESULTS

153
IMPAIRMENT OF ASSETS EXCLUDING GOODWILL
At each balance sheet date, or whenever there is an indication that an asset may be impaired, the Group reviews the carrying amounts of its tangible and intangible assets to determine whether they have suffered an impairment loss. If indications of impairment are present, the assets are tested for impairment. If impaired, the carrying value of the asset is reduced to its recoverable value. Where it is not possible to estimate the recoverable amount of an individual asset, the Group estimates the recoverable amount of the CGU to which the asset belongs.
The recoverable amount of an asset is the greater of the net realisable value and its value-in-use. In assessing its value-in-use, the pre-tax estimated future cash flows are discounted to their present value using a pre-tax discount rate that reflects current market assessments of the time-value of money and the risks specific to the asset.
REVERSAL OF IMPAIRMENT LOSSES
Where an impairment loss on assets other than goodwill subsequently reverses, the carrying amount of the asset or CGU is increased to the revised estimate of its recoverable amount, but not in excess of the carrying amount that would have been recorded had no impairment loss been recognised. A reversal of an impairment loss is recognised as income immediately.
UNBILLED REVENUES AND INVENTORIES
Completed but unbilled services are recorded at net selling prices.
Work in progress is measured at the lower of the costs incurred in providing the service and its ultimate invoice price less costs to complete.
RECEIVABLES
Trade receivables are recognised and carried at original invoice amount less an allowance for any uncollectible amounts. An allowance for doubtful debts is made when collection of the full amount is no longer probable. Bad debts are written off when identified.
MARKETABLE SECURITIES
Marketable securities are recorded in the balance sheet at fair value. Movements in the fair value of marketable securities are reported in the income statement as financial income/expenses. For marketable securities designated as being available for sale, the movements in fair value are recorded as a component of shareholders’ equity and recognised in the income statement at the time of disposal. Marketable securities designated as available for sale are those that are not classified as at fair value through profit and loss.
CASH AND CASH EQUIVALENTS
Cash and cash equivalents include cash, deposits held with banks and investments in money market instruments with an original maturity of three months or less. Bank overdrafts are included within current loans.
DERIVATIVE FINANCIAL INSTRUMENTS AND HEDGING
The Group uses derivative financial instruments to hedge its exposure to foreign exchange and interest rate risks arising from operational, financing and investment activities. In accordance with its treasury policy, the Group does not hold or issue derivative financial instruments for trading purposes. Derivatives are accounted for on a mark-to-market basis.
Derivative financial instruments are initially recognised at fair value and subsequently re-measured at fair value at each balance sheet date. The gains and losses resulting from the fair value re-measurement are recognised in the income statement.
The fair value of forward exchange contracts is determined with reference to market prices at the balance sheet date.
The Group designates and documents certain derivatives as hedging instruments against changes in fair value of recognised assets and liabilities.
CORPORATE BONDS
The corporate bonds issued by the Group are measured at amortised cost using the effective interest method, with interest expense recognised on an effective yield basis.
The effective interest method is a method of calculating the amortised cost of a financial liability and of allocating interest expense over the relevant period. The effective interest rate is the rate that exactly discounts estimated future cash payments through the expected life of the financial liability to the net carrying amount on initial recognition.
The Group uses fair value hedges to mitigate interest rate risks relating to its corporate bonds. The changes in fair value of hedging instruments are recognised in the income statement.
EMPLOYEE BENEFITS
Pension Plans
The Group maintains several defined benefit and defined contribution pension plans in accordance with local conditions and practices in the countries in which it operates. Defined benefit pension plans are based on an employee’s years of service and remuneration earned during a pre-determined period. Contributions to these plans are normally paid into funds, which are managed independently of the Group, except in rare cases where there is no legal obligation to fund.
In such cases, the liability is recorded in the Group’s consolidated balance sheet.
The Group’s obligations towards defined benefit pension plans and the annual cost recognised in the income statement are determined by independent actuaries using the projected unit credit method. Remeasurement gains and losses are immediately recognised in the consolidated balance sheet with the corresponding movement being recorded in the consolidated statement of comprehensive income.
Past service costs are immediately recognised as an expense. Net interest expense is calculated by applying the discount rate at the beginning of the period to the net defined benefit liability or asset.

154
The retirement benefit obligation recognised in the balance sheet represents the present value of the defined benefit obligation reduced by the fair value of plan assets. Any asset resulting from this calculation is limited to the present value of available refunds and reductions in future contributions to the plan.
Payments to defined contribution plans are recognised as an expense in the income statement as incurred.
Post-employment Plans Other than Pensions
The Group operates some non-pension post-employment defined benefit schemes, mainly healthcare plans. The method of accounting and the frequency of valuations are similar to those used for defined benefit pension plans.
Equity Compensation Plans
The Group provides additional benefits to certain senior executives and employees through equity compensation plans (see note 31). An expense is recognised in the income statement for shares and equity-linked instruments granted to senior executives and employees under these plans.
TRADE PAYABLES
Trade payables are recognised at nominal value that approximates the fair value.
PROVISIONS
The Group records provisions when: it has an obligation, legal or constructive, to satisfy a claim; it is probable that an outflow of Group resources will be required to satisfy the obligation; and a reliable estimate of the amount can be made.
In the case of litigation and claims relating to services rendered, the amount that is ultimately recorded is the result of a complex process of assessment of a number of variables, and relies on Management’s informed judgement about the circumstances surrounding the past provision of services. It also relies on expert legal advice and actuarial assessments.
Changes in estimates are reflected in the income statement in the period in which the change occurs.
BORROWING COSTS
Borrowing costs directly attributable to the acquisition, construction or production of qualifying assets, which are assets that necessarily take a substantial period of time to get ready for their intended use or sale, are added to the cost of those assets, until such time as the assets are substantially ready for their intended use or sale.
Investment income earned on the temporary investment of specific borrowings pending their expenditure on qualifying assets is deducted from the borrowing costs eligible for capitalisation.
All other borrowing costs are recognised in the income statement in the period in which they are incurred.
RESTRUCTURING COSTS
The Group recognises costs of restructuring against operating income in the period in which Management has committed to a formal plan, the costs of which can be reliably estimated, and has raised a valid expectation in those affected that the plan will be implemented and the related costs incurred. Where appropriate, restructuring costs include impairment charges arising from the implementation of the formal plan.
CAPITAL MANAGEMENT
Capital comprises equity attributable to equity holders, loans and obligations under finance leases and cash and cash equivalents.
The Board of Directors’ policy is to maintain a strong capital base in order to maintain investor, creditor and market confidence, and to sustain the future development of the business. The Board also recommends the level of dividends to be distributed to ordinary shareholders on an annual basis.
The Group maintains sufficient liquidity at the Group and subsidiary level to meet its working capital requirements, fund capital purchases and small and medium-sized acquisitions.
Cash and cash equivalents as well as loans and obligations under finance leases are disclosed in notes 18 and 23.
In 2017, the Board of Directors of SGS SA has authorised a new share buyback programme of up to CHF 250 million.
Treasury shares are intended to be used to cover the Group’s employee equity participation plan, convertible bonds and/or cancellation of shares. Decisions to buy or sell are made on an individual transaction basis by the Management.
There were no changes in the Group’s approach to capital management during the year.
The Group is not subject to any externally imposed capital requirements.
TAXES
Income taxes include all taxes based upon the taxable profits of the Group, including withholding taxes payable on the transfer of income from Group companies and tax adjustments from prior years. Taxes on income are recognised in the income statement except to the extent that they relate to items directly charged or credited to equity or other comprehensive income, in which case the related income tax effect is recognised in equity or other comprehensive income. Provisions of income and withholding taxes that could arise on the remittance of subsidiary retained earnings are only made where there is a current intention to remit such earnings. Other taxes not based on income, such as property taxes and capital taxes, are included within operating expenses.
Deferred taxes are provided using the full liability method. They are calculated on all temporary differences that arise between the tax base of an asset or liability and the carrying values in the consolidated financial statements except for non-tax-deductible goodwill and for those differences related to investments in subsidiaries where their reversal will not take place in the foreseeable future. Deferred income tax assets relating to the carry-forward of unused tax losses and tax credits are recognised to the extent that it is probable that future taxable profits will be available against which they can be utilised.
8. SGS GROUP RESULTS

155
Current income tax assets and liabilities are offset when the income taxes are levied by the same taxing authority and where there is a legally enforceable right of offset. Deferred tax assets and liabilities are determined based on enacted or substantively enacted tax rates in the respective jurisdictions in which the Group operates that are expected to apply to taxable income in the years in which those temporary differences are expected to be recovered or settled.
EARNINGS PER SHARE
Basic earnings per share are calculated by dividing the Group’s profit by the weighted average number of shares outstanding during the year, excluding treasury shares. For diluted earnings per share, the weighted average number of shares outstanding is adjusted assuming conversion of all potential dilutive shares. Group profit is also adjusted to reflect the after-tax impact of conversion.
DIVIDENDS
Dividends are reported as a movement in equity in the period in which they are approved by the shareholders.
TREASURY SHARES
Treasury shares are reported as a deduction to equity. The original cost of treasury shares and the proceeds of any subsequent sale are recorded as movements in equity.
SIGNIFICANT ACCOUNTING JUDGEMENTS AND ESTIMATES
Judgements
In the process of applying the entity’s accounting policies described above, Management has made the following judgements that have a significant effect on the amounts recognised in the financial statements.
Legal and Warranty Claims on Services Rendered
The Group is subject to litigation and other claims as described in note 25.
Management bases its judgements on the circumstances relating to each specific event, internal and external legal advice,
knowledge of the industries and markets, prevailing commercial terms and legal precedent, and evaluation of applicable insurance cover where appropriate. The Group’s legal and warranty claims are reviewed, at a minimum, on a quarterly basis by a cross-functional representation of Management.
Use of Estimates
The key assumptions concerning the future, and other key sources of estimation at the balance sheet date that have a risk of causing a material adjustment to the carrying amount of assets and liabilities within the next financial year, are discussed below.
Recoverability of Trade Accounts and Notes Receivable
Trade accounts and notes receivable are reflected net of an estimated allowance for doubtful accounts (see note 15). These allowances for potential uncollectible amounts are estimated based primarily on the Group’s ageing policy guidelines, individual client analysis and an analysis of the underlying risk profile of each major revenue stream by business and geography.
Impairment of Goodwill
Details of the assumptions used are provided in note 11.
The Group determines whether goodwill is impaired at a minimum on an annual basis. This requires identification of CGUs and an estimation of the value-in-use of the CGUs to which the goodwill is allocated. Estimating the value-in-use requires the Group to make an estimate of the expected future cash flows from the CGU that holds the goodwill at a determined discount rate in order to calculate the present value of those cash flows.
Estimations of Employee Post-employment Benefits Obligations
The Group maintains several defined benefit pension plans in accordance with local conditions and practices in the countries in which it operates. The related obligations recognised in the balance sheet represent the present value of the defined benefit
obligations calculated annually by independent actuaries. These actuarial valuations include assumptions such as discount rates, salary progression rates and mortality rates. These actuarial assumptions vary according to the local prevailing economic and social conditions. Details of the assumptions used are provided in note 24.
Income Taxes
The Group is subject to income taxes in numerous jurisdictions. Significant judgement is required in determining the worldwide provision for income taxes. There are many transactions and calculations for which the ultimate tax determination is uncertain. The Group recognises liabilities for anticipated tax audit issues based on estimates of whether additional taxes will be due, including estimated interest and penalties where appropriate. Where the final tax outcome of these matters is different from the amounts that were initially recorded, such differences will impact the current and deferred income tax assets and liabilities in the period in which such determination is made.

156
EXCHANGE RATES
The most significant currencies for the Group were translated at the following exchange rates into Swiss Francs:
YEAR-END RATES ANNUAL AVERAGE RATES
2016 2015 2016 2015
Australia AUD 100 74.00 72.24 73.27 72.44
Brazil BRL 100 31.23 25.64 28.38 29.37
Canada CAD 100 75.88 71.54 74.36 75.45
Chile CLP 100 0.15 0.14 0.15 0.15
China CNY 100 14.75 15.28 14.83 15.32
Eurozone EUR 100 107.12 108.42 109.01 106.91
United Kingdom GBP 100 125.75 146.91 133.60 147.19
Hong Kong HKD 100 13.23 12.79 12.69 12.42
Taiwan TWD 100 3.18 3.01 3.05 3.03
USA USD 100 102.57 99.15 98.49 96.26
3. BUSINESS COMBINATIONS
The following business combinations occurred during 2016 and 2015:
BUSINESS COMBINATIONS 2016
In 2016, the Group completed 19 business combinations for a total purchase price of CHF 193 million (note 20).
Accutest Laboratories
Effective 4 January 2016, SGS acquired, for a purchase price of CHF 38 million, 100% of the businesses and related assets of Accutest Laboratories, the fifth largest full services environment testing company in the United States of America.
Cybermetrix Inc. (CMX)
Effective 12 February 2016, SGS acquired, for a purchase price of CHF 32 million, 100% of Cybermetrix Inc., a provider of test cells, equipment and services to meet the complex testing requirements of engine and power systems, based in the United States of America.
Compliance Certification Services Inc.
Effective 5 September 2016, SGS acquired, for a purchase price of CHF 29 million, 100% of Compliance Services Inc., one of China's leading Electro Magnetic Compatibility (EMC) testing laboratories, with operations throughout Taiwan and China.
Other
• Businesses and related assets of Bateman projects from Tenova, a provider of mining engineering and project management operations, based in South Africa (effective 5 April 2016);
• 100% of Cargo Compliance Company (Cargo CC), active in packing, storage, consulting, classification and professional training for the handling of dangerous goods, headquartered in the Netherlands (effective 4 January 2016);
• 100% of Integrated Paper Services, Inc. (IPS Testing), an independent testing laboratory, offering physical and analytical testing for paper, pulp, non-woven fabrics, medical supplies and packaging in both the consumer and supplier environments and is headquartered in the United States of America (effective 8 June 2016);
• 100% of Matrolab Group (Pty)Ltd., a leading engineering and construction materials testing company, based in South Africa (effective 1 February 2016);
• 75% of Shenzhen Firstrank Industrial Development Co. Ltd. (Firstrank), a provider of professional technical services to the offshore energy industry in the areas of quality and safety assurance based in China, covering both in-service and under-construction facilities (effective 1 January 2016);
• 51% of The Lab (Asia) Ltd., a fully independent materials testing, inspection and consulting company, serving the construction, civil engineering, highways, airports and associated industries, based in Hong Kong (effective 1 February 2016);
• 51% of Suzhou Safety-Tech Valve Testing Co., Ltd., offering specialised valve maintenance, repair and overhaul (MRO) services, principally to the energy, metallurgy and papermaking industries based in China (effective 1 January 2016);
• 100% of Laboratorios Contecon Urbar, an independent material testing business focusing on quality control in the construction industry with operations in Colombia and Panama (effective 1 July 2016);
• 100% of SpecHub Inc., offering an extensive array of accredited inspection and testing services for the maritime and energy industry, based in Panama (effective 8 July 2016);
• 100% of Laboratorio de Control Técnico de Calidad de Construcción Eecolab Limitada (Eecolab), offering quality control testing of construction materials as well as soil mechanic studies and geophysical surveys in both the public and private sectors based in Chile (effective 2 August 2016);
• 75% of Unigeo Agricultura de Precisâo (Unigeo), the market leader in precision farming services in Brazil, providing services such as soil
8. SGS GROUP RESULTS

157
sampling and mapping, satellite and drone imagery, interpretation of crop information and online software for farm monitoring and management (effective 1 September 2016);
• 100% of AXYS Analytical Services Ltd. (AXYS), a North American leader in ultra-trace analysis of persistent organic pollutants (POPs), contaminants of emerging concerns (CECs) and the early development stages of the fast-growing metabolomics business (effective 1 October 2016);
• 100% of Roos+Bijl, providing engineering & consulting, project management, asset management and legal services for all types of underground infrastructure in the Netherlands (effective 29 September 2016);
• 70% of Biopremier-Inovacao e Servicios em Biotechnologia S.A. specialised in molecular biology and DNA sequencing services in the food sector, based in Portugal (effective 7 December 2016);
• 41.9% ownership and a 54.5% controlling stake of C-Labs SA, an Industry 4.0 startup, developing solutions for transforming food regulatory compliance, based in Switzerland (effective 19 December 2016);
• 100% of Laagrima, providing testing analysis for the food and hospitality markets in Morocco (effective 20 December 2016).
These companies were acquired for an equivalent of CHF 94 million and the total goodwill generated on these transactions amounted to CHF 67 million (note 20).
Total
All the above transactions contributed in total CHF 135 million in revenues and CHF 10 million in operating income. Had all acquisitions been effective 1 January 2016, the revenues for the period would have increased by CHF 57 million and the Group operating income for the period would have been increased by CHF 8 million. None of the goodwill arising on these acquisitions except Accutest Laboratories and Cybermetrix Inc.(CMX) is expected to be tax deductible.
DIVESTMENTS 2016
There were no significant disposals in 2016.
BUSINESS COMBINATIONS 2015
In 2015, the Group completed 10 business combinations for a total
purchase price of CHF 128 million.
SVA Ltd.
Effective 15 May 2015, SGS acquired for a purchase price of CHF 39 million, 100% of SVA Ltd., an independent provider of advisory, testing and regulatory services for the food and consumer products industry, based in the United Kingdom.
SIGA
Effective 1 October 2015, SGS acquired, for a purchase price of CHF 43 million, 70% of SIGA Ingeniera Consultoria SA, a leading project management, technical inspection and engineering consulting
company in Chile.
Other
In 2015, other acquisitions included:
• 100% of AirServices Estudos e Avaliaçôes Ambientais Ltda., performing air emission monitoring and testing, as well as environmental studies, based in Sao Paulo, Brazil (effective 1 February 2015);
• 100% of Cronolab Referência em Análises Químicas e Ambientais Ltda., providing water, soil and air testing, with a special focus on dioxins and furans, based in Rio de Janeiro, Brazil (effective 1 February 2015);
• 100% of Radiation Safety Services Pty Ltd. (RSS), providing transport and disposal of radioactive sources, compliance, calibration, audit and survey, radiation officer training and other training and consulting services related to radiation, headquartered in Mackay, Australia (effective 1 March 2015);
• 100% of Western Radiation Services Pty Ltd. (WRS), specialising in the analysis of water, soils, sediment and food for radioactive materials based in Perth, Australia (effective 1 March 2015);
• 100% of Testing Services Group LLC (TSG), a provider of fuel systems testing for global customers in the automotive, small engine, marine, portable fuel container and US government markets, based in Michigan, USA (effective 1 May 2015);
• 100% of DLH, a provider of vehicle inspections services, headquartered in Lyon, France (effective 1 June 2015);
• 100% of Le Brigand NDT, a provider of non-destructive testing services on composite and metallic structures for the aviation industry, based in Nantes, France (effective 2 October 2015);
• 100% of Quality Compliance Laboratories Inc (QCL), a GMP compliant laboratory, providing analytical testing to the pharmaceutical, nutraceutical and cosmeceutical industries, based in Toronto, Canada (effective 8 December 2015).
These companies were acquired for an equivalent of CHF 46 million and the total goodwill generated on these transactions amounted to CHF 35 million.
Total
All the above transactions contributed in total CHF 45 million in revenues and CHF 9 million in operating income. Had all acquisitions been effective 1 January 2015, the revenues for the period would have increased by CHF 110 million and the Group operating income for the period would have been increased by CHF 16 million. None of the goodwill arising on these acquisitions is expected to be tax deductible.
DIVESTMENTS 2015
There were no significant disposals in 2015.

158
4. INFORMATION BY BUSINESS AND GEOGRAPHICAL SEGMENT
As indicated in the 2015 Annual Report, the SGS core skills and organisational structures are evolving to adapt to new market conditions and customer demands. The realignment of the Group's business lines, effective as of 1 January 2016, has resulted in greater organisational efficiency, improved customer service and greater agility.
The realignment included the incorporation of Life Science Services and Food Testing into Agricultural Services to generate additional synergies to new product categories. As a result of its expanded scope, the business line has become Agriculture, Food and Life. Automotive Services expanded its reach to become Transportation. Environmental Services expanded to become Environment, Health and Safety. Systems and Services Certification broadened its horizons to become Certification and Business Enhancement. Consumer Testing Services meanwhile became Consumer and Retail. The previously reported 2015 segment disclosures have been restated to reflect this change in organisational structure.
The information presented is disclosed by business line and focuses on revenue, operating income, capital expenditures and employee numbers because these are the performance measures used by the Chief Operating Decision Maker to assess segment performance and decide on the allocation of resources.
(CHF million) 2016 2015
Adjusted operating income 919 917
Restructuring costs (49) (64)
Amortisation of acquisition intangibles (26) (21)
Other non-recurring items (28) (10)
OPERATING INCOME 816 822
(CHF million) REVENUE
ADJUSTED OPERATING
INCOME
AMORTISATION OF ACQUISITION
INTANGIBLESRESTRUCTURING
COSTS
OTHER NON-
RECURRING ITEMS
OPERATING INCOME
BY BUSINESS
2016
Agriculture,Food and Life 935 147 (3) (7) (2) 135
Mineral Services 635 91 (1) (3) (1) 86
Oil, Gas and Chemicals Services 1 098 116 (2) (29) (12) 73
Consumer and Retail Services 873 224 (2) (2) 220
Certification and Business Enhancement 324 57 - - 56
Industrial Services 891 84 (7) (3) (7) 67
Environment, Health and Safety Services
464 55 (4) (1) (2) 48
Transportation Services 490 78 (7) (5) (1) 65
Governments and Institutions Services 275 67 - - (1) 66
TOTAL 5 985 919 (26) (49) (28) 816
8. SGS GROUP RESULTS
(1)
-

159
(CHF million) REVENUE
ADJUSTED OPERATING
INCOME
AMORTISATION OF ACQUISITION
INTANGIBLESRESTRUCTURING
COSTS
OTHER NON-
RECURRING ITEMS
OPERATING INCOME
BY BUSINESS
2015 RESTATED
Agriculture,Food and Life 891 146 (3) (7) - 136
Mineral Services 633 89 (1) (24) - 64
Oil, Gas and Chemicals Services 1 126 129 (3) (8) - 118
Consumer and Retail Services 826 217 - (5) (2) 210
Certification and Business Enhancement 299 49 - (6) - 43
Industrial Services 852 95 (5) (9) (4) 77
Environment, Health and Safety Services
376 48 (3) (1) (3) 41
Transportation Services 449 82 (6) (3) (1) 72
Governments and Institutions Services 260 62 - (1) - 61
TOTAL 5 712 917 (21) (64) (10) 822
(CHF million) REVENUE
ADJUSTED OPERATING
INCOME
AMORTISATION OF ACQUISITION
INTANGIBLESRESTRUCTURING
COSTS OTHER
OPERATING INCOME
BY BUSINESS
2015 PREVIOUSLY PUBLISHED
Agriculture Services 368 64 - (5) - 59
Minerals Services 633 89 (1) (24) - 64
Oil, Gas and Chemicals Services 1 119 129 (3) (8) - 118
Life Science Services 211 23 (2) (1) - 20
Consumer Testing Services 1 133 270 (2) (7) - 261
Systems and Services Certification 419 71 - (6) - 65
Industrial Services 884 100 (5) (9) - 86
Environmental Services 367 47 (2) (1) - 44
Automotive Services 318 62 (6) (2) - 54
Governments and Institutions Services 260 62 - (1) - 61
Unallocated costs - - - - (10) (10)
TOTAL 5 712 917 (21) (64) (10) 822
The revenues reported represent revenue generated from external customers.

160
RESTRUCTURING COSTS
The Group incurred a pre-tax restructuring charge of CHF 49 million (2015: CHF 64 million), largely as a result of the decline in market conditions in certain businesses and geographies. This comprised personnel reorganisation (CHF 18 million) as well as fixed asset impairment and other charges (CHF 31 million).
(CHF million) 2016 % 2015 %
REVENUE FROM EXTERNAL CUSTOMERS BY GEOGRAPHICAL SEGMENT
Europe/Africa/Middle East 2 660 44.4 2 553 44.7
Americas 1 531 25.6 1 432 25.1
Asia Pacific 1 794 30.0 1 727 30.2
TOTAL 5 985 100.0 5 712 100.0
Revenue in Switzerland from external customers for 2016 amounted to CHF 212 million (2015: CHF 227 million). No country represented more than 15% of revenues from external customers in 2016 or 2015.
MAJOR CUSTOMER INFORMATION
In 2016 and 2015, no external customer represented 10% or more of the Group’s total revenue.
SPECIFIC NON-CURRENT ASSETS BY MATERIAL COUNTRIES
Specific non-current assets by material countries:
(CHF million) 2016 % 2015 %
Europe/Africa/Middle East 1 199 48.0 1 224 52.1
Americas 782 31.3 639 27.2
Asia Pacific 518 20.7 486 20.7
TOTAL SPECIFIC NON-CURRENT ASSETS 2 499 100.0 2 349 100.0
Non-current assets in Switzerland for 2016 amounted to CHF 145 million (2015: CHF 206 million).
(CHF million) 2016 2015
RECONCILIATION WITH TOTAL NON-CURRENT ASSETS
Specific non-current assets as above 2 499 2 349
Deferred tax assets 165 173
Retirement benefit assets 60 87
Non-current loans to third parties 14 8
TOTAL 2 738 2 617
8. SGS GROUP RESULTS

161
(CHF million) 2016 % 2015 %
CAPITAL ADDITIONS BY BUSINESS SEGMENT
Agriculture,Food and Life 50 17.3 53 17.3
Mineral Services 21 7.4 29 9.4
Oil, Gas and Chemicals Services 49 17.0 64 20.8
Consumer and Retail Services 55 19.0 64 20.8
Certification and Business Enhancement 4 1.3 4 1.4
Industrial Services 35 12.2 28 9.1
Environment,Health and Safety Services 20 6.8 23 7.4
Transportation Services 43 15.0 26 8.6
Governments and Institutions Services 11 4.0 16 5.2
TOTAL 288 100.0 307 100.0
2016 2015
AVERAGE NUMBER OF EMPLOYEES BY GEOGRAPHICAL SEGMENT
Europe/Africa/Middle East 36 818 34 721
Americas 21 432 19 873
Asia Pacific 31 376 31 309
TOTAL 89 626 85 903
Number of employees at year end 92 269 87 962
5. OTHER OPERATING EXPENSES
(CHF million) 2016 2015
Rental expense, insurance, utilities and sundry supplies 294 279
Consumables, repairs and maintenance 395 375
Communication costs 100 98
Travel costs 360 357
Miscellaneous operating income and expenses 307 265
TOTAL 1 456 1 374
The share of net profit of associates and joint-ventures accounted for using the equity method amounts to CHF nil (2015: CHF 1 million) and is included in the miscellaneous operating income and expenses.
6. FINANCIAL INCOME
(CHF million) 2016 2015
Interest income 10 11
Foreign exchange (losses)/gains (3) 1
Other financial income 1 1
TOTAL 8 13

162
7. FINANCIAL EXPENSES
(CHF million) 2016 2015
Interest expense 33 36
Loss on derivatives at fair value 16 13
Loss/(gain) arising on an Interest Rate Swap1 - 15
(Gain)/loss arising on adjustment for hedged item1 - (15)
Other financial expenses 3 5
Net financial expenses on defined benefit plans 1 2
TOTAL 53 56
1. In a designated fair value hedge accounting relationship.
8. TAXES
(CHF million) 2016 2015
MAJOR COMPONENTS OF TAX EXPENSE
Current taxes 196 214
Deferred tax (credit)/expense relating to the origination and reversal of temporary differences
(11) (19)
TOTAL 185 195
The Group has operations in various countries that have differing tax laws and rates. Consequently, the effective tax rate on consolidated income varies from year to year. A reconciliation between the reported income tax expense and the amount that would arise using the weighted average statutory tax rate of the Group is as follows:
(CHF million) 2016 2015
RECONCILIATION OF TAX EXPENSE
Profit before taxes 771 779
Tax at the domestic rates applicable to the profits earned in the country concerned 135 140
Tax effect of non-deductible or non-taxable items 8 10
Tax charge from/(usage of) unrecognised tax losses 7 1
Non-creditable foreign withholding taxes 34 34
Other 1 10
TAX CHARGE 185 195
(CHF million) 2016 2015
DEFERRED TAX AFTER NETTING
Deferred tax assets 165 173
Deferred tax liabilities (42) (60)
TOTAL 123 113
8. SGS GROUP RESULTS

163
2016 2015
(CHF million) ASSETS LIABILITIES ASSETS LIABILITIES
COMPONENTS OF DEFERRED INCOME TAX BALANCES
Fixed assets 38 7 33 9
Inventories and receivables 10 13 8 18
Defined benefit obligation 20 - 21 -
Provisions and other 38 14 36 17
Intangible assets 5 22 8 16
Tax losses carried forward 68 - 67 -
DEFERRED INCOME TAXES 179 56 173 60
Net change in deferred tax assets/(liabilities):
(CHF million) TOTAL
NET DEFERRED INCOME TAX ASSET (LIABILITY) AT 1 JANUARY 2015 121
(Charged)/credited to the income statement 19
(Charged)/credited to other comprehensive income¹ (15)
Exchange differences and other (12)
NET DEFERRED INCOME TAX ASSET (LIABILITY) AT 31 DECEMBER 2015 113
(Charged)/credited to the income statement 11
(Charged)/credited to other comprehensive income¹ 3
Exchange differences and other (4)
NET DEFERRED INCOME TAX ASSET (LIABILITY) AT 31 DECEMBER 2016 123
1 Related to measurement gains and losses on pensions CHF 3 million (2015: CHF 9 million) and special pension fund contribution 2016: nil [2015: CHF (24) million].
The Group has unrecognised tax losses carried forward amounting to CHF 59 million (2015: CHF 46 million), of which none will expire within the next five years. No tax losses carried forward expired in 2016.
At 31 December 2016, the retained earnings of subsidiaries and foreign incorporated joint ventures consolidated by the Group include approximately CHF 3 790 million (2015: CHF 4 125 million) of undistributed earnings that may be subject to tax if remitted to the parent company. As set out in note 21, the nature of the Group's business requires keeping a significant part of the cash reserves in the operating units. As a Group policy, no deferred tax is recognised in respect of undistributed earnings until the point at which the distributable earnings are determined and foreign statutory requirements, allowing the distribution, are fulfilled. Until that time, the Group takes the view that it is probable that they will not reverse in the foreseeable future.
9. EARNINGS PER SHARE
Basic earnings per share are calculated as follows:
2016 2015
Profit attributable to equity holders of SGS SA (CHF million) 543 549
Weighted average number of shares (in ‘000) 7 583 7 626
BASIC EARNINGS PER SHARE (CHF) 71.54 71.99

164
Diluted earnings per share are calculated as basic earnings per share except that the weighted average number of shares includes the dilutive effect of the Group’s share option plans (see note 31):
2016 2015
Profit attributable to equity holders of SGS SA (CHF million) 543 549
Diluted weighted average number of shares (in ‘000) 7 591 7 630
DILUTED EARNINGS PER SHARE (CHF) 71.47 71.95
Adjusted earnings per share are calculated as follows:2016 2015
Profit attributable to equity holders of SGS SA (CHF million) 543 549
Amortisation of acquisition intangibles (CHF million) 26 21
Restructuring costs net of tax (CHF million) 40 47
Other non-recurring items net of tax (CHF million) 20 8
Adjusted profit attributable to equity holders of SGS SA (CHF million) 629 625
ADJUSTED BASIC EARNINGS PER SHARE (CHF) 83.00 81.95
ADJUSTED DILUTED EARNINGS PER SHARE (CHF) 82.91 81.91
10. LAND, BUILDINGS AND EQUIPMENT
(CHF million) LAND &
BUILDINGS MACHINERY
& EQUIPMENT OTHER TANGIBLE
ASSETS TOTAL
2016
COST
At 1 January 444 1 763 643 2 850
Additions 23 132 103 258
Acquisition of subsidiaries 2 25 6 33
Disposals (27) (68) (40) (135)
Exchange differences and other 6 39 (28) 17
At 31 December 448 1 891 684 3 023
ACCUMULATED DEPRECIATION AND IMPAIRMENT
At 1 January 230 1 243 413 1 886
Depreciation 17 175 61 253
Impairment 29 - 1 30
Disposals (25) (63) (37) (125)
Exchange differences and other - 6 1 7
At 31 December 251 1 361 439 2 051
NET BOOK VALUE AT 31 DECEMBER 2016 197 530 245 972
INCLUDED IN LAND, BUILDINGS AND EQUIPMENT ARE LEASED ASSETS AS FOLLOWS
Purchase cost of leased tangible assets - 2 - 2
Accumulated depreciation - 2 - 2
NET BOOK VALUE AT 31 DECEMBER 2016 - - - -
8. SGS GROUP RESULTS

165
(CHF million) LAND &
BUILDINGS MACHINERY
& EQUIPMENT OTHER TANGIBLE
ASSETS TOTAL
2015
COST
At 1 January 477 1 750 660 2 887
Additions 8 165 102 275
Acquisition of subsidiaries - 10 4 14
Disposals (12) (40) (41) (93)
Exchange differences and other (29) (122) (82) (233)
At 31 December 444 1 763 643 2 850
ACCUMULATED DEPRECIATION AND IMPAIRMENT
At 1 January 229 1 195 420 1 844
Depreciation 16 173 56 245
Impairment 13 4 3 20
Acquisition of subsidiaries - 6 2 8
Disposals (8) (37) (38) (83)
Exchange differences and other (20) (98) (30) (148)
At 31 December 230 1 243 413 1 886
NET BOOK VALUE AT 31 DECEMBER 2015 214 520 230 964
INCLUDED IN LAND, BUILDINGS AND EQUIPMENT ARE LEASED ASSETS AS FOLLOWS
Purchase cost of leased tangible assets - 2 - 2
Accumulated depreciation - 2 - 2
NET BOOK VALUE AT 31 DECEMBER 2015 - - - -
At 31 December 2016, the Group had commitments of CHF 4 million (2015: CHF 4 million) for the acquisition of land, buildings and equipment.
Included in the other tangible assets are construction-in-progress assets amounting to CHF 27 million (2015: CHF 24 million).
11. GOODWILL
(CHF million) NOTE 2016 2015
COST
At 1 January 1 088 1 105
Additions 20 95 85
Impairment (1) -
Exchange differences 13 (102)
AT 31 DECEMBER 1 195 1 088
Goodwill recognised by the Group is allocated to CGUs for impairment testing purposes and is annually tested for impairment at the end of each reporting period.
In response to a constantly changing global marketplace and new demand patterns from the existing customer base, the Group announced an organisational realignment during Autumn 2015, which became effective from 1 January 2016. As a result, most of the Group business lines were reorganised.
This reorganisation, together with a thorough operational review of the Group's business lines and a more seamless approach for business targeting and integration, led the Group to adjust its management of goodwill and to reassess its CGUs to better reflect the operational structure of its business lines and the levels at which cash inflows are generated.

166
• In the case of the following four business lines, the CGU covers the entire worldwide operations since customer activities executed by the local entities, the clients and customers that they serve and the drivers of cash inflows are largely interdependent on a worldwide basis across each business line:
·Consumer and Retails
·Oil, Gas and Chemicals
·Environment, Health and Safety
·Minerals
• The Industrial business line continues to be driven primarily by regional and local customer activities and therefore to have cash inflows, which are largely independent from each other. Consequently, a CGU organisation by region or by country has been maintained and goodwill has been allocated to seven CGUs.
• The Transportation business has been split into two CGUs since the customer activities in this business (especially in testing and engineering activities) are globally interdependent, except for Spain where regulated activities and related cash inflows represent almost entirely the whole business and therefore are assessed as a distinct CGU.
• The Agriculture, Food and Life business has been split into three worldwide CGUs to reflect the global nature of customer activities and drivers of cash inflows in each of Agriculture and Food, Clinical Research and Life Science Laboratories.
• No goodwill has been allocated to the Certification and Business Enhancement or to the Governments and Institutions business lines.
ALLOCATION OF GOODWILL TO CGUS OR GROUP OF CGUS
Goodwill allocated to the main CGUs or groups of CGUs as of 31 December broken down as follows:
(CHF million) 2016 2015
Oil, Gas and Chemicals 137 137
Transportation 230 222
Agriculture, Food and Life 220 209
Environment, Health and Safety 143 122
Industrial 257 212
Minerals 123 110
Consumer and Retail 85 76
TOTAL 1 195 1 088
Goodwill impairment reviews have been conducted for all goodwill balances allocated to the CGUs as described above. An impairment charge of CHF 1 million in relation to the restructuring was recorded (2015: nil).
The recoverable amount of each of the CGUs, determined based upon a value-in-use calculation, is higher than its carrying amount. Cash flow projections were used in this calculation, discounted at a pre-tax rate depending on the business activities and geographic profile of each of the respective CGUs.
PRE-TAX RATE USED IN 2016 FOR THE MAIN CGUS OR GROUP OF CGUS IMPAIRMENT TESTING2016
Oil, Gas and Chemicals 7.4%
Transportation 6.4% – 6.6%
Agriculture, Food and Life 5.3% – 6.9%
Environment, Health and Safety 6.1%
Industrial 5.6% – 9.9%
Minerals 8.3%
Consumer and Retail 6.7%
The cash flow projections for the first five years were based upon financial plans approved by Group Management, while the subsequent years assume a long-term growth rate of 1.0% and stable operating margins. The overall assumptions used in the calculations are consistent with the expected average growth rates of the segments served by the Group.
8. SGS GROUP RESULTS

167
The key sensitivity for each impairment test is the growth in revenue and operating margin. Reducing the expected annual revenue growth rates for the first five years by 2.0% would not result in any of the carrying amounts exceeding the recoverable amount. Reducing the operating margin by 0.25% would not result in any of the carrying amounts exceeding the recoverable amount.
An increase of 1.0% in the discount rate assumption would not change the conclusions of the impairment tests.
12. OTHER INTANGIBLE ASSETS
COMPUTER SOFTWARE AND OTHER ASSETS
(CHF million)TRADEMARKS
AND OTHERCUSTOMER
RELATIONSHIPSINTERNALLY GENERATED PURCHASED TOTAL
2016
COST
At 1 January 76 188 96 283 643
Additions 1 - 8 21 30
Acquisition of subsidiaries 2 50 1 - 53
Disposals - - - (2) (2)
Exchange differences and other (2) 5 1 (8) (4)
At 31 December 77 243 106 294 720
ACCUMULATED AMORTISATION AND IMPAIRMENT
At 1 January 47 74 79 225 425
Amortisation 7 19 8 18 52
Disposals - - - (2) (2)
Exchange differences and other (2) - - 1 (1)
At 31 December 52 93 87 242 474
NET BOOK VALUE AT 31 DECEMBER 2016 25 150 19 52 246
COMPUTER SOFTWARE AND OTHER ASSETS
(CHF million)TRADEMARKS
AND OTHERCUSTOMER
RELATIONSHIPSINTERNALLY GENERATED PURCHASED TOTAL
2015
COST
At 1 January 81 176 85 283 625
Additions - - 8 24 32
Acquisition of subsidiaries 3 27 - - 30
Disposals - - - (5) (5)
Exchange differences and other (8) (15) 3 (19) (39)
At 31 December 76 188 96 283 643
ACCUMULATED AMORTISATION AND IMPAIRMENT
At 1 January 44 63 72 214 393
Amortisation 7 15 6 22 50
Impairment - 1 1 5 7
Disposals - - - (6) (6)
Exchange differences and other (4) (5) - (10) (19)
At 31 December 47 74 79 225 425
NET BOOK VALUE AT 31 DECEMBER 2015 29 114 17 58 218

168
SIGNIFICANT INTANGIBLE ASSETS
The Group is improving its global management information systems, focusing on contract management, finance and sales order processing. Additions relating to the Group's ERP system amount to CHF 5 million (2015: CHF 6 million) and are being amortised over a period of four years.
Incremental costs relating to internally generated assets are capitalised when incurred and amortised over a period of four years from the time of occurrence. Purchased intangible assets mainly consist of purchased computer software and consultancy services required for implementation.
13. OTHER NON-CURRENT ASSETS
(CHF million) NOTE 2016 2015
Non-current loans or amounts receivable from third parties 14 8
Retirement benefit asset 24 60 87
Other non-current assets 48 47
TOTAL 122 142
Depending on the nature of the balances, currency and date of maturity, interest rates on long-term balances or loans to third parties range between 0% and 12%.
In 2016, other non-current assets included deposits for guarantees and CHF 29 million (2015: CHF 28 million) of restricted cash. Typical examples of restricted cash are cash deposits for performance bonds, rentals and other operating obligations.
At 31 December 2016 and 2015, the fair value of the Group's other non-current assets approximates to the carrying value.
14. UNBILLED REVENUES AND INVENTORIES
(CHF million) 2016 2015
Work-in-progress 62 61
Unbilled revenues 187 187
Inventories 41 40
TOTAL 290 288
8. SGS GROUP RESULTS

169
15. TRADE ACCOUNTS AND NOTES RECEIVABLE
(CHF million) 2016 2015
Trade accounts and notes receivable 1 111 1 015
Allowance for doubtful accounts (114) (98)
TOTAL 997 917
Ageing of trade accounts and notes receivables not impaired:
Not overdue 406 361
Past due not more than two months 409 372
Past due more than two months but not more than four months 85 79
Past due more than four months but not more than six months 39 40
Past due more than six months but not more than one year 58 65
Past due more than one year - -
TOTAL 997 917
The nominal value, less impairment provisions, of trade accounts and notes receivable is considered to approximate their fair value.
The movement of allowance for doubtful accounts is analysed as follows:
(CHF million) 2016 2015
Balance at beginning of the year (98) (110)
Acquisition of subsidiaries (2) (1)
Increase in allowance recognised in the income statement (25) (18)
Utilisations 12 22
Exchange differences (1) 9
TOTAL (114) (98)
Receivables aged less than 360 days are provided when the creditworthiness review indicates that the amounts may become unrecoverable. The Group provides fully for all trade accounts and notes receivable over 360 days as historical experience shows that receivables aged more than 360 days are generally not recoverable.
The Group has no significant concentration of credit risk, with exposure spread over a large number of counterparties and customers. Accordingly, Management believes that there is no further credit provision required in excess of the allowance for doubtful debts. Credit risks arise mainly from the possibility that customers may not be able to settle their obligations as agreed. The Group periodically assesses the creditworthiness of customers. The Group’s credit risk is diversified due to the large number of entities that make up the Group’s customer base and the diversification across many different industries and geographic regions.
The maximum credit risk to which the Group is theoretically exposed at 31 December 2016 is represented by the carrying amounts of receivables in the balance sheet.
No customer accounts for 5% or more of the Group’s total receivables at balance sheet date.

170
16. OTHER RECEIVABLES AND PREPAYMENTS
(CHF million) 2016 2015
Accrued income, prepayments 68 69
Derivative assets 3 22
Other receivables 181 181
TOTAL 252 272
The Group has no significant concentration of credit risk, with exposure spread over a large number of counterparties. Other receivables consist mainly of sales taxes and other taxes recoverable as well as advances to suppliers.
17. MARKETABLE SECURITIES
(CHF million) 2016 2015
Available for sale 9 244
TOTAL 9 244
Unrealised gains or losses on marketable securities designated as available for sale and which are recorded in other comprehensive income amounted to less than CHF 1 million for 2016 (2015: CHF 1 million).
The reduction in marketable securities corresponds to the sale Exchange Traded Funds (ETF) investments made in 2015.
18. CASH AND CASH EQUIVALENTS
(CHF million) 2016 2015
Cash and short-term deposits 954 955
Deposits on demand 20 535
Short-term loans 1 -
TOTAL 975 1 490
8. SGS GROUP RESULTS

171
19. CASH FLOW STATEMENT
19.1. OTHER NON-CASH ITEMS
(CHF million) NOTES 2016 2015
Depreciation of buildings and equipment 10 253 245
Impairment of land, buildings and equipment and other intangible assets
10 and 12 30 27
Amortisation of intangible assets 12 52 50
Impairment of goodwill 11 1 -
Net financial expenses 45 43
(Decrease)/increase in provisions and employee benefits (20) (22)
Share-based payment expenses 16 9
(Gain)/loss on disposals of land, buildings and equipment (2) (5)
Share of results from associates and other entities - (1)
Taxes 185 195
OTHER NON-CASH ITEMS 560 541
19.2. DECREASE IN WORKING CAPITAL
(CHF million) 2016 2015
Decrease/(Increase) in unbilled revenues and inventories 12 10
(Increase)/decrease in trade accounts and notes receivable (30) 64
Decrease/(increase) in other receivables and prepayments 11 (12)
Increase/(decrease) in trade and other payables 86 36
Increase/(decrease) in other creditors and accruals 3 50
(Decrease)/increase in other provisions (7) 12
DECREASE IN WORKING CAPITAL 75 160
19.3. CASH FLOWS ARISING FROM ACQUISITIONS OF BUSINESSES
(CHF million) 2016 ACQUISITIONS 2015 ACQUISITIONS
Non-current assets (89) (38)
Current assets excluding cash and cash equivalents (55) (38)
Cash and cash equivalents (15) (6)
Current liabilities 49 21
Non-current liabilities 8 12
Non-controlling interests 4 6
NET IDENTIFIABLE ASSETS ACQUIRED OR DIVESTED (98) (43)
Acquired/(divested) cash and cash equivalents 15 6
SUBTOTAL (83) (37)
Goodwill (95) (85)
Consideration payable 13 22
Payments on prior year acquisitions (8) (1)
Prepayment on acquisitions 1 (3)
NET CASH FLOWS (172) (104)
Note 3 provides further information regarding acquisitions of businesses. All acquisitions were settled in cash.

172
20. ACQUISITIONS
ASSETS AND LIABILITIES ARISING FROM THE 2016 ACQUISITIONS
ACCUTEST CYBERMETRIX CCS OTHER TOTAL
(CHF million) FAIR VALUE ON
ACQUISITION FAIR VALUE ON
ACQUISITION FAIR VALUE ON
ACQUISITION FAIR VALUE ON
ACQUISITION FAIR VALUE ON
ACQUISITION
Tangible assets 8 10 9 6 33
Intangible assets 12 10 7 24 53
Other long-term assets 2 - 1 - 3
Trade accounts and notes receivable
16 2 7 17 42
Other current assets - 1 3 9 13
Cash and cash equivalents - - 5 10 15
Current liabilities (9) (2) (9) (29) (49)
Non-current liabilities (1) - (1) (6) (8)
Non-controlling interests - - - (4) (4)
NET ASSETS ACQUIRED 28 21 22 27 98
Goodwill 10 11 7 67 95
TOTAL PURCHASE PRICE 38 32 29 94 193
Acquired cash and cash equivalents
- - (5) (10) (15)
Consideration receivable/(payable)
4 (5) (4) (8) (13)
Payment on prior year acquisitions
- - - 8 8
Prepayment on acquisitions
- - - (1) (1)
NET CASH OUTFLOW ON ACQUISITIONS
42 27 20 83 172
The goodwill arising on these acquisitions relates mainly to the value of expected synergies and the value of the qualified workforce that do not meet the criteria for recognition as separable intangible assets.
Consideration payable relates mainly to environmental and commercial warranty clauses and the fair value of contingent future earn-out payments.
The Group incurred transaction-related costs of CHF 6 million (2015: CHF 4 million) related to external legal fees, due diligence expenses as well as the costs of maintaining an internal acquisition department. These expenses are reported within Other Operating Expenses in the consolidated income statement.
21. FINANCIAL RISK MANAGEMENT
RISK MANAGEMENT POLICIES AND OBJECTIVES
The Group’s activities expose it primarily to market, credit and liquidity risk. Market risk includes foreign exchange, interest rate and equity price risks.
The risk management policies and objectives are governed by the Group’s policies approved by the Board of Directors.
The Group’s risk management policies are designed to identify and analyse these risks, to set appropriate risk limits and controls and to monitor the risk and limits continually by means of reliable and up-to-date administrative and information systems.
The Audit Committee oversees how Management monitors compliance with the Group’s risk management policies. The Audit Committee is assisted in its oversight role by Internal Audit.
8. SGS GROUP RESULTS

173
RISK MANAGEMENT ACTIVITIES
The Group uses foreign exchange contracts to manage the Group’s exposure to fluctuations in foreign currency exchange rates. These activities are carried out in accordance with the Group’s risk management policies and objectives in areas such as counterparty exposure and hedging practices. Counterparties to these agreements are major international financial institutions with high credit ratings and positions are monitored using market value and sensitivity analyses. The associated credit risk is therefore limited. These agreements generally include the exchange of one currency for a second currency at a future date.
The following table summarises foreign exchange contracts outstanding at year end. The notional amount of derivatives summarised below represents the gross amount of the contracts and includes transactions, which have not yet matured. Therefore the figures do not reflect the Group’s net exposure at year end. The market value approximates the costs to settle the outstanding contracts. These market values should not be viewed in isolation but in relation to the market values of the underlying hedged transactions and the overall reduction in the Group’s exposure to adverse fluctuations in foreign exchange rates.
Currently, the Group has certain exposure to interest and credit risks and no exposure to equity price risk.
NOTIONAL AMOUNT BOOK VALUE MARKET VALUE
(CHF million) 2016 2015 2016 2015 2016 2015
FOREIGN EXCHANGE FORWARD CONTRACTS
Currency:
Australian Dollar (AUD) (10) (54) - (1) - (1)
Brazilian Real (BRL) (63) (27) 2 1 2 1
Canadian Dollar (CAD) (24) (19) - 1 - 1
Chilean Peso (CLP) (34) (23) - - - -
Chinese Renminbi (CNY) 4 19 - 1 - (1)
Colombian Peso (COP) (8) (10) - - - -
Euro (EUR) (243) (318) - - - -
British Pound Sterling (GBP) 26 72 - (2) - -
Hong Kong Dollar (HKD) 24 15 - - - -
Indian Rupee (INR) (4) (4) - - - -
Japanese Yen (JPY) - (7) - - - -
Kenyan Shilling (KES) (3) (2) - - - -
Korean Won (KRW) (5) 4 - - - -
New Zealand Dollar (NZD) (5) (4) - - - -
Philippines Peso (PHP) (4) (7) - - - -
Polish Zloty (PLN) (5) (5) - - - -
Russian Rubble (RUB) 4 3 - - - -
Turkish New Lira (TRY) (13) (14) - - - -
US Dollar (USD) (351) (417) (6) 4 (6) 4
South African Rand (ZAR) (42) (23) (1) 2 (1) 2
Other (8) (2) - (1) - (1)
TOTAL (764) (823) (5) 5 (5) 5
FAIR VALUE MEASUREMENT RECOGNISED IN THE BALANCE SHEET
Marketable securities and derivative assets and liabilities are the only financial instruments measured at fair value subsequent to their initial recognition. Level 1 fair value measurements are those derived from the quoted price in active markets. Level 2 fair value measurements are those derived from inputs other than quoted prices that are observable for the asset and liability, either directly (i.e. as prices) or indirectly (i.e. derived from prices).
Of marketable securities, CHF 9 million (2015: CHF 244 million) qualify as Level 1, fair value measurement category.
Derivative assets (2016: CHF 3 million; 2015: CHF 22 million) and liabilities (2016: CHF 12 million; 2015: CHF 20 million) qualify as Level 2 fair value measurement category in accordance with the fair value hierarchy.
Derivative assets and liabilities consist of foreign currency forward contracts that are measured using quoted forward exchange rates and yield curves derived from quoted interest rates matching maturities of the contract.
The fair values of financial assets and financial liabilities included in Level 2 above have been determined in accordance with generally accepted pricing models.

174
CREDIT RISK MANAGEMENT
Credit risk arises from the possibility that customers may not be able to settle their obligations as agreed. It arises principally from the Group’s commercial activities. The Group has dedicated standards, policies and procedures to control and monitor such risks.
As part of financial management activities, the Group enters into various types of transactions with international banks, usually with a credit rating of at least A. Exposure to these risks is closely monitored and kept within predetermined parameters. The Group does not expect any non-performance by these counterparties.
The maximum credit risk to which the Group is theoretically exposed at 31 December 2016 is the carrying amount of financial assets including derivatives.
Analysis of financial assets by class and category at 31 December 2016:
AMORTISED COST LOANS AND
RECEIVABLES
FAIR VALUE
TOTAL AVAILABLE
FOR SALE AT FAIR VALUE THROUGH P&L
(CHF million) CARRYING
AMOUNT FAIR VALUE CARRYING
AMOUNT FAIR VALUE CARRYING
AMOUNT FAIR VALUE CARRYING
AMOUNT FAIR VALUE
Cash and cash equivalents 975 975 - - - - 975 975
Trade receivables 997 997 - - - - 997 997
Other receivables¹ 154 154 - - - - 154 154
Unbilled revenues 187 187 - - - - 187 187
Non-current loans or amounts receivable from 3rd parties
14 14 - - - - 14 14
Marketable securities - - 9 9 - - 9 9
Derivatives - - - - 3 3 3 3
TOTAL FINANCIAL ASSETS 2 327 2 327 9 9 3 3 2 339 2 339
1. Excluding VAT and other tax related items.
In the fair value hierarchy, marketable securities qualify as Level 1 and the remaining financial assets qualify as Level 2.
Analysis of financial assets by class and category at 31 December 2015:
AMORTISED COST LOANS AND
RECEIVABLES
FAIR VALUE
TOTAL AVAILABLE
FOR SALE AT FAIR VALUE THROUGH P&L
(CHF million) CARRYING
AMOUNT FAIR VALUE CARRYING
AMOUNT FAIR VALUE CARRYING
AMOUNT FAIR VALUE CARRYING
AMOUNT FAIR VALUE
Cash and cash equivalents 1 490 1 490 - - - - 1 490 1 490
Trade receivables 917 917 - - - - 917 917
Other receivables¹ 140 140 - - - - 140 140
Unbilled revenues 187 187 - - - - 187 187
Non-current loans or amounts receivable from 3rd parties
8 8 - - - - 8 8
Marketable securities - - 244 244 - - 244 244
Derivatives - - - - 22 22 22 22
TOTAL FINANCIAL ASSETS 2 742 2 742 244 244 22 22 3 008 3 008
1. Excluding VAT and other tax related items.
In the fair value hierarchy, marketable securities qualify as Level 1 and the remaining financial assets qualify as Level 2.
8. SGS GROUP RESULTS

175
LIQUIDITY RISK MANAGEMENT
The objective of the Group's liquidity and funding management is to ensure that all its foreseeable financial commitments can be met when due. Liquidity and funding are primarily managed by Group Treasury in accordance with practices and limits set in the risk management policies and objectives approved by the Board of Directors.
The nature of the Group’s business requires keeping a significant part of the cash reserves in the operating units.
Due to the significant cash position liquidity risk is limited. The Group has various committed and uncommitted bilateral credit facilities with its banks.
Analysis of financial liabilities by class and category at 31 December 2016:
AMORTISED COST OTHER LIABILITIES
FAIR VALUE
TOTAL AT FAIR VALUE THROUGH P&L
(CHF million) CARRYING
AMOUNT FAIR VALUE CARRYING
AMOUNT FAIR VALUE CARRYING
AMOUNT FAIR VALUE
Trade payables 300 300 - - 300 300
Other payables and financial liabilities¹ 189 189 - - 189 189
Advances from clients 31 31 - - 31 31
Loans and obligations under finance leases 1 719 1 811 - - 1 719 1 811
Derivatives - - 12 12 12 12
Bank overdrafts 1 1 - - 1 1
TOTAL FINANCIAL LIABILITIES 2 240 2 332 12 12 2 252 2 344
1. Excluding VAT and other tax related items.
In the fair value hierarchy, all financial liabilities qualify as Level 2.
Analysis of financial liabilities by class and category at 31 December 2015:
AMORTISED COST OTHER LIABILITIES
FAIR VALUE
TOTAL AT FAIR VALUE THROUGH P&L
(CHF million) CARRYING
AMOUNT FAIR VALUE CARRYING
AMOUNT FAIR VALUE CARRYING
AMOUNT FAIR VALUE
Trade payables 226 226 - - 226 226
Other payables and financial liabilities¹ 162 162 - - 162 162
Advances from clients 59 59 - - 59 59
Loans and obligations under finance leases 2 217 2 217 - - 2 217 2 217
Derivatives - - 20 20 20 20
Bank overdrafts 1 1 - - 1 1
TOTAL FINANCIAL LIABILITIES 2 665 2 665 20 20 2 685 2 685
1. Excluding VAT and other tax related items.
In the fair value hierarchy, all financial liabilities qualify as Level 2.

176
Contractual maturities of financial liabilities including interest payments at 31 December 2016:
(CHF million)
BORROWINGS 3RD PARTY LT AND ST
BANK OVERDRAFTS
AND OTHER LIABILITIES
GROSS SETTLED DERIVATIVE FINANCIAL
INSTRUMENTS OUTFLOWS
GROSS SETTLED DERIVATIVE FINANCIAL
INSTRUMENTS INFLOWS
TRADE PAYABLES
AND OTHERS FINANCE
LEASES TOTAL
On demand or within one year 31 8 1 116 (1 126) 446 - 475
Within the second year 29 11 - - 1 - 41
Within the third year 403 2 - - - 1 406
Within the fourth year 19 - - - - - 19
Within the fifth year 316 - - - - - 316
After five years 1 082 - - - - - 1 082
The Group hedges its foreign exchange exposure on a net basis. The net gross settled derivative financial instruments of CHF 10 million (2015: CHF 1 million) represents the net nominal value expressed in CHF of the Group's foreign currency contracts outstanding at 31 December 2016.
Contractual maturities of financial liabilities including interest payments at 31 December 2015:
(CHF million)
BORROWINGS 3RD PARTY LT AND ST
BANK OVERDRAFTS
AND OTHER LIABILITIES
GROSS SETTLED DERIVATIVE FINANCIAL
INSTRUMENTS OUTFLOWS
GROSS SETTLED DERIVATIVE FINANCIAL
INSTRUMENTS INFLOWS
TRADE PAYABLES
AND OTHERS FINANCE
LEASES TOTAL
On demand or within one year 531 10 1 472 (1 472) 374 - 915
Within the second year 29 6 - - 1 - 36
Within the third year 30 6 - - - - 36
Within the fourth year 402 - - - 1 - 403
Within the fifth year 19 - - - - - 19
After five years 1 403 - - - - - 1 403
SENSITIVITY ANALYSES
The estimated changes in the value of net foreign currency positions are based on an instantaneous 5% weakening of the Swiss Franc against all other currencies from the level applicable at 31 December 2016 and 2015, with all other variables remaining constant.
Sensitivity analysis at 31 December 2016 and 2015:
2016 2015
(CHF million) INCOME STATEMENT
IMPACT INCOME/(EXPENSE) EQUITY IMPACT
INCREASE/(DECREASE) INCOME STATEMENT
IMPACT INCOME/(EXPENSE) EQUITY IMPACT
INCREASE/(DECREASE)
US Dollar (USD) 3 9 - 9
Euro (EUR) (3) - (2) -
CFA Franc BEAC (XAF) 2 - 2 -
New Cedi (GHS) (1) - - -
Kwanza Angolais (AOA) - - 1 -
Taiwanese Dollar (TWD) - 1 - -
Australian Dollar (AUD) - 2 - 2
Canadian dollar (CAD) - 4 - 4
Brazilian Real (BRL) - 2 - 2
Colombian Peso (COP) - 1 - -
Chilean Peso (CLP) - 3 - 3
8. SGS GROUP RESULTS

177
INTEREST RATE RISK MANAGEMENT
The Group is exposed to fair value interest rate risk because the Group borrows funds at fixed interest rates. Where appropriate, the risk is managed by the Group by the use of Interest Rate Swap contracts. Hedging activities are evaluated regularly to align with interest rate views and defined risk appetite, ensuring the most cost-effective hedging strategies are applied.
If interest rates were 50 basis points higher/lower, the profit for the year ended 31 December 2016 would increase/decrease by CHF nil (2015: nil).
22. SHARE CAPITAL AND TREASURY SHARES
SHARES IN CIRCULATION TREASURY SHARES TOTAL SHARES ISSUEDTOTAL SHARE CAPITAL
(CHF MILLION)
BALANCE AT 1 JANUARY 2015 7 675 506 146 930 7 822 436 8
Treasury shares released into circulation 54 636 (54 636) - -
Treasury shares purchased for equity compensation plans
(45 778) 45 778 - -
Treasury shares purchased for cancellation
(78 904) 78 904 - -
BALANCE AT 31 DECEMBER 2015 7 605 460 216 976 7 822 436 8
Treasury shares released into circulation 49 162 (49 162) - -
Treasury shares purchased for equity compensation plans
(6 315) 6 315 - -
Treasury shares purchased for cancellation
(109 800) 109 800 - -
BALANCE AT 31 DECEMBER 2016 7 538 507 283 929 7 822 436 8
ISSUED SHARE CAPITAL
SGS SA has a share capital of CHF 7 822 436 (2015: CHF 7 822 436) fully paid in and divided into 7 822 436 (2015: 7 822 436) registered shares of a par value of CHF 1. All shares, other than own shares, participate equally in the dividends declared by the Company and have equal voting rights.
TREASURY SHARES
On 31 December 2016, SGS SA held 283 929 treasury shares. The shares purchased for cancellation are directly held by SGS SA, while the shares to cover the equity compensation plans are held by a subsidiary company.
In 2016, 49 162 treasury shares were sold to cover the equity compensation plans and 6 315 were purchased for an average price of CHF 2 127.
In 2015, the Group initiated a share buyback programme for a total of up to CHF 750 million. Up to CHF 500 million is designated for cancellation and the remainder for employee equity participation plans and/or for utilisation as underlying securities for potential issuances of convertible bonds. The programme started on 20 January 2015 and closed on 31 December 2016. As part of the share purchased for cancellation, 109 800 shares were purchased in 2016 for an average price of CHF 1 961.

178
AUTHORISED AND CONDITIONAL ISSUE OF SHARE CAPITAL
The Board has the authority to increase the share capital of SGS SA by a maximum of 500 000 registered shares of a par value of CHF 1 each, corresponding to a maximum increase of CHF 500 000 in share capital. The Board is mandated to issue the new shares at the market conditions at the time of issue. In the event that the new shares are issued for an acquisition, the Board is authorised to waive the shareholders’ preferential right of subscription or to allocate such subscription right to third parties. The authority delegated by the shareholders to the Board of Directors to increase the share capital is valid until 12 March 2017.
The shareholders have conditionally approved an increase of share capital in the amount of CHF 1 100 000, divided into 1 100 000 registered shares of a par value of CHF 1 each. This conditional share capital increase is intended to procure the necessary shares to satisfy employee equity participation plans and option or conversion rights to be incorporated in convertible bonds or similar equity-linked instruments that the Board is authorised to issue. The right to subscribe to such conditional capital is reserved for beneficiaries of employee equity participation plans and holders of convertible bonds or similar debt instruments and therefore excludes shareholders’ preferential rights of subscription. The Board is authorised to determine the timing and conditions of such issues, provided that they reflect prevailing market conditions. The term of exercise of the options or conversion rights may not exceed ten years from the date of issuance of the equity-linked instruments.
23. LOANS AND OBLIGATIONS UNDER FINANCE LEASES
RESTATEMENT OF PRIOR YEAR COMPARATIVES
Two bonds with a face value of CHF 492 million indicated in note 23 of the 2015 Annual Report were incorrectly disclosed as "Non-current" instead of "Current" loans and obligations under finance leases. As a result, the Non-current and Current part of loans & obligations under finance leases were respectively over and understated by CHF 491 million as at 31 December 2015. The restated 2015 balance sheet figures take into account these adjustments.
There is no impact on previously reported net debt, total liabilities or profit for the period.
CURRENT YEAR INFORMATION (CHF million) 2016 2015 RESTATED
Bank loans 2 4
Bank overdrafts 1 1
Corporate bonds 1 716 2 211
Finance lease obligations 1 1
TOTAL 1 720 2 217
Current 1 494
Non-current 1 719 1 723
Depending on the nature of the loan, currency and date of maturity, interest rates on long-term loans from third parties range between 0.875% and 5.75% and on short-term loans from third parties range between 0% and 8.75%.
The loans from third parties exposed to fair value interest rate risk amounted to CHF 1 718 million (2015: CHF 2 215 million) and the loans from third parties exposed to cash flow interest rate risk amounted to CHF 1 million (2015: CHF 0.5 million).
The fair value of corporate bonds was CHF 1 808 million (2015: CHF 2 312 million). In 2016, a corporate bond of CHF 492 million was reimbursed.
8. SGS GROUP RESULTS

179
SGS SA issued the following corporate bonds listed on the SIX Swiss Exchange:
DATE OF ISSUEFACE VALUE IN
CHF MILLION COUPON IN %YEAR OF
MATURITYISSUE
PRICE IN %REDEMPTION
PRICE IN %
08.03.2011 375 2.625 2019 100.832 100.000
27.05.2011 275 3.000 2021 100.480 100.000
27.02.2014 138 1.375 2022 100.517 100.000
27.02.2014 250 1.750 2024 101.019 100.000
25.04.2014 112 1.375 2022 101.533 100.000
08.05.2015 325 0.250 2023 100.079 100.000
08.05.2015 225 0.875 2030 100.245 100.000
Loans and finance lease obligations mature as follows:
BANK LOANS, OVERDRAFTS AND CORPORATE BONDS FINANCE LEASE OBLIGATIONS
(CHF million) 2016 2015 2016 2015
On demand or within one year 1 494 - 1
Within the second year - - - -
Within the third year 375 1 1 -
Within the fourth year - 373 - -
Within the fifth year 297 - - -
After five years 1 046 1 348 - -
TOTAL 1 719 2 216 1 1
The currency composition of loans and finance lease obligations is as follows:
BANK LOANS, OVERDRAFTS AND CORPORATE BONDS FINANCE LEASE OBLIGATIONS
(CHF million) 2016 2015 2016 2015
Swiss Franc (CHF) 1 716 2 212 - -
Euro (EUR) 1 1 - -
US Dollar (USD) - 1 - -
Malagasy Ariary (MGA) 1 1 - -
Other 1 1 1 1
TOTAL 1 719 2 216 1 1

180
24. DEFINED BENEFIT OBLIGATIONS
The Group mainly operates defined benefit pension plans in Switzerland, the United States of America, the United Kingdom, the Netherlands, Germany, Italy, France, Korea and Taiwan. Contributions to most plans are paid to pension funds that are legally separate entities.
The Group also operates post-employment benefit plans, principally healthcare plans, in the United States of America and Switzerland. They represent a defined benefit obligation at 31 December 2016 of CHF 14 million (2015: CHF 14 million). The method of accounting and the frequency of valuation are similar to those used for defined benefit pension plans. Healthcare cost trend assumptions do not have a significant effect on the amounts recognised in the income statement.
In 2015, following changes in its status, an entity previously recognised as a subsidiary was qualified as a defined benefit plan (employer fund) in Switzerland. Before the change in status, the Group decided to transfer funds in order to improve the structure of the assets in the United States of America and the United Kingdom.
The Group's material defined benefit plans are in Switzerland, the United States of America and the United Kingdom.
SWITZERLAND
The Group jointly operates with the employees a retirement foundation in Switzerland. The assets and liabilities of the retirement foundation are held separately from the Group. The foundation board is equally composed of representatives of the employees and representatives of the employer. This foundation covers all the employees in Switzerland and provides benefits on a defined contribution basis.
Each employee has a retirement account to which the employee and the Group contribute at a rate set out in the foundation rules based on a percentage of salary. Every year, the foundation decides the level of interest, if any, to apply to retirement accounts based on the agreed policy. At retirement, employees can elect either to withdraw all or part of the balance of their retirement account or to convert it into annuities at pre-defined conversion rates.
As the foundation board is expected to eventually pay out all of the foundation’s assets as benefits to employees and former employees, no surplus is deemed to be recoverable by the Group. Similarly, unless the assets are insufficient to cover minimum benefits, the Group does not expect to make any deficit contribution to the foundation.
According to IFRS, the foundation has to be classified as a defined benefit plan due to underlying benefit guarantees and has to be accounted for on this basis.
The Group also operates an employer fund. The assets are held separately from the Group. This foundation has unilateral power to provide benefits and consequently has no obligations. Therefore, this foundation has no pension liabilities.
The weighted average duration of the expected benefit payment is approximately 16 years.
The Group expects to contribute CHF 7 million to this plan in 2017.
UNITED STATES OF AMERICA
The Group operates a non-contributory defined benefit plan, which is subject to the provisions of the Employee Retirement Income Security Act (ERISA).
The assets of the plan are held separately from the Group by the trustee-custodian and the plan’s third-party pension administrator who disburses payments directly to retirees or beneficiaries under the plan. Both the trustee-custodian and the administrator ensure adherence to ERISA rules.
Funding valuations are calculated on an actuarial basis and contributions are made as necessary. The funding target is to provide the plan with sufficient assets to meet future plan obligations.
Effective 16 March 2004, non-exempt participants ceased accruing any additional benefits; only exempt employees of certain SGS business units in the United States of America are eligible for annual benefit accrual. In addition, the pension benefit was changed and is defined as a percentage of the current year’s pensionable compensation; the cost of additional benefit accrual is evaluated annually. The Group reserves the right to make future changes to the benefit accrual structure of the plan.
Eligible employees become participants in the plan after the completion of one year of service and after reaching the age of 21. Participants become fully vested in the plan after five years of service.
The weighted average of duration of the expected benefit payment is approximately 13 years.
The Group expects to contribute CHF 9 million to this plan in 2017.
8. SGS GROUP RESULTS

181
UNITED KINGDOM
The Group operates two defined benefit plans through a trust. The assets of the plans are held separately from the Group and have trustees who ensure the plan’s rules are strictly adhered to. One plan has been closed to new entrants since 2002. Since then new employees have been offered membership of defined contributions plans, which have been operated by the Group. The other plan has no active members. Under the defined benefit plans, each member’s pension at retirement is related to their pensionable service and final salary.
Funding valuations of the defined benefit plans are carried out and agreed between the Group and the plan trustees at least once every three years. The funding target is for the plans to hold assets equal in value to the accrued benefits based on projected salaries. As part of the valuation process, if there is a shortfall against this target, then the Group and trustees will agree on deficit contributions to meet this deficit over a specified period.
There is a risk to the Group that adverse experience could lead to a requirement for the Group to make additional contributions to recover any deficit that arises.
The weighted average of duration of the expected benefit payments from the combined plans is approximately 22 years.
The Group expects to contribute CHF 1 million to this plan in 2017.
OTHER COUNTRIES
The Group sponsors defined retirement benefits plans in other countries where the Group operates. No individual countries other than those described above are considered material and need to be separately disclosed.
The Group expects to contribute CHF 8 million to those plans in 2017.
The assets and liabilities recognised in the balance sheet at 31 December for defined benefit obligations and for post-employment benefit plans are as follows:
(CHF million) CH UK USA OTHER TOTAL
2016
Fair value of plan assets 384 232 231 39 886
Present value of funded defined benefit obligation (374) (215) (254) (66) (909)
FUNDED/(UNFUNDED) STATUS 10 17 (23) (27) (23)
Present value of unfunded defined benefit obligation (10) - (8) (53) (71)
NET ASSET/(LIABILITY) AT 31 DECEMBER - 17 (31) (80) (94)
(CHF million) CH UK USA OTHER TOTAL
2015
Fair value of plan assets 373 241 214 84 912
Present value of funded defined benefit obligation (390) (198) (242) (109) (939)
FUNDED/(UNFUNDED) STATUS (17) 43 (28) (25) (27)
Present value of unfunded defined benefit obligation (10) - (8) (49) (67)
NET ASSET/(LIABILITY) AT 31 DECEMBER (27) 43 (36) (74) (94)
The net liability of CHF 94 million (2015: CHF 94 million) includes CHF 60 million (2015: CHF 87 million) of pension fund assets recognised in the item Other Non-Current Assets in note 13 and CHF 154 million (2015: CHF 181 million) of pension fund liability recognised in the item Defined Benefit Obligation in the balance sheet.

182
Amounts recognised in the income statement:
(CHF million) CH UK USA OTHER TOTAL
2016
Service cost expense 9 1 2 5 17
Net interest expense on defined benefit plan - (2) 1 2 1
Administrative expenses - 1 1 - 2
TOTAL EXPENSE DUE TO DEFINED BENEFIT OBLIGATION AT 31 DECEMBER
9 - 4 7 20
Expense charged in:
Salaries and wages 9 2 3 5 19
Financial expense - (2) 1 2 1
TOTAL EXPENSE DUE TO DEFINED BENEFIT OBLIGATION AT 31 DECEMBER
9 - 4 7 20
(CHF million) CH UK USA OTHER TOTAL
2015
Service cost expense 8 2 (2) 4 12
Net interest expense on defined benefit plan - (1) 1 2 2
Administrative expenses - 1 1 - 2
TOTAL EXPENSE DUE TO DEFINED BENEFIT OBLIGATION AT 31 DECEMBER
8 2 - 6 16
Expense charged in:
Salaries and wages 8 3 (1) 4 14
Financial expense - (1) 1 2 2
TOTAL EXPENSE DUE TO DEFINED BENEFIT OBLIGATION AT 31 DECEMBER
8 2 - 6 16
Amounts recognised in the statement of other comprehensive income:
(CHF million) CH UK USA OTHER TOTAL
2016
Remeasurement on net defined benefit liability
Change in demographic assumptions (11) - (4) - (15)
Change in financial assumptions (1) 48 8 7 62
Experience adjustments on benefit obligations (4) - 4 - -
Actual return on plan assets excluding net interest expense (13) (25) (7) 1 (44)
TOTAL RECOGNISED IN THE STATEMENT OF OTHER COMPREHENSIVE INCOME AT 31 DECEMBER
(29) 23 1 8 3
8. SGS GROUP RESULTS

183
(CHF million) CH UK USA OTHER TOTAL
2015
Remeasurement on net defined benefit liability
Change in demographic assumptions - - 15 1 16
Change in financial assumptions 11 (13) (7) - (9)
Experience adjustments on benefit obligations 6 - (4) - 2
Actual return on plan assets excluding net interest expense 5 9 17 - 31
TOTAL RECOGNISED IN THE STATEMENT OF OTHER COMPREHENSIVE INCOME AT 31 DECEMBER
22 (4) 21 1 40
Movements in the net asset/(liability) during the period:
(CHF million) CH UK USA OTHER TOTAL
2016
NET ASSET/(LIABILITY) AT 1 JANUARY (27) 43 (36) (74) (94)
Expense recognised in the income statement (9) - (4) (7) (20)
Remeasurements recognised in other comprehensive income 29 (23) (1) (8) (3)
Contributions paid by the Group 7 1 11 10 29
Employer benefit payments - - - 1 1
Exchange differences - (4) (1) (2) (7)
NET ASSET/(LIABILITY) AT 31 DECEMBER - 17 (31) (80) (94)
(CHF million) CH UK USA OTHER TOTAL
2015
NET ASSET/(LIABILITY) AT 1 JANUARY (47) 17 (58) (88) (176)
Expense recognised in the income statement (8) (2) - (6) (16)
Remeasurements recognised in other comprehensive income (22) 4 (21) (1) (40)
Contributions paid by the Group 7 5 3 11 26
Special pension fund contribution 43 20 40 - 103
Exchange differences - (1) - 10 9
NET ASSET/(LIABILITY) AT 31 DECEMBER (27) 43 (36) (74) (94)

184
Change in the defined benefit obligation is as follows:
(CHF million) CH UK USA OTHER TOTAL
2016
Opening present value of the defined benefit obligation 400 198 250 158 1 006
Current service cost 9 1 2 5 17
Interest cost 4 6 10 3 23
Plan participants’ contributions 5 - 1 - 6
Settlements - - (2) (54) (56)
Net increase/(decrease) in DBO from acquisitions/disposals - - - 1 1
Actual net benefit payments (18) (7) (16) (6) (47)
(Gains)/losses due to changes in demographic assumptions (11) - (4) - (15)
(Gains)/losses due to changes in financial assumptions (1) 48 8 7 62
Experience differences (4) - 4 - -
Exchange rate (gains)/losses - (31) 9 5 (17)
DEFINED BENEFIT OBLIGATION AT 31 DECEMBER 384 215 262 119 980
(CHF million) CH UK USA OTHER TOTAL
2015
Opening present value of the defined benefit obligation 379 218 293 174 1 064
Current service cost 8 2 3 4 17
Interest cost 5 7 11 4 27
Plan participants’ contributions 5 1 1 (1) 6
Settlements - - (47) (1) (48)
Actual net benefit payments (14) (8) (15) (6) (43)
(Gains)/losses due to changes in demographic assumptions - - 15 1 16
(Gains)/losses due to changes in financial assumptions 11 (13) (7) - (9)
Experience differences 6 - (4) - 2
Exchange rate (gains)/losses - (9) - (17) (26)
DEFINED BENEFIT OBLIGATION AT 31 DECEMBER 400 198 250 158 1 006
8. SGS GROUP RESULTS

185
Change in fair value of plan assets is as follows:
(CHF million) CH UK USA OTHER TOTAL
2016
Opening fair value of plan assets 373 241 214 84 912
Interest income on plan assets 4 8 9 1 22
Return on plan assets excluding amounts included in net interest expense
13 25 7 (1) 44
Actual employer contributions 7 1 11 11 30
Actual plan participants’ contributions 5 - 1 - 6
Actual net benefit payments (18) (7) (16) (6) (47)
Actual admin expenses paid - (1) (1) - (2)
Settlements - - (2) (54) (56)
Net increase/(decrease) in assets from acquisitions - - - 1 1
Exchange differences - (35) 8 3 (24)
FAIR VALUE OF PLAN ASSETS AT 31 DECEMBER 384 232 231 39 886
(CHF million) CH UK USA OTHER TOTAL
2015
Opening fair value of plan assets 332 235 235 86 888
Interest income on plan assets 5 8 10 2 25
Return on plan assets excluding amounts included in net interest expense
(5) (9) (17) - (31)
Actual employer contributions 7 5 3 11 26
Pension funds special contribution 43 20 40 - 103
Actual plan participants’ contributions 5 1 1 (1) 6
Actual net benefit payments (14) (8) (15) (6) (43)
Actual admin expenses paid - (1) (1) - (2)
Settlements - - (42) (1) (43)
Exchange differences - (10) - (7) (17)
FAIR VALUE OF PLAN ASSETS AT 31 DECEMBER 373 241 214 84 912
There are no reimbursement rights included in plan assets. The actual return on plan assets was a gain of CHF 66 million (2015: loss of CHF 6 million).

186
The major categories of plan assets at the balance sheet date are as follows:
(CHF million) CH UK USA OTHER TOTAL
2016
Cash and cash equivalents 79 1 1 16 97
Equity securities 105 47 73 3 228
Debt securities 57 83 157 1 298
Assets held by insurance company - 17 - 18 35
Property 121 - - - 121
Investment funds 22 84 - - 106
Other - - - 1 1
TOTAL PLAN ASSETS AT 31 DECEMBER 384 232 231 39 886
(CHF million) CH UK USA OTHER TOTAL
2015
Cash and cash equivalents 88 4 1 11 104
Equity securities 91 47 71 2 211
Debt securities 58 91 142 1 292
Assets held by insurance company - 17 - 70 87
Property 116 - - - 116
Investment funds 20 81 - - 101
Other - 1 - - 1
TOTAL PLAN ASSETS AT 31 DECEMBER 373 241 214 84 912
In 2016 and 2015, the Group did not occupy any property that was included in the plan assets.
The property is rented at fair market rental rates. There are no SGS SA shares or any other financial securities used by the Group included in plan assets.
The plan assets are primarily held within instruments with quoted market prices in an active market, with the exception of the property and insurance policy holdings.
The investment strategy in Switzerland is to invest, within the statutory and legal requirements, in a diversified portfolio with the aim of generating long-term returns, which will enable the Board of the foundation to grow the accounts of the members of the pension fund, whilst taking on the lowest possible risk in order to do so.
In the United States of America, the Pension Plan Target Policy is determined by both quantitatively and qualitatively assessing the risk tolerance level and return requirements of the Plan as determined by the Investment Committee. The investment portfolio asset allocation and structure are developed based on the results of this process. In the United Kingdom, the Trustees review the investment strategy of the Scheme and the Plan on a regular basis in order to ensure that they remain appropriate. The last review for both the Scheme and Plan has recently been undertaken and is in the process of being implemented.
8. SGS GROUP RESULTS

187
Actuarial assumptions vary according to local prevailing economic and social conditions. The principal weighted average actuarial assumptions used in determining the cost of benefits for both 2016 and 2015 are as follows:
(Weighted average %) CH UK USA OTHER
2016
Discount rate 0.7 2.9 4.0 2.0
Mortality assumption LPP 2015
Proposed CMI SNA02 CMI
2015 Scale RP 2014
SSA MP 2016 -
Salary progression rate 1.5 3.8 3.3 2.8
Future increase for pension in payments 0.2 3.5 - 0.6
Healthcare cost trend assumed for the next year 3.0 - 6.6 -
Ultimate trend rate 3.0 - 5.0 -
Year that the rate reaches the ultimate trend rate - - 2022 -
(Weighted average %) CH UK USA OTHER
2015
Discount rate 0.9 3.9 4.3 2.5
Mortality assumption LPP 2010
Generational SNA02 CMI
2015 Scale RP 2014
SSA -
Salary progression rate 2.0 3.5 3.3 2.4
Future increase for pension in payments 0.3 3.2 - 0.4
Healthcare cost trend assumed for the next year 3.0 2.0 6.9 -
Ultimate trend rate 3.0 - 5.0 -
Year that the rate reaches the ultimate trend rate - - 2022 -
The weighted average rate for each assumption used to measure the benefits obligation is also shown. The assumptions used to determine end-of-year benefits obligation are also used to calculate the following year’s cost.
In Switzerland, a decrease in the discount rate of 0.5% per annum would, all other things being equal, increase the obligation by CHF 30 million; a 0.5% increase in assumed salary increases would increase the obligation by CHF 2 million; and a one-year increase in members’ life expectancy would increase the obligation by approximately CHF 12 million.
In the United States of America, a decrease in the discount rate of 0.5% per annum would, all other things being equal, increase the obligation by CHF 17 million; a 0.5% increase in assumed salary increases would not impact the obligation and a one-year increase in members’ life expectancy would increase the obligation by approximately CHF 10 million.
In the United Kingdom, a decrease in the discount rate of 0.5% per annum would, all other things being equal, increase the obligation by CHF 24 million; a 0.5% increase in assumed salary increases would increase the obligation; by CHF 3 million; and a one-year increase in members’ life expectancy would increase the obligation by approximately CHF 7 million.
These sensitivities have been calculated to show the movement in the defined benefit obligation in isolation and assume no other changes in market conditions at the accounting date. This is unlikely in practice; for example, a change in discount rate is unlikely to occur without any movement in the value of the assets held by the plans.
The amount recognised as an expense in respect of defined contribution plans during 2016 was CHF 67 million (2015: CHF 69 million).

188
25. PROVISIONS
(CHF million)
LEGAL AND WARRANTY CLAIMS ON SERVICES
RENDERED DEMOBILISATION AND
REORGANISATION OTHER PROVISIONS TOTAL
AT 1 JANUARY 2016 42 34 40 116
Acquisitions of subsidiaries - - 2 2
Charge to income statement 19 67 9 95
Release to income statement (19) (4) (8) (31)
Payments (4) (65) (7) (76)
Exchange differences 1 1 4 6
AT 31 DECEMBER 2016 39 33 40 112
Analysed as: 2 016 2 015
Current liabilities 19 19
Non-current liabilities 93 97
TOTAL 112 116
A number of Group companies are subject to litigation and other claims arising out of the normal conduct of their business that can be best viewed as claims on services rendered. The claim provision represents the sum of estimates of amounts payable on identified claims and of losses incurred but not yet reported. They therefore reflect estimates of the future payments required to settle both reported and unreported claims.
The process of estimation is complex, dealing with uncertainty, requiring the use of informed estimates, actuarial assessment, evaluation of the insurance cover where appropriate and the judgement of Management. Any changes in these estimates are reflected in the income statement in the period in which the estimates change.
The timing of cash outflows from pending litigation and claims is uncertain since it depends, in the majority of cases, on the outcome of administrative and legal proceedings. The Group does not discount its provisions, as the timing of the cash outflows cannot be reasonably and reliably determined.
In the opinion of Management, based on all currently available information, the provisions adequately reflect the Group's exposure to legal and warranty claims on services rendered. The ultimate outcome of these matters is not expected to materially affect the Group’s financial position, results of operations or cash flows.
For specific long-term contracts, typically with two to five years’ duration, the Group is required to dismantle infrastructure and terminate the services of personnel upon completion of the contract. These demobilisation costs are provided for during the life of the contract. Experience has shown that these contracts may be either extended or terminated earlier than expected. The timing of these demobilisation outflows is difficult to assess. The amounts are therefore not discounted.
Other provisions relate to various present legal or constructive obligations of the Group toward third parties, such as termination payments to employees upon leaving the Group, which in some jurisdictions are a legal obligation.
8. SGS GROUP RESULTS

189
26. TRADE AND OTHER PAYABLES
(CHF million) 2016 2015
Trade payables 300 226
Other payables 319 275
Other financial liabilities 22 25
TOTAL 641 526
Trade accounts and other payables principally comprise amounts outstanding for trade purchases and ongoing operating costs. At 31 December 2016 and 2015, the fair value of the Group’s trade accounts and other payables approximates the carrying value.
27. OTHER CREDITORS AND ACCRUALS
(CHF million) 2016 2015
Accrued expenses 562 521
Advance billings 56 54
Advances from clients 31 59
Derivative liabilities 12 20
TOTAL 661 654
At 31 December 2016 and 2015, the fair value of the Group’s other creditors and accruals approximates the carrying value.
28. CONTINGENT LIABILITIES
In the normal course of business, the Group and its subsidiaries are parties to various lawsuits and claims. Management does not expect that the outcome of any of these legal proceedings will have a material adverse effect on the Group’s financial position, results of operations or cash flows.
29. GUARANTEES
(CHF million) 2016 ISSUED 2015 ISSUED
Guarantees 99 130
Performance bonds 217 204
TOTAL 316 334
The Group has issued unconditional guarantees to certain financial institutions that have provided credit facilities (loans and guaranteed bonds) to its subsidiaries. In addition, it has issued performance bonds and bid bonds to commercial customers on behalf of its subsidiaries. Management believes the likelihood that a material payment will be required under these guarantees is remote.

190
30. OPERATING LEASES
Operating lease rentals are payable as follows:
(CHF million) 2016 2015
Less than one year 124 124
Between one and five years 266 254
More than five years 72 72
TOTAL 462 450
The Group leases the majority of its office and laboratory space and vehicles. During the year ended 31 December 2016, CHF 134 million was recognised as an expense in the income statement in respect of operating leases (2015: CHF 149 million).
31. EQUITY COMPENSATION PLANS
Selected employees of the SGS Group are eligible to participate in equity compensation plans.
i) Grants to Members of the Operations Council
In 2016, a total of 1 315 Restricted Shares were granted to the members of the Operations Council, in settlement of 50% of the annual incentive related to the 2015 performance. The Restricted Shares fully vest at grant date and are blocked for a period of three years from the grant date, until April 2019. The fair market value at grant date of the Restricted Shares granted, being defined as the average closing price of the share during a 20-day period following the payment of the dividends after the 2016 Annual General Meeting, was CHF 2 703 180.
50% of the annual incentive related to the 2016 performance will be settled in Restricted Shares. The grant of the Restricted Shares will be done after the 2017 Annual General Meeting; The total number of Restricted Shares to be granted will be calculated based on the average closing price of the share during a 20-day period following the payment of the dividends after the 2017 Annual General Meeting. The Restricted Shares will fully vest at grant date and will be blocked for a period of three years from the grant date, until April 2020. Shareholding guidelines apply to the Restricted Share Plans.
ii) Grants to Other Employees
In 2016, a total of 2 473 Restricted Share Units were granted to selected key employees under the framework of the Restricted Share Units Plan 2016. The Restricted Share Units vest in three stages: one-third at grant; one-third 18 months after the grant date, and one-third 36 months after the grant date. The fair market value at grant date of the Restricted Share Units granted, being defined as the average closing price of the share during a 20-day period preceding the grant date, was CHF 4 968 504.
iii) Long-Term Incentive Plans (LTI)
In 2016, a total of 149 Performance Share Units of the 2015 Long-Term Incentive Plan were granted to selected employees (not members of the Operations Council). Additional information is disclosed in the SGS Remuneration Report (pages 126 to 142).
8. SGS GROUP RESULTS

191
OPTION PLAN
EXERCISE PERIOD
DESCRIPTION FROM TOSTRIKE PRICE1
OPTIONS OUTSTANDING AT
31 DECEMBER 2015 GRANTED CANCELLED EXERCISED
OR ADJUSTED
OPTIONS OUTSTANDING AT
31 DECEMBER 2016
SGSMF-2011 Jan.14 Jan.16 1 528.78 206 662 - (40 996) (165 666) -
SGSMF-2011 LTI Jan.15 Jan.16 1 528.78 66 000 - (66 000) - -
SGSKF-2012 Jan.15 Jan.17 1 448.85 1 444 280 - (122 741) (1 176 218) 145 321
SGSWS-2013 Jan.16 Jan.18 1 989.31 3 061 736 - - (1 706 690) 1 355 046
SGSPF-2014 Jan.17 Jan.19 2 059.00 2 990 399 - (39 996) - 2 950 403
SGSBB-2015 Jan.18 Jan.20 1 798.00 1 482 124 - (35 176) - 1 446 948
TOTAL 9 251 201 - (304 909) (3 048 574) 5 897 718
Of which exercisable at 31 December 1 606 201 1 500 367
1. The strike price of the options has been adjusted in accordance with market practice for capital reductions and special dividends.
PERFORMANCE SHARE UNIT (PSU) AND RESTRICTED SHARE UNIT (RSU) PLANS
DESCRIPTION
EXERCISE PERIOD
FROM
SHARES OUTSTANDING AT
31 DECEMBER 2015 GRANTED CANCELLED VESTED OR ADJUSTED
SHARES OUTSTANDING AT
31 DECEMBER 2016
SGS-PSU-15 Jan.18 39 186 149 (1 338) - 37 997
SGS-RSU-16 Jan.19 - 2 473 (50) (815) 1 608
TOTAL 39 186 2 622 (1 388) (815) 39 605
The Group does not issue new shares to grant to employees in relation to the equity-based compensation plans but uses treasury shares, acquired through share buyback programmes.
In total as of 31 December 2016, the equity overhang, defined as the total number of share units, restricted shares and shares underlying options outstanding divided by the total number of outstanding shares (7 822 436 shares) amounted to 98 792 units, representing 1.26%.
The Company’s burn rate, defined as the number of equities (restricted shares and share units) granted in 2016 (3 937 units) divided by the total number of outstanding shares, was 0.05%.
The Group recognised during the year total expense of CHF 16 million (2015: CHF 9 million) in relation to equity compensation plans.
Shares available for future plans: TOTAL
AT 1 JANUARY 2015 (20 635)
Repurchased shares 45 778
Options granted (SGSBB Plan and adjustments) (16 000)
Options cancelled 6 120
SGS-PSU-15 plan (39 186)
AT 31 DECEMBER 2015 (23 923)
Purchased shares 5 029
Granted SGS-PSU-15 plan (149)
Granted SGS-RSU-16 plan (2 473)
Options cancelled 752
PSU cancelled 1 338
RSU cancelled 50
AT 31 DECEMBER 2016 (19 376)

192
At 31 December, the Group had the following shares available to satisfy various programmes:
2016 TOTAL 2015 TOTAL
Number of shares held 95 225 138 072
Shares allocated to 2011 option plans - (21 392)
Shares allocated to 2012 option plans - (25 669)
Shares allocated to 2013 option plans (31 004) (31 004)
Shares allocated to 2014 option plans (29 523) (29 923)
Shares allocated to 2015 option plans (14 469) (14 821)
Shares allocated for 2015 PSU plans (37 997) (39 186)
Shares allocated for 2016 RSU plans (1 608)
SHARES (REQUIRED)/AVAILABLE FOR FUTURE OPTION PLANS AT 31 DECEMBER 2016 (19 376) (23 923)
For the equity compensation plans, the Group has entered into agreements with various banks, whereby the Group has an obligation to offer to sell to the banks the shares underlying the option programme at the relevant strike price whenever these shares become unblocked. The banks are not obliged to purchase these shares.
32. RELATED-PARTY TRANSACTIONS
Transactions between the Company and its subsidiaries, which are related parties of the Group, have been eliminated on consolidation and are not disclosed.
COMPENSATION TO DIRECTORS AND MEMBERS OF THE OPERATIONS COUNCIL
The remuneration of Directors and members of the Operations Council during the year was as follows:
(CHF million) 2016 2015
Short-term benefits 14 17
Post-employment benefits 1 1
Share-based payments1 2 16
TOTAL 17 34
1. 2016 represents the market value of Restricted Shares granted in 2016 while 2015 represents the market value of SGSBB options and PSUs granted in 2015.
The remuneration of Directors and members of the Operations Council is determined by the Nomination and Remuneration Committee. Additional information is disclosed in the SGS Remuneration Report (pages 126 to 142).
During 2016 and 2015, no member of the Board of Directors or of the Operations Council had a personal interest in any business transactions of the Group.
The Operations Council (including Senior Management) participate in the equity compensation plans as disclosed in note 31.
In 2016, Directors’ fees were CHF 2 123 000 (2015: CHF 2 091 000).
The total compensation (cash and shares/options) received by the Operations Council (including Senior Management) amounted to CHF 15 249 000 (2015: CHF 31 886 000).
Disclosure of compensation paid to the Board of Directors and Senior Management, as required by Swiss law, is presented in the notes to the accounts of SGS SA on pages 207 to 208 of this report.
8. SGS GROUP RESULTS
-

193
LOANS TO MEMBERS OF GOVERNING BODIES
As at 31 December 2016, two members of the Operations Council have received loans for a combined amount equivalent to CHF 28 365 (no loan, credit or outstanding advance was due to the Company from members of its governing bodies in the prior year).
TRANSACTIONS WITH OTHER RELATED PARTIES
In 2016 and 2015, the Group did not perform any activity generating revenue for the other related parties. During the same period, neither related trade receivable balances unpaid nor expenses in respect of any bad or doubtful debts due from these related parties were recognised.
33. SIGNIFICANT SHAREHOLDERS
As at 31 December 2016, Groupe Bruxelles Lambert acting through Serena SARL held 16.20% (2015: 15.00%). Mr. August von Finck and members of his family acting in concert held 15.03% (2015: 15.03%), the Bank of New York Mellon Corporation held 3.35% (2015: 3.35%), BlackRock, Inc. held 3.03% (2015: 3.03%) and MFS Investment Management held 3.01% (2015: 3.01%) of the share capital and voting rights of the Company.
At the same date, SGS Group held 3.63% of the share capital of the Company (2015: 2.77%).
34. APPROVAL OF FINANCIAL STATEMENTS AND SUBSEQUENT EVENTS
The Board of Directors is responsible for the preparation and presentation of the financial statements. These financial statements were authorised for issue by the Board of Directors on 9 February 2017, and will be submitted for approval by the Annual General Meeting of Shareholders to be held on 21 March 2017.
On 3 January 2017, the Group announced the acquisition of 100% of Laboratoire LCA, offering analytical services, including soil fertility testing, to the agricultural sector in Morocco.
On 5 January 2017, the Group announced the acquisition of 100% of BF Machinery Pty Ltd and CBF Engineering Pty Ltd, providing testing, repair, engineering and maintenance services for pumps, valves, hydraulics and plastics systems in Australia.
On 30 January 2017, the Group announced the issuance of nine-year CHF 375 million straight bond with a coupon of 0.55 percent.

194
STATUTORY AUDITOR’S REPORT
To the General Meeting of
SGS SA, GENEVA
REPORT ON THE AUDIT OF THE CONSOLIDATED FINANCIAL STATEMENTS
Opinion
We have audited the consolidated financial statements of SGS SA and its subsidiaries (the Group), which comprise the consolidated balance sheet as at 31 December 2016, and the consolidated income statement, consolidated statement of comprehensive income, consolidated statement of cash flows, consolidated statement of changes in equity and notes to the consolidated financial statements for the year then ended.
In our opinion the consolidated financial statements (presented on pages 146 to 193) give a true and fair view of the consolidated financial position of the Group as at 31 December 2016, its consolidated financial performance and its consolidated cash flows for the year then ended in accordance with International Financial Reporting Standards (IFRS) and comply with Swiss law.
Basis for Opinion
We conducted our audit in accordance with Swiss law, International Standards on Auditing (ISAs) and Swiss Auditing Standards. Our responsibilities under those provisions and standards are further described in the Auditor’s Responsibilities for the Audit of the Consolidated Financial Statements section of our report. We are independent of the Group in accordance with the provisions of Swiss law and the requirements of the Swiss audit profession, as well as the IESBA Code of Ethics for Professional Accountants, and we have fulfilled our other ethical responsibilities in accordance with these requirements.
We believe that the audit evidence we have obtained is sufficient and appropriate to provide a basis for our opinion.
A Summary of our Audit Approach
AUDIT SCOPE
• We scoped our audit of component operations based on the significance of account balances and significant risks
• We gained sufficient and appropriate coverage across the Group
• Coverage details are provided on page 198
GROUP MATERIALITY
CHF 56 MILLION
7% OF PROFIT BEFORE TAX
(ADJUSTED FOR CERTAIN
NON-RECURRING ITEMS)
KEY AUDIT MATTERS
• Revenue recognition in respect of unbilled revenue and work-in-progress
• Goodwill and associated impairment testing
• Current and deferred income tax balances
• Retirement benefit obligations
Key Audit Matters
Key audit matters are those matters that, in our professional judgment, were of most significance in our audit of the consolidated financial statements of the current period. These matters were addressed in the context of our audit of the consolidated financial statements as a whole, and in forming our opinion thereon, and we do not provide a separate opinion on these matters.
195
KEY AUDIT MATTER HOW THE SCOPE OF OUR AUDIT RESPONDED TO THE KEY AUDIT MATTER
REVENUE RECOGNITION IN RESPECT OF UNBILLED REVENUE AND WORK-IN-PROGRESS
The Group recognises revenue on fees for services rendered to third parties when the services have been completed. However, in certain circumstances, including where services are not billed at the end of each financial period, revenue is recognised in proportion to the stage of completion, normally by reference to costs incurred to the balance sheet date in comparison with the total estimated costs of the contracted services to completion. Where services are completed, but unbilled, revenue is recorded at net selling price with a margin on cost incurred. Where services are incomplete, no margin is recognised and the costs incurred are included in work-in-progress.
At 31 December 2016, the Group balance sheet included unbilled revenues of CHF 187 million or 3.12% of total Group revenues of CHF 5 985 million. In addition work-in-progress amounted to CHF 62 million.
Significant judgement is required by Management at operational level in certain cases to estimate the value of revenue and profit that should be recognised prior to the year-end, which is highly dependent on the nature and complexity of the services being provided and the contractual terms with customers. The incremental revenue and profit recognised at period-end is also included in the determination of management incentives, increasing the risk of inappropriate estimation. Accordingly the estimation of work-in-progress and unbilled revenues is considered to be an area of focus for the Audit Committee (see page 122) and a key audit matter.
Refer to the accounting policy in note 2 and additionally note 14.
Our audit during the year included the following procedures on work-in-progress and unbilled revenues:
• In all component locations we discussed with Management the adequate implementation of Group policies and controls regarding revenue recognition and the approval of unbilled revenue balances;
• We tested a sample of unbilled revenue balances recorded at the prior year-end to subsequent invoices and recoveries from third-party clients in order to identify any locations that had over-estimated historic revenues.
At year end, our audit work consisted of:
• We used audit analytics to identify businesses and geographies across the Group, which had recorded significant work-in-progress and unbilled balances at the year-end compared to recurring monthly revenue levels and prior year-end balances, and challenged local management by tracing to contract and status reports to verify significant variances;
• We tested a sample of work-in-progress and unbilled balances to the related customer contracts and appropriate operational evidence to confirm that the services had been completed prior to the year-end; and
• We also considered the adequacy of the disclosures in the consolidated financial statements.
Based on the procedures performed, we consider Management’s estimates and disclosures regarding work-in-progress and unbilled revenue balances to be appropriate.
GOODWILL AND ASSOCIATED IMPAIRMENT TESTING
The Group’s balance sheet includes CHF 1 195 million of goodwill, representing 22.3% of total Group assets. In accordance with IFRS, these balances are allocated to Cash Generating Units (CGUs) which are tested annually for impairment using discounted cash-flow models of each CGU’s recoverable value compared to net operating assets. A deficit in recoverable value would result in impairment.
In the current year, the Group has re-defined its CGUs to align more closely with the Group’s international operations and the levels at which independent cash inflows are generated. This led to a reduction from 63 to 16 CGUs, reflecting the increasingly regionalised and global basis of customer operations.
The inputs to the impairment testing model which have the most significant impact on CGU recoverable value include:
• Projected revenue growth, operating margins and operating cash-flows in the years 1-5;
• Stable long-term growth rates in years 6-10 and in perpetuity; and
• Country and business specific discount rates (pre-tax).
The impairment test model includes sensitivity testing of key assumptions, including revenue growth, operating margin and discount rate.
We considered the appropriateness of the methodology applied and the controls implemented by Management in testing for impairment and the judgements in determining the CGUs to which goodwill is allocated.
We evaluated the appropriateness of the re-definition of CGUs during the current year by discussions with Senior Operational Management, confirmation of the reporting levels at which Group Management monitors independent cash inflows and trading performance and our knowledge of the Group’s operations.
We assessed the impairment testing models and calculations by:
• Checking the mechanical accuracy of the impairment models and the extraction of inputs from source documents;
• Assessing the discount rates applied in the impairment reviews with support from our valuation specialists, developing independent expectations for key macroeconomic assumptions, in particular discount rates, and comparing those independent expectations to those used by Management; and
• Comparing forecast long-term growth rates to economic data.
STATUTORY AUDITOR’S REPORT CONTINUED

196
KEY AUDIT MATTER HOW THE SCOPE OF OUR AUDIT RESPONDED TO THE KEY AUDIT MATTER
The annual impairment testing is considered to be a risk area for the Audit Committee (refer to page 122), a significant accounting judgement and estimate (note 2) and a key audit matter because the assumptions on which the tests are based are highly judgmental and are affected by future market and economic conditions which are inherently uncertain, and because of the materiality of the balances to the financial statements as a whole.
Refer to the accounting policy in note 2 and additionally note 11 for details of the goodwill balances and impairment testing inputs.
Using audit analytic techniques and our knowledge of the Group’s businesses, we identified CGUs with significant goodwill balances, declining trading performance compared with prior year, specific risk factors (such as the impact of commodity price trends on CGUs in the Oil Gas and Chemicals, Minerals and Industrials businesses, macro-economic factors in certain geographies including South and Central America and emerging markets, recent acquisitions or new service innovations) or lower headroom in recoverable value compared to net book value.
For these selected CGUs, we assessed the appropriateness of cash-flow assumptions by analysing projected revenue growth rates, margins and cash-flow levels against current and historic trading and relevant market data where available, and by meeting with Senior Operational and Commercial Management in key businesses and geographies to consider the evidence available to support projected future performance. We also developed our own independent expectations of recoverable value headroom by performing additional sensitivity testing of key assumptions.
We assessed the adequacy of the related disclosures in the consolidated financial statements.
Based on the audit procedures performed, we consider the judgements applied in the determination of CGUs and the assumptions included in the impairment testing models, together with the disclosures set out in the consolidated financial statements, to be appropriate. No impairment was identified from the work above.
CURRENT AND DEFERRED INCOME TAX BALANCES
The Group operates in a large number of different jurisdictions and is therefore subject to many tax regimes with differing rules and regulations. Significant judgement is required in determining the calculation of income taxes, both current and deferred, as well as the assessment of provisions for uncertain tax positions including estimates of interest and penalties where appropriate.
The Group’s balance sheet includes current tax assets of CHF 88 million, current tax liabilities of CHF 166 million together with deferred tax assets of CHF 165 million and deferred tax liabilities of CHF 42 million. The tax expense of CHF 185 million represents 24% of Group profit before taxes.
Due to their significance to the financial statements as a whole, combined with the judgement and estimation required to determine their values, the evaluation of current and deferred tax balances is considered to be an area of focus for the Audit Committee (see page 122) and a key audit matter.
Refer to the accounting policy in note 2 and additionally note 8.
Our audit included the following procedures on current and deferred tax balances:
• We discussed with Management the adequate implementation of Group policies and controls regarding current and deferred tax, as well as the reporting of uncertain tax positions;
• We examined the procedures in place for the current and deferred tax calculations for completeness and valuation and audited the related tax computations and estimates in the light of our knowledge of the tax circumstances. Our work was conducted with our tax specialists in key locations and centrally;
• We verified the consolidation and analysis of tax balances at Group level based on the information reported by Group affiliates;
• We considered Management’s assessment of the validity and adequacy of provisions for uncertain tax positons, evaluating the basis of assessment and reviewing relevant correspondence and legal advice where available including any information regarding similar cases with the relevant tax authorities;
STATUTORY AUDITOR’S REPORT CONTINUED

197
KEY AUDIT MATTER HOW THE SCOPE OF OUR AUDIT RESPONDED TO THE KEY AUDIT MATTER
• In respect of deferred tax assets and liabilities, we assessed the appropriateness of Management’s assumptions and estimates, including the likelihood of generating sufficient future taxable income to support deferred tax assets for tax losses carried forward as disclosed in note 8 of CHF 68 million, considering the time limits applied for the set-off of losses and comparing the assumptions used to the Group’s forecasts for revenue and profits in relevant countries; and.
• We also assessed the adequacy of the related disclosures in the consolidated financial statements.
Based on the audit procedures performed, we consider Management’s estimates and disclosures regarding current and deferred tax balances to be appropriate.
RETIREMENT BENEFIT OBLIGATIONS
The Group maintains a number of defined benefit pension plans. The material defined benefit plans are in Switzerland, USA and UK.
At 31 December 2016, the Group recorded a net retirement benefit liability of CHF 94 million, being the net of pension fund assets of CHF 60 million, included in Other Non-Current Assets and CHF 154 million pension fund liabilities, included in Non-Current Liabilities.
The retirement benefit obligations recognised in the balance sheet represent the present value of defined benefit obligations calculated annually by independent actuaries. These actuarial valuations are sensitive to key assumptions such as discount rates, inflation rates and mortality rates. Changes in any of these assumptions can lead to a material movement in the net retirement benefit liability.
Given the judgement required by Management in setting these assumptions, the volatility in retirement benefit balances that can result from changes in assumptions, and the significance of the balances to the consolidated financial statements as a whole, the estimation of retirement benefit obligations is an area of focus for the Audit Committee (see page 122) and a key audit matter.
Refer to the accounting policy in note 2 and additionally notes 24 and 13.
We evaluated the Group’s assessment of the assumptions used in the valuation of defined benefit liabilities and the information contained within the actuarial valuation reports for each plan. We also assessed the design and implementation of controls in respect of the valuation process for the retirement benefit plans.
We tested the membership and salary data used in the valuation of the retirement benefit plans by reconciliation to payroll records on a sample basis. We also verified retirement benefit assets to third-party confirmations.
Working with our pension specialists both at central and local level, we considered the process applied by the Group’s actuaries and the scope of the valuations performed and we evaluated their expertise and independence. This included assessed the benchmarking of the key assumptions applied, including discount rates, inflation and mortality rates, against external data, where available, and forming our own independent expectations based on our knowledge of local market practices.
We also assessed the adequacy and completeness of the related retirement benefit disclosures in the consolidated financial statements.
Based on the procedures performed, we consider Management’s estimates and disclosures regarding retirement benefit obligation balances to be appropriate.
STATUTORY AUDITOR’S REPORT CONTINUED

198
STATUTORY AUDITOR’S REPORT CONTINUED
Materiality
We define materiality as the magnitude of misstatement in the consolidated financial statements that makes it probable that the economic decisions of a reasonably knowledgeable person would be changed or influenced. We use materiality both in planning the scope of our audit work and in evaluating the results of our work.
Based on our professional judgment we determined materiality for the Group as a whole to be CHF56 million, based on a calculation of 7% of profit before tax adjusted for certain non-recurring items. We selected profit before tax as the basis of materiality because, in our view, it is the measure against which the performance of the Group is most commonly assessed.
The materiality applied by the component auditors ranged from CHF14 million to CHF28 million depending on the scale of the component’s operations, the component’s contribution to Group profit before tax and our assessment of risks specific to each location.
We agreed with the Audit Committee that we would report to the Committee all audit differences in excess of CHF1 million as well as differences below that threshold that, in our view, warranted reporting on qualitative grounds. We also reported to the Audit Committee on disclosure matters that we identified when assessing the overall presentation of the financial statements.
Scope
We designed our audit by obtaining an understanding of the Group and its environment, including Group-wide controls, determining materiality and assessing the risks of material misstatement in the consolidated financial statements.
Based on our scope assessment, we performed full scope component audits at 21 key locations in 2016: Australia; Belgium; Bermuda; Brazil; Chile; China; Colombia; France; Germany; Ghana; Hong Kong; India; Italy; Korea; Netherlands; Russia; South Africa; Spain; Switzerland; USA and UK. In aggregate, these components represented scope coverage of 71% of Group revenue, 86% of net assets and 89% of net income for the year (see table below).
In addition we performed analytical review and other specified procedures (“rotation scope”) in Canada and Taiwan. In aggregate, Canada and Taiwan related procedures represented scope coverage of 6% of Group revenue, 3% of net assets and 3% of net income for the year (see table below).
2016 2015
GROUP AUDIT COVERAGE IN %FULL
SCOPEROTATION
SCOPEFULL
SCOPEROTATION
SCOPE
Revenue 71 6 68 5
Net assets 86 3 72 10
Net income 89 3 74 16
At the parent entity level we tested the consolidation process and carried out analytical procedures to confirm our conclusion that there were no significant risks of material misstatement of the aggregated financial information of the remaining components not subject to a full scope audit.
Other Information in the Annual Report
The Board of Directors is responsible for the other information in the Annual Report. The other information comprises all information included in the Annual Report, but does not include the consolidated financial statements, the stand-alone financial statements of the Company upon which we issue a separate Statutory Auditor’s report, sections 4 and 5 of the Remuneration Report and our auditor’s reports thereon.
Our opinion on the consolidated financial statements does not cover the other information in the Annual Report and we do not express any form of assurance conclusion thereon.
In connection with our audit of the consolidated financial statements, our responsibility is to read the other information in the Annual Report and, in doing so, consider whether the other information is materially inconsistent with the consolidated financial statements or our knowledge obtained in the audit, or otherwise appears to be materially misstated. If, based on the work we have performed, we conclude that there is a material misstatement of this other information, we are required to report that fact. We have nothing to report in this regard.

199
STATUTORY AUDITOR’S REPORT CONTINUED
Responsibility of the Board of Directors for the Consolidated Financial Statements
The Board of Directors is responsible for the preparation of the consolidated financial statements that give a true and fair view in accordance with IFRS and the provisions of Swiss law, and for such internal control as the Board of Directors determines is necessary to enable the preparation of consolidated financial statements that are free from material misstatement, whether due to fraud or error.
In preparing the consolidated financial statements, the Board of Directors is responsible for assessing the Group’s ability to continue as a going concern, disclosing, as applicable, matters related to going concern and using the going concern basis of accounting unless the Board of Directors either intends to liquidate the Group or to cease operations, or has no realistic alternative but to do so.
Auditor’s Responsibilities for the Audit of the Consolidated Financial Statements
Our objectives are to obtain reasonable assurance about whether the consolidated financial statements as a whole are free from material misstatement, whether due to fraud or error, and to issue an auditor’s report that includes our opinion. Reasonable assurance is a high level of assurance, but is not a guarantee that an audit conducted in accordance with Swiss law, ISAs and Swiss Auditing Standards will always detect a material misstatement when it exists. Misstatements can arise from fraud or error and are considered material if, individually or in the aggregate, they could reasonably be expected to influence the economic decisions of users taken on the basis of these consolidated financial statements.
A further description of our responsibilities for the audit of the consolidated financial statements is located at the website of EXPERTsuisse: http://expertsuisse.ch/en/audit-report-for-public-companies. This description forms part of our auditor’s report.
REPORT ON OTHER LEGAL AND REGULATORY REQUIREMENTS
In accordance with article 728a paragraph 1 item 3 CO and the Swiss Auditing Standard 890, we confirm that an internal control system exists which has been designed for the preparation of consolidated financial statements according to the instructions of the Board of Directors.
We recommend that the consolidated financial statements submitted to you be approved.
DELOITTE SA
James Baird Joëlle Herbette
Licensed Audit Expert Licensed Audit Expert Auditor in Charge
Geneva, 9 February 2017

SGS SERVICE
> Digital Services
CONSUMER BENEFIT
> A more secure internet

EARNING THE TRUST OF BILLIONS
In the last 12 months, just three IT security lapses or cyber attacks have resulted in more than a billion records on private individuals being stolen or exposed. This includes the details of all the 191 million people registered to vote in the United States.
These were not just isolated incidents. Cyber criminality is on the rise, with a 29% increase in total costs to businesses reported since 2013. Moreover, it isn’t just large companies that are at risk, with an increasing number of SMEs being attacked.
The biggest single cost to businesses of a security breach is not the loss of data itself – it’s the loss of customer trust and long-term business. For consumers, they need to know that every possible step is being taken to protect their data when they submit it to companies. In a groundbreaking new service, SGS helps ensure this is the case. Testing companies’ architecture, evaluating their network security, running penetration tests and developing incident response approaches are part of the services we provide to ensure that both our customers, and in turn the general public, are protected.

202
INCOME STATEMENTFOR THE YEARS ENDED 31 DECEMBER
(CHF million) NOTES 2016 2015
OPERATING INCOME
Dividends from subsidiaries 461 1 055
Other income 1 1
TOTAL OPERATING INCOME 462 1 056
OPERATING EXPENSES
Other operating & administrative expenses (5) (4)
Depreciation of fixed assets - -
Other expenses 2 (3)
TOTAL OPERATING EXPENSES (3) (7)
OPERATING RESULT 459 1 049
FINANCIAL INCOME
Financial income 7 51 68
Liquidation of subsidiaries, net 7 -
TOTAL FINANCIAL INCOME 58 68
FINANCIAL EXPENSES
Financial expenses 7 (48) (51)
Exchange loss, net (23) (4)
TOTAL FINANCIAL EXPENSES (71) (55)
FINANCIAL RESULT (13) 13
PROFIT BEFORE TAXES 446 1 062
Taxes (1) (5)
Withholding taxes (9) (9)
PROFIT FOR THE YEAR 436 1 048
9. SGS SA RESULTS

203
BALANCE SHEET AT 31 DECEMBER(BEFORE APPROPRIATION OF AVAILABLE RETAINED EARNINGS)
(CHF million) NOTES 2016 2015
ASSETS
CURRENT ASSETS
Cash & cash equivalents 312 529
Other financial assets 28 195
Amounts due from subsidiaries 337 301
Accrued income & prepaid expenses - 1
TOTAL CURRENT ASSETS 677 1 026
NON-CURRENT ASSETS
Financial assets
Investments in subsidiaries 2 1 503 1 635
Loans to subsidiaries 1 404 1 289
Other financial assets - 1
Fixed assets
Tangible fixed assets 3 2 3
TOTAL NON-CURRENT ASSETS 2 909 2 928
TOTAL ASSETS 3 586 3 954
SHAREHOLDERS’ EQUITY AND LIABILITIES
SHORT-TERM LIABILITIES
Other creditors 1 2
Amounts due to subsidiaries 56 50
Deferred income and accrued expenses 91 56
Provisions 34 34
TOTAL SHORT-TERM LIABILITIES 182 142
LONG-TERM LIABILITIES / NON CURRENT LIABILITIES
Long-term liabilities - subsidiaries 655 275
Corporate bonds 4 1 700 2 192
TOTAL LONG-TERM LIABILITIES / NON-CURRENT LIABILITIES 2 355 2 467
CAPITAL AND RESERVES
Share capital 5 and 6 8 8
Statutory capital reserve 5 and 6 34 34
Statutory retained earnings 5 and 6 1 253 1 273
Own shares for share buyback 5 and 6 (361) (145)
Reserve for own shares held by a subsidiary 5 and 6 115 175
TOTAL CAPITAL AND RESERVE 1 049 1 345
TOTAL SHAREHOLDERS' EQUITY AND LIABILITIES 3 586 3 954
9. SGS SA RESULTS

204
SGS SA (“the Company”) is the ultimate parent company of the SGS Group which owns and finances, either directly or indirectly, its subsidiaries and joint ventures throughout the world. The headquarters are located in Geneva, Switzerland.
The average number of employees during the year was less than ten.
NOTES
1. SIGNIFICANT ACCOUNTING POLICIES
The financial statements are prepared in accordance with the accounting principles required by Swiss law.
INVESTMENTS IN SUBSIDIARIES
Investments in subsidiaries are valued individually at acquisition cost less an adjustment for impairment where appropriate.
FOREIGN CURRENCIES
Balance sheet items denominated in foreign currencies are converted at year-end exchange rates with the exception of investments in subsidiaries that are valued at the historical exchange rate. Unrealised gains and losses arising on foreign exchange transactions are included in the determination of the net profit, except long-term unrealised gains on long-term loans and related instruments, which are deferred.
DIVIDENDS FROM SUBSIDIARIES
Dividends are treated as an appropriation of profit in the year in which they are ratified at the Annual General Meeting and subsequently paid, rather than as an appropriation of profit in the year to which they relate or for which they are proposed by the Board of Directors.
As a result, dividends are recognised in income in the year in which they are received, on a cash basis.
BONDS
Bonds are recorded at nominal value.
2. SUBSIDIARIES
The list of principal Group subsidiaries appears in the Annual Report on pages 218 to 221.
3. TANGIBLE FIXED ASSETS
The tangible fixed asset is a building located at 15, rue des Alpes in Geneva and is stated at historical cost less accumulated depreciation.
9. SGS SA RESULTS

205
4. CORPORATE BONDS
SGS SA made the following bond issuances:
DATE OF ISSUEFACE VALUE IN
CHF MILLION COUPON IN %YEAR OF
MATURITYISSUE
PRICE IN %REDEMPTION
PRICE IN %
08.03.2011 375 2.625 2019 100.832 100.000
27.05.2011 275 3.000 2021 100.480 100.000
27.02.2014 138 1.375 2022 100.517 100.000
27.02.2014 250 1.750 2024 101.019 100.000
25.04.2014 112 1.375 2022 101.533 100.000
08.05.2015 325 0.250 2023 100.079 100.000
08.05.2015 225 0.875 2030 100.245 100.000
In 2016, a CHF 492 million corporate bond was reimbursed.
The Group has listed all the bonds on the SIX Swiss Exchange.
5. TOTAL EQUITY
(CHF million)SHARE
CAPITAL
STATUTORY CAPITAL RESERVE
RESERVE FOR OWN SHARES
HELD BY A SUBSIDIARY
OWN SHARES FOR SHARE
BUYBACK
STATUTORY RETAINED
EARNINGS TOTAL
BALANCE AT 1 JANUARY 2015 8 34 172 - 750 964
Dividends paid - - - - (522) (522)
Increase in the reserve for own shares - - 3 - (3) -
Purchase of shares for buyback - - - (145) - (145)
Profit for the year - - - - 1 048 1 048
BALANCE AT 31 DECEMBER 2015 8 34 175 (145) 1 273 1 345
Dividends paid - - - - (516) (516)
Decrease in the reserve for own shares - - (60) - 60 -
Purchase of shares for buyback - - - (216) - (216)
Profit for the year - - - - 436 436
BALANCE AT 31 DECEMBER 2016 8 34 115 (361) 1 253 1 049

206
6. SHARE CAPITAL
SHARES IN CIRCULATION
OWN SHARES
TOTAL SHARES ISSUED
TOTAL SHARE CAPITAL (CHF MILLION)
BALANCE AT 1 JANUARY 2015 7 675 506 146 930 7 822 436 8
Own shares released into circulation 54 636 (54 636) - -
Own shares purchased for future equity compensation plans
(45 778) 45 778 - -
Own shares purchased for buyback (78 904) 78 904 - -
BALANCE AT 31 DECEMBER 2015 7 605 460 216 976 7 822 436 8
Own shares released into circulation 49 162 (49 162) - -
Own shares purchased for future equity compensation plans
(6 315) 6 315 - -
Own shares purchased for buyback (109 800) 109 800 - -
BALANCE AT 31 DECEMBER 2016 7 538 507 283 929 7 822 436 8
Issued Share Capital
SGS SA has a share capital of CHF 7 822 436 (2015: CHF 7 822 436) fully paid-in and divided into 7 822 436 (2015: 7 822 436) registered shares of a par value of CHF 1. All shares, other than own shares, participate equally in the dividends declared by the Company and have equal voting rights.
Own Shares
On 31 December 2016, SGS SA held directly and indirectly 283 929 of its own shares. The shares purchased for cancellation are directly held by SGS SA, while the shares to cover the equity compensation plans are held by a subsidiary company.
In 2016, 49 162 own shares were sold to cover the equity compensation plans and 6 315 were purchased for an average price of CHF 2 127.
In 2015, the Group initiated a share buyback programme for a total of up to CHF 750 million. Up to CHF 500 million is designated for cancellation and the remainder for employee equity participation plans and/or for utilisation as underlying securities for potential issuances of convertible bonds. The programme started on 20 January 2015 and ended on 31 December 2016. As part of the share buyback programme, 109 800 shares were purchased in 2016 for an average price of CHF 1 961.
7. FINANCIAL INCOME AND FINANCIAL EXPENSES
(CHF million) 2016 2015
FINANCIAL INCOME
Interest income 3rd party 1 16
Interest income Group 50 52
FINANCIAL INCOME 51 68
FINANCIAL EXPENSES
Interest expenses 3rd party (35) (42)
Interest expenses Group (2) (3)
Other financial expenses (11) (6)
FINANCIAL EXPENSES (48) (51)
On 12 January 2015, the Group received a cash amount of CHF 15 million in relation to the termination of the Interest Rate Swap agreement to market rates. These cash proceeds were recognised as interest income in the income statement.
9. SGS SA RESULTS

207
8. GUARANTEES AND COMFORT LETTERS
(CHF million) 2016 ISSUED 2016 UTILISED 2015 ISSUED 2015 UTILISED
Guarantees 284 237 243 179
Performance bonds 38 38 44 44
TOTAL 322 275 287 223
The Company has unconditionally guaranteed or provided comfort to financial institutions providing credit facilities (loans and guarantee bonds) to its subsidiaries. In addition, it has issued performance bonds to commercial customers on behalf of its subsidiaries.
The Company is part of a VAT Group comprising itself and other Group companies in Switzerland.
9. REMUNERATION
9.1. COMPANY’S REMUNERATION POLICY AND GOVERNANCE
This section appears in the SGS Remuneration Report paragraph 2 in the Annual Report on pages 128 to 131.
9.2. REMUNERATION MODEL
This section appears in the SGS Remuneration Report paragraph 3 in the Annual Report on pages 131 to 138.
9.3. REMUNERATION AWARDED TO THE BOARD OF DIRECTORS
This section appears in the SGS Remuneration Report paragraph 4 in the Annual Report on pages 138 to 139.
9.4. REMUNERATION AWARDED TO THE CEO, SENIOR MANAGEMENT AND OTHER MEMBERS OF THE OPERATION COUNCIL
This section appears in the SGS Remuneration Report paragraph 5 in the Annual Report on pages 139 to 142.
10. SHARES AND OPTIONS HELD BY MEMBERS OF GOVERNING BODIES
10.1. SHARES AND OPTIONS HELD BY MEMBERS OF THE BOARD OF DIRECTORS
The following table shows the shares and vested options held by Members of the Board of Directors as at 31 December 2016:
NAMESGSWS
(2013)SGSPF (2014)
SGSBB (2015)
RESTRICTED SHARES SHARES
S. Marchionne 40 000 50 000 - - 1 150
A. von Finck - - - - 19 670
A. F. von Finck - - - - 786 255
C. Grupp - - - - -
P. Kalantzis - - - - 85
S.R. du Pasquier - - - - 5
P. Desmarais - - - - -
I. Galienne - - - - -
G. Lamarche - - - - -
C. Kirk 48 576 188 546 206 806 46 1 119

208
The following table shows the shares and vested options held by Members of the Board of Directors as at 31 December 2015:
NAMESGSKF (2012)
SGSWS (2013)
SGSPF (2014)
SGSBB (2015) SHARES
S. Marchionne - 26 667 50 000 - 1 150
A. von Finck - - - - 19 670
A. F. von Finck - - - - 439 515
C. Grupp - - - - 1
P. Kalantzis - - - - 150
S.R. du Pasquier - - - - 10
P. Desmarais - - - - 10
I. Galienne - - - - 1
G. Lamarche - - - - 25
C. Kirk 180 225 32 384 188 546 103 403 1 119
10.2. SHARES AND OPTIONS HELD BY SENIOR MANAGEMENT
The following table shows the shares and vested options held by Senior Management as at 31 December 2016:
NAME CORPORATE RESPONSIBILITYSGSWS
(2013)SGSPF (2014)
SGSBB (2015)
RESTRICTED SHARES SHARES
F. Ng Chief Executive Officer 46 632 15 642 55 152 180 -
C. De Geyseleer Chief Financial Officer - 26 667 8 831 91 -
O. MerktGeneral Counsel and Chef Compliance Officer
- 17 643 33 048 53 45
The following table shows the shares and vested options held by Senior Management as at 31 December 2015:
NAME CORPORATE RESPONSIBILITYSGSKF (2012)
SGSWS (2013)
SGSPF (2014)
SGSBB (2015) SHARES
F. Ng Chief Executive Officer 61 621 31 088 15 642 27 576 -
C. De Geyseleer Chief Financial Officer - 26 667 4 416 70
O. MerktGeneral Counsel and Chief Compliance Officer 21 055 28 842 17 643 16 524 45
Details of the various plans are explained in the remuneration report.
9. SGS SA RESULTS
-

209
11. SIGNIFICANT SHAREHOLDERS
As at 31 December 2016, Groupe Bruxelles Lambert acting through Serena SARL held 16.20% (2015: 15.00%). Mr. August von Finck and members of his family acting in concert held 15.03% (2015: 15.03%), the Bank of New York Mellon Corporation held 3.35% (2015: 3.35%), BlackRock, Inc. held 3.03% (2015: 3.03%) and MFS Investment Management held 3.01% (2015: 3.01%) of the share capital and voting rights of the Company.
At the same date, SGS Group held 3.63% of the share capital of the Company (2015: 2.77%).
PROPOSAL OF THE BOARD OF DIRECTORS FOR THE APPROPRIATION OF AVAILABLE RETAINED EARNINGS
(CHF) 2016 2015
Profit for the year 436 216 325 1 048 128 990
Balance brought forward from previous year 610 633 820 227 785 349
Dividend not paid on own shares bought in 2015 prior the Annual General Meeting on 12 March 2015
- 384 676
Dividend paid on own shares released into circulation in 2016 prior the Annual General Meeting on 14 March 2016
(39 772) -
Share buyback programme (215 274 875) (145 362 298)
Reversal from/(Transfer to) the reserve for own shares 60 989 472 (3 131 617)
TOTAL RETAINED EARNINGS AVAILABLE FOR APPROPRIATION 892 524 970 1 127 805 100
Proposal of the Board of Directors:
Dividends¹ (527 695 490) (517 171 280)
BALANCE CARRIED FORWARD 364 829 480 610 633 820
Ordinary gross dividend per registered share 70.00 68.00
1. No dividend is paid on own shares held directly or indirectly by SGS SA.
12. APPROVAL OF FINANCIAL STATEMENTS AND SUBSEQUENT EVENTS
The Board of Directors is responsible for the preparation and presentation of the financial statements. These financial statements were authorised for issue by the Board of Directors on 9 February 2017, and will be submitted for approval by the Annual General Meeting of Shareholders to be held on 21 March 2017.

210
STATUTORY AUDITOR’S REPORT
To the General Meeting of
SGS SA, GENEVA
REPORT ON THE AUDIT OF THE FINANCIAL STATEMENTS
Opinion
We have audited the financial statements of SGS SA, presented on pages 202 to 209 which comprise the balance sheet as at 31 December 2016 and the income statement and notes for the year then ended, including the summary of significant accounting policies.
In our opinion the accompanying financial statements as at 31 December 2016 comply with Swiss law and the company’s articles of incorporation.
Basis for Opinion
We conducted our audit in accordance with Swiss law and Swiss Auditing Standards. Our responsibilities under those provisions and standards are further described in the Auditor’s Responsibilities for the Audit of the Financial Statements section of our report. We are independent of the entity in accordance with the provisions of Swiss law and the requirements of the Swiss audit profession and we have fulfilled our other ethical responsibilities in accordance with these requirements.
We believe that the audit evidence we have obtained is sufficient and appropriate to provide a basis for our opinion.
Report on Key Audit Matters based on the circular 1/2015 of the Federal Audit Oversight Authority
Key audit matters are those matters that, in our professional judgment, were of most significance in our audit of the financial statements of the current period. These matters were addressed in the context of our audit of the financial statements as a whole, and in forming our opinion thereon, and we do not provide a separate opinion on these matters.
KEY AUDIT MATTER HOW THE SCOPE OF OUR AUDIT RESPONDED TO THE KEY AUDIT MATTER
VALUATION OF INVESTMENTS IN SUBSIDIARIES AND RELATED LOANS TO SUBSIDIARIES
As described in note 2 to the financial statements, the company holds investments in subsidiaries with a carrying value of CHF 1 503 million as of 31 December 2016, representing 41.9% of total assets. The list of principal Group subsidiaries can be found in the Annual Report on pages 218 to 221. The valuation of these assets is dependent on the ability of these companies to generate positive cash flows in the future. It also has loans to subsidiaries amounting to CHF 1 404 million.
In accordance with Article 960 CO, these investment balances are valued by individual investment and the values must be tested annually for impairment. An impairment would need to be recorded if any of the recoverable values of investments were lower than the associated carrying values, or if loan balances were no longer considered recoverable from the associated entities.
The company uses the “income approach” for its impairment tests of investments, and prepares a discounted cash flow forecast for each significant balance. The inputs to the impairment testing model which have the most significant impact on the recoverable value include:
• Projected revenue growth, operating margins and operatingcash-flows in the years 1-5;
• Stable long-term growth rates in years 6-10 and in perpetuity; and
• Country and business specific discount rates (pre-tax).
The annual impairment testing is considered to be a risk area for the Board of Directors and a key audit matter because the assumptions on which the tests are based are highly judgmental and are affected by future market and economic conditions which are inherently uncertain, and because of the materiality of the balances to the statutory financial statements as a whole.
We discussed with Management the adequate implementation of accounting policies and controls regarding the valuation of investments in subsidiaries and related loans.
We tested the design and implementation of controls to determine whether appropriate controls are in place.
We challenged the impairment testing conducted by the company. We tested the valuations and amounts outstanding on a sample basis by critically assessing the methodology applied and the reasonableness of the underlying assumptions and judgements. Involving our valuation specialists, we assessed the impairment testing models and calculations by:
• checking the mechanical accuracy of the impairment modelsand the extraction of inputs from source documents;
• challenging the significant inputs and assumptions used in theimpairment testing for investments in SGS Group companies,such as the weighted average cost of capital and the five yearprojected revenues and margins.
We challenged the recoverability of loans to subsidiaries and tested balances on a sample basis to evidence of the financial position of the entities concerned.
We validated the appropriateness and completeness of the related disclosures in the financial statements.
Based on the audit procedures performed above, we consider Management’s estimates in the assessment of the recoverable value of investments in, and loans to, subsidiaries, to be appropriate.

211
Responsibility of the Board of Directors for the Financial Statements
The Board of Directors is responsible for the preparation of the financial statements in accordance with the provisions of Swiss law and the company’s articles of incorporation, and for such internal control as the Board of Directors determines is necessary to enable the preparation of financial statements that are free from material misstatement, whether due to fraud or error.
In preparing the financial statements, the Board of Directors is responsible for assessing the entity’s ability to continue as a going concern, disclosing, as applicable, matters related to going concern and using the going concern basis of accounting unless the Board of Directors either intends to liquidate the entity or to cease operations, or has no realistic alternative but to do so.
Auditor’s Responsibilities for the Audit of the Financial Statements
Our objectives are to obtain reasonable assurance about whether the financial statements as a whole are free from material misstatement, whether due to fraud or error, and to issue an auditor’s report that includes our opinion. Reasonable assurance is a high level of assurance, but is not a guarantee that an audit conducted in accordance with Swiss law and Swiss Auditing Standards will always detect a material misstatement when it exists. Misstatements can arise from fraud or error and are considered material if, individually or in the aggregate, they could reasonably be expected to influence the economic decisions of users taken on the basis of these financial statements.
A further description of our responsibilities for the audit of the consolidated financial statements is located at the website of EXPERTsuisse: http://expertsuisse.ch/en/audit-report-for-public-companies. This description forms part of our auditor’s report.
REPORT ON OTHER LEGAL REQUIREMENTS
In accordance with article 728a paragraph 1 item 3 CO and the Swiss Auditing Standard 890, we confirm that an internal control system exists which has been designed for the preparation of financial statements according to the instructions of the Board of Directors.
We further confirm that the proposed appropriation of available earnings complies with Swiss law and the company’s articles of incorporation. We recommend that the financial statements submitted to you be approved.
DELOITTE SA
James Baird Joëlle Herbette
Licensed Audit Expert Licensed Audit Expert Auditor in Charge
Geneva, 9 February 2017
STATUTORY AUDITOR’S REPORT CONTINUED

DELIVERING SECURITY WITHOUT BARRIERS
At borders, authorities face a constant balancing act between implementing controls (regulating immigration, collecting excise tax, preventing smuggling and illicit products entering our markets etc.) and ensuring that the flow of traffic, trade and people moves at a reasonable pace.
In 2015, SGS launched SGS D-TECT®, the first universal image analysis solution for container x-ray scanners. As the first ever server-based solution, SGS D-TECT® allows image analysis to be undertaken remotely, improving inspection speed and efficiency.
In 2016, SGS D-TECT® has taken a further step, making the deployment of a 100% scanning scheme in seaports possible by resolving the logistic constraints behind mass volume inspection. With new automated functionalities, SGS D-TECT® highlights non-conformities, assisting border control authorities to allocate resources on higher risk profiles while speeding the process for the majority of lower-risk cases.
All this means that security is becoming ever tighter at ports and borders, while at the same time, waiting times are being reduced.Society as a whole benefits from smoother trade flows and the fact that thanks to SGS D-TECT® we are all that little bit safer.

SGS SERVICE
> SGS D-TECT®
CONSUMER BENEFIT
> Safer borders with reduced waiting times

214
SGS GROUP – FIVE-YEAR STATISTICAL DATA CONSOLIDATED INCOME STATEMENTSFOR THE YEARS ENDED 31 DECEMBER
(CHF million) 2016 2015 2014 2013 2012
REVENUE 5 985 5 712 5 883 5 830 5 569
Salaries and wages (3 009) (2 849) (2 891) (2 871) (2 733)
Subcontractors’ expenses (368) (345) (361) (357) (338)
Depreciation, amortisation and impairment (336) (322) (304) (298) (280)
Other operating expenses (1 456) (1 374) (1 386) (1 392) (1 384)
OPERATING INCOME (EBIT) 816 822 941 912 834
Financial income/(expense) (45) (43) (41) (38) (41)
PROFIT BEFORE TAXES 771 779 900 874 793
Taxes (185) (195) (234) (236) (214)
PROFIT FOR THE YEAR 586 584 666 638 579
Profit attributable to:
Equity holders of SGS SA 543 549 629 600 545
Non-controlling interests 43 35 37 38 34
OPERATING INCOME MARGINS IN % 13.6 14.4 16.0 15.6 15.0
AVERAGE NUMBER OF EMPLOYEES 89 626 85 903 83 515 80 510 76 790
10. DATA

215
SGS GROUP – FIVE-YEAR STATISTICAL DATA CONSOLIDATED BALANCE SHEETSAT 31 DECEMBER
(CHF million) 2016 2015¹ 2014 2013 2012
Land, buildings and equipment 972 964 1 043 1 029 1 015
Goodwill and other intangible assets 1 441 1 306 1 337 1 216 1 172
Investments in associated and other companies 38 32 24 18 17
Deferred tax and other non-current assets 287 315 244 215 266
TOTAL NON-CURRENT ASSETS 2 738 2 617 2 648 2 478 2 470
Unbilled revenues and inventories 290 288 330 330 302
Trade accounts and notes receivable 997 917 1 068 952 977
Other receivables and prepayments 252 272 298 247 226
Current tax assets 88 66 73 59 29
Cash and marketable securities 984 1 734 1 350 973 987
TOTAL CURRENT ASSETS 2 611 3 277 3 119 2 561 2 521
TOTAL ASSETS 5 349 5 894 5 767 5 039 4 991
Share capital 8 8 8 8 8
Reserves 1 765 1 898 2 319 2 135 2 052
EQUITY ATTRIBUTABLE TO EQUITY HOLDERS OF SGS SA
1 773 1 906 2 327 2 143 2 060
Non-controlling interests 80 75 76 69 58
TOTAL EQUITY 1 853 1 981 2 403 2 212 2 118
Loans and obligations under finance leases 1 719 1 723 1 672 1 293 1 305
Deferred tax liabilities 42 60 74 66 72
Provisions and retirement benefit obligations 247 278 273 190 273
TOTAL NON-CURRENT LIABILITIES 2 008 2 061 2 019 1 549 1 650
Loans and obligations under finance leases 1 494 18 15 17
Trade and other payables 641 526 511 502 492
Current tax liabilities 166 159 175 142 103
Provisions, other creditors and accruals 680 673 641 619 611
TOTAL CURRENT LIABILITIES 1 488 1 852 1 345 1 278 1 223
TOTAL LIABILITIES 3 496 3 913 3 364 2 827 2 873
TOTAL EQUITY AND LIABILITIES 5 349 5 894 5 767 5 039 4 991
1. Restated figures (notes 2 and 23).
10. DATA

216
SGS GROUP – FIVE-YEAR STATISTICAL SHARE DATA(CHF unless indicated otherwise) 2016 2015 2014 2013 2012
SHARE INFORMATION
REGISTERED SHARES
Number of shares issued 7 822 436 7 822 436 7 822 436 7 822 436 7 822 436
Number of shares with dividend rights 7 538 507 7 605 460 7 675 506 7 650 840 7 632 042
PRICE
High 2 317 2 049 2 260 2 450 2 156
Low 1 734 1 577 1 802 1 952 1 559
Year-end 2 072 1 911 2 045 2 052 2 026
Par value 1 1 1 1 1
KEY FIGURES BY SHARES
Equity attributable to equity holders of SGS SA per share in circulation at 31 December
235.22 250.56 303.13 280.08 269.95
Basic earnings per share1 71.54 71.99 81.99 78.43 71.52
Dividend per share ordinary 70.00 68.00 68.00 65.00 30.00
Dividend per share special - - - - 28.00
Total dividend per share 70.00 68.00 68.00 65.00 58.00
DIVIDENDS (CHF MILLION)
Ordinary2 528 517 522 497 229
Special - - - - 214
Total 528 517 522 497 443
1. Calculation of the basic earnings per share (weighted average for the year) is disclosed in note 9, page 163.2. As proposed by the Board of Directors.
SGS GROUP SHARE INFORMATIONSHARE TRANSFER
SGS SA has no restrictions as to share ownership, except that registered shares acquired in a fiduciary capacity by third parties may not be registered in the shareholders’ register, unless a special authorisation has been granted by the Board of Directors.
MARKET CAPITALISATION
At the end of 2016, market capitalisation was approximately CHF 16 208 million (2015: CHF 14 949 million). Shares are quoted on the SIX Swiss Exchange.
10. DATA

217
SGS SA
2 400
2 300
2 200
2 100
2 000
1 900
1 800
1 700
1 600
1 500
1 400
1 300
1 200
1 100
1 000
900
800
SMI
11 500
11 250
11 000
10 750
10 500
10 250
10 000
9 750
9 500
9 250
9 000
8 750
8 500
8 250
8 000
7 750
7 500
J F M A M J J A S O N D J F M A M J J A S O N D2015 2016
HIGH PRICE
CLOSE
LOW PRICESWISS MARKET INDEX (MONTHLY CLOSE)SGS SA
CLOSING PRICES FOR SGS AND THE SMI 2015 – 2016

218
SGS GROUP PRINCIPAL OPERATING COMPANIES AND ULTIMATE PARENT
COUNTRY NAME AND DOMICILEISSUED CAPITAL
CURRENCYISSUED CAPITAL
AMOUNT% HELD BY
GROUPDIRECT /
INDIRECT
Albania SGS Albania Ltd., Tirana ALL 15 100 000 100 D
Albania SGS Automotive Albania sh.p.k., Tirana ALL 190 000 100 100 I
Algeria SGS Qualitest Algérie SpA, Alger DZD 50 000 000 100 D
AlgeriaSociété de Contrôle Technique Automobile SA, Rouiba-Alger
DZD 173 600 000 77 D
Angola SGS Angola Limitada, Luanda AOA 8 000 000 100 D
Argentina SGS Argentina SA, Buenos Aires ARS 4 171 536 100 D
Argentina ITV SA, Buenos Aires ARS 1 500 000 100 I
Australia SGS Australia Pty. Ltd., Perth AUD 200 000 100 I
Australia Gearhart Australia Limited, Perth AUD 5 609 210 100 I
Austria SGS Austria Controll-Co. Ges.m.b.H., Vienna EUR 185 000 100 D
AzerbaijanSociété Générale de Surveillance Azeri Ltd., Baku
USD 100 000 100 D
Bahamas SGS Bahamas Ltd., Freeport BSD 5 000 100 D
Bangladesh SGS Bangladesh Limited, Dhaka BDT 10 000 000 100 D
Belarus SGS Minsk Ltd., Minsk USD 20 000 100 D
Belgium SGS Belgium N.V., Antwerpen EUR 2 178 200 100 I
Benin SGS Bénin SA, Cotonou XOF 10 000 000 100 D
Bolivia SGS Bolivia SA, La Paz BOB 41 900 100 D
Bosnia-Herzegovina SGS Bosna i Hercegovina (d.o.o.) Ltd., Sarajevo BAM 2 151 100 I
Botswana SGS Botswana (Proprietary) Limited, Gaborone BWP 1 000 100 D
Brazil SGS do Brasil Ltda., São Paulo BRL 170 166 827 100 D
Brazil SGS Enger Engenharia Ltda., Barueri-SP BRL 3 000 000 100 I
BrazilUnigeo Geoprocessamento e Consultoria Ltda, Nova Mutum
BRL 4 870 257 75 I
Bulgaria SGS Bulgaria Ltd., Sofia BGN 5 010 000 100 D
Burkina Faso SGS Burkina SA, Ouagadougou XOF 601 080 000 100 D
Cambodia SGS (Cambodia) Ltd., Phnom Penh KHR 4 000 000 000 100 D
Cameroon SGS Cameroun SA, Douala XAF 10 000 000 98.9 D
Canada SGS Canada Inc., Missisauga CAD 20 900 000 100 D
Chile SGS Chile Limitada, Santiago de Chile CLP 22 061 741 237 100 D
ChileCIMM Tecnologias y Servicios SA, Santiago de Chile
CLP 7 570 000 000 100 I
ChileSIGA Ingeneria y Consultoria S.A. Santiago de Chile
CLP 3 382 313 364 70 I
ChinaSGS-CSTC Standards Technical Services Co. Ltd., Beijing
USD 3 966 667 85 I
Colombia SGS Colombia SAS, Bogota COP 59 054 167 360 100 D
Colombia Estudios Técnicos SAS, (ETSA), Bogota COP 6 021 642 700 100 I
Colombia Laboratorios Contecon Urbar SAS, Bogota COP 2 489 200 100 I
Congo SGS Congo SA, Pointe-Noire XAF 1 510 000 000 100 D
Croatia SGS Adriatica, w.l.l., Zagreb HRK 1 300 000 100 I
Czech Republic SGS Czech Republic s.r.o., Praha CZK 7 707 000 100 I
Denmark SGS Danmark A / S, Glostrup Hvidovre DKK 700 000 100 I
Democratic Republic of Congo
SGS Minerals RDC SARL, Lubumbashi USD 50 000 100 D
10. DATA

219
COUNTRY NAME AND DOMICILEISSUED CAPITAL
CURRENCYISSUED CAPITAL
AMOUNT% HELD BY
GROUPDIRECT /
INDIRECT
Ecuador SGS del Ecuador SA, Guayaquil USD 147 680 100 D
Egypt SGS Egypt Ltd., Cairo EGP 1 500 000 100 D
Estonia SGS Estonia Ltd., Tallinn EUR 42 174 100 I
Ethiopia SGS Ethiopia Private Limited, Addis Abeba ETB 15 000 100 D
Finland SGS Inspection Services Oy, Helsingfors EUR 102 000 100 I
Finland SGS Fimko Oy, Helsingfors EUR 260 000 100 I
France SGS Oil, Gas and Chemicals, SAS, Arcueil EUR 2 320 000 100 I
France SGS Qualitest Industrie SAS, Orsay EUR 200 000 100 I
France Securitest SA, Paris EUR 2 745 000 92.31 I
Georgia SGS Georgia Ltd., Batumi USD 80 000 100 D
Germany SGS Germany GmbH, Hamburg EUR 1 210 000 100 I
Germany SGS Institut Fresenius GmbH, Taunusstein EUR 7 490 000 100 I
Germany SGS-Tüv Saar GmbH, Sulzbach EUR 750 000 74.9 I
Ghana SGS Ghana Limited, Accra GHS 4 005 202 100 I
Ghana Ghana Community Network Services Limited, Accra
GHS 1 978 604 60 I
Great Britain SGS United Kingdom Limited, Ellesmere Port GBP 8 000 000 100 I
Great Britain SGS M-Scan Limited, Ellesmere Port GBP 139 100 I
Greece SGS Greece SA, Peristeri EUR 301 731 100 D
Guam SGS Guam Inc., Guam USD 25 000 100 D
Guatemala SGS Central America SA, Guatemala City GTQ 1 068 000 100 D
Guinea-Conakry SGS Guinée Conakry SA, Conakry GNF 50 000 000 100 D
Guinea-EquatorialCompañia de Inspecciones y Servicios G.E., Malabo
XAF 10 000 000 51 D
Hong Kong SGS Hong Kong Limited, Hong Kong HKD 200 000 100 D
Hungary SGS Hungária Kft., Budapest HUF 518 000 000 100 I
India SGS India Private Ltd., Mumbai INR 960 000 100 D
Indonesia P.T. SGS Indonesia, Jakarta USD 200 000 100 D
Iran SGS Iran (Private Joint Stock) Limited, Tehran IRR 50 000 000 100 D
Ireland SGS Ireland (Holdings) Limited, Dublin EUR 62 500 100 I
Italy SGS Italia S.p.A., Milan EUR 2 500 000 100 I
Ivory Coast SGS Côte d’Ivoire SA, Abidjan XOF 300 000 000 100 D
Ivory Coast Société Ivoirienne de Contrôles Techniques Automobiles et Industriels SA, Abidjan
XOF 200 000 000 95 D
Japan SGS Japan Inc., Yokohama JPY 100 000 000 100 D
Jordan SGS (Jordan) Private Shareholding Company, Amman
JOD 100 000 50 D
Kazakhstan SGS Kazakhstan Limited, Almaty KZT 146 527 100 D
Kenya SGS Kenya Limited, Mombasa KES 2 000 000 100 D
Korea (Republic of) SGS Korea Co., Ltd., Seoul KRW 15 617 540 000 100 D
Kuwait SGS Kuwait W.L.L., Kuwait KWD 50 000 49 D
Lao (People's Democratic Republic)
SGS (Lao) Sole Co., Ltd., Vientiane LAK 2 444 700 000 100 D
Latvia SGS Latvija Limited, Riga EUR 118 382 100 I

220
COUNTRY NAME AND DOMICILEISSUED CAPITAL
CURRENCYISSUED CAPITAL
AMOUNT% HELD BY
GROUPDIRECT /
INDIRECT
Lebanon SGS (Liban) S.A.L., Beirut LBP 30 000 000 99.99 D
Liberia SGS Liberia Inc, Monrovia LRD 100 100 D
Lithuania SGS Klaipeda Ltd., Klaipeda EUR 11 584 100 I
Luxembourg SGS Luxembourg SA, Windhof EUR 38 000 100 I
Madagascar SGS Madagascar SARL, Antananarivo MGA 20 000 000 100 I
MadagascarMalagasy Community Network Services SA, Antananarivo
MGA 10 000 000 70 D
Malawi SGS Malawi Limited, Blantyre MWK 30 000 100 D
Malaysia Petrotechnical Inspection (Malaysia) Sdn. Bhd., Kuala Lumpur
MYR 500 000 70 D
Malaysia SGS (Malaysia) Sdn. Bhd., Kuala Lumpur MYR 60 000 100 D
Mali SGS Mali Sàrlu, Kayes XOF 300 000 000 100 D
Mauritius SGS (Mauritius) LTD, Phoenix MUR 100 000 100 D
Mexico SGS de Mexico, SA de C.V., Mexico MXN 7 065 828 100 D
Moldova SGS (Moldova) SA, Chisinau MDL 488 050 100 D
Mongolia SGS Mongolia LLC, Ulaanbaatar USD 10 000 100 D
Morocco SGS Maroc SA, Casablanca MAD 12 000 000 100 D
Morocco SGS Maroc Automotive SA, Casablanca MAD 33 000 000 75 D
Mozambique SGS Mozambique, Limitada, Maputo MZN 73 479 883 100 D
Myanmar SGS (Myanmar) Limited, Yangon MMK 300 000 100 D
Namibia SGS Inspection Services Namibia (Proprietary) Limited, Windhoek
NAD 100 100 I
Netherlands SGS Nederland B.V., Spijkenisse EUR 250 000 100 I
Netherlands SGS Horizon B.V., Gravenhage EUR 45 000 100 I
New Zealand SGS New Zealand Limited, Auckland-Onehunga NZD 10 522 190 100 D
Nigeria SGS Inspection Services Nigeria Limited, Lagos NGN 200 000 49 D
Norway SGS Norge A / S, Austrheim NOK 804 000 100 I
Oman SGS Gulf Upstream, Oman (Branch office) - - - -
Pakistan SGS Pakistan (Private) Limited, Karachi PKR 2 300 000 100 D
Panama SGS Panama Control Services Inc., Panama USD 850 000 100 D
Papua-New-Guinea SGS PNG Pty. Limited, Port Moresby PGK 2 100 I
Paraguay SGS Paraguay SA, Asunción PYG 1 962 000 000 100 D
Peru SGS del Perú S.A.C., Lima PEN 43 081 182 100 D
Philippines SGS Philippines, Inc., Manila PHP 24 620 000 100 D
Poland SGS Polska Sp.z o.o., Warsaw PLN 10 144 200 100 I
Portugal SGS Portugal - Sociedade Geral de Superintendência SA, Lisboa
EUR 500 000 100 I
Qatar SGS Qatar LLC,Doha QAR 200 000 49 D
Romania SGS Romania SA, Bucharest RON 100 002 100 I
Russia SGS Vostok Limited, Moscow RUB 18 000 000 100 D
Saudi Arabia SGS Inspection Services Saudi Arabia Ltd., Jeddah
SAR 1 000 000 75 D
Senegal SGS Sénégal SA, Dakar XAF 35 000 000 100 D
Serbia SGS Beograd d.o.o., Beograd EUR 66 161 100 I
10. DATA

221
COUNTRY NAME AND DOMICILEISSUED CAPITAL
CURRENCYISSUED CAPITAL
AMOUNT% HELD BY
GROUPDIRECT /
INDIRECT
Sierra Leone SGS (SL) Ltd., Freetown SLL 200 000 000 100 D
Singapore SGS Testing and Control Services Singapore Pte Ltd., Singapore
SGD 100 000 100 D
Slovakia SGS Slovakia spol.s.r.o., Kosice EUR 19 917 100 I
Slovenia SGS Slovenija d.o.o. - Podjetje za kontrol blaga, Koper
EUR 10 432 100 I
South Africa SGS South Africa (Proprietary) Limited, Johannesburg
ZAR 452 000 500 100 I
South Africa SGS Bateman (Pty) Ltd,Bryanston ZAR 100 100 I
Spain SGS Española de Control SA, Madrid EUR 240 000 100 I
Spain SGS Tecnos, SA, Sociedad Unipersonal, Madrid EUR 92 072 034 100 I
Spain General de Servicios ITV, SA, Madrid EUR 4 559 657 100 I
Sri Lanka SGS Lanka (Private) Limited, Colombo LKR 9 000 000 100 D
Sweden SGS Sweden AB, Göteborg SEK 1 500 000 100 I
Switzerland SGS Société Générale de Surveillance SA, Geneva
CHF 10 000 000 100 I
Switzerland SGS SA, Geneva CHF 7 822 436Ultimate
parent company
Switzerland SGS Group Management SA, Geneva CHF 100 000 100 I
Taiwan SGS Taiwan Limited, Taipei TWD 62 000 000 100 I
Taiwan Compliance Certification Services Inc. New Taipei City
TWD 353 330 780 100 I
Tanzania SGS Tanzania Superintendence Co. Limited, Dar-es-Salaam
TZS 250 000 100 D
Thailand SGS (Thailand) Limited, Bangkok THB 20 000 000 99.99 D
Togo SGS Togo SA, Lomé XOF 10 000 000 100 D
Tunisia SGS Tunisie SA, Tunis TND 49 500 50 D
Turkey SGS Supervise Gözetme Etud Kontrol Servisleri Anonim Sirketi, Istanbul
TRY 6 550 000 100 I
Turkmenistan SGS Turkmen Ltd., Ashgabat USD 50 000 100 D
Uganda SGS Uganda Limited, Kampala UGX 5 000 000 100 D
Ukraine SGS Ukraine, Foreign Enterprise, Odessa USD 400 000 100 I
United Arab Emirates SGS Gulf Limited, Abu Dhabi (Branch office) - - - -
United States SGS North America Inc., Wilmington USD 73 701 996 100 I
United States SGS Accutest Inc., Wilmington USD 10 100 I
United States SGS CyberMetrix Inc., Wilmington USD 241 111 100 I
Uruguay SGS Uruguay Limitada, Montevideo UYU 1 500 100 D
Uruguay Sociedad Uruguaya de Control Técnico de Automotores Sociedad Anónima, Montevideo
UYU 24 000 100 I
Uzbekistan SGS Tashkent Ltd., Tashkent USD 50 000 100 D
Venezuela SGS Venezuela SA, Caracas VEF 162 980 100 D
Vietnam SGS Vietnam Ltd., Ho Chi Minh City USD 288 000 100 D
Zambia SGS Inspections Services Ltd., Lusaka ZMK 5 000 000 100 I
Zimbabwe SGS Zimbabwe (Private) Limited, Harare ZWD 5 000 100 D

SGS SERVICE
> Building Quality Index
CONSUMER BENEFIT
> Compare the quality of your build to the index average
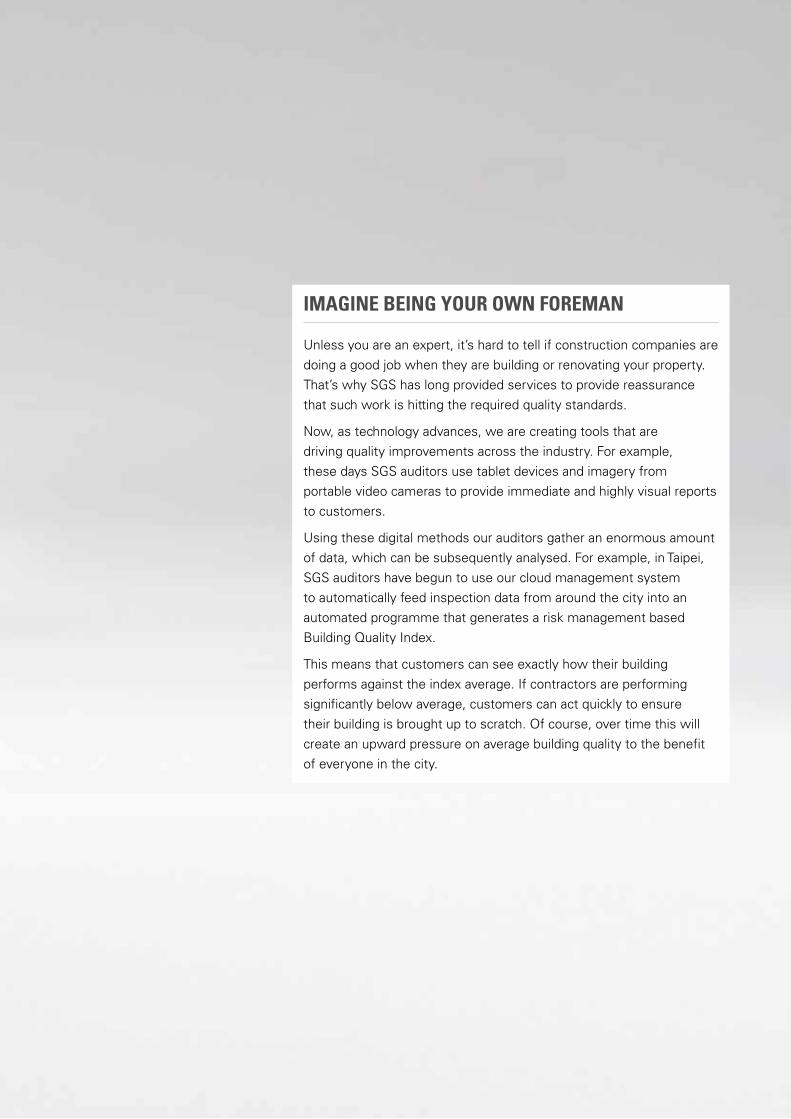
IMAGINE BEING YOUR OWN FOREMAN
Unless you are an expert, it’s hard to tell if construction companies are doing a good job when they are building or renovating your property. That’s why SGS has long provided services to provide reassurance that such work is hitting the required quality standards.
Now, as technology advances, we are creating tools that are driving quality improvements across the industry. For example, these days SGS auditors use tablet devices and imagery from portable video cameras to provide immediate and highly visual reports to customers.
Using these digital methods our auditors gather an enormous amount of data, which can be subsequently analysed. For example, in Taipei, SGS auditors have begun to use our cloud management system to automatically feed inspection data from around the city into an automated programme that generates a risk management based Building Quality Index.
This means that customers can see exactly how their building performs against the index average. If contractors are performing significantly below average, customers can act quickly to ensure their building is brought up to scratch. Of course, over time this will create an upward pressure on average building quality to the benefit of everyone in the city.

224
SGS SA CORPORATE OFFICE
1 place des Alpes P.O. Box 2152 CH – 1211 Geneva 1
t +41 (0)22 739 91 11
f +41 (0)22 739 98 86
www.sgs.com
STOCK EXCHANGE LISTING
SIX Swiss Exchange, SGSN
STOCK EXCHANGE TRADING
SIX Swiss Exchange
COMMON STOCK SYMBOLS
Bloomberg: Registered Share: SGSN.VX
Reuters: Registered Share: SGSN.VX
Telekurs: Registered Share: SGSN
ISIN: Registered Share: CH0002497458
Swiss security number: 249745
CORPORATE COMMUNICATIONS AND INVESTOR RELATIONS SGS SA
Jean-Luc de Buman 1 place des Alpes P.O. Box 2152 CH – 1211 Geneva 1
t +41 (0)22 739 93 31
f +41 (0)22 739 92 00
www.sgs.com
ANNUAL GENERAL MEETING OF SHAREHOLDERS
Tuesday, 21 March 2017 Geneva, Switzerland
2017 HALF YEAR RESULTS
Monday, 17 July 2017
INVESTOR DAYS (IN ASIA)
Thursday and Friday, 26 and 27 October 2017
DIVIDEND PAYMENT DATE
Ex-date: 23 March 2017 Record date: 24 March 2017 Payment date: 27 March 2017
PROJECT MANAGEMENT
Françoise Rein
CONCEPT, DESIGN, PHOTOGRAPHY, REALISATION AND PRODUCTION
Group Charlescannon SARL Geneva, Switzerland
PRINTED BY
Hertig Print SA Lyss, Switzerland
Printed on 100% recycled BalancePure offset paper, February 2017
11. SHAREHOLDER INFORMATION

225
11. SHAREHOLDER INFORMATION

THE PEOPLE BEHIND THE AWARDS
SGS prides itself on being an employer of choice and our efforts in this area were recognised in the Philippines in 2016, when we received the Investor in People (IiP) Gold Award.
IiP is an international standard for people management. It defines what it takes to lead, support and manage people for sustained success.
The main motivation for us to work towards this accreditation was the recognition that our people are our most important asset. This focus on our people is particularly important in view of an anticipated increase in business in the Philippines that could see a doubling of revenue in the country by 2020.
In order to support this expected growth, the local SGS team opted to accelerate the process of obtaining the Gold Award – ultimately achieving it over 12 months sooner than initially envisaged.
Although the award marks us out as one of the most attractive employers in the country, the process of honestly identifying our weaknesses and addressing them was even more important.
By nurturing a purpose-driven culture at SGS and by embracing best practices in areas such as empowering people and learning and development, we have maintained a staff attrition rate of just 11% in the Philippines since we started to work with IiP in 2012.

SGS SERVICE
> Management Development Training
CONSUMER BENEFIT
> Opportunities to advance your leadership skills

WWW.SGS.COM
© S
GS
Gro
up M
anag
emen
t S
A –
201
7 –
All
right
s re
serv
ed –
SG
S is
a r
egis
tere
d tr
adem
ark
of S
GS
Gro
up M
anag
emen
t S
A.