annual report summary 2010 - sydney water · pdf file12 sydney water annual report summary...
TRANSCRIPT

Annual Report Summary 2010
Contents
About Sydney Water 2
Milestones 3
Chairman and Managing Director’s review 5
Sustainability scorecard 7
Financial summary 9
1 Sydney Water Annual Report Summary 2010 12 Sydney Water Annual Report Summary 2010 2

About Sydney WaterSydney Water delivers essential and sustainable water services for the benefit of the community.It is a state owned corporation, constituted under the State Owned Corporations Act 1989 and operates under the Sydney Water Act 1994.
Sydney Water’s three equal, principal objectives are to:
• protect public health • protect the environment • be a successful business.
Sydney Water supplies drinking water, recycled water, wastewater services and some stormwater services to over four million people in Sydney, the Illawarra and the Blue Mountains. It is Australia’s largest water utility.
Wind turbines at Capital Wind Farm offset energy needs of the desalination plant
Sydney Water consults residents about construction work that affects them.
Cover Image: Sydney Water’s Mike Watts, Ian Payne and Susan Trousdale led the desalination project. The reverse osmosis hall is where seawater is forced at high pressure through thousands of reverse osmosis membranes to extract freshwater.
12,700square kilometres
• Area of operations – Sydney, the Illawarra and the Blue Mountains.
4.4 million people with
water services
• About 500 billion litres of water a year supplied.• 1.77 million properties have a water main. • Households used 72% of the water supplied.• Businesses used 28%.
4.3 million people with wastewater services
• 472.3 billion litres of wastewater collected and treated. • 1.72 million properties have a wastewater main.• 100% of captured biosolids used in agriculture or land rehabilitation.• 50% of captured grit and screenings reused.
69,400 people with recycled
water services
• 35.8 billion litres of recycled water a year, 33.7 billion litres by Sydney Water.
• Recycled water is treated to agricultural standards or higher, depending on its use.
5% ownership of
stormwater channels
• Works with councils and other agencies to manage stormwater where possible.
• 440 kilometres of stormwater channels managed as well as some flood-prone areas.
1 Sydney Water Annual Report Summary 2010 12 Sydney Water Annual Report Summary 2010 2
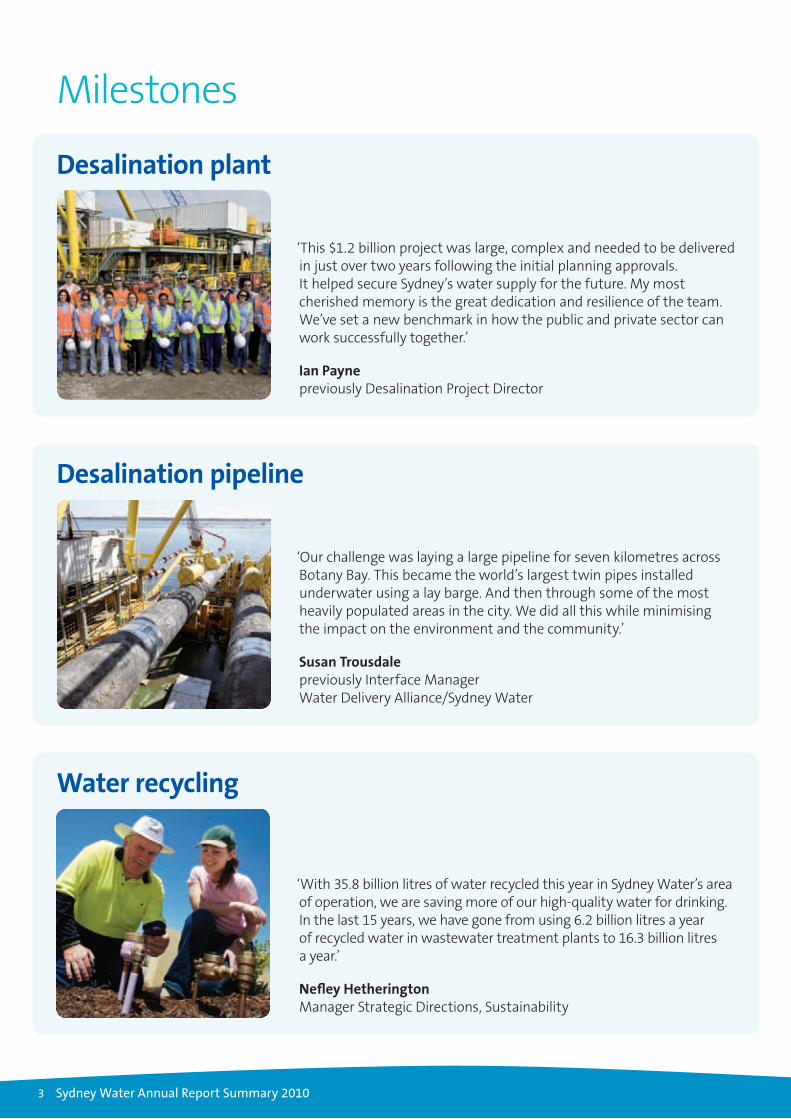
Milestones
Desalination plant
‘This $1.2 billion project was large, complex and needed to be delivered in just over two years following the initial planning approvals. It helped secure Sydney’s water supply for the future. My most cherished memory is the great dedication and resilience of the team. We’ve set a new benchmark in how the public and private sector can work successfully together.’
Ian Paynepreviously Desalination Project Director
Desalination pipeline
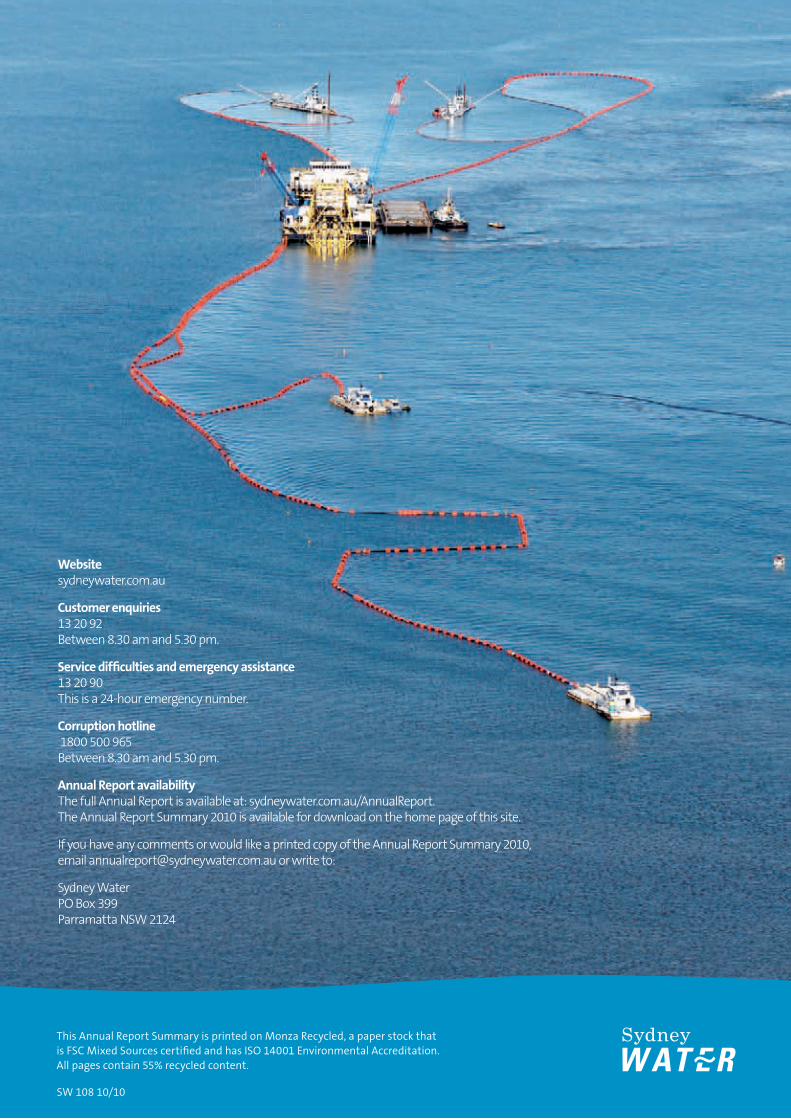
‘Our challenge was laying a large pipeline for seven kilometres across Botany Bay. This became the world’s largest twin pipes installed underwater using a lay barge. And then through some of the most heavily populated areas in the city. We did all this while minimising the impact on the environment and the community.’
Susan Trousdalepreviously Interface Manager Water Delivery Alliance/Sydney Water
Water recycling
‘With 35.8 billion litres of water recycled this year in Sydney Water’s area of operation, we are saving more of our high-quality water for drinking. In the last 15 years, we have gone from using 6.2 billion litres a year of recycled water in wastewater treatment plants to 16.3 billion litres a year.’
Nefley HetheringtonManager Strategic Directions, Sustainability
3 Sydney Water Annual Report Summary 2010 34 Sydney Water Annual Report Summary 2010 4

Renewable energy
‘Eight state-of-the-art methane gas cogeneration plants at wastewater treatment plants are capturing wastewater gases and converting them to green energy. Together with the hydroelectricity projects, these will be generating about 20% of Sydney Water’s energy needs.’
Daniel CooperEnergy Manager
Sustainable and efficient accommodation
‘Our new office and warehouse at Potts Hill houses 450 office and field-based staff. The office building is using up to 70% less water and 50% less energy than a conventional office. The warehouse has consolidated stock and equipment from eight locations with a much more efficient inventory system.’
Ray AbéProgram Manager Workplace Accommodation
Public Water Agency of the Year 2010
‘Sydney Water was named Public Water Agency of the Year 2010 – as the international organisation that made the greatest contribution to meeting the challenges of water supply. This was for the efforts made by Sydney Water to balance water supply and demand through desalination, water efficiency and recycling projects. Queen Noor of Jordan presented the trophy at the Global Water Intelligence Conference in Paris in April 2010. Water industry executives from around the world voted for the award.’
Kerry SchottManaging Director
3 Sydney Water Annual Report Summary 2010 34 Sydney Water Annual Report Summary 2010 4

Chairman and Managing Director’s review
The major highlight of the year was the completion of the desalination project. Water from the plant flowed into the system in January 2010. This $1.9 billion project was completed on time and $90 million below budget. It was the most significant construction for Sydney Water since Warragamba Dam was built 50 years ago.The project has won a number of awards in public private partnership, environmental and project management, and for the use of innovative technologies and techniques. The desalination pipeline construction across Botany Bay was world-first engineering – the largest twin pipes installed underwater using a lay barge.
The desalination project was part of the NSW Government’s Metropolitan Water Plan. This plan is designed to balance water supply and demand, as population increases, in the context of an uncertain climate outlook. The Metropolitan Water Plan was reviewed during the year and Sydney Water was closely involved in that review.
Under the plan, we are responsible for wastewater, recycling and demand management. This year, the Rouse Hill Water Recycling Plant was expanded. Work started on the Hoxton Park recycled water scheme and on the privately owned and operated Recycled Water Plant at Smithfield/Camellia. The pipelines for the St Marys Water Recycling Plant were completed.
Sydney Water also continued to encourage efficient water use. Managing our own leaks continued to be a key focus. Active leak detection, pressure management and water main renewal programs
are showing positive results. Over the past five years, Sydney Water has reduced leaks by 40%. Under the world rating system for leak management, Sydney Water is ranked at the highest level.
Water efficiency initiatives for households and businesses continued. The toilet replacement program for residential customers began and Sydney Water worked closely with schools to assist them in water conservation.
Sydney’s population is expected to reach 5.3 million in 2031. To accommodate the steady increase in population we developed Growth Servicing Plans after consultation with the Department of Planning and developers. Water, wastewater and recycling services continued to be added to the system, particularly in the south-west and north-west growth sectors.
During the year, assets were built to service new lots at Edmondson Park, Hoxton Park, Oran Park and Turner Road in the south-west; at North Kellyville, Alex Avenue and Area 20 in the north-west.
The desalination pipeline construction across Botany Bay was world-first engineering –
the largest twin pipes installed underwater using a lay barge.
5 Sydney Water Annual Report Summary 2010 56 Sydney Water Annual Report Summary 2010 6
New sewerage schemes were constructed at Freemans Reach, Glossodia, Wilberforce, Londonderry, Agnes Banks, Hawkesbury Heights and Yellow Rock.
Both population increase and environmental objectives have led to upgrades at various wastewater treatment plants. During the year, we completed a major upgrade of North Head treatment plant and started work at Winmalee and Wollongong plants. Plans to upgrade the Warriewood plant are underway. Major projects to reduce wet weather overflows have been completed at Blackwattle Bay and Hayes Street Beach, in Neutral Bay.
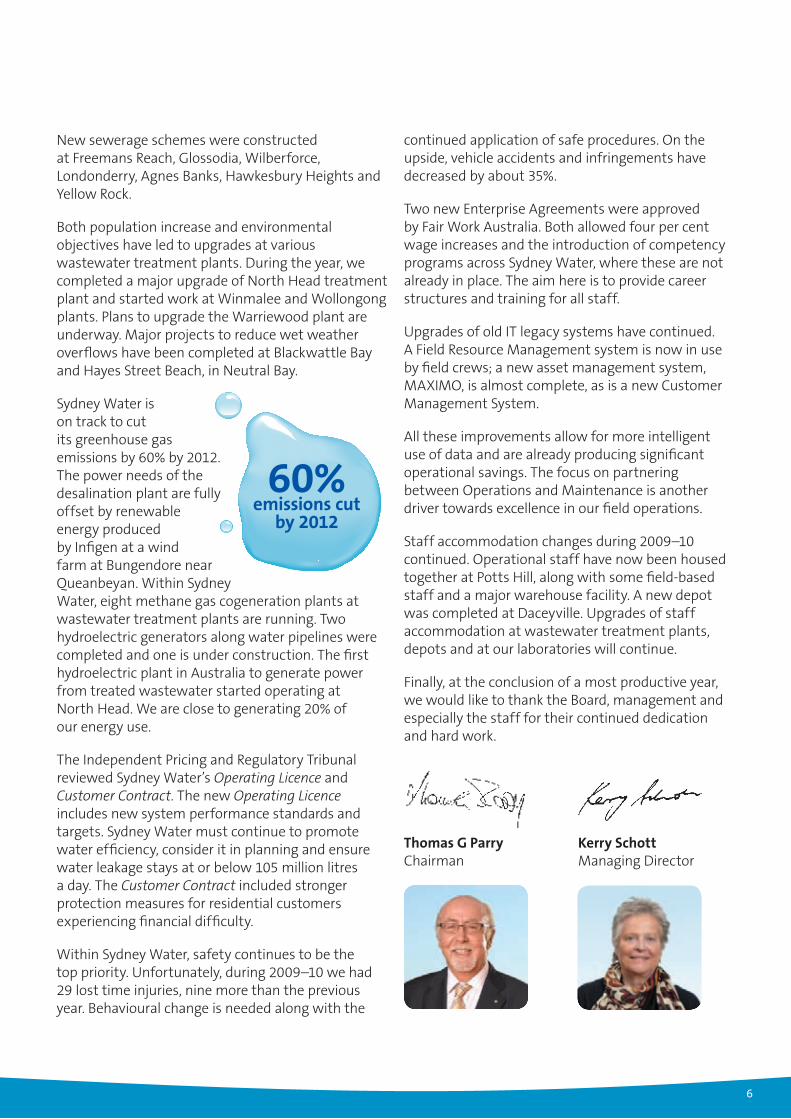
Sydney Water is on track to cut its greenhouse gas emissions by 60% by 2012. The power needs of the desalination plant are fully offset by renewable energy produced by Infigen at a wind farm at Bungendore near Queanbeyan. Within Sydney Water, eight methane gas cogeneration plants at wastewater treatment plants are running. Two hydroelectric generators along water pipelines were completed and one is under construction. The first hydroelectric plant in Australia to generate power from treated wastewater started operating at North Head. We are close to generating 20% of our energy use.
The Independent Pricing and Regulatory Tribunal reviewed Sydney Water’s Operating Licence and Customer Contract. The new Operating Licence includes new system performance standards and targets. Sydney Water must continue to promote water efficiency, consider it in planning and ensure water leakage stays at or below 105 million litres a day. The Customer Contract included stronger protection measures for residential customers experiencing financial difficulty.
Within Sydney Water, safety continues to be the top priority. Unfortunately, during 2009–10 we had 29 lost time injuries, nine more than the previous year. Behavioural change is needed along with the
continued application of safe procedures. On the upside, vehicle accidents and infringements have decreased by about 35%.
Two new Enterprise Agreements were approved by Fair Work Australia. Both allowed four per cent wage increases and the introduction of competency programs across Sydney Water, where these are not already in place. The aim here is to provide career structures and training for all staff.
Upgrades of old IT legacy systems have continued. A Field Resource Management system is now in use by field crews; a new asset management system, MAXIMO, is almost complete, as is a new Customer Management System.
All these improvements allow for more intelligent use of data and are already producing significant operational savings. The focus on partnering between Operations and Maintenance is another driver towards excellence in our field operations.
Staff accommodation changes during 2009–10 continued. Operational staff have now been housed together at Potts Hill, along with some field-based staff and a major warehouse facility. A new depot was completed at Daceyville. Upgrades of staff accommodation at wastewater treatment plants, depots and at our laboratories will continue.
Finally, at the conclusion of a most productive year, we would like to thank the Board, management and especially the staff for their continued dedication and hard work.
Thomas G Parry Kerry SchottChairman Managing Director
60% emissions cut
by 2012
5 Sydney Water Annual Report Summary 2010 56 Sydney Water Annual Report Summary 2010 6

Sustainability scorecardThis scorecard provides an overview of Sydney Water’s sustainability performance in 2009–10.The scorecard is based on Sydney Water’s goals, which integrate the social, economic and environmental aspects of our performance.
It includes summary statements and progress ratings based on management evaluation of Sydney Water’s performance against its sustainability indicators. Sydney Water’s sustainability indicators performance data is available in the full 2010 Annual Report at sydneywater.com.au
Goal 2009–10 Performance summaryProgress rating
2009-10
2008-09
2007-08
Serving customers
Customer satisfaction: Customer satisfaction with service delivery remained high and there was a significant reduction in the number of customer complaints.
▲ ö ö
Social assistance: Sydney Water continued to support customers experiencing difficulties by providing flexible payment arrangements.
▲ ▲ ▲
Service quality and system performance: Water and wastewater system performance targets met.
▲ ▲ ▲
Maintaining a water efficient city
Reuse and recycling: 17.5 billion litres of drinking water saved through recycling schemes. More than seven per cent of total wastewater collected was recycled.
▲ ▲ ▲
Water leakage: Leakage is at its lowest level of 6.7% of drinking water drawn. The Operating Licence target of 105 million litres a day was met.
▲ ▲ ▲
Demand management: Investment in demand management and water savings has increased significantly since the programs began in 1999. Despite a minor increase in the volume of water drawn in 2009–10, water use has remained at historically low levels.
▲ ▲ ▲
Water drawn: There was a minor increase of three per cent in the total volume of water drawn due to a hot, dry summer.
▲ ▲ ▲
Providing clean, safe drinking water
Water quality: Continued full compliance with the Australian Drinking Water Guidelines 2004.
▲ ▲ ▲
Customer satisfaction with water: Customer feedback shows satisfaction with water quality is high.
▲ ▲ ▲
Contributing to clean beaches, oceans, rivers and harbours
Wastewater treatment system discharges: Treated wastewater discharge loads remained within Environment Protection Licence limits.
▲ ▲ ▲
Breaches of statutory instruments: One tier 3 penalty notice was issued under the Protection of the Environmental Operations (Waste) Regulation 2005 to a Sydney Water contractor. No environmental harm occurred as a result of the incident.
▲ ö ▲
Environmental performance monitoring: Long-term results show water quality and ecosystem health in inland waterways and at Sydney beaches continue to be maintained.
▲ ▲ ö
Trade waste agreements: The mass of heavy metals discharged into the sewer remained within total limits specified in trade waste consents for the various catchments.
▲ ▲ ▲
7 Sydney Water Annual Report Summary 2010 78 Sydney Water Annual Report Summary 2010 8
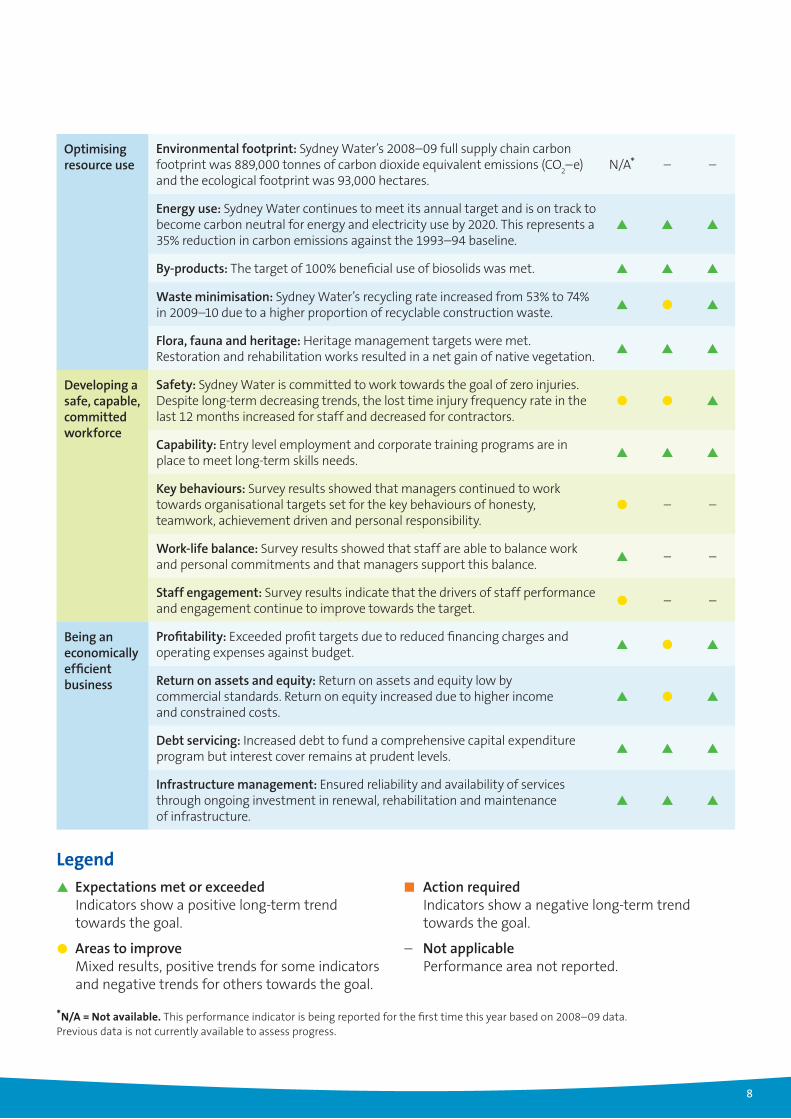
Optimising resource use
Environmental footprint: Sydney Water’s 2008–09 full supply chain carbon footprint was 889,000 tonnes of carbon dioxide equivalent emissions (CO
2–e)
and the ecological footprint was 93,000 hectares.N/A* – –
Energy use: Sydney Water continues to meet its annual target and is on track to become carbon neutral for energy and electricity use by 2020. This represents a 35% reduction in carbon emissions against the 1993–94 baseline.
▲ ▲ ▲
By-products: The target of 100% beneficial use of biosolids was met. ▲ ▲ ▲
Waste minimisation: Sydney Water’s recycling rate increased from 53% to 74% in 2009–10 due to a higher proportion of recyclable construction waste.
▲ ö ▲
Flora, fauna and heritage: Heritage management targets were met. Restoration and rehabilitation works resulted in a net gain of native vegetation.
▲ ▲ ▲
Developing a safe, capable, committed workforce
Safety: Sydney Water is committed to work towards the goal of zero injuries. Despite long-term decreasing trends, the lost time injury frequency rate in the last 12 months increased for staff and decreased for contractors.
ö ö ▲
Capability: Entry level employment and corporate training programs are in place to meet long-term skills needs.
▲ ▲ ▲
Key behaviours: Survey results showed that managers continued to work towards organisational targets set for the key behaviours of honesty, teamwork, achievement driven and personal responsibility.
ö – –
Work-life balance: Survey results showed that staff are able to balance work and personal commitments and that managers support this balance.
▲ – –
Staff engagement: Survey results indicate that the drivers of staff performance and engagement continue to improve towards the target.
ö – –
Being an economically efficient business
Profitability: Exceeded profit targets due to reduced financing charges and operating expenses against budget.
▲ ö ▲
Return on assets and equity: Return on assets and equity low by commercial standards. Return on equity increased due to higher income and constrained costs.
▲ ö ▲
Debt servicing: Increased debt to fund a comprehensive capital expenditure program but interest cover remains at prudent levels.
▲ ▲ ▲
Infrastructure management: Ensured reliability and availability of services through ongoing investment in renewal, rehabilitation and maintenance of infrastructure.
▲ ▲ ▲
▲ Expectations met or exceededIndicators show a positive long-term trend towards the goal.
ö Areas to improveMixed results, positive trends for some indicators and negative trends for others towards the goal.
■ Action requiredIndicators show a negative long-term trend towards the goal.
– Not applicablePerformance area not reported.
Legend
*N/A = Not available. This performance indicator is being reported for the first time this year based on 2008–09 data. Previous data is not currently available to assess progress.
7 Sydney Water Annual Report Summary 2010 78 Sydney Water Annual Report Summary 2010 8

Financial summarySydney Water’s total income for 2009–10 was $2.2 billion, $230 million (12%) higher than 2008–09. Prices increased on average by around seven per cent plus the Consumer Price Index. This is in line with the Independent Pricing and Regulatory Tribunal’s (IPART) pricing determination for Sydney Water. It also reflects IPART’s determination of higher bulk water charges for the Sydney Catchment Authority. Water volumes sold increased slightly, due to the hot, dry summer.
Total operating expenditure of $1.1 billion was $49 million (4.8%) higher than 2008–09. This was driven by higher labour costs and a rise in the cost of bulk
water that Sydney Water buys from the Sydney Catchment Authority.
Capital expenditure in 2009–10 included completion of the desalination plant and pipeline and continued expenditure on asset renewals, reliability, government programs and growth.
Gearing (debt/debt plus equity) continues to rise, as new borrowing occurs to cover the large increase in capital expenditure.
Earnings before interest, tax, depreciation and amortisation were about $1.1 billion, $181 million (20%) higher than 2008–09, due to higher income and controlled operating expenses.
Depreciation, amortisation and impairments were $182 million, $56 million (23%) lower than 2008–09, due to a reversal of previous asset impairments.
Interest expense was $291 million, $56 million (24%) higher than in 2008–09. This related to higher borrowings to finance capital expenditure and a large increase in the Government guarantee fee on those borrowings.
Tax expense for the year was $192 million, $15 million (seven per cent) lower than 2008–09.
Profit after tax for 2009–10, of $446 million, was $195 million higher than 2008–09, mostly due to higher income.
Total assets were valued at $14.0 billion, $1.2 billion higher than last financial year. During the year, Sydney Water spent $1.1 billion on capital expenditure.
Total liabilities were $8.4 billion, $1.1 billion higher than last year, due mostly to higher borrowings. During the year, Sydney Water’s net borrowings increased by $947 million, mainly to fund the capital expenditure program. Total debt outstanding at the end of the year was $6.5 billion.
Shareholder equity increased by $186 million during the year to $5.6 billion.
$1.1billion capital expenditure
Summary profit and loss*2009–10
$M2008–09
$M2007–08
$M2006–07
$M2005–06
$M
Total income 2,187 1,958 1,766 1,693 1,541
Operating expenses 1,076 1,027 975 969 887
Earnings before interest, tax, depreciation and amortisation 1,111 931 791 724 654
Depreciation, amortisation and impairments 182 238 193 184 224
Interest expense 291 235 210 180 172
Profit before tax 638 458 388 360 257
Taxation expense 192 207 109 103 135
Profit after tax 446 251 279 257 122
Dividend payable 232 205 190 140 193
*Excludes superannuation actuarial gains/losses.
9 Sydney Water Annual Report Summary 2010 910 Sydney Water Annual Report Summary 2010 10

Summary cash flow2009–10
$M2008–09
$M2007–08
$M2006–07
$M2005–06
$M
Sources
Receipts from operations 2,093 1,891 1,618 1,534 1,392
Grants, interest, CSO and other operational receipts 155 138 119 106 98
Borrowings 957 1,336 1,100 420 254
Other receipts 63 21 270 121 68
Total sources 3,268 3,386 3,107 2,180 1,812
Uses
Operational expense 1,251 1,244 1,172 1,052 924
Capital expenditure 1,196 1,567 1,234 591 468
Dividends 205 190 140 193 120
Income tax 88 71 105 63 41
Interest 410 285 258 218 206
Other payments 79 51 191 59 42
Total uses 3,227 3,408 3,101 2,176 1,801
Increase (decrease) in cash 41 –22 6 5 11
Note: Interest paid includes the Government guarantee fee and capital expenditure payments including payments for intangibles.
Summary balance sheet2009–10
$M2008–09
$M2007–08
$M2006–07
$M2005–06
$M
Property, plant and equipment 13,475 12,316 12,355 11,909 10,528
Other assets 481 398 318 387 291
Total assets 13,956 12,714 12,673 12,296 10,819
Total debt 6,505 5,558 4,218 3,276 2,875
Other liabilities 1,884 1,774 1,714 1,780 1,460
Total liabilities 8,389 7,332 5,932 5,056 4,335
Net assets/equity 5,567 5,381 6,741 7,240 6,484
Cash receipts from operations in 2009–10 were $2.1 billion, an increase of 11% over the previous year. Sydney Water borrowed an additional $957 million (excluding repayments and other financing items).
Cash used for operational purposes increased by less than one per cent over the previous year. A total of $1.2 billion was used for capital expenditure. Interest
paid increased by $125 million (44%), due to the increase in debt in recent years to fund increased capital expenditure.
The dividend paid to the NSW Government of $205 million was in line with the amount agreed in the Statement of Corporate Intent.
9 Sydney Water Annual Report Summary 2010 910 Sydney Water Annual Report Summary 2010 10
This Annual Report Summary is printed on Monza Recycled, a paper stock that is FSC Mixed Sources certified and has ISO 14001 Environmental Accreditation. All pages contain 55% recycled content.
SW 108 10/10
Website sydneywater.com.au
Customer enquiries 13 20 92 Between 8.30 am and 5.30 pm.
Service difficulties and emergency assistance 13 20 90 This is a 24-hour emergency number.
Corruption hotline 1800 500 965 Between 8.30 am and 5.30 pm.
Annual Report availability The full Annual Report is available at: sydneywater.com.au/AnnualReport. The Annual Report Summary 2010 is available for download on the home page of this site.
If you have any comments or would like a printed copy of the Annual Report Summary 2010, email [email protected] or write to:
Sydney Water PO Box 399 Parramatta NSW 2124