annual report summary for testing in 2003 … · annual report summary for testing in 2003 prepared...
TRANSCRIPT

ANNUAL REPORT SUMMARY FOR TESTING IN 2003 Prepared by the Parentage Testing Standards Program Unit
October 2004 PREFACE This year marks the 20th anniversary of the AABB parentage laboratory accreditation program. At a joint conference of the AMA/ABA in 1977, the need for accreditation was recognized. AABB assumed the role of accreditation organization of parentage laboratories as the same testing technology used in the blood bank was also used in parentage testing. Over the past twenty years, paternity tests have moved towards different technologies. With AABB's expanded mission into the area of cellular therapies, the testing used to evaluate the success of some cellular therapies is the same as that used in parentage testing, renewing the alliance of technologies. This year’s annual report for 2003 continues the past precedent of providing basic summary statistics for testing that took place in the previous year. AABB sent surveys to 60 organizations that indicated they performed parentage testing and 44 (73%) laboratories returned the surveys. Although these surveys were mostly from accredited laboratories in the United States, several of the laboratories were from Canada and Europe. Many of the laboratories reported testing a broad range of cases, including relationship tests for routine parentage testing, immigration, prenatal evaluations, and post-mortem evaluations. In this report, AABB provides some commentary regarding misconceptions relating to the significance of the survey results. Some of the commentary from last year is included in this year's report, as the commentary remains relevant to issues raised this year. The Parentage Testing Standards Program Unit would also like to remind readers that shortly after publication of each edition of Standards for Parentage Testing Laboratories, the AABB publishes a guidance document that discusses the Standards in some detail. The Guidance for Standards for Parentage Testing Laboratories provides suggestions on how to comply with the standards and contains explanations of the standards; various calculations used, and addresses other issues in parentage testing.

ANNUAL VOLUME OF TESTING The volume reported for cases tested in 2003 was 354,011, a 3.9% increase over the 2002 reported volume and an approximately 700% increase since 1984. Based on these case numbers, approximately 991,000 persons were tested in 2003. A summary of the totals of all years since 1988 is shown in Table 1 and Figure 1. Table 1. The Number of Parentage Cases Reported for 1988-2003.
Year No. of Cases Year No. of Cases 1988 77000 1996 172316 1989 85231 1997 237981 1990 120436 1998 247317 1991 143459 1999 280510 1992 161000 2000 300626 1993 189904 2001 310490 1994 193000 2002 340798 1995 149100 2003 354011
Figure 1. Graph of the Case Volume for 1988-2003.
Number of Cases
0
50000
100000
150000
200000
250000
300000
350000
400000
1988 1989 1990 1991 1992 1993 1994 1995 1996 1997 1998 1999 2000 2001 2002 2003
Year
Cas
e Vo
lum
e
The totals include data from parentage laboratories worldwide. A total of 44 laboratories responded to the survey, six more than last year.
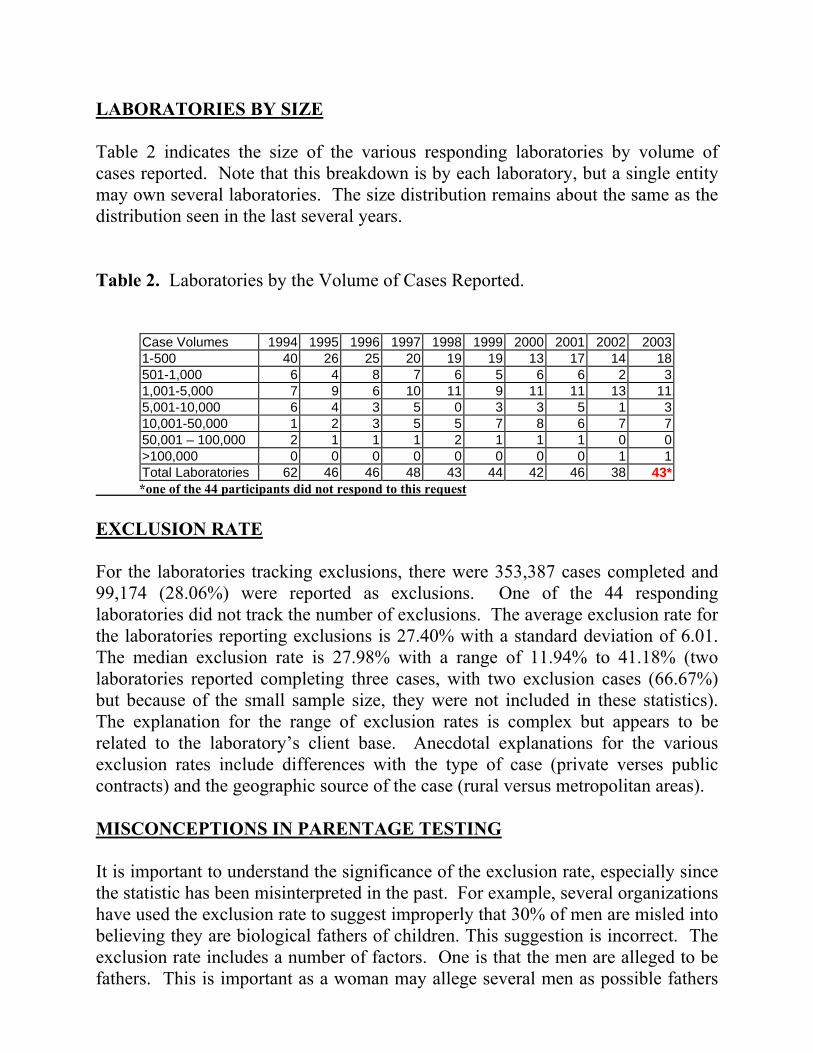
LABORATORIES BY SIZE Table 2 indicates the size of the various responding laboratories by volume of cases reported. Note that this breakdown is by each laboratory, but a single entity may own several laboratories. The size distribution remains about the same as the distribution seen in the last several years. Table 2. Laboratories by the Volume of Cases Reported.
Case Volumes 1994 1995 1996 1997 1998 1999 2000 2001 2002 20031-500 40 26 25 20 19 19 13 17 14 18501-1,000 6 4 8 7 6 5 6 6 2 31,001-5,000 7 9 6 10 11 9 11 11 13 115,001-10,000 6 4 3 5 0 3 3 5 1 310,001-50,000 1 2 3 5 5 7 8 6 7 750,001 – 100,000 2 1 1 1 2 1 1 1 0 0>100,000 0 0 0 0 0 0 0 0 1 1Total Laboratories 62 46 46 48 43 44 42 46 38 43*
*one of the 44 participants did not respond to this request EXCLUSION RATE For the laboratories tracking exclusions, there were 353,387 cases completed and 99,174 (28.06%) were reported as exclusions. One of the 44 responding laboratories did not track the number of exclusions. The average exclusion rate for the laboratories reporting exclusions is 27.40% with a standard deviation of 6.01. The median exclusion rate is 27.98% with a range of 11.94% to 41.18% (two laboratories reported completing three cases, with two exclusion cases (66.67%) but because of the small sample size, they were not included in these statistics). The explanation for the range of exclusion rates is complex but appears to be related to the laboratory’s client base. Anecdotal explanations for the various exclusion rates include differences with the type of case (private verses public contracts) and the geographic source of the case (rural versus metropolitan areas). MISCONCEPTIONS IN PARENTAGE TESTING It is important to understand the significance of the exclusion rate, especially since the statistic has been misinterpreted in the past. For example, several organizations have used the exclusion rate to suggest improperly that 30% of men are misled into believing they are biological fathers of children. This suggestion is incorrect. The exclusion rate includes a number of factors. One is that the men are alleged to be fathers. This is important as a woman may allege several men as possible fathers
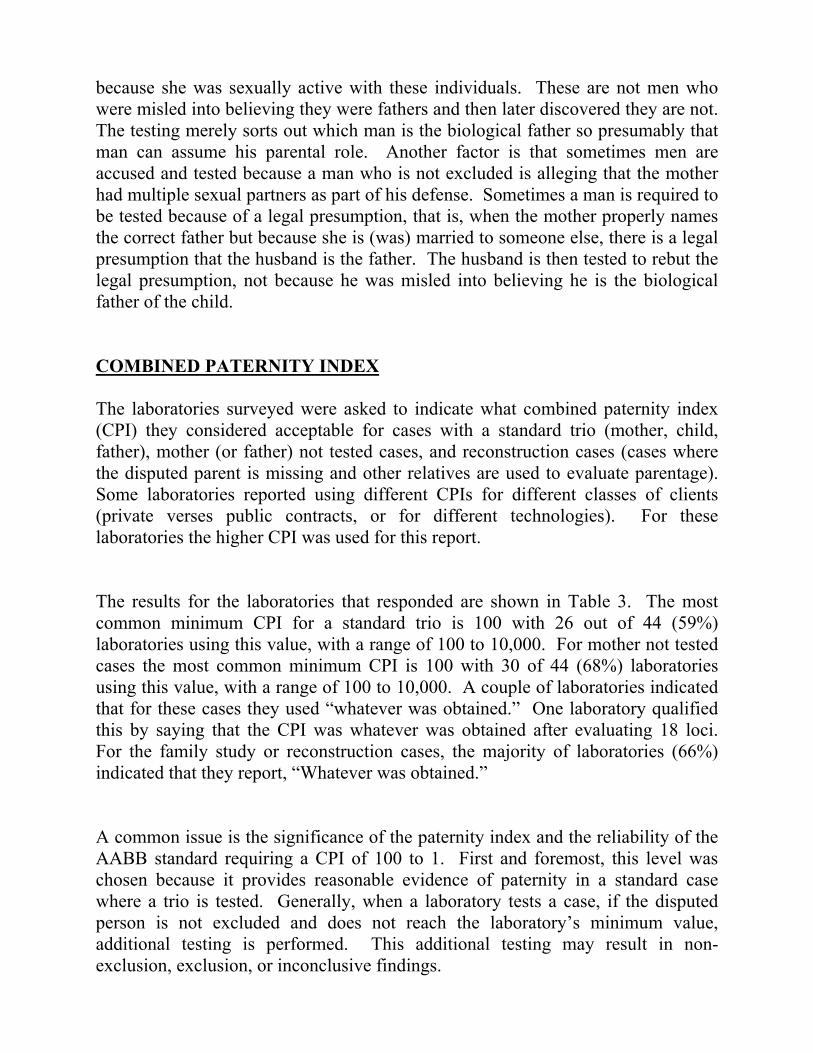
because she was sexually active with these individuals. These are not men who were misled into believing they were fathers and then later discovered they are not. The testing merely sorts out which man is the biological father so presumably that man can assume his parental role. Another factor is that sometimes men are accused and tested because a man who is not excluded is alleging that the mother had multiple sexual partners as part of his defense. Sometimes a man is required to be tested because of a legal presumption, that is, when the mother properly names the correct father but because she is (was) married to someone else, there is a legal presumption that the husband is the father. The husband is then tested to rebut the legal presumption, not because he was misled into believing he is the biological father of the child. COMBINED PATERNITY INDEX The laboratories surveyed were asked to indicate what combined paternity index (CPI) they considered acceptable for cases with a standard trio (mother, child, father), mother (or father) not tested cases, and reconstruction cases (cases where the disputed parent is missing and other relatives are used to evaluate parentage). Some laboratories reported using different CPIs for different classes of clients (private verses public contracts, or for different technologies). For these laboratories the higher CPI was used for this report. The results for the laboratories that responded are shown in Table 3. The most common minimum CPI for a standard trio is 100 with 26 out of 44 (59%) laboratories using this value, with a range of 100 to 10,000. For mother not tested cases the most common minimum CPI is 100 with 30 of 44 (68%) laboratories using this value, with a range of 100 to 10,000. A couple of laboratories indicated that for these cases they used “whatever was obtained.” One laboratory qualified this by saying that the CPI was whatever was obtained after evaluating 18 loci. For the family study or reconstruction cases, the majority of laboratories (66%) indicated that they report, “Whatever was obtained.” A common issue is the significance of the paternity index and the reliability of the AABB standard requiring a CPI of 100 to 1. First and foremost, this level was chosen because it provides reasonable evidence of paternity in a standard case where a trio is tested. Generally, when a laboratory tests a case, if the disputed person is not excluded and does not reach the laboratory’s minimum value, additional testing is performed. This additional testing may result in non-exclusion, exclusion, or inconclusive findings.
Another significant issue arises with regard to performing other relationship analyses such as reconstruction cases, trios with genetic anomalies, and samples from exhumations, coroners, and postmortem testing. It is important to note that a CPI of less than 100 is not an indicator of non-paternity, unless 0 (or much less than 1), and may still in fact be a strong indicator of paternity. Practical difficulties exist with the ability to obtain results from degraded samples, as happens in postmortem testing, and in the mathematical analysis of the relationships in reconstruction cases. This concept is particularly important for legislators who establish presumption levels based on paternity calculations, and contract administrators, who need to differentiate between reasonable science and what might be achieved under ideal conditions. Also remember that a laboratory’s minimum combined paternity index, which may reflect scientific reality, is not necessarily the laboratory’s testing goal or median combined paternity index. Table 3. The Number of Laboratories Using Various Combined Paternity Indices for Standard Trios, Mother (Father) Not Tested (MNT) and Reconstruction Cases (Note: not all laboratories indicated a CPI for each type of case).
Minimum Acceptable CPI in Your Laboratory Under the Following Conditions
Type of Case CPI Trio No Mother Family Study
(Reconstruction) Whatever is
obtained 2 2 23
100 26 30 9 101 1 150 2 2 1 200 2 3 1 400 1 500 2 1 1000 6 4 1001 1 1
10000 2 1
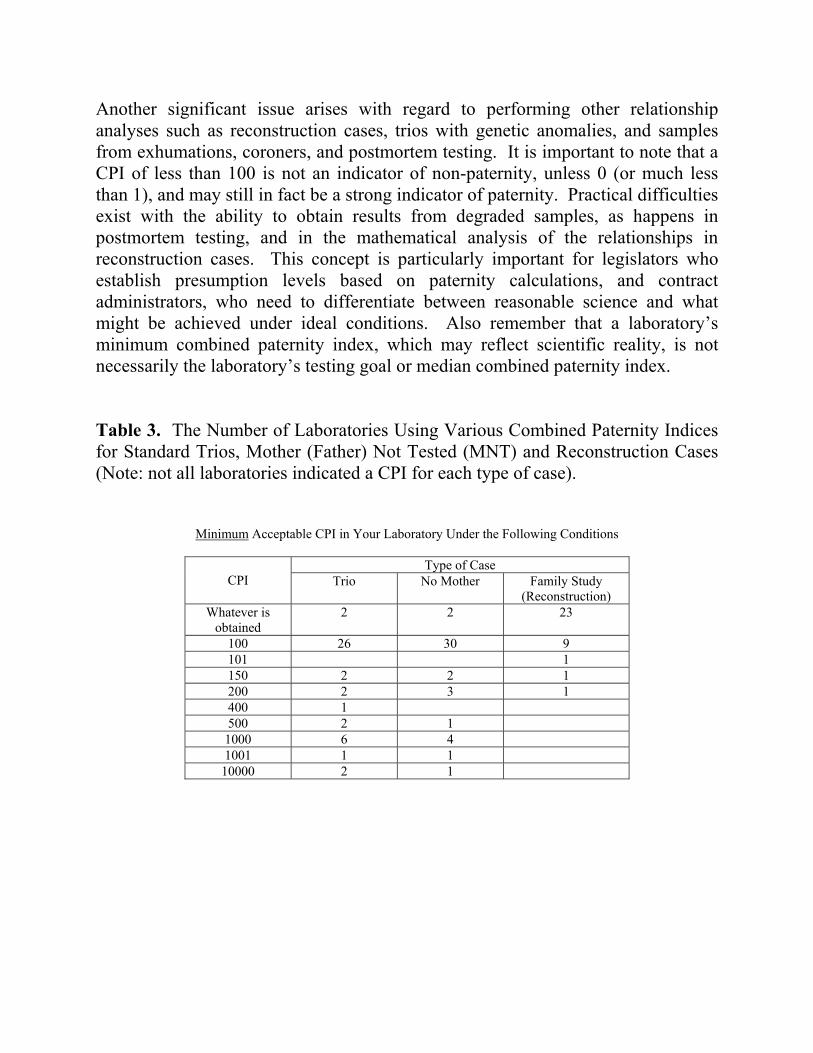
TECHNOLOGY USE The survey showed a continued trend toward the increased use of polymerase chain reaction (PCR) technology with a decrease in the use of restriction fragment length polymorphism (RFLP) methods. PCR short tandem repeat (STR) technology was used in 93.26% of reported cases, while RFLP analysis was used in 2.48% of reported cases. For the first time SNP technology was reported in paternity evaluation. SNP was used in 3.99% of reported cases, exceeding the use of RFLP methods. All other technologies were used in about 0.27% of reported cases. Table 4 provides a breakdown of the technology used to resolve the reported paternity cases. The laboratories using HLA molecular methods were asked to identify the source of the frequencies. Laboratories using HLA molecular for Class I HLA methods reported using serologic tables for calculating paternity indices. Table 4. The Technology Used in Cases Reported in 2003
Technology Number of Cases Utilization (%) Red Cell Antigens 3 0.00085
HLA Serology 3 0.00085 HLA Class 1 Molecular 95 0.02689 HLA Class II Molecular 777 0.21995
Red Cell Enzymes/Serum Proteins
0 0
Allotyping 0 0 RFLP 8744 2.475 STR 329467 93.263 SNP 14111 3.994
Y Chromosome 65 0.018 Total of All Technologies 353265 100
*Note that some cases used more than one technology. Not all laboratories responded to this question.
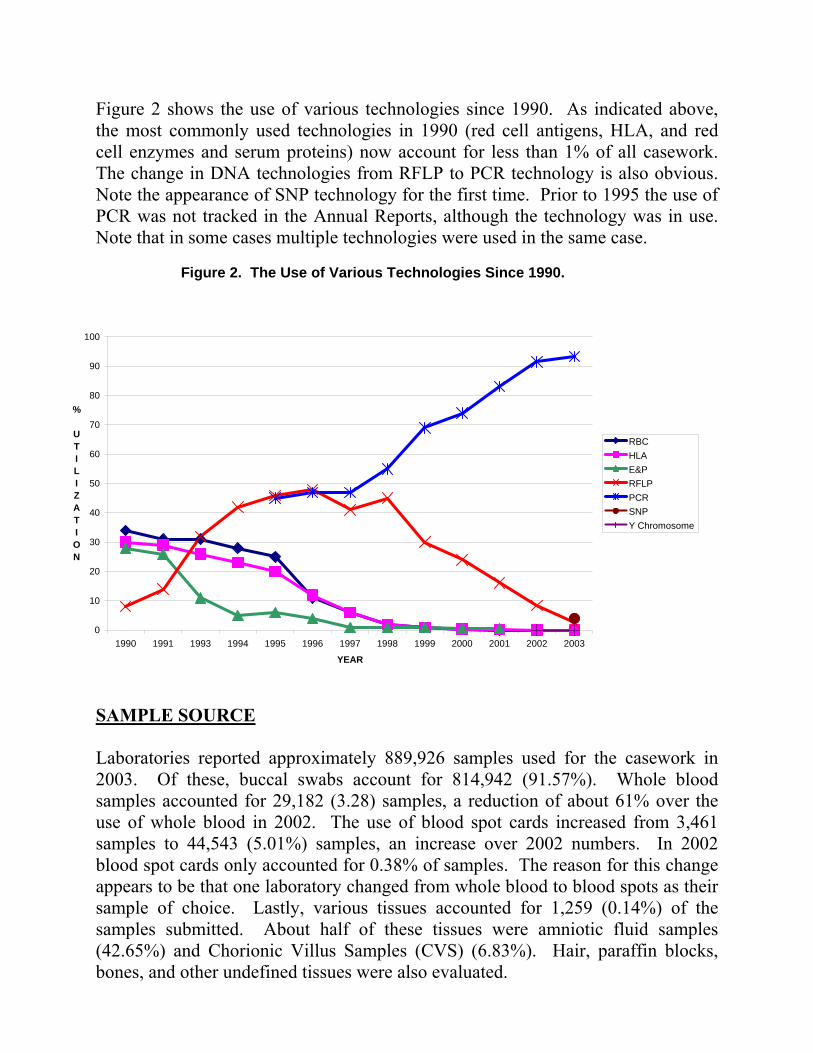
Figure 2 shows the use of various technologies since 1990. As indicated above, the most commonly used technologies in 1990 (red cell antigens, HLA, and red cell enzymes and serum proteins) now account for less than 1% of all casework. The change in DNA technologies from RFLP to PCR technology is also obvious. Note the appearance of SNP technology for the first time. Prior to 1995 the use of PCR was not tracked in the Annual Reports, although the technology was in use. Note that in some cases multiple technologies were used in the same case.
Figure 2. The Use of Various Technologies Since 1990.
0
10
20
30
40
50
60
70
80
90
100
1990 1991 1993 1994 1995 1996 1997 1998 1999 2000 2001 2002 2003
YEAR
% UTILIZATION
RBCHLAE&PRFLPPCRSNPY Chromosome
SAMPLE SOURCE Laboratories reported approximately 889,926 samples used for the casework in 2003. Of these, buccal swabs account for 814,942 (91.57%). Whole blood samples accounted for 29,182 (3.28) samples, a reduction of about 61% over the use of whole blood in 2002. The use of blood spot cards increased from 3,461 samples to 44,543 (5.01%) samples, an increase over 2002 numbers. In 2002 blood spot cards only accounted for 0.38% of samples. The reason for this change appears to be that one laboratory changed from whole blood to blood spots as their sample of choice. Lastly, various tissues accounted for 1,259 (0.14%) of the samples submitted. About half of these tissues were amniotic fluid samples (42.65%) and Chorionic Villus Samples (CVS) (6.83%). Hair, paraffin blocks, bones, and other undefined tissues were also evaluated.

PROBABILITY OF EXCLUSION So few laboratories use RFLP technology that probability of exclusion data and mutation/null allele data were not tracked. With the small number of laboratories using RFLP, statistically significant numbers could not be achieved. For those seeking information on RFLP, please review previous annual reports (available at www.AABB.org) or the appendices of Guidance for Standards for Parentage Testing Laboratories published by AABB. Appendix 1 shows the average probability of exclusion for the various PCR loci reported. For the CODIS loci a sufficient sample size is available to make statistical analysis of the laboratory's probabilities of exclusion. This was done without regard to the database used. Table 5 shows the statistical analysis of the probabilities of exclusion provided for the CODIS loci. The range of probabilities of exclusion seen is partly caused by using different frequency tables (population sampling differences) or by varying methods of determining the probability of exclusion. This same observation was made in previous years. Table 5. The Mean Probability of Exclusion, Standard Deviation, Mode, Median, Range and Number of Laboratories Reporting Results for the CODIS Loci in 2003.
Locus Mean StDev Mode Median Range ∆ Range
# Labs
VWA 61.96 2.36 62.5 62.5 52.3 - 64.7 12.4 35 D7S820 59.50 2.83 58.2 59.0 51.3 - 63.7 12.4 35
TH 54.57 2.63 56.6 54.2 46.4 - 59.2 12.8 34 D18S51 73.13 2.96 73.1 74.1 64.7 - 78.0 13.3 33
D16S539 53.96 4.55 56.6 55.8 44.8 - 63.0 18.2 34 CSF1P0 50.43 3.64 49.6 49.6 38.1 - 57.0 18.9 34 D3S1358 58.5 4.22 63.0 58.0 48.3 - 67.5 19.2 33 D21S11 68.25 4.32 70.8 68.7 52.9 - 72.3 19.4 33 D5S818 46.18 3.81 44.0 45.5 34.0 - 56.1 22.1 34
FGA 72.81 3.98 76.6 72.4 60.7 - 83.6 22.9 33 TPOX 37.16 5.69 32.9 35.9 27.8 - 51.2 23.4 34
D8S1179 63.05 5.46 68.0 61.5 52.7 - 78.9 26.2 33 D13S317 52.86 6.62 48.7 52.3 44.2 - 71.5 27.3 35

In order to evaluate the effects of different frequency tables the probability of exclusion was calculated for the two loci at the extremes, D13S317 and VWA. The formula used was that of Garber and Morris (R. A. Garber & J. W. Morris. General Equations for the Average Power of Exclusion for Genetic Systems of n Codominant Alleles in One-Parent and No-Parent Cases of Disputed Parentage. In R. H. Walker, ed., Inclusion Probabilities in Parentage Testing. AABB, pg. 277-280 (1983).
)433()()1(,
22
1Â −+∑−∑
<=
+ = P jPiP jPiPiPn
jiji
n
ii
Where Ā is the average probability of exclusion, in an n allele codominant system that has alleles a, b,…, i, j,….n and allele frequencies of Pa, Pb, …, Pi, Pj,… Pn. Table 6. The average probability of exclusion obtained using the formula above and published Caucasian data. FBI, ABI, and Promega were indicated as sources for frequencies used by the laboratories in Table 5. NIST is provided as another published frequency table, but was apparently not used by any laboratories.
LOCUS D13S317 VWA
Frequency Table
FBI1 ABI2 PROMEGA2 NIST3 FBI1 ABI2 PROMEGA2 NIST3
# Alleles 392 400 420 604 392 400 426 604 Ā (%) 56.8 59.5 57.6 59.2 62.5 61.7 62.8 62.2
X ± SD 58.28±1.29 62.3±0.469 1 Budowle, et al, J Forensic Sci 1999;44(6). 2 Provided by company as part of their kit 3 Butler, et al, J Forensic Sci 2003;48(4). The probabilities of exclusions obtained by the reporting laboratories for each frequency source is shown in Table 7. In looking at D13S539 the reason for the large range that appears in Table 5 may be the frequency table used by laboratories using frequency provided by Promega. In Table 6 available data was analyzed and the Promega frequencies for the available data were comparable to the other frequency tables. Promega may have more than one frequency table available, which may explain the difference between Table 6 and 7 Promega data. NIST used PowerPlex 16 to obtain the frequencies shown in Table 6, and NIST's average probability of exclusion is comparable to the probability of exclusion obtained with other data sources. Laboratories using Promega frequency tables should review the power of exclusion they are using.
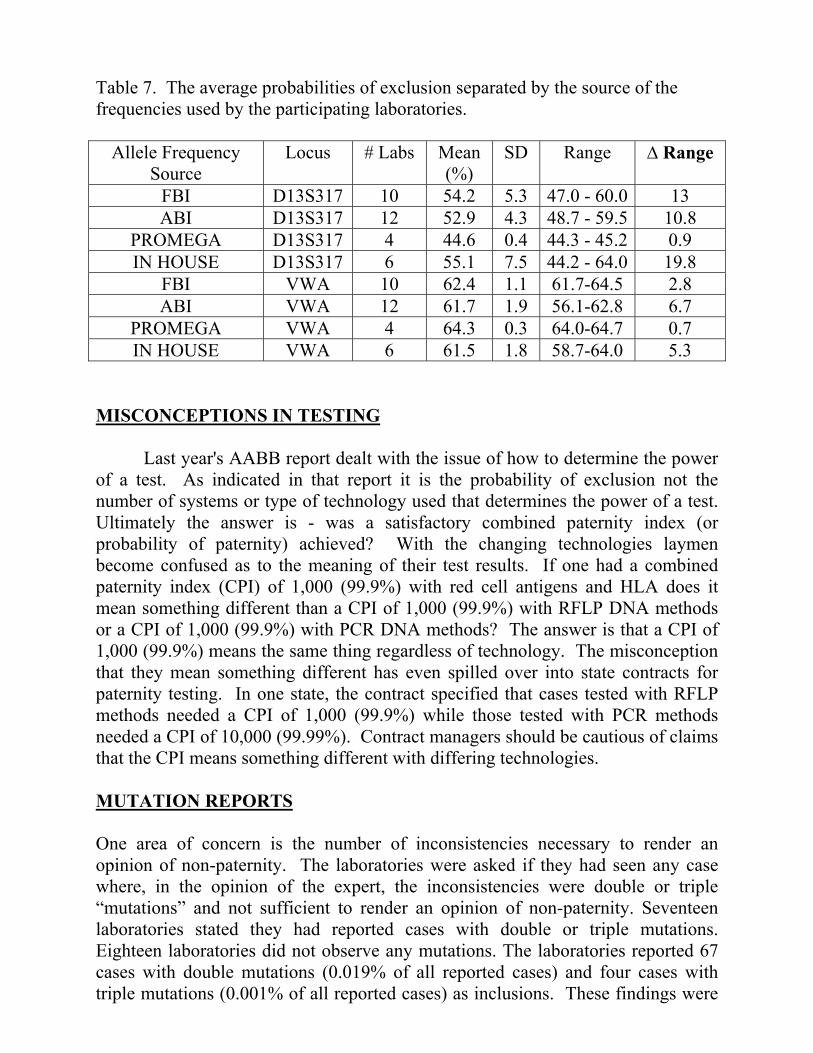
Table 7. The average probabilities of exclusion separated by the source of the frequencies used by the participating laboratories.
Allele Frequency Source
Locus # Labs Mean (%)
SD Range ∆ Range
FBI D13S317 10 54.2 5.3 47.0 - 60.0 13 ABI D13S317 12 52.9 4.3 48.7 - 59.5 10.8
PROMEGA D13S317 4 44.6 0.4 44.3 - 45.2 0.9 IN HOUSE D13S317 6 55.1 7.5 44.2 - 64.0 19.8
FBI VWA 10 62.4 1.1 61.7-64.5 2.8 ABI VWA 12 61.7 1.9 56.1-62.8 6.7
PROMEGA VWA 4 64.3 0.3 64.0-64.7 0.7 IN HOUSE VWA 6 61.5 1.8 58.7-64.0 5.3
MISCONCEPTIONS IN TESTING
Last year's AABB report dealt with the issue of how to determine the power of a test. As indicated in that report it is the probability of exclusion not the number of systems or type of technology used that determines the power of a test. Ultimately the answer is - was a satisfactory combined paternity index (or probability of paternity) achieved? With the changing technologies laymen become confused as to the meaning of their test results. If one had a combined paternity index (CPI) of 1,000 (99.9%) with red cell antigens and HLA does it mean something different than a CPI of 1,000 (99.9%) with RFLP DNA methods or a CPI of 1,000 (99.9%) with PCR DNA methods? The answer is that a CPI of 1,000 (99.9%) means the same thing regardless of technology. The misconception that they mean something different has even spilled over into state contracts for paternity testing. In one state, the contract specified that cases tested with RFLP methods needed a CPI of 1,000 (99.9%) while those tested with PCR methods needed a CPI of 10,000 (99.99%). Contract managers should be cautious of claims that the CPI means something different with differing technologies. MUTATION REPORTS One area of concern is the number of inconsistencies necessary to render an opinion of non-paternity. The laboratories were asked if they had seen any case where, in the opinion of the expert, the inconsistencies were double or triple “mutations” and not sufficient to render an opinion of non-paternity. Seventeen laboratories stated they had reported cases with double or triple mutations. Eighteen laboratories did not observe any mutations. The laboratories reported 67 cases with double mutations (0.019% of all reported cases) and four cases with triple mutations (0.001% of all reported cases) as inclusions. These findings were
similar to those observed in 2001 and 2002. Most laboratories report these cases with the inconsistencies noted and statistically considered. This illustrates the importance of accurate assessments of potential mutations and null alleles. With PCR-STR technology, this assessment is made easier than RFLP technology as the repeat differences between the obligatory allele and the closest allele in the disputed parent can be evaluated as part of the evaluation process.
MUTATION CALCULATION AND FREQUENCIES Single inconsistencies are routinely seen in the testing of paternity cases. If a laboratory comes to the conclusion that the inconsistency is a mutation, then the mutation result must be incorporated into the reported results. Laboratories were asked how they calculated the paternity index (PI) for these loci. The laboratories all appear to be using one of several calculation methods. Interestingly, several laboratories use different methods for different cases. The rational for using different methods in different cases is not known to the committee. Some laboratories are using the mutation rate as the PI (8% of laboratories), while others (61%) used the mutation rate divided by the average probability of exclusion. Some laboratories (5.9%) used the mutation rate as a transmission frequency and 17.6% of the laboratories used Brenner’s method in looking at the repeat length difference between STR alleles. During the 2004 annual meeting a presentation summarizing research among both European and American statisticians indicating general consensus that the future of mutation calculations is the method described by Fimmers, et.al. (Fimmers, R., L. Henke, J. Henke & M.P. Baur. 1992. How to deal with mutations in DNA-testing, pp. 285-287 in Advances in Forensic Haemogenetics 4, edited by C. Rittner & P.M. Schneider. Springer-Verlag, Berlin). The presentation at the 2004 Annual Meeting is, in part, based the data collected on specific mutation changes reported in last years AABB Annual Report Summary for 2002. The data collected for 2003 is reported in this year’s report. Based on the observation of the statistician evaluating this issue and those laboratories present at the annual meeting, the committee will be asking contributing laboratories to present the specific mutation changes by ethnic group for the 2004 cases. A summary of the mutation frequencies for each STR locus is provided in Appendix 2. In Appendix 3 a summary of the distance (repeat lengths) from the obligatory allele is provided. The frequencies for changes from one allele to another are presented in Appendix 6.

NULL ALLELES Null allele data was similar to last year’s report. As with last year’s report the frequency of the null phenotype is separated from the mutation rate, as these frequencies do not represent the frequency of the null allele. Laboratories should be careful in evaluating case with potential null alleles. The use of alternative primers may resolve these cases. In next years report the laboratories will not be asked to provide null allele data in order to concentrate on the mutation calculation issue. Very little data was presented from laboratories using Promega primers, therefore the summary table contains last years data. ABI data is summarized in Appendix 4 and Appendix 5. For a further discussion see the Annual Report Summary for Testing in 2002. The raw data is presented in Appendix 7. AMELOGENIN The amelogenin locus is now used in a number of laboratories to test for the gender of the sample. A number of males lacking the Y or X amelogenin allele have been observed. Laboratories were asked to measure the apparent X males observed in their laboratory. No laboratory using Promega primers reported X or Y male phenotypes, although in last year’s report several laboratories reported seeing amelogenin mutations. Like other DNA loci, amelogenin is subject to mutations. Therefore, occasionally normal males have a female amelogenin phenotype or a Y phenotype. The X male phenotype was most commonly seen in the “oriental” populations, in about 1/628 men. The Y male phenotype was most commonly seen in the Black population in about 1/2221 Black males.
Table 8. A Summary of Data on Apparent X and Y Males Seen with ABI Primers
Race/Ethnicity
Black
White
Hispanic American
Indian
Oriental Number X
Males Observed
34
33
13
1
4
% 0.033 0.039 0.102 0.079 0.159 Number Y
Males Observed
46
5
1
0
1
% 0.045 0.006 0.008 0.040 Total
Number of Males Tested
102,176
84,925
12,752
1,270
2,512
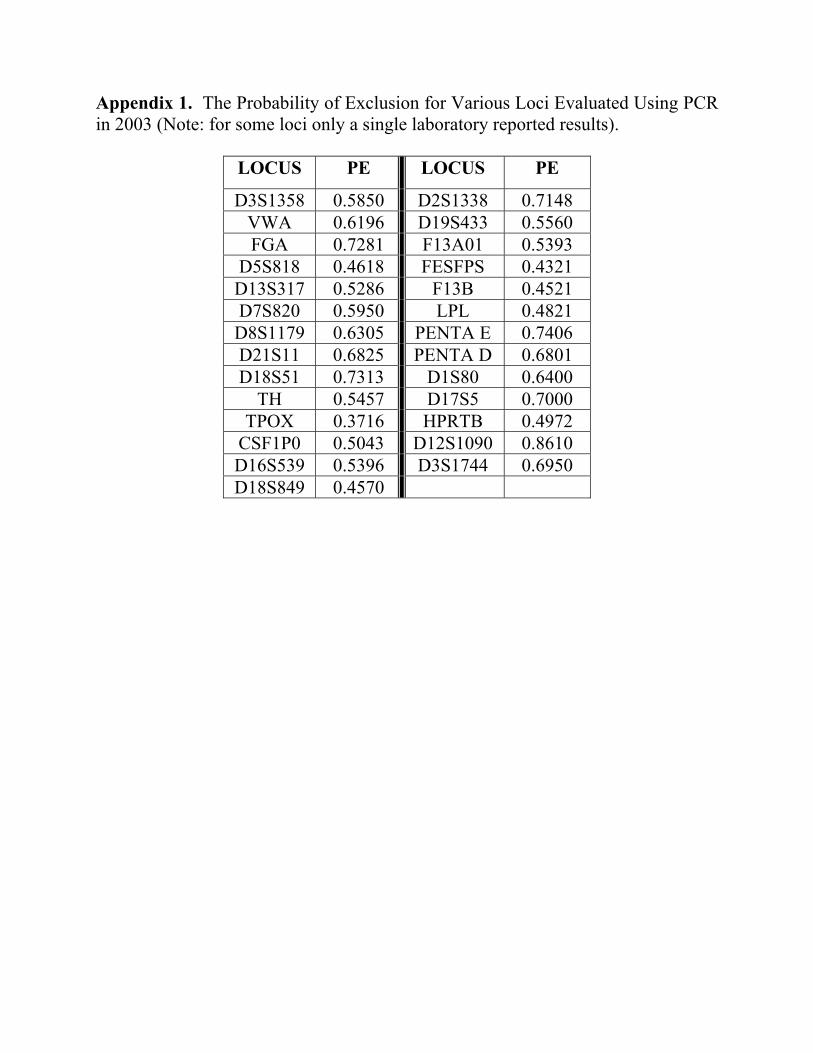
Appendix 1. The Probability of Exclusion for Various Loci Evaluated Using PCR in 2003 (Note: for some loci only a single laboratory reported results).
LOCUS PE LOCUS PE
D3S1358 0.5850 D2S1338 0.7148 VWA 0.6196 D19S433 0.5560 FGA 0.7281 F13A01 0.5393
D5S818 0.4618 FESFPS 0.4321 D13S317 0.5286 F13B 0.4521 D7S820 0.5950 LPL 0.4821 D8S1179 0.6305 PENTA E 0.7406 D21S11 0.6825 PENTA D 0.6801 D18S51 0.7313 D1S80 0.6400
TH 0.5457 D17S5 0.7000 TPOX 0.3716 HPRTB 0.4972
CSF1P0 0.5043 D12S1090 0.8610 D16S539 0.5396 D3S1744 0.6950 D18S849 0.4570
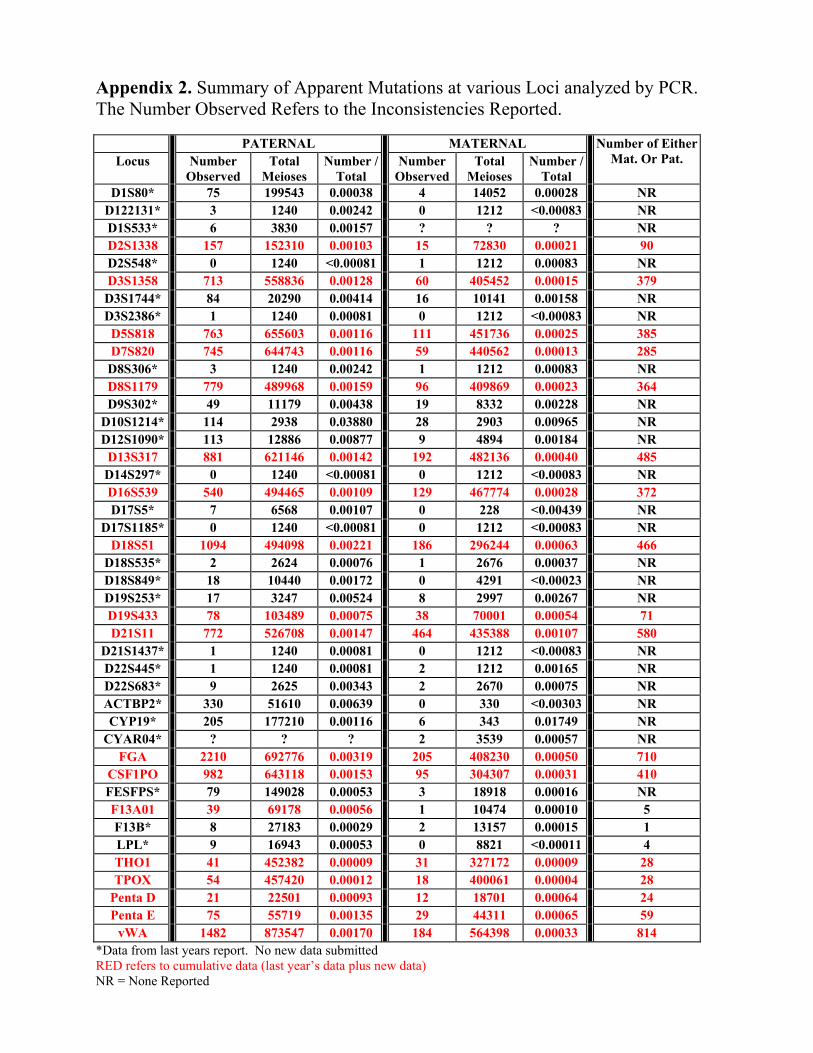
Appendix 2. Summary of Apparent Mutations at various Loci analyzed by PCR. The Number Observed Refers to the Inconsistencies Reported.
PATERNAL MATERNAL Locus Number
Observed Total
Meioses Number /
Total Number
ObservedTotal
Meioses Number /
Total
Number of Either Mat. Or Pat.
D1S80* 75 199543 0.00038 4 14052 0.00028 NR D122131* 3 1240 0.00242 0 1212 <0.00083 NR D1S533* 6 3830 0.00157 ? ? ? NR D2S1338 157 152310 0.00103 15 72830 0.00021 90 D2S548* 0 1240 <0.00081 1 1212 0.00083 NR D3S1358 713 558836 0.00128 60 405452 0.00015 379 D3S1744* 84 20290 0.00414 16 10141 0.00158 NR D3S2386* 1 1240 0.00081 0 1212 <0.00083 NR D5S818 763 655603 0.00116 111 451736 0.00025 385 D7S820 745 644743 0.00116 59 440562 0.00013 285
D8S306* 3 1240 0.00242 1 1212 0.00083 NR D8S1179 779 489968 0.00159 96 409869 0.00023 364 D9S302* 49 11179 0.00438 19 8332 0.00228 NR
D10S1214* 114 2938 0.03880 28 2903 0.00965 NR D12S1090* 113 12886 0.00877 9 4894 0.00184 NR D13S317 881 621146 0.00142 192 482136 0.00040 485 D14S297* 0 1240 <0.00081 0 1212 <0.00083 NR D16S539 540 494465 0.00109 129 467774 0.00028 372 D17S5* 7 6568 0.00107 0 228 <0.00439 NR
D17S1185* 0 1240 <0.00081 0 1212 <0.00083 NR D18S51 1094 494098 0.00221 186 296244 0.00063 466
D18S535* 2 2624 0.00076 1 2676 0.00037 NR D18S849* 18 10440 0.00172 0 4291 <0.00023 NR D19S253* 17 3247 0.00524 8 2997 0.00267 NR D19S433 78 103489 0.00075 38 70001 0.00054 71 D21S11 772 526708 0.00147 464 435388 0.00107 580
D21S1437* 1 1240 0.00081 0 1212 <0.00083 NR D22S445* 1 1240 0.00081 2 1212 0.00165 NR D22S683* 9 2625 0.00343 2 2670 0.00075 NR ACTBP2* 330 51610 0.00639 0 330 <0.00303 NR CYP19* 205 177210 0.00116 6 343 0.01749 NR
CYAR04* ? ? ? 2 3539 0.00057 NR FGA 2210 692776 0.00319 205 408230 0.00050 710
CSF1PO 982 643118 0.00153 95 304307 0.00031 410 FESFPS* 79 149028 0.00053 3 18918 0.00016 NR F13A01 39 69178 0.00056 1 10474 0.00010 5 F13B* 8 27183 0.00029 2 13157 0.00015 1 LPL* 9 16943 0.00053 0 8821 <0.00011 4 THO1 41 452382 0.00009 31 327172 0.00009 28 TPOX 54 457420 0.00012 18 400061 0.00004 28
Penta D 21 22501 0.00093 12 18701 0.00064 24 Penta E 75 55719 0.00135 29 44311 0.00065 59
vWA 1482 873547 0.00170 184 564398 0.00033 814 *Data from last years report. No new data submitted RED refers to cumulative data (last year’s data plus new data) NR = None Reported
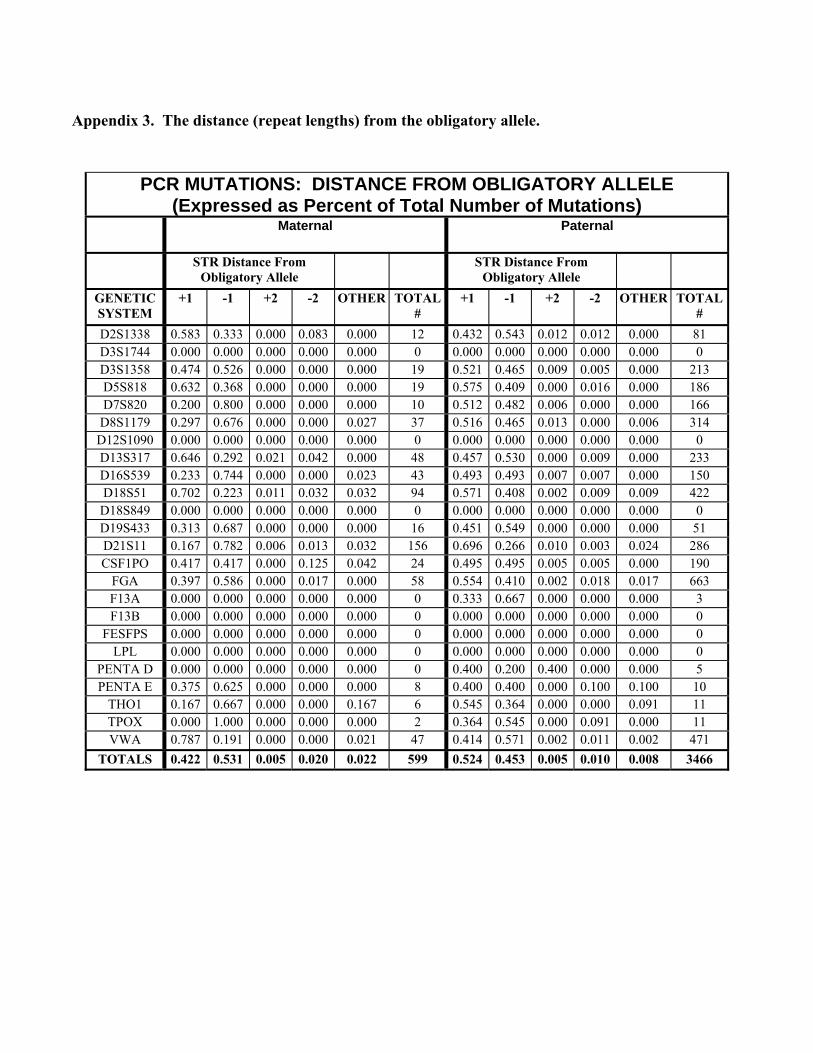
Appendix 3. The distance (repeat lengths) from the obligatory allele.
PCR MUTATIONS: DISTANCE FROM OBLIGATORY ALLELE (Expressed as Percent of Total Number of Mutations)
Maternal Paternal
STR Distance From Obligatory Allele
STR Distance From Obligatory Allele
GENETIC SYSTEM
+1 -1 +2 -2 OTHER TOTAL #
+1 -1 +2 -2 OTHER TOTAL #
D2S1338 0.583 0.333 0.000 0.083 0.000 12 0.432 0.543 0.012 0.012 0.000 81 D3S1744 0.000 0.000 0.000 0.000 0.000 0 0.000 0.000 0.000 0.000 0.000 0 D3S1358 0.474 0.526 0.000 0.000 0.000 19 0.521 0.465 0.009 0.005 0.000 213 D5S818 0.632 0.368 0.000 0.000 0.000 19 0.575 0.409 0.000 0.016 0.000 186 D7S820 0.200 0.800 0.000 0.000 0.000 10 0.512 0.482 0.006 0.000 0.000 166
D8S1179 0.297 0.676 0.000 0.000 0.027 37 0.516 0.465 0.013 0.000 0.006 314 D12S1090 0.000 0.000 0.000 0.000 0.000 0 0.000 0.000 0.000 0.000 0.000 0 D13S317 0.646 0.292 0.021 0.042 0.000 48 0.457 0.530 0.000 0.009 0.000 233 D16S539 0.233 0.744 0.000 0.000 0.023 43 0.493 0.493 0.007 0.007 0.000 150 D18S51 0.702 0.223 0.011 0.032 0.032 94 0.571 0.408 0.002 0.009 0.009 422
D18S849 0.000 0.000 0.000 0.000 0.000 0 0.000 0.000 0.000 0.000 0.000 0 D19S433 0.313 0.687 0.000 0.000 0.000 16 0.451 0.549 0.000 0.000 0.000 51 D21S11 0.167 0.782 0.006 0.013 0.032 156 0.696 0.266 0.010 0.003 0.024 286 CSF1PO 0.417 0.417 0.000 0.125 0.042 24 0.495 0.495 0.005 0.005 0.000 190
FGA 0.397 0.586 0.000 0.017 0.000 58 0.554 0.410 0.002 0.018 0.017 663 F13A 0.000 0.000 0.000 0.000 0.000 0 0.333 0.667 0.000 0.000 0.000 3 F13B 0.000 0.000 0.000 0.000 0.000 0 0.000 0.000 0.000 0.000 0.000 0
FESFPS 0.000 0.000 0.000 0.000 0.000 0 0.000 0.000 0.000 0.000 0.000 0 LPL 0.000 0.000 0.000 0.000 0.000 0 0.000 0.000 0.000 0.000 0.000 0
PENTA D 0.000 0.000 0.000 0.000 0.000 0 0.400 0.200 0.400 0.000 0.000 5 PENTA E 0.375 0.625 0.000 0.000 0.000 8 0.400 0.400 0.000 0.100 0.100 10
THO1 0.167 0.667 0.000 0.000 0.167 6 0.545 0.364 0.000 0.000 0.091 11 TPOX 0.000 1.000 0.000 0.000 0.000 2 0.364 0.545 0.000 0.091 0.000 11 VWA 0.787 0.191 0.000 0.000 0.021 47 0.414 0.571 0.002 0.011 0.002 471
TOTALS 0.422 0.531 0.005 0.020 0.022 599 0.524 0.453 0.005 0.010 0.008 3466
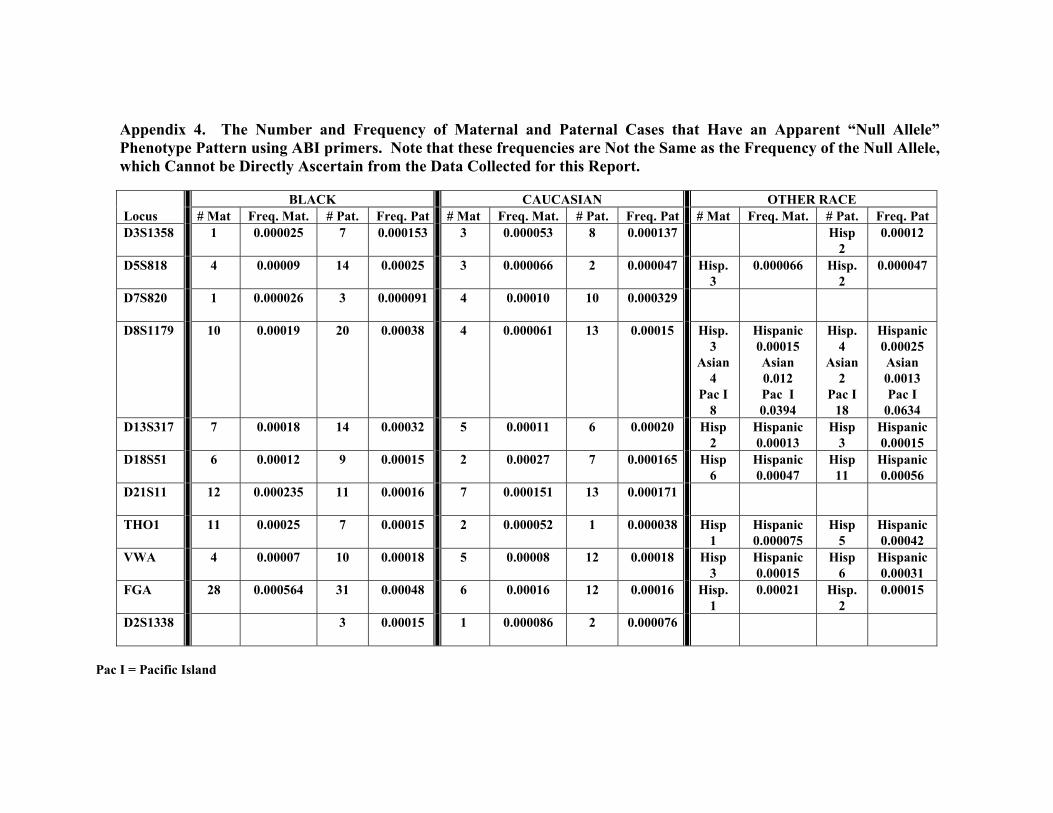
Appendix 4. The Number and Frequency of Maternal and Paternal Cases that Have an Apparent “Null Allele” Phenotype Pattern using ABI primers. Note that these frequencies are Not the Same as the Frequency of the Null Allele, which Cannot be Directly Ascertain from the Data Collected for this Report.
BLACK CAUCASIAN OTHER RACE Locus # Mat Freq. Mat. # Pat. Freq. Pat # Mat Freq. Mat. # Pat. Freq. Pat # Mat Freq. Mat. # Pat. Freq. Pat D3S1358 1 0.000025 7 0.000153 3 0.000053 8 0.000137 Hisp
2 0.00012
D5S818 4 0.00009 14 0.00025 3 0.000066 2 0.000047 Hisp. 3
0.000066 Hisp. 2
0.000047
D7S820 1 0.000026 3 0.000091 4 0.00010 10 0.000329
D8S1179 10 0.00019 20 0.00038 4 0.000061 13 0.00015 Hisp. 3
Asian 4
Pac I 8
Hispanic 0.00015 Asian 0.012 Pac I 0.0394
Hisp. 4
Asian 2
Pac I 18
Hispanic 0.00025 Asian 0.0013 Pac I
0.0634 D13S317 7 0.00018 14 0.00032 5 0.00011 6 0.00020 Hisp
2 Hispanic 0.00013
Hisp 3
Hispanic 0.00015
D18S51 6 0.00012 9 0.00015 2 0.00027 7 0.000165 Hisp 6
Hispanic 0.00047
Hisp 11
Hispanic 0.00056
D21S11
12 0.000235 11 0.00016 7 0.000151 13 0.000171
THO1 11 0.00025 7 0.00015 2 0.000052 1 0.000038 Hisp 1
Hispanic 0.000075
Hisp 5
Hispanic 0.00042
VWA 4 0.00007 10 0.00018 5 0.00008 12 0.00018 Hisp 3
Hispanic 0.00015
Hisp 6
Hispanic 0.00031
FGA 28 0.000564 31 0.00048 6 0.00016 12 0.00016 Hisp. 1
0.00021 Hisp. 2
0.00015
D2S1338 3 0.00015 1 0.000086 2 0.000076
Pac I = Pacific Island

BLACK CAUCASIAN OTHER RACE Locus # Mat Freq. Mat. # Pat. Freq. Pat # Mat Freq. Mat. # Pat. Freq. Pat # Mat Freq. Mat. # Pat. Freq. Pat TPOX 2 0.000057 1 0.00024 Hisp
2 0.00013
D5S818 4 0.00009 14 0.00025 3 0.000066 2 0.000047 Hisp. 3
0.000066 Hisp. 2
0.000047
CSF1PO 2 0.000053 5 0.00012 2 0.000053 12 0.00028 Hisp 2
0.00018
D16S539
1 0.000026 6 0.00010 6 0.00013 4 0.000073 Hisp 2
0.00039 Hisp 2
0.00017
D19S433
3 0.00021 4 0.00021 1 0.000087 2 0.000085 Hisp 3
0.00082

Appendix 5. This appendix provides a summary of the potential null alleles based on the data supplied. The sample for the 2003 Promega mutation data was insufficient to draw a conclusion so the 2002 data is presented. Note that the use of the term YES means the data is consistent with the presence of a null allele. See the Annual Report Summary for Testing in 2002 for a complete discussion of the method used to make a determination.
Appendix 6. Apparent mutation changes from on allele to another.
Maternal and Paternal D3S1358 Mutations Observed in 2003 Apparent Change Paternal Maternal From To Observed % Total Observed %Total
20 19 2 0.94% 19 20 5 2.35% 19 18 13 6.10% 4 21.05% 18 19 29 13.62% 3 15.79% 18 17 26 12.21% 3 15.79% 17 18 33 15.49% 0.00% 17 16 21 9.86% 2 10.53% 17 15 1 0.47% 16 18 1 0.47% 16 17 27 12.68% 4 21.05% 16 15 24 11.27% 1 5.26% 15 16 13 6.10%
PRIMER SOURCELOCUSABI (2003) PROMEGA (2002)
D3S1358 YES ?D5S818 YES ?D7S820 YES ?
D13S317 YES YESD16S539 NO YESD18S51 YES ?D21S11 YES YES
PENTA D N/A YESPENTA E N/A YES
THO1 YES YESTPOX YES ?VWA YES YESFGA YES YES
D2S1338 YES N/AD19S433 ? N/AD8S1179 YES ?CSF1PO NO ?

15 14 13 6.10% 14 15 3 1.41% 2 10.53% 13 15 1 0.47% 13 14 1 0.47%
213 100.00% 19 100.00%
Maternal and Paternal D5S818 Mutations Observed in 2003 Apparent Change Paternal Maternal From To Observed % Total Observed %Total
16 15 2 1.08% 15 16 1 0.54% 15 14 3 1.61% 14 15 6 3.23% 1 5.26% 14 13 26 13.98% 3 15.79% 13 14 40 21.51% 5 26.32% 13 12 28 15.05% 3 15.79% 12 13 40 21.51% 2 10.53% 12 11 11 5.91% 1 5.26% 12 10 1 0.54% 11 12 14 7.53% 2 10.53% 11 10 5 2.69% 11 9 1 0.54% 10 11 3 1.61% 2 10.53% 10 9 1 0.54% 9 10 3 1.61% 9 7 1 0.54% 186 100.00% 19 100.00%
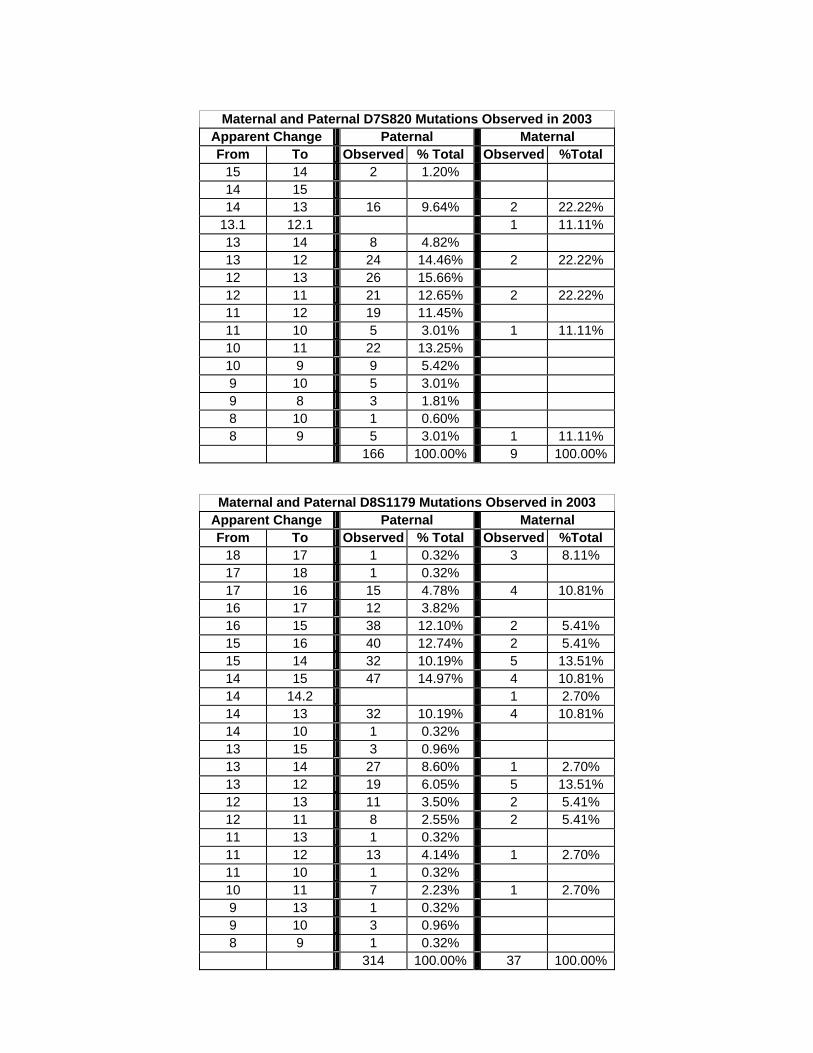
Maternal and Paternal D7S820 Mutations Observed in 2003
Apparent Change Paternal Maternal From To Observed % Total Observed %Total
15 14 2 1.20% 14 15 14 13 16 9.64% 2 22.22%
13.1 12.1 1 11.11% 13 14 8 4.82% 13 12 24 14.46% 2 22.22% 12 13 26 15.66% 12 11 21 12.65% 2 22.22% 11 12 19 11.45% 11 10 5 3.01% 1 11.11% 10 11 22 13.25% 10 9 9 5.42% 9 10 5 3.01% 9 8 3 1.81% 8 10 1 0.60% 8 9 5 3.01% 1 11.11% 166 100.00% 9 100.00%
Maternal and Paternal D8S1179 Mutations Observed in 2003 Apparent Change Paternal Maternal From To Observed % Total Observed %Total
18 17 1 0.32% 3 8.11% 17 18 1 0.32% 17 16 15 4.78% 4 10.81% 16 17 12 3.82% 16 15 38 12.10% 2 5.41% 15 16 40 12.74% 2 5.41% 15 14 32 10.19% 5 13.51% 14 15 47 14.97% 4 10.81% 14 14.2 1 2.70% 14 13 32 10.19% 4 10.81% 14 10 1 0.32% 13 15 3 0.96% 13 14 27 8.60% 1 2.70% 13 12 19 6.05% 5 13.51% 12 13 11 3.50% 2 5.41% 12 11 8 2.55% 2 5.41% 11 13 1 0.32% 11 12 13 4.14% 1 2.70% 11 10 1 0.32% 10 11 7 2.23% 1 2.70% 9 13 1 0.32% 9 10 3 0.96% 8 9 1 0.32% 314 100.00% 37 100.00%
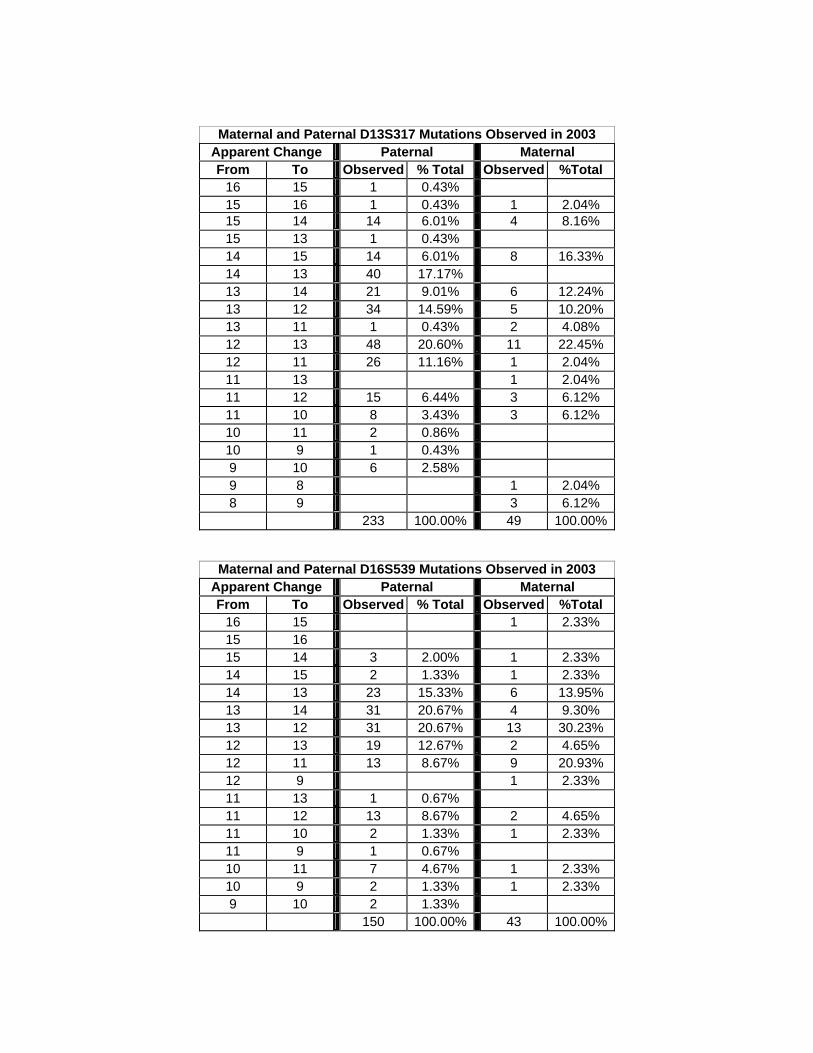
Maternal and Paternal D13S317 Mutations Observed in 2003 Apparent Change Paternal Maternal From To Observed % Total Observed %Total
16 15 1 0.43% 15 16 1 0.43% 1 2.04% 15 14 14 6.01% 4 8.16% 15 13 1 0.43% 14 15 14 6.01% 8 16.33% 14 13 40 17.17% 13 14 21 9.01% 6 12.24% 13 12 34 14.59% 5 10.20% 13 11 1 0.43% 2 4.08% 12 13 48 20.60% 11 22.45% 12 11 26 11.16% 1 2.04% 11 13 1 2.04% 11 12 15 6.44% 3 6.12% 11 10 8 3.43% 3 6.12% 10 11 2 0.86% 10 9 1 0.43% 9 10 6 2.58% 9 8 1 2.04% 8 9 3 6.12% 233 100.00% 49 100.00%
Maternal and Paternal D16S539 Mutations Observed in 2003 Apparent Change Paternal Maternal From To Observed % Total Observed %Total
16 15 1 2.33% 15 16 15 14 3 2.00% 1 2.33% 14 15 2 1.33% 1 2.33% 14 13 23 15.33% 6 13.95% 13 14 31 20.67% 4 9.30% 13 12 31 20.67% 13 30.23% 12 13 19 12.67% 2 4.65% 12 11 13 8.67% 9 20.93% 12 9 1 2.33% 11 13 1 0.67% 11 12 13 8.67% 2 4.65% 11 10 2 1.33% 1 2.33% 11 9 1 0.67% 10 11 7 4.67% 1 2.33% 10 9 2 1.33% 1 2.33% 9 10 2 1.33% 150 100.00% 43 100.00%
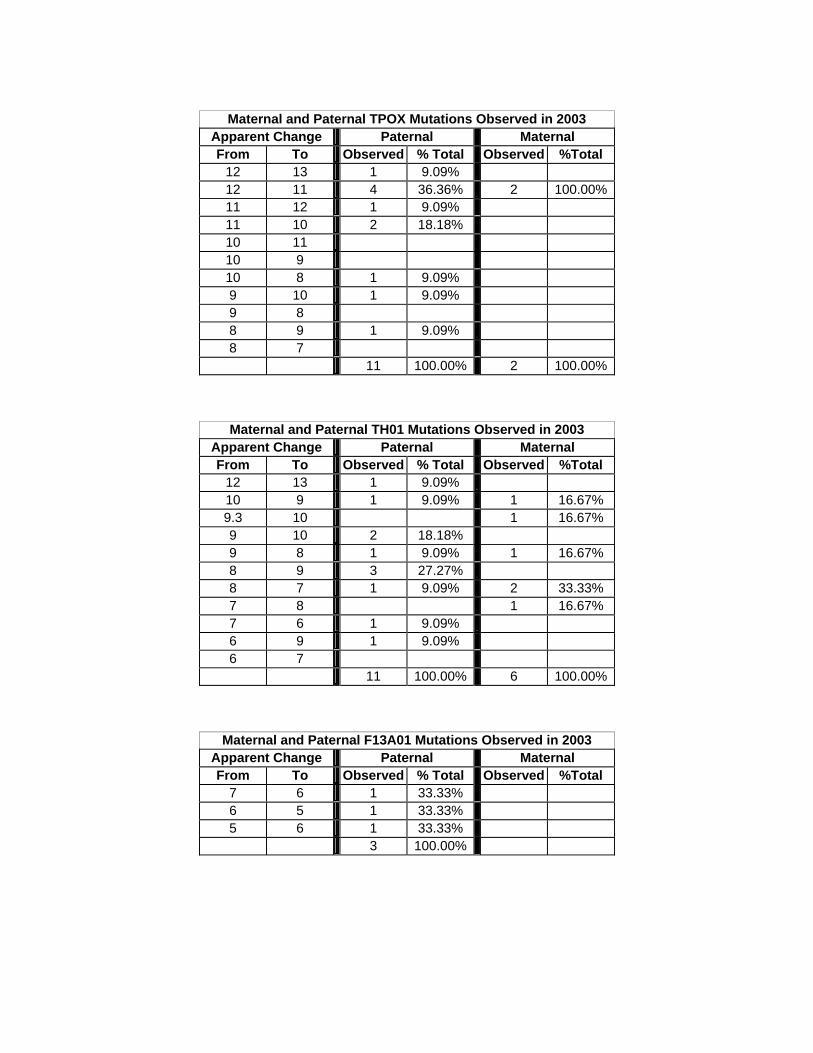
Maternal and Paternal TPOX Mutations Observed in 2003
Apparent Change Paternal Maternal From To Observed % Total Observed %Total
12 13 1 9.09% 12 11 4 36.36% 2 100.00% 11 12 1 9.09% 11 10 2 18.18% 10 11 10 9 10 8 1 9.09% 9 10 1 9.09% 9 8 8 9 1 9.09% 8 7 11 100.00% 2 100.00%
Maternal and Paternal TH01 Mutations Observed in 2003 Apparent Change Paternal Maternal From To Observed % Total Observed %Total
12 13 1 9.09% 10 9 1 9.09% 1 16.67% 9.3 10 1 16.67% 9 10 2 18.18% 9 8 1 9.09% 1 16.67% 8 9 3 27.27% 8 7 1 9.09% 2 33.33% 7 8 1 16.67% 7 6 1 9.09% 6 9 1 9.09% 6 7 11 100.00% 6 100.00%
Maternal and Paternal F13A01 Mutations Observed in 2003 Apparent Change Paternal Maternal From To Observed % Total Observed %Total
7 6 1 33.33% 6 5 1 33.33% 5 6 1 33.33% 3 100.00%

Maternal and Paternal CSF1P0 Mutations Observed in 2003
Apparent Change Paternal Maternal From To Observed % Total Observed %Total
15 14 10 5.26% 14 15 3 1.58% 1 4.17% 14 13 17 8.95% 13 15 1 0.53% 13 14 16 8.42% 2 8.33% 13 12 33 17.37% 4 16.67% 12 13 43 22.63% 4 16.67% 12 11 19 10.00% 1 4.17% 12 10 1 0.53% 2 8.33% 11 12 23 12.11% 2 8.33% 11 10 12 6.32% 4 16.67% 11 9 1 4.17% 10 11 7 3.68% 10 9 3 1.58% 1 4.17% 10 7 1 4.17% 9 10 1 0.53% 1 4.17% 8 9 1 0.53% 190 100.00% 24 100.00%

Maternal and Paternal D18S51 Mutations Observed in 2003 Apparent Change Paternal Maternal From To Observed % Total Observed %Total
26 25 1 0.24% 25 24 5 1.18% 25 23 2 0.47% 24 25 24 23 3 0.71% 23 24 4 0.95% 2 2.13% 23 22 9 2.13% 1 1.06% 22 23 5 1.18% 1 1.06% 22 21 10 2.37% 3 3.19% 22 20 1 0.24% 21 22 18 4.27% 4 4.26% 21 20 20 4.74% 2 2.13% 21 19 1 1.06% 20 23 1 1.06% 20 21 21 4.98% 8 8.51% 20 19 28 6.64% 19 20 31 7.35% 13 13.83% 19 18 17 4.03% 3 3.19% 19 17 1 1.06% 18 19 40 9.48% 5 5.32% 18 17 16 3.79% 5 5.32% 18 15 1 0.24% 17 18 36 8.53% 5 5.32% 17 16 21 4.98% 16 17 31 7.35% 9 9.57% 16 15 17 4.03% 3 3.19% 16 14 1 0.24% 16 13 1 0.24% 15 16 27 6.40% 5 5.32% 15 14 9 2.13% 3 3.19% 14 16 2 2.13% 14 15 14 3.32% 5 5.32% 14 13 5 1.18%
13.2 14.2 2 0.47% 13.2 13 1 0.24% 13 18 1 1.06% 13 15 1 0.24% 13 14 5 1.18% 2 2.13% 13 12 6 1.42% 1 1.06% 12 13 6 1.42% 6 6.38% 12 11 4 0.95% 12 19 1 1.06% 11 12 1 0.24% 11 10 1 0.24% 10 13 1 0.24% 10 11 1 1.06%
422 100.00% 94 100.00%

Maternal and Paternal D21S11 Mutations Observed in 2003 Apparent Change Paternal Maternal From To Observed % Total Observed %Total
38 37 1 0.35% 37 38 2 0.70% 37 36 1 0.35% 36 37 2 0.70% 36 35 1 0.64% 35 36 3 1.05% 35 34
34.2 33.2 11 7.01% 34 35 5 1.75% 34 33 1 0.35%
33.2 34.2 12 4.20% 33.2 32.2 6 2.10% 21 13.38% 33.2 29.2 1 0.64% 33 34 1 0.35% 33 32 3 1.05% 3 1.91%
32.2 34.2 1 0.35% 32.2 33.2 18 6.29% 4 2.55% 32.2 33 3 1.05% 32.2 31.2 6 2.10% 6 3.82% 32.2 31 1 0.35% 32 33 12 4.20% 3 1.91% 32 31 5 1.75% 14 8.92%
31.2 32.2 9 3.15% 31.2 32 1 0.35% 31.2 30.2 3 1.05% 4 2.55% 31.2 30 1 0.64% 31 32 24 8.39% 2 1.27% 31 30 15 5.24% 33 21.02% 31 29 1 0.64%
30.2 31.2 1 0.35% 2 1.27% 30.2 29 1 0.35% 30 33.2 1 0.64% 30 31.2 1 0.64% 30 31 44 15.38% 3 1.91% 30 30.2 1 0.64% 30 29 18 6.29% 16 10.19% 30 27 1 0.35% 29 31 1 0.35% 29 30 36 12.59% 7 4.46% 29 28 13 4.55% 13 8.28% 29 27 1 0.35% 1 0.64% 28 30 1 0.35% 1 0.64% 28 29 24 8.39% 5 3.18% 28 27 4 1.40% 1 0.64% 27 28 6 2.10%
286 100.00% 157 100.00%
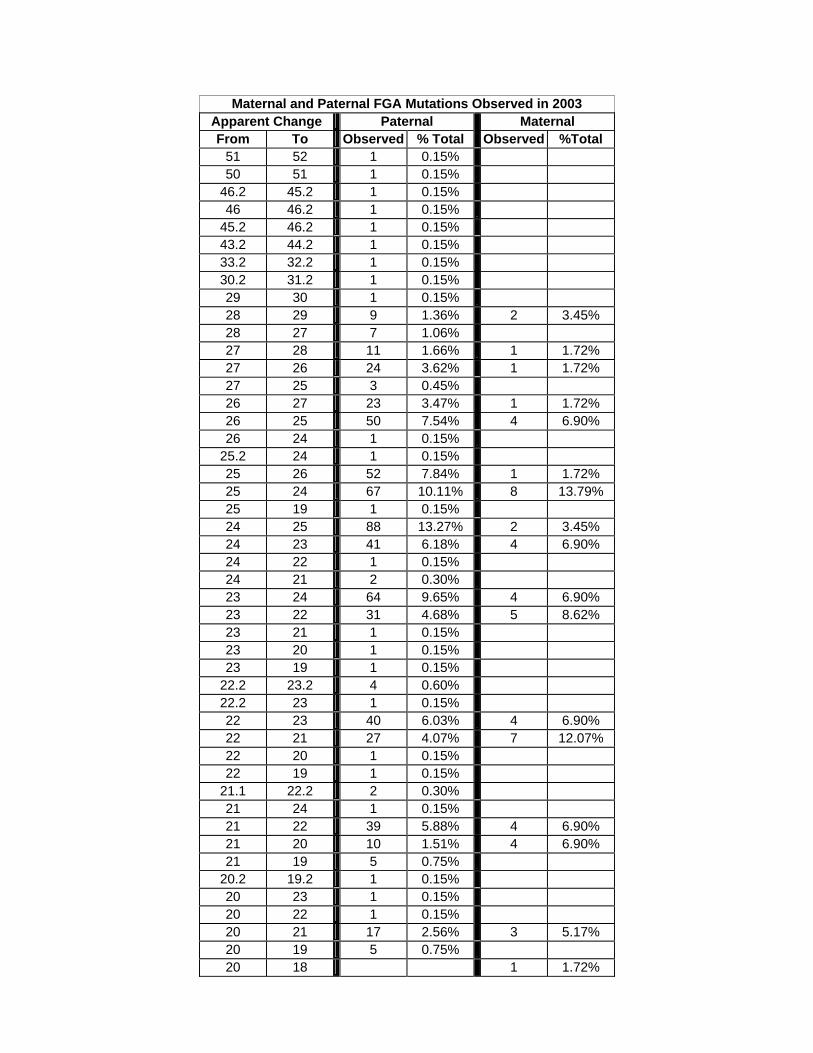
Maternal and Paternal FGA Mutations Observed in 2003 Apparent Change Paternal Maternal From To Observed % Total Observed %Total
51 52 1 0.15% 50 51 1 0.15%
46.2 45.2 1 0.15% 46 46.2 1 0.15%
45.2 46.2 1 0.15% 43.2 44.2 1 0.15% 33.2 32.2 1 0.15% 30.2 31.2 1 0.15% 29 30 1 0.15% 28 29 9 1.36% 2 3.45% 28 27 7 1.06% 27 28 11 1.66% 1 1.72% 27 26 24 3.62% 1 1.72% 27 25 3 0.45% 26 27 23 3.47% 1 1.72% 26 25 50 7.54% 4 6.90% 26 24 1 0.15%
25.2 24 1 0.15% 25 26 52 7.84% 1 1.72% 25 24 67 10.11% 8 13.79% 25 19 1 0.15% 24 25 88 13.27% 2 3.45% 24 23 41 6.18% 4 6.90% 24 22 1 0.15% 24 21 2 0.30% 23 24 64 9.65% 4 6.90% 23 22 31 4.68% 5 8.62% 23 21 1 0.15% 23 20 1 0.15% 23 19 1 0.15%
22.2 23.2 4 0.60% 22.2 23 1 0.15% 22 23 40 6.03% 4 6.90% 22 21 27 4.07% 7 12.07% 22 20 1 0.15% 22 19 1 0.15%
21.1 22.2 2 0.30% 21 24 1 0.15% 21 22 39 5.88% 4 6.90% 21 20 10 1.51% 4 6.90% 21 19 5 0.75%
20.2 19.2 1 0.15% 20 23 1 0.15% 20 22 1 0.15% 20 21 17 2.56% 3 5.17% 20 19 5 0.75% 20 18 1 1.72%

19 20 9 1.36% 1 1.72% 19 18 6 0.90% 1 1.72%
18.2 17.2 1 0.15% 18 19 3 0.45%
663 100.00% 58 100.00%
Maternal and Paternal vWA Mutations Observed in 2003 Apparent Change Paternal Maternal From To Observed % Total Observed %Total
23 22 1 0.21% 22 21 7 1.49% 21 22 2 0.42% 1 2.13% 21 20 17 3.61% 1 2.13% 20 21 12 2.55% 4 8.51% 20 19 33 7.01% 19 20 19 4.03% 4 8.51% 19 18 67 14.23% 1 2.13% 19 17 1 0.21% 18 19 56 11.89% 8 17.02% 18 17 69 14.65% 4 8.51% 18 16 2 0.42% 17 18 48 10.19% 8 17.02% 17 16 53 11.25% 1 2.13% 17 15 1 0.21% 16 19 1 0.21% 16 18 1 0.21% 16 17 29 6.16% 7 14.89% 16 15 18 3.82% 2 4.26% 16 14 1 0.21% 15 16 24 5.10% 3 6.38% 15 14 3 0.64% 14 17 1 2.13% 14 15 4 0.85% 1 2.13% 14 13 1 0.21% 13 14 1 0.21% 12 13 1 2.13%
471 100.00% 47 100.00%

Maternal and Paternal D19S433 Mutations Observed in 2003
Apparent Change Paternal Maternal From To Observed % Total Observed %Total 17.2 16.2 2 3.92% 17 18 1 1.96% 17 16 2 3.92% 1 6.25%
16.2 17.2 1 1.96% 16.2 15.2 2 3.92% 16 17 2 3.92% 16 15 1 1.96% 1 6.25%
15.2 16.2 2 3.92% 1 6.25% 15.2 14.2 2 3.92% 15 16 7 13.73% 15 14 1 1.96% 3 18.75%
14.2 13.2 3 5.88% 2 12.50% 14 15 4 7.84% 2 12.50% 14 13 11 21.57% 4 25.00%
13.2 14.2 2 3.92% 13.2 12.2 1 1.96% 13 14 4 7.84% 13 12 2 3.92% 12 13 1 6.25% 11 12 1 1.96% 9 10 1 6.25% 51 100.00% 16 100.00%
Maternal and Paternal Penta D Mutations Observed in 2003 Apparent Change Paternal Maternal From To Observed % Total Observed %Total
13 14 12 13 12 11 1 20.00% 11 13 1 20.00% 11 10 10 11 9 11 1 20.00% 9 10 2 40.00% 5 100.00%
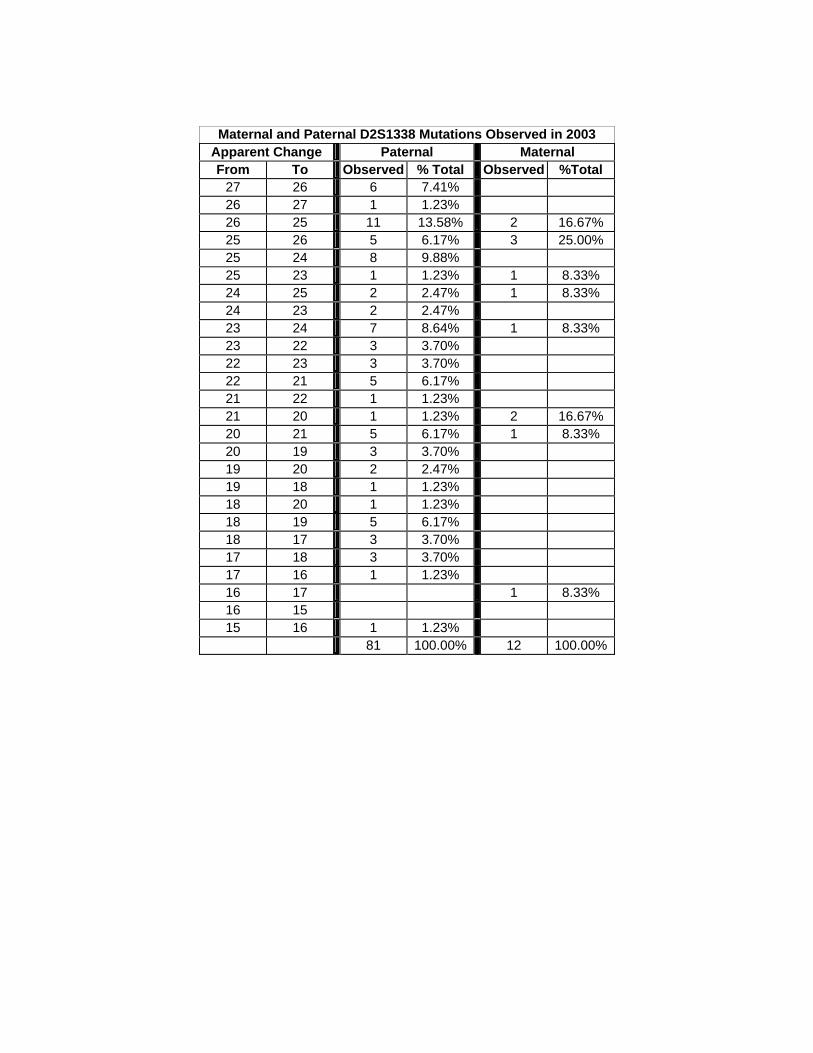
Maternal and Paternal D2S1338 Mutations Observed in 2003 Apparent Change Paternal Maternal From To Observed % Total Observed %Total
27 26 6 7.41% 26 27 1 1.23% 26 25 11 13.58% 2 16.67% 25 26 5 6.17% 3 25.00% 25 24 8 9.88% 25 23 1 1.23% 1 8.33% 24 25 2 2.47% 1 8.33% 24 23 2 2.47% 23 24 7 8.64% 1 8.33% 23 22 3 3.70% 22 23 3 3.70% 22 21 5 6.17% 21 22 1 1.23% 21 20 1 1.23% 2 16.67% 20 21 5 6.17% 1 8.33% 20 19 3 3.70% 19 20 2 2.47% 19 18 1 1.23% 18 20 1 1.23% 18 19 5 6.17% 18 17 3 3.70% 17 18 3 3.70% 17 16 1 1.23% 16 17 1 8.33% 16 15 15 16 1 1.23%
81 100.00% 12 100.00%

Maternal and Paternal Penta E Mutations Observed in 2003
Apparent Change Paternal Maternal From To Observed % Total Observed %Total
23 22 1 10.00% 20 21 1 10.00% 19 20 1 10.00% 19 18 18 19 1 10.00% 1 12.50% 18 17 1 12.50% 17 18 17 16 1 10.00% 17 15 1 10.00% 16 17 1 12.50% 16 15 2 20.00% 2 25.00% 15 16 15 14 14 13 1 12.50% 13 14 13 12 12 13 1 10.00% 12 11 11 12 1 12.50% 11 10 10 9 9 10 7 6 1 12.50% 5 8 1 10.00% 10 100.00% 8 100.00%
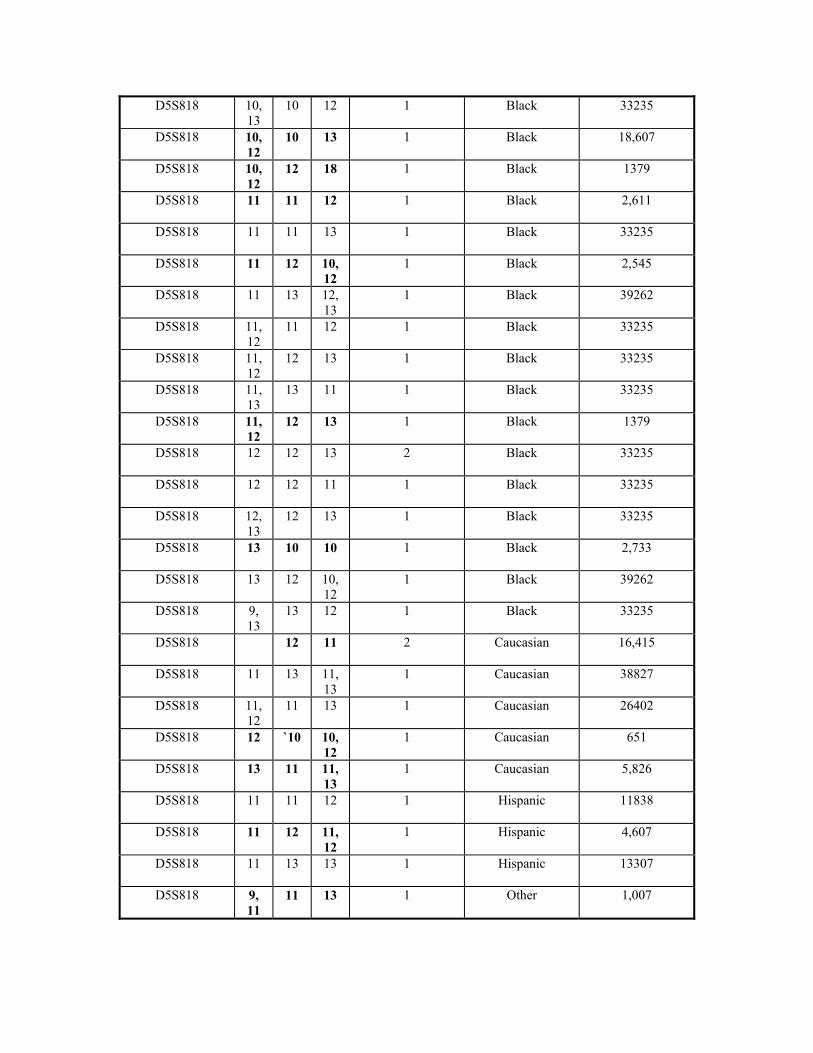
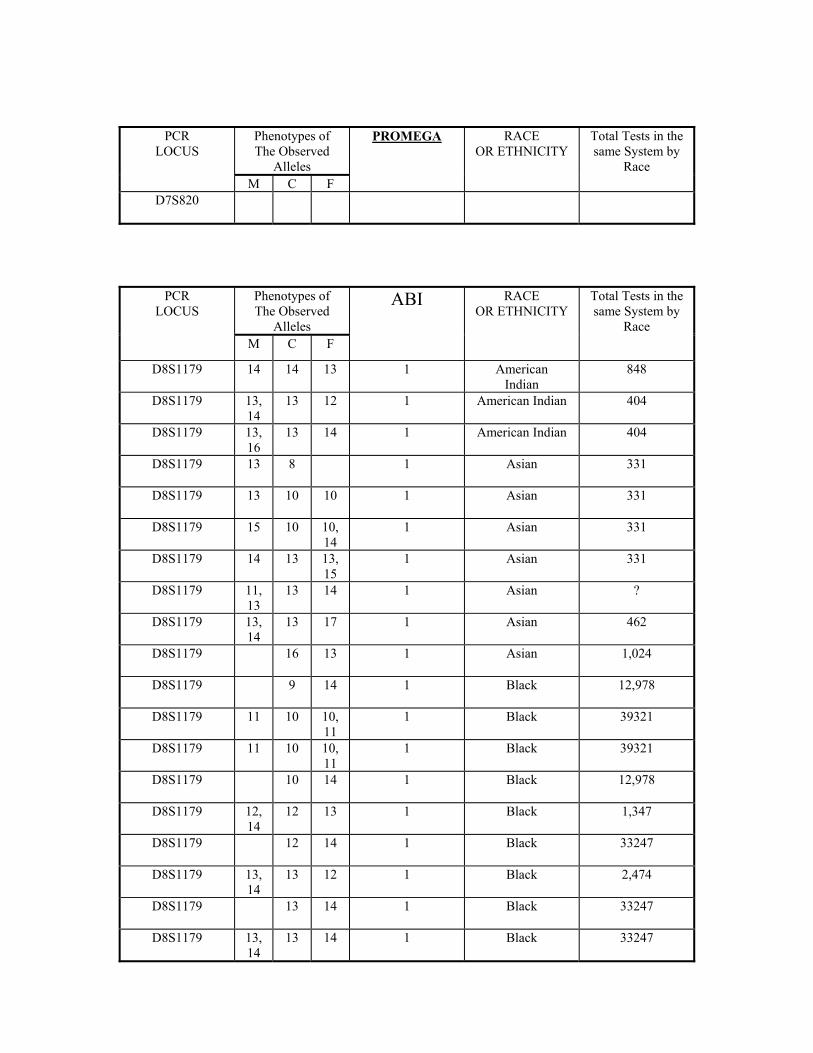
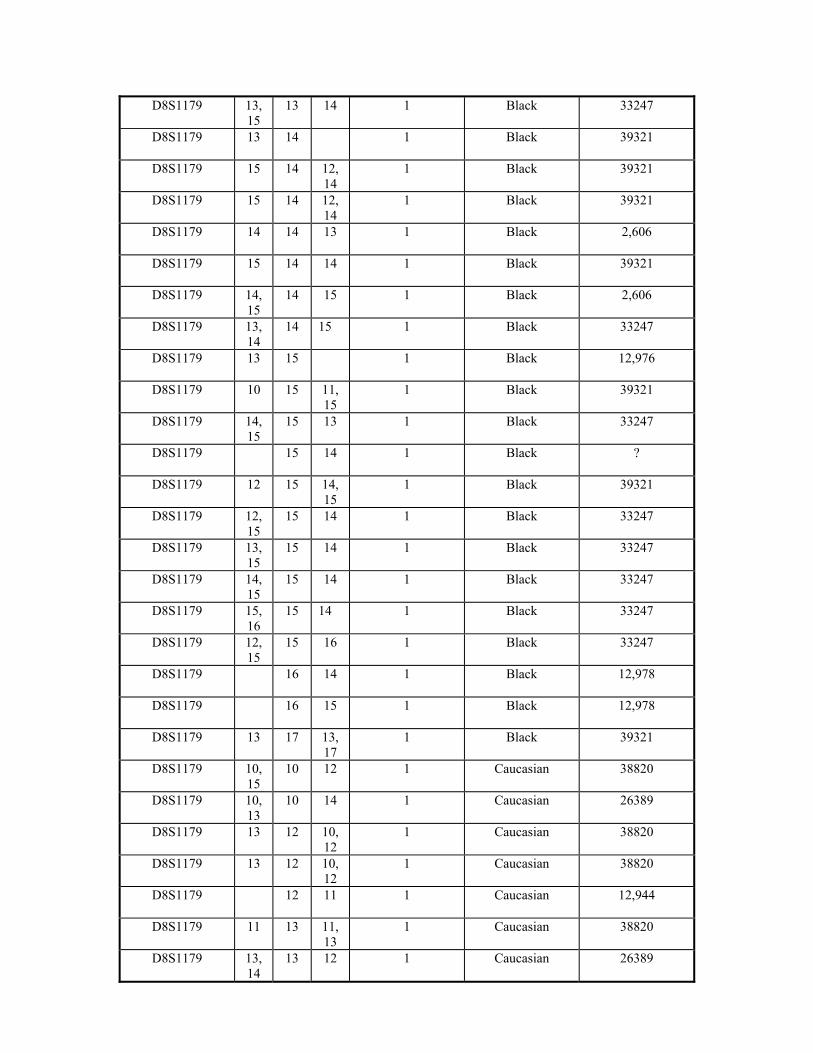
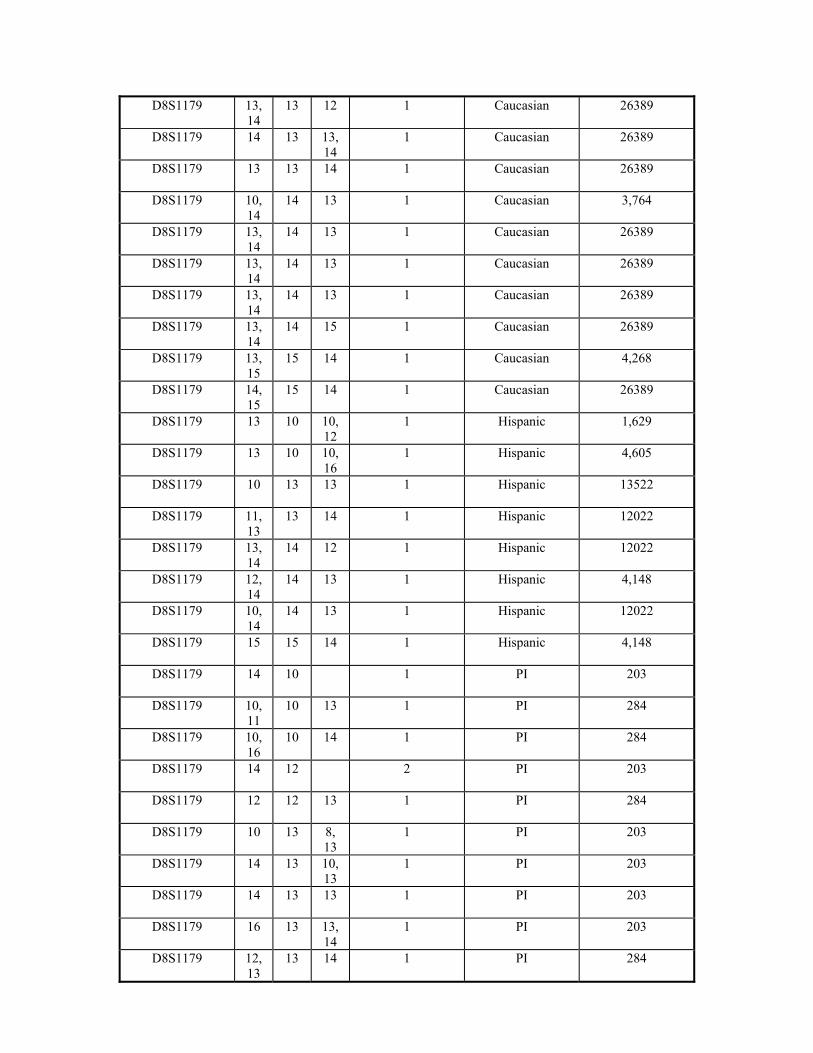
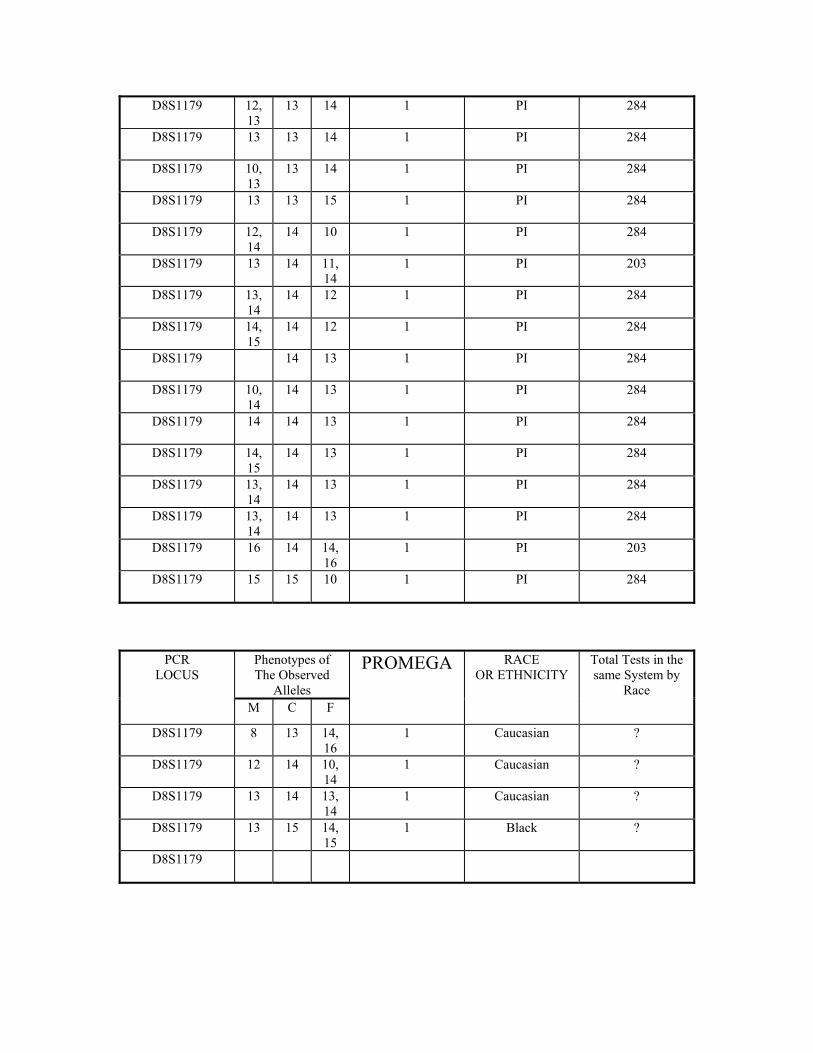
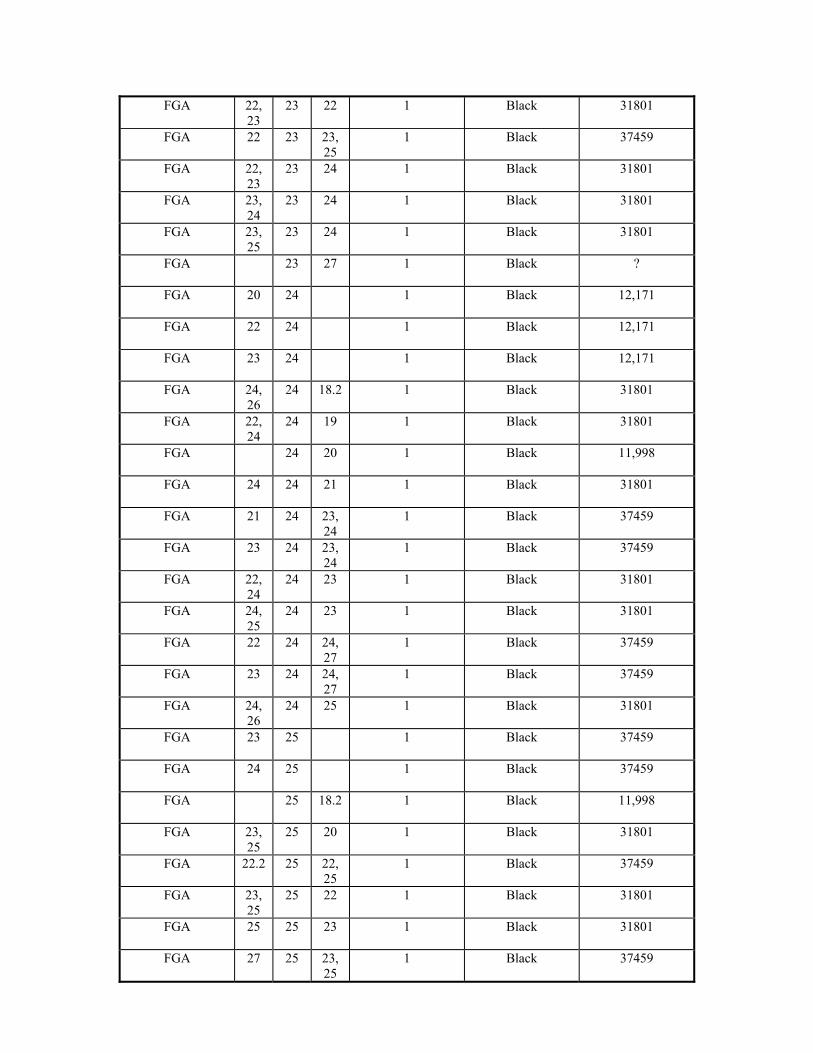
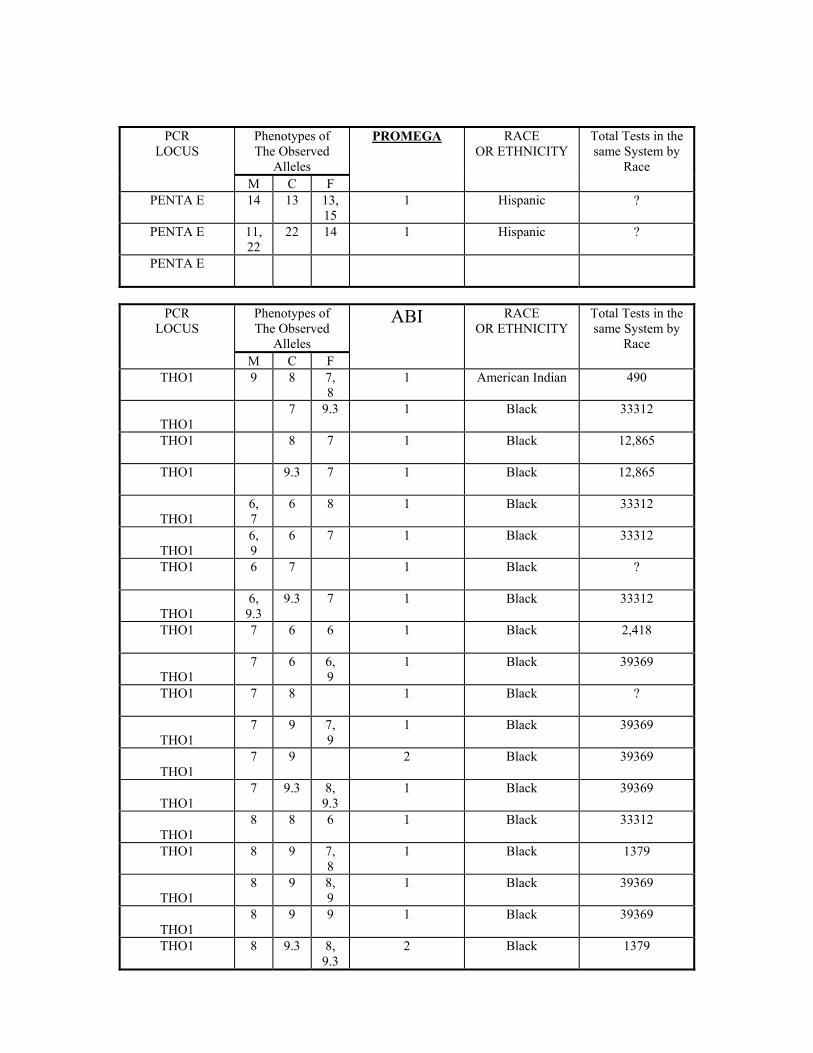
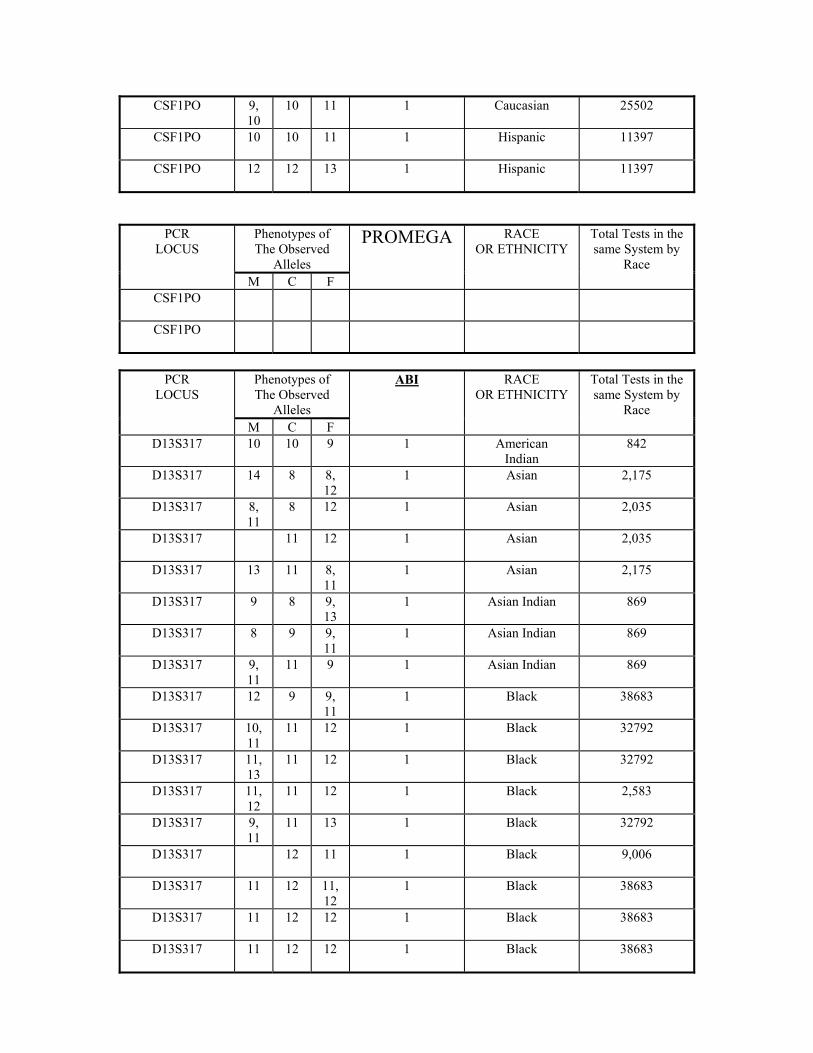
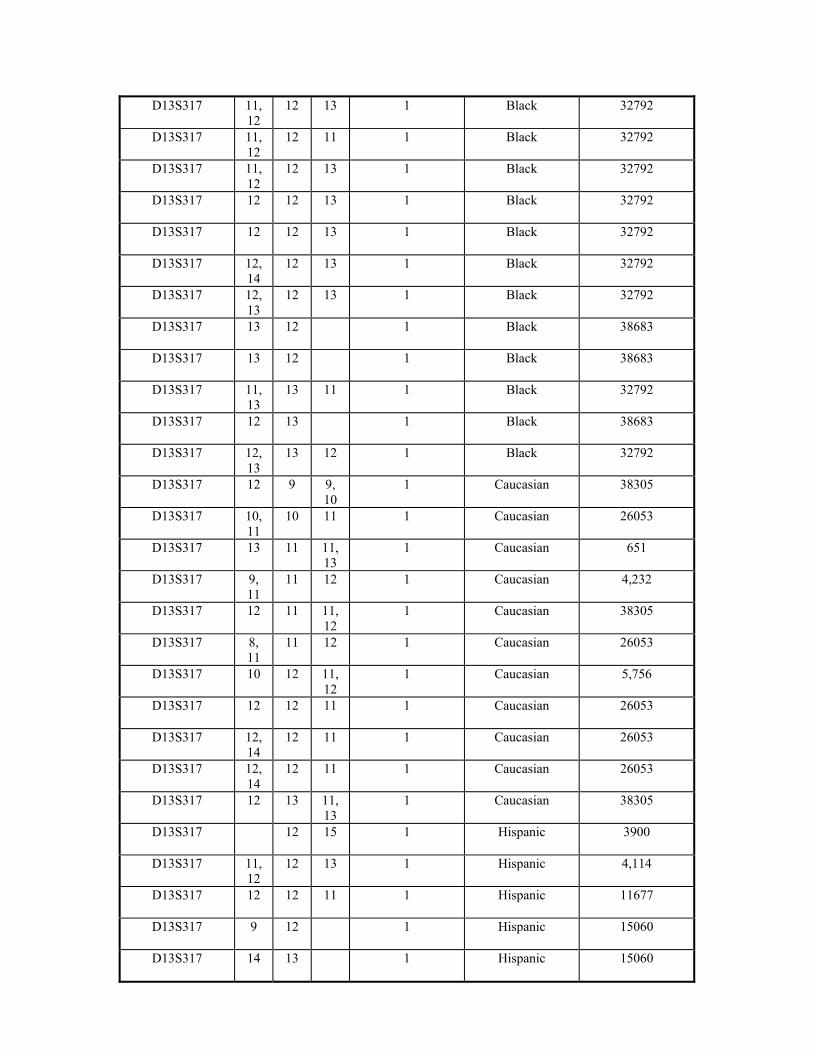
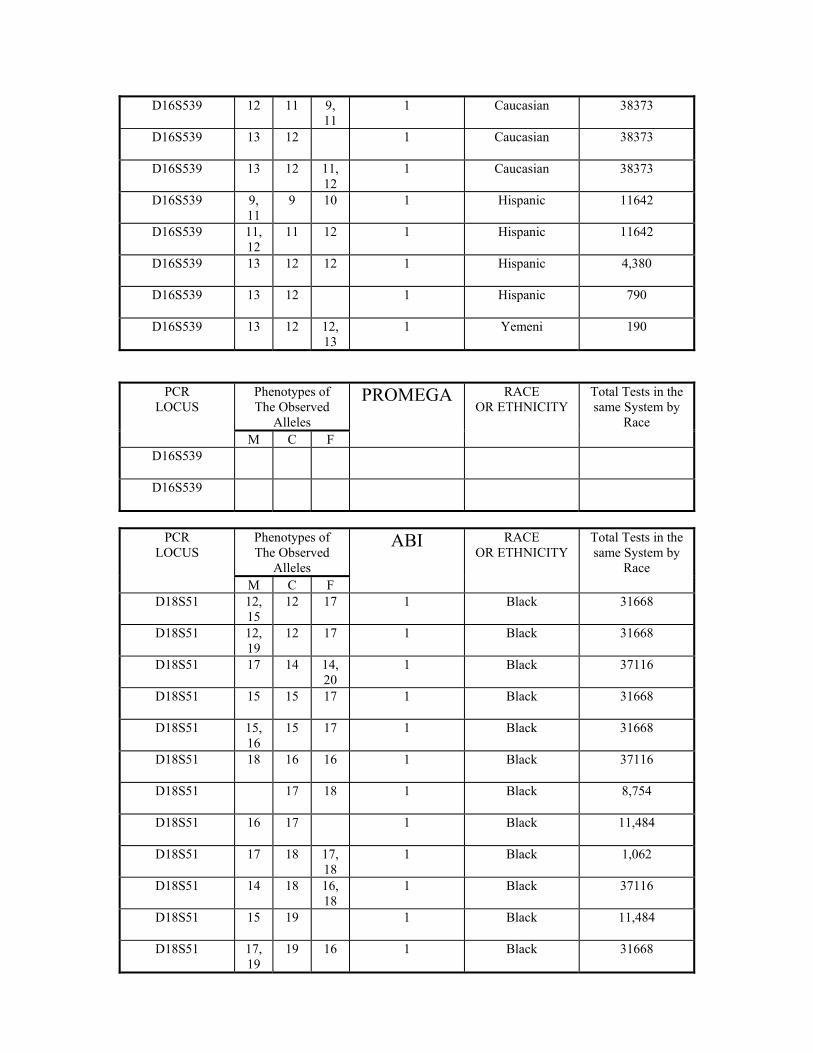
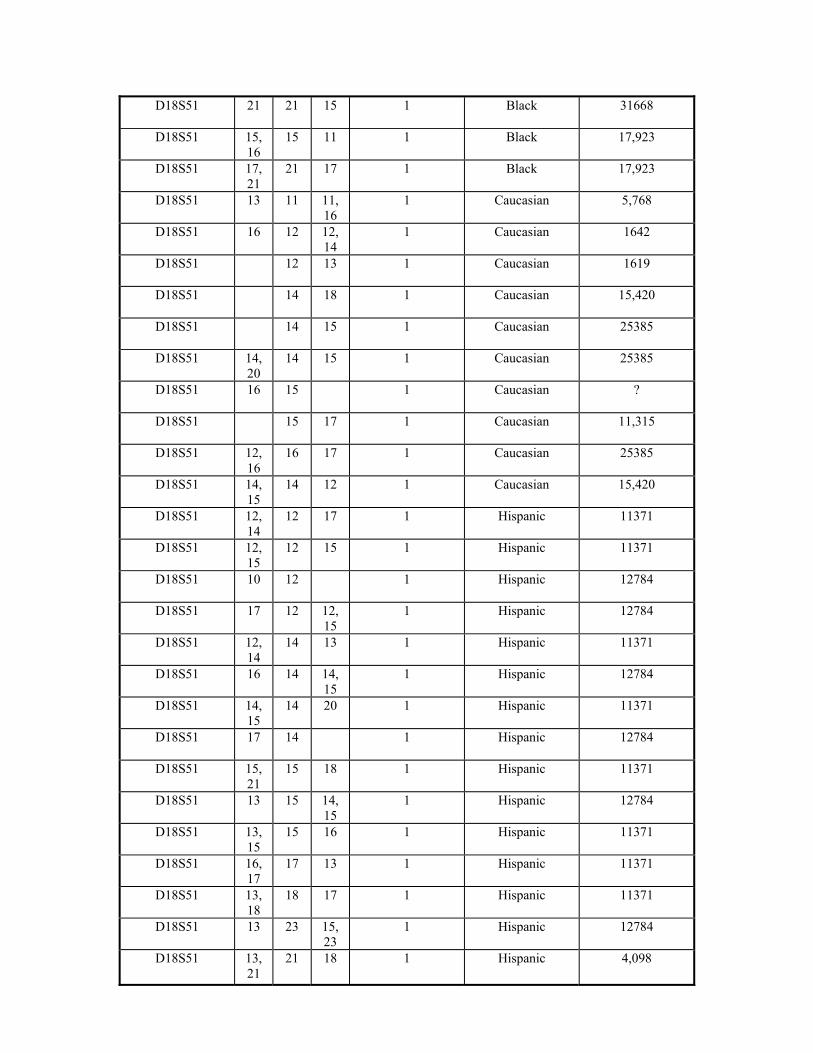
Appendix 7. Apparent Null Alleles for the Loci Submitted for the 2003 Annual Report.
Phenotypes of The Observed
Alleles
PCR LOCUS
M C F
ABI RACE OR ETHNICITY
Total Tests in the same System by
Race
D3S1358
17 18 1 American Indian
864
D3S1358
15, 16
15 14 1 Black 33405
D3S1358
16 15 15, 16
1 Black 39496
D3S1358
15, 16
15 16 1 Black 33405
D3S1358
16 15 2 Black ?
D3S1358
16 15 1 Black 12,323

D3S1358
16 15 1 Black 33405
D3S1358
15, 16
16 15 1 Black 33405
D3S1358
15, 16
16 17 1 Black 33405
D3S1358
15, 17
17 16 1 Black 33405
D3S1358
15 14 1 Caucasian 12,292
D3S1358
15 16 1 Caucasian 12,193
D3S1358
16, 18
16 15 1 Caucasian 26555
D3S1358
15 16 16, 17
1 Caucasian 39074
D3S1358
16 17 1 Caucasian 12,292
D3S1358
15, 17
17 16 1 Caucasian 4,278
D3S1358
17 17 16 1 Caucasian 26555
D3S1358
16 17 15, 17
1 Caucasian 5,824
D3S1358
16, 18
18 17 1 Caucasian 26555
D3S1358
17, 18
18 17 1 Caucasian 15,314
D3S1358
19 14 1 Caucasian 15,314
D3S1358
14, 15
14 15 1 Hispanic 4,539
D3S1358
16, 18
16 15 1 Hispanic 12200
Phenotypes of The Observed
Alleles
PCR LOCUS
M C F
PROMEGA
RACE OR ETHNICITY
Total Tests in the same System by
Race
D3S1358
Phenotypes of The Observed
Alleles
PCR LOCUS
M C F
ABI RACE OR ETHNICITY
Total Tests in the same System by
Race
D5S818
10, 13
10 12 1 Asian 2,106
D5S818
11, 12
12 11 1 Asian Indian 265
D5S818
12 11 1 Black 868
D5S818 10, 13
10 12 1 Black 33235
D5S818
10, 12
10 13 1 Black 18,607
D5S818
10, 12
12 18 1 Black 1379
D5S818
11 11 12 1 Black 2,611
D5S818
11 11 13 1 Black 33235
D5S818
11 12 10, 12
1 Black 2,545
D5S818 11 13 12, 13
1 Black 39262
D5S818 11, 12
11 12 1 Black 33235
D5S818 11, 12
12 13 1 Black 33235
D5S818 11, 13
13 11 1 Black 33235
D5S818
11, 12
12 13 1 Black 1379
D5S818
12 12 13 2 Black 33235
D5S818
12 12 11 1 Black 33235
D5S818 12, 13
12 13 1 Black 33235
D5S818
13 10 10 1 Black 2,733
D5S818 13 12 10, 12
1 Black 39262
D5S818 9, 13
13 12 1 Black 33235
D5S818
12 11 2 Caucasian 16,415
D5S818 11 13 11, 13
1 Caucasian 38827
D5S818 11, 12
11 13 1 Caucasian 26402
D5S818
12 `10 10, 12
1 Caucasian 651
D5S818
13 11 11, 13
1 Caucasian 5,826
D5S818 11 11 12 1 Hispanic 11838
D5S818
11 12 11, 12
1 Hispanic 4,607
D5S818
11 13 13 1 Hispanic 13307
D5S818
9, 11
11 13 1 Other 1,007

Phenotypes of The Observed
Alleles
PCR LOCUS
M C F
PROMEGA RACE OR ETHNICITY
Total Tests in the same System by
Race
D5S818
13 12 1 Black ?
D5S818
11 12 1 Caucasian 1,208
D5S818
Phenotypes of The Observed
Alleles
PCR LOCUS
M C F
ABI RACE OR ETHNICITY
Total Tests in the same System by
Race
D7S820 11 11 12 1 American Indian 866
D7S820
10 10 9 1 Black 32830
D7S820
11 11 10 1 Black 32830
D7S820
10,11
11 10 1 Black 32830
D7S820
12 11 1 Black 38756
D7S820
8 8 9 1 Caucasian 4,263
D7S820 9, 10
9 7 1 Caucasian 4,263
D7S820
11 12 1 Caucasian 4,263
D7S820 7 11 1 Caucasian 26124
D7S820 13 9 9, 12
1 Caucasian 38415
D7S820
9 9 10 1 Caucasian 26124
D7S820
9, 11
9 10 1 Caucasian 26124
D7S820
11 11 12 1 Caucasian 26124
D7S820
11 11 10 1 Caucasian 26124
D7S820
10, 11
11 10 1 Caucasian 26124
D7S820 12 12 9 1 Caucasian 26124
D7S820 8 10 10, 12
1 Caucasian 38415
D7S820 7 10 8, 10
1 Caucasian 38415
D7S820 8 11 11 1 Caucasian 38415
D7S820
11, 12
12 11 1 Hispanic 12535
Phenotypes of The Observed
Alleles
PCR LOCUS
M C F
PROMEGA
RACE OR ETHNICITY
Total Tests in the same System by
Race
D7S820
Phenotypes of The Observed
Alleles
PCR LOCUS
M C F
ABI RACE OR ETHNICITY
Total Tests in the same System by
Race
D8S1179 14 14 13 1 American Indian
848
D8S1179
13, 14
13 12 1 American Indian 404
D8S1179
13, 16
13 14 1 American Indian 404
D8S1179
13 8 1 Asian 331
D8S1179
13 10 10 1 Asian 331
D8S1179 15 10 10, 14
1 Asian 331
D8S1179 14 13 13, 15
1 Asian 331
D8S1179
11, 13
13 14 1 Asian ?
D8S1179 13, 14
13 17 1 Asian 462
D8S1179
16 13 1 Asian 1,024
D8S1179
9 14 1 Black 12,978
D8S1179 11 10 10, 11
1 Black 39321
D8S1179 11 10 10, 11
1 Black 39321
D8S1179
10 14 1 Black 12,978
D8S1179
12, 14
12 13 1 Black 1,347
D8S1179
12 14 1 Black 33247
D8S1179
13, 14
13 12 1 Black 2,474
D8S1179
13 14 1 Black 33247
D8S1179 13, 14
13 14 1 Black 33247
D8S1179 13, 15
13 14 1 Black 33247
D8S1179
13 14 1 Black 39321
D8S1179 15 14 12, 14
1 Black 39321
D8S1179 15 14 12, 14
1 Black 39321
D8S1179
14 14 13 1 Black 2,606
D8S1179
15 14 14 1 Black 39321
D8S1179
14, 15
14 15 1 Black 2,606
D8S1179 13, 14
14 15 1 Black 33247
D8S1179
13 15 1 Black 12,976
D8S1179 10 15 11, 15
1 Black 39321
D8S1179 14, 15
15 13 1 Black 33247
D8S1179
15 14 1 Black ?
D8S1179 12 15 14, 15
1 Black 39321
D8S1179 12, 15
15 14 1 Black 33247
D8S1179 13, 15
15 14 1 Black 33247
D8S1179 14, 15
15 14 1 Black 33247
D8S1179 15, 16
15 14 1 Black 33247
D8S1179 12, 15
15 16 1 Black 33247
D8S1179
16 14 1 Black 12,978
D8S1179
16 15 1 Black 12,978
D8S1179 13 17 13, 17
1 Black 39321
D8S1179 10, 15
10 12 1 Caucasian 38820
D8S1179 10, 13
10 14 1 Caucasian 26389
D8S1179 13 12 10, 12
1 Caucasian 38820
D8S1179 13 12 10, 12
1 Caucasian 38820
D8S1179
12 11 1 Caucasian 12,944
D8S1179 11 13 11, 13
1 Caucasian 38820
D8S1179 13, 14
13 12 1 Caucasian 26389
D8S1179 13, 14
13 12 1 Caucasian 26389
D8S1179 14 13 13, 14
1 Caucasian 26389
D8S1179
13 13 14 1 Caucasian 26389
D8S1179
10, 14
14 13 1 Caucasian 3,764
D8S1179 13, 14
14 13 1 Caucasian 26389
D8S1179 13, 14
14 13 1 Caucasian 26389
D8S1179 13, 14
14 13 1 Caucasian 26389
D8S1179 13, 14
14 15 1 Caucasian 26389
D8S1179
13, 15
15 14 1 Caucasian 4,268
D8S1179 14, 15
15 14 1 Caucasian 26389
D8S1179
13 10 10, 12
1 Hispanic 1,629
D8S1179
13 10 10, 16
1 Hispanic 4,605
D8S1179
10 13 13 1 Hispanic 13522
D8S1179 11, 13
13 14 1 Hispanic 12022
D8S1179 13, 14
14 12 1 Hispanic 12022
D8S1179
12, 14
14 13 1 Hispanic 4,148
D8S1179 10, 14
14 13 1 Hispanic 12022
D8S1179
15 15 14 1 Hispanic 4,148
D8S1179
14 10 1 PI 203
D8S1179 10, 11
10 13 1 PI 284
D8S1179 10, 16
10 14 1 PI 284
D8S1179
14 12 2 PI 203
D8S1179
12 12 13 1 PI 284
D8S1179 10 13 8, 13
1 PI 203
D8S1179 14 13 10, 13
1 PI 203
D8S1179
14 13 13 1 PI 203
D8S1179 16 13 13, 14
1 PI 203
D8S1179 12, 13
13 14 1 PI 284
D8S1179 12, 13
13 14 1 PI 284
D8S1179
13 13 14 1 PI 284
D8S1179 10, 13
13 14 1 PI 284
D8S1179
13 13 15 1 PI 284
D8S1179 12, 14
14 10 1 PI 284
D8S1179 13 14 11, 14
1 PI 203
D8S1179 13, 14
14 12 1 PI 284
D8S1179 14, 15
14 12 1 PI 284
D8S1179
14 13 1 PI 284
D8S1179 10, 14
14 13 1 PI 284
D8S1179
14 14 13 1 PI 284
D8S1179 14, 15
14 13 1 PI 284
D8S1179 13, 14
14 13 1 PI 284
D8S1179 13, 14
14 13 1 PI 284
D8S1179 16 14 14, 16
1 PI 203
D8S1179
15 15 10 1 PI 284
Phenotypes of The Observed
Alleles
PCR LOCUS
M C F
PROMEGA RACE OR ETHNICITY
Total Tests in the same System by
Race
D8S1179
8 13 14, 16
1 Caucasian ?
D8S1179
12 14 10, 14
1 Caucasian ?
D8S1179
13 14 13, 14
1 Caucasian ?
D8S1179
13 15 14, 15
1 Black ?
D8S1179

Phenotypes of The Observed
Alleles
PCR LOCUS
M C F
ABI RACE OR ETHNICITY
Total Tests in the same System by
Race
FGA
22, 23
22 21 1 Asian 2,069
FGA
18.219.2
18.2 26 1 Black 17865
FGA
22 19 1 Black 12,171
FGA
26 19 19, 22
1 Black 37459
FGA
19 21 1 Black 31801
FGA
19, 22
19 21 1 Black 31801
FGA
23 20 20, 22
1 Black 37459
FGA
27 20 20, 21.2
1 Black 37459
FGA
20, 22
20 22 2 Black 31801
FGA
20 23 1 Black 31801
FGA
20, 21
20 24 1 Black 31801
FGA
20, 21
20 26 1 Black 31801
FGA
23 21 1 Black 37459
FGA
22 21 21, 25
1 Black 37459
FGA
22 21 21, 23
1 Black 37459
FGA
21, 22
21 23 1 Black 31801
FGA
23 22 21, 22
1 Black 37459
FGA
23 22 22, 24
1 Black 37459
FGA
22, 23
22 23 1 Black 2,474
FGA
21 22 23, 25
1 Black 37459
FGA
22, 24
22 23 1 Black 31801
FGA
22, 25
22 24 1 Black 31801
FGA
22, 26
22 24 1 Black 31801
FGA
22 23 20, 23
1 Black 37459
FGA
23 23 21 1 Black 31801
FGA
22 23 22, 23
1 Black 37459
FGA
22, 23
23 22 1 Black 31801
FGA
22 23 23, 25
1 Black 37459
FGA
22, 23
23 24 1 Black 31801
FGA
23, 24
23 24 1 Black 31801
FGA
23, 25
23 24 1 Black 31801
FGA
23 27 1 Black ?
FGA
20 24 1 Black 12,171
FGA
22 24 1 Black 12,171
FGA
23 24 1 Black 12,171
FGA
24, 26
24 18.2 1 Black 31801
FGA
22, 24
24 19 1 Black 31801
FGA
24 20 1 Black 11,998
FGA
24 24 21 1 Black 31801
FGA
21 24 23, 24
1 Black 37459
FGA
23 24 23, 24
1 Black 37459
FGA
22, 24
24 23 1 Black 31801
FGA
24, 25
24 23 1 Black 31801
FGA
22 24 24, 27
1 Black 37459
FGA
23 24 24, 27
1 Black 37459
FGA
24, 26
24 25 1 Black 31801
FGA
23 25 1 Black 37459
FGA
24 25 1 Black 37459
FGA
25 18.2 1 Black 11,998
FGA
23, 25
25 20 1 Black 31801
FGA
22.2 25 22, 25
1 Black 37459
FGA
23, 25
25 22 1 Black 31801
FGA
25 25 23 1 Black 31801
FGA
27 25 23, 25
1 Black 37459

FGA
18.2 25 24, 25
1 Black 37459
FGA
18.2 25.2 23, 25.2
1 Black 37459
FGA
22 26 22, 26
1 Black 37459
FGA
24, 26
26 23 1 Black 2,474
FGA
20, 26
26 23 1 Black 17865
FGA
22 28 22, 28
1 Black 37459
FGA
29 23 1 Black 31801
FGA
18, 22
18 24 1 Caucasian 13379
FGA
20, 22
20 24 1 Caucasian 25614
FGA
21 20 1 Caucasian 11,968
FGA
20 21 21 1 Caucasian 37542
FGA
22 21 21, 24
1 Caucasian 37542
FGA
22 23 1 Caucasian 16,131
FGA
22, 23
23 21 1 Caucasian 3,764
FGA
23 22 1 Caucasian 16,131
FGA
23 22 1 Caucasian 11,968
FGA
24 22 1 Caucasian 25614
FGA
24 23 1 Caucasian 4,266
FGA
24 24 23 1 Caucasian 25614
FGA
20 25 1 Caucasian 37542
FGA
20 25 1 Caucasian 37542
FGA
20 25 23, 25
1 Caucasian 37542
FGA
22, 25
25 24 1 Caucasian 4,266
FGA
20 26 1 Caucasian 37542
FGA
21, 26
26 21 1 Caucasian 4,266
FGA
21 21 23 1 Hispanic 4,141
FGA
20 21 20, 21
1 Hispanic 4,862
FGA
22 26 1 Hispanic 11440

Phenotypes of The Observed
Alleles
PCR LOCUS
M C F
PROMEGA
RACE OR ETHNICITY
Total Tests in the same System by
Race
FGA
Phenotypes of The Observed
Alleles
PCR LOCUS
M C F
PROMEGA
RACE OR ETHNICITY
Total Tests in the same System by
Race
PENTA E 14 13 13, 15
1 Hispanic ?
PENTA E 11, 22
22 14 1 Hispanic ?
PENTA E
Phenotypes of The Observed
Alleles
PCR LOCUS
M C F
ABI RACE OR ETHNICITY
Total Tests in the same System by
Race
THO1
9 8 7, 8
1 American Indian 490
THO1
7 9.3 1 Black 33312
THO1
8 7 1 Black 12,865
THO1
9.3 7 1 Black 12,865
THO1
6, 7
6 8 1 Black 33312
THO1
6, 9
6 7 1 Black 33312
THO1
6 7 1 Black ?
THO1
6, 9.3
9.3 7 1 Black 33312
THO1
7 6 6 1 Black 2,418
THO1
7 6 6, 9
1 Black 39369
THO1
7 8 1 Black ?
THO1
7 9 7, 9
1 Black 39369
THO1
7 9 2 Black 39369
THO1
7 9.3 8, 9.3
1 Black 39369
THO1
8 8 6 1 Black 33312
THO1
8 9 7, 8
1 Black 1379
THO1
8 9 8, 9
1 Black 39369
THO1
8 9 9 1 Black 39369
THO1
8 9.3 8, 9.3
2 Black 1379

THO1
9 8 1 Black ?
THO1
9 9.3 9, 9.3
1 Black 39369
THO1
9.3 9 9, 9.3
1 Black 2,418
THO1
6 7 1 Caucasian 38825
THO1
6 7 6, 7
1 Caucasian 38825
THO1
7, 9
7 9 1 Caucasian 26375
THO1
6 6 9.3 1 Hispanic 11793
THO1
6, 7
7 9.3 1 Hispanic 11793
THO1
7 7 9.3 1 Hispanic 11793
THO1
8, 9
8 6 1 Hispanic 11793
THO1
9 9.3 6, 9.3
1 Hispanic 13269
THO1
9.3 9.3 7 1 Hispanic 11793
THO1
7 7 6 1 PI 175
Phenotypes of The Observed
Alleles
PCR LOCUS
M C F
PROMEGA RACE OR ETHNICITY
Total Tests in the same System by
Race
THO1
Phenotypes of The Observed
Alleles
PCR LOCUS
M C F
ABI RACE OR ETHNICITY
Total Tests in the same System by
Race
TPOX 10, 11
10 11 1 Black 32853
TPOX
8, 11
8 11 1 Black 2,470
TPOX
8, 11
11 12 1 Caucasian 4,102
TPOX 8, 9
9 11 1 Hispanic 11756
TPOX
8, 11
11 8 1 Hispanic 3,965
PCR LOCUS
Phenotypes of The Observed
Alleles
PROMEGA
RACE OR ETHNICITY
Total Tests in the same System by
Race

M C F TPOX 8 8 10 1 Caucasian 212
TPOX
13 11 1 Hispanic 456
TPOX 8, 22
8 5 1 Hispanic 456
Phenotypes of The Observed
Alleles
PCR LOCUS
M C F
ABI RACE OR ETHNICITY
Total Tests in the same System by
Race
CSF1PO
11, 12
12 13 1 American Indian
822
CSF1PO
12 11 1 Black 7,574
CSF1PO
10 11 11 1 Black 37725
CSF1PO
10 11 11, 12
1 Black 37725
CSF1PO
11 11 10 1 Black 2,291
CSF1PO
11, 12
12 11 1 Black 31976
CSF1PO
12 12 13 1 Black 31976
CSF1PO
12 12 13 1 Black 31976
CSF1PO
12 13 1 Caucasian 13,342
CSF1PO
10, 11
11 12 1 Caucasian 25502
CSF1PO
10, 12
12 11 1 Caucasian 25502
CSF1PO
11 11 12 1 Caucasian 3,744
CSF1PO
11 11 12 1 Caucasian 25502
CSF1PO
11 11 13 1 Caucasian 25502
CSF1PO
11 12 12 1 Caucasian 37539
CSF1PO
11, 12
12 11 2 Caucasian 25502
CSF1PO
11, 12
11 10 1 Caucasian 3,744
CSF1PO
11, 12
11 12 1 Caucasian 3,744
CSF1PO
12 13 12, 13
1 Caucasian 37539
CSF1PO
12, 13
13 12 1 Caucasian 13,342
CSF1PO
9, 13
9 11 1 Caucasian 25502
CSF1PO
9, 10
10 11 1 Caucasian 25502
CSF1PO
10 10 11 1 Hispanic 11397
CSF1PO
12 12 13 1 Hispanic 11397
Phenotypes of The Observed
Alleles
PCR LOCUS
M C F
PROMEGA RACE OR ETHNICITY
Total Tests in the same System by
Race
CSF1PO
CSF1PO
Phenotypes of The Observed
Alleles
PCR LOCUS
M C F
ABI RACE OR ETHNICITY
Total Tests in the same System by
Race
D13S317
10 10 9 1 American Indian
842
D13S317
14 8 8, 12
1 Asian 2,175
D13S317
8, 11
8 12 1 Asian 2,035
D13S317
11 12 1 Asian 2,035
D13S317
13 11 8, 11
1 Asian 2,175
D13S317
9 8 9, 13
1 Asian Indian 869
D13S317
8 9 9, 11
1 Asian Indian 869
D13S317
9, 11
11 9 1 Asian Indian 869
D13S317
12 9 9, 11
1 Black 38683
D13S317
10, 11
11 12 1 Black 32792
D13S317
11, 13
11 12 1 Black 32792
D13S317
11, 12
11 12 1 Black 2,583
D13S317
9, 11
11 13 1 Black 32792
D13S317
12 11 1 Black 9,006
D13S317
11 12 11, 12
1 Black 38683
D13S317
11 12 12 1 Black 38683
D13S317
11 12 12 1 Black 38683
D13S317
11, 12
12 13 1 Black 32792
D13S317
11, 12
12 11 1 Black 32792
D13S317
11, 12
12 13 1 Black 32792
D13S317
12 12 13 1 Black 32792
D13S317
12 12 13 1 Black 32792
D13S317
12, 14
12 13 1 Black 32792
D13S317
12, 13
12 13 1 Black 32792
D13S317
13 12 1 Black 38683
D13S317
13 12 1 Black 38683
D13S317
11, 13
13 11 1 Black 32792
D13S317
12 13 1 Black 38683
D13S317
12, 13
13 12 1 Black 32792
D13S317
12 9 9, 10
1 Caucasian 38305
D13S317
10, 11
10 11 1 Caucasian 26053
D13S317
13 11 11, 13
1 Caucasian 651
D13S317
9, 11
11 12 1 Caucasian 4,232
D13S317
12 11 11, 12
1 Caucasian 38305
D13S317
8, 11
11 12 1 Caucasian 26053
D13S317
10 12 11, 12
1 Caucasian 5,756
D13S317
12 12 11 1 Caucasian 26053
D13S317
12, 14
12 11 1 Caucasian 26053
D13S317
12, 14
12 11 1 Caucasian 26053
D13S317
12 13 11, 13
1 Caucasian 38305
D13S317
12 15 1 Hispanic 3900
D13S317
11, 12
12 13 1 Hispanic 4,114
D13S317
12 12 11 1 Hispanic 11677
D13S317
9 12 1 Hispanic 15060
D13S317
14 13 1 Hispanic 15060

Phenotypes of The Observed
Alleles
PCR LOCUS
M C F
PROMEGA RACE OR ETHNICITY
Total Tests in the same System by
Race
D13S317
11 12 2 Black 1,280
D13S317
12 13 1 Black ?
D13S317
10 12 1 Caucasian 1,277
D13S317
14, 12
12 13 1 Caucasian ?
Phenotypes of The Observed
Alleles
PCR LOCUS
M C F
ABI RACE OR ETHNICITY
Total Tests in the same System by
Race
D16S539
12 11 1 Black 9,258
D16S539
12 11 1 Black 425
D16S539
12 13 1 Black 12,670
D16S539
11 12 1 Black ?
D16S539 11 13 9, 13
1 Black 38683
D16S539
12 12 11 1 Black 32806
D16S539 12, 13
12 11 1 Black 32806
D16S539
13 13 12 1 Black 2,481
D16S539
11 12 1 Caucasian 16,308
D16S539
12 11 2 Caucasian 12,637
D16S539
13 12 1 Caucasian 12,637
D16S539 9, 13
9 11 1 Caucasian 26075
D16S539 11 9 9, 12
1 Caucasian 38373
D16S539
12 11 11 1 Caucasian 7,583
D16S539 12 11 9, 11
1 Caucasian 38373
D16S539 12 11 9, 11
1 Caucasian 38373
D16S539
13 12 1 Caucasian 38373
D16S539 13 12 11, 12
1 Caucasian 38373
D16S539 9, 11
9 10 1 Hispanic 11642
D16S539 11, 12
11 12 1 Hispanic 11642
D16S539
13 12 12 1 Hispanic 4,380
D16S539
13 12 1 Hispanic 790
D16S539
13 12 12, 13
1 Yemeni 190
Phenotypes of The Observed
Alleles
PCR LOCUS
M C F
PROMEGA RACE OR ETHNICITY
Total Tests in the same System by
Race
D16S539
D16S539
Phenotypes of The Observed
Alleles
PCR LOCUS
M C F
ABI RACE OR ETHNICITY
Total Tests in the same System by
Race
D18S51
12, 15
12 17 1 Black 31668
D18S51
12, 19
12 17 1 Black 31668
D18S51
17 14 14, 20
1 Black 37116
D18S51
15 15 17 1 Black 31668
D18S51
15, 16
15 17 1 Black 31668
D18S51
18 16 16 1 Black 37116
D18S51
17 18 1 Black 8,754
D18S51
16 17 1 Black 11,484
D18S51
17 18 17, 18
1 Black 1,062
D18S51
14 18 16, 18
1 Black 37116
D18S51
15 19 1 Black 11,484
D18S51
17, 19
19 16 1 Black 31668
D18S51
21 21 15 1 Black 31668
D18S51
15, 16
15 11 1 Black 17,923
D18S51
17, 21
21 17 1 Black 17,923
D18S51
13 11 11, 16
1 Caucasian 5,768
D18S51
16 12 12, 14
1 Caucasian 1642
D18S51
12 13 1 Caucasian 1619
D18S51
14 18 1 Caucasian 15,420
D18S51
14 15 1 Caucasian 25385
D18S51
14, 20
14 15 1 Caucasian 25385
D18S51
16 15 1 Caucasian ?
D18S51
15 17 1 Caucasian 11,315
D18S51
12, 16
16 17 1 Caucasian 25385
D18S51
14, 15
14 12 1 Caucasian 15,420
D18S51
12, 14
12 17 1 Hispanic 11371
D18S51
12, 15
12 15 1 Hispanic 11371
D18S51
10 12 1 Hispanic 12784
D18S51
17 12 12, 15
1 Hispanic 12784
D18S51
12, 14
14 13 1 Hispanic 11371
D18S51
16 14 14, 15
1 Hispanic 12784
D18S51
14, 15
14 20 1 Hispanic 11371
D18S51
17 14 1 Hispanic 12784
D18S51
15, 21
15 18 1 Hispanic 11371
D18S51
13 15 14, 15
1 Hispanic 12784
D18S51
13, 15
15 16 1 Hispanic 11371
D18S51
16, 17
17 13 1 Hispanic 11371
D18S51
13, 18
18 17 1 Hispanic 11371
D18S51
13 23 15, 23
1 Hispanic 12784
D18S51
13, 21
21 18 1 Hispanic 4,098

D18S51
15, 17
17 12 1 Hispanic 4,098
D18S51
16, 17
16 13 1 Hispanic 3,775
D18S51
15, 16
16 13 1 Other 970
D18S51
17 18 18 1 Yemeni 190
Phenotypes of The Observed
Alleles
PCR LOCUS
M C F
PROMEGA RACE OR ETHNICITY
Total Tests in the same System by
Race
D18S51
Phenotypes of The Observed
Alleles
PCR LOCUS
M C F
ABI RACE OR ETHNICITY
Total Tests in the same System by
Race
D19S433
12 13 1 Asian 1,685
D19S433
14 14 13 1 Asian 1,577
D19S433
12 12 14 2 Black 1,062
D19S433
14 13 1 Black 11,518
D19S433
13 14 14 1 Black 1,379
D19S433
13 14 14 2 Black 1,062
D19S433
14 14 13 1 Black 6,979
D19S433
14 12 1 Black 6,979
D19S433
15 14 1 Black ?
D19S433
15 15.2 1 Black 11,412
D19S433
15.2 14 1 Black ?
D19S433
17.2 14 1 Black 6,979
D19S433
14 13 1 Caucasian 11,489
D19S433
14.2 15
15 13 1 Caucasian 12,294
D19S433
15 14 1 Caucasian 11,382
D19S433
13, 15
13 14 1 Hispanic 3,644
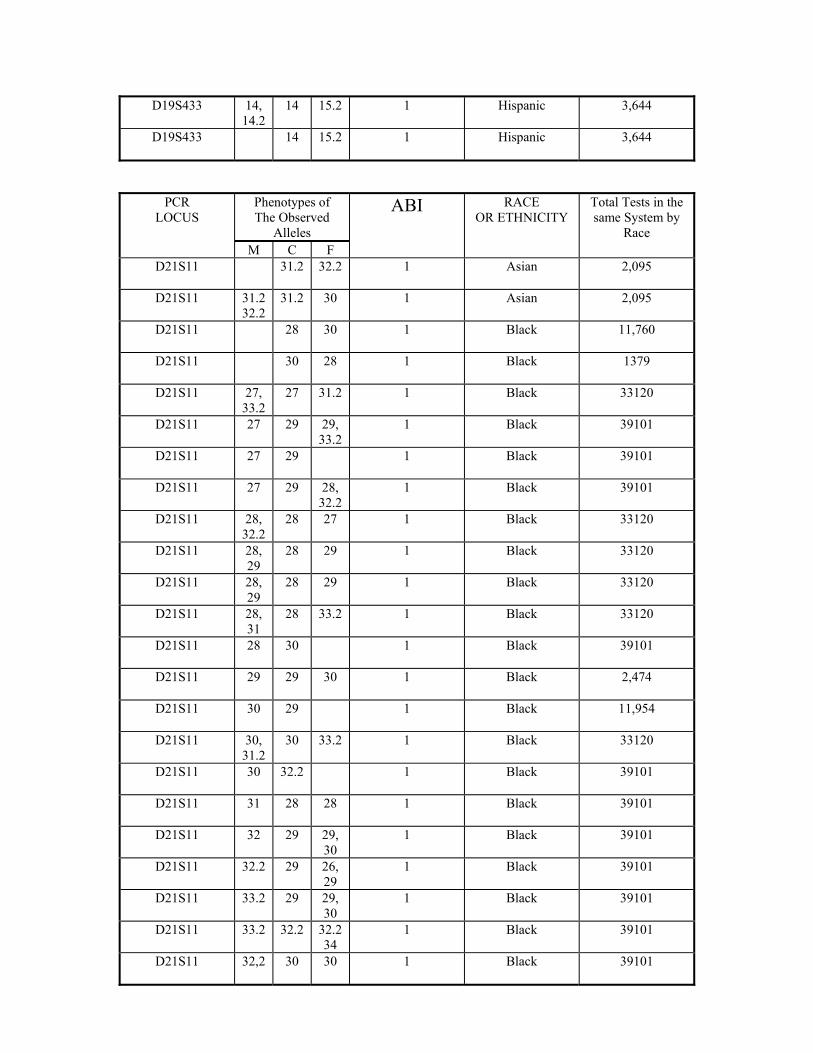
D19S433
14, 14.2
14 15.2 1 Hispanic 3,644
D19S433
14 15.2 1 Hispanic 3,644
Phenotypes of The Observed
Alleles
PCR LOCUS
M C F
ABI RACE OR ETHNICITY
Total Tests in the same System by
Race
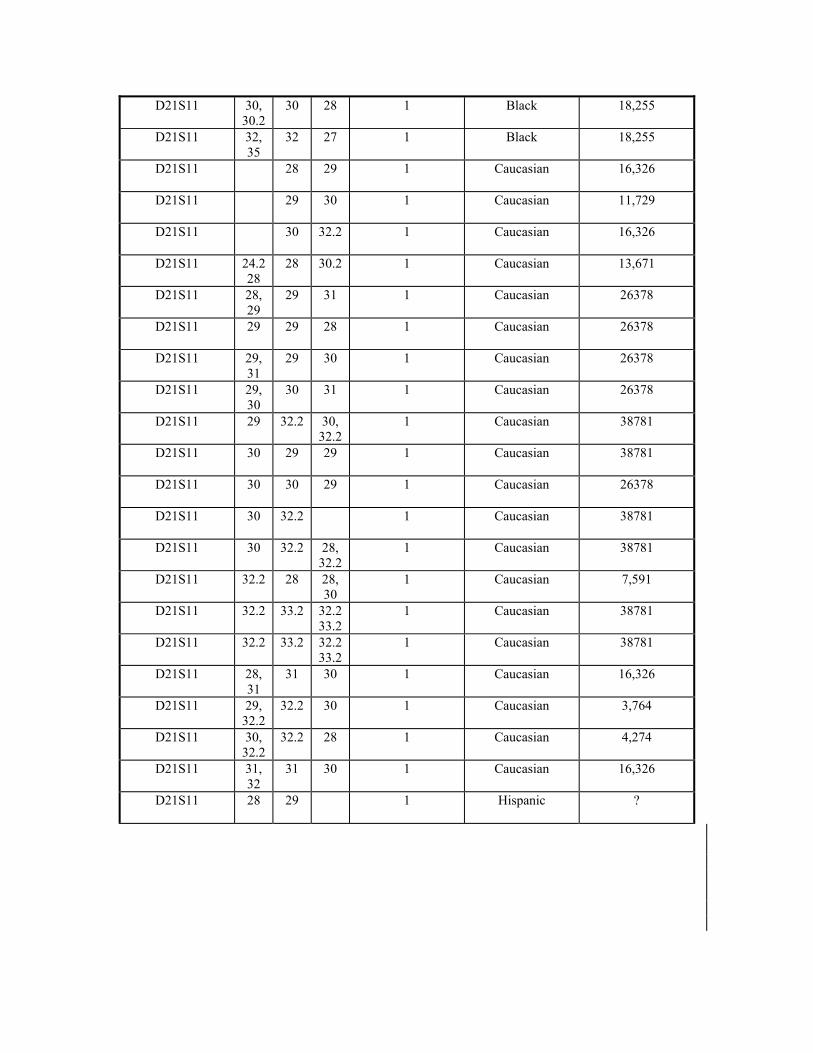
D21S11
31.2 32.2 1 Asian 2,095
D21S11
31.2 32.2
31.2 30 1 Asian 2,095
D21S11
28 30 1 Black 11,760
D21S11
30 28 1 Black 1379
D21S11
27, 33.2
27 31.2 1 Black 33120
D21S11
27 29 29, 33.2
1 Black 39101
D21S11
27 29 1 Black 39101
D21S11
27 29 28, 32.2
1 Black 39101
D21S11
28, 32.2
28 27 1 Black 33120
D21S11
28, 29
28 29 1 Black 33120
D21S11
28, 29
28 29 1 Black 33120
D21S11
28, 31
28 33.2 1 Black 33120
D21S11
28 30 1 Black 39101
D21S11
29 29 30 1 Black 2,474
D21S11
30 29 1 Black 11,954
D21S11
30, 31.2
30 33.2 1 Black 33120
D21S11
30 32.2 1 Black 39101
D21S11
31 28 28 1 Black 39101
D21S11
32 29 29, 30
1 Black 39101
D21S11
32.2 29 26, 29
1 Black 39101
D21S11
33.2 29 29, 30
1 Black 39101
D21S11
33.2 32.2 32.2 34
1 Black 39101
D21S11
32,2 30 30 1 Black 39101
D21S11
30, 30.2
30 28 1 Black 18,255
D21S11
32, 35
32 27 1 Black 18,255
D21S11
28 29 1 Caucasian 16,326
D21S11
29 30 1 Caucasian 11,729
D21S11
30 32.2 1 Caucasian 16,326
D21S11
24.228
28 30.2 1 Caucasian 13,671
D21S11
28, 29
29 31 1 Caucasian 26378
D21S11
29 29 28 1 Caucasian 26378
D21S11
29, 31
29 30 1 Caucasian 26378
D21S11
29, 30
30 31 1 Caucasian 26378
D21S11
29 32.2 30, 32.2
1 Caucasian 38781
D21S11
30 29 29 1 Caucasian 38781
D21S11
30 30 29 1 Caucasian 26378
D21S11
30 32.2 1 Caucasian 38781
D21S11
30 32.2 28, 32.2
1 Caucasian 38781
D21S11
32.2 28 28, 30
1 Caucasian 7,591
D21S11
32.2 33.2 32.2 33.2
1 Caucasian 38781
D21S11
32.2 33.2 32.2 33.2
1 Caucasian 38781
D21S11
28, 31
31 30 1 Caucasian 16,326
D21S11
29, 32.2
32.2 30 1 Caucasian 3,764
D21S11
30, 32.2
32.2 28 1 Caucasian 4,274
D21S11
31, 32
31 30 1 Caucasian 16,326
D21S11
28 29 1 Hispanic ?

Phenotypes of The Observed
Alleles
PCR LOCUS
M C F
PROMEGA
RACE OR ETHNICITY
Total Tests in the same System by
Race
D21S11
D21S11
Phenotypes of The Observed
Alleles
PCR LOCUS
M C F
ABI RACE OR ETHNICITY
Total Tests in the same System by
Race
D2S1338
16 17 1 Black 11,551
D2S1338
20 21 1 Black 8,452
D2S1338
23 22 1 Black 11,551
D2S1338
17 18 1 Caucasian 11,521
D2S1338
22 20 1 Caucasian 11,670
D2S1338
19, 23
23 17 1 Caucasian 14,887
D2S1338
25 23 1 Caucasian ?
D2S1338