annual...
TRANSCRIPT

Annual Report 2017


1MOODY’S 2017 ANNUAL REPORT
Another important element of Moody’s approach to conducting business is corporate social responsibility (CSR). From environmental sustainability, economic development and philanthropy to support for education and employee volunteerism, CSR initiatives make Moody’s stronger. They help us to be an employer of choice, promoting innovation and building goodwill across markets and in the world at large. For example, MIS’s environmental, social and governance (ESG) initiatives help corporations and investors confidently assess the value and impact of sustainability in financial markets. Also, MIS’s green bond assessments provide information that market participants need to invest in environmentally beneficial projects by providing a consistent, standardized way to evaluate green bonds. Moody’s approach to CSR is helping empower people with the knowledge and tools they need to create a better future for themselves, their communities and the environment. To learn more about Moody’s CSR strategy, visit moodys.com/csr.
On behalf of Moody’s board of directors, I would like to thank two of our directors, Darrell Duffie and Ewald Kist, who recently announced they will not be standing for re-election to Moody’s board in April. Both Darrell and Ewald served with distinction and their substantial contributions and insights will be missed. We wish them all the best in their next endeavors.
Finally, I would like to thank Moody’s stockholders for their continued support. I also thank my fellow board members, Moody’s executive management team and all Moody’s employees for their hard work and exemplary performance in 2017. On behalf of the board, I can say with confidence to all of our stakeholders that Moody’s has the resources, capabilities and brand to ensure it remains a global authority supporting credit and related financial risk decisions. I am very optimistic about Moody’s opportunities and look forward to future success.
Henry A. McKinnell, Jr., Ph.D. Chairman of the Board
Sitting at the heart of the global financial markets, Moody’s plays an important role in shaping the thinking of participants in those markets. The quality and depth of our credit research, opinions and ratings, award-winning risk management software and professional services all contribute to the more effective functioning of credit- and risk-sensitive markets around the world. Individuals, firms, governments and regulators continue to rely on Moody’s thought leadership to inform their decision-making across a wide range of credit and related financial risk issues.
Moody’s had a notable 2017, achieving strong financial results and share price performance, while successfully completing our largest acquisition to date — the purchase of Bureau van Dijk. Moody’s Investors Service (MIS) remained focused on analytical excellence and the continuous refinement of its credit methodologies to provide predictive, predictable and transparent ratings. Indeed, the accuracy of MIS’s ratings in 2017 was at or near high-water marks across the corporate, public and structured finance sectors. Moody’s Analytics continued to build a platform that offers unique data, models, analytical software and expertise that empower its customers to better measure, monitor and manage risk. Across the entire organization, Moody’s explored and embraced enabling technologies, with a focus on enhancing existing revenue streams, creating new opportunities and controlling expenses.
It is the duty of the board of directors to serve as a prudent fiduciary for our stockholders and to oversee the management of the Company’s business, including overseeing Moody’s risk management processes so that the Company can better anticipate and respond to risks. Moody’s enterprise risk management program serves to identify, analyze and mitigate risk —strategic, operational, financial, reputational and human capital —across all business units. Moody’s Chief Risk Officer reports to the CEO and has a global remit. The most significant risks are regularly reviewed with the executive management team and reported to the board. Managing risk is a core function at Moody’s, and we apply the same close scrutiny of risks to our own operations as we do to the companies and customers we serve.
Henry A. McKinnell, Jr., Ph.D.Letter from the Chairman of the Board

2 MOODY’S 2017 ANNUAL REPORT
Global economic expansion was strong and stable in 2017 with all major economies experiencing growth. The U.S. economy remained on solid footing, featuring high levels of consumer and business confidence as well as sustained employment gains. In Europe, a broad-based recovery gained momentum as electoral and related geopolitical concerns over more exits from the European Union abated. Emerging market countries also exhibited improved prospects.
Capital markets activity proved to be highly resilient to geopolitical, macroeconomic and other risks that could have restrained debt issuance during the year. Funding and refinancing conditions were favorable, reflecting healthy economic growth, still-accommodative monetary policies and declining corporate default rates, all of which combined to support low borrowing costs and readily available capital.
Synchronous global growth and healthy capital markets in 2017 provided the backdrop for Moody’s highest rate of revenue growth since 2012. Revenue of $4.2 billion in 2017 increased 17% from 2016. Moody’s Investors Service (MIS) and Moody’s Analytics (MA) both reported record revenues, with seven out of eight lines of business showing growth.
MIS revenue rose 17% to $2.8 billion. 2017 saw broad gains in corporate and financial sector bond and loan issuance, including record volumes of U.S. and European bank loans and Asian bonds, while important sectors of structured finance, such as collateralized loan obligations (CLOs), experienced robust activity. MIS also benefited from a record number of new rating mandates in 2017, reflecting the ongoing trend of disintermediation of fixed-income markets in both developed and emerging economies.
MA revenue increased 16% to $1.4 billion, driven by organic growth in all three lines of business as well as the addition of Bureau van Dijk, which Moody’s acquired on August 10, 2017. Research, Data and Analytics achieved very strong
organic growth reflecting a combination of new sales, product upgrades and high customer retention rates. Enterprise Risk Solutions grew revenue at a solid, albeit slower pace than in recent years as the business adjusts to a shift in demand and customers’ technology preferences while emphasizing more scalable product sales. Finally, Professional Services achieved positive results as both Moody’s Analytics Knowledge Services and Financial Services Training & Certifications returned to growth.
Other 2017 reported financial measures for Moody’s Corporation include:
» Operating income of $1,809 million, up from $639 million in 20161
» Operating margin of 43.0%, up from 17.7%1
» Adjusted operating income of $1,990 million, up from $1,641 million2
» Adjusted operating margin of 47.3%, up 180 basis points from 45.5%2
» Diluted EPS of $5.15, up from $1.361
» Adjusted diluted EPS of $6.07, up 23% from $4.942
Moody’s strong results helped our stock outperform the overall market. 2017’s total return of 59% compared to 22% for the S&P 500 and represented the strongest annual performance for Moody’s stock since becoming a public company.
I am confident that our business today is resilient. Moody’s remains an essential component of the global capital markets, providing credit ratings, research, tools and analysis that contribute to transparent and integrated financial markets. While defending and enhancing our core business is our primary objective, we have the resources, capabilities and brand to achieve broader success.
1 Comparisons to 2016 include the impact in that year of an $863.8 million settlement charge - $700.7 million net of tax - related to an agreement with the U.S. Department of Justice and the attorneys general of 21 U.S. states and the District of Columbia.
2 Refer to “Non-GAAP Financial Measures” on page 55 in Item 7 of Moody’s 2017 Form 10-K for a discussion of the Company’s non-GAAP financial measures.
Raymond W. McDaniel, Jr.Letter from the President & Chief Executive Officer
3MOODY’S 2017 ANNUAL REPORT
As previously mentioned, in early August Moody’s completed the largest acquisition in our history —the €3 billion acquisition of Bureau van Dijk. Bureau van Dijk aggregates, standardizes and distributes one of the world’s most extensive private company datasets. We are very pleased to be able to add this successful and highly complementary business, which builds on Moody’s role as a global provider of credit risk measures and analytical insight.
While Bureau van Dijk was the headline story on acquisitions, we also made smaller investments in companies and technologies that have the potential to help us strengthen existing offerings and enter new areas of opportunity. In 2017, Moody’s made minority investments in CompStak and Rockport VAL, both in the commercial real estate analytics space, and Security-Scorecard, a cybersecurity ratings firm. We also acquired the structured finance data and analytics business of SCDM, a leading provider of analytical tools for participants in securitization markets.
As part of expanding Moody’s global footprint, we are positioning ourselves to play a larger role in China —one of the largest debt markets in the world. By the end of 2017, MIS rated over 250 cross-border Chinese entities, up 15% from 2016 and more than double the number rated just five years ago. To help attract international capital, China recently announced that foreign rating agencies will be allowed to assess the credit risks of the nation’s sizeable domestic corporate debt market. Amid these indications that the Chinese market will continue to open, MIS completed a realignment and expansion of its local affiliate, CCXI, in 2017 and is increasing its participation in China more broadly.
Environmental, social and governance (ESG) initiatives represent another area of opportunity for MIS, where its practice continues to gain momentum. MIS’s initiative to incorporate ESG risks into its credit analysis is growing. To further its reputation as a thought leader in the ESG space, MIS is increasing its outreach and research, all supported by a dedicated ESG analytical team and a green bond assessment team.
Fostering innovation is crucial to success in a market environment that is increasingly digital and where the rate of technology-enabled change is accelerating. The Emerging Business Unit in MA and the new Analytic and Technology Solutions Group in MIS continue to study developments in
applied technologies that can help Moody’s better reach customers, create new products and improve the Company’s internal processes, including across multiple compliance and control functions.
In January 2018, Moody’s announced that Linda Huber, Executive Vice President and Chief Financial Officer, is leaving the Company to pursue other opportunities. Linda has given Moody’s more than 12 years of outstanding service. She has been an exceptional steward of our financial performance, and I wish her every success in the next phase of her career.
I would also like to thank two of Moody’s board members, Darrell Duffie and Ewald Kist, who recently announced they will not be standing for re-election to Moody’s board of directors after 9 and 13 years of service, respectively. Their experiences, insights and contributions will continue to serve as positive influences on Moody’s management team and our business for years to come.
At Moody’s, we are proud of our open and diverse workplace, which helps attract and retain top talent and fosters analytical rigor, intellectual curiosity and collegiality. In 2017, Moody’s was again recognized as one of the best and most inclusive places to work by multiple institutions, including Working Mother and the Human Rights Campaign via its Corporate Equality Index. I am confident that the dedication and capabilities of our employees will enable Moody’s to continue to perform at a high level as we execute on our strategy to create ever broader, sustainable growth in our core business while expanding into areas that strengthen Moody’s position as the world’s most respected authority serving risk-sensitive financial markets.
While challenges will inevitably persist, I am proud of all we achieved in 2017 and optimistic about the future. I thank our employees for their hard work and commitment in making 2017 a particularly successful year. I also welcome our new colleagues from Bureau van Dijk to Moody’s. We look forward to continued success as we maintain our focus on achieving the highest standards while growing, innovating and creating value for all our stakeholders.
Raymond W. McDaniel, Jr. President & Chief Executive Officer

Moody’s Corporation
DIRECTORS Henry A. McKinnell, Jr., Ph.D.(1,2,3,4*)
Chairman of the Board of Directors Moody’s Corporation
Raymond W. McDaniel, Jr.(4)
President & Chief Executive OfficerMoody’s Corporation Basil L. Anderson(1,2*,3,4)
Retired Vice ChairmanStaples, Inc.
Jorge A. Bermudez(1,2,3)
Retired Chief Risk OfficerCitigroup, Inc.
Darrell Duffie, Ph.D.(1,2,3)
Dean Witter Distinguished Professor of FinanceStanford University Graduate School of Business Kathryn M. Hill(1,2,3*)
Retired Senior Vice President Cisco Systems Inc.
Ewald Kist(1,2,3)
Retired ChairmanING Groep N.V. (ING Group)
Leslie F. Seidman(1*,2,3,4)
Former ChairmanFinancial Accounting Standards Board
Bruce Van Saun(1,2,3)
Chairman & Chief Executive OfficerCitizens Financial Group, Inc.
EXECUTIVE OFFICERS Raymond W. McDaniel, Jr.President & Chief Executive Officer
Executive Vice Presidents John J. GogginsGeneral Counsel
Linda S. HuberChief Financial Officer
Senior Vice Presidents Michael S. CrimminsCorporate Controller
Jeffrey R. HareCorporate Planning & Risk
Melanie HughesChief Human Resources Officer
Scott KenneyGeneral Auditor
Arthur N. SkelskieCorporate Services
Tony StoupasChief Information Officer
Blair L. WorrallRatings Delivery & Data
Vice PresidentsThomas Fezza Global Tax
Stephen MaireInvestor Relations & Communications
Salli SchwartzTreasurer
Chief Risk Officer Richard Cantor
Chief Compliance Officer Helene Gurian
Corporate Secretary Jane B. Clark
BOARD COMMITTEES 1 Audit2 Governance & Nominating3 Compensation & Human Resources4 Executive* Committee Chairman
Stockholders and other stakeholders may communicate with the Board, or with a specific director or directors, by writing to:
c/o Corporate Secretary Moody’s Corporation 7 World Trade Center 250 Greenwich Street New York, NY 10007
4 MOODY’S 2017 ANNUAL REPORT
SENIOR MANAGEMENT
Presidents Mark AlmeidaMoody’s Analytics
Robert FauberMoody’s Investors Service

UNITED STATESSECURITIES AND EXCHANGE COMMISSION
WASHINGTON, D.C. 20549
FORM 10-K(MARK ONE)
Í ANNUAL REPORT PURSUANT TO SECTION 13 OR 15(d) OF THE SECURITIES EXCHANGE ACT OF 1934FOR THE FISCAL YEAR ENDED DECEMBER 31, 2017
OR
‘ TRANSITION REPORT PURSUANT TO SECTION 13 OR 15(d) OF THE SECURITIES EXCHANGE ACT OF 1934FOR THE TRANSITION PERIOD FROM TO .
COMMISSION FILE NUMBER 1-14037
MOODY’S CORPORATION(EXACT NAME OF REGISTRANT AS SPECIFIED IN ITS CHARTER)
DELAWARE 13-3998945(STATE OF INCORPORATION) (I.R.S. EMPLOYER IDENTIFICATION NO.)
7 World Trade Center at 250 Greenwich Street, NEW YORK, NEW YORK 10007(ADDRESS OF PRINCIPAL EXECUTIVE OFFICES)
(ZIP CODE)
REGISTRANT’S TELEPHONE NUMBER, INCLUDING AREA CODE: (212) 553-0300.
SECURITIES REGISTERED PURSUANT TO SECTION 12(b) OF THE ACT:
TITLE OF EACH CLASS NAME OF EACH EXCHANGE ON WHICH REGISTEREDCOMMON STOCK, PAR VALUE $.01 PER SHARE NEW YORK STOCK EXCHANGE
1.75% SENIOR NOTES DUE 2027 NEW YORK STOCK EXCHANGE
SECURITIES REGISTERED PURSUANT TO SECTION 12(g) OF THE ACT:NONE
Indicate by check mark if the registrant is a well-known seasoned issuer, as defined in Rule 405 of the Securities Act. Yes Í No ‘
Indicate by check mark if the registrant is not required to file reports pursuant to Section 13 or Section 15(d) of the Act. Yes ‘ No Í
Indicate by check mark whether the registrant (1) has filed all reports required to be filed by Section 13 or 15(d) of the Securities Exchange Act of 1934during the preceding 12 months (or for such shorter period that the registrant was required to file such reports), and (2) has been subject to such filingrequirements for the past 90 days. Yes Í No ‘
Indicate by check mark whether the registrant has submitted electronically and posted on its corporate Web site, if any, every Interactive Data Filerequired to be submitted and posted pursuant to Rule 405 of Regulation S-T (§232.405 of this chapter) during the preceding 12 months (or for suchshorter period that the registrant was required to submit and post such files). Yes Í No ‘
Indicate by check mark if disclosure of delinquent filers pursuant to Item 405 of Regulation S-K (§ 229.405 of this chapter) is not contained herein, andwill not be contained, to the best of registrant’s knowledge, in definitive proxy or information statements incorporated by reference in Part III of thisForm 10-K or any amendment to this Form 10-K. ‘
Indicate by check mark whether the registrant is a large accelerated filer, an accelerated filer, a non-accelerated filer, a smaller reporting company, oremerging growth company. See the definitions of “large accelerated filer,” “accelerated filer,” “smaller reporting company,” and “emerging growthcompany” in Rule 12b-2 of the Exchange Act.
Large Accelerated Filer Í Accelerated Filer ‘ Non-accelerated Filer ‘ Smaller reporting company ‘ Emerging growth company ‘
If an emerging growth company, indicate by check mark if the Registrant has elected not to use the extended transition period for complying with anynew or revised financial accounting standards pursuant to Section 13(a) of the Exchange Act. ‘
Indicate by check mark whether the registrant is a shell company (as defined in Rule 12b-2 of the Act). Yes ‘ No Í
The aggregate market value of Moody’s Corporation Common Stock held by nonaffiliates* on June 30, 2017 (based upon its closing transaction price onthe Composite Tape on such date) was approximately $23.0 billion.
As of January 31, 2018, 191.1 million shares of Common Stock of Moody’s Corporation were outstanding.
DOCUMENTS INCORPORATED BY REFERENCE
Portions of the Registrant’s definitive proxy statement for use in connection with its annual meeting of stockholders scheduled to be held on April 24,2018, are incorporated by reference into Part III of this Form 10-K.
The Index to Exhibits is included as Part IV, Item 15(3) of this Form 10-K.
* Calculated by excluding all shares held by executive officers and directors of the Registrant without conceding that all such persons are “affiliates” of theRegistrant for purposes of federal securities laws.
MOODY’S 2017 10-K

MOODY’S CORPORATION
INDEX TO FORM 10-K
Page(s)
Glossary of Terms and Abbreviations 4-10
PART I.
Item 1. BUSINESS 11
Background 11
The Company 11
Prospects for Growth 11-13
Competition 13
Moody’s Strategy 13-14
Regulation 14-15
Intellectual Property 15-16
Employees 16
Available Information 16
Executive Officers of the Registrant 16-17
Item 1A. RISK FACTORS 18-25
Item 1B. UNRESOLVED STAFF COMMENTS 25
Item 2. PROPERTIES 25
Item 3. LEGAL PROCEEDINGS 25
Item 4. MINE SAFETY DISCLOSURES 25
PART II.
Item 5. MARKET FOR THE REGISTRANT’S COMMON EQUITY, RELATED SHAREHOLDER MATTERS AND ISSUERPURCHASES OF EQUITY SECURITIES 26
Moody’s Purchases of Equity Securities 26
Common Stock Information and Dividends 26
Equity Compensation Plan Information 27
Performance Graph 28
Item 6. SELECTED FINANCIAL DATA 29-30
Item 7. MANAGEMENT’S DISCUSSION AND ANALYSIS OF FINANCIAL CONDITION AND RESULTS OF OPERATIONS 31
The Company 31
Critical Accounting Estimates 31-37
Reportable Segments 37-38
Results of Operations 38-51
Market Risk 51-52
Liquidity and Capital Resources 52-58
Recently Issued Accounting Pronouncements 58
Contingencies 58
Forward-Looking Statements 58-59
Item 7A. QUANTITATIVE AND QUALITATIVE DISCLOSURES OF MARKET RISK 59
Item 8. FINANCIAL STATEMENTS 60
Item 9. CHANGES IN AND DISAGREEMENTS WITH ACCOUNTANTS ON ACCOUNTING AND FINANCIAL DISCLOSURE 117
Item 9A. CONTROLS AND PROCEDURES 117
Item 9B. OTHER INFORMATION 117
2 MOODY’S 2017 10-K

Page(s)
PART III.
Item 10. DIRECTORS, EXECUTIVE OFFICERS AND CORPORATION GOVERNANCE 118
Item 11. EXECUTIVE COMPENSATION 118
Item 12. SECURITY OWNERSHIP OF CERTAIN BENEFICIAL OWNERS AND MANAGEMENT AND RELATED STOCKHOLDERMATTERS 118
Item 13. CERTAIN RELATIONSHIPS AND RELATED TRANSACTIONS, AND DIRECTOR INDEPENDENCE 118
Item 14. PRINCIPAL ACCOUNTING FEES AND SERVICES 118
PART IV.
Item 15. EXHIBITS AND FINANCIAL STATEMENT SCHEDULES 119
SIGNATURES 120
INDEX TO EXHIBITS 121-124
Exhibitsfiled Herewith
10.2.1 1998 Moody’s Corporation Non-Employee Directors’ Stock Incentive Plan (Adopted September 8, 2000; Amended andRestated as of December 11, 2012, October 20, 2015, December 14, 2015 and December 18, 2017)
10.2.3 Form of Non-Employee Director Restricted Stock Unit Grant Agreement (for awards after 2017) for the 1998 Moody’sCorporation Non-Employee Directors’ Stock Incentive Plan (Adopted September 8, 2000; Amended and Restated as ofDecember 11, 2012, October 20, 2015, December 14, 2015 and December 18, 2017)
10.4.1 Amended and Restated 2001 Moody’s Corporation Key Employees’ Stock Incentive Plan (as amended, December 18, 2017)
10.4.6 Form of Performance Share Award Letter (for awards granted after 2017) for the Amended and Restated 2001 Moody’sCorporation Key Employees’ Stock Incentive Plan.
10.10 Moody’s Corporation Change in Control Severance Plan (as amended December 18, 2017).
12 Statement of Computation of Ratios of Earnings to Fixed Charges
21 SUBSIDIARIES OF THE REGISTRANT
23.1 CONSENT OF INDEPENDENT REGISTERED PUBLIC ACCOUNTING FIRM
31.1 Chief Executive Officer Certification Pursuant to Section 302 of the Sarbanes-Oxley Act of 2002
31.2 Chief Financial Officer Certification Pursuant to Section 302 of the Sarbanes-Oxley Act of 2002
32.1 Chief Executive Officer Certification Pursuant to Section 906 of the Sarbanes-Oxley Act of 2002
32.2 Chief Financial Officer Certification Pursuant to Section 906 of the Sarbanes-Oxley Act of 2002
101.DEF XBRL Definitions Linkbase Document
101.INS XBRL Instance Document
101.SCH XBRL Taxonomy Extension Schema Document
101. CAL XBRL Taxonomy Extension Calculation Linkbase Document
101.LAB XBRL Taxonomy Extension Labels Linkbase Document
101.PRE XBRL Taxonomy Extension Presentation Linkbase Document
MOODY’S 2017 10-K 3

GLOSSARY OF TERMS AND ABBREVIATIONS
The following terms, abbreviations and acronyms are used to identify frequently used terms in this report:
TERM DEFINITION
Acquisition-RelatedAmortization
Amortization of acquired definite-lived intangible assets acquired by the Company from all business combina-tion transactions
Acquisition-RelatedExpenses
Consists of expenses incurred to complete and integrate the acquisition of Bureau van Dijk for which theintegration will be a multi-year effort
Adjusted Diluted EPS Diluted EPS excluding the impact of certain items as detailed in Item 7 in the section entitled “Non-GAAPFinancial Measures”
Adjusted Net Income Net Income excluding the impact of certain items as detailed in Item 7 in the section entitled “Non-GAAPFinancial Measures”
Adjusted OperatingIncome
Operating income excluding certain items as detailed in Item 7 in the section entitled “Non-GAAP FinancialMeasures”
Adjusted OperatingMargin
Adjusted Operating Income divided by revenue
Americas Represents countries within North and South America, excluding the U.S.
AOCI Accumulated other comprehensive income (loss); a separate component of shareholders’ (deficit) equity
ASC The FASB Accounting Standards Codification; the sole source of authoritative GAAP as of July 1, 2009 exceptfor rules and interpretive releases of the SEC, which are also sources of authoritative GAAP for SEC registrants
Asia-Pacific Represents countries in Asia including but not limited to: Australia, China, India, Indonesia, Japan, Korea,Malaysia, Singapore, Sri Lanka and Thailand
ASU The FASB Accounting Standards Update to the ASC. It also provides background information for accountingguidance and the bases for conclusions on the changes in the ASC. ASUs are not considered authoritative untilcodified into the ASC
Basel II Capital adequacy framework published in June 2004 by the Basel Committee on Banking Supervision
Basel III A new global regulatory standard on bank capital adequacy and liquidity agreed by the members of the BaselCommittee on Banking Supervision. Basel III was developed in a response to the deficiencies in financial regu-lation revealed by the global financial crisis. Basel III strengthens bank capital requirements and introducesnew regulatory requirements on bank liquidity and bank leverage
BlackBox BlackBox Logic; a leading provider of Residential Mortgage-Backed securities loan level data. The Companyacquired the customer base and products of BlackBox Logic in December 2015
Board The board of directors of the Company
BPS Basis points
Bureau van Dijk Bureau van Dijk Electronic Publishing, B.V., a global provider of business intelligence and company information;acquired by the company on August 10, 2017 via acquisition of yellow Maple I B.V., an indirect parent ofBureau van Dijk
CCAR Comprehensive Capital Analysis and Review; annual review by the Federal Reserve in the U.S. to ensure thatfinancial institutions have sufficient capital in times of economic and financial stress and that they haverobust, forward-looking capital-planning processes that account for their unique risks.
CCXI China Chen Xin International Credit Rating Co. Ltd.; China’s first and largest domestic credit rating agencyapproved by the People’s Bank of China; the Company acquired a 49% interest in 2006; currently Moody’sowns 30% of CCXI
CCXI Gain In the first quarter of 2017 CCXI, as a part of a strategic business realignment, issued additional capital to itsmajority shareholder in exchange for a ratings business wholly-owned by the majority shareholder and whichhas the right to rate a different class of debt instruments in the Chinese market. The capital issuance by CCXIin exchange for the ratings business diluted Moody’s ownership interest in CCXI to 30% of a larger businessand resulted in a $59.7 million non-cash, non-taxable gain
4 MOODY’S 2017 10-K

TERM DEFINITION
CFG Corporate finance group; an LOB of MIS
CLO Collateralized loan obligation
CMBS Commercial mortgage-backed securities; part of the CREF asset class within SFG
Commission European Commission
Common Stock The Company’s common stock
Company Moody’s Corporation and its subsidiaries; MCO; Moody’s
Copal Copal Partners; an acquisition completed in November 2011; part of the MA segment; leading provider ofoffshore research and analytical services to institutional investors
Council Council of the European Union
CP Commercial paper
CP Notes Unsecured commercial paper issued under the CP Program
CP Program A program entered into on August 3, 2016 allowing the Company to privately place CP up to a maximum of$1 billion for which the maturity may not exceed 397 days from the date of issue.
CRAs Credit rating agencies
CREF Commercial real estate finance, which includes REITs, commercial real estate CDOs and mortgage-backedsecurities; part of SFG
CSI CSI Global Education, Inc.; an acquisition completed in November 2010; part of the PS LOB and FSTC report-ing unit within the MA segment; a provider of financial learning, credentials, and certification services primar-ily in Canada
CSPP Corporate Sector Purchase Programme; quantitative easing program implemented by the ECB. This programallows the central bank to purchase bonds issued by European companies, as well as provide access to thesecondary bond market in which existing corporate bonds trade
D&A Depreciation and amortization
DBPPs Defined benefit pension plans
DBRS Dominion Bond Rating Service
DCF Discounted cash flow; a fair value calculation methodology whereby future projected cash flows are dis-counted back to their present value
Debt/EBITDA Ratio of Total Debt to EBITDA
Directors’ Plan The 1998 Moody’s Corporation Non-Employee Directors’ Stock Incentive Plan
Distribution Date September 30, 2000; the date which Old D&B separated into two publicly traded companies—Moody’s Corpo-ration and New D&B
DOJ U.S. Department of Justice
E&P Earnings and profits
EBITDA Earnings before interest, taxes, depreciation and amortization
ECB European Central Bank
ECCA Economics and Consumer Credit Analytics; a business within the RD&A LOB which provides economic andconsumer credit trend analytics
MOODY’S 2017 10-K 5
TERM DEFINITION
EMEA Represents countries within Europe, the Middle East and Africa
EPS Earnings per share
Equilibrium A leading provider of credit rating and research services in Peru and Panama; acquired by Moody’s in May2015
ERS The enterprise risk solutions LOB within MA, which offers risk management software products as well as soft-ware implementation services and related risk management advisory engagements
ESA Economics and Structured Analytics; part of the RD&A line of business within MA
ESG Environmental, Social and Governance
ESMA European Securities and Markets Authority
ESP Estimated Selling Price; estimate of selling price, as defined in the ASC, at which the vendor would transact ifthe deliverable were sold by the vendor regularly on a stand-alone basis
ESPP The 1999 Moody’s Corporation Employee Stock Purchase Plan
ETR Effective tax rate
EU European Union
EUR Euros
European Ratings Plat-form
Central credit ratings website administered by ESMA
Excess Tax Benefits The difference between the tax benefit realized at exercise of an option or delivery of a restricted share andthe tax benefit recorded at the time the option or restricted share is expensed under GAAP
Exchange Act The Securities Exchange Act of 1934, as amended
FASB Financial Accounting Standards Board
FIG Financial institutions group; an LOB of MIS
Fitch Fitch Ratings, a part of the Fitch Group
Financial Reform Act Dodd-Frank Wall Street Reform and Consumer Protection Act
Free Cash Flow Net cash provided by operating activities less cash paid for capital additions
FSTC Financial Services Training and Certifications; part of the PS LOB and a reporting unit within the MA reportablesegment; consists of on-line and classroom-based training services and CSI
FX Foreign exchange
GAAP U.S. Generally Accepted Accounting Principles
GBP British pounds
GDP Gross domestic product
GGY Gilliland Gold Young; a leading provider of advanced actuarial software for the global insurance industry. TheCompany acquired GGY on March 1, 2016; Part of the ERS LOB and reporting unit within the MA reportablesegment
ICRA ICRA Limited; a leading provider of credit ratings and research in India. The Company previously held 28.5%equity ownership and in June 2014, increased that ownership stake to just over 50% through the acquisitionof additional shares
ICRA Acquisition The June 2014 purchase of an additional interest in ICRA resulting in a majority ownership of ICRA; ICRAsresults are consolidated into Moody’s financial statements on a three-month lag and accordingly the Com-pany began including the results of operations for ICRA in its consolidated financial statements beginning inthe fourth quarter of 2014
6 MOODY’S 2017 10-K

TERM DEFINITION
ICRA Gain Gain relating to the ICRA Acquisition; U.S. GAAP requires the remeasurement to fair value of the previouslyheld non-controlling shares upon obtaining a controlling interest in a step-acquisition. This remeasurement ofthe Company’s equity investment in ICRA to fair value resulted in a pre-tax gain of $102.8 million($78.5 million after tax) in the second quarter of 2014
ICTEAS ICRA Techno Analytics; formerly a wholly-owned subsidiary of ICRA; divested by ICRA in the fourth quarter of2016
Intellectual Property The Company’s intellectual property, including but not limited to proprietary information, trademarks,research, software tools and applications, models and methodologies, databases, domain names, and otherproprietary materials
IRS Internal Revenue Service
IT Information technology
KIS Korea Investors Service, Inc; a leading Korean rating agency and consolidated subsidiary of the Company
KIS Pricing Korea Investors Service Pricing, Inc; a leading Korean provider of fixed income securities pricing and con-solidated subsidiary of the Company
KIS Research Korea Investors Service Research; a Korean provider of financial research and consolidated subsidiary of theCompany
Korea Republic of South Korea
Legacy Tax Matter(s) Exposures to certain potential tax liabilities assumed in connection with the Company’s spin-off from Dun &Bradstreet in 2000
LIBOR London Interbank Offered Rate
LOB Line of business
M&A Mergers and acquisitions
MA Moody’s Analytics—a reportable segment of MCO formed in January 2008 which provides a wide range ofproducts and services that support financial analysis and risk management activities of institutional partic-ipants in global financial markets; consists of three LOBs—RD&A, ERS and PS
Make Whole Amount The prepayment penalty amount relating to the Series 2007-1 Notes, 2010 Senior Notes, 2012 Senior Notes,2013 Senior Notes, 2014 Senior Notes (5-year), 2014 Senior Notes (30-year), 2015 Senior Notes, 2017 SeniorNotes, 2017 Private Placement Notes Due 2023 and 2028 which is a premium based on the excess, if any, ofthe discounted value of the remaining scheduled payments over the prepaid principal
MAKS Moody’s Analytics Knowledge Services; formerly known as Copal Amba; provides offshore research and ana-lytic services to the global financial and corporate sectors; part of the PS LOB and a reporting unit within theMA reportable segment
MCO Moody’s Corporation and its subsidiaries; the Company; Moody’s
MD&A Management’s Discussion and Analysis of Financial Condition and Results of Operations
MIS Moody’s Investors Service—a reportable segment of MCO; consists of five LOBs—SFG, CFG, FIG, PPIF and MISOther
MIS Other Consists of non-ratings revenue from ICRA, KIS Pricing and KIS Research. These businesses are components ofMIS; MIS Other is an LOB of MIS
Moody’s Moody’s Corporation and its subsidiaries; MCO; the Company
Net Income Net income attributable to Moody’s Corporation, which excludes net income from consolidated non-controlling interests belonging to the minority interest holder
New D&B The New D&B Corporation—which comprises the D&B business after September 30, 2000
MOODY’S 2017 10-K 7

TERM DEFINITION
NM Percentage change is not meaningful
Non-GAAP A financial measure not in accordance with GAAP; these measures, when read in conjunction with the Compa-ny’s reported results, can provide useful supplemental information for investors analyzing period-to-periodcomparisons of the Company’s performance, facilitate comparisons to competitors’ operating results and toprovide greater transparency to investors of supplemental information used by management in its financialand operational decision making
NRSRO Nationally Recognized Statistical Rating Organization
OCI Other comprehensive income (loss); includes gains and losses on cash flow and net investment hedges, unreal-ized gains and losses on available for sale securities, certain gains and losses relating to pension and otherretirement benefit obligations and foreign currency translation adjustments
Old D&B The former Dun and Bradstreet Company which distributed New D&B shares on September 30, 2000, and wasrenamed Moody’s Corporation
Other Retirement Plan The U.S. retirement healthcare and U.S. retirement life insurance plans
PPIF Public, project and infrastructure finance; an LOB of MIS
Profit Participation Plan Defined contribution profit participation plan that covers substantially all U.S. employees of the Company
PS Professional Services, an LOB within MA consisting of MAKS and FSTC that provides offshore research andanalytical services as well as financial training and certification programs
Purchase Price Hedge Foreign currency collar and forward contracts entered by the Company to economically hedge the Bureau vanDijk euro denominated purchase price
Purchase Price HedgeGain
Gain on foreign currency collars to economically hedge the Bureau van Dijk euro denominated purchase price
RD&A Research, Data and Analytics; an LOB within MA that produces, sells and distributes research, data and relatedcontent. Includes products generated by MIS, such as analyses on major debt issuers, industry studies, andcommentary on topical credit events. Also includes economic research, data, quantitative risk scores, andother analytical tools that are produced within MA and business intelligence and company information prod-ucts
Reform Act Credit Rating Agency Reform Act of 2006
REIT Real Estate Investment Trust
Relationship Revenue For MIS represents monitoring of a rated debt obligation and/or entities that issue such obligations, as well asrevenue from programs such as commercial paper, medium-term notes and shelf registrations. For MIS Otherrepresents subscription-based revenue. For MA, represents subscription-based license and maintenance rev-enue
Retirement Plans Moody’s funded and unfunded pension plans, the healthcare plans and life insurance plans
S&P S&P Global Ratings, a division of S&P Global Inc.
SAV Structured Analytics and Valuation; a business within the RD&A LOB which provides data and analytics forsecuritized assets
SCDM SCDM Financial, a leading provider of analytical tools for participants in securitization markets. Moody’sacquired SCDM’s structured finance data and analytics business in February 2017
SEC U.S. Securities and Exchange Commission
Securities Act Securities Act of 1933, as amended
Series 2007-1 Notes Principal amount of $300 million, 6.06% senior unsecured notes due in September 2017 pursuant to the 2007Agreement; prepaid in March 2017
8 MOODY’S 2017 10-K

TERM DEFINITION
Settlement Charge Charge of $863.8 million recorded in the fourth quarter of 2016 related to an agreement entered into onJanuary 13, 2017 with the U.S. Department of Justice and the attorneys general of 21 U.S. states and the Dis-trict of Columbia to resolve pending and potential civil claims related to credit ratings that MIS assigned tocertain structured finance instruments in the financial crisis era
SFG Structured finance group; an LOB of MIS
SG&A Selling, general and administrative expenses
Solvency II EU directive 2009/138/EC that codifies the amount of capital that EU insurance companies must hold toreduce insolvency
Stock Plans The Old D&B’s 1998 Key Employees’ Stock Incentive Plan and the Restated 2001 Moody’s Corporation KeyEmployees’ Stock Incentive Plan
Tax Act The “Tax Cuts and Jobs Act” enacted into U.S. law on December 22, 2017 which significantly amends the taxcode in the U.S.
Total Debt All indebtedness of the Company as reflected on the consolidated balance sheets
TPE Third party evidence, as defined in the ASC, used to determine selling price based on a vendor’s or any com-petitor’s largely interchangeable products or services in standalone sales transactions to similarly situatedcustomers
Transaction Revenue For MIS, represents the initial rating of a new debt issuance as well as other one-time fees. For MIS Other,represents revenue from professional services as well as data services, research and analytical engagements.For MA, represents software license fees and revenue from risk management advisory projects, training andcertification services, and research and analytical engagements
U.K. United Kingdom
U.S. United States
USD U.S. dollar
UTBs Unrecognized tax benefits
UTPs Uncertain tax positions
VSOE Vendor specific objective evidence; as defined in the ASC, evidence of selling price limited to either of the fol-lowing: the price charged for a deliverable when it is sold separately, or for a deliverable not yet being soldseparately, the price established by management having the relevant authority
WACC Weighted average cost of capital
1998 Plan Old D&B’s 1998 Key Employees’ Stock Incentive Plan
2001 Plan The Amended and Restated 2001 Moody’s Corporation Key Employees’ Stock Incentive Plan
2007 Agreement Note purchase agreement dated September 7, 2007, relating to the Series 2007-1 Notes
2010 Indenture Supplemental indenture and related agreements dated August 19, 2010, relating to the 2010 Senior Notes
2010 Senior Notes Principal amount of $500 million, 5.50% senior unsecured notes due in September 2020 pursuant to the 2010Indenture
2012 Facility Revolving credit facility of $1 billion entered into on April 18, 2012; was replaced with the 2015 Facility
2012 Indenture Supplemental indenture and related agreements dated August 18, 2012, relating to the 2012 Senior Notes
2012 Senior Notes Principal amount of $500 million, 4.50% senior unsecured notes due in September 2022 pursuant to the 2012Indenture
2013 Indenture Supplemental indenture and related agreements dated August 12, 2013, relating to the 2013 Senior Notes
MOODY’S 2017 10-K 9

TERM DEFINITION
2013 Senior Notes Principal amount of the $500 million, 4.875% senior unsecured notes due in February 2024 pursuant to the2013 Indenture
2014 Indenture Supplemental indenture and related agreements dated July 16, 2014, relating to the 2014 Senior Notes
2014 Senior Notes(5-Year)
Principal amount of $450 million, 2.75% senior unsecured notes due in July 2019
2014 Senior Notes(30-Year)
Principal amount of $600 million, 5.25% senior unsecured notes due in July 2044
2015 Facility Five-year unsecured revolving credit facility, with capacity to borrow up to $1 billion; replaces the 2012Facility
2015 Indenture Supplemental indenture and related agreements dated March 9, 2015, relating to the 2015 Senior Notes
2015 Senior Notes Principal amount €500 million, 1.75% senior unsecured notes issued March 9, 2015 and due in March 2027
2017 Bridge CreditFacility
Bridge Credit Agreement entered into in May 2017 pursuant to the definitive agreement to acquire Bureauvan Dijk; this facility was terminated in June 2017 upon issuance of the 2017 Private Placement Notes Due2023 and 2028
2017 Floating RateSenior Notes
Principal amount of $300 million, floating rate senior unsecured notes due in September 2018
2017 Indenture Collectively the Supplemental indenture and related agreements dated March 2, 2017, relating to the 2017Floating Rate Senior Notes and 2017 Senior Notes and the Supplemental indenture and related agreementsdated June 12, 2017, relating to the 2017 Private Placement Notes Due 2023 and 2028
2017 Private Place-ment Notes due 2023
Principal amount of $500 million, 2.625% senior unsecured notes due January 15, 2023
2017 Private Place-ment Notes Due 2028
Principal amount $500 million, 3.250% senior unsecured notes due January 15, 2028
2017 Senior Notes Principal amount of $500 million, 2.75% unsecured notes due December 2021
2017 Term Loan $500 million, three-year term loan facility entered into on June 6, 2017 for which the Company drew down$500 million on August 8, 2017 to fund the acquisition of Bureau van Dijk
7WTC The Company’s corporate headquarters located at 7 World Trade Center in New York, NY
10 MOODY’S 2017 10-K

PART I
ITEM 1. BUSINESS
BACKGROUND
As used in this report, except where the context indicates otherwise, the terms “Moody’s” or the “Company” refer to Moody’s Corpo-ration, a Delaware corporation, and its subsidiaries. The Company’s executive offices are located at 7 World Trade Center at 250Greenwich Street, New York, NY 10007 and its telephone number is (212) 553-0300.
THE COMPANY
Moody’s is a provider of (i) credit ratings; (ii) credit, capital markets and economic research, data and analytical tools; (iii) software sol-utions that support financial risk management activities; (iv) quantitatively derived credit scores; (v) financial services training andcertification services; (vi) offshore financial research and analytical services; and (vii) company information and business intelligenceproducts. Moody’s reports in two reportable segments: MIS and MA. Financial information and operating results of these segments,including revenue, expenses and operating income, are included in Part II, Item 8. Financial Statements of this annual report, and areherein incorporated by reference.
MIS publishes credit ratings on a wide range of debt obligations and the entities that issue such obligations in markets worldwide, includ-ing various corporate and governmental obligations, structured finance securities and commercial paper programs. Ratings revenue isderived from the originators and issuers of such transactions who use MIS ratings to support the distribution of their debt issues toinvestors. MIS provides ratings in more than 120 countries. Ratings are disseminated via press releases to the public through a variety ofprint and electronic media, including the Internet and real-time information systems widely used by securities traders and investors. Asof December 31, 2017, MIS had the following ratings relationships:
» Approximately 4,700 rated non-financial corporate issuers;
» Approximately 4,100 rated financial institutions issuers;
» Approximately 18,000 rated public finance issuers (including sovereign, sub-sovereign and supranational issuers);
» Approximately 11,000 rated structured finance transactions; and
» Approximately 1,000 rated infrastructure and project finance issuers.
Additionally, MIS earns revenue from certain non-ratings-related operations, which primarily consist of financial instruments pricingservices in the Asia-Pacific region as well as revenue from ICRA non-rating operations. The revenue from these operations is included inthe MIS Other LOB and is not material to the results of the MIS segment.
The MA segment develops a wide range of products and services that support financial analysis and risk management activities ofinstitutional participants in global financial markets. Within its Research, Data and Analytics business, MA distributes research and datadeveloped by MIS as part of its ratings process, including in-depth research on major debt issuers, industry studies, commentary ontopical credit related events. The RD&A LOB also provides economic research and credit data and analytical tools such as quantitativecredit risk scores as well as business intelligence and company information products. Within its Enterprise Risk Solutions business, MAprovides software solutions as well as related risk management services. Within its Professional Services business it provides offshoreresearch and analytical services along with financial training and certification programs. MA customers represent more than 10,500institutions worldwide operating in over 155 countries. During 2017 Moody’s research website was accessed by over 252,000individuals including 36,000 customer users.
PROSPECTS FOR GROWTH
Over recent decades, global fixed-income markets have grown significantly both in terms of the amount and types of securities or otherobligations outstanding. Beginning in mid-2007, there was a severe market disruption and associated financial crisis both in the devel-
MOODY’S 2017 10-K 11

oped and emerging markets resulting in a global decline in debt issuance activity for some significant asset classes and weak economicperformance in advanced economies. Since this financial crisis, many markets and economies have recovered and Moody’s believes theoverall long-term outlook remains favorable for continued growth of the global fixed-income market and related financial informationmarket, which includes information such as credit opinions, research, data, analytics, risk management tools and related services.
Moody’s growth is influenced by a number of trends that impact financial information markets including:
» Health of the world’s major economies;
» Debt capital markets activity;
» Disintermediation of credit markets;
» Fiscal and monetary policy of governments; and
» Business investment spending, including mergers and acquisitions.
In an environment of increasing financial complexity and heightened attention to credit analysis and risk management, Moody’s is wellpositioned to benefit from continued growth in global fixed-income market activity and a more widespread use of credit ratings,research and related analytical products. Moody’s expects that these developments will support continued long-term demand for highquality, independent credit opinions, research, data, analytics, risk management tools and related services.
Strong secular trends should continue to provide long-term growth opportunities. For MIS, key growth drivers include debt market issu-ance driven by global GDP growth, continued disintermediation of fixed-income markets in both developed and emerging economiesdriving issuance and demand for new ratings products and services. Growth in MA is likely to be driven by deeper and broader pene-tration of its customer base as regulatory compliance and other analytical requirements drive demand for MA’s products and expertise.Moreover, pricing opportunities aligned with customer value creation and advances in information technology present growth oppor-tunities for Moody’s.
Growth in global fixed income markets in a given year is dependent on many macroeconomic and capital market factors including inter-est rates, business investment spending, corporate refinancing needs, merger and acquisition activity, issuer profits, consumer borrowinglevels and securitization activity. Rating fees paid by debt issuers account for most of the revenue of MIS. Therefore, a substantial por-tion of MIS’s revenue is dependent upon the dollar-equivalent volume and number of ratable debt securities issued in the global capitalmarkets. MIS’s results can be affected by factors such as the performance and prospects for growth of the major world economies, thefiscal and monetary policies pursued by their governments, and the decisions of issuers to request MIS ratings to aid investors in theirinvestment decisions. However, annual fee arrangements with frequent debt issuers, annual debt monitoring fees and annual fees fromcommercial paper and medium-term note programs, bank deposit ratings, insurance company financial strength ratings, mutual fundratings, and other areas partially mitigate MIS’s dependence on the volume or number of new debt securities issued in the global fixed-income markets. Furthermore, the strong growth seen in the issuance of structured finance securities from the mid-1990’s reverseddramatically in 2008 due to market turmoil, with continued declines seen in 2009 and 2010, before stabilizing in 2011 with Moody’sexperiencing revenue growth in this market beginning in 2012. Despite significant declines from peak market issuance levels, Moody’sbelieves that structured finance securities will continue to play a role in global fixed-income markets and provide opportunities forlong-term revenue growth.
The pace of change in technology and communication over the past two decades makes information about investment alternativeswidely available throughout the world and facilitates issuers’ ability to place securities outside their national markets and similarlyinvestors’ ability to obtain information about securities issued outside their national markets. Technology also allows issuers andinvestors the ability to more readily obtain information about new financing techniques and new types of securities that they may wishto purchase or sell, which in the absence of the appropriate technology might not be readily or easily obtainable. This availability ofinformation promotes the ongoing integration and expansion of financial markets worldwide, giving issuers and investors access to awider range of both established and newer capital markets. As technology provides broader access to worldwide markets, it also resultsin a greater need for credible, globally comparable opinions about credit risk, data, analytics and related services. Additionally,information technology also provides opportunities to further build a global platform to support Moody’s continued expansion indeveloping markets.
An ongoing trend in the world’s capital markets is the disintermediation of financial systems. Issuers increasingly raise capital in theglobal public capital markets, in addition to, or in substitution for, traditional financial intermediaries. Moreover, financial intermediarieshave sold assets in the global public capital markets, in addition to, or instead of, retaining those assets. Moody’s believes that issueruse of global debt capital markets offer advantages in capacity and efficiency compared to traditional banking systems and that thetrend of increased disintermediation will continue. Further, disintermediation has continued because of the ongoing low interest rateenvironment and bank deleveraging, which has encouraged a number of corporations and other entities to seek alternative funding inthe bond markets.
12 MOODY’S 2017 10-K

Moody’s also observes disintermediation in key emerging markets where economic growth may outpace internal banking systemcapacity. Thus, disintermediation is expected to continue over the longer-term, with Moody’s targeting investment and resources tothose markets where disintermediation and bond issuance is expected to remain robust.
In the aftermath of the global financial crisis, banking, insurance and capital markets authorities promulgated a wide range of new regu-lations to restore stability and confidence in financial institutions under their oversight. Programs such as Basel III, Solvency II, andCCAR — among many others — prompted banks, insurers, securities dealers, and asset managers to invest in more robust riskmanagement practices and systems. Many of these investments drew on expertise and tools offered by MA, resulting in strong revenuegrowth in the post-crisis period. As banking and capital markets continue to stabilize, and with financial institutions better capitalized,regulatory-driven demand for MA products will moderate. Nonetheless, we expect that MA products and services that enable com-pliance with financial regulation will continue to be adopted by institutions worldwide, prompted by periodic revisions to regulatoryframeworks such as the Basel capital adequacy protocols. Moreover, having responded to regulatory imperatives, financial institutionsare increasingly seeking to leverage investments in regulatory compliance systems to gain business insights and front-office efficiencies;MA is well-positioned to realize revenue growth by assisting in these efforts to apply back-office analytics in support of front-line busi-ness decisions. Finally, in order to respond to other sources of demand and drive growth, MA is actively investing in new products,including enhanced data sets and improved delivery methods (e.g., software-as-a-service). These efforts will support broader dis-tribution of MA’s capabilities, deepen relationships with existing customers and facilitate more new customer acquisition.
Legislative bodies and regulators in the U.S., Europe and other jurisdictions continue to conduct regulatory reviews of CRAs, which mayresult in, for example, an increased number of competitors, changes to the business model or restrictions on certain business activitiesof MIS, removal of references to ratings in certain regulations, or increased costs of doing business for MIS. Therefore, in order tobroaden the potential for expansion of non-ratings services, Moody’s reorganized in January 2008 into two distinct businesses: MIS,consisting primarily of the ratings business, and MA, which conducts activities including the sale of credit research produced by MIS andthe production and sale of other economic and credit-related products and services. The reorganization broadened the opportunities forexpansion by MA into activities that may have otherwise been restricted for MIS, due to the potential for conflicts of interest with theratings business. At present, Moody’s is unable to assess the nature and effect that any regulatory changes may have on future growthopportunities.
Moody’s operations are subject to various risks, as more fully described in Part I, Item 1A “Risk Factors,” inherent in conducting businesson a global basis. Such risks include currency fluctuations and possible nationalization, expropriation, exchange and price controls,changes in the availability of data from public sector sources, limits on providing information across borders and other restrictive gov-ernmental actions.
COMPETITION
MIS competes with other CRAs and with investment banks and brokerage firms that offer credit opinions and research. Many users ofMIS’s ratings also have in-house credit research capabilities. MIS’s largest competitor in the global credit rating business is S&P GlobalRatings (S&P), a division of S&P Global. There are some rating markets, based on industry, geography and/or instrument type, in whichMoody’s has made investments and obtained market positions superior to S&P, while in other markets, the reverse is true.
In addition to S&P, MIS’s competitors include Fitch Ratings, Dominion Bond Rating Service (DBRS), A.M. Best Company, Japan CreditRating Agency Ltd., Kroll Bond Rating Agency Inc., Morningstar Inc. and Egan-Jones Ratings Company. In Europe, there are approx-imately 30 companies currently registered with ESMA, which include both purely domestic European CRAs and International CRAs suchas S&P, Fitch and DBRS. There are additional competitors in other regions and countries, for example, in China, where Moody’s partic-ipates through a joint venture. These competitors include China Lianhe Credit Rating Co Ltd., Shanghai Brilliance Credit Rating &Investors Service Co Ltd., Dagong Global Credit Rating Co Ltd. and Pengyuan Credit Rating Co Ltd.
MA competes broadly in the financial information industry against diversified competitors such as Thomson Reuters, Bloomberg, S&PGlobal Market Intelligence, Fitch Solutions, Dun & Bradstreet, IBM, Wolters Kluwer, Fidelity National Information Services, SAS, Fiserv,MSCI and IHS Markit among others. MA’s main competitors within RD&A include S&P Global Market Intelligence, CreditSights, Thom-son Reuters, Intex, IHS Markit, BlackRock Solutions, FactSet and other providers of fixed income analytics, valuations, economic dataand research. In ERS, MA faces competition from both large software providers such as IBM Algorithmics, Fidelity National InformationServices, SAS, Oracle, Misys, Oliver Wyman, Verisk Analytics and various other vendors and in-house solutions. Within ProfessionalServices, MA competes with a host of financial training and education firms such as Omega Performance and providers of offshoreresearch and analytical services such as Evalueserve and CRISIL Global Research & Analytics.
MOODY’S STRATEGY
Moody’s corporate strategy is to be the world’s most respected authority serving financial risk-sensitive markets. The key aspects toimplement this strategy are to:
» Defend and enhance the core ratings and research business of MIS;
MOODY’S 2017 10-K 13

» Build MA’s position as a leading provider of data, analytics and risk management solutions to financial institutions, corporations, andgovernmental authorities; and
» Invest in strategic growth opportunities.
Moody’s will make investments to defend and enhance its core businesses in an attempt to position the Company to fully capturemarket opportunities resulting from global debt capital market expansion and increased business investment spending. Moody’s willalso make strategic investments to achieve scale in attractive financial information markets, move into attractive product and serviceadjacencies where the Company can leverage its brand, extend its thought leadership and expand its geographic presence in highgrowth emerging markets.
To broaden the Company’s potential, MA provides a wide range of products and services to enable financial institutions, corporationsand governmental authorities to better manage risk. As such, MA adds to the Company’s value proposition in three ways. First, MA’ssubscription businesses provide a significant base of recurring revenue to offset cyclicality in ratings issuance volumes that may result involatility in MIS’s revenues. Second, MA products and services, such as financial training and professional services on research and riskmanagement best practices, provide opportunities for entry into emerging markets before banking systems and debt capital marketsfully develop and thus present long-term growth opportunities for the ratings business. Finally, MA’s integrated risk management soft-ware platform embeds Moody’s solutions deep into the technology infrastructure of banks and insurance companies worldwide.
Moody’s invests in initiatives to implement the Company’s strategy, including internally led organic development and targeted acquis-itions. Example initiatives include:
» Enhancements to ratings quality and product extensions;
» Investments that extend ownership and participation in joint ventures and strategic alliances;
» New products, services, content (e.g., non-credit risk assessments such as ESG and cybersecurity risk), and technology capabilities tomeet customer demands;
» Selective bolt-on acquisitions that accelerate the ability to scale and grow Moody’s businesses; and
» Expansion in emerging markets.
During 2017, Moody’s continued to invest in and acquire complementary businesses in MIS and MA. In February 2017, Moody’sacquired the structured finance data and analytics business of SCDM, a leading provider of analytical tools for participants in securitiza-tion markets in Europe. The acquisition further extended the geographic footprint of MA’s structured finance analytics business, whichincludes extensive loan- and pool-level data for securitized assets, as well as cash flow analytics, risk monitoring and credit modellingtools that cover all major asset classes worldwide. In June 2017, Moody’s invested in CompStak, a provider of commercial real estatelease information. Leveraging lease data provided by CompStak will help MA expand its product offering and develop new products andtechnologies that serve the needs of commercial real estate finance and risk professionals. In August 2017, Moody’s completed theacquisition of Bureau van Dijk, a global provider of business intelligence and company information, for €3.0 billion. The acquisition ofBureau van Dijk extended MA’s offerings of small and medium size enterprise and private company information, strengthening Moody’sposition as a leader in financial risk data and analytical insight. Also in August 2017, Moody’s invested in SecurityScorecard, a leadingprovider of cybersecurity ratings. SecurityScorecard’s innovative cyber risk ratings, data and analytics are used by information security,risk management, supply chain, and compliance practitioners to assess and monitor their security posture and secure their partner andvendor ecosystem. In November 2017, Moody’s invested in Rockport VAL, a provider of cloud-based commercial real estate valuationand cash flow modeling tools.
RegulationMIS and many of the securities that it rates are subject to extensive regulation in both the U.S. and in other countries (including bystate and local authorities). Thus, existing and proposed laws and regulations can impact the Company’s operations and the markets forsecurities that it rates. Additional laws and regulations have been adopted but not yet implemented or have been proposed or are beingconsidered. Each of the existing, adopted, proposed and potential laws and regulations can increase the costs and legal risk associatedwith the issuance of credit ratings and may negatively impact Moody’s operations or profitability, the Company’s ability to compete, orresult in changes in the demand for credit ratings, in the manner in which ratings are utilized and in the manner in which Moody’soperates.
The regulatory landscape has changed rapidly in recent years, and continues to evolve. In the EU, the CRA industry is registered andsupervised through a pan-European regulatory framework. The European Securities and Markets Authority has direct supervisoryresponsibility for the registered CRA industry throughout the EU. MIS is a registered entity and is subject to formal regulation and peri-odic inspection. Applicable rules include procedural requirements with respect to ratings of sovereign issuers, liability for intentional orgrossly negligent failure to abide by applicable regulations, mandatory rotation requirements of CRAs hired by issuers of securities for
14 MOODY’S 2017 10-K

ratings of resecuritizations, restrictions on CRAs or their shareholders if certain ownership thresholds are crossed, reporting require-ments to ESMA regarding fees, and additional procedural and substantive requirements on the pricing of services. In 2016, the Commis-sion published a report concluding that no new European legislation was needed for the industry at that time, but that it wouldcontinue to monitor the credit rating industry and analyze approaches that may strengthen existing regulation. In addition, from timeto time, ESMA publishes interpretive guidance or thematic reports regarding various aspects of the regulation. Over the past quarter,two such reports have been published. The first report provides further guidance from ESMA regarding the endorsement mechanismthat CRAs will need to employ for those ratings that are produced outside of the EU but are used inside the EU by EU-regulated enti-ties. The second report discusses ESMA’s observations on CRAs fee practices.
Separately, on June 23, 2016, the U.K. voted through a referendum to exit the EU. The UK officially launched the exit process by submit-ting its Article 50 letter to the EU, informing it of the UK’s intention to exit. The submission of this letter “starts the clock” on thenegotiation of the terms of exit which will take up to two years. The specifics regarding the “new relationship” or any transitionalarrangements (bridging the UK’s exit from its re-engagement with the EU) will only begin once the broad terms of exit have beenagreed upon by all parties.
The longer-term impacts of the decision to leave the EU on the overall regulatory framework for the U.K. will depend, in part, on therelationship that the U.K. negotiates with the EU in the future. In the interim, however, the U.K.’s markets regulator (the FinancialConduct Authority) has said that all EU financial regulations will stay in place and that firms must continue to abide by their existingobligations. As a consequence, at this point in time, there is no change to the regulatory framework under which MIS operates andESMA remains MIS’s regulator both in the EU and in the U.K.
In the U.S., CRAs are subject to extensive regulation primarily pursuant to the Reform Act and the Financial Reform Act. The SEC isrequired by these legislative acts to publish two annual reports to Congress on NRSROs. The Financial Reform Act requires the SEC toexamine each NRSRO once a year and issue an annual report summarizing the examination findings, among other requirements. Theannual report required by the Reform Act details the SEC’s views on the state of competition, transparency and conflicts of interestsamong NRSROs, among other requirements. The SEC voted in August 2014 to adopt its final rules for NRSROs as required by theFinancial Reform Act. The Company has made and continues to make substantial IT and other investments, and has implemented therelevant compliance obligations.
In light of the regulations that have gone into effect in both the EU and the U.S. (as well as many other countries), periodically and as amatter of course pursuant to their enabling legislation these regulatory authorities have and will continue to publish reports thatdescribe their oversight activities over the industry. In addition, other legislation and/or interpretation of existing regulation relating tocredit rating and research services is being considered by local, national and multinational bodies and this type of activity is likely tocontinue in the future. Finally, in certain countries, governments may provide financial or other support to locally-based rating agencies.For example, governments may from time to time establish official rating agencies or credit ratings criteria or procedures for evaluatinglocal issuers. If enacted, any such legislation and regulation could change the competitive landscape in which MIS operates. The legalstatus of rating agencies has been addressed by courts in various decisions and is likely to be considered and addressed in legal proceed-ings from time to time in the future. Management of the Company cannot predict whether these or any other proposals will beenacted, the outcome of any pending or possible future legal proceedings, or regulatory or legislative actions, or the ultimate impact ofany such matters on the competitive position, financial position or results of operations of Moody’s.
INTELLECTUAL PROPERTY
Moody’s and its affiliates own and control a variety of intellectual property, including but not limited to proprietary information, trade-marks, research, software tools and applications, models and methodologies, databases, domain names, and other proprietary materialsthat, in the aggregate, are of material importance to Moody’s business. Management of Moody’s believes that each of the trademarksand related corporate names, marks and logos containing the term “Moody’s” are of material importance to the Company.The Company, primarily through MA (including its Bureau van Dijk business), licenses certain of its databases, software applications,credit risk models, training courses in credit risk and capital markets, research and other publications and services that containintellectual property to its customers. These licenses are provided pursuant to standard fee-bearing agreements containing customaryrestrictions and intellectual property protections.
In addition, Moody’s licenses certain technology, data and other intellectual property rights owned and controlled by others. Specifi-cally, Moody’s licenses financial information (such as market and index data, financial statement data, third party research, defaultdata, and security identifiers) as well as software development tools and libraries. In addition, the Company’s Bureau van Dijk businessobtains from third party information providers certain financial, credit risk, compliance, management, ownership and other data oncompanies worldwide, which Bureau van Dijk distributes through its company information products. The Company obtains suchtechnology and intellectual property rights from generally available commercial sources. The Company also utilizes generally availableopen source software and libraries for internal use and also, subject to appropriately permissive open source licenses, to carry out rou-
MOODY’S 2017 10-K 15

tine functions in certain of the Company’s software products. Most of such technology and intellectual property is available from avariety of sources. Although certain financial information (particularly security identifiers, certain pricing or index data, and certaincompany financial data in selected geographic markets sourced by Bureau van Dijk) is available only from a limited number of sources,Moody’s does not believe it is dependent on any one data source for a material aspect of its business.
The Company considers its Intellectual Property to be proprietary, and Moody’s relies on a combination of copyright, trademark, tradesecret, patent, non-disclosure and other contractual safeguards for protection. Moody’s also pursues instances of third-party infringe-ment of its Intellectual Property in order to protect the Company’s rights. The Company owns two patents. None of the IntellectualProperty is subject to a specific expiration date, except to the extent that the patents and the copyright in items that the Companyauthors (such as credit reports, research, software, and other written opinions) expire pursuant to relevant law.
The names of Moody’s products and services referred to herein are trademarks, service marks or registered trademarks or service marksowned by or licensed to Moody’s or one or more of its subsidiaries.
EMPLOYEES
As of December 31, 2017 the number of full-time equivalent employees of Moody’s was approximately 12,000.
AVAILABLE INFORMATION
Moody’s investor relations Internet website is http://ir.moodys.com/. Under the “SEC Filings” tab at this website, the Company makesavailable free of charge its annual reports on Form 10-K, quarterly reports on Form 10-Q, current reports on Form 8-K and amendmentsto those reports as soon as reasonably practicable after they are filed with, or furnished to, the SEC.
The SEC maintains an internet site that contains annual, quarterly and current reports, proxy and other information statements that theCompany files electronically with the SEC. The SEC’s internet site is http://www.sec.gov/.
Executive Officers of the Registrant
Name, Age and Position Biographical Data
Mark E. Almeida, 58President, Moody’s Analytics
Mr. Almeida has served as President of Moody’s Analytics since January 2008. Prior to this position,Mr. Almeida was Senior Vice President of Moody’s Corporation from August 2007 to January 2008,Senior Managing Director of the Investor Services Group (ISG) at Moody’s Investors Service, Inc.from December 2004 to January 2008 and was Group Managing Director of ISG from June 2000 toDecember 2004. Mr. Almeida joined Moody’s Investors Service, Inc. in April 1988 and has held avariety of positions with the company in both the U.S. and overseas.
Richard Cantor, 60Chief Risk Officer
Mr. Cantor has served as Chief Risk Officer of Moody’s Corporation since December 2008 and asChief Credit Officer of Moody’s Investors Service, Inc. since November 2008. From July 2008 toNovember 2008, Mr. Cantor served as Acting Chief Credit Officer. Prior thereto, Mr. Cantor wasManaging Director of Moody’s Credit Policy Research Group from June 2001 to July 2008, after serv-ing as Senior Vice President in the Financial Guarantors Rating Group. Mr. Cantor joined Moody’s in1997 from the Federal Reserve Bank of New York, where he served as Assistant Vice President in theResearch Group and was Staff Director at the Discount Window. Prior to the Federal Reserve,Mr. Cantor taught Economics at UCLA and Ohio State and has taught on an adjunct basis at thebusiness schools of Columbia University and New York University.
Michael S. Crimmins, 47Senior Vice President andCorporate Controller
Mr. Crimmins has served as the Company’s Senior-Vice President—Corporate Controller sinceAugust 2016. Mr. Crimmins joined Moody’s in November 2004 as Assistant Controller. Prior to join-ing the Company, Mr. Crimmins worked at Deloitte where his last position held was a SeniorManager in their Assurance and Advisory Practice. He also served at PricewaterhouseCoopers as aconsultant.
16 MOODY’S 2017 10-K

Name, Age and Position Biographical Data
Robert Fauber, 47President, Moody’s InvestorsService
Mr. Fauber has served as President—Moody’s Investors Service since June 1, 2016. He served asSenior Vice President—Corporate & Commercial Development of Moody’s Corporation fromApril 2014 to May 31, 2016 and was Head of the MIS Commercial Group from January 2013 toMay 31, 2016. From April 2009 through April 2014, he served as Senior Vice President –CorporateDevelopment of Moody’s Corporation. Mr. Fauber served as Vice President-Corporate Developmentfrom September 2005 to April 2009. Prior to joining Moody’s, Mr. Fauber served in several roles atCitigroup and its investment banking subsidiary Salomon Smith Barney from 1999 to 2005. From1992-1996, Mr. Fauber worked at NationsBank (now Bank of America) in the middle market com-mercial banking group.
John J. Goggins, 57Executive Vice President andGeneral Counsel
Mr. Goggins has served as the Company’s Executive Vice President and General Counsel sinceApril 2011 and the Company’s Senior Vice President and General Counsel from October 2000 untilApril 2011. Mr. Goggins joined Moody’s Investors Service in February 1999 as Vice President andAssociate General Counsel.
Linda S. Huber, 59Executive Vice President andChief Financial Officer
Ms. Huber has served as the Company’s Executive Vice President and Chief Financial Officer sinceMay 2005. Prior to that, she served as Executive Vice President and Chief Financial Officer at U.S.Trust Company, a subsidiary of Charles Schwab & Company, Inc., from 2003 to 2005. Prior to U.S.Trust, she was Managing Director at Freeman & Co. from 1998 through 2002. She served PepsiCo asVice President of Corporate Strategy and Development from 1997 until 1998 and as Vice Presidentand Assistant Treasurer from 1994 until 1997. She served as Vice President in the Energy InvestmentBanking Group at Bankers Trust Company from 1991 until 1994 and as an Associate in the EnergyGroup at First Boston Corporation from 1986 through 1990. She also held the rank of Captain in theU.S. Army where she served from 1980 to 1984.
Melanie Hughes, 55Senior Vice President andChief Human Resources Officer
Ms. Hughes has served as Senior Vice President—Chief Human Resources Officer since September2017. Prior to joining the Company, Ms. Hughes was Chief Human Resource Officer & ExecutiveVice President Human Resources at American Eagle Outfitters from July 2016 to September 2017and served as Executive Vice President, Human Resources at Tribune Media from May 2013 to June2016. She has held several senior management roles for many different companies such as Coach,Gilt Group, DoubleClick and UBS Warburg.
Raymond W. McDaniel, Jr., 60President andChief Executive Officer
Mr. McDaniel has served as the President and Chief Executive Officer of the Company sinceApril 2012, and served as the Chairman and Chief Executive Officer from April 2005 until April 2012.He currently serves on the Executive Committee of the Board of Directors. Mr. McDaniel served asthe Company’s President from October 2004 until April 2005 and the Company’s Chief OperatingOfficer from January 2004 until April 2005. He has served as Chief Executive Officer of Moody’sInvestors Service since October 2007. He held the additional titles of President from November2001 to August 2007 and December 2008 to November 2010 and Chairman from October 2007until June 2015. Mr. McDaniel served as the Company’s Executive Vice President from April 2003 toJanuary 2004, and as Senior Vice President, Global Ratings and Research from November 2000 untilApril 2003. He served as Senior Managing Director, Global Ratings and Research of Moody’s Invest-ors Service from November 2000 until November 2001 and as Managing Director, Internationalfrom 1996 to November 2000. Mr. McDaniel currently is a Director of John Wiley & Sons, Inc. and isa member of the Board of Trustees of Muhlenberg College.
Blair L. Worrall, 61Senior Vice President,Ratings Delivery and Data
Mr. Worrall has served as Senior Vice President—Ratings Delivery and Data since February 2013 andHead of MIS Operations, Data & Controls since February 2016. He served as Head of MIS RatingsTransaction Services from January 2014 to February 2016. Mr. Worrall served as Senior Vice Presi-dent—Internal Audit from April 2011 to February 2013 and as Vice President—Internal Audit fromSeptember 2007 to April 2011. He served as the Controller for MIS from November 2004 until Sep-tember 2007. Prior to joining the Company, Mr. Worrall was Vice President, Accounting for RCNCorporation from 2002 to 2004 and held various finance positions at Dow Jones & Company, Inc.from 1979 to 2001.
MOODY’S 2017 10-K 17
ITEM 1A. RISK FACTORS
The following risk factors and other information included in this annual report on Form 10-K should be carefully considered. The risksand uncertainties described below are not the only ones the Company faces. Additional risks and uncertainties not presently known tothe Company or that the Company’s management currently deems minor or insignificant also may impair its business operations. If anyof the following risks occur, Moody’s business, financial condition, operating results and cash flows could be materially and adverselyaffected. These risk factors should be read in conjunction with the other information in this annual report on Form 10-K.
U.S. Laws and Regulations Affecting the Credit Rating Industry May Negatively Impact the Nature and Economics of the Company’sBusiness.Moody’s operates in a highly regulated industry and is subject to extensive regulation by federal, state and local authorities in the U.S.,including the Reform Act and the Financial Reform Act. These regulations are complex, continually evolving and have tended to becomemore stringent over time. See “Regulation” in Part 1, Item 1 of this annual report on Form 10-K for more information. These laws andregulations:
» seek to encourage, and may result in, increased competition among rating agencies and in the credit rating business;
» may result in alternatives to credit ratings or changes in the pricing of credit ratings;
» restrict the use of information in the development or maintenance of credit ratings;
» increase regulatory oversight of the credit markets and CRA operations;
» provide for direct jurisdiction of the SEC over CRAs that seek NRSRO status, and grant authority to the SEC to inspect the operationsof CRAs; and
» authorize the adoption of enhanced oversight standards and new pleading standards, which may result in increases in the number oflegal proceedings claiming liability for losses suffered by investors on rated securities and aggregate legal defense costs.
These laws and regulations, and any future rulemaking or court rulings, could result in reduced demand for credit ratings and increasedcosts, which Moody’s may be unable to pass through to customers. In addition, there may be uncertainty over the scope, interpretationand administration of such laws and regulations. The Company may be required to incur significant expenses in order to ensure com-pliance and mitigate the risk of fines, penalties or other sanctions. Legal proceedings could become increasingly lengthy and there maybe uncertainty over and exposure to liability. It is difficult to accurately assess the future impact of legislative and regulatory require-ments on Moody’s business and its customers’ businesses. For example, new laws and regulations may affect MIS’s communicationswith issuers as part of the rating assignment process, alter the manner in which MIS’s ratings are developed, assigned and communi-cated, affect the manner in which MIS or its customers or users of credit ratings operate, impact the demand for MIS’s ratings and alterthe economics of the credit ratings business, including by restricting or mandating business models for rating agencies. Further, spec-ulation concerning the impact of legislative and regulatory initiatives and the increased uncertainty over potential liability and adverselegal or judicial determinations may negatively affect Moody’s stock price. Although these legislative and regulatory initiatives apply torating agencies and credit markets generally, they may affect Moody’s in a disproportionate manner. Each of these developmentsincrease the costs and legal risk associated with the issuance of credit ratings and may have a material adverse effect on Moody’s oper-ations, profitability and competitiveness, the demand for credit ratings and the manner in which such ratings are utilized.
Financial Reforms Outside the U.S. Affecting the Credit Rating Industry May Negatively Impact the Nature and Economics of theCompany’s Business.In addition to the extensive and evolving U.S. laws and regulations governing the industry, foreign jurisdictions have taken measures toincrease regulation of rating agencies and the markets for ratings. In particular, the EU has adopted a common regulatory frameworkfor rating agencies operating in the EU. As a result, ESMA has direct supervisory authority for CRAs in the EU and has the power to takeenforcement action against non-compliant CRAs, including through the issuance of public notices, withdrawal of registration and, insome cases, the imposition of fines.
MIS is a registered entity and is therefore subject to formal regulation and periodic inspection in the EU. Applicable rules include proce-dural requirements with respect to ratings of sovereign issuers, liability for intentional or grossly negligent failure to abide by applicableregulations, mandatory rotation requirements of CRAs hired by issuers of securities for ratings of resecuritizations, and restrictions onCRAs or their shareholders if certain ownership thresholds are crossed. Additional procedural and substantive requirements includeconditions for the issuance of credit ratings, rules regarding the organization of CRAs, restrictions on activities deemed to create a con-flict of interest, including fees that are based on costs and are non-discriminatory, and special requirements for the rating of structuredfinance instruments. Compliance with the EU regulations may increase costs of operations and could have a significant negative effecton Moody’s operations, profitability or ability to compete, or the markets for its products and services, including in ways that Moody’spresently is unable to predict. In addition, exposure to increased liability under the EU regulations may further increase costs and legalrisks associated with the issuance of credit ratings and materially and adversely impact Moody’s results of operations.
18 MOODY’S 2017 10-K
The EU and other jurisdictions engage in rulemaking on an ongoing basis that could significantly impact operations or the markets forMoody’s products and services, including regulations extending to products and services not currently regulated and regulations affect-ing the need for debt securities to be rated, expansion of supervisory remit to include non-EU ratings used for regulatory purposes,increasing the level of competition in the market for credit ratings, establishing criteria for credit ratings or limiting the entitiesauthorized to provide credit ratings. Moody’s cannot predict the extent of such future laws and regulations, and the effect that they willhave on Moody’s business or the potential for increased exposure to liability could be significant. Financial reforms in the EU and otherforeign jurisdictions may have a material adverse effect on Moody’s business, operating results and financial condition.
The Company Faces Exposure to Litigation and Government Regulatory Proceedings, Investigations and Inquiries Related to RatingOpinions and Other Business Practices.Moody’s faces exposure to litigation and government and regulatory proceedings, investigations and inquiries related to MIS’s ratingsactions, as well as other business practices and products. If the market value of credit-dependent instruments declines or defaults,whether as a result of difficult economic times, turbulent markets or otherwise, the number of investigations and legal proceedings thatMoody’s faces could increase significantly. Parties who invest in securities rated by MIS may pursue claims against MIS or Moody’s forlosses they face in their portfolios. Moody’s has faced numerous class action lawsuits and other litigation, government investigationsand inquiries concerning events linked to the U.S. subprime residential mortgage sector and broader deterioration in the credit marketsduring the financial crisis of 2007-2008. Legal proceedings impose additional expenses on the Company and require the attention ofsenior management to an extent that may significantly reduce their ability to devote time addressing other business issues, and any ofthese proceedings, investigations or inquiries could ultimately result in adverse judgments, damages, fines, penalties or activityrestrictions. Risks relating to legal proceedings may be heightened in foreign jurisdictions that lack the legal protections or liabilitystandards comparable to those that exist in the U.S. In addition, new laws and regulations have been and may continue to be enactedthat establish lower liability standards, shift the burden of proof or relax pleading requirements, thereby increasing the risk of successfullitigations in the U.S. and in foreign jurisdictions. These litigation risks are often difficult to assess or quantify. Moody’s may not haveadequate insurance or reserves to cover these risks, and the existence and magnitude of these risks often remains unknown for sub-stantial periods of time. Furthermore, to the extent that Moody’s is unable to achieve dismissals at an early stage and litigation mattersproceed to trial, the aggregate legal defense costs incurred by Moody’s increase substantially, as does the risk of an adverse outcome.Additionally, as litigation or the process to resolve pending matters progresses, Moody’s may change its accounting estimates, whichcould require Moody’s to record liabilities in the consolidated financial statements in future periods. See Note 19 to the consolidatedfinancial statements for more information regarding ongoing investigations and civil litigation that the Company currently faces. Due tothe number of these proceedings and the significant amount of damages sought, there is a risk that Moody’s will be subject to judg-ments, settlements, fines, penalties or other adverse results that could have a material adverse effect on its business, operating resultsand financial condition.
The Company is Exposed to Legal, Economic, Operational and Regulatory Risks of Operating in Multiple Jurisdictions.Moody’s conducts operations in various countries outside the U.S. and derives a significant portion of its revenue from foreign sources.Changes in the economic condition of the various foreign economies in which the Company operates may have an impact on theCompany’s business. For example, economic uncertainty in the Eurozone or elsewhere could affect the number of securities offeringsundertaken within those particular areas. In addition, operations abroad expose Moody’s to a number of legal, economic and regulatoryrisks such as:
» exposure to exchange rate movements between foreign currencies and USD;
» restrictions on the ability to convert local currency into USD and the costs, including the tax impact, of repatriating cash held byentities outside the U.S.;
» U.S. laws affecting overseas operations including domestic and foreign export and import restrictions, tariffs and other trade barriers;
» differing and potentially conflicting legal or civil liability, compliance and regulatory standards, including as a result of the U.K.’sreferendum vote to withdraw from the EU, Brexit;
» current and future regulations relating to the imposition of mandatory rotation requirements on CRAs hired by issuers of securities;
» uncertain and evolving laws and regulations, including those applicable to the financial services industries, such as the EuropeanUnion’s implementation of the Markets in Financial Instruments Directive II, MiFID II, in January 2018, and to the protection ofintellectual property;
» economic, political and geopolitical market conditions;
» the possibility of nationalization, expropriation, price controls and other restrictive governmental actions;
MOODY’S 2017 10-K 19

» competition with local rating agencies that have greater familiarity, longer operating histories and/or support from localgovernments or other institutions;
» uncertainties of obtaining data and creating products and services relevant to particular geographic markets;
» reduced protection for intellectual property rights;
» longer payment cycles and possible problems in collecting receivables;
» differing accounting principles and standards;
» difficulties in staffing and managing foreign operations;
» difficulties and delays in translating documentation into foreign languages; and
» potentially adverse tax consequences.
Additionally, Moody’s is subject to complex U.S., foreign and other local laws and regulations that are applicable to its operationsabroad, such as the Foreign Corrupt Practices Act of 1977, the U.K. Bribery Act of 2010 and other anti-bribery and anti-corruption laws.Although the Company has implemented internal controls, policies and procedures and employee training and compliance programs todeter prohibited practices, such measures may not be effective in preventing employees, contractors or agents from violating orcircumventing such internal policies and violating applicable laws and regulations. Any determination that the Company has violatedanti-bribery or anti-corruption laws could have a material adverse effect on Moody’s business, operating results and financial condition.Compliance with international and U.S. laws and regulations that apply to the Company’s international operations increases the cost ofdoing business in foreign jurisdictions. Violations of such laws and regulations may result in severe fines and penalties, criminal sanc-tions, administrative remedies, restrictions on business conduct and could have a material adverse effect on Moody’s reputation, itsability to attract and retain employees, its business, operating results and financial condition.
Moody’s Operations and Infrastructure May Malfunction or Fail.Moody’s ability to conduct business may be materially and adversely impacted by a disruption in the infrastructure that supports itsbusinesses and the communities in which Moody’s is located, including New York City, the location of Moody’s headquarters, majorcities worldwide in which Moody’s has offices, and locations in China used for certain Moody’s back office work. This may include adisruption involving physical or technological infrastructure (whether or not controlled by the Company), including the Company’selectronic delivery systems, data center facilities, or the Internet, used by the Company or third parties with or through whom Moody’sconducts business. Many of the Company’s products and services are delivered electronically and the Company’s customers depend onthe Company’s ability to receive, store, process, transmit and otherwise rapidly handle very substantial quantities of data and trans-actions on computer-based networks. The Company’s customers also depend on the continued capacity, reliability and security of theCompany’s telecommunications, data centers, networks and other electronic delivery systems, including its websites and connectionsto the Internet. The Company’s employees also depend on these systems for internal use. Any significant failure, compromise, cyber-breach, interruption or a significant slowdown of operations of the Company’s infrastructure, whether due to human error, capacityconstraints, hardware failure or defect, natural disasters, fire, power loss, telecommunication failures, break-ins, sabotage, intentionalacts of vandalism, acts of terrorism, political unrest, war or otherwise, may impair the Company’s ability to deliver its products andservices.
Moody’s efforts to secure and plan for potential disruptions of its major operating systems may not be successful. The Company relieson third-party providers to provide certain essential services. While the Company believes that such providers are reliable, the Companyhas limited control over the performance of such providers. To the extent any of the Company’s third-party providers ceases to providethese services in an efficient, cost-effective manner or fails to adequately expand its services to meet the Company’s needs and theneeds of the Company’s customers, the Company could experience lower revenues and higher costs. Additionally, although the Com-pany maintains processes to prevent, detect and recover from a disruption, the Company also does not have fully redundant systemsfor most of its smaller office locations and low-risk systems, and its disaster recovery plan does not include restoration of non-essentialservices. If a disruption occurs in one of Moody’s locations or systems and its personnel in those locations or those who rely on suchsystems are unable to utilize other systems or communicate with or travel to other locations, such persons’ ability to service and inter-act with Moody’s customers may suffer. The Company cannot predict with certainty all of the adverse effects that could result fromthe Company’s failure, or the failure of a third party, to efficiently address and resolve these delays and interruptions. A disruption toMoody’s operations or infrastructure may have a material adverse effect on its reputation, business, operating results and financialcondition.
The Company is Exposed to Risks Related to Cybersecurity and Protection of Confidential Information.The Company’s operations rely on the secure processing, storage and transmission of confidential, sensitive, proprietary and other typesof information relating to its business operations and confidential and sensitive information about its customers and employees in the
20 MOODY’S 2017 10-K

Company’s computer systems and networks, and in those of its third party vendors. The cyber risks the Company faces range fromcyber-attacks common to most industries, to more advanced threats that target the Company because of its prominence in the globalmarketplace, or due to its ratings of sovereign debt. Breaches of Moody’s or Moody’s vendors’ technology and systems, whether fromcircumvention of security systems, denial-of-service attacks or other cyber-attacks, hacking, “phishing” attacks, computer viruses, ran-somware, or malware, employee or insider error, malfeasance, social engineering, physical breaches or other actions, may result inmanipulation or corruption of sensitive data, material interruptions or malfunctions in the Company’s or such vendors’ web sites, appli-cations, data processing, or disruption of other business operations, or may compromise the confidentiality and integrity of materialinformation held by the Company (including information about Moody’s business, employees or customers), as well as sensitivepersonally identifiable information (“PII”), the disclosure of which could lead to identity theft. Measures that Moody’s takes to avoid,detect, mitigate or recover from material incidents can be expensive, and may be insufficient, circumvented, or may become ineffective.To conduct its operations, the Company regularly moves data across national borders, and consequently is subject to a variety of con-tinuously evolving and developing laws and regulations in the United States and abroad regarding privacy, data protection and datasecurity. The scope of the laws that may be applicable to Moody’s is often uncertain and may be conflicting, particularly with respect toforeign laws. For example, the European Union’s General Data Protection Regulation (“GDPR”), which greatly increases the jurisdictionalreach of European Union law and adds a broad array of requirements for handling personal data, including the public disclosure of sig-nificant data breaches, becomes effective in May 2018. Additionally, other countries have enacted or are enacting data localizationlaws that require data to stay within their borders. All of these evolving compliance and operational requirements impose significantcosts that are likely to increase over time.
The Company has invested and continues to invest in risk management and information security measures in order to protect its sys-tems and data, including employee training, disaster plans, and technical defenses, in order to protect its systems and data. The costand operational consequences of implementing, maintaining and enhancing further data or system protection measures could increasesignificantly to overcome increasingly intense, complex, and sophisticated global cyber threats. Despite the Company’s best efforts, it isnot fully insulated from data breaches and system disruptions. Recent well-publicized security breaches at other companies have led toenhanced government and regulatory scrutiny of the measures taken by companies to protect against cyber-attacks, and may in thefuture result in heightened cybersecurity requirements, including additional regulatory expectations for oversight of vendors and serviceproviders. Any material breaches of cybersecurity or media reports of perceived security vulnerabilities to the Company’s systems orthose of the Company’s third parties, even if no breach has been attempted or occurred, could cause the Company to experiencereputational harm, loss of customers and revenue, regulatory actions and scrutiny, sanctions or other statutory penalties, litigation,liability for failure to safeguard the Company’s customers’ information, or financial losses that are either not insured against or not fullycovered through any insurance maintained by the Company. Any of the foregoing may have a material adverse effect on Moody’sbusiness, operating results and financial condition.
Changes in the Volume of Debt Securities Issued in Domestic and/or Global Capital Markets, Asset Levels and Flows into InvestmentLevels and Changes in Interest Rates and Other Volatility in the Financial Markets May Negatively Impact the Nature and Economicsof the Company’s Business.Moody’s business is impacted by general economic conditions and volatility in the U.S. and world financial markets. Furthermore,issuers of debt securities may elect to issue securities without ratings or securities which are rated or evaluated by non-traditional par-ties such as financial advisors, rather than traditional CRAs, such as MIS. A majority of Moody’s credit-rating-based revenue istransaction-based, and therefore it is especially dependent on the number and dollar volume of debt securities issued in the capitalmarkets. Market disruptions and economic slowdown and uncertainty have in the past negatively impacted the volume of debt secu-rities issued in global capital markets and the demand for credit ratings. The Tax Act, in addition to other changes to U.S. tax laws andpolicy, could negatively affect the volume of debt securities issued in the U.S. For example, the Tax Act will limit deductibility on inter-est payments and significantly reduce the tax cost associated with the repatriation of cash held outside the U.S., both of which couldnegatively affect the volume of debt securities issued. Conditions that reduce issuers’ ability or willingness to issue debt securities, suchas market volatility, declining growth, currency devaluations or other adverse economic trends, reduce the number and dollar-equivalent volume of debt issuances for which Moody’s provides ratings services and thereby adversely affect the fees Moody’s earns inits ratings business.
Economic and government factors such as a long-term continuation of difficult economic conditions or a re-emergence of the sover-eign debt crisis in Europe may have an adverse impact on the Company’s business. Future debt issuances also could be negativelyaffected by increases in interest rates, widening credit spreads, regulatory and political developments, growth in the use of alternativesources of credit, and defaults by significant issuers. Declines or other changes in the markets for debt securities may materially andadversely affect the Company’s business, operating results and financial condition.
Moody’s initiatives to reduce costs to counteract a decline in its business may not be sufficient and cost reductions may be difficult orimpossible to obtain in the short term, due in part to rent, technology, compliance and other fixed costs associated with some of theCompany’s operations as well as the need to monitor outstanding ratings. Further, cost-reduction initiatives, including those under-
MOODY’S 2017 10-K 21

taken to date, could make it difficult for the Company to rapidly expand operations in order to accommodate any unexpected increasein the demand for ratings. Volatility in the financial markets, including changes in the volumes of debt securities and changes in interestrates, may have a material adverse effect on the business, operating results and financial condition, which the Company may not beable to successfully offset with cost reductions.
The Company Faces Increased Pricing Pressure from Competitors and/or Customers.There is price competition in the credit rating, research, credit risk management markets, research and analytical services and financialtraining and certification services. Moody’s faces competition globally from other CRAs and from investment banks and brokerage firmsthat offer credit opinions in research, as well as from in-house research operations. Competition for customers and market share hasspurred more aggressive tactics by some competitors in areas such as pricing and services, as well as increased competition fromnon-NRSROs that evaluate debt risk for issuers or investors. At the same time, a challenging business environment and consolidationamong customers, particularly those involved in structured finance products, and other factors affecting demand may enhance themarket power of competitors and reduce the Company’s customer base. Weak economic growth intensifies competitive pricing pres-sures and can result in customers’ use of free or lower-cost information that is available from alternative sources. While Moody’s seeksto compete primarily on the basis of the quality of its products and services, it may lose market share if its pricing is not sufficientlycompetitive. In addition, the Reform Act was designed to encourage competition among rating agencies. The formation of additionalNRSROs may increase pricing and competitive pressures. Furthermore, in some of the countries in which Moody’s operates, govern-ments may provide financial or other support to local rating agencies. Any inability of Moody’s to compete successfully with respect tothe pricing of its products and services could have a material adverse impact on its business, operating results and financial condition.
The Company is Exposed to Reputation and Credibility Concerns.Moody’s reputation and the strength of its brand are key competitive strengths. To the extent that the rating agency business as awhole or Moody’s, relative to its competitors, suffers a loss in credibility, Moody’s business could be significantly impacted. Factors thatmay have already affected credibility and could potentially continue to have an impact in this regard include the appearance of a con-flict of interest, the performance of securities relative to the rating assigned to such securities, the timing and nature of changes in rat-ings, a major compliance failure, negative perceptions or publicity and increased criticism by users of ratings, regulators and legislativebodies, including as to the ratings process and its implementation with respect to one or more securities and intentional or uninten-tional misrepresentations of Moody’s products and services in advertising materials, public relations information, social media or otherexternal communications. Operational errors, whether by Moody’s or a Moody’s competitor, could also harm the reputation of theCompany or the credit rating industry. Damage to reputation and credibility could have a material adverse impact on Moody’s business,operating results and financial condition, as well as on the Company’s ability to find suitable candidates for acquisition.
The Introduction of Competing Products or Technologies by Other Companies May Negatively Impact the Nature and Economics ofthe Company’s Business.The markets for credit ratings, research, credit risk management services, research and analytical services and financial training and cer-tification services are highly competitive and characterized by rapid technological change, changes in customer demands, and evolvingregulatory requirements, industry standards and market preferences. The ability to develop and successfully launch and maintaininnovative products and technologies that anticipate customers’ changing requirements and utilize emerging technological trends is akey factor in maintaining market share. Moody’s competitors include both established companies with significant financial resources,brand recognition, market experience and technological expertise, and smaller companies which may be better poised to quickly adoptnew or emerging technologies or respond to customer requirements. Competitors may develop quantitative methodologies or relatedservices for assessing credit risk that customers and market participants may deem preferable, more cost-effective or more valuablethan the credit risk assessment methods currently employed by Moody’s, or may position, price or market their products in mannersthat differ from those utilized by Moody’s. Moody’s also competes indirectly against consulting firms and technology and informationproviders; these indirect competitors could in the future choose to compete directly with Moody’s, cease doing business with Moody’sor change the terms under which it does business with Moody’s in a way that could negatively impact our business. In addition,customers or others may develop alternative, proprietary systems for assessing credit risk. Such developments could affect demand forMoody’s products and services and its growth prospects. Further, the increased availability in recent years of free or relatively inex-pensive Internet information may reduce the demand for Moody’s products and services. For example, in December 2016, ESMAlaunched a database providing access to free, current information on certain credit ratings and rating outlooks. Moody’s growth pros-pects also could be adversely affected by Moody’s failure to make necessary or optimal capital infrastructure expenditures andimprovements and the inability of its information technologies to provide adequate capacity and capabilities to meet increaseddemands of producing quality ratings and research products at levels achieved by competitors. Any inability of Moody to competesuccessfully may have a material adverse effect on its business, operating results and financial condition.
Possible Loss of Key Employees and Related Compensation Cost Pressures May Negatively Impact the Company.Moody’s success depends upon its ability to recruit, retain and motivate highly skilled, experienced financial analysts and other pro-fessionals. Competition for skilled individuals in the financial services industry is intense, and Moody’s ability to attract high quality
22 MOODY’S 2017 10-K

employees could be impaired if it is unable to offer competitive compensation and other incentives or if the regulatory environmentmandates restrictions on or disclosures about individual employees that would not be necessary in competing industries. As greaterfocus has been placed on executive compensation at public companies, in the future, Moody’s may be required to alter its compensa-tion practices in ways that could adversely affect its ability to attract and retain talented employees. Investment banks, investors andcompetitors may seek to attract analyst talent by providing more favorable working conditions or offering significantly more attractivecompensation packages than Moody’s. Moody’s also may not be able to identify and hire the appropriate qualified employees in somemarkets outside the U.S. with the required experience or skills to perform sophisticated credit analysis. There is a risk that even if theCompany invests significant resources in attempting to attract, train and retain qualified personnel, it will not succeed in its efforts, andits business could be harmed.
Moody’s is highly dependent on the continued services of Raymond W. McDaniel, Jr., the President and Chief Executive Officer, andother senior officers and key employees. The loss of the services of skilled personnel for any reason and Moody’s inability to replacethem with suitable candidates quickly or at all, as well as any negative market perception resulting from such loss, could have amaterial adverse effect on Moody’s business, operating results and financial condition.
Moody’s Acquisitions, Dispositions and Other Strategic Transactions or Internal Technology Investments May Not ProduceAnticipated Results Exposing the Company to Future Significant Impairment Charges Relating to its Goodwill, Intangible Assets orProperty and Equipment.Moody’s has entered into and expects to continue to enter into acquisition, disposition or other strategic transactions and expects tomake various investments to strengthen its business and grow the Company. Such transactions as well as internal technology invest-ments present significant challenges and risks. The market for acquisition targets, dispositions and other strategic transactions is highlycompetitive, especially in light of industry consolidation, which may affect Moody’s ability to complete such transactions. If Moody’s isunsuccessful in completing such transactions or if opportunities for expansion do not arise, its business, operating results and financialcondition could be materially adversely affected. Additionally, we make significant investments in technology including software devel-oped for internal-use which is time-intensive and complex to implement. Such investments may not be successful or may not result inthe anticipated benefits resulting in asset write-offs.
In August 2017, Moody’s acquired Bureau van Dijk for $3,542.0 million. The anticipated growth, synergies and other strategic objectivesof the Bureau van Dijk acquisition, as well as other completed transactions, may not be fully realized, and a variety of factors mayadversely affect any anticipated benefits from such transactions. Any strategic transaction can involve a number of risks, includingunanticipated challenges regarding integration of operations, technologies and new employees; the existence of liabilities or con-tingencies not disclosed to or otherwise known by the Company prior to closing a transaction; unexpected regulatory and operatingdifficulties and expenditures; scrutiny from competition and antitrust authorities; failure to retain key personnel of the acquired busi-ness; future developments may impair the value of purchased goodwill or intangible assets; diverting management’s focus from otherbusiness operations; failing to implement or remediate controls, procedures and policies appropriate for a larger public company atacquired companies that prior to the acquisition lacked such controls, procedures and policies; challenges retaining the customers ofthe acquired business; and for foreign transactions, additional risks related to the integration of operations across different cultures andlanguages, and the economic, political, and regulatory risks associated with specific countries. The anticipated benefits from an acquis-ition or other strategic transaction may not be realized fully, or may take longer to realize than expected. As a result, the failure ofacquisitions, dispositions and other strategic transactions to perform as expected may have a material adverse effect on Moody’s busi-ness, operating results and financial condition.
At December 31, 2017, Moody’s had $3,753.2 million of goodwill and $1,631.6 million of intangible assets on its balance sheet, both ofwhich increased significantly due to the acquisition of Bureau van Dijk. Approximately 92% of the goodwill and intangible assets residein the MA business, including those related to Bureau van Dijk, and are allocated to the five reporting units within MA: RD&A; ERS;Financial Services Training and Certifications; Moody’s Analytics Knowledge Services; and Bureau van Dijk. The remaining 8% of good-will and intangible assets reside in MIS and primarily relate to ICRA. Failure to achieve business objectives and financial projections inany of these reporting units could result in a significant asset impairment charge, which would result in a non-cash charge to operatingexpenses. Goodwill and intangible assets are tested for impairment on an annual basis and also when events or changes in circum-stances indicate that impairment may have occurred. Determining whether an impairment of goodwill exists can be especially difficultin periods of market or economic uncertainty and turmoil, and requires significant management estimates and judgment. In addition,the potential for goodwill impairment is increased during periods of economic uncertainty. An asset impairment charge could have amaterial adverse effect on Moody’s business, operating results and financial condition.
The Company’s Compliance and Risk Management Programs May Not be Effective and May Result in Outcomes That CouldAdversely Affect the Company’s Reputation, Financial Condition and Operating Results.Moody’s operates in a number of countries, and as a result the Company is required to comply and quickly adapt with numerous inter-national and U.S. federal, state and local laws and regulations. The Company’s ability to comply with applicable laws and regulations,
MOODY’S 2017 10-K 23

including anti-corruption laws, is largely dependent on its establishment and maintenance of compliance, review and reporting systems,as well as its ability to attract and retain qualified compliance and risk management personnel. Moody’s policies and procedures toidentify, evaluate and manage the Company’s risks, including risks resulting from acquisitions, may not be fully effective, and Moody’semployees or agents may engage in misconduct, fraud or other errors. It is not always possible to deter such errors, and the precautionsthe Company takes to prevent and detect this activity may not be effective in all cases. If Moody’s employees violate its policies or ifthe Company’s risk management methods are not effective, the Company could be subject to criminal and civil liability, the suspensionof the Company’s employees, fines, penalties, regulatory sanctions, injunctive relief, exclusion from certain markets or other penalties,and may suffer harm to its reputation, financial condition and operating results.
Legal Protections for the Company’s Intellectual Property Rights may not be Sufficient or Available to Protect the Company’sCompetitive Advantages.Moody’s considers many aspects of its products and services to be proprietary. Failure to protect the Company’s intellectual propertyadequately could harm its reputation and affect the Company’s ability to compete effectively. Businesses the Company acquires alsoinvolve intellectual property portfolios, which increase the challenges the Company faces in protecting its strategic advantage. In addi-tion, the Company’s operating results may be adversely affected by inadequate or changing legal and technological protections forintellectual property and proprietary rights in some jurisdictions and markets. On January 6, 2015, a rule with direct relevance to theCRA industry was published in the Official Journal of the European Union regarding the types of information that CRAs are to provideabout certain ratings (those that were paid for by issuers) for publication on a central website administered by ESMA (the EuropeanRatings Platform). This rule directly relates to the Company’s intellectual property as it requires that the Company provide proprietaryinformation at no cost that the Company currently sells, which could result in lost revenue. ESMA launched the European Rating Plat-form for public use on December 1, 2016.
Unauthorized third parties may also try to obtain and use technology or other information that the Company regards as proprietary. Itis also possible that Moody’s competitors or other entities could obtain patents related to the types of products and services thatMoody’s offers, and attempt to require Moody’s to stop developing or marketing the products or services, to modify or redesign theproducts or services to avoid infringing, or to obtain licenses from the holders of the patents in order to continue developing and mar-keting the products and services. Even if Moody’s attempts to assert or protect its intellectual property rights through litigation, it mayrequire considerable cost, time and resources to do so, and there is no guarantee that the Company will be successful. These risks, andthe cost, time and resources needed to address them, may increase as the Company’s business grows and its profile rises in countrieswith intellectual property regimes that are less protective than the rules and regulations applied in the United States.
The Company is Dependent on the Use of Third-Party Software, Data, Hosted Solutions, Data Centers, Cloud and NetworkInfrastructure (Together, “Third Party Technology”), and Any Reduction in Third-Party Product Quality or Service Offerings, CouldHave a Material Adverse Effect on the Company’s Business, Financial Condition or Results of Operations.Moody’s relies on Third Party Technology in connection with its product development and offerings and operations. The Companydepends on the ability of Third Party Technology providers to deliver and support reliable products, enhance their current products,develop new products on a timely and cost-effective basis, and respond to emerging industry standards and other technologicalchanges. The Third Party Technology Moody’s uses may become obsolete, incompatible with future versions of the Company’s prod-ucts, unavailable or fail to operate effectively, and Moody’s business could be adversely affected if the Company is unable to timely oreffectively replace such Third Party Technology. The Company also monitors its use of Third Party Technology to comply with appli-cable license and other contractual requirements. Despite the Company’s efforts, the Company cannot ensure that such third partieswill permit Moody’s use in the future, resulting in increased Third Party Technology acquisition costs and loss of rights. In addition, theCompany’s operating costs could increase if license or other usage fees for Third Party Technology increase or the efforts to incorporateenhancements to Third Party Technology are substantial. Some of these third-party suppliers are also Moody’s competitors, increasingthe risks noted above. If any of these risks materialize, they could have a material adverse effect on the Company’s business, financialcondition or results of operations.
Changes in Tax Rates or Tax Rules Could Affect Future Results.As a global company, Moody’s is subject to taxation in the United States and various other countries and jurisdictions. As a result, oureffective tax rate is determined based on the pre-tax income and applicable tax rates in the various jurisdictions in which we operate.Moody’s future tax rates could be affected by changes in the composition of earnings in countries or states with differing tax rates orother factors, including by increased earnings in jurisdictions where Moody’s faces higher tax rates, losses incurred in jurisdictions forwhich Moody’s is not able to realize the related tax benefit, or changes in foreign currency exchange rates. Changes in the tax, account-ing and other laws, treaties, regulations, policies and administrative practices, or changes to their interpretation or enforcement, includ-ing changes applicable to multinational corporations such as the Base Erosion Profit Shifting project being conducted by theOrganization for Economic Co-operation and Development and the European Union’s state aid rulings, could have a material adverseeffect on the Company’s effective tax rate, results of operations and financial condition. The Tax Act made significant changes to theU.S. federal tax laws. Many aspects of the new legislation are currently uncertain or unclear and may not be clarified for some time. As
24 MOODY’S 2017 10-K

additional regulatory guidance is issued interpreting or clarifying the Tax Act or if the tax accounting rules are modified, there may beadjustments or changes to our estimate of the mandatory one-time deemed repatriation tax liability (“transition tax”) on previouslyuntaxed accumulated earnings of foreign subsidiaries recorded in 2017. Additional regulatory guidance may also affect our expectedfuture effective tax rates and tax assets and liabilities which could have a material adverse effect on Moody’s business, results of oper-ations, cash flows and financial condition. Furthermore, the Tax Act may impact the volume of debt securities issued as discussed in theRisk Factor, Changes in the Volume of Debt Securities Issued in Domestic and/or Global Capital Markets, Asset Levels and Flows intoInvestment Levels and Changes in Interest Rates and Other Volatility in the Financial Markets May Negatively Impact the Natureand Economics of the Company’s Business.
In addition, Moody’s is subject to regular examination of its income tax returns by the Internal Revenue Service and other tax author-ities, and the Company is experiencing increased scrutiny as its business grows. Moody’s regularly assesses the likelihood of favorable orunfavorable outcomes resulting from these examinations to determine the adequacy of its provision for income taxes, includingunrecognized tax benefits; however, developments in an audit or litigation could materially and adversely affect the Company.Although the Company believes its tax estimates and accruals are reasonable, there can be no assurance that any final determinationwill not be materially different than the treatment reflected in its historical income tax provisions, accruals and unrecognized tax bene-fits, which could materially and adversely affect the Company’s business, operating results, cash flows and financial condition.
ITEM 1B. UNRESOLVED STAFF COMMENTS
None.
ITEM 2. PROPERTIES
Moody’s corporate headquarters is located at 7 World Trade Center at 250 Greenwich Street, New York, New York 10007, with approx-imately 797,537 square feet of leased space. As of December 31, 2017, Moody’s operations were conducted from 17 U.S. offices and114 non-U.S. office locations, all of which are leased. These properties are geographically distributed to meet operating and salesrequirements worldwide. These properties are generally considered to be both suitable and adequate to meet current operatingrequirements.
ITEM 3. LEGAL PROCEEDINGS
For information regarding legal proceedings, see Part II, Item 8 –“Financial Statements”, Note 19 “Contingencies” in this Form 10-K.
ITEM 4. MINE SAFETY DISCLOSURES
Not applicable.
MOODY’S 2017 10-K 25

PART II
ITEM 5. MARKET FOR THE REGISTRANT’S COMMON EQUITY, RELATED SHAREHOLDERMATTERS AND ISSUER PURCHASES OF EQUITY SECURITIES
Information in response to this Item is set forth under the captions below.
MOODY’S PURCHASES OF EQUITY SECURITIES
For the three months ended December 31, 2017
PeriodTotal Number
of Shares Purchased (1)
Average PricePaid per Share
Total Number ofShares Purchased as
Part of PubliclyAnnounced Program
Approximate DollarValue of Shares That May
yet be Purchased Underthe Program (2)
October 1 – 31 69,062 $ 143.01 68,249 $ 553.4 million
November 1 – 30 78,562 $ 145.80 78,186 $ 542.0 million
December 1 – 31 101,898 $ 150.31 99,769 $ 527.0 million
Total 249,522 $ 146.84 246,204
(1) Includes surrender to the Company of 813, 376 and 2,129 shares of common stock in October, November and December, respectively, to satisfy taxwithholding obligations in connection with the vesting of restricted stock issued to employees.
(2) As of the last day of each of the months. On December 15, 2015, the Board authorized a $1 billion share repurchase program. There is no establishedexpiration date for the remaining authorization.
During the fourth quarter of 2017, Moody’s issued 0.1 million shares under employee stock-based compensation plans.
COMMON STOCK INFORMATION AND DIVIDENDS
The Company’s common stock trades on the New York Stock Exchange under the symbol “MCO”. The table below indicates the highand low sales price of the Company’s common stock and the dividends declared and paid for the periods shown. The number of regis-tered shareholders of record at January 31, 2018 was 2,020. A substantially greater number of the Company’s common stock is held bybeneficial holders whose shares are held of record by banks, brokers and other financial institutions.
Price Per Share Dividends Per Share
High Low Declared Paid
2017:
First quarter $ 114.03 $ 93.51 $ — $ 0.38
Second quarter $ 122.99 $ 110.82 0.38 0.38
Third quarter $ 139.94 $ 121.53 0.38 0.38
Fourth quarter $ 153.86 $ 139.33 0.38 0.38
Year ended December 31, 2017 $ 1.14 $ 1.52
2016:
First quarter $ 99.09 $ 77.76 $ — $ 0.37
Second quarter $ 101.70 $ 87.30 0.37 0.37
Third quarter $ 110.83 $ 90.98 0.37 0.37
Fourth quarter $ 110.00 $ 93.85 0.75 0.37
Year Ended December 31, 2016 $ 1.49 $ 1.48
26 MOODY’S 2017 10-K

EQUITY COMPENSATION PLAN INFORMATION
The table below sets forth, as of December 31, 2017, certain information regarding the Company’s equity compensation plans.
Number of Securities tobe Issued Upon Exercise
of Outstanding Options,Warrants and Rights
Weighted-AverageExercise Price of
Outstanding Options,Warrants and Rights (2)
Number of SecuritiesRemaining Available for
Future Issuance UnderEquity Compensation
Plans (excludingSecurities Reflected in
Column (a))
Plan Category (a) (b) (c)
Equity compensation plans approved by security holders 6,499,733(1) $ 57.48 20,026,669(3)
Equity compensation plans not approved by security holders — $ — —
Total 6,499,733 $ 49.68 20,026,669
(1) Includes 5,216,663 options and unvested restricted shares outstanding under the Company’s 2001 Key Employees’ Stock Incentive Plan, 12,100 optionsoutstanding under the Company’s 1998 Key Employees’ Stock Incentive Plan, and 12,761 unvested restricted shares outstanding under the 1998Non-Employee Directors’ Stock Incentive Plan. This number also includes a maximum of 1,258,209 performance shares outstanding under the Company’s2001 Key Employees’ Stock Incentive Plan, which is the maximum number of shares issuable pursuant to performance share awards assuming the maximumpayout at 225% of the target award for performance shares granted in 2015, 2016 and 2017. Assuming payout at target, the number of shares to be issuedupon the vesting of outstanding performance share awards is 559,204.
(2) Does not reflect unvested restricted shares or performance share awards included in column (a) because these awards have no exercise price.
(3) Includes 16,324,164 shares available for issuance as under the 2001 Stock Incentive Plan, of which all may be issued as options and 9,843,708 may be issuedas restricted stock, performance shares or other stock-based awards under the 2001 Stock Incentive Plan and 914,711 shares available for issuance as options,shares of restricted stock or performance shares under the 1998 Directors Plan, and 2,787,794 shares available for issuance under the Company’s EmployeeStock Purchase Plan. No new grants may be made under the 1998 Stock Incentive Plan, which expired by its terms in June 2008.
MOODY’S 2017 10-K 27
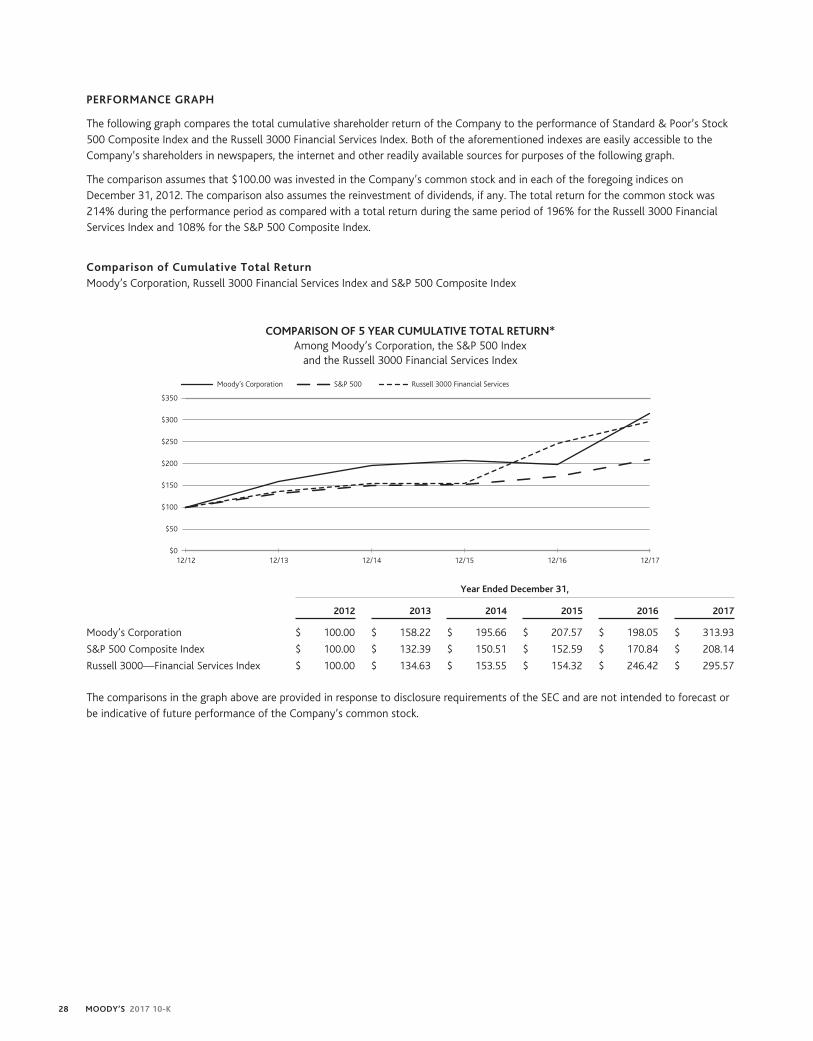
PERFORMANCE GRAPH
The following graph compares the total cumulative shareholder return of the Company to the performance of Standard & Poor’s Stock500 Composite Index and the Russell 3000 Financial Services Index. Both of the aforementioned indexes are easily accessible to theCompany’s shareholders in newspapers, the internet and other readily available sources for purposes of the following graph.
The comparison assumes that $100.00 was invested in the Company’s common stock and in each of the foregoing indices onDecember 31, 2012. The comparison also assumes the reinvestment of dividends, if any. The total return for the common stock was214% during the performance period as compared with a total return during the same period of 196% for the Russell 3000 FinancialServices Index and 108% for the S&P 500 Composite Index.
Comparison of Cumulative Total ReturnMoody’s Corporation, Russell 3000 Financial Services Index and S&P 500 Composite Index
COMPARISON OF 5 YEAR CUMULATIVE TOTAL RETURN*Among Moody’s Corporation, the S&P 500 Index
and the Russell 3000 Financial Services Index
12/12 12/13 12/14 12/15 12/1712/16$0
$50
$100
$150
$200
$250
$300
$350
Moody’s Corporation S&P 500 Russell 3000 Financial Services
Year Ended December 31,
2012 2013 2014 2015 2016 2017
Moody’s Corporation $ 100.00 $ 158.22 $ 195.66 $ 207.57 $ 198.05 $ 313.93
S&P 500 Composite Index $ 100.00 $ 132.39 $ 150.51 $ 152.59 $ 170.84 $ 208.14
Russell 3000—Financial Services Index $ 100.00 $ 134.63 $ 153.55 $ 154.32 $ 246.42 $ 295.57
The comparisons in the graph above are provided in response to disclosure requirements of the SEC and are not intended to forecast orbe indicative of future performance of the Company’s common stock.
28 MOODY’S 2017 10-K

ITEM 6. SELECTED FINANCIAL DATA
The Company’s selected consolidated financial data should be read in conjunction with Item 7. “MD&A” and the Moody’s Corporationconsolidated financial statements and notes thereto.
Year Ended December 31,
amounts in millions, except per share data 2017 2016 2015 2014 2013
Results of operations
Revenue $4,204.1 $ 3,604.2 $3,484.5 $3,334.3 $2,972.5
Expenses
Operating and SG&A expenses 2,214.2 1,963.0 1,897.6 1,799.6 1,644.5
Depreciation and amortization 158.3 126.7 113.5 95.6 93.4
Acquisition-Related Expenses 22.5 — — — —
Settlement Charge — 863.8 — — —
Restructuring — 12.0 — — —
Total Expenses 2,395.0 2,965.5 2,011.1 1,895.2 1,737.9
Operating income (1) 1,809.1 638.7 1,473.4 1,439.1 1,234.6
Non-operating (expense) income, net (4) (22.3) (80.7) (93.8) 21.9 (65.3)
Income before provision for income taxes (1) 1,786.8 558.0 1,379.6 1,461.0 1,169.3
Provision for income taxes (3) 779.1 282.2 430.0 455.0 353.4
Net income (1) 1,007.7 275.8 949.6 1,006.0 815.9
Less: Net income attributable to noncontrolling interests 7.1 9.2 8.3 17.3 11.4
Net income attributable to Moody’s (1)(5) $1,000.6 $ 266.6 $ 941.3 $ 988.7 $ 804.5
Earnings per share
Basic (1) $ 5.24 $ 1.38 $ 4.70 $ 4.69 $ 3.67
Diluted (1) $ 5.15 $ 1.36 $ 4.63 $ 4.61 $ 3.60
Weighted average shares outstanding
Basic 191.1 192.7 200.1 210.7 219.4
Diluted 194.2 195.4 203.4 214.7 223.5
Dividends declared per share $ 1.14 $ 1.49 $ 1.39 $ 1.18 $ 0.98
Operating margin (1) 43.0% 17.7% 42.3% 43.2% 41.5%
Operating Cash Flow (2) $ 747.5 $ 1,259.2 $1,198.1 $1,077.3 $ 965.6
December 31,
2017 2016 2015 2014 2013
Balance sheet data
Total assets $8,594.2 $ 5,327.3 $5,103.0 $4,653.8 $4,384.6
Long-term debt (6) $5,111.1 $ 3,063.0 $3,380.6 $2,532.1 $2,091.3
Total shareholders’ (deficit) equity $ (114.9) $(1,027.3) $ (333.0) $ 42.9 $ 347.9
(1) The significant change in 2016 and 2017 is primarily driven by the $863.8 million Settlement Charge ($700.7 million, net of tax, or $3.59 per diluted share) in2016.
(2) The decline in operating cash flow in 2017 is primarily due to payments made relating to the Settlement Charge. Additionally, in the first quarter of 2017, theCompany adopted ASU No. 2016-09 “Improvements to Employee Share-Based Payment Accounting”. As required by ASU 2016-09, Excess Tax Benefits orshortfalls relating to employee stock-based compensation are reflected in operating cash flow and the Company has applied this provision on a retrospectivebasis. Under previous accounting guidance, Excess Tax Benefits or shortfalls were shown as a reduction to operating cash flow and an increase to financingcash flow.
(3) Provision for income taxes in the year ended December 31, 2017 includes a net charge of $245.6 million related to the impact of U.S. tax reform and astatutory tax rate reduction in Belgium as more fully discussed in Note 15 to the consolidated financial statements in Item 8 of this Form 10-K.
(4) The 2017 amount includes a $111.1 million Purchase Price Hedge Gain as well as the $59.7 million CCXI Gain. The 2016 amount includes an approximate$35 million FX gain relating to the substantial liquidation of a subsidiary. The 2015, 2014 and 2013 amounts include benefits of $7.1 million, $7.1 million and$22.8 million, respectively, related to the favorable resolution of certain Legacy Tax Matters. The 2014 amount also includes the ICRA Gain of $102.8 million.
MOODY’S 2017 10-K 29

(5) The 2017 amount includes: i) a $245.6 million ($1.27 per share) net charge related to the impact of U.S. tax reform and a statutory tax rate reduction inBelgium; ii) a $72.3 million ($0.37 per share) Purchase Price Hedge Gain; and iii) the $59.7 million ($0.31 per share) CCXI Gain. The 2016 amount includes: i)a $700.7 million ($3.59 per share) Settlement Charge; ii) $8.1 million ($0.04 per share) restructuring charge; and iii) a $34.8 million ($0.18 per share) FX gainrelating to the substantial liquidation of a subsidiary. The 2015, 2014 and 2013 amounts include benefits of $6.4 million ($0.03 per share), $6.4 million($0.03 per share) and $21.3 million ($0.09 per share), respectively, related to the resolution of certain Legacy Tax Matters. Also, the 2014 amount includesthe ICRA Gain of $78.5 million ($0.37 per share) and the 2013 amount includes a litigation settlement charge of $0.14 per share.
(6) The 2017 amount excludes $429.4 million relating to the current portion of long-term debt and commercial paper. The 2016 amount excludes $300.0 millionof the Series 2007-1 Notes which were due in 2017.
30 MOODY’S 2017 10-K

ITEM 7. MANAGEMENT’S DISCUSSION AND ANALYSIS OF FINANCIAL CONDITION AND RESULTSOF OPERATIONS
This discussion and analysis of financial condition and results of operations should be read in conjunction with the Moody’s Corporationconsolidated financial statements and notes thereto included elsewhere in this annual report on Form 10-K.
This MD&A contains Forward-Looking Statements. See “Forward-Looking Statements” commencing on page 58 and Item 1A. “RiskFactors” commencing on page 18 for a discussion of uncertainties, risks and other factors associated with these statements.
THE COMPANY
Moody’s is a provider of (i) credit ratings; (ii) credit, capital markets and economic research, data and analytical tools; (iii) software sol-utions that support financial risk management activities; (iv) quantitatively derived credit scores; (v) financial services training andcertification services; (vi) offshore financial research and analytical services; and (vii) company information and business intelligenceproducts. Moody’s reports in two reportable segments: MIS and MA.
MIS, the credit rating agency, publishes credit ratings on a wide range of debt obligations and the entities that issue such obligations inmarkets worldwide. Revenue is primarily derived from the originators and issuers of such transactions who use MIS ratings in the dis-tribution of their debt issues to investors. Additionally, MIS earns revenue from certain non-ratings-related operations which consistprimarily of financial instruments pricing services in the Asia-Pacific region as well as revenue from ICRA’s non-ratings operations. Therevenue from these operations is included in the MIS Other LOB and is not material to the results of the MIS segment.
The MA segment develops a wide range of products and services that support financial analysis and risk management activities ofinstitutional participants in global financial markets. Within its RD&A business, MA distributes research and data developed by MIS aspart of its ratings process, including in-depth research on major debt issuers, industry studies and commentary on topical credit-relatedevents. The RD&A business also produces economic research and data and analytical tools such as quantitative credit risk scores as wellas business intelligence and company information products. Within its ERS business, MA provides software solutions as well as relatedrisk management services. The PS business provides offshore research and analytical services and financial training and certificationprograms.
CRITICAL ACCOUNTING ESTIMATES
Moody’s discussion and analysis of its financial condition and results of operations are based on the Company’s consolidated financialstatements, which have been prepared in accordance with GAAP. The preparation of these financial statements requires Moody’s tomake estimates and judgments that affect reported amounts of assets and liabilities and related disclosures of contingent assets andliabilities at the dates of the financial statements and revenue and expenses during the reporting periods. These estimates are based onhistorical experience and on other assumptions that are believed to be reasonable under the circumstances. On an ongoing basis,Moody’s evaluates its estimates, including those related to revenue recognition, accounts receivable allowances, contingencies, goodwilland intangible assets (including the estimated useful lives of amortizable intangible assets), pension and other retirement benefits andUTBs. Actual results may differ from these estimates under different assumptions or conditions. The following accounting estimates areconsidered critical because they are particularly dependent on management’s judgment about matters that are uncertain at the timethe accounting estimates are made and changes to those estimates could have a material impact on the Company’s consolidatedresults of operations or financial condition.
Revenue RecognitionRevenue is recognized when persuasive evidence of an arrangement exists, delivery has occurred or the services have been provided andaccepted by the customer when applicable, fees are determinable and the collection of resulting receivables is considered probable.
Pursuant to ASC Topic 605, when a sales arrangement contains multiple deliverables, the Company allocates revenue to each deliver-able based on its relative selling price which is determined based on its vendor specific objective evidence if available, third party evi-dence if VSOE is not available, or estimated selling price if neither VSOE nor TPE is available.
The Company’s products and services will generally qualify as separate units of accounting under ASC Topic 605. The Company eval-uates each deliverable in an arrangement to determine whether it represents a separate unit of accounting. A deliverable constitutes aseparate unit of accounting when it has stand-alone value to the customers and if the arrangement includes a customer refund orreturn right relative to the delivered item and the delivery and performance of the undelivered item is considered probable and sub-stantially in the Company’s control. In instances where the aforementioned criteria are not met, the deliverable is combined with theundelivered items and revenue recognition is determined as one single unit.
MOODY’S 2017 10-K 31

The Company determines whether its selling price in a multi-element transaction meets the VSOE criteria by using the price chargedfor a deliverable when sold separately or, if the deliverable is not yet being sold separately, the price established by management havingthe relevant authority to establish such a price. In instances where the Company is not able to establish VSOE for all deliverables in amultiple element arrangement, which may be due to the Company infrequently selling each element separately, not selling productswithin a reasonably narrow price range, or only having a limited sales history, the Company attempts to establish TPE for deliverables.The Company determines whether TPE exists by evaluating largely similar and interchangeable competitor products or services instandalone sales to similarly situated customers. However, due to the difficulty in obtaining third party pricing, possible differences inits market strategy from that of its peers and the potential that products and services offered by the Company may contain a sig-nificant level of differentiation and/or customization such that the comparable pricing of products with similar functionality cannot beobtained, the Company generally is unable to reliably determine TPE. Based on the selling price hierarchy established by ASC Topic 605,when the Company is unable to establish selling price using VSOE or TPE, the Company will establish an ESP. ESP is the price at whichthe Company would transact a sale if the product or service were sold on a stand-alone basis. The Company establishes its best esti-mate of ESP considering internal factors relevant to is pricing practices such as costs and margin objectives, standalone sales prices ofsimilar products, percentage of the fee charged for a primary product or service relative to a related product or service, and customersegment and geography. Additional consideration is also given to market conditions such as competitor pricing strategies and markettrend. The Company reviews its determination of VSOE, TPE and ESP on an annual basis or more frequently as needed.
In the MIS segment, revenue attributed to initial ratings of issued securities is recognized when the rating is delivered to the issuer.Revenue attributed to monitoring of issuers or issued securities is recognized ratably over the period in which the monitoring is per-formed, generally one year. In the case of commercial mortgage-backed securities, structured credit, international residential mortgage-backed and asset-backed securities, issuers can elect to pay the monitoring fees upfront. These fees are deferred and recognized overthe future monitoring periods based on the expected lives of the rated securities, which was approximately 24 years on a weightedaverage basis at December 31, 2017. At December 31, 2017, 2016 and 2015, deferred revenue related to these securities was approx-imately $140.1 million, $133.0 million, and $121.0 million.
Multiple element revenue arrangements in the MIS segment are generally comprised of an initial rating and the related monitoring serv-ice. In instances where monitoring fees are not charged for the first year monitoring effort, fees are allocated to the initial rating andmonitoring services based on the relative selling price of each service to the total arrangement fees. The Company generally uses ESP indetermining the selling price for its initial ratings as the Company rarely provides initial ratings separately without providing relatedmonitoring services and thus is unable to establish VSOE or TPE for initial ratings.
MIS estimates revenue for ratings of commercial paper for which, in addition to a fixed annual monitoring fee, issuers are billed quar-terly based on amounts outstanding. Revenue is accrued each quarter based on estimated amounts outstanding and is billed whenactual data is available. The estimate is determined based on the issuers’ most recent reported quarterly data. At December 31, 2017,2016 and 2015, accounts receivable included approximately $27.0 million, $25.0 million, and $24.0 million, respectively, related toaccrued commercial paper revenue. Historically, MIS has not had material differences between the estimated revenue and the actualbillings. Furthermore, for certain annual monitoring services, fees are not invoiced until the end of the annual monitoring period andrevenue is accrued ratably over the monitoring period. At December 31, 2017, 2016 and 2015, accounts receivable included approx-imately $185.0 million, $159.1 million, and $146.4 million, respectively, relating to accrued annual monitoring service revenue.
In the MA segment, products and services offered by the Company include software licenses and related maintenance, subscriptions,and professional services. Revenue from subscription based products, such as research and data subscriptions and certain software-based credit risk management subscription products, is recognized ratably over the related subscription period, which is principally oneyear. Revenue from sale of perpetual licenses of credit processing software is generally recognized at the time the product master orfirst copy is delivered or transferred to and accepted by the customer. If uncertainty exists regarding customer acceptance of the prod-uct or service, revenue is not recognized until acceptance occurs. Software maintenance revenue is recognized ratably over the annualmaintenance period. Revenue from professional services rendered is generally recognized as the services are performed. A large portionof annual research and data subscriptions and annual software maintenance are invoiced in the months of November, December andJanuary.
Products and services offered within the MA segment are sold either stand-alone or together in various combinations. In instanceswhere a multiple element arrangement includes software and non-software deliverables, revenue is allocated to the non-softwaredeliverables and to the software deliverables, as a group, using the relative selling prices of each of the deliverables in the arrangementbased on the aforementioned selling price hierarchy. Revenue is recognized for each element based upon the conditions for revenuerecognition noted above.
If the arrangement contains more than one software deliverable, the arrangement consideration allocated to the software deliverablesas a group is allocated to each software deliverable using VSOE. In the instances where the Company is not able to determine VSOE forall of the deliverables of an arrangement, the Company allocates the revenue to the undelivered elements equal to its VSOE and the
32 MOODY’S 2017 10-K

residual revenue to the delivered elements. If the Company is unable to determine VSOE for an undelivered element, the Companydefers all revenue allocated to the software deliverables until the Company has delivered all of the elements or when VSOE has beendetermined for the undelivered elements. In cases where software implementation services are considered essential and VSOE of fairvalue exists for post-contract customer support (“PCS”), once the delivery criteria has been met on the standard software, license andservice revenue is recognized on a percentage-of-completion basis as implementation services are performed, while PCS is recognizedover the coverage period. If VSOE of fair value does not exist for PCS, once the delivery criteria has been met on the standard software,service revenue is recognized on a zero profit margin basis until essential services are complete, at which point total remainingarrangement revenue is then spread ratably over the remaining PCS coverage period. If VSOE does not exist for PCS at the beginning ofan arrangement but is established during implementation, revenue not recognized due to the absence of VSOE will be recognized on acumulative basis.
Accounts Receivable AllowanceMoody’s records an allowance for estimated future adjustments to customer billings as a reduction of revenue, based on historicalexperience and current conditions. Such amounts are reflected as additions to the accounts receivable allowance. Additionally, esti-mates of uncollectible accounts are recorded as bad debt expense and are reflected as additions to the accounts receivable allowance.Actual billing adjustments and uncollectible account write-offs are charged against the allowance. Moody’s evaluates its accountsreceivable allowance by reviewing and assessing historical collection and invoice adjustment experience as well as the current agingstatus of customer accounts. Moody’s also considers the economic environment of the customers, both from an industry and geo-graphic perspective, in evaluating the need for allowances. Based on its analysis, Moody’s adjusts its allowance as considered appro-priate in the circumstances. This process involves a high degree of judgment and estimation and could involve significant dollaramounts. Accordingly, Moody’s results of operations can be affected by adjustments to the allowance. Management believes that theallowance for uncollectible accounts receivable is adequate to cover anticipated adjustments and write-offs under current conditions.However, significant changes in any of the above factors, or actual write-offs or adjustments that differ from the estimated amountscould impact the Company’s consolidated results of operations.
ContingenciesAccounting for contingencies, including those matters described in Note 19 to the consolidated financial statements, is highly sub-jective and requires the use of judgments and estimates in assessing their magnitude and likely outcome. In many cases, the outcomesof such matters will be determined by third parties, including governmental or judicial bodies. The provisions made in the consolidatedfinancial statements, as well as the related disclosures, represent management’s best estimates of the current status of such mattersand their potential outcome based on a review of the facts and in consultation with outside legal counsel where deemed appropriate.The Company regularly reviews contingencies and as new information becomes available may, in the future, adjust its associatedliabilities.
For claims, litigation and proceedings and governmental investigations and inquiries not related to income taxes, where it is both prob-able that a liability has been incurred and the amount of loss can be reasonably estimated, the Company records liabilities in the con-solidated financial statements and periodically adjusts these as appropriate. When the reasonable estimate of the loss is within a rangeof amounts, the minimum amount of the range is accrued unless some higher amount within the range is a better estimate thananother amount within the range. In other instances, where a loss is reasonably possible, management does not record a liabilitybecause of uncertainties related to the probable outcome and/or the amount or range of loss, but discloses the contingency if material.As additional information becomes available, the Company adjusts its assessments and estimates of such matters accordingly. In viewof the inherent difficulty of predicting the outcome of litigation, regulatory, governmental investigations and inquiries, enforcement andsimilar matters and contingencies, particularly where the claimants seek large or indeterminate damages or where the parties assertnovel legal theories or the matters involve a large number of parties, the Company cannot predict what the eventual outcome of thepending matters will be or the timing of any resolution of such matters. The Company also cannot predict the impact (if any) that anysuch matters may have on how its business is conducted, on its competitive position or on its financial position, results of operations orcash flows. As the process to resolve any pending matters progresses, management will continue to review the latest information avail-able and assess its ability to predict the outcome of such matters and the effects, if any, on its operations and financial con-dition. However, in light of the large or indeterminate damages sought in some of them, the absence of similar court rulings on thetheories of law asserted and uncertainties regarding apportionment of any potential damages, an estimate of the range of possiblelosses cannot be made at this time.
The Company’s wholly-owned insurance subsidiary insures the Company against certain risks including but not limited to deductiblesfor worker’s compensation, employment practices litigation, employee medical claims and terrorism, for which the claims are notmaterial to the Company. In addition, for claim years 2008 and 2009, the insurance subsidiary insured the Company for defense costs
MOODY’S 2017 10-K 33

related to professional liability claims. For matters insured by the Company’s insurance subsidiary, Moody’s records liabilities based onthe estimated total claims expected to be paid and total projected costs to defend a claim through its anticipated conclusion. TheCompany determines liabilities based on an assessment of management’s best estimate of claims to be paid and legal defense costs aswell as actuarially determined estimates. Defense costs for matters not self-insured by the Company’s wholly-owned insurance sub-sidiary are expensed as services are provided.
For income tax matters, the Company employs the prescribed methodology of Topic 740 of the ASC which requires a company to firstdetermine whether it is more-likely-than-not (defined as a likelihood of more than fifty percent) that a tax position will be sustainedbased on its technical merits as of the reporting date, assuming that taxing authorities will examine the position and have full knowl-edge of all relevant information. A tax position that meets this more-likely-than-not threshold is then measured and recognized at thelargest amount of benefit that is greater than fifty percent likely to be realized upon effective settlement with a taxing authority.
Goodwill and Other Acquired Intangible AssetsAs of July 31 of each year, Moody’s evaluates its goodwill for impairment at the reporting unit level, defined as an operating segment orone level below an operating segment.
The Company has seven primary reporting units: two within the Company’s ratings business (one for the ICRA business and one thatencompasses all of Moody’s other ratings operations) and five reporting units within MA: RD&A, ERS, FSTC, MAKS and Bureau van Dijk.The RD&A reporting unit encompasses the distribution of investor-oriented research and data developed by MIS as part of its ratingsprocess, in-depth research on major debt issuers, industry studies, economic research and commentary on topical events and creditanalytic tools. The ERS reporting unit provides products and services that support the credit risk management and regulatory com-pliance activities of financial institutions and also provides advanced actuarial software for the life insurance industry. These productsand services are primarily delivered via software that is licensed on a perpetual basis or sold on a subscription basis. The FSTC reportingunit consists of the portion of the MA business that offers both credit training as well as other professional development training andimplementation services. The MAKS reporting unit provides offshore research and analytical services. The Bureau van Dijk reporting unitconsists of the newly acquired Bureau van Dijk business, which was acquired on August 10, 2017, and primarily provides businessintelligence and company information products.
The Company evaluates the recoverability of goodwill using a two-step impairment test approach at the reporting unit level. In the firststep, the Company assesses various qualitative factors to determine whether the fair value of a reporting unit may be less than itscarrying amount. If a determination is made based on the qualitative factors that an impairment does not exist, the Company is notrequired to perform further testing. If the aforementioned qualitative assessment results in the Company concluding that it is morelikely than not that the fair value of a reporting unit may be less than its carrying amount, the fair value of the reporting unit will bedetermined and compared to its carrying value including goodwill. If the fair value of the reporting unit exceeds the carrying value ofthe net assets assigned to that unit, goodwill is not impaired and the Company is not required to perform further testing. If the fairvalue of the reporting unit is less than the carrying value, the Company will record a goodwill impairment charge for the amount bywhich the carrying value exceeds the reporting unit’s fair value. The Company evaluates its reporting units on an annual basis, or morefrequently if there are changes in the reporting structure of the Company due to acquisitions or realignments. For the reporting unitswhere the Company is consistently able to conclude that no impairment exists using only a qualitative approach, the Company’saccounting policy is to perform the second step of the aforementioned goodwill impairment assessment at least once every three years.At July 31, 2017, the Company performed a qualitative assessment on all reporting units except for MAKS, which resulted in noindicators of impairment of goodwill.
In January 2017 there was a management change in the MAKS business. A quantitative impairment assessment for the MAKS reportingunit was performed as of July 31, 2017 to reflect the completion of a new strategic plan for this reporting unit under new management(the Company’s annual strategic plan is completed in the third quarter of each year). This quantitative assessment resulted in noimpairment of goodwill for the MAKS reporting unit at July 31, 2017.
Determining the fair value of a reporting unit or an indefinite-lived acquired intangible asset involves the use of significant estimatesand assumptions. These estimates and assumptions include revenue growth rates and operating margins used to calculate projectedfuture cash flows, risk-adjusted discount rates, future economic and market conditions, and appropriate comparable market metrics.However, as these estimates and assumptions are unpredictable and inherently uncertain, actual future results may differ from theseestimates. In addition, the Company also makes certain judgments and assumptions in allocating shared assets and liabilities todetermine the carrying values for each of its reporting units.
Other assets and liabilities, including applicable corporate assets, are allocated to the extent they are related to the operation ofrespective reporting units.
34 MOODY’S 2017 10-K

Sensitivity Analyses and Key Assumptions for Deriving the Fair Value of a Reporting UnitThe following table identifies the amount of goodwill allocated to each reporting unit as of December 31, 2017 as well as the amountby which the net assets of each reporting unit would exceed the fair value under Step 2 of the goodwill impairment test as prescribed inASC Topic 350, assuming hypothetical reductions in their fair values as of the date of the last quantitative goodwill impairmentassessment for each reporting unit.
Sensitivity Analysis
Deficit Caused by a Hypothetical Reduction to Fair Value
Goodwill 10% 20% 30% 40%
MIS $ 50.1 $ — $ — $ — $ —
RD&A 187.3 — — — —
ERS 340.8 — — — —
FSTC 90.8 — — (14.4) (34.6)
MAKS 160.9 — — (2.9) (35.6)
ICRA 238.5 — — — —
Bureau van Dijk* 2,684.8 N/A N/A N/A N/A
Totals $ 3,753.2 $ — $ — $ (17.3) $ (70.2)
* Bureau van Dijk was acquired subsequent to the Company’s annual goodwill impairment assessment as of July 31, 2017. Due to the close proximity of theBureau van Dijk acquisition to December 31, 2017, the purchase price approximates the fair value of the reporting unit. Additionally, the Company has notcompleted its allocation of certain of the goodwill acquired to other MA reporting units that are anticipated to benefit from synergies resulting from theBureau van Dijk acquisition.
Methodologies and significant estimates utilized in determining of the fair value of reporting units:The following is a discussion regarding the Company’s methodology for determining the fair value of its reporting units, excluding ICRA,as of the date of each reporting unit’s last quantitative assessment (July 31, 2017 for MAKS; July 31, 2016 for the remaining reportingunits). As ICRA is a publicly traded company in India, the Company was able to observe its fair value based on its market capitalization.
The fair value of each reporting unit, excluding ICRA, was estimated using a discounted cash flow methodology and comparable publiccompany and precedent transaction multiples. The DCF analysis requires significant estimates, including projections of future operatingresults and cash flows of each reporting unit that is based on internal budgets and strategic plans, expected long-term growth rates,terminal values, weighted average cost of capital and the effects of external factors and market conditions. Changes in these estimatesand assumptions could materially affect the estimated fair value of each reporting unit which could result in an impairment charge toreduce the carrying value of goodwill, which could be material to the Company’s financial position and results of operations. Moody’sallocates newly acquired goodwill to reporting units based on the reporting unit expected to benefit from the acquisition.
The sensitivity analyses on the future cash flows and WACC assumptions described below are as of the date of the last quantitativegoodwill impairment assessment for each reporting unit. The following discusses the key assumptions utilized in the discounted cashflow valuation methodology that requires significant management judgment:
» Future cash flow assumptions—The projections for future cash flows utilized in the models are derived from historical experience andassumptions regarding future growth and profitability of each reporting unit. These projections are consistent with the Company’soperating and strategic plan. Cash flows for the five years subsequent to the date of the quantitative goodwill impairment analysiswere utilized in the determination of the fair value of each reporting unit. The growth rates assumed a gradual increase in revenuebased on a continued improvement in the global economy and capital markets, new customer acquisition and new products. Beyondfive years, a terminal value was determined using a perpetuity growth rate based on expected inflation and real GDP growth rates. Asensitivity analysis of the revenue growth rates was performed on all reporting units. For all reporting units, a 10% decrease in therevenue growth rates used would not have resulted in the carrying value of the reporting unit exceeding its respective estimated fairvalue.
» WACC—The WACC is the rate used to discount each reporting unit’s estimated future cash flows. The WACC is calculated based onthe proportionate weighting of the cost of debt and equity. The cost of equity is based on a risk-free interest rate, an equity riskfactor which is derived from public companies similar to the reporting unit and which captures the perceived risks and uncertaintiesassociated with the reporting unit’s cash flows. The cost of debt component is calculated as the weighted average cost associatedwith all of the Company’s outstanding borrowings as of the date of the impairment test and was immaterial to the computation ofthe WACC. The cost of debt and equity is weighted based on the debt to market capitalization ratio of publicly traded companieswith similarities to the reporting unit being tested. The WACC for all reporting units ranged from 8.5% to 10.5%. Differences in theWACC used between reporting units is primarily due to distinct risks and uncertainties regarding the cash flows of the differentreporting units. A sensitivity analysis of the WACC was performed on all reporting units whereby an increase in the WACC of onepercentage point would not result in the carrying value of the reporting unit exceeding its fair value.
MOODY’S 2017 10-K 35

Amortizable intangible assets are reviewed for recoverability whenever events or changes in circumstances indicate that the carryingamount may not be recoverable. There were no such events or changes during 2017 that would indicate that the carrying amount ofamortizable intangible assets in any of the Company’s reporting units may not be recoverable. This determination was made based oncontinued growth, consistent with operating and strategic plans for the reporting unit where the intangible asset resides.
Pension and Other Retirement BenefitsThe expenses, assets and liabilities that Moody’s reports for its Retirement Plans are dependent on many assumptions concerning theoutcome of future events and circumstances. These significant assumptions include the following:
» future compensation increases are based on the Company’s long-term actual experience and future outlook;
» long-term expected return on pension plan assets is based on historical portfolio results and the expected future average annual returnfor each major asset class within the plan’s portfolio (which is principally comprised of equity and fixed-income investments); and
» discount rates are based on current yields on high-grade corporate long-term bonds.
The discount rates used to measure the present value of the Company’s benefit obligation for its Retirement Plans as of December 31,2017 were derived using a cash flow matching method whereby the Company compares each plan’s projected payment obligations byyear with the corresponding yield on the Citibank pension discount curve. The cash flows by plan are then discounted back to presentvalue to determine the discount rate applicable to each plan.
Moody’s major assumptions vary by plan and assumptions used are set forth in Note 13 to the consolidated financial statements. Indetermining these assumptions, the Company consults with third-party actuaries and other advisors as deemed appropriate. While theCompany believes that the assumptions used in its calculations are reasonable, differences in actual experience or changes in assump-tions could have a significant effect on the expenses, assets and liabilities related to the Company’s Retirement Plans. Additionally, theCompany has updated its mortality assumption by adopting the newly released mortality improvement scale MP-2017 to accompanythe RP-2014 mortality tables to reflect the latest information regarding future mortality expectations by the Society of Actuaries.
When actual plan experience differs from the assumptions used, actuarial gains or losses arise. Excluding differences between theexpected long-term rate of return assumption and actual returns on plan assets, the Company amortizes, as a component of annualpension expense, total outstanding actuarial gains or losses over the estimated average future working lifetime of active plan partic-ipants to the extent that the gain/loss exceeds 10% of the greater of the beginning-of-year projected benefit obligation or the market-related value of plan assets. For Moody’s Retirement Plans, the total actuarial losses as of December 31, 2017 that have not beenrecognized in annual expense are $123.2 million, and Moody’s expects to recognize a net periodic expense of $6.0 million in 2018related to the amortization of actuarial losses.
For Moody’s funded U.S. pension plan, the differences between the expected long-term rate of return assumption and actual experiencecould also affect the net periodic pension expense. As permitted under ASC Topic 715, the Company spreads the impact of assetexperience over a five-year period for purposes of calculating the market-related value of assets that is used in determining theexpected return on assets’ component of annual expense and in calculating the total unrecognized gain or loss subject to amortization.As of December 31, 2017, the Company has an unrecognized asset loss of $16.1 million, of which $2.1 million will be recognized in themarket-related value of assets that is used to calculate the expected return on assets’ component of 2019 expense.
The table below shows the estimated effect that a one percentage-point decrease in each of these assumptions will have on Moody’s2018 income before provision for income taxes. These effects have been calculated using the Company’s current projections of 2018expenses, assets and liabilities related to Moody’s Retirement Plans, which could change as updated data becomes available.
(dollars in millions) Assumption Used for 2018
Estimated Impact on2018 income before provision
for income taxes(Decrease)/Increase
Weighted Average Discount Rates* 3.46%/3.45% $ (11.4)
Weighted Average Assumed Compensation Growth Rate 3.71% $ 1.6
Assumed Long-Term Rate of Return on Pension Assets 4.50% $ (3.4)
* Weighted average discount rates of 3.46% and 3.45% for pension plans and Other Retirement Plans, respectively.
A one percentage-point increase in assumed healthcare cost trend rates will not affect 2018 projected expenses. Based on current pro-jections, the Company estimates that expenses related to Retirement Plans will be approximately $31 million in 2018, a decreasecompared to the $32.6 million recognized in 2017.
36 MOODY’S 2017 10-K
Income TaxesThe Company is subject to income taxes in the U.S. and various foreign jurisdictions. The Company’s tax assets and liabilities areaffected by the amounts charged for services provided and expenses incurred as well as other tax matters such as intercompany trans-actions. The Company accounts for income taxes under the asset and liability method in accordance with ASC Topic 740. Therefore,income tax expense is based on reported income before income taxes, and deferred income taxes reflect the effect of temporary differ-ences between the amounts of assets and liabilities that are recognized for financial reporting purposes and the amounts that arerecognized for income tax purposes.
The Company is subject to tax audits in various jurisdictions. The Company regularly assesses the likely outcomes of such audits inorder to determine the appropriateness of liabilities for UTBs. The Company classifies interest related to income taxes as a componentof interest expense in the Company’s consolidated financial statements and associated penalties, if any, as part of other non-operatingexpenses.
For UTBs, ASC Topic 740 requires a company to first determine whether it is more-likely-than-not (defined as a likelihood of more thanfifty percent) that a tax position will be sustained based on its technical merits as of the reporting date, assuming that taxing author-ities will examine the position and have full knowledge of all relevant information. A tax position that meets this more-likely-than-notthreshold is then measured and recognized at the largest amount of benefit that is greater than fifty percent likely to be realized uponeffective settlement with a taxing authority. As the determination of liabilities related to UTBs and associated interest and penaltiesrequires significant estimates to be made by the Company, there can be no assurance that the Company will accurately predict theoutcomes of these audits, and thus the eventual outcomes could have a material impact on the Company’s operating results or finan-cial condition.
On December 22, 2017, the Tax Act was signed into law which resulted in significant changes to U.S. corporate tax laws. The Tax Actincludes a mandatory one-time deemed repatriation tax (“transition tax”) on previously untaxed accumulated earnings of foreign sub-sidiaries and reduces the statutory federal corporate income tax rate from 35% to 21%. Due to the complexities involved in applyingthe provisions of the Tax Act, in 2017 the Company recorded a provisional estimate of $247.3 million related to the transition tax. Aportion of this amount will be payable over eight years, starting in 2018, and will not accrue interest. Also in 2017, a provisional esti-mate of $56.2 million was recorded decreasing net deferred tax assets resulting from the reduction in the federal corporate income taxrate. The above provisional estimates may be impacted by a number of additional considerations, including but not limited to the issu-ance of regulations and our ongoing analysis of the new law.
Other EstimatesIn addition, there are other accounting estimates within Moody’s consolidated financial statements, including recoverability of deferredtax assets, valuation of investments in affiliates and the estimated lives of amortizable intangible assets. Management believes thecurrent assumptions and other considerations used to estimate amounts reflected in Moody’s consolidated financial statements areappropriate. However, if actual experience differs from the assumptions and other considerations used in estimating amounts reflectedin Moody’s consolidated financial statements, the resulting changes could have a material adverse effect on Moody’s consolidatedresults of operations or financial condition.
See Note 2 to the consolidated financial statements for further information on significant accounting policies that impact Moody’s.
REPORTABLE SEGMENTS
The Company is organized into two reportable segments at December 31, 2017: MIS and MA.
The MIS segment is comprised primarily of all of the Company’s ratings operations consisting of five LOBs—CFG, SFG, FIG, PPIF andMIS Other. The ratings LOBs generate revenue principally from fees for the assignment and ongoing monitoring of credit ratings ondebt obligations and the entities that issue such obligations in markets worldwide. The MIS Other LOB consists of certain non-ratingsoperations managed by MIS which consists of non-rating revenue from ICRA and fixed income pricing service operations in the Asia-Pacific region.
The MA segment develops a wide range of products and services that support financial analysis and risk management activities ofinstitutional participants in global financial markets as well as serving as provider of business intelligence and company information. TheMA segment consists of three lines of business—RD&A, ERS and PS. The results of operations for MA and revenue for the RD&A LOBfor the fourth quarter and year ended December 31, 2017 include the financial results from Bureau van Dijk which was acquired onAugust 10, 2017.
The following is a discussion of the results of operations of the Company and its reportable segments. Total MIS revenue and total MAexpenses include the intersegment royalty revenue for MIS and expense charged to MA for the rights to use and distribute content,data and products developed by MIS. The royalty rate charged by MIS approximates the fair value of the aforementioned content, dataand products developed by MIS. Total MA revenue and total MIS expenses include intersegment fees charged to MIS from MA for the
MOODY’S 2017 10-K 37

use of certain MA products and services in MIS’s ratings process. These fees charged by MA are generally equal to the costs incurred byMA to provide these products and services. Overhead charges and corporate expenses that exclusively benefit one segment are fullycharged to that segment. Additionally, overhead costs and corporate expenses of the Company that benefit both segments are gen-erally allocated to each segment based on a revenue-split methodology. Overhead expenses include costs such as rent and occupancy,information technology and support staff such as finance, human resources and information technology.
Beginning in the third quarter of 2017, in conjunction with the acquisition of Bureau van Dijk, the Company modified its definition ofAdjusted Net Income and Adjusted Diluted EPS to exclude the impact of amortization of all acquisition-related intangible assets. Referto the section entitled “Non-GAAP Financial Measures” of this Management Discussion and Analysis for further information regardingthis measure.
RESULTS OF OPERATIONS
Year ended December 31, 2017 compared with year ended December 31, 2016
Executive Summary» Moody’s completed the acquisition of Bureau van Dijk on August 10, 2017. Moody’s results of operations include Bureau van Dijk’s
operating results beginning as of August 10, 2017.
» Moody’s revenue in 2017 totaled $4,204.1 million, an increase of $599.9 million, or 17%, compared to 2016 reflecting strong growthin both segments.
» MIS revenue was 17% higher compared to the prior year with growth across all ratings LOBs. The most notable growth was inthe CFG LOB mainly due to strong leveraged finance issuance across all regions reflecting favorable market conditions andincreased investor demand for higher yielding securities.
» MA revenue grew 16% compared to the prior year reflecting growth across all LOBs. The most notable growth was in theRD&A LOB which reflected increases in credit research subscriptions and licensing of credit data as well as an approximate$92 million contribution from Bureau van Dijk (net of an approximate $36 million reduction relating to a deferred revenueadjustment required as part of acquisition accounting as further described in Note 7 to the financial statements), providingapproximately seven percentage points to growth.
» Total operating expenses excluding D&A decreased $602.1 million, or 21% compared to 2016 reflecting the $863.8 millionSettlement Charge in 2016. This decrease is partially offset by higher compensation costs in 2017 which reflects growth inperformance-based compensation resulting from strong financial performance in 2017 coupled with annual merit increases.Additionally, there was approximately $64 million in Bureau van Dijk operating expenses and $22.5 million in Acquisition-RelatedExpenses in 2017.
» D&A increased $31.6 million primarily due to amortization of intangible assets acquired as part of the Bureau van Dijk acquisition.
» Operating income of $1,809.1 million in 2017 increased $1,170.4 million compared to 2016 and resulted in an operating margin of43.0%, compared to 17.7% in the prior year. Operating income and operating margin in 2016 were suppressed by the $863.8 millionSettlement Charge. Adjusted Operating Income of $1,989.9 million in 2017 increased $348.7 million compared to 2016, resulting inan Adjusted Operating Margin of 47.3% compared to 45.5% in the prior year.
» The decrease in non-operating expense, net, compared to the prior year is primarily due to:
» the $59.7 million CCXI Gain in 2017;
» the $111.1 million Purchase Price Hedge Gain in 2017;
Partially offset by:» higher interest expense of $50.6 million primarily reflecting additional financing in 2017 utilized to fund the payment of the
2016 Settlement Charge, repay the Series 2007-1 Notes and fund the Bureau van Dijk acquisition.
» FX losses of approximately $17 million in the 2017 compared to FX gains of approximately $50 million in the prior year. TheFX gains in 2016 included approximately $35 million related to the liquidation of a non-U.S. subsidiary.
» The ETR of 43.6% in 2017 includes a net charge of approximately $246 million in the fourth quarter related to the impacts of taxreform in the U.S. and Belgium partially offset by the non-taxable CCXI Gain and an approximate $40 million benefit relating toExcess Tax Benefits on stock-based compensation. The 2016 ETR of 50.6% included the non-deductible nature of the federal portionof the Settlement Charge.
38 MOODY’S 2017 10-K

» Diluted EPS of $5.15 increased $3.79 compared to 2016. Diluted EPS in 2017 and 2016 included the following items, detailed in thetable below, which impacted year-over-year comparability:
Year Ended December 31,
Per share benefit (charge) to Diluted EPS 2017 2016
CCXI Gain $ 0.31 —
Purchase Price Hedge Gain $ 0.37 —
Restructuring — $ (0.04)
Settlement Charge — $ (3.59)
FX gain on liquidation of a subsidiary — $ 0.18
Acquisition-Related Expenses $ (0.10) —
Amortization of acquired intangible assets $ (0.23) $ (0.13)
Impact of U.S. tax reform / Belgium statutory tax rate change $ (1.27) —
Excluding all of the items in the table above, Adjusted Diluted EPS of $6.07, which included $0.20 relating to Excess Tax Benefits onstock-based compensation and $0.03 in financing costs incurred between the execution of the agreement to acquire Bureau van Dijkand the closing of the acquisition, increased $1.13 compared to 2016.
MOODY’S 2017 10-K 39

Moody’s Corporation
Year ended December 31,% Change Favorable
(Unfavorable)2017 2016
Revenue:
United States $ 2,348.4 $ 2,105.5 12%
International:
EMEA 1,131.7 904.4 25%
Asia-Pacific 471.4 373.2 26%
Americas 252.6 221.1 14%
Total International 1,855.7 1,498.7 24%
Total 4,204.1 3,604.2 17%
Expenses:
Operating 1,222.8 1,026.6 (19%)
SG&A 991.4 936.4 (6%)
Restructuring — 12.0 100%
Depreciation and amortization 158.3 126.7 (25%)
Acquisition-Related Expenses 22.5 — NM
Settlement Charge — 863.8 100%
Total 2,395.0 2,965.5 19%
Operating income $ 1,809.1 $ 638.7 183%
Adjusted Operating Income (1) $ 1,989.9 $ 1,641.2 21%
Interest expense, net $ (188.4) $ (137.8) (37%)Other non-operating (expense) income, net $ (4.7) $ 57.1 (108%)Purchase Price Hedge Gain $ 111.1 $ — NMCCXI Gain $ 59.7 $ — NM
Non-operating expense, net $ (22.3) $ (80.7) 72%
Net income attributable to Moody’s $ 1,000.6 $ 266.6 275%Diluted weighted average shares outstanding $ 194.2 195.4 1%Diluted EPS attributable to Moody’s commonshareholders $ 5.15 $ 1.36 279%Adjusted Diluted EPS attributable to Moody’s commonshareholders (1) $ 6.07 $ 4.94 23%
Operating margin 43.0% 17.7%
Adjusted Operating Margin (1) 47.3% 45.5%(1) Adjusted Operating Income, Adjusted Operating Margin and Adjusted Diluted EPS attributable to Moody’s common shareholders are non-GAAP financial
measures. Refer to the section entitled “Non-GAAP Financial Measures” of this Management Discussion and Analysis for further information regarding thesemeasures.
The table below shows Moody’s global staffing by geographic area:
December 31,
% Change2017 2016
United States 3,591 3,386 6%International 8,305 7,231 15%
Total 11,896* 10,617 12%
* Includes 874 employees from the acquisition of Bureau van Dijk
Global revenue of $4,204.1 million in 2017 increased $599.9 million, or 17%, compared to 2016 and reflected strong growth in bothMIS and MA.
The $403.0 million increase in MIS revenue primarily reflects strong global leveraged finance rated issuance volumes in CFG as issuerstook advantage of favorable market conditions to refinance obligations in 2017 as well as growth in the banking sector within FIG andin CLO issuance in SFG. Additionally, the increase over prior year reflects benefits from changes in the mix of fee type, new fee ini-tiatives and pricing increases. These increases were partially offset by lower U.S. public finance refunding volumes.
40 MOODY’S 2017 10-K
The $196.9 million increase in MA revenue primarily reflects higher RD&A revenue across all regions driven by growth in credit researchsubscriptions and licensing of ratings data as well as the contribution from the Bureau van Dijk acquisition of approximately $92 million(net of an approximate $36 million reduction relating to a deferred revenue adjustment required as part of acquisition accounting asfurther described in Note 7 to the financial statements).
Transaction revenue accounted for 50% of global MCO revenue in 2017, compared to 49% in 2016.
U.S. revenue of $2,348.4 million in 2017 increased $242.9 million over the prior year, reflecting growth in both reportable segments.
Non-U.S. revenue increased $357.0 million from 2016 reflecting growth in both reportable segments.
Operating expenses were $1,222.8 million in 2017, up $196.2 million from 2016, primarily due to an increase in performance-basedcompensation expenses (including annual bonuses, a profit sharing contribution and performance-based equity compensation), which iscorrelated with the strong financial performance of the Company in 2017. This increase also reflects higher salaries and employeebenefit expenses resulting from the impact of annual compensation increases and increases in headcount coupled with Bureau van Dijkexpenses.
SG&A expenses of $991.4 million in 2017 increased $55.0 million from the prior year period primarily due to higher performance-basedcompensation costs (including annual bonuses, a profit sharing contribution and performance-based equity compensation), which iscorrelated with the strong financial performance of the Company in 2017 coupled with Bureau van Dijk expenses. These increases werepartially offset by the impact of cost management initiatives implemented in 2016 that have benefited 2017 as well as lower legalcosts.
D&A increased $31.6 million primarily due to amortization of intangible assets acquired as part of the Bureau van Dijk acquisition.
Acquisition-Related Expenses represent expenses incurred to complete and integrate the acquisition of Bureau van Dijk.
Operating income of $1,809.1 million increased $1,170.4 million from 2016. Operating margin was 43.0% compared to 17.7% in 2016.Operating income and operating margin in 2016 were suppressed by the $863.8 million Settlement Charge. Adjusted Operating Incomewas $1,989.9 million in 2017, an increase of $348.7 million compared to 2016. Adjusted Operating Margin of 47.3% increased 180 BPScompared to the prior year.
Interest (expense) income, net in 2017 was $(188.4) million, a $50.6 million increase in expense compared to 2016 primarily due to: i)interest on the 2017 Senior Notes and 2017 Floating Rate Senior Notes which were issued in the first quarter of 2017 to fund thepayment of the 2016 Settlement Charge and repayment of the Series 2007-1 Notes; ii) interest on the 2017 Private Placement NotesDue 2023 and 2028 both issued in June 2017 coupled with interest on the 2017 Term Loan drawn down in August 2017, all of whichwere issued to fund the acquisition of Bureau van Dijk; and iii) fees on the undrawn 2017 Bridge Credit Facility also related to theacquisition of Bureau van Dijk.
Other non-operating (expense) income, net was $(4.7) million in 2017, a $61.8 million change compared to 2016 primarily reflectingapproximately $17 million in FX losses in 2017 compared to approximately $50 million in FX gains in the prior year. The FX gains in2016 included an approximate $35 million gain related to the liquidation of a non-U.S. subsidiary.
Additionally, Moody’s recognized the $59.7 million CCXI Gain and the $111.1 million Purchase Price Hedge Gain in 2017.
The ETR of 43.6% in 2017 includes a net charge of approximately $246 million in the fourth quarter related to the impacts of corporatetax reform in the U.S. and Belgium partially offset by the non-taxable CCXI Gain and an approximate $40 million benefit reflecting theadoption on a prospective basis of a new accounting standard relating to Excess Tax Benefits on stock-based compensation. In accord-ance with a new accounting standard, these Excess Tax Benefits are now recorded to the provision for income taxes, whereas in theprior year were recorded to capital surplus (refer to Note 1 to the consolidated financial statements for further discussion on this newaccounting standard). The 2016 ETR of 50.6% included the non-deductible nature of the federal portion of the Settlement Charge. Theimpact of the aforementioned tax reform in the U.S. is expected to reduce the Company’s ETR in years subsequent to 2017. For thefull-year ended December 31, 2018, the Company expects the ETR to be between 22% and 23%.
MOODY’S 2017 10-K 41

Diluted EPS increased $3.79 compared to 2016. Diluted EPS in 2017 and 2016 included the following items detailed in the table belowwhich impacted year-over-year comparability:
Year Ended December 31,
Per share benefit (charge) to Diluted EPS 2017 2016
CCXI Gain $ 0.31 —
Purchase Price Hedge Gain $ 0.37 —
Restructuring — (0.04)
Settlement Charge — $ (3.59)
FX gain on liquidation of a subsidiary $ 0.18
Acquisition-Related Expenses $ (0.10) —
Amortization of acquired intangible assets $ (0.23) $ (0.13)
Impact of U.S. tax reform / Belgium statutory tax rate change $ (1.27) —
Excluding all of the items in the table above, Adjusted Diluted EPS of $6.07, which included $0.20 relating to Excess Tax Benefits onstock-based compensation and $0.03 in financing costs incurred between the execution of the agreement to acquire Bureau van Dijkand the closing of the acquisition, increased $1.13 compared to 2016 reflecting higher Net Income and a 1% reduction in dilutedweighted average shares outstanding. Refer to the section entitled “Non-GAAP Financial Measures” of this Management’s Discussionand Analysis for the impact to Net Income relating to the aforementioned per-share amounts.
Segment Results
Moody’s Investors ServiceThe table below provides a summary of revenue and operating results, followed by further insight and commentary:
Year ended December 31,% Change Favorable
(Unfavorable)2017 2016
Revenue:
Corporate finance (CFG) $ 1,392.7 $ 1,122.3 24%
Structured finance (SFG) 495.5 436.8 13%
Financial institutions (FIG) 435.8 368.9 18%
Public, project and infrastructure finance (PPIF) 431.3 412.2 5%
Total ratings revenue 2,755.3 2,340.2 18%
MIS Other 18.5 30.6 (40%)
Total external revenue 2,773.8 2,370.8 17%
Intersegment royalty 111.7 100.2 11%
Total MIS Revenue 2,885.5 2,471.0 17%
Expenses:
Operating and SG&A (external) 1,230.9 1,102.1 (12%)
Operating and SG&A (intersegment) 16.0 13.5 (19%)
Adjusted Operating Income 1,638.6 1,355.4 21%
Depreciation and amortization 74.7 73.8 (1%)
Restructuring — 10.2 100%
Settlement Charge — 863.8 100%
Operating income $ 1,563.9 $ 407.6 284%
Operating margin 54.2% 16.5%
Adjusted Operating Margin 56.8% 54.9%
The following is a discussion of external MIS revenue and operating expenses:
Global MIS revenue of $2,773.8 million in 2017 was up 17% compared to 2016, most notably from strong leveraged finance rated issu-ance volumes within CFG coupled with strong growth in banking-related revenue in FIG and increases across most asset classes in SFG.Also contributing to the growth was the favorable impact of changes in the mix of fee type, new fee initiatives and pricing increases.
42 MOODY’S 2017 10-K

Transaction revenue for MIS was 65% in 2017 compared to 61% in 2016.
In the U.S., revenue was $1,702.8 million in 2017, an increase of $200.9 million or 13%, compared to 2016 primarily reflecting stronggrowth in CFG, SFG and FIG revenue being partially offset by declines in PPIF and MIS Other revenue.
Non-U.S. revenue was $1,071.0 million in 2017, an increase of $202.1 million or 23%, compared to 2016 reflecting growth across allLOBs excluding MIS Other.
Global CFG revenue of $1,392.7 million in 2017 was up 24% compared to 2016 primarily due to strength in leveraged finance issuancein the U.S., EMEA and Asia-Pacific as issuers took advantage of favorable market conditions to refinance obligations and fund M&Aactivity. The growth in leveraged finance revenue also reflects benefits from a favorable issuance mix in 2017 compared to the prioryear where issuance volumes included a greater number of lower-yielding jumbo deals. The increase over the prior year also reflectshigher investment-grade corporate debt revenue in the U.S. reflecting continued favorable market conditions and benefits from changesin the mix of fee type, new fee initiatives and pricing increases as well as growth in monitoring fees across all regions. Transaction rev-enue represented 73% of total CFG revenue in 2017, compared to 68% in the prior year period. In the U.S., revenue was $909.7 million,or 19% higher compared to the prior year. Internationally, revenue of $483.0 million increased 34% compared to the prior year.
Global SFG revenue of $495.5 million in 2017 increased $58.7 million, or 13%, compared to 2016. In the U.S., revenue of$340.1 million increased $46.8 million over 2016 primarily due to strong growth in CLO issuance reflecting an increase in bank loansupply and favorable market conditions which enabled both new securitizations and a surge in refinancing activity. Non-U.S. revenue in2017 of $155.4 million increased $11.9 million compared to the prior year primarily reflecting growth across most asset classes in theEMEA region. Transaction revenue was 65% of total SFG revenue in 2017 compared to 62% in the prior year.
Global FIG revenue of $435.8 million in 2017 increased $66.9 million, or 18%, compared to 2016. In the U.S., revenue of $186.1 millionincreased $26.0 million compared to the prior year primarily reflecting higher issuance in the banking sector and benefits from changesin the mix of fee type, new fee initiatives and price increases. Internationally, revenue was $249.7 million in 2017, up $40.9 millioncompared to 2016 primarily due to higher banking revenue in EMEA from opportunistic issuance amidst current favorable market con-ditions as well as benefits from changes in the mix of fee type, new fee initiatives and pricing increases. The non-U.S. growth alsoreflects strength in banking revenue in the Asia-Pacific region reflecting higher cross-border issuance from Chinese banks and thenon-bank financial sector. Transaction revenue was 45% of total FIG revenue in 2017 compared to 37% in 2016.
Global PPIF revenue was $431.3 million in 2017 and increased $19.1 million, or 5%, compared to 2016. In the U.S., revenue in 2017was $266.4 million and decreased $9.8 million compared to 2016 primarily due to strong PFG refunding volumes in 2016. Thesedecreases were partially offset by growth in infrastructure finance revenue coupled with benefits from changes in the mix of fee type,new fee initiatives and pricing increases. Outside the U.S., PPIF revenue was $164.9 million and increased $28.9 million compared to2016 reflecting strong growth in infrastructure finance revenue in the Asia-Pacific region and growth in public finance revenue in EMEA.Transaction revenue was 65% of total PPIF revenue in 2017 compared to 63% in the prior year.
Operating and SG&A expenses in 2017 increased $128.8 million compared to 2016 primarily due to growth in performance-basedcompensation resulting from strong financial performance in 2017 coupled with increased headcount and higher salaries and employeebenefits costs reflecting annual compensation increases. These increases were partially offset by lower legal fees and continued costcontrol initiatives.
Adjusted Operating Income and operating income in 2017, which includes intersegment royalty revenue and intersegment expenses,were $1,638.6 million and $1,563.9 million, respectively, and increased $283.2 million and $1,156.3 million, respectively, compared to2016. Adjusted Operating Margin was 56.8% or 190 BPS higher than the prior year. Operating margin was 54.2% in 2017 compared to16.5% in the prior year. Operating income and operating margin in 2016 were suppressed due to the Settlement Charge.
MOODY’S 2017 10-K 43

Moody’s AnalyticsThe table below provides a summary of revenue and operating results, followed by further insight and commentary:
Year ended December 31,% Change Favorable
(Unfavorable)2017 2016
Revenue:
Research, data and analytics (RD&A) $ 832.7 $ 667.6 25%
Enterprise risk solutions (ERS) 448.6 418.8 7%
Professional services (PS) 149.0 147.0 1%
Total external revenue 1,430.3 1,233.4 16%
Intersegment revenue 16.0 13.5 19%
Total MA Revenue 1,446.3 1,246.9 16%
Expenses:
Operating and SG&A (external) 983.3 860.9 (14%)
Operating and SG&A (intersegment) 111.7 100.2 (11%)
Adjusted Operating Income 351.3 285.8 23%
Depreciation and amortization 83.6 52.9 (58%)
Restructuring — 1.8 100%
Acquisition-Related Expenses 22.5 — NM
Operating income $ 245.2 $ 231.1 6%
Operating margin 17.0% 18.5%
Adjusted Operating Margin 24.3% 22.9%
The following is a discussion of external MA revenue and operating expenses:
Global MA revenue increased $196.9 million, or 16%, compared to 2016 primarily due to growth in RD&A (which included approx-imately $92 million in revenue, or 7 percentage points of the growth, from the Bureau van Dijk acquisition) coupled with growth in ERS,which included revenue from the first quarter 2016 acquisition of GGY. Additionally, the growth over the prior year reflects benefitsfrom higher fees within MA’s recurring revenue base due to enhanced content and continued alignment of usage and licensing parame-ters. Recurring revenue comprised 78% and 75% of total MA revenue in 2017 and 2016, respectively.
In the U.S., revenue of $645.6 million in 2017 increased $42.0 million, and reflected growth across all LOBs.
Non-U.S. revenue of $784.7 million in 2017 was $154.9 million higher than in 2016 reflecting growth in RD&A, which included approx-imately $82 million in non-U.S. Bureau van Dijk revenue, and higher ERS revenue.
Global RD&A revenue of $832.7 million, which comprised 58% and 54% of total external MA revenue in 2017 and 2016, respectively,increased $165.1 million, or 25%, over the prior year period. In the U.S., revenue of $424.4 million increased $35.1 million compared to2016. Non-U.S. revenue of $408.3 million increased $130.0 million compared to the prior year. RD&A revenue in 2017 includedapproximately $92 million in revenue, or 14 percentage points of the growth, from the Bureau van Dijk acquisition (net of an approx-imate $36 million reduction relating to a deferred revenue adjustment required as part of acquisition accounting as further described inNote 7 to the financial statements). RD&A revenue growth also reflects strong results in the credit research and rating data feeds prod-uct lines, where enhanced content and continued alignment of usage and licensing parameters have generated higher fees.
Global ERS revenue of $448.6 million in 2017 increased $29.8 million, or 7%, over 2016. The growth is primarily due to higher revenuefrom risk and finance analytics products coupled with incremental revenue from GGY, which was acquired in March 2016. Additionally,the revenue growth reflects benefits from pricing increases within ERS’s recurring revenue base. Revenue in ERS is subject to quarterlyvolatility resulting from the variable nature of project timing and the concentration of software implementation and license revenue ina relatively small number of engagements. In the U.S., revenue of $166.6 million increased $3.7 million compared to the prior year.Non-U.S. revenue of $282.0 million increased $26.1 million compared to the prior year.
Global PS revenue of $149.0 million in 2017 increased 1% compared to 2016 reflecting higher revenue from analytical and researchservices in the U.S. mostly offset by lower revenue from these services internationally. In the U.S., revenue in 2017 was $54.6 million,up 6% compared to 2016. International revenue was $94.4 million, down 1% compared to 2016.
Operating and SG&A expenses in 2017 increased $122.4 million compared to 2016. The expense growth includes an approximate$74 million increase in compensation costs reflecting $32 million in Bureau van Dijk compensation costs coupled with annual salary
44 MOODY’S 2017 10-K

increases, higher performance-based compensation and higher severance costs partially offset by the impact of cost control initiatives.Non-compensation costs increased approximately $48 million primarily due to Bureau van Dijk expenses.
There were $22.5 million in Acquisition-Related Expenses incurred to complete and integrate the acquisition of Bureau van Dijk.
Depreciation and amortization increased $30.7 million primarily due to the amortization of Bureau van Dijk’s intangible assets.
Adjusted Operating Income was $351.3 million in 2017 and increased $65.5 million compared to the same period in 2016. Operatingincome of $245.2 million in 2017 increased $14.1 million compared to the same period in 2016. Adjusted Operating Margin in 2017was 24.3%, up 140BPS from 2016. Operating margin was 17.0% in 2017, down 150BPS from the prior year reflecting the afore-mentioned $22.5 million in Bureau van Dijk Acquisition-Related Expenses coupled with approximately $31 million of higher D&A pri-marily relating to Bureau van Dijk’s intangible assets. Adjusted Operating Income and operating income both include intersegmentrevenue and expense.
RESULTS OF OPERATIONS
Year ended December 31, 2016 compared with year ended December 31, 2015
Executive Summary» Moody’s revenue in 2016 totaled $3,604.2 million, an increase of $119.7 million, or 3%, compared to 2015 reflecting good growth in
MA revenue coupled with modest growth in MIS revenue.
» MIS revenue was 2% higher compared to the prior year reflecting robust rated issuance volumes for high-yield corporate debtand bank loans as well as for public finance related activity in the second half of 2016. The growth also reflected benefitsfrom changes in the mix of fee type, new fee initiatives and pricing increases. These increases were mostly offset bychallenges in the first half of 2016 in the high-yield and investment-grade corporate debt sectors due to elevated creditspreads and market volatility. Additionally, there was lower securitization activity in the U.S. in the first half of 2016, mostnotably in the U.S. CLO and CMBS asset classes, which reflected the aforementioned elevated credit spreads and marketvolatility as well as uncertainty relating to the implementation of risk retention regulatory requirements for these assetclasses.
» MA revenue grew 7% compared to the prior year reflecting growth in ERS and RD&A, most notably in the U.S. Revenue grewin most product areas of ERS and included revenue from the acquisition of GGY. In RD&A, revenue growth was primarilydriven by credit research subscriptions and licensing of ratings data. Excluding unfavorable changes in FX translation rates,MA revenue grew 10%.
» Total operating expenses increased $954.4 million or 47%, reflecting:
» an $863.8 million Settlement Charge relating to the MIS segment pursuant to an agreement with the DOJ and the attorneysgeneral of 21 U.S. states and the District of Columbia;
» higher compensation costs of $88.1 million associated with headcount growth in MA (including costs from the acquisition ofGGY) and annual compensation increases company-wide partially offset by cost reduction initiatives in response to thechallenging business conditions in MIS during the first half of 2016; and
» a restructuring charge of $12.0 million associated with cost management initiatives in the MIS segment as well as in certaincorporate overhead functions.
» Operating income of $638.7 million in 2016, which included the aforementioned $863.8 million Settlement Charge, was down$834.7 million compared to 2015 and resulted in an operating margin of 17.7%, compared to 42.3% in the prior year. AdjustedOperating Income of $1,641.2 million in 2016 was up modestly compared to 2015, while Adjusted Operating Margin of 45.5%remained flat compared to 2015.
» The change in non-operating income (expense) net, compared to the prior year is primarily due to higher FX gains which included anapproximate $35 million gain related to the liquidation of a non-U.S. subsidiary and an approximate $15 million gain relating to theappreciation of the euro relative to the British pound during 2016. Partially offsetting these increases was higher interest expensereflecting the 2015 Senior Notes issued in March 2015 and the $300 million of additional borrowings under the 2014 Senior Notes(30-Year) in November 2015.
» The ETR was 50.6% in 2016 compared to 31.2% in the prior year with the increase primarily reflecting the non-deductible nature ofthe federal portion of the aforementioned Settlement Charge.
MOODY’S 2017 10-K 45

» Diluted EPS of $1.36 in 2016, which included: i) a $3.59 Settlement Charge; ii) a $0.04 restructuring charge; iii) an $0.18 FX gainrelating to the substantial liquidation of a subsidiary; and iv) $0.13 in Acquisition-Related Intangible Amortization, decreased $3.27compared to 2015. Excluding all of the aforementioned items in 2016 and a $0.03 benefit from a Legacy Tax Matter and $0.11 inAcquisition-Related Intangible Amortization in the prior year, Adjusted Diluted EPS of $4.94 in 2016 increased $0.23.
Moody’s Corporation
Year ended December 31,% Change Favorable
(Unfavorable)2016 2015
Revenue:
United States $ 2,105.5 $ 2,009.0 5%
International:
EMEA 904.4 882.3 3%
Asia-Pacific 373.2 364.2 2%
Americas 221.1 229.0 (3%)
Total International 1,498.7 1,475.5 2%
Total 3,604.2 3,484.5 3%
Expenses:
Operating 1,026.6 976.3 (5%)
SG&A 936.4 921.3 (2%)
Restructuring 12.0 — NM
Depreciation and amortization 126.7 113.5 (12%)
Settlement Charge 863.8 — NM
Total 2,965.5 2,011.1 (47%)
Operating income $ 638.7 $ 1,473.4 (57%)
Adjusted Operating Income (1) $ 1,641.2 $ 1,586.9 3%
Interest expense, net $ (137.8) $ (115.1) (20%)Other non-operating income, net $ 57.1 $ 21.3 168%
Non-operating expense, net $ (80.7) $ (93.8) 14%
Net income attributable to Moody’s $ 266.6 $ 941.3 (72%)Diluted EPS attributable to Moody’s commonshareholders $ 1.36 $ 4.63 (71%)Adjusted Diluted EPS attributable to Moody’s commonshareholders (1) $ 4.94 $ 4.71 5%
Operating margin 17.7% 42.3%
Adjusted Operating Margin (1) 45.5% 45.5%(1) Adjusted Operating Income, Adjusted Operating Margin and Adjusted Diluted EPS attributable to Moody’s common shareholders are non-GAAP financial
measures. Refer to the section entitled “Non-GAAP Financial Measures” of this Management Discussion and Analysis for further information regarding thesemeasures.
The table below shows Moody’s global staffing by geographic area:
December 31,
% Change2016 2015
United States 3,386 3,364 1%International 7,231 7,006 3%
Total 10,617 10,370 2%
Global revenue of $3,604.2 million in 2016 increased $119.7 million, or 3%, compared to 2015 and reflected good growth in MA rev-enue, which included revenue from the first quarter 2016 acquisition of GGY, coupled with modest growth in MIS revenue.
The $36.6 million increase in MIS revenue reflected robust rated issuance volumes for high-yield corporate debt and bank loans as wellas for public finance related activity in the second half of 2016 reflecting both opportunistic refinancing and new issuance activity. Thegrowth also reflected benefits from changes in the mix of fee type, new fee initiatives and pricing increases. These increases weremostly offset by challenges in the first half of 2016 in the high-yield and investment-grade corporate debt sectors due to elevatedcredit spreads and market volatility. Additionally, there was lower securitization activity in the U.S. in the first half of 2016, most nota-
46 MOODY’S 2017 10-K

bly in the U.S. CLO and CMBS asset classes, which reflected the aforementioned elevated credit spreads and market volatility as well asuncertainty earlier in the year relating to the implementation of certain risk retention regulatory requirements by the end of 2016 forthese asset classes.
The $83.1 million increase in MA revenue reflects growth in ERS and RD&A, most notably in the U.S. Revenue grew in most productareas of ERS and included revenue from the 2016 acquisition of GGY. In RD&A, revenue growth was primarily driven by credit research,subscriptions and licensing of ratings data partially offset by the impact of unfavorable changes in FX rates. Excluding unfavorablechanges in FX translation rates, MA revenue grew 10%.
Transaction revenue accounted for 49% of global MCO revenue in 2016 compared 50% of global MCO revenue in 2015.
U.S. revenue of $2,105.5 million in 2016 increased $96.5 million over the prior year, reflecting strong growth in MA coupled with mod-est growth in MIS.
Non-U.S. revenue increased $23.2 million from 2015 reflecting modest growth in both reportable segments.
Operating expenses were $1,026.6 million in 2016 up $50.3 million from 2015 and included an increase in compensation costs ofapproximately $71 million. This increase reflects higher salaries and employee benefit expenses resulting from the impact of annualcompensation increases and headcount growth in MA which includes headcount from the acquisition of GGY. The increase in compen-sation expenses also reflects higher incentive compensation reflecting greater achievement relative to targeted results compared to theprior year. These increases were partially offset by an approximate $21 million decrease in non-compensation expenses reflecting costreduction initiatives in response to challenging business conditions in MIS earlier in the year.
SG&A expenses of $936.4 million in 2016 increased $15.1 million from the prior year period reflecting increased compensation costsprimarily due to annual compensation increases company-wide and headcount growth in MA which included headcount from the GGYacquisition. The increase in compensation expenses also reflects higher incentive compensation reflecting greater achievement relativeto targeted results compared to the prior year. Additionally, there was an increase in non-compensation expenses reflecting higher rentand occupancy costs being mostly offset by the impact of cost reduction initiatives in response to challenging business conditions inMIS earlier in the year.
The restructuring charge of $12.0 million relates to cost management initiatives in 2016 in the MIS segment as well as in certain corpo-rate overhead functions.
D&A increased $13.2 million reflecting amortization of intangible assets from acquisitions as well as higher depreciation reflecting anincrease in capital expenditures to support IT infrastructure and business growth.
The $863.8 million Settlement Charge relates to an agreement with the U.S. DOJ and the attorneys general of 21 U.S. states and theDistrict of Columbia to resolve pending and potential civil claims related to the MIS segment.
Operating income of $638.7 million in 2016, which included the aforementioned $863.8 million Settlement Charge, was down$834.7 million compared to 2015 and resulted in an operating margin of 17.7%, compared to 42.3% in the prior year. Adjusted Operat-ing Income of $1,641.2 million in 2016 was up modestly compared to 2015, while Adjusted Operating Margin of 45.5% remained flatcompared to 2015.
Interest expense, net in 2016 was ($137.8) million, a $22.7 million increase in expense compared to 2015 reflecting interest on the2015 Senior Notes which were issued in March 2015 as well as interest on the $300 million of additional borrowings under the 2014Senior Notes (30-Year) in November 2015.
Other non-operating income, net was $57.1 million in 2016, a $35.8 million increase in income compared to 2015. This increasereflected FX gains of approximately $35 million related to the substantial liquidation of a subsidiary and approximately $15 million ofgains relating to the appreciation of the euro relative to the British pound during 2016. FX gains in 2015 were immaterial. This increasein income was partially offset by a $6.4 million benefit from a Legacy Tax Matter in 2015 compared to a $1.6 million benefit in 2016.
The ETR was 50.6% in 2016 compared to 31.2% in the prior year with the increase primarily reflecting the non-deductible nature of thefederal portion of the aforementioned Settlement Charge.
Net Income in 2016, which included an approximate $701 million net Settlement Charge more fully described above, was$266.6 million, or $674.7 million lower than prior year. Diluted EPS of $1.36 in 2016, which included: i) a $3.59 Settlement Charge; ii) a$0.04 restructuring charge and iii) an $0.18 FX gain relating to the substantial liquidation of a subsidiary; and iv) $0.13 in Acquisition-Related Intangible Amortization, decreased $3.27 compared to 2015. Excluding all of the aforementioned items in 2016 and a $0.03benefit from a Legacy Tax Matter and $0.11 in Acquisition-Related Intangible Amortization in the prior year, Adjusted Diluted EPS of$4.94 in 2016 increased $0.23 primarily reflecting lower diluted weighted average shares outstanding. The reduction in dilutedweighted average shares outstanding reflects share repurchases under the Company’s Board authorized share repurchase programpartially offset by shares issued under the employee stock-based compensation programs.
MOODY’S 2017 10-K 47
Segment Results
Moody’s Investors ServiceThe table below provides a summary of revenue and operating results, followed by further insight and commentary:
Year ended December 31,% Change Favorable
(Unfavorable)2016 2015
Revenue:
Corporate finance (CFG) $ 1,122.3 $ 1,112.7 1%
Structured finance (SFG) 436.8 449.1 (3%)
Financial institutions (FIG) 368.9 365.6 1%
Public, project and infrastructure finance (PPIF) 412.2 376.4 10%
Total ratings revenue 2,340.2 2,303.8 2%
MIS Other 30.6 30.4 1%
Total external revenue 2,370.8 2,334.2 2%
Intersegment royalty 100.2 93.5 7%
Total MIS Revenue 2,471.0 2,427.7 2%
Expenses:
Operating and SG&A (external) 1,102.1 1,107.2 —
Operating and SG&A (intersegment) 13.5 13.1 (3%)
Adjusted Operating Income 1,355.4 1,307.4 4%
Depreciation and amortization 73.8 66.0 (12%)
Restructuring 10.2 — NM
Settlement Charge 863.8 — NM
Operating income $ 407.6 $ 1,241.4 (67%)
Operating margin 16.5% 51.1%
Adjusted Operating Margin 54.9% 53.9%
The following is a discussion of external MIS revenue and operating expenses:
Global MIS revenue of $2,370.8 million in 2016 was up 2% compared to 2015 reflecting robust rated issuance volumes for high-yieldcorporate debt, bank loans and public finance in the second half of 2016 as capital market volatility and elevated credit spreads thathindered issuance in the first half of 2016 subsided. Additionally, the growth reflects the favorable impact of changes in the mix of feetype, new fee initiatives and pricing increases. These increases were mostly offset by challenges in the first half of 2016 in both thespeculative-grade and investment-grade corporate debt sectors due to elevated credit spreads and market volatility at the time coupledwith an unfavorable shift in issuance mix for investment-grade corporate debt. Additionally, there was lower securitization activity inthe U.S. in the first half of 2016, primarily in the U.S. CLO and CMBS asset classes, which reflected the aforementioned elevated creditspreads and market volatility as well as uncertainty earlier in the year relating to the December 2016 implementation deadline for cer-tain risk retention regulatory requirements for these asset classes.
Transaction revenue for MIS was 61% in both 2016 and 2015.
In the U.S., revenue was $1,501.9 million in 2016, an increase of $27.6 million compared to 2015 and reflected benefits from changesin the mix of fee type, new fee initiatives and pricing increases coupled with second half of 2016 growth in rated issuance volumes forhigh-yield corporate debt and bank loans as well as strong public finance issuance. These increases were partially offset by lower ratedissuance volumes for high-yield corporate debt in the first half of 2016 and a decline in investment-grade corporate debt rated issuancevolumes which was most notable in the fourth quarter of 2016. Additionally, there were declines in securitization activity in the CLOand CMBS asset classes within SFG in the first half of 2016.
Non-U.S. revenue was $868.9 million in 2016, an increase of $9.0 million compared to 2015 primarily reflecting second half of 2016growth in high-yield corporate debt and bank loans as well as investment-grade corporate debt. This growth in the second half reflectedimproved market sentiment following volatility in the first half of 2016 as well as the ECB sponsored CSPP providing a ballast to corpo-rate debt issuance in the EMEA region. The growth over the prior year also reflects changes in the mix of fee type, new fee initiativesand pricing increases. These increases were partially offset by lower revenue in the first half of 2016 primarily reflecting declines ininvestment-grade and high-yield corporate debt across all regions.
48 MOODY’S 2017 10-K

Global CFG revenue of $1,122.3 million in 2016 was up 1% compared to 2015. The increase reflects benefits from changes in the mixof fee type, new fee initiatives and pricing increases coupled with robust rated issuance volumes for high-yield corporate debt and bankloans in the U.S. and EMEA in the second half of 2016 as capital market volatility and elevated credit spreads that hindered issuance inthe first half of 2016 subsided. The increase also reflects higher investment-grade rated issuance volumes in EMEA in the second half of2016 reflecting additional liquidity in the region resulting from the ECB sponsored CSPP. These increases were partially offset by lowerrated issuance volumes in the first half of 2016 for investment-grade and speculative-grade corporate debt across all regions due toelevated credit spreads and capital market volatility at the time. Also, there were lower U.S. investment-grade rated issuance volumesin the fourth quarter of 2016 reflecting an increase in benchmark interest rates immediately following the U.S. presidential election inNovember. Transaction revenue represented 68% of total CFG revenue in 2016, compared to 69% in the prior year period. In the U.S.,revenue in 2016 was $762.9 million, or $10.0 million higher than the prior year. Internationally, revenue of $359.4 million in the 2016was flat compared to the prior year.
Global SFG revenue of $436.8 million in 2016 decreased $12.3 million, or 3%, compared to 2015. In the U.S., revenue of $293.3 milliondecreased $18.2 million compared to 2015. This decrease primarily reflected lower CLO formation in the first half of 2016 due to ele-vated credit spreads and declining availability of collateral for these instruments earlier in the year. Additionally, the decrease reflectedlower securitization activity in the CMBS asset class reflecting higher average credit spreads over the course of 2016, particularly in thefirst quarter, as well as uncertainties relating to the implementation of certain risk retention regulatory requirements for this asset class.These declines were partially offset by benefits from changes in the mix of fee type, new fee initiatives and pricing increases. Non-U.S.revenue in 2016 of $143.5 million increased $5.9 million compared to the prior year primarily reflecting growth in RMBS and ABS inEMEA. Transaction revenue was 62% of total SFG revenue in 2016 compared to 64% in the prior year.
Global FIG revenue of $368.9 million in 2016 increased $3.3 million, or 1%, compared to 2015. In the U.S., revenue of $160.1 millionincreased $3.7 million compared to the prior year primarily reflecting benefits from changes in the mix of fee type, new fee initiativesand pricing increases as well as higher M&A related issuance volumes in the insurance sector. These increases were partially offset byreduced banking-related issuance volumes due to market volatility in the first half of 2016. Internationally, revenue was $208.8 millionin 2016, or flat compared to 2015 with benefits from changes in the mix of fee type, new fee initiatives and pricing increases andgrowth in the Asia-Pacific region reflecting higher cross-border issuance from Chinese banks and asset managers being offset bydeclines in banking-related issuance in EMEA. Transaction revenue was 37% of total FIG revenue in both 2016 and 2015.
Global PPIF revenue was $412.2 million in 2016 and increased $35.8 million, or 10%, compared to 2015. In the U.S., revenue in 2016was $276.2 million and increased $31.5 million compared to 2015 primarily due to benefits from changes in the mix of fee type, newfee initiatives and pricing increases as well as strong growth in public finance issuance in the second half of 2016. This growth in issu-ance reflects opportunistic refunding activity amidst favorable market conditions as well as higher new issuance volumes to fundmunicipal infrastructure investment needs. Additionally, the growth in the U.S. reflects higher infrastructure finance revenue. Outsidethe U.S., PPIF revenue was $136.0 million and increased $4.3 million compared to 2015 reflecting benefits from changes in the mix offee type, new fee initiatives and pricing increases as well as higher infrastructure finance revenue in the Americas region. Theseincreases were partially offset by lower project finance revenue across all non-U.S. regions. Transaction revenue was 63% of total PPIFrevenue in 2016 compared to 60% in the prior year.
Global MIS Other revenue of $30.6 million in 2016 was flat compared to 2015.
Operating and SG&A expenses in 2016 decreased $5.1 million compared to 2015 primarily reflecting lower non-compensation costs ofapproximately $25.0 million reflecting overall cost control initiatives. This decrease was partially offset by higher compensationexpenses of approximately $20 million compared to the prior year reflecting annual salary increases coupled with higher incentivecompensation costs resulting from higher achievement against full-year targeted results compared to the prior year.
The increase in D&A compared to the prior year reflects capital expenditures related to investments in the Company’s IT and opera-tional infrastructure.
The restructuring charge in 2016 relates to cost management initiatives in the MIS segment as well as in certain corporate overheadfunctions.
The Settlement Charge is pursuant to an agreement with the DOJ and the attorneys general of 21 U.S. states and the District ofColumbia.
Adjusted Operating Income was $1,355.4 million and increased $48.0 million compared to the prior year. Operating income in 2016,which includes the aforementioned $863.8 million Settlement Charge, was $407.6 million and decreased $833.8 million compared tothe prior year. Adjusted Operating Margin was 54.9% or 100 BPS higher than the prior year. Operating margin was 16.5% in 2016compared to 51.1% in the prior year, with the decline primarily due to the aforementioned Settlement Charge. Adjusted OperatingIncome and operating income both include intersegment revenue and expense.
MOODY’S 2017 10-K 49

Moody’s AnalyticsThe table below provides a summary of revenue and operating results, followed by further insight and commentary:
Year ended December 31,% Change Favorable
(Unfavorable)2016 2015
Revenue:
Research, data and analytics (RD&A) $ 667.6 $ 626.4 7%
Enterprise risk solutions (ERS) 418.8 374.0 12%
Professional services (PS) 147.0 149.9 (2%)
Total external revenue 1,233.4 1,150.3 7%
Intersegment revenue 13.5 13.1 3%
Total MA Revenue 1,246.9 1,163.4 7%
Expenses:
Operating and SG&A (external) 860.9 790.4 (9%)
Operating and SG&A (intersegment) 100.2 93.5 (7%)
Adjusted Operating Income 285.8 279.5 2%
Depreciation and amortization 52.9 47.5 (11%)
Restructuring 1.8 — NM
Operating income $ 231.1 $ 232.0 —
Operating margin 18.5% 19.9%
Adjusted Operating Margin 22.9% 24.0%
The following is a discussion of external MA revenue and operating expenses:
Global MA revenue increased $83.1 million, or 7%, compared to 2015 and reflected growth in RD&A as well as ERS, which includedrevenue from the acquisition of GGY. Additionally, the growth over the prior year reflects benefits from pricing increases within MA’srecurring revenue base. Excluding unfavorable changes in FX rates, MA revenue grew 10% compared to the prior year. Recurring rev-enue comprised 75% and 74% of total MA revenue in 2016 and 2015, respectively.
In the U.S., revenue of $603.6 million in 2016 increased $68.9 million, and reflected growth in RD&A and ERS. The growth in RD&Areflected strength in credit research subscriptions and licensing of ratings data as well as higher revenue within SAV and ECCA. Theincrease in ERS revenue reflected growth across all product verticals and included revenue from the acquisition of GGY in March 2016.
Non-U.S. revenue of $629.8 million in 2016 was $14.2 million higher than in 2015 reflecting growth in RD&A and ERS partially offsetby unfavorable changes in FX rates. The growth in RD&A primarily reflects strength in credit research subscriptions and licensing ofratings data in the Asia-Pacific region. The increase in ERS was primarily due to higher revenue from the Assets Liability & Capital andCredit Assessment & Origination product verticals in the EMEA region coupled with revenue from the acquisition of GGY. Theseincreases were partially offset by declines in the Credit Assessment & Origination product vertical in the Americas region.
Global RD&A revenue of $667.6 million, which comprised 54% of total external MA revenue in both 2016 and 2015, increased$41.2 million, or 7%, over the prior year period. Excluding unfavorable changes in FX rates, RD&A revenue increased 9% over the prioryear. The growth reflected strength in credit research subscriptions and licensing of ratings data as well as higher revenue within SAVand ECCA. The growth compared to 2015 also reflects the benefits of pricing increases. In the U.S., revenue of $389.3 million increased$37.4 million compared to 2015. Non-U.S. revenue of $278.3 million increased $3.8 million compared to the prior year.
Global ERS revenue of $418.8 million in 2016 increased $44.8 million, or 12%, over 2015. Excluding unfavorable changes in FX rates,ERS revenue grew 15% reflecting increases across most product offerings and included revenue from the acquisition of GGY in March of2016. Additionally, the revenue growth reflects benefits from pricing increases within ERS’s recurring revenue base. Revenue in ERS issubject to quarterly volatility resulting from the variable nature of project timing and the concentration of software implementationand license revenue in a relatively small number of engagements. In the U.S., revenue of $162.9 million increased $31.7 million com-pared to the prior year. Non-U.S. revenue of $255.9 million increased $13.1 million compared to the prior year.
Global PS revenue of $147.0 million in 2016 decreased $2.9 million, or 2%, from 2015. Excluding the unfavorable impact from changesin FX translation rates, PS revenue was flat compared to the prior year. In the U.S. and internationally revenue was $51.4 million and$95.6 million, respectively, or flat and down 3%, respectively.
50 MOODY’S 2017 10-K

The increase in D&A compared to the prior year reflects capital expenditures related to investments in the Company’s IT and opera-tional infrastructure as well as amortization of acquired intangible assets.
Operating and SG&A expenses in 2016 increased $70.5 million compared to 2015. The expense growth primarily reflects an approx-imate $68 million increase in compensation costs primarily due to higher headcount to support business growth as well as headcountfrom the acquisition of GGY coupled with annual merit increases.
Adjusted Operating Income was $285.8 million in 2016 and increased $6.3 million compared to the same period in 2015. Operatingincome of $231.1 million in 2016 decreased $0.9 million compared to the same period in 2015. Adjusted Operating Margin in 2016was 22.9%, down 110bps from 2015. Operating margin was 18.5% in 2016, down 140bps from the prior year. Operating margin andAdjusted Operating Margin in 2016 were suppressed due to a larger proportion of overhead costs allocated to MA under the Company’srevenue-split methodology. Adjusted operating income and operating income both include intersegment revenue and expense.
MARKET RISK
Foreign exchange risk:Moody’s maintains a presence in 40 countries outside the U.S. In 2017, approximately 40% and 39% of both the Company’s revenueand expenses, respectively were denominated in functional currencies other than the U.S. dollar, principally in the British pound and theeuro. As such, the Company is exposed to market risk from changes in FX rates. As of December 31, 2017, approximately 81% ofMoody’s assets were located outside the U.S. making the Company susceptible to fluctuations in FX rates. The effects of translatingassets and liabilities of non-U.S. operations with non-U.S. functional currencies to the U.S. dollar are charged or credited to OCI.
The effects of revaluing assets and liabilities that are denominated in currencies other than a subsidiary’s functional currency arecharged to other non-operating income (expense), net in the Company’s consolidated statements of operations. Accordingly, theCompany enters into foreign exchange forwards to partially mitigate the change in fair value on certain assets and liabilities denomi-nated in currencies other than a subsidiary’s functional currency. The following table shows the impact to the fair value of the forwardcontracts if foreign currencies strengthened against the U.S. dollar:
Foreign Currency Forwards * Impact on fair value of contract ifforeign currency strengthened by 10%Sell Buy
U.S. dollar British pound $47 million unfavorable impactU.S. dollar Canadian dollar $6 million unfavorable impactU.S. dollar Euro $47 million unfavorable impactU.S. dollar Japanese yen $3 million unfavorable impactU.S. dollar Singapore dollar $4 million unfavorable impact
* Refer to Note 5 to the consolidated financial statements in Item 8 of this Form 10-K for further detail on the forward contracts.
The change in fair value of the foreign exchange forward contracts would be offset by FX revaluation gains or losses on underlyingassets and liabilities denominated in currencies other than a subsidiary’s functional currency.
Also, the Company has designated €500 million of the 2015 Senior Notes as a net investment hedge to mitigate FX exposure relatingto euro denominated net investments in subsidiaries. If the euro were to strengthen 10% relative to the U.S. dollar, there would be anapproximate $56 million unfavorable adjustment to OCI related to this net investment hedge. This adjustment would be offset byfavorable translation adjustments on the Company’s euro net investment in subsidiaries.
Moody’s aggregate cash and cash equivalents and short- term investments of $1.2 billion at December 31, 2017 included $1 billionlocated outside the U.S. Approximately 62% of the Company’s aggregate cash and cash equivalents and short term investments atDecember 31, 2017 were held in currencies other than USD. As such, a decrease in the value of foreign currencies against the U.S. dol-lar, particularly the euro and GBP, could reduce the reported amount of USD cash and cash equivalents and short-term investments.
Credit and Interest rate risk:The Company’s interest rate risk management objectives are to reduce the funding cost and volatility to the Company and to alter theinterest rate exposure to the desired risk profile. Moody’s uses interest rate swaps as deemed necessary to assist in accomplishing theseobjectives.
The Company is exposed to interest rate risk on its various outstanding fixed rate debt for which the fair value of the outstanding fixedrate debt fluctuates based on changes in interest rates. The Company has entered into interest rate swaps to convert the fixed rate ofinterest on certain of its borrowings to a floating rate based on the 3-month LIBOR. These swaps are adjusted to fair market value
MOODY’S 2017 10-K 51

based on prevailing interest rates at the end of each reporting period and fluctuations are recorded as a reduction or addition to thecarrying value of the borrowing, while net interest payments are recorded as interest expense/income in the Company’s consolidatedstatement of operations. A hypothetical change of 100bps in the LIBOR-based swap rate would result in an approximate $26 millionchange to the fair value of these interest rate swaps.
Additional information on these interest rate swaps is disclosed in Note 5 to the consolidated financial statements located in Item 8 ofthis Form 10-K.
Moody’s cash equivalents consist of investments in high-quality investment-grade securities within and outside the U.S. with maturitiesof three months or less when purchased. The Company manages its credit risk exposure by allocating its cash equivalents among vari-ous money market mutual funds, money market deposit accounts, certificates of deposit and issuers of high-grade commercial paperand by limiting the amount it can invest with any single issuer. Short-term investments primarily consist of certificates of deposit.
LIQUIDITY AND CAPITAL RESOURCES
Cash FlowThe Company is currently financing its operations, capital expenditures, acquisitions and share repurchases from operating and financ-ing cash flows.
The following is a summary of the changes in the Company’s cash flows followed by a brief discussion of these changes:
Year Ended December 31, Year Ended December 31,
2017 2016
$ ChangeFavorable
(unfavorable) 2016 2015
$ ChangeFavorable
(unfavorable)
Net cash provided by operating activities $ 747.5 $ 1,259.2 $ (511.7) $ 1,259.2 $ 1,198.1 $ 61.1
Net cash (used in) provided by investing activities $ (3,420.0) $ 102.0 $ (3,522.0) $ 102.0 $ (92.0) $ 194.0
Net cash provided by (used in) financing activities $ 1,607.2 $ (1,042.9) $ 2,650.1 $ (1,042.9) $ (505.5) $ (537.4)
Free Cash Flow * $ 656.9 $ 1,144.0 $ (487.1) $ 1,144.0 $ 1,109.1 $ 34.9
* Free Cash Flow is a non-GAAP measure and is defined by the Company as net cash provided by operating activities minus cash paid for capital expenditures.Refer to “Non-GAAP Financial Measures” of this MD&A for further information on this financial measure.
Net cash provided by operating activities
Year ended December 31, 2017 compared to the year ended December 31, 2016:Net cash flows from operating activities decreased $511.7 million compared to the prior year primarily due to the approximate$701 million net payment for the Settlement Charge in 2017 (net of an approximate $163 million tax benefit relating to the charge).This was partially offset by an increase in cash flows primarily relating to the Company’s strong Adjusted Net Income growth in 2017.
Additionally, the Company made approximately $26 million and $22 million in contributions to its funded U.S. pension plan in 2017and 2016, respectively.
Year ended December 31, 2016 compared to the year ended December 31, 2015:Net cash flows from operating activities increased $61.1 million compared to the prior year primarily due to:
» an approximate $64 million increase due to the timing of income tax payments;
» an approximate $43 million increase relating to higher deferred revenue reflecting overall business growth;
» an approximate $43 million increase reflecting higher incentive compensation payouts in 2015 compared to 2016 as well as higherincentive compensation accruals reflecting greater achievement against full-year targeted results in 2016 compared to 2015
partially offset by:» approximate $79 million decrease in cash flow from changes in accounts receivable balances primarily reflecting greater growth in
accounts receivable in 2016 compared to 2015. Approximately 30% and 33% of the Company’s accounts receivable atDecember 31, 2016 and 2015, respectively, represent unbilled receivables which primarily reflect certain annual fees in MIS which arebilled in arrears.
Additionally, the Company made approximately $22 million to its funded U.S. pension plan in both 2016 and 2015.
52 MOODY’S 2017 10-K

Net cash provided by (used in) investing activities
Year ended December 31, 2017 compared to the year ended December 31, 2016:The $3,522.0 million increase in cash flows used in investing activities compared to 2016 primarily reflects:
» a $3.4 billion increase in cash paid for acquisitions compared to the prior year primarily reflecting the acquisition of Bureau van Dijkin the third quarter of 2017;
» lower net maturities of short-term investments of $251.2 million;
Partially offset by:» cash received of $111.1 million relating to the Purchase Price Hedge.
Year ended December 31, 2016 compared to the year ended December 31, 2015:The $194.0 million increase in cash flows provided by investing activities compared to 2015 primarily reflects:
» higher net maturities of short-term investments of $354.7 million;
Partially offset by:» a $73.2 million increase in cash paid for acquisitions and equity investments primarily due to the acquisition of GGY in 2016;
» net cash paid of $23.1 million for the settlement of forward contracts designated as net investment hedges in 2016 compared tocash received of $39.7 million in 2015; and
» higher capital expenditures of approximately $26 million reflecting investment in the Company’s IT and operational infrastructure.
Net cash provided by financing activities
Year ended December 31, 2017 compared to the year ended December 31, 2016:The $2,650.1 million increase in cash provided by financing activities was primarily attributed to:
» proceeds of $1.5 billion from notes and a term loan issued as well as $0.1 billion in net proceeds from commercial paper to fund theacquisition of Bureau van Dijk. Additionally, reflects $0.8 billion of notes issued in the first quarter of 2017 to fund the payment ofthe 2016 Settlement Charge and the early repayment of the Series 2007-1 Notes;
» treasury shares repurchased of $199.7 million in 2017 compared to $738.8 million in 2016;
partially offset by:» repayment of the $300 million Series 2007-1 Notes.
Year ended December 31, 2016 compared to the year ended December 31, 2015:The $537.4 million increase in cash used in financing activities was primarily attributed to:
» $852.8 million from the issuance of long-term debt in 2015, no long-term debt was issued in 2016;
» $45.4 million paid to acquire the non-controlling interest of KIS and additional shares of KIS Pricing;
partially offset by:» treasury shares repurchased of $738.8 million in 2016 compared to $1,098.1 million repurchased in 2015.
Cash and short-term investments held in non-U.S. jurisdictionsThe Company’s aggregate cash and cash equivalents and short-term investments of $1.2 billion at December 31, 2017 included approx-imately $1 billion located outside of the U.S. Approximately 27% of the Company’s aggregate cash and cash equivalents and short-term investments is denominated in euros and British pounds. The Company manages both its U.S. and international cash flow tomaintain sufficient liquidity in all regions to effectively meet its operating needs.
Other Material Future Cash RequirementsThe Company believes that it has the financial resources needed to meet its cash requirements and expects to have positive operatingcash flow in 2018. Cash requirements for periods beyond the next twelve months will depend, among other things, on the Company’sprofitability and its ability to manage working capital requirements. The Company may also borrow from various sources.
The Company remains committed to using its strong cash flow to create value for shareholders by investing in growing areas of thebusiness, reinvesting in ratings quality initiatives, making selective acquisitions, repurchasing stock and paying a dividend, all in a man-ner consistent with maintaining sufficient liquidity after giving effect to any additional indebtedness that may be incurred.
In January 2018, the Board of Directors of the Company declared a quarterly dividend of $0.44 per share of Moody’s common stock,payable March 12, 2018 to shareholders of record at the close of business on February 20, 2018. The continued payment of dividends
MOODY’S 2017 10-K 53

at this rate, or at all, is subject to the discretion of the Board. In December 2015, the Board authorized $1.0 billion of share repurchaseauthority, which had a remaining repurchase authority of approximately $0.5 million at December 31, 2017. Full-year 2018 total sharerepurchases are expected to be approximately $200 million, subject to available cash, market conditions and other ongoing capitalallocation decisions.
The Company has future cash requirements, including operating leases and debt service and principal payments, as noted in the tablesthat follow as well as future payments related to the transition tax under the Tax Act:
IndebtednessAt December 31, 2017, Moody’s had $5.5 billion of outstanding debt and approximately $0.9 billion of additional capacity availableunder the Company’s CP program which is backstopped by the 2015 Facility as more fully discussed in Note 16 to the consolidatedfinancial statements. At December 31, 2017, the Company was in compliance with all covenants contained within all of the debtagreements. All of the Company’s long-term debt agreements contain cross default provisions which state that default under one ofthe aforementioned debt instruments could in turn permit lenders under other debt instruments to declare borrowings outstandingunder those instruments to be immediately due and payable. At December 31, 2017, there were no such cross defaults.
The repayment schedule for the Company’s borrowings outstanding at December 31, 2017 is as follows:
Year EndedDecember 31,
2010SeniorNotes
due2020
2012SeniorNotes
due2022
2013SeniorNotes
due2024
2014SeniorNotes
(5-Year)due
2019
2014SeniorNotes
(30-Year)due
2044
2015SeniorNotes
due2027
TermLoan
Facilitydue
2020
2017Floating
RateSeniorNotes
due2018
2017SeniorNotes
due2021
2017Private
PlacementNotes
due2023
2017Private
PlacementNotes
due2028
CommercialPaper Total
2018 $ — $ — $ — $ — $ — $ — $ — $ 300.0 $ — $ — $ — $ 130.0 $ 430.0
2019 — — — 450.0 — — — — — — — — 450.0
2020 500.0 — — — — — 500.0 — — — — — 1,000.0
2021 — — — — — — — — 500.0 — — — 500.0
2022 — 500.0 — — — — — — — — — — 500.0
Thereafter — — 500.0 — 600.0 600.4 — — — 500.0 500.0 — 2,700.4
Total $500.0 $500.0 $500.0 $ 450.0 $ 600.0 $600.4 $500.0 $ 300.0 $500.0 $ 500.0 $ 500.0 $ 130.0 $5,580.4
Management may consider pursuing additional long-term financing when it is appropriate in light of cash requirements for operations,share repurchases and other strategic opportunities, which would result in higher financing costs.
Off-Balance Sheet ArrangementsAt December 31, 2017, Moody’s did not have any relationships with unconsolidated entities or financial partnerships, such as entitiesoften referred to as special purpose or variable interest entities where Moody’s is the primary beneficiary, which would have beenestablished for the purpose of facilitating off-balance sheet arrangements or other contractually narrow or limited purposes. As such,Moody’s is not exposed to any financing, liquidity, market or credit risk that could arise if it had engaged in such relationships.
Contractual ObligationsThe following table presents payments due under the Company’s contractual obligations as of December 31, 2017:
Payments Due by Period
(in millions) TotalLess Than 1
Year 1-3 Years 3-5 Years Over 5 Years
Indebtedness (1) $ 7,232.9 $ 615.0 $ 2,423.1 $ 1,205.3 2,989.5
Operating lease obligations 715.1 108.3 167.8 148.4 290.6
Purchase obligations 152.8 80.6 58.7 11.4 2.1
Capital lease obligations 0.2 0.2 — — —
Pension obligations (2) 134.0 8.0 40.0 18.0 68.0
Total (3) $ 8,235.0 $ 812.1 $ 2,689.6 $ 1,383.1 $ 3,350.2
(1) Reflects principal payments, related interest and applicable fees due on all indebtedness outstanding as described in Note 16 to the consolidated financialstatements.
(2) Reflects projected benefit payments relating to the Company’s U.S. unfunded DBPPs and Retirement and Other Plans described in Note 13 to theconsolidated financial statements
54 MOODY’S 2017 10-K

(3) The table above does not include the Company’s net long-term tax liabilities of $389.1 million relating to UTPs, since the expected cash outflow of suchamounts by period cannot be reasonably estimated. Additionally, the table above does not include approximately $247 million relating to the deemedrepatriation liability resulting from the Tax Act enacted into law in the U.S. in December 2017.
Non-GAAP Financial Measures:In addition to its reported results, Moody’s has included in this MD&A certain adjusted results that the SEC defines as “non-GAAP finan-cial measures.” Management believes that such non-GAAP financial measures, when read in conjunction with the Company’s reportedresults, can provide useful supplemental information for investors analyzing period-to-period comparisons of the Company’s perform-ance, facilitate comparisons to competitors’ operating results and can provide greater transparency to investors of supplementalinformation used by management in its financial and operational decision-making. These non-GAAP measures, as defined by theCompany, are not necessarily comparable to similarly defined measures of other companies. Furthermore, these non-GAAP measuresshould not be viewed in isolation or used as a substitute for other GAAP measures in assessing the operating performance or cash flowsof the Company. Below are descriptions of the Company’s non-GAAP financial measures accompanied by a reconciliation of thenon-GAAP measure to its most directly comparable GAAP measure:
Adjusted Operating Income and Adjusted Operating Margin:The Company presents Adjusted Operating Income because management deems this metric to be a useful measure of assessing theoperating performance of Moody’s. Adjusted Operating Income excludes depreciation and amortization, Acquisition-Related Expenses,restructuring and the Settlement Charge. Depreciation and amortization are excluded because companies utilize productive assets ofdifferent ages and use different methods of acquiring and depreciating productive assets. Acquisition-Related Expenses consist ofexpenses incurred to complete and integrate the acquisition of Bureau van Dijk and are excluded due to the material nature of theseexpenses which are not expected to recur at this dollar magnitude subsequent to the completion of the multi-year integration effort.Acquisition related expenses from previous acquisitions were not material. Restructuring charges are excluded as the frequency andmagnitude of these charges may vary widely across periods and companies. The Settlement Charge is a material non-recurring eventthat is not expected to recur in the future at this magnitude. Management believes that the exclusion of depreciation and amortization,Acquisition-Related Expenses, restructuring and the Settlement Charge, as detailed in the reconciliation below, allows for an additionalperspective on the Company’s operating results from period to period and across companies. The Company defines Adjusted OperatingMargin as Adjusted Operating Income divided by revenue.
Year Ended December 31,
2017 2016 2015
Operating income $ 1,809.1 $ 638.7 $ 1,473.4Adjustments:
Restructuring — 12.0 —Depreciation and amortization 158.3 126.7 113.5Acquisition-Related Expenses 22.5 — —Settlement Charge — 863.8 —
Adjusted Operating Income $ 1,989.9 $ 1,641.2 $ 1,586.9
Operating margin 43.0% 17.7% 42.3%Adjusted Operating Margin 47.3% 45.5% 45.5%
Adjusted Net Income and Adjusted Diluted EPS attributable to Moody’s common shareholders:Beginning in the third quarter of 2017, the Company modified this adjusted measure to exclude the impact of amortization of acquiredintangible assets as companies utilize intangible assets with different ages and have different methods of acquiring and amortizingintangible assets. Furthermore, the timing and magnitude of business combination transactions are not predictable and the purchaseprice allocated to amortizable intangible assets and the related amortization period are unique to each acquisition and can vary sig-nificantly from period to period and across companies. Also, management believes that excluding acquisition-related amortizationexpense provides additional perspective when comparing operating results from period to period, and with both acquisitive and non-acquisitive peer companies. Furthermore, U.S. tax reform as well as changes in statutory tax rates in Belgium were both enacted in thefourth quarter of 2017, resulting in significant adjustments to the tax provision. The Company modified the adjusted measures toexclude these adjustments to provide additional perspective when comparing net income and diluted EPS from period to period andacross companies. In addition to excluding acquisition-related amortization expense and the effects of U.S. tax reform as well as thestatutory tax rate change in Belgium, current and prior-year adjusted net income and adjusted diluted earnings per share exclude theCCXI Gain, the Purchase Price Hedge Gain, Acquisition-Related Expenses, restructuring charges and the Settlement Charge. The Com-pany excludes these items to provide additional perspective on the Company’s operating results from period to period and acrosscompanies as the frequency and magnitude of similar transactions may vary widely across periods. Additionally, the Acquisition-Related Expenses are excluded due to the material nature of these expenses which are not expected to recur at this dollar magnitudesubsequent to the completion of the multi-year integration effort relating to Bureau van Dijk. Acquisition-Related Expenses from pre-vious acquisitions were not material.
MOODY’S 2017 10-K 55

Below is a reconciliation of this measure to its most directly comparable U.S. GAAP amount.
Year ended December 31,
2017 2016 2015
Net income attributable toMoody’s common shareholders $ 1,000.6 $ 266.6 $ 941.3
Transition tax related to U.S.tax reform 247.3
Net Impact of U.S. tax reform/Belgium statutory tax ratechange on deferred taxes (1.7)
CCXI Gain (59.7) —
Pre-Tax Purchase Price HedgeGain $ (111.1) $ — $ —
Tax on Purchase Price HedgeGain 38.8 — —
Net Purchase Price Hedge Gain (72.3) — —
Pre-Tax Acquisition-RelatedExpenses $ 22.5 $ — $ —
Tax on Acquisition-RelatedExpenses (3.6) — —
Acquisition-Related Expenses (1) 18.9 — —
Pre-Tax Acquisition-RelatedIntangible AmortizationExpenses $ 61.4 $ 34.2 $ 31.9
Tax on Acquisition-RelatedIntangible AmortizationExpenses (16.2) (9.8) (9.1)
Net Acquisition-RelatedIntangible AmortizationExpenses 45.2 24.4 22.8
Pre-Tax Restructuring $ — $ 12.0 $ —
Tax on Restructuring — (3.9) —
Net Restructuring — $ 8.1 $ —
Pre-tax Settlement Charge $ 863.8 $ —
Tax on Settlement Charge (163.1) —
Net Settlement Charge 700.7 —
FX gain on liquidation of asubsidiary (34.8) —
Legacy Tax benefit — (6.4)
Adjusted Net Income $ 1,178.3 $ 965.0 $ 957.7
(1) Certain of these Acquisition-Related Expenses are not deductible for tax
56 MOODY’S 2017 10-K
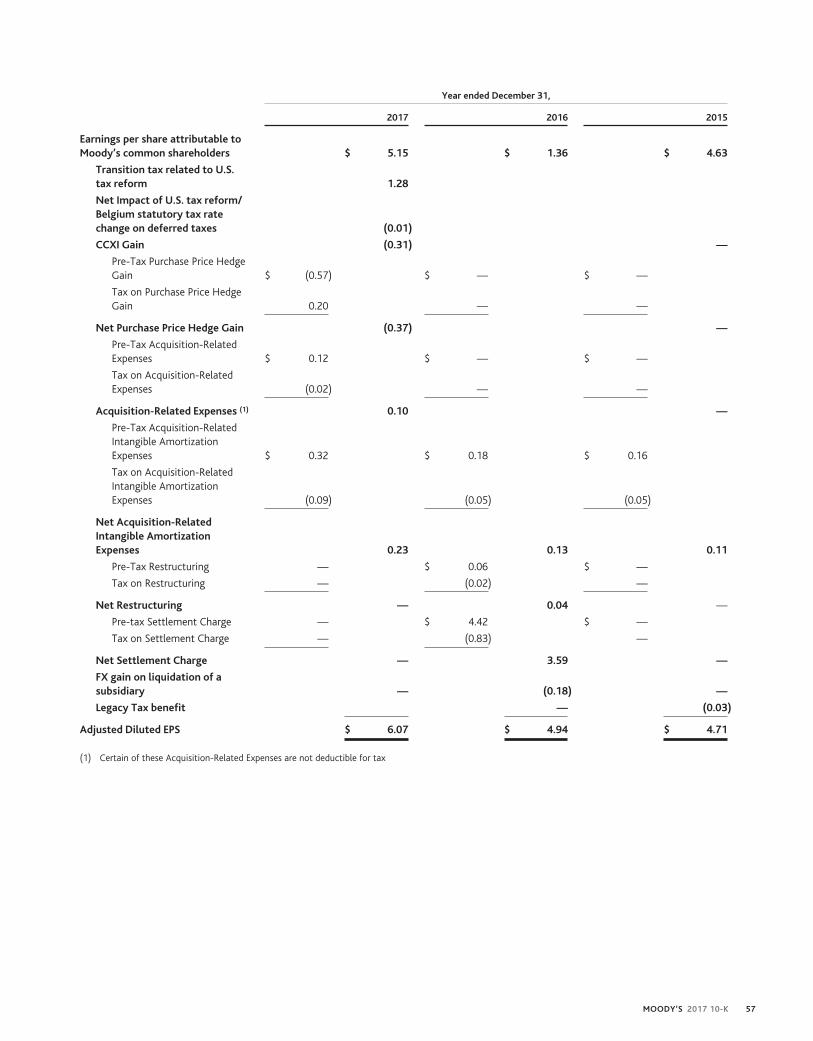
Year ended December 31,
2017 2016 2015
Earnings per share attributable toMoody’s common shareholders $ 5.15 $ 1.36 $ 4.63
Transition tax related to U.S.tax reform 1.28
Net Impact of U.S. tax reform/Belgium statutory tax ratechange on deferred taxes (0.01)
CCXI Gain (0.31) —
Pre-Tax Purchase Price HedgeGain $ (0.57) $ — $ —
Tax on Purchase Price HedgeGain 0.20 — —
Net Purchase Price Hedge Gain (0.37) —
Pre-Tax Acquisition-RelatedExpenses $ 0.12 $ — $ —
Tax on Acquisition-RelatedExpenses (0.02) — —
Acquisition-Related Expenses (1) 0.10 —
Pre-Tax Acquisition-RelatedIntangible AmortizationExpenses $ 0.32 $ 0.18 $ 0.16
Tax on Acquisition-RelatedIntangible AmortizationExpenses (0.09) (0.05) (0.05)
Net Acquisition-RelatedIntangible AmortizationExpenses 0.23 0.13 0.11
Pre-Tax Restructuring — $ 0.06 $ —
Tax on Restructuring — (0.02) —
Net Restructuring — 0.04 —
Pre-tax Settlement Charge — $ 4.42 $ —
Tax on Settlement Charge — (0.83) —
Net Settlement Charge — 3.59 —
FX gain on liquidation of asubsidiary — (0.18) —
Legacy Tax benefit — (0.03)
Adjusted Diluted EPS $ 6.07 $ 4.94 $ 4.71
(1) Certain of these Acquisition-Related Expenses are not deductible for tax
MOODY’S 2017 10-K 57

Free Cash Flow:The Company defines Free Cash Flow as net cash provided by operating activities minus payments for capital additions. Managementbelieves that Free Cash Flow is a useful metric in assessing the Company’s cash flows to service debt, pay dividends and to fund acquis-itions and share repurchases. Management deems capital expenditures essential to the Company’s product and service innovations andmaintenance of Moody’s operational capabilities. Accordingly, capital expenditures are deemed to be a recurring use of Moody’s cashflow. Below is a reconciliation of the Company’s net cash flows from operating activities to Free Cash Flow:
Year Ended December 31,
2017 2016 2015
Net cash provided by operating activities $ 747.5 $ 1,259.2 $ 1,198.1
Capital additions (90.6) (115.2) (89.0)
Free Cash Flow $ 656.9 $ 1,144.0 $ 1,109.1
Net cash (used in) provided by investing activities $ (3,420.0) $ 102.0 $ (92.0)
Net cash provided by (used in) financing activities $ 1,607.2 $ (1,042.9) $ (505.5)
Recently Issued Accounting Pronouncements
Refer to Note 2 to the consolidated financial statements located in Item 8 on this Form 10-K for a discussion on the impact to theCompany relating to recently issued accounting pronouncements.
CONTINGENCIES
For information regarding legal proceedings, see Part II, Item 8 –“Financial Statements”, Note 19 “Contingencies” in this Form 10-K.
Forward-Looking StatementsCertain statements contained in this annual report on Form 10-K are forward-looking statements and are based on future expectations,plans and prospects for the Company’s business and operations that involve a number of risks and uncertainties. Such statementsinvolve estimates, projections, goals, forecasts, assumptions and uncertainties that could cause actual results or outcomes to differmaterially from those contemplated, expressed, projected, anticipated or implied in the forward-looking statements. Those statementsappear at various places throughout this annual report on Form 10-K, including in the sections entitled “Contingencies” under Item 7.“MD&A”, commencing on page 31 of this annual report on Form 10-K, under “Legal Proceedings” in Part I, Item 3, of this Form 10-K,and elsewhere in the context of statements containing the words “believe”, “expect”, “anticipate”, “intend”, “plan”, “will”, “predict”,“potential”, “continue”, “strategy”, “aspire”, “target”, “forecast”, “project”, “estimate”, “should”, “could”, “may” and similar expressionsor words and variations thereof relating to the Company’s views on future events, trends and contingencies. Stockholders and investorsare cautioned not to place undue reliance on these forward-looking statements. The forward-looking statements and other informationare made as of the date of this annual report on Form 10-K, and the Company undertakes no obligation (nor does it intend) to publiclysupplement, update or revise such statements on a going-forward basis, whether as a result of subsequent developments, changedexpectations or otherwise. In connection with the “safe harbor” provisions of the Private Securities Litigation Reform Act of 1995, theCompany is identifying examples of factors, risks and uncertainties that could cause actual results to differ, perhaps materially, fromthose indicated by these forward-looking statements.
Those factors, risks and uncertainties include, but are not limited to, world-wide credit market disruptions or an economic slowdown,which could affect the volume of debt and other securities issued in domestic and/or global capital markets; other matters that couldaffect the volume of debt and other securities issued in domestic and/or global capital markets, including regulation, credit qualityconcerns, changes in interest rates and other volatility in the financial markets such as that due to the U.K.’s referendum vote wherebythe U.K. citizens voted to withdraw from the EU; the level of merger and acquisition activity in the U.S. and abroad; the uncertain effec-tiveness and possible collateral consequences of U.S. and foreign government actions affecting world-wide credit markets, internationaltrade and economic policy; concerns in the marketplace affecting our credibility or otherwise affecting market perceptions of theintegrity or utility of independent credit agency ratings; the introduction of competing products or technologies by other companies;pricing pressure from competitors and/or customers; the level of success of new product development and global expansion; the impactof regulation as an NRSRO, the potential for new U.S., state and local legislation and regulations, including provisions in the FinancialReform Act and regulations resulting from that Act; the potential for increased competition and regulation in the EU and other foreignjurisdictions; exposure to litigation related to our rating opinions, as well as any other litigation, government and regulatory proceed-ings, investigations and inquires to which the Company may be subject from time to time; provisions in the Financial Reform Act legis-lation modifying the pleading standards, and EU regulations modifying the liability standards, applicable to credit rating agencies in amanner adverse to credit rating agencies; provisions of EU regulations imposing additional procedural and substantive requirements on
58 MOODY’S 2017 10-K

the pricing of services and the expansion of supervisory remit to include non-EU ratings used for regulatory purposes; the possible lossof key employees; failures or malfunctions of our operations and infrastructure; any vulnerabilities to cyber threats or other cyberse-curity concerns; the outcome of any review by controlling tax authorities of the Company’s global tax planning initiatives; exposure topotential criminal sanctions or civil remedies if the Company fails to comply with foreign and U.S. laws and regulations that are appli-cable in the jurisdictions in which the Company operates, including sanctions laws, anti-corruption laws, and local laws prohibiting cor-rupt payments to government officials; the impact of mergers, acquisitions or other business combinations and the ability of theCompany to successfully integrate acquired businesses; currency and foreign exchange volatility; the level of future cash flows; the lev-els of capital investments; and a decline in the demand for credit risk management tools by financial institutions. Other factors, risksand uncertainties relating to our acquisition of Bureau van Dijk could cause our actual results to differ, perhaps materially, from thoseindicated by these forward-looking statements, including risks relating to the integration of Bureau van Dijk’s operations, products andemployees into Moody’s and the possibility that anticipated synergies and other benefits of the acquisition will not be realized in theamounts anticipated or will not be realized within the expected timeframe; risks that the acquisition could have an adverse effect onthe business of Bureau van Dijk or its prospects, including, without limitation, on relationships with vendors, suppliers or customers;claims made, from time to time, by vendors, suppliers or customers; changes in the European or global marketplaces that have anadverse effect on the business of Bureau van Dijk. These factors, risks and uncertainties as well as other risks and uncertainties thatcould cause Moody’s actual results to differ materially from those contemplated, expressed, projected, anticipated or implied in theforward-looking statements are described in greater detail under “Risk Factors” in Part I, Item 1A of the Company’s annual report onForm 10-K for the year ended December 31, 2017, and in other filings made by the Company from time to time with the SEC or inmaterials incorporated herein or therein. Stockholders and investors are cautioned that the occurrence of any of these factors, risks anduncertainties may cause the Company’s actual results to differ materially from those contemplated, expressed, projected, anticipated orimplied in the forward-looking statements, which could have a material and adverse effect on the Company’s business, results of oper-ations and financial condition. New factors may emerge from time to time, and it is not possible for the Company to predict new fac-tors, nor can the Company assess the potential effect of any new factors on it.
ITEM 7A. QUANTITATIVE AND QUALITATIVE DISCLOSURES ABOUT MARKET RISK
Information in response to this item is set forth under the caption “Market Risk” in Part II, Item 7 on page 51 of this annual report onForm 10-K.
MOODY’S 2017 10-K 59

ITEM 8. FINANCIAL STATEMENTS
Index to Financial Statements
Page(s)
Management’s Report on Internal Control Over Financial Reporting 61
Report of Independent Registered Public Accounting Firm 62-63
Consolidated Financial Statements:
Consolidated Statements of Operations 64
Consolidated Statements of Comprehensive Income 65
Consolidated Balance Sheets 66
Consolidated Statements of Cash Flows 67
Consolidated Statements of Shareholders’ Equity (Deficit) 68-70
Notes to Consolidated Financial Statements 71-116
Schedules are omitted as not required or inapplicable or because the required information is provided in the consolidatedfinancial statements, including the notes thereto.
60 MOODY’S 2017 10-K
MANAGEMENT’S REPORT ON INTERNAL CONTROL OVER FINANCIAL REPORTING
Management of Moody’s Corporation is responsible for establishing and maintaining adequate internal control over financial reportingand for the assessment of the effectiveness of internal control over financial reporting. As defined by the SEC in Rules 13a-15(f) and15d-15(f) under the Securities Exchange Act of 1934, internal control over financial reporting is a process designed by, or under thesupervision of, the Company’s principal executive and principal financial officers, or persons performing similar functions, and effectedby the Company’s Board, management and other personnel, to provide reasonable assurance regarding the reliability of financial report-ing and the preparation of financial statements for external purposes in accordance with generally accepted accounting principles.
Moody’s internal control over financial reporting includes those policies and procedures that (1) pertain to the maintenance of recordsthat, in reasonable detail, accurately and fairly reflect the transactions and dispositions of assets of the Company; (2) provide reason-able assurance that transactions are recorded as necessary to permit preparation of financial statements in accordance with generallyaccepted accounting principles, and that receipts and expenditures of the Company are being made only in accordance with author-izations of Moody’s management and directors; and (3) provide reasonable assurance regarding prevention or timely detection ofunauthorized acquisition, use or disposition of the Company’s assets that could have a material effect on the financial statements.
Because of its inherent limitations, internal control over financial reporting may not prevent or detect misstatements. Also, projectionsof any evaluation of effectiveness to future periods are subject to the risk that controls may become inadequate because of changes inconditions, or that the degree of compliance with the policies or procedures may deteriorate.
Management of the Company has undertaken an assessment of the design and operational effectiveness of the Company’s internalcontrol over financial reporting as of December 31, 2017 based on criteria established in the Internal Control—Integrated Framework(2013) issued by the Committee of Sponsoring Organizations of the Treadway Commission (COSO).
Our assessment of and conclusion on the effectiveness of our internal control over financial reporting as of December 31, 2017 did notinclude the internal controls of Bureau van Dijk, which was acquired during our fiscal year ended December 31, 2017 and will beincluded in our assessment of and conclusion on the effectiveness of our internal control over financial reporting for the fiscal yearending December 31, 2018. The total assets (excluding acquired goodwill and intangible assets which are included within the scope ofthis assessment) and revenues of Bureau van Dijk represents approximately $322 million and $92 million, respectively, of the corre-sponding amounts in our consolidated financial statements for the fiscal year ended December 31, 2017.
Based on the assessment performed, management has concluded that Moody’s maintained effective internal control over financialreporting as of December 31, 2017.
The effectiveness of our internal control over financial reporting as of December 31, 2017 has been audited by KPMG LLP, anindependent registered public accounting firm, as stated in their report which appears herein.
/s/ RAYMOND W. MCDANIEL, JR.
Raymond W. McDaniel, Jr.President and Chief Executive Officer
/s/ LINDA S. HUBER
Linda S. HuberExecutive Vice President and Chief Financial Officer
February 26, 2018
MOODY’S 2017 10-K 61

Report of Independent Registered Public Accounting Firm
The Shareholders and Board of Directors of Moody’s Corporation:
Opinions on the Consolidated Financial Statements and Internal Control over Financial Reporting
We have audited the accompanying consolidated balance sheets of Moody’s Corporation (the Company) as of December 31, 2017 and2016, and the related consolidated statements of operations, comprehensive income, shareholders’ equity (deficit), and cash flows foreach of the years in the three-year period ended December 31, 2017, and the related notes (collectively, the consolidated financialstatements). We also have audited the Company’s internal control over financial reporting as of December 31, 2017, based on criteriaestablished in Internal Control—Integrated Framework (2013) issued by the Committee of Sponsoring Organizations of the TreadwayCommission.
In our opinion, the consolidated financial statements referred to above present fairly, in all material respects, the financial position ofthe Company as of December 31, 2017 and 2016, and the results of its operations and its cash flows for each of the years in the three-year period ended December 31, 2017, in conformity with U.S. generally accepted accounting principles. Also in our opinion, the Com-pany maintained, in all material respects, effective internal control over financial reporting as of December 31, 2017, based on criteriaestablished in Internal Control—Integrated Framework (2013) issued by the Committee of Sponsoring Organizations of the TreadwayCommission.
The Company acquired Bureau Van Dijk in August 2017, and management excluded from its assessment of the effectiveness of theCompany’s internal control over financial reporting as of December 31, 2017, Bureau Van Dijk’s internal control over financial reporting,which is associated with total assets (excluding goodwill and intangibles which are included within the scope of the assessment) of$322 million and total revenues of $92 million included in the consolidated financial statements of the Company as of and for the yearended December 31, 2017. Our audit of internal control over financial reporting of the Company also excluded an evaluation of theinternal control over financial reporting of Bureau Van Dijk.
Basis for OpinionsThe Company’s management is responsible for these consolidated financial statements, for maintaining effective internal control overfinancial reporting, and for its assessment of the effectiveness of internal control over financial reporting included in the accompanyingManagement’s Report on Internal Control over Financial Reporting. Our responsibility is to express an opinion on the Company’s con-solidated financial statements and an opinion on the Company’s internal control over financial reporting based on our audits. We are apublic accounting firm registered with the Public Company Accounting Oversight Board (United States) (“PCAOB”) and are required tobe independent with respect to the Company in accordance with the U.S. federal securities laws and the applicable rules and regu-lations of the Securities and Exchange Commission and the PCAOB.
We conducted our audits in accordance with the standards of the PCAOB. Those standards require that we plan and perform the auditto obtain reasonable assurance about whether the consolidated financial statements are free of material misstatement, whether due toerror or fraud, and whether effective internal control over financial reporting was maintained in all material respects.
Our audits of the consolidated financial statements included performing procedures to assess the risks of material misstatement of theconsolidated financial statements, whether due to error or fraud, and performing procedures that respond to those risks. Such proce-dures included examining, on a test basis, evidence regarding the amounts and disclosures in the consolidated financial statements. Ouraudits also included evaluating the accounting principles used and significant estimates made by management, as well as evaluating theoverall presentation of the consolidated financial statements. Our audit of internal control over financial reporting included obtainingan understanding of internal control over financial reporting, assessing the risk that a material weakness exists, and testing and evaluat-ing the design and operating effectiveness of internal control based on the assessed risk. Our audits also included performing such otherprocedures as we considered necessary in the circumstances. We believe that our audits provide a reasonable basis for our opinions.
Definition and Limitations of Internal Control over Financial ReportingA company’s internal control over financial reporting is a process designed to provide reasonable assurance regarding the reliability offinancial reporting and the preparation of financial statements for external purposes in accordance with generally accepted accountingprinciples. A company’s internal control over financial reporting includes those policies and procedures that (1) pertain to the main-tenance of records that, in reasonable detail, accurately and fairly reflect the transactions and dispositions of the assets of the com-pany; (2) provide reasonable assurance that transactions are recorded as necessary to permit preparation of financial statements inaccordance with generally accepted accounting principles, and that receipts and expenditures of the company are being made only inaccordance with authorizations of management and directors of the company; and (3) provide reasonable assurance regarding pre-vention or timely detection of unauthorized acquisition, use, or disposition of the company’s assets that could have a material effect onthe financial statements.
62 MOODY’S 2017 10-K

Because of its inherent limitations, internal control over financial reporting may not prevent or detect misstatements. Also, projectionsof any evaluation of effectiveness to future periods are subject to the risk that controls may become inadequate because of changes inconditions, or that the degree of compliance with the policies or procedures may deteriorate.
/s/ KPMG LLP
We have served as the Company’s auditor since 2008.
New York, New YorkFebruary 26, 2018
MOODY’S 2017 10-K 63

MOODY’S CORPORATION
CONSOLIDATED STATEMENTS OF OPERATIONS(Amounts in millions, except per share data)
Year Ended December 31,
2017 2016 2015
Revenue $ 4,204.1 $ 3,604.2 $ 3,484.5
Expenses
Operating 1,222.8 1,026.6 976.3
Selling, general and administrative 991.4 936.4 921.3
Restructuring — 12.0 —
Depreciation and amortization 158.3 126.7 113.5
Acquisition-Related Expenses 22.5 — —
Settlement Charge — 863.8 —
Total expenses 2,395.0 2,965.5 2,011.1
Operating income 1,809.1 638.7 1,473.4
Non-operating (expense) income, net
Interest expense, net (188.4) (137.8) (115.1)
Other non-operating (expense) income , net (4.7) 57.1 21.3
Purchase Price Hedge Gain 111.1 — —
CCXI Gain 59.7 — —
Non-operating (expense) income, net (22.3) (80.7) (93.8)
Income before provision for income taxes 1,786.8 558.0 1,379.6
Provision for income taxes 779.1 282.2 430.0
Net income 1,007.7 275.8 949.6
Less: Net income attributable to noncontrolling interests 7.1 9.2 8.3
Net income attributable to Moody’s $ 1,000.6 $ 266.6 $ 941.3
Earnings per share
Basic $ 5.24 $ 1.38 $ 4.70
Diluted $ 5.15 $ 1.36 $ 4.63
Weighted average shares outstanding
Basic 191.1 192.7 200.1
Diluted 194.2 195.4 203.4
The accompanying notes are an integral part of the consolidated financial statements.
64 MOODY’S 2017 10-K
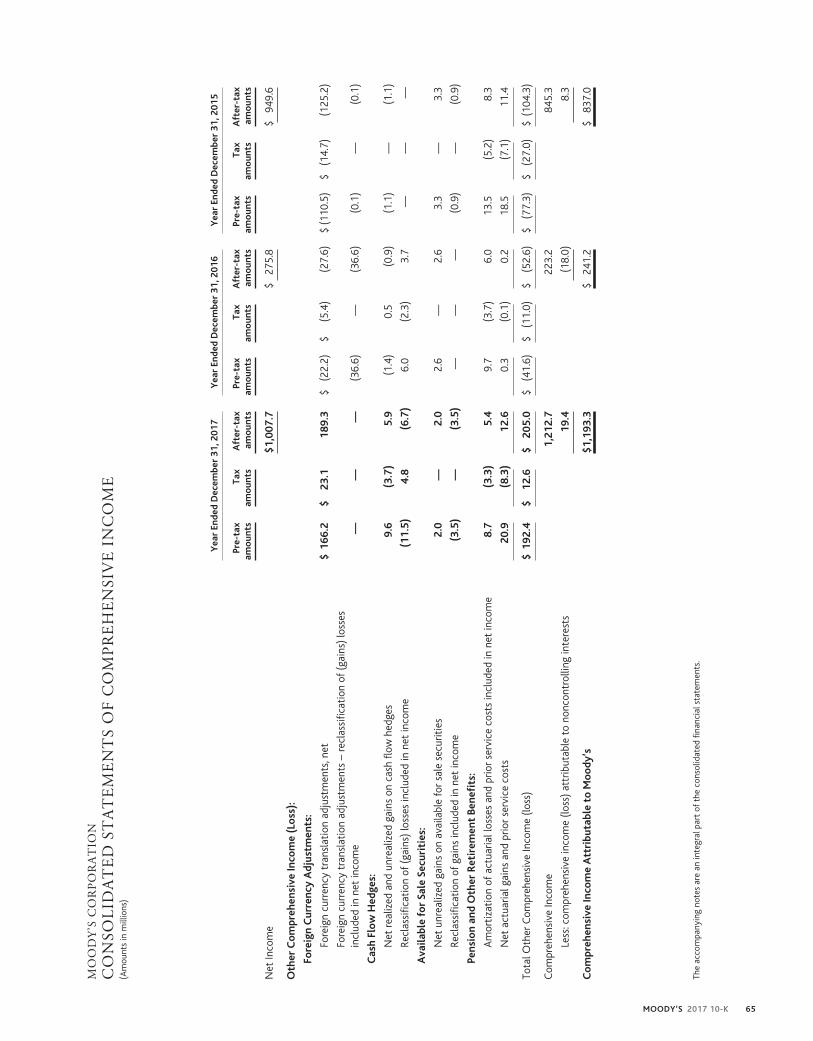
MO
OD
Y’S
CO
RP
OR
AT
ION
CO
NSO
LID
AT
ED
STA
TE
ME
NT
SO
FC
OM
PR
EH
EN
SIV
EIN
CO
ME
(Am
ount
sin
mill
ions
)
Yea
rEn
ded
Dec
embe
r31
,201
7Y
ear
Ende
dD
ecem
ber
31,2
016
Yea
rEn
ded
Dec
embe
r31
,201
5
Pre-
tax
amo
unts
Tax
amo
unts
Aft
er-t
axam
oun
tsPr
e-ta
xam
oun
tsTa
xam
oun
tsA
fter
-tax
amo
unts
Pre-
tax
amo
unts
Tax
amo
unts
Aft
er-t
axam
oun
ts
Net
Inco
me
$1,0
07.7
$27
5.8
$94
9.6
Oth
erC
om
preh
ensi
veIn
com
e(L
oss
):
Fore
ign
Cur
renc
yA
djus
tmen
ts:
Fore
ign
curr
ency
tran
slat
ion
adju
stm
ents
,net
$16
6.2
$23
.118
9.3
$(2
2.2)
$(5
.4)
(27.
6)$
(110
.5)
$(1
4.7)
(125
.2)
Fore
ign
curr
ency
tran
slat
ion
adju
stm
ents
–re
clas
sific
atio
nof
(gai
ns)
loss
esin
clud
edin
net
inco
me
——
—(3
6.6)
—(3
6.6)
(0.1
)—
(0.1
)
Cas
hFl
ow
Hed
ges:
Net
real
ized
and
unre
aliz
edga
ins
onca
shflo
whe
dges
9.6
(3.7
)5.
9(1
.4)
0.5
(0.9
)(1
.1)
—(1
.1)
Recl
assi
ficat
ion
of(g
ains
)lo
sses
incl
uded
inne
tin
com
e(1
1.5)
4.8
(6.7
)6.
0(2
.3)
3.7
——
—
Ava
ilabl
efo
rSa
leSe
curi
ties
:
Net
unre
aliz
edga
ins
onav
aila
ble
for
sale
secu
riti
es2.
0—
2.0
2.6
—2.
63.
3—
3.3
Recl
assi
ficat
ion
ofga
ins
incl
uded
inne
tin
com
e(3
.5)
—(3
.5)
——
—(0
.9)
—(0
.9)
Pens
ion
and
Oth
erR
etir
emen
tBe
nefi
ts:
Am
orti
zati
onof
actu
aria
llos
ses
and
prio
rse
rvic
eco
sts
incl
uded
inne
tin
com
e8.
7(3
.3)
5.4
9.7
(3.7
)6.
013
.5(5
.2)
8.3
Net
actu
aria
lgai
nsan
dpr
ior
serv
ice
cost
s20
.9(8
.3)
12.6
0.3
(0.1
)0.
218
.5(7
.1)
11.4
Tota
lOth
erC
ompr
ehen
sive
Inco
me
(loss
)$
192.
4$
12.6
$20
5.0
$(4
1.6)
$(1
1.0)
$(5
2.6)
$(7
7.3)
$(2
7.0)
$(1
04.3
)
Com
preh
ensi
veIn
com
e1,
212.
722
3.2
845.
3
Less
:com
preh
ensi
vein
com
e(lo
ss)
attr
ibut
able
tono
ncon
trol
ling
inte
rest
s19
.4(1
8.0)
8.3
Co
mpr
ehen
sive
Inco
me
Att
ribu
tabl
eto
Mo
ody
’s$1
,193
.3$
241.
2$
837.
0
The
acco
mpa
nyin
gno
tes
are
anin
tegr
alpa
rtof
the
cons
olid
ated
finan
cial
stat
emen
ts.
MOODY’S 2017 10-K 65

MOODY’S CORPORATION
CONSOLIDATED BALANCE SHEETS(Amounts in millions, except share and per share data)
December 31,
2017 2016
ASSETS
Current assets:
Cash and cash equivalents $ 1,071.5 $ 2,051.5
Short-term investments 111.8 173.4
Accounts receivable, net of allowances of $36.6 in 2017 and $25.7 in 2016 1,147.2 887.4
Other current assets 250.1 140.8
Total current assets 2,580.6 3,253.1
Property and equipment, net 325.1 325.9
Goodwill 3,753.2 1,023.6
Intangible assets, net 1,631.6 296.4
Deferred tax assets, net 143.8 316.1
Other assets 159.9 112.2
Total assets $ 8,594.2 $ 5,327.3
LIABILITIES, NONCONTROLLING INTERESTS AND SHAREHOLDERS’ DEFICIT
Current liabilities:
Accounts payable and accrued liabilities $ 750.3 $ 1,444.3
Commercial paper 129.9 —
Current portion of long-term debt 299.5 300.0
Deferred revenue 883.6 683.9
Total current liabilities 2,063.3 2,428.2
Non-current portion of deferred revenue 140.0 134.1
Long-term debt 5,111.1 3,063.0
Deferred tax liabilities, net 341.6 104.3
Unrecognized tax benefits 389.1 199.8
Other liabilities 664.0 425.2
Total liabilities 8,709.1 6,354.6
Contingencies (Note 19) — —
Shareholders’ deficit:
Preferred stock, par value $.01 per share; 10,000,000 shares authorized; no shares issued andoutstanding — —
Series common stock, par value $.01 per share; 10,000,000 shares authorized; no shares issuedand outstanding — —
Common stock, par value $.01 per share; 1,000,000,000 shares authorized; 342,902,272 sharesissued At December 31, 2017 and December 31, 2016, respectively. 3.4 3.4
Capital surplus 528.6 477.2
Retained earnings 7,465.4 6,688.9
Treasury stock, at cost; 151,932,157 and 152,208,231 shares of common stock at December 31,2017 and December 31, 2016, respectively (8,152.9) (8,029.6)
Accumulated other comprehensive loss (172.2) (364.9)
Total Moody’s shareholders’ deficit (327.7) (1,225.0)
Noncontrolling interests 212.8 197.7
Total shareholders’ deficit (114.9) (1,027.3)
Total liabilities, noncontrolling interests and shareholders’ deficit $ 8,594.2 $ 5,327.3
The accompanying notes are an integral part of the consolidated financial statements.
66 MOODY’S 2017 10-K

MOODY’S CORPORATION
CONSOLIDATED STATEMENTS OF CASH FLOWS(Amounts in millions)
Year Ended December 31,
2017 2016 2015
Cash flows from operating activities
Net income $ 1,007.7 $ 275.8 $ 949.6
Reconciliation of net income to net cash provided by operatingactivities:
Depreciation and amortization 158.3 126.7 113.5
Stock-based compensation 122.9 98.1 87.2
CCXI Gain (59.7) — —
Purchase Price Hedge Gain (111.1) — —
FX gain relating to liquidation and sale of subsidiaries — (36.6) —
Deferred income taxes 88.3 (153.1) 18.1
Legacy Tax Matters — (1.6) (6.4)
Changes in assets and liabilities:
Accounts receivable (148.1) (104.8) (25.4)
Other current assets (70.3) 37.0 (28.9)
Other assets 12.1 6.6 (13.1)
Accounts payable and accrued liabilities (651.4) 908.7 51.4
Deferred revenue 72.9 74.9 31.6
Unrecognized tax benefits and other non-current tax liabilities 63.0 2.2 (10.9)
Other liabilities 262.9 25.3 31.4
Net cash provided by operating activities 747.5 1,259.2 1,198.1
Cash flows from investing activities
Capital additions (90.6) (115.2) (89.0)
Purchases of investments (170.1) (379.9) (688.2)
Sales and maturities of investments 238.5 699.5 653.1
Receipts from Purchase Price Hedge 111.1 — —
Cash paid for acquisitions, net of cash acquired and equity investments (3,511.0) (80.8) (7.6)
Receipts from settlements of net investment hedges 2.1 3.8 39.7
Payments for settlements of net investment hedges — (26.9) —
Cash received upon disposal of a subsidiary, net of cash transferred topurchaser — 1.5 —
Net cash (used in) provided by investing activities (3,420.0) 102.0 (92.0)
Cash flows from financing activities
Issuance of notes 2,291.9 — 852.8
Repayment of notes (300.0) — —
Issuance of commercial paper 1,837.1 — —
Repayment of commercial paper (1,707.2) — —
Proceeds from stock-based compensation plans 55.6 77.8 89.2
Repurchase of shares related to stock-based compensation (48.8) (44.4) (59.5)
Treasury shares (199.7) (738.8) (1,098.1)
Dividends (290.4) (285.1) (272.1)
Dividends to noncontrolling interests (3.2) (6.7) (6.8)
Payment for noncontrolling interest (8.5) (45.4) —
Contingent consideration — (0.2) (1.5)
Debt issuance costs and related fees (19.6) (0.1) (9.5)
Net cash provided by (used in) financing activities 1,607.2 (1,042.9) (505.5)
Effect of exchange rate changes on cash and cash equivalents 85.3 (24.2) (62.7)
(Decrease) Increase in cash and cash equivalents (980.0) 294.1 537.9
Cash and cash equivalents, beginning of period 2,051.5 1,757.4 1,219.5
Cash and cash equivalents, end of period $ 1,071.5 $ 2,051.5 $ 1,757.4
The accompanying notes are an integral part of the consolidated financial statements
MOODY’S 2017 10-K 67

MO
OD
Y’S
CO
RP
OR
AT
ION
CO
NSO
LID
AT
ED
STA
TE
ME
NT
SO
FSH
AR
EH
OL
DE
RS’
EQ
UIT
Y(D
EF
ICIT
)(A
mou
nts
inm
illio
ns)
Shar
eho
lder
s’o
fM
oo
dy’s
Co
rpo
rati
on
Co
mm
on
Sto
ckTr
easu
rySt
ock
Acc
umul
ated
Oth
erC
om
preh
ensi
veLo
ss
Tota
lMo
ody
’sSh
areh
old
ers’
Def
icit
No
n-C
ont
roll
ing
Inte
rest
s
Tota
lSh
areh
old
ers’
Equi
ty(D
efic
it)
Shar
esA
mo
unt
Cap
ital
Surp
lus
Ret
aine
dEa
rnin
gsSh
ares
Am
oun
t
Bala
nce
atD
ecem
ber
31,2
014
342.
9$
3.4
$38
3.9
$6,0
44.3
(138
.5)
$(6,
384.
2)$
(235
.2)$
(187
.8)$
230.
7$
42.9
Net
inco
me
941.
394
1.3
8.3
949.
6
Div
iden
ds(2
76.6
)(2
76.6
)(7
.0)
(283
.6)
Stoc
k-ba
sed
com
pens
atio
n87
.587
.587
.5
Shar
esis
sued
for
stoc
k-ba
sed
com
pens
atio
npl
ans
atav
erag
eco
st,n
et(6
3.5)
2.6
93.1
29.6
29.6
Net
exce
ssta
xbe
nefit
sup
onse
ttle
men
tof
stoc
k-ba
sed
com
pens
atio
naw
ards
43.4
43.4
43.4
Trea
sury
shar
esre
purc
hase
d(1
0.9)
(1,0
98.1
)(1
,098
.1)
(1,0
98.1
)
Cur
renc
ytr
ansl
atio
nad
just
men
t(n
etof
tax
of$1
4.7
mill
ion)
(125
.3)
(125
.3)
(125
.3)
Net
actu
aria
llos
ses
and
prio
rse
rvic
eco
st(n
etof
tax
of$7
.1m
illio
n)11
.411
.411
.4
Am
orti
zati
onof
prio
rse
rvic
eco
sts
and
actu
aria
llos
ses,
(net
ofta
xof
$5.2
mill
ion)
8.3
8.3
8.3
Net
unre
aliz
edga
inon
avai
labl
efo
rsa
lese
curi
ties
2.4
2.4
2.4
Net
real
ized
loss
onca
shflo
whe
dges
(1.1
)(1
.1)
(1.1
)
Bala
nce
atD
ecem
ber
31,2
015
342.
9$
3.4
$45
1.3
$6,7
09.0
(146
.8)
$(7,
389.
2)$
(339
.5)$
(565
.0)$
232.
0(3
33.0
)
The
acco
mpa
nyin
gno
tes
are
anin
tegr
alpa
rtof
the
cons
olid
ated
finan
cial
stat
emen
ts.
(con
tinu
edon
next
page
)
68 MOODY’S 2017 10-K

MO
OD
Y’S
CO
RP
OR
AT
ION
CO
NSO
LID
AT
ED
STA
TE
ME
NT
SO
FSH
AR
EH
OL
DE
RS’
EQ
UIT
Y(D
EF
ICIT
)co
ntin
ued
(Am
ount
sin
mill
ions
)
Shar
eho
lder
s’o
fM
oo
dy’s
Co
rpo
rati
on
Co
mm
on
Sto
ckTr
easu
rySt
ock
Acc
umul
ated
Oth
erC
om
preh
ensi
veLo
ss
Tota
lMo
ody
’sSh
areh
old
ers’
Def
icit
No
n-C
ont
roll
ing
Inte
rest
s
Tota
lSh
areh
old
ers’
Def
icit
Shar
esA
mo
unt
Cap
ital
Surp
lus
Ret
aine
dEa
rnin
gsSh
ares
Am
oun
t
Bala
nce
atD
ecem
ber
31,2
015
342.
9$
3.4
$45
1.3
$6,7
09.0
(146
.8)
$(7,
389.
2)$
(339
.5)$
(565
.0)$
232.
0$
(333
.0)
Net
inco
me
266.
626
6.6
9.2
275.
8
Div
iden
ds(2
86.7
)(2
86.7
)(6
.7)
(293
.4)
Stoc
k-ba
sed
com
pens
atio
n98
.498
.498
.4
Shar
esis
sued
for
stoc
k-ba
sed
com
pens
atio
npl
ans
atav
erag
eco
st,n
et(6
5.0)
2.3
98.4
33.4
33.4
Net
exce
ssta
xbe
nefit
sup
onse
ttle
men
tof
stoc
k-ba
sed
com
pens
atio
naw
ards
32.0
32.0
32.0
Purc
hase
ofno
ncon
trol
ling
inte
rest
(39.
5)(3
9.5)
(9.6
)(4
9.1)
Trea
sury
shar
esre
purc
hase
d(7
.7)
(738
.8)
(738
.8)
(738
.8)
Cur
renc
ytr
ansl
atio
nad
just
men
t(n
etof
tax
of$5
.4m
illio
n)(3
4.2)
(34.
2)(3
0.0)
(64.
2)
Net
actu
aria
llos
ses
and
prio
rse
rvic
eco
st(n
etof
tax
of$0
.1m
illio
n)0.
20.
20.
2
Am
orti
zati
onof
prio
rse
rvic
eco
sts
and
actu
aria
llos
ses,
(net
ofta
xof
$3.7
mill
ion)
6.0
6.0
6.0
Net
unre
aliz
edga
inon
avai
labl
efo
rsa
lese
curi
ties
(0.2
)(0
.2)
2.8
2.6
Net
real
ized
and
unre
aliz
edga
inon
cash
flow
hedg
es(n
etof
tax
of$1
.8m
illio
n)2.
82.
82.
8
Bala
nce
atD
ecem
ber
31,2
016
342.
9$
3.4
$47
7.2
$6,6
88.9
(152
.2)
$(8,
029.
6)$
(364
.9)$
(1,2
25.0
)$19
7.7
$(1
,027
.3)
The
acco
mpa
nyin
gno
tes
are
anin
tegr
alpa
rtof
the
cons
olid
ated
finan
cial
stat
emen
ts.
(con
tinu
edon
next
page
)
MOODY’S 2017 10-K 69

MO
OD
Y’S
CO
RP
OR
AT
ION
CO
NSO
LID
AT
ED
STA
TE
ME
NT
SO
FSH
AR
EH
OL
DE
RS’
EQ
UIT
Y(D
EF
ICIT
)co
ntin
ued
(Am
ount
sin
mill
ions
)
Shar
eho
lder
s’o
fM
oo
dy’s
Co
rpo
rati
on
Co
mm
on
Sto
ckTr
easu
rySt
ock
Acc
umul
ated
Oth
erC
om
preh
ensi
veLo
ss
Tota
lMo
ody
’sSh
areh
old
ers’
Def
icit
No
n-C
ont
roll
ing
Inte
rest
s
Tota
lSh
areh
old
ers’
Def
icit
Shar
esA
mo
unt
Cap
ital
Surp
lus
Ret
aine
dEa
rnin
gsSh
ares
Am
oun
t
Bala
nce
atD
ecem
ber
31,2
016
342.
9$
3.4
$47
7.2
$6,6
88.9
(152
.2)
$(8,
029.
6)$
(364
.9)$
(1,2
25.0
)$19
7.7
$(1
,027
.3)
Net
inco
me
1,00
0.6
1,00
0.6
7.1
1,00
7.7
Div
iden
ds(2
19.5
)(2
19.5
)(3
.3)
(222
.8)
Ado
ptio
nof
ASU
2016
-16
(See
Not
e15
)(4
.6)
(4.6
)(4
.6)
Stoc
k-ba
sed
com
pens
atio
n12
3.2
123.
212
3.2
Shar
esis
sued
for
stoc
k-ba
sed
com
pens
atio
npl
ans
atav
erag
eco
st,n
et(6
7.1)
1.9
76.4
9.3
9.3
Purc
hase
ofno
ncon
trol
ling
inte
rest
(4.7
)(4
.7)
(1.0
)(5
.7)
Trea
sury
shar
esre
purc
hase
d(1
.6)
(199
.7)
(199
.7)
(199
.7)
Cur
renc
ytr
ansl
atio
nad
just
men
t(n
etof
tax
of$2
3.1
mill
ion)
176.
317
6.3
13.0
189.
3
Net
actu
aria
llos
ses
and
prio
rse
rvic
eco
st(n
etof
tax
of$8
.3m
illio
n)12
.612
.612
.6
Am
orti
zati
onof
prio
rse
rvic
eco
sts
and
actu
aria
llos
ses,
(net
ofta
xof
$3.3
mill
ion)
5.4
5.4
5.4
Net
real
ized
and
unre
aliz
edga
inon
avai
labl
efo
rsa
lese
curi
ties
(0.8
)(0
.8)
(0.7
)(1
.5)
Net
real
ized
and
unre
aliz
edga
inon
cash
flow
hedg
es(n
etof
tax
of$1
.1m
illio
n)(0
.8)
(0.8
)(0
.8)
Bala
nce
atD
ecem
ber
31,2
017
342.
9$
3.4
$52
8.6
$7,4
65.4
(151
.9)
$(8,
152.
9)$
(172
.2)$
(327
.7)$
212.
8$
(114
.9)
The
acco
mpa
nyin
gno
tes
are
anin
tegr
alpa
rtof
the
cons
olid
ated
finan
cial
stat
emen
ts.
70 MOODY’S 2017 10-K

MOODY’S CORPORATION
NOTES TO CONSOLIDATED FINANCIAL STATEMENTS(tabular dollar and share amounts in millions, except per share data)
NOTE 1 DESCRIPTION OF BUSINESS AND BASIS OF PRESENTATION
Moody’s is a provider of (i) credit ratings; (ii) credit, capital markets and economic research, data and analytical tools; (iii) software sol-utions that support financial risk management activities; (iv) quantitatively derived credit scores; (v) financial services training andcertification services; (vi) offshore financial research and analytical services; and (vii) company information and business intelligenceproducts. Moody’s reports in two reportable segments: MIS and MA.
MIS, the credit rating agency, publishes credit ratings on a wide range of debt obligations and the entities that issue such obligations inmarkets worldwide. Revenue is primarily derived from the originators and issuers of such transactions who use MIS ratings in the dis-tribution of their debt issues to investors. Additionally, MIS earns revenue from certain non-ratings-related operations which consistprimarily of financial instrument pricing services in the Asia-Pacific region as well as revenue from ICRA’s non-ratings operations. Therevenue from these operations is included in the MIS Other LOB and is not material to the results of the MIS segment.
The MA segment develops a wide range of products and services that support financial analysis and risk management activities ofinstitutional participants in global financial markets. Within its RD&A business, MA distributes research and data developed by MIS aspart of its ratings process, including in-depth research on major debt issuers, industry studies and commentary on topical credit-relatedevents. The RD&A business also produces economic research and data and analytical tools such as quantitative credit risk scores as wellas business intelligence and company information products. Within its ERS business, MA provides software solutions as well as relatedrisk management services. The PS business provides offshore analytical and research services along with financial training and certifi-cation programs.
Certain reclassifications have been made to prior period amounts to conform to the current presentation.
Adoption of New Accounting StandardIn the first quarter of 2017, the Company adopted ASU No. 2016-09 “Improvements to Employee Share-Based Payment Accounting”.As required by ASU 2016-09, Excess Tax Benefits or shortfalls recognized on stock-based compensation are reflected in the con-solidated statement of operations as a component of the provision for income taxes on a prospective basis. Prior to the adoption of thisASU, Excess Tax Benefits and shortfalls were recorded to capital surplus within shareholders’ deficit. The impact of this adoption was a$39.5 million benefit to the provision for income taxes for the year end December 31, 2017.
Additionally, in accordance with this ASU, Excess Tax Benefits or shortfalls recognized on stock-based compensation are classified asoperating cash flows in the consolidated statement of cash flows, and the Company has applied this provision on a retrospective basis.Under previous accounting guidance, the Excess Tax Benefits or shortfalls were shown as a reduction to operating activity and anincrease to financing activity. Furthermore, the Company has elected to continue to estimate the number of stock-based awardsexpected to vest, rather than accounting for award forfeitures as they occur, to determine the amount of stock-based compensationcost recognized in each period. The impact to the Company’s statement of cash flows for prior year relating to the adoption of thisprovision of the ASU is set forth in the table below:
As reportedDecember 31, 2016 Reclassification
December 31, 2016as adjusted
As reportedDecember 31,
2015 ReclassificationDecember 31, 2015
as adjusted
Net cash provided byoperating activities $ 1,226.1 $ 33.1 $ 1,259.2 $ 1,153.6 $ 44.5 $ 1,198.1
Net cash used in financingactivities $ (1,009.8) $ (33.1) $ (1,042.9) $ (461.0) $ (44.5) $ (505.5)
NOTE 2 SUMMARY OF SIGNIFICANT ACCOUNTING POLICIES
Basis of ConsolidationThe consolidated financial statements include those of Moody’s Corporation and its majority- and wholly-owned subsidiaries. Theeffects of all intercompany transactions have been eliminated. Investments in companies for which the Company has significant influ-
MOODY’S 2017 10-K 71

ence over operating and financial policies but not a controlling interest are accounted for on an equity basis whereby the Companyrecords its proportional share of the investment’s net income or loss as part of other non-operating income (expense), net and anydividends received reduce the carrying amount of the investment. The Company applies the guidelines set forth in Topic 810 of the ASCin assessing its interests in variable interest entities to decide whether to consolidate that entity. The Company has reviewed thepotential variable interest entities and determined that there are no consolidation requirements under Topic 810 of the ASC. TheCompany consolidates its ICRA subsidiaries on a three month lag.
Cash and Cash EquivalentsCash equivalents principally consist of investments in money market mutual funds and money market deposit accounts as well as high-grade commercial paper and certificates of deposit with maturities of three months or less when purchased.
Short-term InvestmentsShort-term investments are securities with maturities greater than 90 days at the time of purchase that are available for operations inthe next 12 months. The Company’s short-term investments primarily consist of certificates of deposit and their cost approximates fairvalue due to the short-term nature of the instruments. Interest and dividends on these investments are recorded into income whenearned.
Property and EquipmentProperty and equipment are stated at cost and are depreciated using the straight-line method over their estimated useful lives.Expenditures for maintenance and repairs that do not extend the economic useful life of the related assets are charged to expense asincurred.
Research and Development CostsAll research and development costs are expensed as incurred. These costs primarily reflect the development of credit processing soft-ware and quantitative credit risk assessment products sold by the MA segment.
Research and development costs were $42.0 million, $40.1 million, and $29.1 million for the years ended December 31, 2017, 2016 and2015, respectively, and are included in operating expenses within the Company’s consolidated statements of operations. These costsgenerally consist of professional services provided by third parties and compensation costs of employees.
Costs for internally developed computer software that will be sold, leased or otherwise marketed are capitalized when technologicalfeasibility has been established. These costs primarily relate to the development or enhancement of products in the ERS business andgenerally consist of professional services provided by third parties and compensation costs of employees that develop the software.Judgment is required in determining when technological feasibility of a product is established and the Company believes that techno-logical feasibility for its software products is reached after all high-risk development issues have been resolved through coding and test-ing. Generally, this occurs shortly before the products are released to customers. Accordingly, costs for internally developed computersoftware that will be sold, leased or otherwise marketed that were eligible for capitalization under Topic 985 of the ASC were immate-rial for the years ended December 31, 2017, 2016 and 2015.
Computer Software Developed or Obtained for Internal UseThe Company capitalizes costs related to software developed or obtained for internal use. These assets, included in property and equip-ment in the consolidated balance sheets, relate to the Company’s financial, website and other systems. Such costs generally consist ofdirect costs for third-party license fees, professional services provided by third parties and employee compensation, in each caseincurred either during the application development stage or in connection with upgrades and enhancements that increase functionality.Such costs are depreciated over their estimated useful lives on a straight-line basis. Costs incurred during the preliminary project stageof development as well as maintenance costs are expensed as incurred.
Long-Lived Assets, Including Goodwill and Other Acquired Intangible AssetsMoody’s evaluates its goodwill for impairment at the reporting unit level, defined as an operating segment or one level below an operat-ing segment, annually as of July 31 or more frequently if impairment indicators arise in accordance with ASC Topic 350.
The Company evaluates the recoverability of goodwill using a two-step impairment test approach at the reporting unit level. In the firststep, the Company assesses various qualitative factors to determine whether the fair value of a reporting unit may be less than itscarrying amount. If a determination is made that, based on the qualitative factors, an impairment does not exist, the Company is notrequired to perform further testing. If the aforementioned qualitative assessment results in the Company concluding that it is morelikely than not that the fair value of a reporting unit may be less than its carrying amount, the fair value of the reporting unit will bedetermined and compared to its carrying value including goodwill. If the fair value of the reporting unit exceeds the carrying value ofthe net assets assigned to that unit, goodwill is not impaired and the Company is not required to perform further testing. If the fairvalue of the reporting unit is less than the carrying value, the Company will recognize the difference as an impairment charge.
The Company evaluates its reporting units for impairment on an annual basis, or more frequently if there are changes in the reportingstructure of the Company due to acquisitions or realignments or if there are indicators of potential impairment. For the reporting units
72 MOODY’S 2017 10-K

where the Company is consistently able to conclude that an impairment does not exist using only a qualitative approach, the Compa-ny’s accounting policy is to perform the second step of the aforementioned goodwill impairment assessment at least once every threeyears. Goodwill is assigned to a reporting unit at the date when an acquisition is integrated into one of the established reporting units,and is based on which reporting unit is expected to benefit from the synergies of the acquisition.
For purposes of assessing the recoverability of goodwill, the Company has seven primary reporting units at December 31, 2017: twowithin the Company’s ratings business (one for the ICRA business and one that encompasses all of Moody’s other ratings operations)and five reporting units within MA: RD&A, ERS, FSTC, MAKS and Bureau van Dijk. The RD&A reporting unit encompasses the dis-tribution of investor-oriented research and data developed by MIS as part of its ratings process, in-depth research on major debt issuers,industry studies, economic research and commentary on topical events and credit analytic tools. The ERS reporting unit consists ofcredit risk management and compliance software that is sold on a license or subscription basis as well as related advisory services forimplementation and maintenance. The FSTC reporting unit consists of the portion of the MA business that offers both credit training aswell as other professional development training and certification services. The MAKS reporting unit consists of offshore research andanalytical services. The Bureau van Dijk reporting unit consists of business intelligence and company information products.
Amortizable intangible assets are reviewed for recoverability whenever events or changes in circumstances indicate that the carryingamount may not be recoverable.
Rent ExpenseThe Company records rent expense on a straight-line basis over the life of the lease. In cases where there is a free rent period or futurefixed rent escalations the Company will record a deferred rent liability. Additionally, the receipt of any lease incentives will be recordedas a deferred rent liability which will be amortized over the lease term as a reduction of rent expense.
Stock-Based CompensationThe Company records compensation expense for all share-based payment award transactions granted to employees based on the fairvalue of the equity instrument at the time of grant. This includes shares issued under stock option and restricted stock plans. Theaccounting for Excess Tax Benefits or shortfalls on stock-based compensation is more fully discussed in Note 1.
Derivative Instruments and Hedging ActivitiesBased on the Company’s risk management policy, from time to time the Company may use derivative financial instruments to reduceexposure to changes in foreign exchange rates and interest rates. The Company does not enter into derivative financial instruments forspeculative purposes. All derivative financial instruments are recorded on the balance sheet at their respective fair values. The changesin the value of derivatives that qualify as fair value hedges are recorded with a corresponding adjustment to the carrying value of theitem being hedged. Changes in the derivative’s fair value that qualify as cash flow hedges are recorded to other comprehensive incomeor loss, to the extent the hedge is effective, and such amounts are reclassified from accumulated other comprehensive income or lossto earnings in the same period or periods during which the hedged transaction affects income. Changes in the derivative’s fair valuethat qualify as net investment hedges are recorded to other comprehensive income or loss, to the extent the hedge is effective. Anychanges in the fair value of derivatives that the Company does not designate as hedging instruments under Topic 815 of the ASC arerecorded in the consolidated statements of operations in the period in which they occur.
Revenue RecognitionRevenue is recognized when persuasive evidence of an arrangement exists, delivery has occurred or the services have been provided andaccepted by the customer when applicable, fees are determinable and the collection of resulting receivables is considered probable.
Pursuant to ASC Topic 605, when a sales arrangement contains multiple deliverables, the Company allocates revenue to each deliver-able based on its relative selling price which is determined based on its vendor specific objective evidence if available, third party evi-dence if VSOE is not available, or estimated selling price if neither VSOE nor TPE is available.
The Company’s products and services will generally qualify as separate units of accounting under ASC Topic 605. The Company eval-uates each deliverable in an arrangement to determine whether it represents a separate unit of accounting. A deliverable constitutes aseparate unit of accounting when it has stand-alone value to the customers and if the arrangement includes a customer refund orreturn right relative to the delivered item and the delivery and performance of the undelivered item is considered probable and sub-stantially in the Company’s control. In instances where the aforementioned criteria are not met, the deliverable is combined with theundelivered items and revenue recognition is determined as one single unit.
The Company determines whether its selling price in a multi-element transaction meets the VSOE criteria by using the price chargedfor a deliverable when sold separately or, if the deliverable is not yet being sold separately, the price established by management havingthe relevant authority to establish such a price. In instances where the Company is not able to establish VSOE for all deliverables in amultiple element arrangement, which may be due to the Company infrequently selling each element separately, not selling products
MOODY’S 2017 10-K 73

within a reasonably narrow price range, or only having a limited sales history, the Company attempts to establish TPE for deliverables.The Company determines whether TPE exists by evaluating largely similar and interchangeable competitor products or services instandalone sales to similarly situated customers. However, due to the difficulty in obtaining third party pricing, possible differences inits market strategy from that of its peers and the potential that products and services offered by the Company may contain a sig-nificant level of differentiation and/or customization such that the comparable pricing of products with similar functionality cannot beobtained, the Company generally is unable to reliably determine TPE. Based on the selling price hierarchy established by ASC Topic 605,when the Company is unable to establish selling price using VSOE or TPE, the Company will establish an ESP. ESP is the price at whichthe Company would transact a sale if the product or service were sold on a stand-alone basis. The Company establishes its best esti-mate of ESP considering internal factors relevant to is pricing practices such as costs and margin objectives, standalone sales prices ofsimilar products, percentage of the fee charged for a primary product or service relative to a related product or service, and customersegment and geography. Additional consideration is also given to market conditions such as competitor pricing strategies and markettrend. The Company reviews its determination of VSOE, TPE and ESP on an annual basis or more frequently as needed.
In the MIS segment, revenue attributed to initial ratings of issued securities is recognized when the rating is delivered to the issuer.Revenue attributed to monitoring of issuers or issued securities is recognized ratably over the period in which the monitoring is per-formed, generally one year. In the case of commercial mortgage-backed securities, structured credit, international residential mortgage-backed and asset-backed securities, issuers can elect to pay the monitoring fees upfront. These fees are deferred and recognized overthe future monitoring periods based on the expected lives of the rated securities, which was approximately 24 years on a weightedaverage basis at December 31, 2017. At December 31, 2017, 2016 and 2015, deferred revenue related to these securities was approx-imately $140.1 million, $133.0 million, and $121.0 million, respectively.
Multiple element revenue arrangements in the MIS segment are generally comprised of an initial rating and the related monitoring serv-ice. In instances where monitoring fees are not charged for the first year monitoring effort, fees are allocated to the initial rating andmonitoring services based on the relative selling price of each service to the total arrangement fees. The Company generally uses ESP indetermining the selling price for its initial ratings as the Company rarely provides initial ratings separately without providing relatedmonitoring services and thus is unable to establish VSOE or TPE for initial ratings.
MIS estimates revenue for ratings of commercial paper for which, in addition to a fixed annual monitoring fee, issuers are billed quar-terly based on amounts outstanding. Revenue is accrued each quarter based on estimated amounts outstanding and is billed whenactual data is available. The estimate is determined based on the issuers’ most recent reported quarterly data. At December 31, 2017,2016 and 2015, accounts receivable included approximately $27.0 million, $25.0 million, and $24.0 million, respectively, related toaccrued commercial paper revenue. Historically, MIS has not had material differences between the estimated revenue and the actualbillings. Furthermore, for certain annual monitoring services, fees are not invoiced until the end of the annual monitoring period andrevenue is accrued ratably over the monitoring period. At December 31, 2017, 2016, and 2015, accounts receivable included approx-imately $185.0 million, $159.1 million, and $146.4 million, respectively, relating to accrued annual monitoring service revenue.
In the MA segment, products and services offered by the Company include software licenses and related maintenance, subscriptions,and professional services. Revenue from subscription-based products, such as research and data subscriptions and certain software-based credit risk management subscription products, is recognized ratably over the related subscription period, which is principally oneyear. Revenue from sale of perpetual licenses of credit processing software is generally recognized at the time the product master orfirst copy is delivered or transferred to and accepted by the customer. If uncertainty exists regarding customer acceptance of the prod-uct or service, revenue is not recognized until acceptance occurs. Software maintenance revenue is recognized ratably over the annualmaintenance period. Revenue from professional services rendered is generally recognized as the services are performed. A large portionof annual research and data subscriptions and annual software maintenance are invoiced in the months of November, December andJanuary.
Products and services offered within the MA segment are sold either stand-alone or together in various combinations. In instanceswhere a multiple element arrangement includes software and non-software deliverables, revenue is allocated to the non-softwaredeliverables and to the software deliverables, as a group, using the relative selling prices of each of the deliverables in the arrangementbased on the aforementioned selling price hierarchy. Revenue is recognized for each element based upon the conditions for revenuerecognition noted above.
If the arrangement contains more than one software deliverable, the arrangement consideration allocated to the software deliverablesas a group is allocated to each software deliverable using VSOE. In the instances where the Company is not able to determine VSOE forall of the deliverables of an arrangement, the Company allocates the revenue to the undelivered elements equal to its VSOE and theresidual revenue to the delivered elements. If the Company is unable to determine VSOE for an undelivered element, the Companydefers all revenue allocated to the software deliverables until the Company has delivered all of the elements or when VSOE has beendetermined for the undelivered elements. In cases where software implementation services are considered essential and VSOE of fairvalue exists for post-contract customer support (“PCS”), once the delivery criteria has been met on the standard software, license andservice revenue is recognized on a percentage-of-completion basis as implementation services are performed, while PCS is recognized
74 MOODY’S 2017 10-K

over the coverage period. If VSOE of fair value does not exist for PCS, once the delivery criteria has been met on the standard software,service revenue is recognized on a zero profit margin basis until essential services are complete, at which point total remainingarrangement revenue is then spread ratably over the remaining PCS coverage period. If VSOE does not exist for PCS at the beginning ofan arrangement but is established during implementation, revenue not recognized due to the absence of VSOE will be recognized on acumulative basis.
Accounts Receivable AllowancesMoody’s records an allowance for estimated future adjustments to customer billings as a reduction of revenue, based on historicalexperience and current conditions. Such amounts are reflected as additions to the accounts receivable allowance. Additionally, esti-mates of uncollectible accounts are recorded as bad debt expense and are reflected as additions to the accounts receivable allowance.Actual billing adjustments and uncollectible account write-offs are recorded against the allowance. Moody’s evaluates its accountsreceivable allowance by reviewing and assessing historical collection and adjustment experience and the current status of customeraccounts. Moody’s also considers the economic environment of the customers, both from an industry and geographic perspective, inevaluating the need for allowances. Based on its analysis, Moody’s adjusts its allowance as considered appropriate in the circumstances.
ContingenciesMoody’s is involved in legal and tax proceedings, governmental, regulatory and legislative investigations and inquiries, claims and liti-gation that are incidental to the Company’s business, including claims based on ratings assigned by MIS. Moody’s is also subject toongoing tax audits in the normal course of business. Management periodically assesses the Company’s liabilities and contingencies inconnection with these matters based upon the latest information available. Moody’s discloses material pending legal proceedings pur-suant to SEC rules and other pending matters as it may determine to be appropriate.
For claims, litigation and proceedings and governmental investigations and inquires not related to income taxes, where it is both prob-able that a liability has been incurred and the amount of loss can be reasonably estimated, the Company records liabilities in the con-solidated financial statements and periodically adjusts these as appropriate. When the reasonable estimate of the loss is within a rangeof amounts, the minimum amount of the range is accrued unless some higher amount within the range is a better estimate thananother amount within the range. In other instances, where a loss is reasonably possible, management may not record a liabilitybecause of uncertainties related to the probable outcome and/or the amount or range of loss, but discloses the contingency if sig-nificant. As additional information becomes available, the Company adjusts its assessments and estimates of such matters accordingly.In view of the inherent difficulty of predicting the outcome of litigation, regulatory, governmental investigations and inquiries,enforcement and similar matters, particularly where the claimants seek large or indeterminate damages or where the parties assertnovel legal theories or the matters involve a large number of parties, the Company cannot predict what the eventual outcome of thepending matters will be or the timing of any resolution of such matters. The Company also cannot predict the impact (if any) that anysuch matters may have on how its business is conducted, on its competitive position or on its financial position, results of operations orcash flows. As the process to resolve any pending matters progresses, management will continue to review the latest information avail-able and assess its ability to predict the outcome of such matters and the effects, if any, on its operations and financial con-dition. However, in light of the large or indeterminate damages sought in some of them, the absence of similar court rulings on thetheories of law asserted and uncertainties regarding apportionment of any potential damages, an estimate of the range of possiblelosses cannot be made at this time.
The Company’s wholly-owned insurance subsidiary insures the Company against certain risks including but not limited to deductiblesfor worker’s compensation, employment practices litigation and employee medical claims and terrorism, for which the claims are notmaterial to the Company. In addition, for claim years 2008 and 2009, the insurance subsidiary insured the Company for defense costsrelated to professional liability claims. For matters insured by the Company’s insurance subsidiary, Moody’s records liabilities based onthe estimated total claims expected to be paid and total projected costs to defend a claim through its anticipated conclusion. TheCompany determines liabilities based on an assessment of management’s best estimate of claims to be paid and legal defense costs aswell as actuarially determined estimates. Defense costs for matters not self-insured by the Company’s wholly-owned insurance sub-sidiary are expensed as services are provided.
For income tax matters, the Company employs the prescribed methodology of Topic 740 of the ASC which requires a company to firstdetermine whether it is more-likely-than-not (defined as a likelihood of more than fifty percent) that a tax position will be sustainedbased on its technical merits as of the reporting date, assuming that taxing authorities will examine the position and have full knowl-edge of all relevant information. A tax position that meets this more-likely-than-not threshold is then measured and recognized at thelargest amount of benefit that is greater than fifty percent likely to be realized upon effective settlement with a taxing authority.
Operating ExpensesOperating expenses include costs associated with the development and production of the Company’s products and services and theirdelivery to customers. These expenses principally include employee compensation and benefits and travel costs that are incurred in
MOODY’S 2017 10-K 75

connection with these activities. Operating expenses are charged to income as incurred, except for certain costs related to softwareimplementation services which may be deferred until related revenue is recognized. Additionally, certain costs incurred to developinternal use software are capitalized and depreciated over their estimated useful life.
Selling, General and Administrative ExpensesSG&A expenses include such items as compensation and benefits for corporate officers and staff and compensation and other expensesrelated to sales. They also include items such as office rent, business insurance, professional fees and gains and losses from sales anddisposals of assets. SG&A expenses are charged to income as incurred, except for certain expenses incurred to develop internal usesoftware (which are capitalized and depreciated over their estimated useful life) and the deferral of sales commissions in the MA seg-ment (which are recognized in the period in which the related revenue is recognized).
Foreign Currency TranslationFor all operations outside the U.S. where the Company has designated the local currency as the functional currency, assets andliabilities are translated into U.S. dollars using end of year exchange rates, and revenue and expenses are translated using averageexchange rates for the year. For these foreign operations, currency translation adjustments are recorded to other comprehensiveincome.
Comprehensive IncomeComprehensive income represents the change in net assets of a business enterprise during a period due to transactions and otherevents and circumstances from non-owner sources including foreign currency translation impacts, net actuarial losses and net priorservice costs related to pension and other retirement plans, gains and losses on derivative instruments designated as net investmenthedges or cash flow hedges and unrealized gains and losses on securities designated as ‘available-for-sale’ under Topic 320 of the ASC.Comprehensive income items, including cumulative translation adjustments of entities that are less-than-wholly-owned subsidiaries,will be reclassified to noncontrolling interests and thereby, adjusting accumulated other comprehensive income proportionately inaccordance with the percentage of ownership interest of the NCI shareholder.
Income TaxesThe Company accounts for income taxes under the asset and liability method in accordance with ASC Topic 740. Therefore, income taxexpense is based on reported income before income taxes and deferred income taxes reflect the effect of temporary differencesbetween the amounts of assets and liabilities that are recognized for financial reporting purposes and the amounts that are recognizedfor income tax purposes. On January 1, 2017, the Company adopted ASU No. 2016-16, “ Accounting for Income Taxes, Intra-EntityAsset Transfers of Assets Other than Inventory. Under previous guidance, the tax effects of intra-entity asset transfers (intercompanysales) were deferred until the transferred asset was sold to a third party or otherwise recovered through use. The new guidance elimi-nates the exception for all intra-entity sales of assets other than inventory. Upon adoption, a $4.6 million cumulative-effect adjustmentwas recorded in retained earnings as of the beginning of the period of adoption.
The Company classifies interest related to unrecognized tax benefits as a component of interest expense in its consolidated statementsof operations. Penalties are recognized in other non-operating expenses. For uncertain tax positions (“UTPs”), the Company firstdetermines whether it is more-likely-than-not (defined as a likelihood of more than fifty percent) that a tax position will be sustainedbased on its technical merits as of the reporting date, assuming that taxing authorities will examine the position and have full knowl-edge of all relevant information. A tax position that meets this more-likely-than-not threshold is then measured and recognized at thelargest amount of benefit that is greater than fifty percent likely to be realized upon effective settlement with a taxing authority.
On December 22, 2017, the Tax Act was signed into law, resulting in all previously undistributed foreign earnings being subject to U.S.tax. However, the Company currently intends to continue to indefinitely reinvest these earnings outside the U.S. The Company has notprovided non-U.S. deferred income taxes on these indefinitely reinvested earnings. It is not practicable to determine the amount ofnon-U.S. deferred taxes that might be required to be provided if such earnings were distributed in the future, due to complexities in thetax laws and in the hypothetical calculations that would have to be made.
Fair Value of Financial InstrumentsThe Company’s financial instruments include cash, cash equivalents, trade receivables and payables, all of which are short-term innature and, accordingly, approximate fair value. Additionally, the Company invests in certain short-term investments consisting primar-ily of certificates of deposit that are carried at cost, which approximates fair value due to their short-term maturities.
The Company also has certain investments in closed-ended and open-ended mutual funds in India which are designated as ‘availablefor sale’ under Topic 320 of the ASC. Accordingly, unrealized gains and losses on these investments are recorded to other compre-hensive income and are reclassified out of accumulated other comprehensive income to the statement of operations when the invest-ment matures or is sold using a specific identification method.
Also, the Company uses derivative instruments, as further described in Note 5, to manage certain financial exposures that occur in thenormal course of business. These derivative instruments are carried at fair value on the Company’s consolidated balance sheets.
76 MOODY’S 2017 10-K

Fair value is defined by the ASC as the price that would be received from selling an asset or paid to transfer a liability (i.e., an exit price)in an orderly transaction between market participants at the measurement date. The determination of this fair value is based on theprincipal or most advantageous market in which the Company could commence transactions and considers assumptions that marketparticipants would use when pricing the asset or liability, such as inherent risk, transfer restrictions and risk of nonperformance. Also,determination of fair value assumes that market participants will consider the highest and best use of the asset.
The ASC establishes a fair value hierarchy whereby the inputs contained in valuation techniques used to measure fair value are catego-rized into three broad levels as follows:
Level 1: quoted market prices in active markets that the reporting entity has the ability to access at the date of the fair value measure-ment;
Level 2: inputs other than quoted market prices described in Level 1 that are observable for the asset or liability, either directly orindirectly, such as quoted prices in active markets for similar assets or liabilities, quoted prices for identical or similar assets or liabilitiesin markets that are not active or other inputs that are observable or can be corroborated by observable market data for substantiallythe full term of the assets or liabilities;
Level 3: unobservable inputs that are supported by little or no market activity and that are significant to the fair value measurement ofthe assets or liabilities.
Concentration of Credit RiskFinancial instruments that potentially subject the Company to concentration of credit risk principally consist of cash and cash equiv-alents, short-term investments, trade receivables and derivatives.
The Company manages its credit risk exposure by allocating its cash equivalents among various money market mutual funds, moneymarket deposit accounts, certificates of deposits and high-grade commercial paper. Short-term investments primarily consist of certifi-cates of deposit as of December 31, 2017 and 2016. The Company manages its credit risk exposure on cash equivalents and short-terminvestments by limiting the amount it can invest with any single entity. No customer accounted for 10% or more of accounts receiv-able at December 31, 2017 or 2016.
Earnings (Loss) per Share of Common StockBasic shares outstanding is calculated based on the weighted average number of shares of common stock outstanding during the report-ing period. Diluted shares outstanding is calculated giving effect to all potentially dilutive common shares, assuming that such shareswere outstanding and dilutive during the reporting period.
Pension and Other Retirement BenefitsMoody’s maintains various noncontributory DBPPs as well as other contributory and noncontributory retirement plans. The expenseand assets/liabilities that the Company reports for its pension and other retirement benefits are dependent on many assumptions con-cerning the outcome of future events and circumstances. These assumptions represent the Company’s best estimates and may vary byplan. The differences between the assumptions for the expected long-term rate of return on plan assets and actual experience is spreadover a five-year period to the market-related value of plan assets which is used in determining the expected return on assets compo-nent of annual pension expense. All other actuarial gains and losses are generally deferred and amortized over the estimated averagefuture working life of active plan participants.
The Company recognizes as an asset or liability in its consolidated balance sheet the funded status of its defined benefit retirementplans, measured on a plan-by-plan basis. Changes in the funded status due to actuarial gains/losses are recorded as part of other com-prehensive income during the period the changes occur.
Use of EstimatesThe preparation of financial statements in conformity with GAAP requires management to make estimates and assumptions that affectthe reported amounts of assets and liabilities, the disclosure of contingent assets and liabilities at the date of the financial statements,and the reported amounts of revenue and expenses during the period. Actual results could differ from those estimates. Estimates areused for, but not limited to, revenue recognition, accounts receivable allowances, income taxes, contingencies, valuation and usefullives of long-lived and intangible assets, goodwill, pension and other retirement benefits, stock-based compensation, and depreciablelives for property and equipment and computer software.
Recently Issued Accounting PronouncementsIn May 2014, the FASB issued ASU No. 2014-09, “Revenue from Contracts with Customers (Topic 606)”. This ASU outlines a compre-hensive new revenue recognition model that requires a company to recognize revenue to depict the transfer of goods or services to acustomer at an amount that reflects the consideration it expects to receive in exchange for those goods or services by performing afive-step process. In August 2015, the FASB issued ASU No. 2015-14 “Revenue from Contracts with Customers (Topic 606), Deferral of
MOODY’S 2017 10-K 77

the Effective Date” which defers the effective date of the ASU for annual and interim reporting periods beginning after December 15,2017, with early adoption permitted up to the original effective date of December 15, 2016. In addition, during 2016, the FASB issuedadditional updates clarifying the implementation guidance for the new revenue recognition standard.
The Company will adopt the new revenue guidance as of January 1, 2018 using the modified retrospective transition method. Underthis adoption method, the Company will record a cumulative adjustment to retained earnings at January 1, 2018 and apply the provi-sions of the ASU prospectively. As of the date of this filing, the Company has made a full assessment of the changes to its accountingpolicies relating to the adoption of the new revenue accounting standard. This ASU will have an impact on, which is not limited to: i)the accounting for certain software subscription revenue in MA whereby the license rights within the arrangement will be recognized atthe inception of the contract based on estimated stand-alone selling price with the remainder recognized over the subscription period(compared to ASC 605 whereby all software subscription revenue is currently recognized over the subscription period); ii) the account-ing for certain ERS and ESA revenue arrangements where VSOE is not currently available under ASC 605 will result in the accelerationof revenue recognition (compared to ASC 605 whereby revenue is currently deferred due to lack of VSOE until all elements withoutVSOE have been delivered); iii) the capitalization and related amortization period for sales commissions, which are incurred in the MAsegment; iv) the expensing of software implementation project costs to fulfill a contract for its ERS and ESA businesses which underASC 605 were capitalized and expensed when related project revenue was recognized; v) the capitalization of work-in-process costsfor in-progress MIS ratings at the end of each reporting period; and vi) the timing of when fees for certain MIS ratings products arerecognized to match when the performance obligation to the customer is satisfied and the determination of the transaction price toaccount for variable consideration at contract inception. This ASU will also require new comprehensive disclosures about contracts withcustomers including the significant reasonable judgments the Company has made when applying the ASU.
The Company is in the process of finalizing the implementation of a software solution in order to support the accounting under the newstandard for MA revenue arrangements with multiple performance obligations.
Under this adoption method, the Company will record a cumulative non-cash adjustment to retained earnings at January 1, 2018 andapply the provisions of the ASU prospectively. The table below reflects an approximation of anticipated impacts to January 1, 2018retained earnings for each type of adjustment required under the new revenue standard based on the Company’s assessment and bestestimates to date.
Transition adjustment Estimated benefit to / (reduction of) January 1, 2018 Retained Earnings
Recognition of MA deferred revenue (1) Approximately $105 millionIncrease to capitalized MA sales commissions (2) Approximately $76 millionCapitalization of work-in-process for in-progress ratings Approximately $9 millionNet impact of all other adjustments Approximately $4 millionNet increase in tax liability on the above (Approximately $45 million)Total anticipated post-tax adjustment Approximately $149 million
(1) Represents anticipated deferred revenue as of December 31, 2017 that would have been recognized as revenue in 2017 or earlier if the new standard wasthen in effect. The transition adjustment will continue to be refined as the Company finalizes its implementation of the aforementioned software solution.
(2) Pending finalization of the final fourth quarter MA sales commission payout to be made during the first quarter.
Note that the above range of expected impacts from adopting the new revenue standard pertains solely to the impact to retained earn-ings as of January 1, 2018 on the Company’s consolidated balance sheet, and is not indicative of the impact the new ASU is expectedto have on the Company’s consolidated statement of operations post-adoption. The impact that the provisions of the new ASU willhave on the consolidated statement of operations subsequent to adoption will depend heavily on the volume and impact of new salescontracts realized in future periods, particularly in the ERS and ESA businesses. The Company does not have any material softwareimplementation arrangements in progress as of December 31, 2017 with terms longer than two years, and therefore the impact to theconsolidated statement of operations under the provisions of the new standard will be dependent on each future period’s sales activity.Generally, however, the Company does not anticipate that applying the provisions of the new standard will have a material impact toits 2018 consolidated Net Income. However, there could be quarterly fluctuations in the financial results of both MIS and MA, or therecould be increases or decreases in revenues and expenses which would largely offset and not be material at a total Company level forthe full year. Furthermore, as part of the disclosure requirements in the first year of adoption, there will be disclosures of the Company’sconsolidated statement of operations for 2018 as if the new revenue standard was not adopted and the Company continued toaccount for revenue and related transactions under the existing standards. Importantly, the application of this new guidance has noeffect on the cash the Company expects to receive nor on the economics of the business, but rather affects the timing of revenue andexpense recognition with the expectation that revenue recognition will more closely align with cash received.
In January 2016, the FASB issued ASU No. 2016-01 “Financial Instruments—Overall (Subtopic 825-10), Recognition and Measurementof Financial Assets and Financial Liabilities”. The amendments in this ASU update various aspects of recognition, measurement, pre-sentation and disclosures relating to financial instruments. This ASU is effective for fiscal years beginning after December 15, 2017. The
78 MOODY’S 2017 10-K
Company has determined that the most pertinent impact to its financial statements upon the adoption of this ASU will relate to thediscontinuance of the available-for-sale classification for investments in equity securities (unrealized gains and losses were recordedthrough OCI). Accordingly, subsequent to adoption of this ASU, changes in the fair value of equity securities held by the Company willbe recorded through earnings. The Company does not expect the adoption of this ASU to have a material impact on its financialstatements.
In February 2016, the FASB issued ASU No. 2016-02, “Leases (Topic 842)” requiring lessees to recognize a right-of-use asset and leaseliability for all leases with terms of more than 12 months. Recognition, measurement and presentation of expenses and cash flows willdepend on classification as either a finance or operating lease. This ASU is effective for fiscal years beginning after December 15, 2018,with early adoption permitted. This standard must be adopted using a modified retrospective approach whereby leases will be pre-sented in accordance with the new standard as of the earliest period presented. The Company is currently evaluating the impact of thisASU on the Company’s financial statements. The Company believes that the most notable impact to its financial statements upon theadoption of this ASU will be the recognition of a material right-of-use asset and lease liability for its real estate leases.
In June 2016, the FASB issued ASU No. 2016-13, “Financial Instruments—Credit Losses (Topic 326), Measurement of Credit Losses onFinancial Instruments”. The amendments in this ASU require the use of an “expected credit loss” impairment model for most financialassets reported at amortized cost which will require entities to estimate expected credit losses over the lifetime of the instrument. Thismay result in the earlier recognition of allowances for losses. For available-for-sale debt securities with unrealized losses, an allowancefor credit losses will be recognized as a contra account to the amortized cost carrying value of the asset rather than a direct reductionto the carrying value, with changes in the allowance impacting earnings. This ASU is effective for annual and interim reporting periodsbeginning after December 15, 2019, with early adoption permitted in annual and interim reporting periods beginning afterDecember 15, 2018. Entities will apply the standard’s provisions as a cumulative-effect adjustment to retained earnings as of thebeginning of the first effective reporting period. The Company is currently evaluating the impact of this ASU on its financial statements.Currently, the Company believes that the most notable impact of this ASU will relate to its processes around the assessment of theadequacy of its allowance for doubtful accounts on accounts receivable.
In August 2016, the FASB issued ASU No. 2016-15, “Statement of Cash Flows (Topic 230), Classification of Certain Cash Receipts andCash Payments”. This ASU adds or clarifies guidance on the classification of certain cash receipts and payments in the statement ofcash flows with the intent to alleviate diversity in practice for classifying various types of cash flows. This ASU is effective for annualand interim reporting periods beginning after December 15, 2017. The Company will apply this clarification guidance in its statementsof cash flows upon adoption.
In January 2017, the FASB issued ASU No. 2017-01, “Business Combinations (Topic 805), Clarifying the Definition of a Business”. ThisASU clarifies the definition of a business with the objective of adding guidance to assist entities with evaluating whether transactionsshould be accounted for as acquisitions (or disposals) of assets or businesses. This ASU is effective for annual and interim reportingperiods beginning after December 15, 2017 and should be applied prospectively. Upon adoption, the Company will apply the guidancein this ASU when evaluating whether acquired assets and activities constitute a business.
In March 2017, the FASB issued ASU No. 2017-07, “Compensation—Retirement Benefits (Topic 715), Improving the Presentation ofNet Periodic Pension Cost and Net Periodic Postretirement Benefit Cost”. This ASU impacts the presentation of net periodic pensioncosts in the statement of operations. Entities will be required to report the service cost component in the same line item or items asother compensation costs (either Operating or SG&A in Moody’s statement of operations). The other components of net benefit costare required to be presented in the statement of operations separately from the service cost component and outside of operatingincome. The ASU permits only the service cost component of net periodic pension cost to be eligible for capitalization, when applicable.This ASU is effective for annual and interim reporting periods beginning after December 15, 2017. Upon adoption, the Company willbifurcate its net periodic pension costs reported in its statements of operations in accordance with this ASU.
In May 2017, the FASB issued ASU No. 2017-09, “Compensation—Stock Compensation (Topic 718), Scope of ModificationAccounting”. This ASU clarifies when changes to the terms or conditions of a share-based payment award must be accounted for asmodifications. Under this ASU, an entity will not apply modification accounting to a share-based payment award if the award’s fairvalue, vesting conditions and classification as an equity or liability instrument are the same immediately before and after the change.The new guidance will reduce diversity in practice and result in fewer changes to the terms of an award being accounted for as mod-ifications. This ASU is effective for annual and interim reporting periods beginning after December 15, 2017 and should be applied pro-spectively to awards modified on or after the adoption date. The Company does not expect the adoption of this ASU to have a materialimpact on its financial statements.
In July 2017, the FASB issued ASU No. 2017-12, “Derivatives and Hedging (Topic 815): Targeted Improvements to Accounting for Hedg-ing Activities”. This ASU enables entities to enhance transparency relating to risk management activities and simplifies the applicationof hedge accounting in certain circumstances. This ASU is effective for fiscal years beginning after December 15, 2018, including interim
MOODY’S 2017 10-K 79
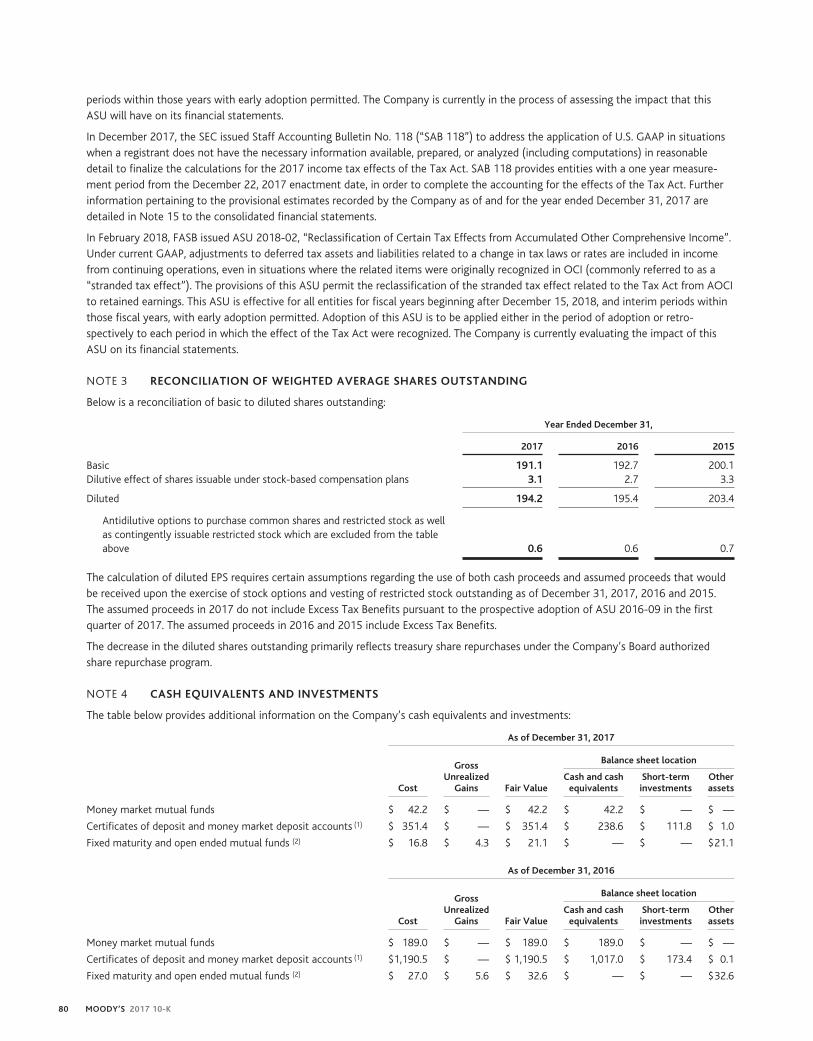
periods within those years with early adoption permitted. The Company is currently in the process of assessing the impact that thisASU will have on its financial statements.
In December 2017, the SEC issued Staff Accounting Bulletin No. 118 (“SAB 118”) to address the application of U.S. GAAP in situationswhen a registrant does not have the necessary information available, prepared, or analyzed (including computations) in reasonabledetail to finalize the calculations for the 2017 income tax effects of the Tax Act. SAB 118 provides entities with a one year measure-ment period from the December 22, 2017 enactment date, in order to complete the accounting for the effects of the Tax Act. Furtherinformation pertaining to the provisional estimates recorded by the Company as of and for the year ended December 31, 2017 aredetailed in Note 15 to the consolidated financial statements.
In February 2018, FASB issued ASU 2018-02, “Reclassification of Certain Tax Effects from Accumulated Other Comprehensive Income”.Under current GAAP, adjustments to deferred tax assets and liabilities related to a change in tax laws or rates are included in incomefrom continuing operations, even in situations where the related items were originally recognized in OCI (commonly referred to as a“stranded tax effect”). The provisions of this ASU permit the reclassification of the stranded tax effect related to the Tax Act from AOCIto retained earnings. This ASU is effective for all entities for fiscal years beginning after December 15, 2018, and interim periods withinthose fiscal years, with early adoption permitted. Adoption of this ASU is to be applied either in the period of adoption or retro-spectively to each period in which the effect of the Tax Act were recognized. The Company is currently evaluating the impact of thisASU on its financial statements.
NOTE 3 RECONCILIATION OF WEIGHTED AVERAGE SHARES OUTSTANDING
Below is a reconciliation of basic to diluted shares outstanding:
Year Ended December 31,
2017 2016 2015
Basic 191.1 192.7 200.1Dilutive effect of shares issuable under stock-based compensation plans 3.1 2.7 3.3
Diluted 194.2 195.4 203.4
Antidilutive options to purchase common shares and restricted stock as wellas contingently issuable restricted stock which are excluded from the tableabove 0.6 0.6 0.7
The calculation of diluted EPS requires certain assumptions regarding the use of both cash proceeds and assumed proceeds that wouldbe received upon the exercise of stock options and vesting of restricted stock outstanding as of December 31, 2017, 2016 and 2015.The assumed proceeds in 2017 do not include Excess Tax Benefits pursuant to the prospective adoption of ASU 2016-09 in the firstquarter of 2017. The assumed proceeds in 2016 and 2015 include Excess Tax Benefits.
The decrease in the diluted shares outstanding primarily reflects treasury share repurchases under the Company’s Board authorizedshare repurchase program.
NOTE 4 CASH EQUIVALENTS AND INVESTMENTS
The table below provides additional information on the Company’s cash equivalents and investments:
As of December 31, 2017
Cost
GrossUnrealized
Gains Fair Value
Balance sheet location
Cash and cashequivalents
Short-terminvestments
Otherassets
Money market mutual funds $ 42.2 $ — $ 42.2 $ 42.2 $ — $ —
Certificates of deposit and money market deposit accounts (1) $ 351.4 $ — $ 351.4 $ 238.6 $ 111.8 $ 1.0
Fixed maturity and open ended mutual funds (2) $ 16.8 $ 4.3 $ 21.1 $ — $ — $21.1
As of December 31, 2016
Cost
GrossUnrealized
Gains Fair Value
Balance sheet location
Cash and cashequivalents
Short-terminvestments
Otherassets
Money market mutual funds $ 189.0 $ — $ 189.0 $ 189.0 $ — $ —
Certificates of deposit and money market deposit accounts (1) $1,190.5 $ — $ 1,190.5 $ 1,017.0 $ 173.4 $ 0.1
Fixed maturity and open ended mutual funds (2) $ 27.0 $ 5.6 $ 32.6 $ — $ — $32.6
80 MOODY’S 2017 10-K

(1) Consists of time deposits and money market deposit accounts. The remaining contractual maturities for the certificates of deposits classified as short-terminvestments were one to 12 months at December 31, 2017 and at December 31, 2016. The remaining contractual maturities for the certificates of depositsclassified in other assets are 15 to 48 months at December 31, 2017 and 13 months to 15 months at December 31, 2016. Time deposits with a maturity ofless than 90 days at time of purchase are classified as cash and cash equivalents.
(2) Consists of investments in fixed maturity mutual funds and open-ended mutual funds. The remaining contractual maturities for the fixed maturityinstruments range from six months to seven months and six months to 19 months at December 31, 2017 and December 31,2016 respectively.
The money market mutual funds as well as the fixed maturity and open ended mutual funds in the table above are deemed to be ‘avail-able for sale’ under ASC Topic 320 and the fair value of these instruments is determined using Level 1 inputs as defined in the ASC.
NOTE 5 DERIVATIVE INSTRUMENTS AND HEDGING ACTIVITIES
The Company is exposed to global market risks, including risks from changes in FX rates and changes in interest rates. Accordingly, theCompany uses derivatives in certain instances to manage the aforementioned financial exposures that occur in the normal course ofbusiness. The Company does not hold or issue derivatives for speculative purposes.
Derivatives and non-derivative instruments designated as accounting hedges:
Interest Rate SwapsThe Company has entered into interest rate swaps to convert the fixed interest rate on certain of its long-term debt to a floating inter-est rate based on the 3-month LIBOR. The purpose of these hedges is to mitigate the risk associated with changes in the fair value ofthe long-term debt, thus the Company has designated these swaps as fair value hedges. The fair value of the swaps is adjusted quarterlywith a corresponding adjustment to the carrying value of the debt. The changes in the fair value of the swaps and the underlyinghedged item generally offset and the net cash settlements on the swaps are recorded each period within interest expense, net in theCompany’s consolidated statement of operations.
The following table summarizes the Company’s interest rate swaps designated as fair value hedges:
Nature of Swap
Notional AmountAs of December 31,
Floating Interest RateHedged Item 2017 2016
2010 Senior Notes due 2020 Pay Floating/Receive Fixed $500.0 $500.0 3-month LIBOR
2014 Senior Notes due 2019 Pay Floating/Receive Fixed $450.0 $450.0 3-month LIBOR
2012 Senior Notes due 2022 Pay Floating/Receive Fixed $80.0 $80.0 3-month LIBOR
The following table summarizes the impact to the statement of operations of the Company’s interest rate swaps designated as fairvalue hedges:
Amount of IncomeRecognized in the Consolidated
Statements of Operations
Year Ended December 31,
2017 2016 2015
Derivatives Designated as Fair ValueAccounting Hedges
Location on Consolidated Statement ofOperations
Interest rate swaps Interest expense, net $ 6.7 $ 11.2 $ 15.2
Cross-currency swapsIn conjunction with the issuance of the 2015 Senior Notes, the Company entered into a cross-currency swap to exchange €100 millionfor U.S. dollars on the date of the settlement of the notes. The purpose of this cross-currency swap was to mitigate FX risk on theremaining principal balance on the 2015 Senior Notes that initially was not designated as a net investment hedge. Under the terms ofthe swap, the Company paid the counterparty interest on the $110.5 million received at 3.945% per annum and the counterparty paidthe Company interest on the €100 million paid at 1.75% per annum. These interest payments were settled in March of each year,beginning in 2016, until either the maturity of the cross-currency swap in 2027 or upon early termination at the discretion of theCompany. The principal payments on this cross currency swap were to be settled in 2027, concurrent with the repayment of the 2015Senior Notes at maturity or upon early termination at the discretion of the Company. In March 2016, the Company designated thesecross-currency swaps as cash flow hedges. Accordingly, changes in fair value subsequent to the date the swaps were designated as cashflow hedges were recognized in OCI. Gains and losses on the swaps initially recognized in OCI were reclassified to the statement ofoperations in the period in which changes in the underlying hedged item affects net income. On December 18, 2017, the Companyterminated the cross-currency swap and designated the full €500 million principal of the 2015 Senior Notes as a net investment hedgeas discussed below.
MOODY’S 2017 10-K 81

Net Investment HedgesThe Company had entered into foreign currency forward contracts that were designated as net investment hedges which were dis-continued during 2017. Additionally, the Company has designated €500 million of the 2015 Senior Notes Due 2027 as a net invest-ment hedge. These hedges are intended to mitigate FX exposure related to non-U.S. dollar net investments in certain foreignsubsidiaries against changes in foreign exchange rates. These net investment hedges are designated as accounting hedges under theapplicable sections of Topic 815 of the ASC. The net investment hedge relating to the 2015 Senior Notes will end upon the repaymentof the notes in 2027 unless terminated earlier at the discretion of the Company.
Hedge effectiveness is assessed based on the overall changes in the fair value of the hedge. For hedges that meet the effectivenessrequirements, any change in the fair value is recorded in OCI in the foreign currency translation account. Any change in the fair value ofthe Company’s outstanding net investment hedges that is the result of ineffectiveness would be recognized immediately in othernon-operating (expense) income, net in the Company’s consolidated statement of operations.
The following table summarizes the notional amounts of the Company’s outstanding forward contracts that were designated as netinvestment hedges:
December 31, 2017 December 31, 2016
Sell Buy Sell Buy
Notional amount of net investment hedges:
Contracts to sell GBP for euros £ — € — £ 22.1 €26.4
The following table provides information on the gains/(losses) on the Company’s net investment and cash flow hedges:
Amount of Gain/(Loss)Recognized in AOCI onDerivative (EffectivePortion), net of Tax
Amount of Gain/(Loss)Reclassified from AOCI intoIncome (Effective Portion),
net of tax
Derivatives and Non-Derivative Instrumentsin Net Investment Hedging Relationships
Year Ended December 31, Year Ended December 31,
2017 2016 2015 2017 2016 2015
FX forwards $ 1.2 $(12.0) $13.4 $ — $ — $ —
Long-term debt (37.2) 7.8 4.7 — — —
Total net investment hedges $(36.0) $ (4.2) $18.1 $ — $ — $ —
Derivatives in Cash Flow Hedging Relationships
Cross currency swap $ 6.3 $ (0.9) $ — $ 7.8* $ (3.7)* $ —
Interest rate contracts (0.4) — (1.1) (1.1) — —
Total cash flow hedges 5.9 (0.9) (1.1) 6.7 (3.7) —
Total $(30.1) $ (5.1) $17.0 $ 6.7 $ (3.7) $ —
* Reflects $12.6 million in gains and $6 million in losses in 2017 and 2016, respectively, recorded in other non-operating income (expense), net of $4.8 millionand $2.3 million in 2017 and 2016, respectively, relating to the tax effect of the aforementioned items.
The cumulative amount of realized and unrecognized net investment and cash flow hedge gains/(losses) recorded in AOCI is as follows:
Cumulative Gains/(Losses), net of tax
December 31, 2017 December 31, 2016
Net investment hedges
FX forwards $ 23.5 $ 22.3
Long-term debt (24.7) 12.5
Total net investment hedges $ (1.2) $ 34.8
Cash flow hedges
Interest rate contracts $ (0.4) $ (1.1)
Cross currency swap 1.3 2.8
Total losses on cash flow hedges 0.9 1.7
Total net (losses) gains in AOCI $ (0.3) $ 36.5
82 MOODY’S 2017 10-K
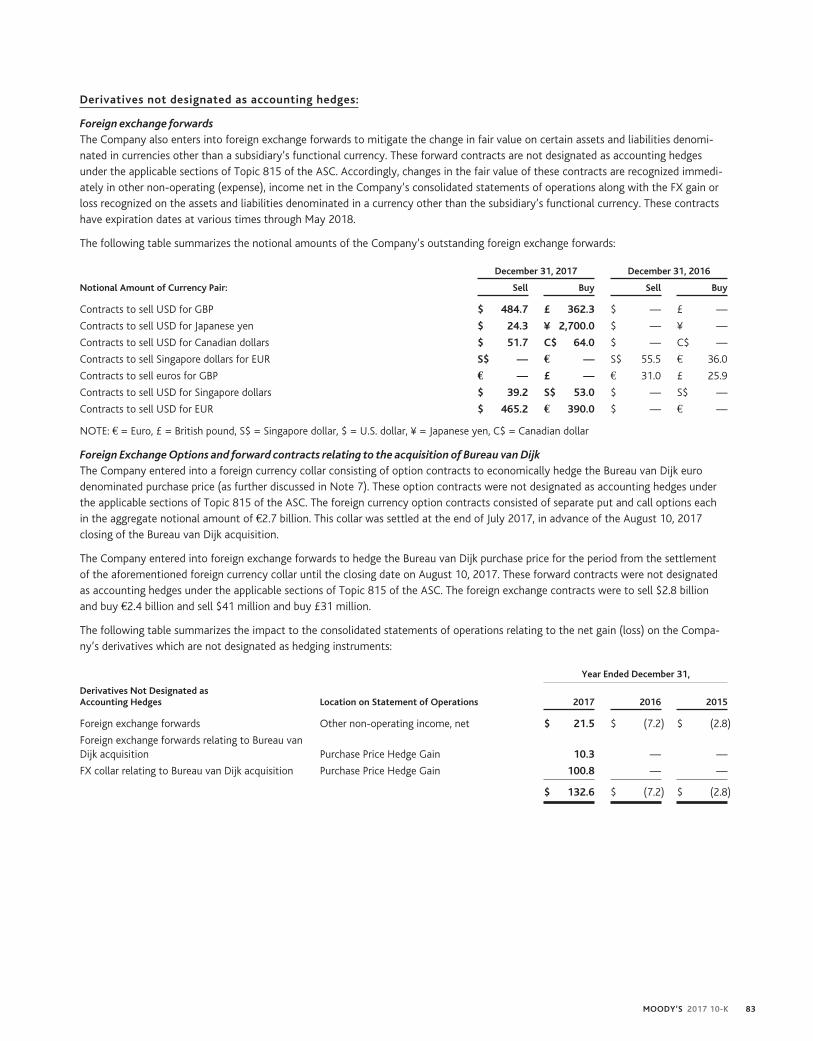
Derivatives not designated as accounting hedges:
Foreign exchange forwardsThe Company also enters into foreign exchange forwards to mitigate the change in fair value on certain assets and liabilities denomi-nated in currencies other than a subsidiary’s functional currency. These forward contracts are not designated as accounting hedgesunder the applicable sections of Topic 815 of the ASC. Accordingly, changes in the fair value of these contracts are recognized immedi-ately in other non-operating (expense), income net in the Company’s consolidated statements of operations along with the FX gain orloss recognized on the assets and liabilities denominated in a currency other than the subsidiary’s functional currency. These contractshave expiration dates at various times through May 2018.
The following table summarizes the notional amounts of the Company’s outstanding foreign exchange forwards:
December 31, 2017 December 31, 2016
Notional Amount of Currency Pair: Sell Buy Sell Buy
Contracts to sell USD for GBP $ 484.7 £ 362.3 $ — £ —
Contracts to sell USD for Japanese yen $ 24.3 ¥ 2,700.0 $ — ¥ —
Contracts to sell USD for Canadian dollars $ 51.7 C$ 64.0 $ — C$ —
Contracts to sell Singapore dollars for EUR S$ — € — S$ 55.5 € 36.0
Contracts to sell euros for GBP € — £ — € 31.0 £ 25.9
Contracts to sell USD for Singapore dollars $ 39.2 S$ 53.0 $ — S$ —
Contracts to sell USD for EUR $ 465.2 € 390.0 $ — € —
NOTE: € = Euro, £ = British pound, S$ = Singapore dollar, $ = U.S. dollar, ¥ = Japanese yen, C$ = Canadian dollar
Foreign Exchange Options and forward contracts relating to the acquisition of Bureau van DijkThe Company entered into a foreign currency collar consisting of option contracts to economically hedge the Bureau van Dijk eurodenominated purchase price (as further discussed in Note 7). These option contracts were not designated as accounting hedges underthe applicable sections of Topic 815 of the ASC. The foreign currency option contracts consisted of separate put and call options eachin the aggregate notional amount of €2.7 billion. This collar was settled at the end of July 2017, in advance of the August 10, 2017closing of the Bureau van Dijk acquisition.
The Company entered into foreign exchange forwards to hedge the Bureau van Dijk purchase price for the period from the settlementof the aforementioned foreign currency collar until the closing date on August 10, 2017. These forward contracts were not designatedas accounting hedges under the applicable sections of Topic 815 of the ASC. The foreign exchange contracts were to sell $2.8 billionand buy €2.4 billion and sell $41 million and buy £31 million.
The following table summarizes the impact to the consolidated statements of operations relating to the net gain (loss) on the Compa-ny’s derivatives which are not designated as hedging instruments:
Year Ended December 31,
Derivatives Not Designated asAccounting Hedges Location on Statement of Operations 2017 2016 2015
Foreign exchange forwards Other non-operating income, net $ 21.5 $ (7.2) $ (2.8)
Foreign exchange forwards relating to Bureau vanDijk acquisition Purchase Price Hedge Gain 10.3 — —
FX collar relating to Bureau van Dijk acquisition Purchase Price Hedge Gain 100.8 — —
$ 132.6 $ (7.2) $ (2.8)
MOODY’S 2017 10-K 83

The table below shows the classification between assets and liabilities on the Company’s consolidated balance sheets for the fair valueof the derivative instrument as well as the carrying value of its non-derivative debt instruments designated and qualifying as netinvestment hedges:
Derivative and Non-derivative Instruments
Balance Sheet LocationDecember 31,
2017December 31,
2016
Assets:
Derivatives designated as accounting hedges:
FX forwards on net investment in certain foreign subsidiaries Other current assets $ — $ 0.6
Interest rate swaps Other assets 0.5 7.0
Total derivatives designated as accounting hedges 0.5 7.6
Derivatives not designated as accounting hedges:
FX forwards on certain assets and liabilities Other current assets 12.5 —
Total assets $ 13.0 $ 7.6
Liabilities:
Derivatives designated as accounting hedges:
Cross-currency swap Other non-currentliabilities $ — $ 3.8
Interest rate swaps Other non-currentliabilities 3.5 0.8
Total derivatives designated as accounting hedges 3.5 4.6
Non-derivative instrument designated as accounting hedge:
Long-term debt designated as net investment hedge Long-term debt 600.4 421.9
Derivatives not designated as accounting hedges:
FX forwards on certain assets and liabilities Accounts payableand accrued liabilities 2.0 0.8
Total liabilities $ 605.9 $ 427.3
NOTE 6 PROPERTY AND EQUIPMENT, NET
Property and equipment, net consisted of:
December 31,
2017 2016
Office and computer equipment (3 – 10 year estimated useful life) $ 219.5 $ 189.1
Office furniture and fixtures (3 – 10 year estimated useful life) 50.5 47.1
Internal-use computer software (1 – 10 year estimated useful life) 520.3 452.1
Leasehold improvements and building (2 – 20 year estimated useful life) 240.8 233.1
Total property and equipment, at cost 1,031.1 921.4
Less: accumulated depreciation and amortization (706.0) (595.5)
Total property and equipment, net $ 325.1 $ 325.9
Depreciation and amortization expense related to the above assets was $96.9 million, $92.5 million, and $81.6 million for the yearsended December 31, 2017, 2016 and 2015, respectively.
NOTE 7 ACQUISITIONS
The business combinations described below are accounted for using the acquisition method of accounting whereby assets acquired andliabilities assumed were recognized at fair value on the date of the transaction. Any excess of the purchase price over the fair value ofthe assets acquired and liabilities assumed was recorded to goodwill. For all acquisitions excluding Bureau van Dijk, the Company hasnot presented pro forma combined results for these acquisitions because the impact on previously reported statements of operations
84 MOODY’S 2017 10-K

would not have been material. Additionally, the near term impact to the Company’s operations and cash flows for these acquisitions(excluding Bureau van Dijk) is not material.
Bureau van DijkOn August 10, 2017, a subsidiary of the Company acquired 100% of Yellow Maple I B.V., an indirect parent company of Bureau van DijkElectronic Publishing B.V., a global provider of business intelligence and company information products. The cash payment of$3,542.0 million was funded with a combination of cash on hand, primarily offshore, and new debt financing. The acquisition extendsMoody’s position as a leader in risk data and analytical insight.
Shown below is the purchase price allocation, which summarizes the fair value of the assets and liabilities assumed, at the date ofacquisition:
(Amounts in millions)
Current assets $ 158.4
Property and equipment, net 4.2
Intangible assets:
Customer relationships (23 year weighted average life) $ 998.7
Product technology (12 year weighted average life) 258.5
Trade name (18 year weighted average life) 82.3
Database (10 year weighted average life) 12.9
Total intangible assets (21 year weighted average life) 1,352.4
Goodwill 2,619.0
Other assets 5.9
Liabilities
Deferred revenue $ (101.1)
Accounts payable and accrued liabilities (48.6)
Deferred tax liabilities, net (329.8)
Other liabilities (118.4)
Total liabilities (597.9)
Net assets acquired $ 3,542.0
The Company has performed a preliminary valuation analysis of the fair market value of assets and liabilities of the Bureau van Dijkbusiness. The final purchase price allocation will be determined when the Company has completed and fully reviewed the detailedvaluations. The final allocation could differ materially from the preliminary allocation. The final allocation may include changes inallocations to acquired intangible assets as well as goodwill and other changes to assets and liabilities including reserves for uncertaintax positions and deferred tax liabilities. The estimated useful lives of acquired intangibles assets are also preliminary. Additionally, atDecember 31, 2017, the Company has not completed its allocation of certain of the goodwill acquired to other MA reporting units thatare anticipated to benefit from synergies resulting from the Bureau van Dijk acquisition.
Current assets in the table above include acquired cash of $36 million. Additionally, current assets include accounts receivable ofapproximately $88 million (net of an allowance for uncollectible accounts of $3.7 million).
The amount of Bureau van Dijk’s revenue and Net Income from August 10, 2017 through December 31, 2017 included in the Compa-ny’s statement of operations was $92.4 million and $63.7 million, respectively. The aforementioned net income includes a $57.9 milliontax benefit, as further described in Note 15, relating to a statutory tax rate reduction in Belgium which resulted in a decrease indeferred tax liabilities relating to acquired intangible assets. The acquired deferred revenue balance of approximately $154 million wasreduced by $53 million as part of acquisition accounting to establish the fair value of deferred revenue. This will reduce reported rev-enue by $53 million over the remaining contractual period of in-progress customer arrangements assumed as of the acquisition date.This resulted in approximately $36 million less in reported revenue for the period from August 10, 2017 to December 31, 2017 with theremaining $17 million to reduce revenue in 2018. Amortization of acquired intangible assets was approximately $28 million for theperiod from August 10, 2017 through December 31, 2017.
GoodwillUnder the acquisition method of accounting for business combinations, the excess of the purchase price over the fair value of the netassets acquired is allocated to goodwill. Goodwill typically results through expected synergies from combining operations of an
MOODY’S 2017 10-K 85

acquiree and an acquirer, anticipated new customer acquisition and products, as well as from intangible assets that do not qualify forseparate recognition. The goodwill recognized as a result of this acquisition includes, among other things, the value of combining thecomplementary product portfolios of the Company and Bureau van Dijk which is expected to extend the Company’s reach to new andevolving market segments as well as cost savings synergies, expected new customer acquisitions and products.
Goodwill, which has been assigned to the MA segment, is not deductible for tax purposes.
Bureau van Dijk will be a separate reporting unit for purposes of the Company’s annual goodwill impairment assessment.
Other Liabilities AssumedIn connection with the acquisition, the Company assumed liabilities relating to UTBs as well as deferred tax liabilities which relate toacquired intangible assets. These items are included in other liabilities in the table above.
Transaction and Non-Recurring Integration Costs.In connection with the acquisition, the Company incurred transaction and non-recurring integration costs (Acquisition-RelatedExpenses) through December 2017. Acquisition-Related Expenses of $22.5 million were comprised of transaction costs (consistingprimarily of legal and advisory costs) of $8.6 million and non-recurring integration costs of $13.9 million for the year endedDecember 31, 2017.
Supplementary Unaudited Pro Forma InformationSupplemental information on an unaudited pro forma basis is presented below for the year ended December 31, 2017 and 2016 as ifthe acquisition of Bureau van Dijk occurred on January 1, 2016. The pro forma financial information is presented for comparative pur-poses only, based on certain estimates and assumptions, which the Company believes to be reasonable but not necessarily indicative offuture results of operations or the results that would have been reported if the acquisition had been completed at January 1, 2016. Theunaudited pro forma information includes amortization of acquired intangible assets, based on the preliminary purchase price allocationand an estimate of useful lives reflected above, and incremental financing costs resulting from the acquisition, net of income tax, whichwas estimated using the weighted average statutory tax rates in effect in the jurisdiction for which the pro forma adjustment relates.
(Amounts in millions)For the year endedDecember 31, 2017
For the year endedDecember 31, 2016
Pro forma Revenue $ 4,414.8 $ 3,825.8
Pro forma Net Income attributable to Moody’s $ 1,011.6 $ 240.6
The unaudited pro forma results do not include any anticipated cost savings or other effects of the planned integration of Bureau vanDijk. Accordingly, the pro forma results above are not necessarily indicative of the results that would have been reported if the acquis-ition had occurred on the dates indicated, nor are the pro forma results indicative of results which may occur in the future. The Bureauvan Dijk results included in the table above have been converted to U.S. GAAP from IFRS as issued by the IASB and have been translatedto USD at rates in effect for the periods presented. As the unaudited pro forma results give effect to the acquisition of Bureau van Dijkas if it had occurred on January 1, 2016, the Bureau van Dijk amounts in the pro forma results include a reduction in revenue of approx-imately $58 million and $1 million relating to a fair value adjustment to deferred revenue required as part of acquisition accounting forthe year ended December 31, 2016 and 2017, respectively. In addition, a corresponding pro forma adjustment was included to add backthe approximate $36 million reduction to reported revenue for the period from August 10, 2017 to December 31, 2017 relating to thedeferred revenue adjustment required as part of acquisition accounting as of the actual August 10, 2017 acquisition date.
SCDM FinancialOn February 13, 2017, a subsidiary of the Company acquired the structured finance data and analytics business of SCDM Financial. Theaggregate purchase price was not material and the near term impact to the Company’s operations and cash flow is not expected to bematerial. This business unit operates in the MA reportable segment and goodwill related to this acquisition has been allocated to theRD&A reporting unit.
Korea Investor Service (KIS)In July 2016, a subsidiary of the Company acquired the non-controlling interest of KIS and additional shares of KIS Pricing. Theaggregate purchase price was not material and the near term impact to the Company’s operations and cash flow is not expected to bematerial. KIS and KIS Pricing are a part of the MIS segment.
Gilliland Gold Young (GGY)On March 1, 2016, subsidiaries of the Company acquired 100% of GGY, a leading provider of advanced actuarial software for the lifeinsurance industry. The cash payments noted in the table below were funded with cash on hand. The acquisition of GGY will allow MAto provide an industry-leading enterprise risk offering for global life insurers and reinsurers.
86 MOODY’S 2017 10-K

The table below details the total consideration relating to the acquisition:
Cash paid at closing $ 83.4
Additional consideration paid to sellers in the third quarter 2016(1) 3.1
Total consideration $ 86.5
(1) Represents additional consideration paid to the sellers for amounts withheld at closing pending the completion of certain administrative matters
Shown below is the purchase price allocation, which summarizes the fair value of the assets and liabilities assumed, at the date ofacquisition:
Current assets $ 11.7
Property and equipment, net 2.0
Indemnification assets 1.5
Intangible assets:
Trade name (19 year weighted average life) $ 3.7
Customer relationships (21 year weighted average life) 13.8
Software (7 year weighted average life) 16.6
Total intangible assets (14 year weighted average life) 34.1
Goodwill 59.4
Liabilities (22.2)
Net assets acquired $ 86.5
Current assets in the table above include acquired cash of $7.5 million. Additionally, current assets include accounts receivable of$2.9 million. Goodwill, which has been assigned to the MA segment, is not deductible for tax.
In connection with the acquisition, the Company assumed liabilities relating to UTBs and certain other tax exposures which are includedin the liabilities assumed in the table above. The sellers have contractually indemnified the Company against any potential paymentsthat may have to be made regarding these amounts. Accordingly, the Company carries an indemnification asset on its consolidatedbalance sheet at December 31, 2017 and December 31, 2016.
The Company incurred $0.9 million of costs directly related to the GGY acquisition of which $0.6 million was incurred in 2015 and$0.3 million was incurred in the first quarter of 2016. These costs are recorded within selling, general and administrative expenses in theCompany’s consolidated statements of operations.
GGY is part of the ERS reporting unit for purposes of the Company’s annual goodwill impairment assessment.
BlackBox LogicOn December 9, 2015, a subsidiary of the Company acquired the RMBS data and analytics business of BlackBox Logic. The aggregatepurchase price was not material and the near term impact to the Company’s operations and cash flows is not expected to be material.This business operates in the MA reportable segment and goodwill related to this acquisition has been allocated to the RD&A reportingunit.
EquilibriumOn May 21, 2015, a subsidiary of the Company acquired 100% of Equilibrium, a provider of credit rating and research services in Peruand Panama. The aggregate purchase price was not material and the near term impact to the Company’s operations and cash flows isnot expected to be material. Equilibrium operates in the MIS reportable segment and goodwill related to this acquisition has been allo-cated to the MIS reporting unit.
MOODY’S 2017 10-K 87

NOTE 8 GOODWILL AND OTHER ACQUIRED INTANGIBLE ASSETS
The following table summarizes the activity in goodwill:
Year Ended December 31, 2017
MIS MA Consolidated
Grossgoodwill
Accumulatedimpairment
chargeNet
goodwillGross
goodwill
Accumulatedimpairment
chargeNet
goodwillGross
goodwill
Accumulatedimpairment
chargeNet
goodwill
Balance at beginningof year $ 277.0 $ — $ 277.0 $ 758.8 $ (12.2)$ 746.6 $ 1,035.8 $ (12.2)$ 1,023.6
Additions/adjustments — — — 2,622.6 — 2,622.6 2,622.6 — 2,622.6
Foreign currencytranslationadjustments 8.2 — 8.2 98.8 — 98.8 107.0 — 107.0
Ending balance $ 285.2 $ — $ 285.2 $ 3,480.2 $ (12.2)$ 3,468.0 $ 3,765.4 $ (12.2)$ 3,753.2
Year Ended December 31, 2016
MIS MA Consolidated
Grossgoodwill
Accumulatedimpairment
chargeNet
goodwillGross
goodwill
Accumulatedimpairment
chargeNet
goodwillGross
goodwill
Accumulatedimpairment
chargeNet
goodwill
Balance at beginningof year $ 284.4 $ — $ 284.4 $ 704.1 $ (12.2)$ 691.9 $ 988.5 $ (12.2)$ 976.3
Additions/adjustments — — — 61.0 — 61.0 61.0 — 61.0
Goodwill derecognizedupon sale of subsidiary (3.2) — (3.2) — — — (3.2) — (3.2)
Foreign currencytranslationadjustments (4.2) — (4.2) (6.3) — (6.3) (10.5) — (10.5)
Ending balance $ 277.0 $ — $ 277.0 $ 758.8 $ (12.2)$ 746.6 $ 1,035.8 $ (12.2)$ 1,023.6
The 2017 additions/adjustments for the MA segment in the table above relate to the acquisition of Bureau van Dijk and the structuredfinance data and analytics business of SCDM. The 2016 additions/adjustments for the MA segment in the table above relate to theacquisition of GGY. The 2016 goodwill derecognized for the MIS segment in the table above relates to the divestiture of ICTEAS in thefourth quarter of 2016.
88 MOODY’S 2017 10-K

Acquired intangible assets and related amortization consisted of:
December 31,
2017 2016
Customer relationships $ 1,345.1 $ 310.1
Accumulated amortization (159.9) (124.4)
Net customer relationships 1,185.2 185.7
Trade secrets 30.2 29.9
Accumulated amortization (28.1) (25.6)
Net trade secrets 2.1 4.3
Software/product technology 358.6 87.7
Accumulated amortization (78.0) (54.9)
Net software/product technology 280.6 32.8
Trade names 161.6 75.3
Accumulated amortization (26.7) (19.9)
Net trade names 134.9 55.4
Other (1) 57.4 43.5
Accumulated amortization (28.6) (25.3)
Net other 28.8 18.2
Total $ 1,631.6 $ 296.4
(1) Other intangible assets primarily consist of databases, covenants not to compete, and acquired ratings methodologies and models.
Amortization expense relating to acquired intangible assets is as follows:
Year Ended December 31,
2017 2016 2015
Amortization expense $ 61.4 $ 34.2 $ 31.9
Estimated future annual amortization expense for intangible assets subject to amortization is as follows:
Year Ending December 31,
2018 $ 101.0
2019 97.0
2020 94.7
2021 94.6
2022 94.1
Thereafter 1,150.2
Total estimated future amortization $ 1,631.6
Amortizable intangible assets are reviewed for recoverability whenever events or changes in circumstances indicate that the carryingamount may not be recoverable. For all intangible assets, there were no such events or changes during 2017, 2016 or 2015 that wouldindicate that the carrying amount of amortizable intangible assets in any of the Company’s reporting units may not be recoverable.
NOTE 9 RESTRUCTURING
In September 2016, the Company approved a restructuring plan relating to cost management initiatives in the MIS segment as well asin certain corporate overhead functions. This restructuring plan consisted solely of headcount reductions, which when combined withan immaterial restructuring in the first half of 2016, represented approximately 1% of the Company’s workforce. The cumulativeamount of expense incurred from inception through December 31, 2016 for these actions was $12.0 million. Actions under these planswere substantially complete at September 30, 2016.
MOODY’S 2017 10-K 89
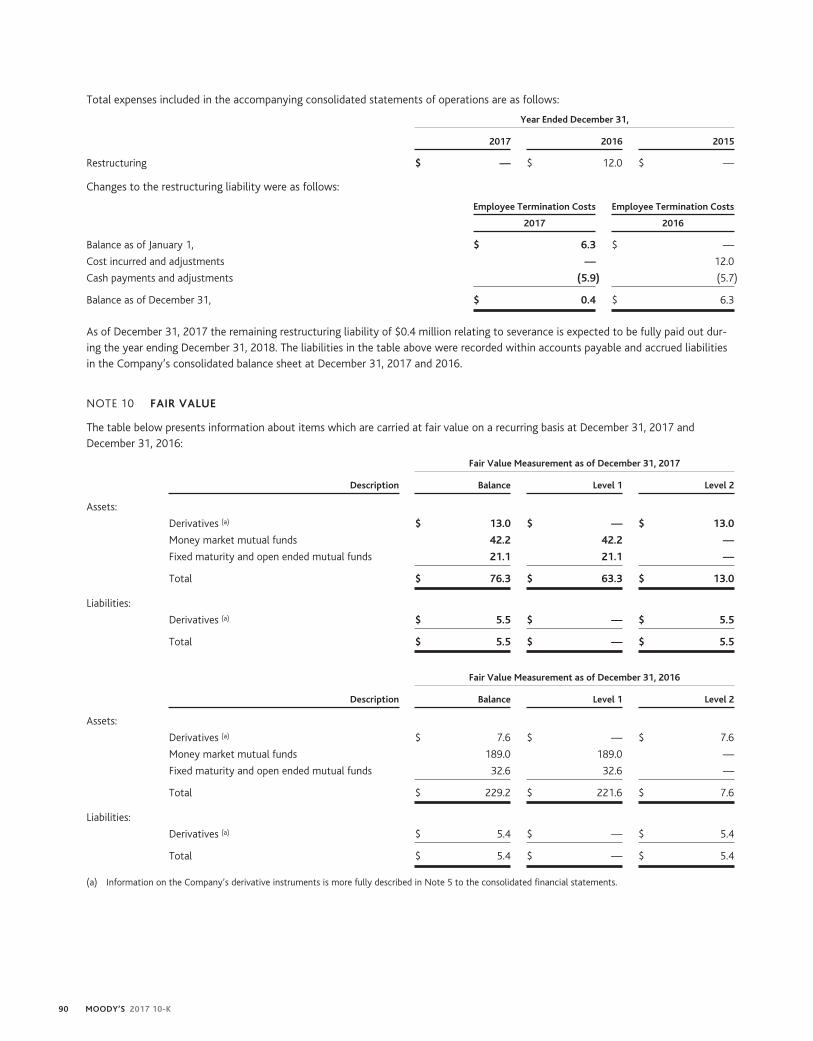
Total expenses included in the accompanying consolidated statements of operations are as follows:
Year Ended December 31,
2017 2016 2015
Restructuring $ — $ 12.0 $ —
Changes to the restructuring liability were as follows:
Employee Termination Costs Employee Termination Costs
2017 2016
Balance as of January 1, $ 6.3 $ —
Cost incurred and adjustments — 12.0
Cash payments and adjustments (5.9) (5.7)
Balance as of December 31, $ 0.4 $ 6.3
As of December 31, 2017 the remaining restructuring liability of $0.4 million relating to severance is expected to be fully paid out dur-ing the year ending December 31, 2018. The liabilities in the table above were recorded within accounts payable and accrued liabilitiesin the Company’s consolidated balance sheet at December 31, 2017 and 2016.
NOTE 10 FAIR VALUE
The table below presents information about items which are carried at fair value on a recurring basis at December 31, 2017 andDecember 31, 2016:
Fair Value Measurement as of December 31, 2017
Description Balance Level 1 Level 2
Assets:
Derivatives (a) $ 13.0 $ — $ 13.0
Money market mutual funds 42.2 42.2 —
Fixed maturity and open ended mutual funds 21.1 21.1 —
Total $ 76.3 $ 63.3 $ 13.0
Liabilities:
Derivatives (a) $ 5.5 $ — $ 5.5
Total $ 5.5 $ — $ 5.5
Fair Value Measurement as of December 31, 2016
Description Balance Level 1 Level 2
Assets:
Derivatives (a) $ 7.6 $ — $ 7.6
Money market mutual funds 189.0 189.0 —
Fixed maturity and open ended mutual funds 32.6 32.6 —
Total $ 229.2 $ 221.6 $ 7.6
Liabilities:
Derivatives (a) $ 5.4 $ — $ 5.4
Total $ 5.4 $ — $ 5.4
(a) Information on the Company’s derivative instruments is more fully described in Note 5 to the consolidated financial statements.
90 MOODY’S 2017 10-K

The following are descriptions of the methodologies utilized by the Company to estimate the fair value of its derivative contracts, fixedmaturity plans, and money market mutual funds:
Derivatives:In determining the fair value of the derivative contracts in the table above, the Company utilizes industry standard valuation models.Where applicable, these models project future cash flows and discount the future amounts to a present value using spot rates, forwardpoints, currency volatilities, interest rates as well as the risk of non-performance of the Company and the counterparties with whom ithas derivative contracts. The Company established strict counterparty credit guidelines and only enters into transactions with financialinstitutions that adhere to these guidelines. Accordingly, the risk of counterparty default is deemed to be minimal.
Fixed maturity and open ended mutual funds:The fixed maturity mutual funds and open ended mutual funds primarily represent exchange traded funds in India and are classified assecurities available-for-sale. Accordingly, any unrealized gains and losses are recognized through OCI until the instruments mature orare sold.
Money market mutual funds:The money market mutual funds represent publicly traded funds with a stable $1 net asset value.
NOTE 11 OTHER BALANCE SHEET AND STATEMENT OF OPERATIONS INFORMATION
The following tables contain additional detail related to certain balance sheet captions:
December 31,
2017 2016
Other current assets:
Prepaid taxes $ 94.9 $ 47.0
Prepaid expenses 107.6 65.7
Other 47.6 28.1
Total other current assets $ 250.1 $ 140.8
December 31,
2017 2016
Other assets:
Investments in joint ventures $ 99.1 $ 26.3
Deposits for real-estate leases 12.3 10.8
Indemnification assets related to acquisitions 17.0 16.5
Mutual funds and fixed deposits 22.1 32.7
Other 9.4 25.9
Total other assets $ 159.9 $ 112.2
MOODY’S 2017 10-K 91

December 31,
2017 2016
Accounts payable and accrued liabilities:
Salaries and benefits $ 129.6 $ 89.3
Incentive compensation 246.7 151.1
Accrued settlement charge — 863.8
Customer credits, advanced payments and advanced billings 22.2 28.4
Self-insurance reserves 8.1 11.1
Dividends 6.2 78.5
Professional service fees 47.1 40.4
Interest accrued on debt 73.9 59.2
Accounts payable 21.8 28.4
Income taxes (see Note 15) 79.2 16.8
Restructuring (see Note 9) 0.4 6.3
Pension and other retirement employee benefits (see Note 13) 5.9 6.1
Accrued royalties (1) 26.4 1.8
Other 82.8 63.1
Total accounts payable and accrued liabilities $ 750.3 $ 1,444.3
(1) Primarily relates to fees due to Bureau van Dijk’s data providers
December 31,
2017 2016
Other liabilities:
Pension and other retirement employee benefits (see Note 13) $ 244.5 $ 264.1
Deferred rent-non-current portion 103.1 98.3
Interest accrued on UTPs 54.7 34.1
Legacy and other tax matters 1.3 1.2
Income tax liability – non current* 232.2 —
Other 28.2 27.5
Total other liabilities $ 664.0 $ 425.2
* The 2017 amount primarily reflects the transition tax pursuant to the Tax Act, which was enacted into law in December 2017. See Note 15 for furtherinformation.
Changes in the Company’s self-insurance reserves for claims insured by the Company’s wholly-owned insurance subsidiary, which pri-marily relate to legal defense costs for claims from prior years, are as follows:
Year Ended December 31,
2017 2016 2015
Balance January 1, $ 11.1 $ 19.7 $ 21.5
Accruals (reversals), net 9.6 12.1 22.2
Payments (12.6) (20.7) (24.0)
Balance December 31, $ 8.1 $ 11.1 $ 19.7
Purchase Price Hedge Gain:There was a $111.1 million realized gain reflecting gains on an FX collar and foreign exchange forwards to economically hedge the eurodenominated purchase price for Bureau van Dijk as more fully discussed in Note 5 to the condensed consolidated financial statements.
Settlement ChargeThere was a charge of $863.8 million recorded in the fourth quarter of 2016 related to an agreement entered into on January 13, 2017with the U.S. Department of Justice and the attorneys general of 21 U.S. states and the District of Columbia to resolve pending andpotential civil claims related to credit ratings that MIS assigned to certain structured finance instruments in the financial crisis era.
92 MOODY’S 2017 10-K

CCXI Gain:CCXI is a Chinese credit rating agency in which Moody’s acquired a 49% stake in 2006. Moody’s accounts for this investment under theequity method of accounting. On March 21, 2017, CCXI, as part of a strategic business realignment, issued additional capital to itsmajority shareholder in exchange for a ratings business wholly-owned by the majority shareholder and which has the right to rate adifferent class of debt instrument in the Chinese market. The capital issuance by CCXI in exchange for this ratings business dilutedMoody’s ownership interest in CCXI to 30% of a larger business and resulted in a $59.7 million non-cash, non-taxable gain. The issu-ance of additional capital by CCXI is treated as if Moody’s sold a 19% interest in CCXI at fair value. The fair value of the 19% interest inCCXI that Moody’s hypothetically sold was estimated using both a discounted cash flow methodology and comparable public companymultiples. A DCF analysis requires significant estimates, including projections of future operating results and cash flows based on thebudgets and forecasts of CCXI, expected long-term growth rates, terminal values, WACC and the effects of external factors and marketconditions. Moody’s will continue to account for its 30% interest in CCXI under the equity method of accounting.
NOTE 12. COMPREHENSIVE INCOME AND ACCUMULATED OTHER COMPREHENSIVE INCOME
The following table provides details about the reclassifications out of AOCI:
Year Ended December 31,Affected line in the
consolidated statement ofoperations2017 2016 2015
Gains on currency translation adjustments
Liquidation/sale of foreign subsidiary $ — $ 36.6 $ 0.1Other non-operating income(expense), net
Total gains on currency translation adjustments — 36.6 0.1
Gains (losses) on cash flow hedges
Cross-currency swap12.6 (6.0) —
Other non-operating income(expense), net
Interest rate contract (1.1) — — Interest expense, net
Total before income taxes 11.5 (6.0) —
Income tax effect of item above (4.8) 2.3 — Provision for income taxes
Total net gains (losses) on cash flow hedges 6.7 (3.7) —
Gains on available for sale securities:
Gains on available for sale securities 1.8 — 0.9 Other income
Income tax effect of item above — — — Provision for income taxes
Total gains on available for sale securities 1.8 — 0.9
Pension and other retirement benefits
Amortization of actuarial losses and prior service costsincluded in net income (5.5) (5.8) (8.5) Operating expense
Amortization of actuarial losses and prior service costsincluded in net income (3.2) (3.9) (5.0) SG&A expense
Total before income taxes (8.7) (9.7) (13.5)
Income tax effect of item above 3.3 3.7 5.2 Provision for income taxes
Total pension and other retirement benefits (5.4) (6.0) (8.3)
Total gains (losses) included in Net Income attributable toreclassifications out of AOCI $ 3.1 $ 26.9 $ (7.3)
MOODY’S 2017 10-K 93

The following table shows changes in AOCI by component (net of tax):
Year Ended December 31, 2017
Pension and OtherRetirement
Benefits
Gains / (Losses)on Cash Flow
Hedges
Foreign CurrencyTranslation
AdjustmentsGains on Availablefor Sale Securities Total
Balance December 31, 2016 $ (79.5) $ 1.7 $ (290.2) $ 3.1 $ (364.9)
Other comprehensive income beforereclassifications 12.6 5.9 176.3 1.0 195.8
Amounts reclassified from AOCI 5.4 (6.7) — (1.8) (3.1)
Other comprehensive income/(loss) 18.0 (0.8) 176.3 (0.8) 192.7
Balance December 31, 2017 $ (61.5) $ 0.9 $ (113.9) $ 2.3 $ (172.2)
Year Ended December 31, 2016
Balance December 31, 2015 $ (85.7) $ (1.1) $ (256.0) $ 3.3 $ (339.5)
Other comprehensive income/(loss)before reclassifications 0.2 (0.9) 2.4 (0.2) 1.5
Amounts reclassified from AOCI 6.0 3.7 (36.6) — (26.9)
Other comprehensive income/(loss) 6.2 2.8 (34.2) (0.2) (25.4)
Balance December 31, 2016 $ (79.5) $ 1.7 $ (290.2) $ 3.1 $ (364.9)
Year Ended December 31, 2015
Balance December 31, 2014 $ (105.4) $ — $ (130.7) $ 0.9 $ (235.2)
Other comprehensive income/(loss)before reclassifications 11.4 (1.1) (125.2) 3.3 (111.6)
Amounts reclassified from AOCI 8.3 — (0.1) (0.9) 7.3
Other comprehensive income/(loss) 19.7 (1.1) (125.3) 2.4 (104.3)
Balance December 31, 2015 $ (85.7) $ (1.1) $ (256.0) $ 3.3 $ (339.5)
NOTE 13 PENSION AND OTHER RETIREMENT BENEFITS
U.S. PlansMoody’s maintains funded and unfunded noncontributory Defined Benefit Pension Plans. The U.S. plans provide defined benefits using acash balance formula based on years of service and career average salary or final average pay for selected executives. The Companyalso provides certain healthcare and life insurance benefits for retired U.S. employees. The retirement healthcare plans are contributory;the life insurance plans are noncontributory. Moody’s funded and unfunded U.S. pension plans, the U.S. retirement healthcare plans andthe U.S. retirement life insurance plans are collectively referred to herein as the “Retirement Plans”. The U.S. retirement healthcareplans and the U.S. retirement life insurance plans are collectively referred to herein as the “Other Retirement Plans”. Effective at theDistribution Date, Moody’s assumed responsibility for the pension and other retirement benefits relating to its active employees. NewD&B has assumed responsibility for the Company’s retirees and vested terminated employees as of the Distribution Date.
Through 2007, substantially all U.S. employees were eligible to participate in the Company’s DBPPs. Effective January 1, 2008, theCompany no longer offers DBPPs to U.S. employees hired or rehired on or after January 1, 2008 and new hires in the U.S. instead willreceive a retirement contribution in similar benefit value under the Company’s Profit Participation Plan. Current participants of theCompany’s Retirement Plans and Other Retirement Plans continue to accrue benefits based on existing plan benefit formulas.
94 MOODY’S 2017 10-K

Following is a summary of changes in benefit obligations and fair value of plan assets for the Retirement Plans for the years endedDecember 31:
Pension Plans Other Retirement Plans
2017 2016 2017 2016
Change in benefit obligation:
Benefit obligation, beginning of the period $ (489.5) $ (459.2) $ (29.5) $ (27.0)
Service cost (18.4) (20.1) (2.5) (2.2)
Interest cost (18.5) (18.2) (1.1) (1.0)
Plan participants’ contributions — — (0.4) (0.4)
Benefits paid 15.0 9.9 1.4 0.9
Actuarial gain (loss) 7.4 4.2 (0.1) 0.7
Assumption changes (14.1) (6.1) 1.0 (0.5)
Benefit obligation, end of the period $ (518.1) $ (489.5) $ (31.2) $ (29.5)
Change in plan assets:
Fair value of plan assets, beginning of the period $ 297.1 $ 260.9 $ — $ —
Actual return on plan assets 44.3 19.7 — —
Benefits paid (15.0) (9.9) (1.4) (0.9)
Employer contributions 31.0 26.4 1.0 0.5
Plan participants’ contributions — — 0.4 0.4
Fair value of plan assets, end of the period $ 357.4 $ 297.1 $ — $ —
Funded Status of the plans $ (160.7) $ (192.4) $ (31.2) $ (29.5)
Amounts recorded on the consolidated balance sheets:
Pension and retirement benefits liability – current $ (4.9) $ (5.1) $ (1.0) $ (1.0)
Pension and retirement benefits liability – non current (155.8) (187.3) (30.2) (28.5)
Net amount recognized $ (160.7) $ (192.4) $ (31.2) $ (29.5)
Accumulated benefit obligation, end of the period $ (461.5) $ (433.1)
The following information is for those pension plans with an accumulated benefit obligation in excess of plan assets:
December 31,
2017 2016
Aggregate projected benefit obligation $ 518.1 $ 489.5
Aggregate accumulated benefit obligation $ 461.5 $ 433.1
Aggregate fair value of plan assets $ 357.4 $ 297.1
The following table summarizes the pre-tax net actuarial losses and prior service cost recognized in AOCI for the Company’s RetirementPlans as of December 31:
Pension Plans Other Retirement Plans
2017 2016 2017 2016
Net actuarial losses $ (104.0) $ (133.9) $ (3.0) $ (4.0)
Net prior service costs 4.5 4.5 0.6 0.9
Total recognized in AOCI – pretax $ (99.5) $ (129.4) $ (2.4) $ (3.1)
MOODY’S 2017 10-K 95

The following table summarizes the estimated pre-tax net actuarial losses and prior service cost for the Company’s Retirement Plansthat will be amortized from AOCI and recognized as components of net periodic expense during the next fiscal year:
Pension Plans Other Retirement Plans
Net actuarial losses $ 6.0 $ —
Net prior service costs (0.3) (0.3)
Total to be recognized as components of net periodic expense $ 5.7 $ (0.3)
Net periodic benefit expenses recognized for the Retirement Plans for years ended December 31:
Pension Plans Other Retirement Plans
2017 2016 2015 2017 2016 2015
Components of net periodicexpense
Service cost $ 18.4 $ 20.1 $ 21.6 $ 2.5 $ 2.2 $ 2.2
Interest cost 18.5 18.2 16.9 1.1 1.0 1.0
Expected return on plan assets (16.5) (17.0) (14.4) — — —
Amortization of net actuarial lossfrom earlier periods 8.8 9.8 12.5 0.1 0.2 0.3
Amortization of net prior servicecosts from earlier periods — 0.1 0.7 (0.3) (0.3) —
Net periodic expense $ 29.2 $ 31.2 $ 37.3 $ 3.4 $ 3.1 $ 3.5
The following table summarizes the pre-tax amounts recorded in OCI related to the Company’s Retirement Plans for the years endedDecember 31:
Pension Plans Other Retirement Plans
2017 2016 2015 2017 2016 2015
Amortization of net actuarial losses $ 8.8 $ 9.8 $12.5 $ 0.1 $ 0.2 $ 0.3
Amortization of prior service costs — 0.1 0.7 (0.3) (0.3) —
Prior service costs — — 6.5 — — 1.2
Net actuarial gain (loss) arising during the period 21.1 0.8 8.4 0.9 0.2 1.3
Total recognized in OCI – pre-tax $29.9 $10.7 $28.1 $ 0.7 $ 0.1 $ 2.8
ADDITIONAL INFORMATION:
Assumptions — Retirement Plans
Weighted-average assumptions used to determine benefit obligations at December 31:
Pension Plans Other Retirement Plans
2017 2016 2017 2016
Discount rate 3.46% 3.89% 3.45% 3.85%
Rate of compensation increase 3.71% 3.72% — —
Weighted-average assumptions used to determine net periodic benefit expense for years ended December 31:
Pension Plans Other Retirement Plans
2017 2016 2015 2017 2016 2015
Discount rate 3.89% 4.04% 3.78% 3.85% 4.00% 3.65%
Expected return on plan assets 5.40% 6.10% 5.80% — — —
Rate of compensation increase 3.72% 3.74% 3.76% — — —
96 MOODY’S 2017 10-K

The expected rate of return on plan assets represents the Company’s best estimate of the long-term return on plan assets and isdetermined by using a building block approach, which generally weighs the underlying long-term expected rate of return for each majorasset class based on their respective allocation target within the plan portfolio, net of plan paid expenses. As the assumption reflects along-term time horizon, the plan performance in any one particular year does not, by itself, significantly influence the Company’sevaluation. For 2017, the expected rate of return used in calculating the net periodic benefit costs was 5.40%. For 2018, the Company’sexpected rate of return assumption is 4.50% to reflect the Company’s current view of long-term capital market outlook. In addition, theCompany has updated its mortality assumption by adopting the newly released mortality improvement scale MP-2017 to accompanythe RP-2014 mortality tables to reflect the latest information regarding future mortality expectations by the Society of Actuaries. Addi-tionally, the assumed healthcare cost trend rate assumption is not material to the valuation of the other retirement plans.
Plan AssetsMoody’s investment objective for the assets in the funded pension plan is to earn total returns that will minimize future contributionrequirements over the long-term within a prudent level of risk. The Company works with its independent investment consultants todetermine asset allocation targets for its pension plan investment portfolio based on its assessment of business and financial conditions,demographic and actuarial data, funding characteristics, and related risk factors. Other relevant factors, including historical and forwardlooking views of inflation and capital market returns, are also considered. Risk management practices include monitoring plan assetperformance, diversification across asset classes and investment styles, and periodic rebalancing toward asset allocation targets. TheCompany’s Asset Management Committee is responsible for overseeing the investment activities of the plan, which includes selectingacceptable asset classes, defining allowable ranges of holdings by asset class and by individual investment managers, defining accept-able securities within each asset class, and establishing investment performance expectations. Ongoing monitoring of the plan includesreviews of investment performance and managers on a regular basis, annual liability measurements, and periodic asset/liability studies.
In 2014, the Company implemented a revised investment policy, which uses risk-controlled investment strategies by increasing theplan’s asset allocation to fixed income securities and specifying ranges of acceptable target allocation by asset class based on differentlevels of the plan’s accounting funded status. In addition, the investment policy also requires the investment-grade fixed income assetsbe rebalanced between shorter and longer duration bonds as the interest rate environment changes. This revised investment policy isdesigned to help protect the plan’s funded status and to limit volatility of the Company’s contributions. Based on the revised policy, theCompany’s current target asset allocation is approximately 53% (range of 48% to 58%) in equity securities, 40% (range of 35% to45%) in fixed income securities and 7% (range of 4% to 10%) in other investments and the plan will use a combination of active andpassive investment strategies and different investment styles for its investment portfolios within each asset class. The plan’s equityinvestments are diversified across U.S. and non-U.S. stocks of small, medium and large capitalization. The plan’s fixed income invest-ments are diversified principally across U.S. and non-U.S. government and corporate bonds which are expected to help reduce planexposure to interest rate variation and to better align assets with obligations. The plan also invests in other fixed income investmentssuch as debts rated below investment grade, emerging market debt, and convertible securities. The plan’s other investment, which ismade through a private real estate debt fund, is expected to provide additional diversification benefits and absolute return enhance-ment to the plan assets.
MOODY’S 2017 10-K 97

Fair value of the assets in the Company’s funded pension plan by asset category at December 31, 2017 and 2016 are as follows:
Fair Value Measurement as of December 31, 2017
Asset Category Balance Level 1 Level 2
Measuredusing NAV
practicalexpedient (a)
% of totalassets
Cash and cash equivalent $ 16.5 $ — $ 16.5 $ — 4%
Common/collective trust funds—equity securities
U.S. large-cap 140.3 — 140.3 — 39%
U.S. small and mid-cap 23.3 — 23.3 — 7%
Emerging markets 28.1 — 28.1 — 8%
Total equity investments 191.7 — 191.7 — 54%
Emerging markets bond fund 12.1 12.1 — — 3%
Common/collective trust funds—fixed incomesecurities
Intermediate-term investment grade U.S.government/ corporate bonds 83.7 — 83.7 — 23%
U.S. Treasury Inflation-Protected Securities (TIPs) 13.4 — 13.4 — 4%
Private investment fund—convertible securities 9.9 — — 9.9 3%
Private investment fund—high yield securities 9.7 — — 9.7 3%
Total fixed-income investments 128.8 12.1 97.1 19.6 36%
Other investment—private real estate debt fund 20.4 — — 20.4 6%
Total Assets $ 357.4 $ 12.1 $ 305.3 $ 40.0 100%
Fair Value Measurement as of December 31, 2016
Asset Category Balance Level 1 Level 2
Measuredusing NAV
practicalexpedient (a)
% of totalassets
Cash and cash equivalent $ 1.2 $ — $ 1.2 $ — —
Common/collective trust funds—equity securities
U.S. large-cap 130.1 — 130.1 — 44%
U.S. small and mid-cap 19.7 — 19.7 — 7%
Emerging markets 20.8 — 20.8 — 7%
Total equity investments 170.6 — 170.6 — 58%
Emerging markets bond fund 11.4 11.4 — — 4%
Common/collective trust funds—fixed incomesecurities
Intermediate-term investment grade U.S.government/ corporate bonds 74.3 — 74.3 — 25%
U.S. Treasury Inflation-Protected Securities (TIPs) 13.1 — 13.1 — 4%
Private investment fund—convertible securities 9.1 — — 9.1 3%
Private investment fund—high yield securities 9.0 — — 9.0 3%
Total fixed-income investments 116.9 11.4 87.4 18.1 39%
Other investment—private real estate fund 8.4 — — 8.4 3%
Total Assets $ 297.1 $ 11.4 $ 259.2 $ 26.5 100%
(a) Investments are measured using the net asset value per share (or its equivalent) practical expedient and have not been categorized in the fair value hierarchy.The fair value amounts presented in the table are intended to permit a reconciliation of the fair value hierarchy to the value of the total plan assets.
Cash and cash equivalents are primarily comprised of investment in money market mutual funds. In determining fair value, Level 1investments are valued based on quoted market prices in active markets. Investments in common/collective trust funds are valued
98 MOODY’S 2017 10-K

using the net asset value (NAV) per unit in each fund. The NAV is based on the value of the underlying investments owned by eachtrust, minus its liabilities, and then divided by the number of shares outstanding. Common/collective trust funds are categorized inLevel 2 to the extent that they are considered to have a readily determinable fair value. Investments for which fair value is estimated byusing the NAV per share (or its equivalent) as a practical expedient are not categorized in the fair value hierarchy.
Except for the Company’s U.S. funded pension plan, all of Moody’s Retirement Plans are unfunded and therefore have no plan assets.
Cash FlowsThe Company contributed $25.9 million and $22.4 million to its U.S. funded pension plan during the years ended December 31, 2017and 2016, respectively. The Company made payments of $5.1 million and $4.0 million related to its U.S. unfunded pension plan obliga-tions during the years ended December 31, 2017 and 2016, respectively. The Company made payments of $1.0 million and $0.5 millionto its Other Retirement Plans during the years ended December 31, 2017 and 2016, respectively. The Company is currently evaluatingwhether to make a contribution to its funded pension plan in 2018, and anticipates making payments of $4.9 million related to itsunfunded U.S. pension plans and $1.0 million related to its Other Retirement Plans during the year ended December 31, 2018.
Estimated Future Benefits PayableEstimated future benefits payments for the Retirement Plans are as follows as of year ended December 31, 2017:
Year Ending December 31, Pension PlansOther Retirement
Plans
2018 $ 12.2 $ 1.0
2019 13.0 1.1
2020 41.4 1.2
2021 17.8 1.3
2022 19.5 1.4
2023 – 2027 $ 135.7 $ 10.2
Defined Contribution PlansMoody’s has a Profit Participation Plan covering substantially all U.S. employees. The Profit Participation Plan provides for an employeesalary deferral and the Company matches employee contributions, equal to 50% of employee contribution up to a maximum of 3% ofthe employee’s pay. Moody’s also makes additional contributions to the Profit Participation Plan based on year-to-year growth in theCompany’s EPS. Effective January 1, 2008, all new hires are automatically enrolled in the Profit Participation Plan when they meeteligibility requirements unless they decline participation. As the Company’s U.S. DBPPs are closed to new entrants effective January 1,2008, all eligible new hires will instead receive a retirement contribution into the Profit Participation Plan in value similar to the pensionbenefits. Additionally, effective January 1, 2008, the Company implemented a deferred compensation plan in the U.S., which isunfunded and provides for employee deferral of compensation and Company matching contributions related to compensation in excessof the IRS limitations on benefits and contributions under qualified retirement plans. Total expenses associated with U.S. defined con-tribution plans were $43.3 million, $28.3 million and $21.1 million in 2017, 2016, and 2015, respectively. The full year 2017 expenseincludes an accrued profit sharing contribution.
Effective January 1, 2008, Moody’s has designated the Moody’s Stock Fund, an investment option under the Profit Participation Plan, asan Employee Stock Ownership Plan and, as a result, participants in the Moody’s Stock Fund may receive dividends in cash or mayreinvest such dividends into the Moody’s Stock Fund. Moody’s paid approximately $0.7 million during each of the years endedDecember 31, 2017, 2016 and 2015, respectively, for the Company’s common shares held by the Moody’s Stock Fund. The Companyrecords the dividends as a reduction of retained earnings in the Consolidated Statements of Shareholders’ Equity (Deficit). The Moody’sStock Fund held approximately 457,000 and 471,000 shares of Moody’s common stock at December 31, 2017 and 2016, respectively.
International PlansCertain of the Company’s international operations provide pension benefits to their employees. The non-U.S. defined benefit pensionplans are immaterial. For defined contribution plans, company contributions are primarily determined as a percentage of employees’eligible compensation. Moody’s also makes contributions to non-U.S. employees under a profit sharing plan which is based onyear-to-year growth in the Company’s diluted EPS. Expenses related to these defined contribution plans for the years endedDecember 31, 2017, 2016 and 2015 were $23.9 million, $24.5 million and $26.7 million, respectively.
NOTE 14 STOCK-BASED COMPENSATION PLANS
Under the 1998 Plan, 33.0 million shares of the Company’s common stock have been reserved for issuance. The 2001 Plan, which isshareholder approved, permits the granting of up to 50.6 million shares, of which not more than 14.0 million shares are available forgrants of awards other than stock options. The Stock Plans also provide for the granting of restricted stock. The Stock Plans provide thatoptions are exercisable not later than ten years from the grant date. The vesting period for awards under the Stock Plans is generally
MOODY’S 2017 10-K 99

determined by the Board at the date of the grant and has been four years except for employees who are at or near retirement eligi-bility, as defined, for which vesting is between one and four years. Additionally, the vesting period is three years for certainperformance-based restricted stock that contain a condition whereby the number of shares that ultimately vest are based on the ach-ievement of certain non-market based performance metrics of the Company. Options may not be granted at less than the fair marketvalue of the Company’s common stock at the date of grant.
The Company maintains the Directors’ Plan for its Board, which permits the granting of awards in the form of non-qualified stockoptions, restricted stock or performance shares. The Directors’ Plan provides that options are exercisable not later than ten years fromthe grant date. The vesting period is determined by the Board at the date of the grant and is generally one year for both options andrestricted stock. Under the Directors’ Plan, 1.7 million shares of common stock were reserved for issuance. Any director of the Companywho is not an employee of the Company or any of its subsidiaries as of the date that an award is granted is eligible to participate in theDirectors’ Plan.
Presented below is a summary of the stock-based compensation expense and associated tax benefit in the accompanying ConsolidatedStatements of Operations:
Year Ended December 31,
2017 2016 2015
Stock-based compensation expense $ 122.9 $ 98.1 $ 87.2
Tax benefit $ 13.3* $ 31.9 $ 28.6
* Amount includes a decrease in deferred tax assets resulting from a future reduction in the U.S. federal corporate income tax rate in accordance with the TaxAct, more fully described in Note 15.
The fair value of each employee stock option award is estimated on the date of grant using the Black-Scholes option-pricing model thatuses the assumptions noted below. The expected dividend yield is derived from the annual dividend rate on the date of grant. Theexpected stock volatility is based on an assessment of historical weekly stock prices of the Company as well as implied volatility fromMoody’s traded options. The risk-free interest rate is based on U.S. government zero coupon bonds with maturities similar to theexpected holding period. The expected holding period was determined by examining historical and projected post-vesting exercisebehavior activity.
The following weighted average assumptions were used for options granted:
Year Ended December 31,
2017 2016 2015
Expected dividend yield 1.34% 1.83% 1.39%
Expected stock volatility 27% 32% 39%
Risk-free interest rate 2.19% 1.60% 1.88%
Expected holding period 6.5 years 6.8 years 6.9 years
Grant date fair value $ 30.00 $ 22.98 $ 36.08
A summary of option activity as of December 31, 2017 and changes during the year then ended is presented below:
Options Shares
WeightedAverage
Exercise PricePer Share
WeightedAverage
RemainingContractual
TermAggregate
Intrinsic Value
Outstanding, December 31, 2016 3.9 $ 49.68
Granted 0.2 $ 113.80
Exercised (1.2) $ 42.52
Outstanding, December 31, 2017 2.9 $ 57.48 4.7 years $ 261.6
Vested and expected to vest, December 31, 2017 2.8 $ 56.50 4.6 years $ 257.7
Exercisable, December 31, 2017 2.1 $ 43.30 3.4 years $ 216.8
The aggregate intrinsic value in the table above represents the total pre-tax intrinsic value (the difference between Moody’s closingstock price on the last trading day of the year ended December 31, 2017 and the exercise prices, multiplied by the number ofin-the-money options) that would have been received by the option holders had all option holders exercised their options as ofDecember 31, 2017. This amount varies based on the fair value of Moody’s stock. As of December 31, 2017 there was $6.6 million oftotal unrecognized compensation expense related to options. The expense is expected to be recognized over a weighted average periodof 1.4 years.
100 MOODY’S 2017 10-K

The following table summarizes information relating to stock option exercises:
Year Ended December 31,
2017 2016 2015
Proceeds from stock option exercises $ 48.8 $ 71.8 $ 83.9Aggregate intrinsic value $ 88.3 $ 71.3 $ 72.9Tax benefit realized upon exercise $ 31.2 $ 24.3 $ 26.0
A summary of the status of the Company’s nonvested restricted stock as of December 31, 2017 and changes during the year thenended is presented below:
Nonvested Restricted Stock SharesWeighted Average GrantDate Fair Value Per Share
Balance, December 31, 2016 2.4 $ 81.17
Granted 1.0 $ 113.48
Vested (1.0) $ 75.06
Forfeited (0.1) $ 97.06
Balance, December 31, 2017 2.3 $ 97.17
As of December 31, 2017, there was $126.6 million of total unrecognized compensation expense related to nonvested restricted stock.The expense is expected to be recognized over a weighted average period of 1.6 years.
The following table summarizes information relating to the vesting of restricted stock awards:
Year Ended December 31,
2017 2016 2015
Fair value of shares vested $ 110.5 $ 92.9 $ 111.9Tax benefit realized upon vesting $ 34.9 $ 29.4 $ 38.1
A summary of the status of the Company’s performance-based restricted stock as of December 31, 2017 and changes during the yearthen ended is presented below:
Performance-based restricted stock SharesWeighted Average GrantDate Fair Value Per Share
Balance, December 31, 2016 0.5 $ 80.70
Granted 0.2 $ 109.36
Vested (0.2) $ 76.36
Adjustment to shares expected to vest* 0.2 $ 98.88
Balance, December 31, 2017 0.7 $ 94.30
* Reflects an adjustment to shares expected to vest based on the Company’s projected achievement of certain non-market based performance metrics as ofDecember 31, 2017.
The following table summarizes information relating to the vesting of the Company’s performance-based restricted stock awards:
Year Ended December 31,
2017 2016 2015
Fair value of shares vested $ 19.5 $ 23.6 $ 43.1Tax benefit realized upon vesting $ 6.9 $ 8.4 $ 15.6
As of December 31, 2017, there was $31.0 million of total unrecognized compensation expense related to this plan. The expense isexpected to be recognized over a weighted average period of 1.0 years.
The Company has a policy of issuing treasury stock to satisfy shares issued under stock-based compensation plans.
In addition, the Company also sponsors the ESPP. Under the ESPP, 6.0 million shares of common stock were reserved for issuance. TheESPP allows eligible employees to purchase common stock of the Company on a monthly basis at a discount to the average of the highand the low trading prices on the New York Stock Exchange on the last trading day of each month. This discount was 5% in 2017, 2016and 2015 resulting in the ESPP qualifying for non-compensatory status under Topic 718 of the ASC. Accordingly, no compensation
MOODY’S 2017 10-K 101

expense was recognized for the ESPP in 2017, 2016, and 2015. The employee purchases are funded through after-tax payrolldeductions, which plan participants can elect from one percent to ten percent of compensation, subject to the annual federal limit.
NOTE 15 INCOME TAXES
Components of the Company’s provision for income taxes are as follows:
Year Ended December 31,
2017 2016 2015
Current:
Federal $ 453.8 $ 292.9 $ 278.2
State and Local 30.0 39.5 40.1
Non-U.S. 207.0 102.9 93.6
Total current 690.8 435.3 411.9
Deferred:
Federal 155.5 (125.8) 14.7
State and Local 17.5 (20.3) 7.6
Non-U.S. (84.7) (7.0) (4.2)
Total deferred 88.3 (153.1) 18.1
Total provision for income taxes $ 779.1 $ 282.2 $ 430.0
A reconciliation of the U.S. federal statutory tax rate to the Company’s effective tax rate on income before provision for income taxesis as follows:
Year Ended December 31,
2017 2016 2015
U.S. statutory tax rate 35.0% 35.0% 35.0%State and local taxes, net of federal tax benefit 1.9 2.2 3.0Benefit of foreign operations (9.9) (13.3) (5.8)Settlement charge — 27.4 —Legacy tax items — (0.1) (0.2)U.S. Tax Act Impact 17.0 — —Other (0.4) (0.6) (0.8)
Effective tax rate 43.6% 50.6% 31.2%
Income tax paid $ 366.4 $ 355.7 $ 397.4
The source of income before provision for income taxes is as follows:
Year Ended December 31,
2017 2016 2015
United States $ 1,098.5 $ 37.2 $ 913.9
International 688.3 520.8 465.7
Income before provision for income taxes $ 1,786.8 $ 558.0 $ 1,379.6
102 MOODY’S 2017 10-K

The components of deferred tax assets and liabilities are as follows:
December 31,
2017 2016
Deferred tax assets:
Account receivable allowances $ 6.0 $ 6.0
Accumulated depreciation and amortization 1.2 1.3
Stock-based compensation 39.6 54.4
Accrued compensation and benefits 79.2 119.3
Deferred rent and construction allowance 21.2 30.1
Deferred revenue 41.9 46.2
Foreign net operating loss (1) 13.3 3.7
Settlement Charge — 163.2
Legal and professional fees 1.2 4.2
Restructuring 0.2 2.2
Uncertain tax positions 28.6 37.3
Self-insured related reserves 7.5 15.1
Capitalized cost 4.3 —
Other 19.0 4.5
Total deferred tax assets $ 263.2 $ 487.5
Deferred tax liabilities:
Accumulated depreciation and amortization of intangible assets and capitalized software $ (408.8) $ (189.8)
Foreign earnings to be repatriated — (7.5)
Capital gains (25.6) (24.1)
Self-insured related income (7.5) (15.1)
Stock based compensation (3.3) (2.9)
Unrealized gain on net investment hedges - OCI — (21.0)
Other liabilities (3.0) (12.1)
Total deferred tax liabilities (448.2) (272.5)
Net deferred tax (liabilities) asset (185.0) 215.0Valuation allowance (12.8) (3.2)
Total net deferred tax (liabilities) assets $ (197.8) $ 211.8
(1) Amounts are primarily set to expire beginning in 2018, if unused.
On December 22, 2017, the Tax Cut and Jobs Act was signed into law which resulted in significant changes to U.S. corporate tax laws.The Tax Act includes a mandatory one-time deemed repatriation tax (“transition tax”) on previously untaxed accumulated earnings offoreign subsidiaries and beginning in 2018 reduces the statutory federal corporate income tax rate from 35% to 21%. Due to the com-plexities of the Tax Act, the SEC issued guidance requiring that companies provide a reasonable estimate of the impact of the Tax Actto the extent such reasonable estimate has been determined. Accordingly, the Company recorded a provisional estimate for the tran-sition tax of $247.3 million, a portion of which will be payable over eight years, starting in 2018, and will not accrue interest. Addition-ally, the Company recorded a provisional estimate decreasing net deferred tax assets by $56.2 million resulting from the futurereduction in the federal corporate income tax rate. Separately, a statutory tax rate reduction in Belgium resulted in a $57.9 milliondecrease of deferred tax liabilities pertaining to Bureau van Dijk’s acquired intangible assets.
The above provisional estimates may be impacted by a number of additional considerations, including but not limited to the issuance ofregulations and our ongoing analysis of the new law.
As a result of the Tax Act, all previously undistributed foreign earnings have now been subject to U.S. tax. However, the Companyintends to continue to indefinitely reinvest these earnings outside the U.S. and accordingly the Company has not provided non-U.S.deferred income taxes on these indefinitely reinvested earnings. It is not practicable to determine the amount of non-U.S. deferredtaxes that might be required to be provided if such earnings were distributed in the future, due to complexities in the tax laws and inthe hypothetical calculations that would have to be made.
On March 30, 2016, the FASB issued Accounting Standards Update (ASU) 2016-09, Improvements to Employee Share Based PaymentAccounting as more fully discussed in Note 1 to the condensed consolidated financial statements. The new guidance requires all taxeffects related to share based payments to be recorded through the income statement. The Company has adopted the new guidance as
MOODY’S 2017 10-K 103

of the first quarter of 2017 and the adoption resulted in a reduction in its income tax provision of approximately $40 million, or220BPS, for the full year of 2017.
In the first quarter of 2017, the Company adopted Accounting Standards Update 2016-16, “Accounting for Income Taxes: Intra-EntityAsset Transfers of Assets Other than Inventory.” Under previous guidance, the tax effects of intra-entity asset transfers (intercompanysales) were deferred until the transferred asset was sold to a third party or otherwise recovered through use. The new guidance elimi-nates the exception for all intra-entity sales of assets other than inventory. Upon adoption, a cumulative-effect adjustment is recordedin retained earnings as of the beginning of the period of adoption. The net impact upon adoption is a reduction to retained earnings of$4.6 million. The Company does not expect any material impact on its future operations as a result of the adoption of this guidance.
The Company had valuation allowances of $12.8 million and $3.2 million at December 31, 2017 and 2016, respectively, related to for-eign net operating losses for which realization is uncertain.
As of December 31, 2017 the Company had $389.1 million of UTPs of which $353.0 million represents the amount that, if recognized,would impact the effective tax rate in future periods. The increase in UTPs results primarily from the acquisition of Bureau van Dijk.
A reconciliation of the beginning and ending amount of UTPs is as follows:
Year Ended December 31,
2017 2016 2015
Balance as of January 1 $ 199.8 $ 203.4 $ 220.3
Additions for tax positions related to the current year 86.3 21.9 24.1
Additions for tax positions of prior years 120.2 12.4 14.0
Reductions for tax positions of prior years (4.1) (27.6) (41.6)
Settlements with taxing authorities (2.2) (8.3) (7.8)
Lapse of statute of limitations (10.9) (2.0) (5.6)
Balance as of December 31 $ 389.1 $ 199.8 $ 203.4
The Company classifies interest related to UTPs in interest expense in its consolidated statements of operations. Penalties, if incurred,would be recognized in other non-operating expenses. During the years ended December 31, 2017 and 2016, the Company incurred anet interest expense of $15.3 million and $7.8 million respectively, related to UTPs. An additional $5.6 million of accrued interest wasrecorded in connection with the Company’s acquisition of Bureau van Dijk. As of December 31, 2017 and 2016, the amount of accruedinterest recorded in the Company’s consolidated balance sheets related to UTPs was $54.7 million and $34.1 million, respectively.
Moody’s Corporation and subsidiaries are subject to U.S. federal income tax as well as income tax in various state, local and foreignjurisdictions. The Company’s U.S. federal income tax returns for the years 2011 and 2012 are under examination and its 2013 to 2016returns remain open to examination. The Company’s New York State income tax returns for 2011 to 2016 are under examination. TheCompany’s New York City tax return for 2014 is under examination and 2015 to 2016 remain open to examination. The Company’sU.K. tax return for 2012 is under examination. Tax filings in the U.K. remain open to examination for 2013 through 2016.
For current ongoing audits related to open tax years, the Company estimates that it is possible that the balance of UTPs could decreasein the next twelve months as a result of the effective settlement of these audits, which might involve the payment of additional taxes,the adjustment of certain deferred taxes and/or the recognition of tax benefits. It is also possible that new issues might be raised by taxauthorities which might necessitate increases to the balance of UTPs. As the Company is unable to predict the timing of conclusion ofthese audits, the Company is unable to estimate the amount of changes to the balance of UTPs at this time.
104 MOODY’S 2017 10-K

NOTE 16 INDEBTEDNESS
The following table summarizes total indebtedness:
December 31, 2017
PrincipalAmount
Fair Value ofInterest Rate
Swaps (1)
Unamortized(Discount)
Premium
UnamortizedDebt Issuance
CostsCarrying
Value
Notes Payable:
5.50% 2010 Senior Notes, due 2020 $ 500.0 $ — $ (1.0) $ (1.2) $ 497.8
4.50% 2012 Senior Notes, due 2022 500.0 (0.8) (2.0) (1.7) 495.5
4.875% 2013 Senior Notes, due 2024 500.0 — (1.8) (2.4) 495.8
2.75% 2014 Senior Notes (5-Year), due 2019 450.0 (2.2) (0.2) (1.1) 446.5
5.25% 2014 Senior Notes (30-Year), due 2044 600.0 — 3.3 (5.7) 597.6
1.75% 2015 Senior Notes, due 2027 600.4 — — (3.6) 596.8
2.75% 2017 Senior Notes, due 2021 500.0 — (1.3) (3.2) 495.5
2017 Floating Rate Senior Notes, due 2018 300.0 — — (0.5) 299.5
2.625% 2017 Private Placement Notes, due 2023 500.0 — (1.1) (3.5) 495.4
3.25% 2017 Private Placement Notes, due 2028 500.0 — (5.2) (3.9) 490.9
2017 Term Loan Facility, due 2020 500.0 — — (0.7) 499.3
Commercial Paper 130.0 — (0.1) — 129.9
Total debt $5,580.4 $ (3.0) $ (9.4) $ (27.5) $5,540.5
Current portion (429.4)
Total long-term debt $5,111.1
December 31, 2016
PrincipalAmount
Fair Value ofInterest Rate
Swaps (1)
Unamortized(Discount)
Premium
UnamortizedDebt Issuance
CostsCarrying
Value
Notes Payable:
6.06% Series 2007-1 Notes due 2017 $ 300.0 $ — $ — $ — $ 300.0
5.50% 2010 Senior Notes, due 2020 500.0 5.5 (1.3) (1.6) 502.6
4.50% 2012 Senior Notes, due 2022 500.0 (0.2) (2.4) (2.1) 495.3
4.875% 2013 Senior Notes, due 2024 500.0 — (2.1) (2.7) 495.2
2.75% 2014 Senior Notes (5-Year), due 2019 450.0 0.9 (0.4) (1.7) 448.8
5.25% 2014 Senior Notes (30-Year), due 2044 600.0 — 3.3 (5.9) 597.4
1.75% 2015 Senior Notes, due 2027 527.4 — — (3.7) 523.7
Total long-term debt $ 3,377.4 $ 6.2 $ (2.9) $ (17.7) $ 3,363.0
Current portion (300.0)
Total long-term debt $3,063.0
(1) The Company has entered into interest rate swaps on the 2010 Senior Notes, the 2012 Senior Notes and the 2014 Senior Notes (5-Year) which are morefully discussed in Note 5 above.
Term Loan FacilityOn June 6, 2017, the Company entered into a three-year term loan facility with the capacity to borrow up to $500.0 million. OnAugust 8, 2017, the Company borrowed $500 million under the 2017 Term Loan for which the proceeds were used to fund the acquis-ition of Bureau van Dijk and to pay acquisition-related fees and expenses. At the Company’s election, interest on borrowings under the2017 Term Loan is payable at rates that are based on either (a) Alternate Base Rate (as defined in the 2017 Term Loan Facility agree-ment) plus an applicable rate (ranging from 0 BPS to 50 BPS per annum) or (b) the Adjusted LIBO Rate (as defined in the 2017 TermLoan Facility agreement) plus an applicable rate (ranging from 87.5 BPS to 150 BPS per annum), in each case, depending on theCompany’s index debt rating, as set forth in the 2017 Term Loan agreement.
The 2017 Term Loan contains covenants that, among other things, restrict the ability of the Company to engage in mergers, con-solidations, asset sales, transactions with affiliates, sale and leaseback transactions or to incur liens, with exceptions as set forth in the2017 Term Loan Facility agreement. The 2017 Term Loan also contains a financial covenant that requires the Company to maintain a
MOODY’S 2017 10-K 105
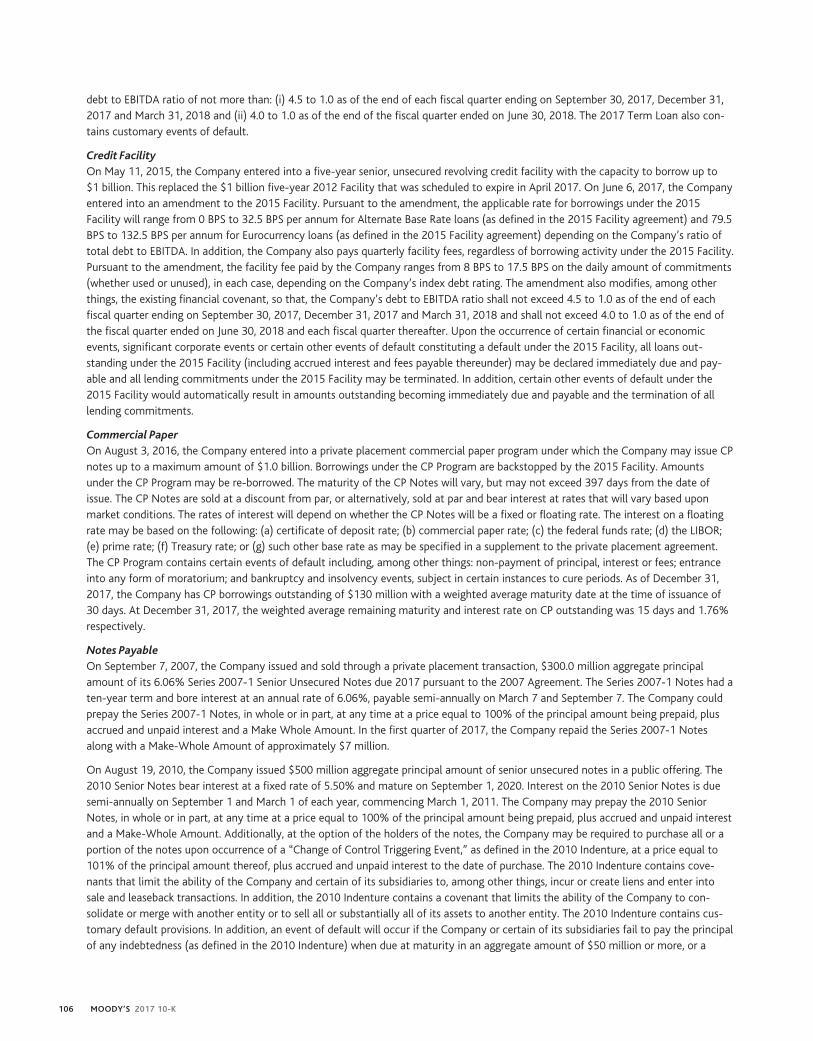
debt to EBITDA ratio of not more than: (i) 4.5 to 1.0 as of the end of each fiscal quarter ending on September 30, 2017, December 31,2017 and March 31, 2018 and (ii) 4.0 to 1.0 as of the end of the fiscal quarter ended on June 30, 2018. The 2017 Term Loan also con-tains customary events of default.
Credit FacilityOn May 11, 2015, the Company entered into a five-year senior, unsecured revolving credit facility with the capacity to borrow up to$1 billion. This replaced the $1 billion five-year 2012 Facility that was scheduled to expire in April 2017. On June 6, 2017, the Companyentered into an amendment to the 2015 Facility. Pursuant to the amendment, the applicable rate for borrowings under the 2015Facility will range from 0 BPS to 32.5 BPS per annum for Alternate Base Rate loans (as defined in the 2015 Facility agreement) and 79.5BPS to 132.5 BPS per annum for Eurocurrency loans (as defined in the 2015 Facility agreement) depending on the Company’s ratio oftotal debt to EBITDA. In addition, the Company also pays quarterly facility fees, regardless of borrowing activity under the 2015 Facility.Pursuant to the amendment, the facility fee paid by the Company ranges from 8 BPS to 17.5 BPS on the daily amount of commitments(whether used or unused), in each case, depending on the Company’s index debt rating. The amendment also modifies, among otherthings, the existing financial covenant, so that, the Company’s debt to EBITDA ratio shall not exceed 4.5 to 1.0 as of the end of eachfiscal quarter ending on September 30, 2017, December 31, 2017 and March 31, 2018 and shall not exceed 4.0 to 1.0 as of the end ofthe fiscal quarter ended on June 30, 2018 and each fiscal quarter thereafter. Upon the occurrence of certain financial or economicevents, significant corporate events or certain other events of default constituting a default under the 2015 Facility, all loans out-standing under the 2015 Facility (including accrued interest and fees payable thereunder) may be declared immediately due and pay-able and all lending commitments under the 2015 Facility may be terminated. In addition, certain other events of default under the2015 Facility would automatically result in amounts outstanding becoming immediately due and payable and the termination of alllending commitments.
Commercial PaperOn August 3, 2016, the Company entered into a private placement commercial paper program under which the Company may issue CPnotes up to a maximum amount of $1.0 billion. Borrowings under the CP Program are backstopped by the 2015 Facility. Amountsunder the CP Program may be re-borrowed. The maturity of the CP Notes will vary, but may not exceed 397 days from the date ofissue. The CP Notes are sold at a discount from par, or alternatively, sold at par and bear interest at rates that will vary based uponmarket conditions. The rates of interest will depend on whether the CP Notes will be a fixed or floating rate. The interest on a floatingrate may be based on the following: (a) certificate of deposit rate; (b) commercial paper rate; (c) the federal funds rate; (d) the LIBOR;(e) prime rate; (f) Treasury rate; or (g) such other base rate as may be specified in a supplement to the private placement agreement.The CP Program contains certain events of default including, among other things: non-payment of principal, interest or fees; entranceinto any form of moratorium; and bankruptcy and insolvency events, subject in certain instances to cure periods. As of December 31,2017, the Company has CP borrowings outstanding of $130 million with a weighted average maturity date at the time of issuance of30 days. At December 31, 2017, the weighted average remaining maturity and interest rate on CP outstanding was 15 days and 1.76%respectively.
Notes PayableOn September 7, 2007, the Company issued and sold through a private placement transaction, $300.0 million aggregate principalamount of its 6.06% Series 2007-1 Senior Unsecured Notes due 2017 pursuant to the 2007 Agreement. The Series 2007-1 Notes had aten-year term and bore interest at an annual rate of 6.06%, payable semi-annually on March 7 and September 7. The Company couldprepay the Series 2007-1 Notes, in whole or in part, at any time at a price equal to 100% of the principal amount being prepaid, plusaccrued and unpaid interest and a Make Whole Amount. In the first quarter of 2017, the Company repaid the Series 2007-1 Notesalong with a Make-Whole Amount of approximately $7 million.
On August 19, 2010, the Company issued $500 million aggregate principal amount of senior unsecured notes in a public offering. The2010 Senior Notes bear interest at a fixed rate of 5.50% and mature on September 1, 2020. Interest on the 2010 Senior Notes is duesemi-annually on September 1 and March 1 of each year, commencing March 1, 2011. The Company may prepay the 2010 SeniorNotes, in whole or in part, at any time at a price equal to 100% of the principal amount being prepaid, plus accrued and unpaid interestand a Make-Whole Amount. Additionally, at the option of the holders of the notes, the Company may be required to purchase all or aportion of the notes upon occurrence of a “Change of Control Triggering Event,” as defined in the 2010 Indenture, at a price equal to101% of the principal amount thereof, plus accrued and unpaid interest to the date of purchase. The 2010 Indenture contains cove-nants that limit the ability of the Company and certain of its subsidiaries to, among other things, incur or create liens and enter intosale and leaseback transactions. In addition, the 2010 Indenture contains a covenant that limits the ability of the Company to con-solidate or merge with another entity or to sell all or substantially all of its assets to another entity. The 2010 Indenture contains cus-tomary default provisions. In addition, an event of default will occur if the Company or certain of its subsidiaries fail to pay the principalof any indebtedness (as defined in the 2010 Indenture) when due at maturity in an aggregate amount of $50 million or more, or a
106 MOODY’S 2017 10-K

default occurs that results in the acceleration of the maturity of the Company’s or certain of its subsidiaries’ indebtedness in anaggregate amount of $50 million or more. Upon the occurrence and during the continuation of an event of default under the 2010Indenture, the notes may become immediately due and payable either automatically or by the vote of the holders of more than 25% ofthe aggregate principal amount of all of the notes then outstanding.
On November 4, 2011, in connection with the acquisition of Copal, a subsidiary of the Company issued a $14.2 million non-interestbearing note to the sellers which represented a portion of the consideration transferred to acquire the Copal entities. If a seller sub-sequently transfers to the Company all of its shares, the Company must repay the seller its proportion of the principal on the later of(i) the fourth anniversary date of the note or (ii) within a time frame set forth in the acquisition agreement relating to the resolution ofcertain income tax uncertainties pertaining to the transaction. The Company has the right to offset payment of the note against certainindemnification assets associated with UTPs related to the acquisition. Accordingly, the Company has offset the liability for this noteagainst the indemnification asset, thus no balance for this note is carried on the Company’s consolidated balance sheet atDecember 31, 2017 and 2016. In the event that the Company would not be required to settle amounts related to the UTPs, the Com-pany would be required to pay the sellers the principal in accordance with the note agreement. The Company may prepay the note inaccordance with certain terms set forth in the acquisition agreement.
On August 20, 2012, the Company issued $500 million aggregate principal amount of unsecured notes in a public offering. The 2012Senior Notes bear interest at a fixed rate of 4.50% and mature on September 1, 2022. Interest on the 2012 Senior Notes is due semi-annually on September 1 and March 1 of each year, commencing March 1, 2013. The Company may prepay the 2012 Senior Notes, inwhole or in part, at any time at a price equal to 100% of the principal amount being prepaid, plus accrued and unpaid interest and aMake-Whole Amount. Additionally, at the option of the holders of the notes, the Company may be required to purchase all or a portionof the notes upon occurrence of a “Change of Control Triggering Event,” as defined in the 2012 Indenture, at a price equal to 101% ofthe principal amount thereof, plus accrued and unpaid interest to the date of purchase. The 2012 Indenture contains covenants thatlimit the ability of the Company and certain of its subsidiaries to, among other things, incur or create liens and enter into sale andleaseback transactions. In addition, the 2012 Indenture contains a covenant that limits the ability of the Company to consolidate ormerge with another entity or to sell all or substantially all of its assets to another entity. The 2012 Indenture contains customarydefault provisions. In addition, an event of default will occur if the Company or certain of its subsidiaries fail to pay the principal of anyindebtedness (as defined in the 2012 Indenture) when due at maturity in an aggregate amount of $50 million or more, or a defaultoccurs that results in the acceleration of the maturity of the Company’s or certain of its subsidiaries’ indebtedness in an aggregateamount of $50 million or more. Upon the occurrence and during the continuation of an event of default under the 2012 Indenture, the2012 Senior notes may become immediately due and payable either automatically or by the vote of the holders of more than 25% ofthe aggregate principal amount of all of the notes then outstanding.
On August 12, 2013, the Company issued $500 million aggregate principal amount of senior unsecured notes in a public offering. The2013 Senior Notes bear interest at a fixed rate of 4.875% and mature on February 15, 2024. Interest on the 2013 Senior Notes is duesemi-annually on February 15 and August 15 of each year, commencing February 15, 2014. The Company may prepay the 2013 SeniorNotes, in whole or in part, at any time at a price equal to 100% of the principal amount being prepaid, plus accrued and unpaid interestand a Make-Whole Amount. Notwithstanding the immediately preceding sentence, the Company may redeem the 2013 Senior Notes,in whole or in part, at any time or from time to time on or after November 15, 2023 (three months prior to their maturity), at aredemption price equal to 100% of the principal amount of the notes to be redeemed, plus accrued and unpaid interest, if any, to, butexcluding the redemption date. Additionally, at the option of the holders of the notes, the Company may be required to purchase all ora portion of the notes upon occurrence of a “Change of Control Triggering Event,” as defined in the 2013 Indenture, at a price equal to101% of the principal amount thereof, plus accrued and unpaid interest to the date of purchase. The 2013 Indenture contains cove-nants that limit the ability of the Company and certain of its subsidiaries to, among other things, incur or create liens and enter intosale and leaseback transactions. In addition, the 2013 Indenture contains a covenant that limits the ability of the Company to con-solidate or merge with another entity or to sell all or substantially all of its assets to another entity. The 2013 Indenture contains cus-tomary default provisions. In addition, an event of default will occur if the Company or certain of its subsidiaries fail to pay the principalof any indebtedness (as defined in the 2013 Indenture) when due at maturity in an aggregate amount of $50 million or more, or adefault occurs that results in the acceleration of the maturity of the Company’s or certain of its subsidiaries’ indebtedness in anaggregate amount of $50 million or more. Upon the occurrence and during the continuation of an event of default under the 2013Indenture, the 2013 Senior Notes may become immediately due and payable either automatically or by the vote of the holders of morethan 25% of the aggregate principal amount of all of the notes then outstanding.
On July 16, 2014, the Company issued $300 million aggregate principal amount of senior unsecured notes in a public offering. The2014 Senior Notes (30-year) bear interest at a fixed rate of 5.25% and mature on July 15, 2044. Interest on the 2014 Senior Notes(30-year) is due semi-annually on January 15 and July 15 of each year, commencing January 15, 2015. The Company may prepay the2014 Senior Notes (30-year), in whole or in part, at any time at a price equal to 100% of the principal amount being prepaid, plus
MOODY’S 2017 10-K 107

accrued and unpaid interest and a Make-Whole Amount. Additionally, at the option of the holders of the notes, the Company may berequired to purchase all or a portion of the notes upon occurrence of a “Change of Control Triggering Event,” as defined in the 2014Indenture, at a price equal to 101% of the principal amount thereof, plus accrued and unpaid interest to the date of purchase. The 2014Indenture contains covenants that limit the ability of the Company and certain of its subsidiaries to, among other things, incur or createliens and enter into sale and leaseback transactions. In addition, the 2014 Indenture contains a covenant that limits the ability of theCompany to consolidate or merge with another entity or to sell all or substantially all of its assets to another entity. The 2014Indenture contains customary default provisions. In addition, an event of default will occur if the Company or certain of its subsidiariesfail to pay the principal of any indebtedness (as defined in the 2014 Indenture) when due at maturity in an aggregate amount of$50 million or more, or a default occurs that results in the acceleration of the maturity of the Company’s or certain of its subsidiaries’indebtedness in an aggregate amount of $50 million or more. Upon the occurrence and during the continuation of an event of defaultunder the 2014 Indenture, the 2014 Senior Notes (30-year) may become immediately due and payable either automatically or by thevote of the holders of more than 25% of the aggregate principal amount of all of the notes then outstanding. On November 13, 2015,the Company issued an additional $300 million aggregate principal amount of the 2014 Senior Notes (30-year) in a public offering. Thisissuance constitutes an additional issuance of, and a single series with, the $300 million 2014 Senior Notes (30-year) issued on July 16,2014 and have the same terms as the 2014 Senior Notes (30-year).
On July 16, 2014, the Company issued $450 million aggregate principal amount of senior unsecured notes in a public offering. The2014 Senior Notes (5-year) bear interest at a fixed rate of 2.75% and mature July 15, 2019. Interest on the 2014 Senior Notes (5-year)is due semi-annually on January 15 and July 15 of each year, commencing January 15, 2015. The Company may prepay the 2014Senior Notes (5-year), in whole or in part, at any time at a price prior to June 15, 2019, equal to 100% of the principal amount beingprepaid, plus accrued and unpaid interest and a Make-Whole Amount. Notwithstanding the immediately preceding sentence, theCompany may redeem the 2014 Senior Notes (5-year), in whole or in part, at any time or from time to time on or after June 15, 2019(one month prior to their maturity), at a redemption price equal to 100% of the principal amount of the notes to be redeemed, plusaccrued and unpaid interest, if any, to, but excluding the redemption date. Additionally, at the option of the holders of the notes, theCompany may be required to purchase all or a portion of the notes upon occurrence of a “Change of Control Triggering Event,” asdefined in the 2014 Indenture, at a price equal to 101% of the principal amount thereof, plus accrued and unpaid interest to the date ofpurchase. The 2014 Indenture contains covenants that limit the ability of the Company and certain of its subsidiaries to, among otherthings, incur or create liens and enter into sale and leaseback transactions. In addition, the 2014 Indenture contains a covenant thatlimits the ability of the Company to consolidate or merge with another entity or to sell all or substantially all of its assets to anotherentity. The 2014 Indenture contains customary default provisions. In addition, an event of default will occur if the Company or certainof its subsidiaries fail to pay the principal of any indebtedness (as defined in the 2014 Indenture) when due at maturity in an aggregateamount of $50 million or more, or a default occurs that results in the acceleration of the maturity of the Company’s or certain of itssubsidiaries’ indebtedness in an aggregate amount of $50 million or more. Upon the occurrence and during the continuation of anevent of default under the 2014 Indenture, the 2014 Senior Notes (5-year) may become immediately due and payable eitherautomatically or by the vote of the holders of more than 25% of the aggregate principal amount of all of the notes then outstanding.
On March 9, 2015, the Company issued €500 million aggregate principal amount of senior unsecured notes in a public offering. The2015 Senior Notes bear interest at a fixed rate of 1.75% and mature on March 9, 2027. Interest on the 2015 Senior Notes is due annu-ally on March 9 of each year, commencing March 9, 2016. The Company may prepay the 2015 Senior Notes, in whole or in part, at anytime at a price equal to 100% of the principal amount being prepaid, plus accrued and unpaid interest and a Make-Whole Amount.Additionally, at the option of the holders of the notes, the Company may be required to purchase all or a portion of the notes uponoccurrence of a “Change of Control Triggering Event,” as defined in the 2015 Indenture, at a price equal to 101% of the principalamount thereof, plus accrued and unpaid interest to the date of purchase. The 2015 Indenture contains covenants that limit the abilityof the Company and certain of its subsidiaries to, among other things, incur or create liens and enter into sale and leaseback trans-actions. In addition, the 2015 Indenture contains a covenant that limits the ability of the Company to consolidate or merge withanother entity or to sell all or substantially all of its assets to another entity. The 2015 Indenture contains customary default provisions.In addition, an event of default will occur if the Company or certain of its subsidiaries fail to pay the principal of any indebtedness (asdefined in the 2015 Indenture) when due at maturity in an aggregate amount of $50 million or more, or a default occurs that results inthe acceleration of the maturity of the Company’s or certain of its subsidiaries’ indebtedness in an aggregate amount of $50 million ormore. Upon the occurrence and during the continuation of an event of default under the 2015 Indenture, the 2015 Senior Notes maybecome immediately due and payable either automatically or by the vote of the holders of more than 25% of the aggregate principalamount of all of the notes then outstanding. The Company has designated the entire balance of the 2015 Senior Notes as a netinvestment hedge as more fully discussed in Note 5.
On March 2, 2017, the Company issued $500 million aggregate principal amount of senior unsecured notes in a public offering. The2017 Senior Notes bear interest at a fixed rate of 2.750% and mature on December 15, 2021. Interest on the 2017 Senior Notes is duesemiannually on June 15 and December 15 of each year, commencing June 15, 2017. The Company may redeem the 2017 Senior
108 MOODY’S 2017 10-K

Notes, in whole or in part, at any time at a price equity to 100% of the principal amount being redeemed, plus accrued and unpaid inter-est and a Make-Whole Amount.
On March 2, 2017, the Company issued $300 million aggregate principal amount of senior unsecured floating rate notes in a publicoffering. The 2017 Floating Rate Senior Notes bear interest at a floating rate which is to be calculated by Wells Fargo Bank, NationalAssociation, equal to three-month LIBOR as determined on the interest determination date plus 0.35%. The interest determination datefor an interest period is the second London business day preceding the first day of such interest period. The 2017 Floating Rate SeniorNotes mature on September 4, 2018. Interest on the 2017 Floating Rate Senior Notes will accrue from March 2, 2017, and will be paidquarterly in arrears on June 4, 2017, September 4, 2017, December 4, 2017, March 4, 2018, June 4, 2018 and on the maturity date, tothe record holders at the close of business on the business date preceding the interest payment date. The 2017 Floating Rate SeniorNotes are not redeemable prior to their maturity.
On June 12, 2017, the Company issued and sold through a private placement transaction, $500 million aggregate principal amount ofits 2017 Private Placement Notes Due 2023 and $500 million aggregate principal amount of its 2017 Private Placement Notes Due2028. The 2017 Private Placement Notes Due 2023 bear interest at the fixed rate of 2.625% per year and mature on January 15, 2023.The 2017 Private Placement Notes Due 2028 bear interest at the fixed rate of 3.250% per year and mature on January 15, 2028. Inter-est on each tranche of notes will be due semiannually on January 15 and July 15 of each year, commencing January 15, 2018. TheCompany entered into a registration rights agreement, dated as of June 12, 2017, with the representatives of the initial purchasers ofthe notes, which sets forth, among other things, the Company’s obligations to register the notes under the Securities Act, within 365days of issuance. The net proceeds of the note offering were used to finance, in part, the acquisition of Bureau van Dijk. In addition, theCompany may redeem each of the notes in whole or in part, at any time at a price equity to 100% of the principal amount beingredeemed, plus accrued interest and a Make-Whole Amount.
For the 2017 Floating Rate Notes, 2017 Senior Notes, 2017 Private Placement Notes Due 2023 and 2017 Private Placement Notes Due2028, at the option of the holders of the notes, the Company may be required to purchase all or a portion of the notes upon occurrenceof a “Change of Control Triggering Event,” as defined in the 2017 Indenture, at a price equal to 101% of the principal amount, thereof,plus accrued and unpaid interest to the date of purchase. The 2017 Indenture contains covenants that limit the ability of the Companyand certain of its subsidiaries to, among other things, incur or create liens and enter into sale and leaseback transactions. In addition,the 2017 Indenture contains a covenant that limits the ability of the Company to consolidate or merge with another entity or to sell allor substantially all of its assets to another entity. The 2017 Indenture also contains customary default provisions. In addition, an eventof default will occur if the Company or certain of its subsidiaries fail to pay the principal of any indebtedness (as defined in the 2017Indenture) when due at maturity in an aggregate amount of $50 million or more, or a default occurs that results in the acceleration ofthe maturity of the Company’s or certain of its subsidiaries’ indebtedness in an aggregate amount of $50 million or more. Upon theoccurrence and during the continuation of an event of default under the 2017 Indenture, all the aforementioned notes may becomeimmediately due and payable either automatically or by the vote of the holders of more than 25% of the aggregate principal amountof all of the notes of the applicable series then outstanding.
2017 Bridge Credit FacilityOn May 15, 2017, the Company entered into a 364-Day Bridge Credit Agreement providing for a $1.5 billion bridge facility. OnJune 12, 2017, the commitments under this facility were terminated upon the issuance of the 2017 Private Placement Notes Due 2023,the 2017 Private Placement Notes Due 2028 and the 2017 Term Loan Facility.
At December 31, 2017, the Company was in compliance with all covenants contained within all of the debt agreements. All the debtagreements contain cross default provisions which state that default under one of the aforementioned debt instruments could in turnpermit lenders under other debt instruments to declare borrowings outstanding under those instruments to be immediately due andpayable. As of December 31, 2017, there were no such cross defaults.
MOODY’S 2017 10-K 109

The repayment schedule for the Company’s borrowings is as follows:
Year EndingDecember 31,
2010SeniorNotes
due2020
2012SeniorNotes
due2022
2013SeniorNotes
due2024
2014SeniorNotes
(5-year)due
2019
2014SeniorNotes
(30-year)due
2044
2015SeniorNotes
due2027
TermLoan
Facilitydue
2020
2017Floating
RateSeniorNotes
due2018
2017SeniorNotes
due2021
2017Private
PlacementNotes due
2023
2017Private
PlacementNotes due
2028Commercial
Paper Total
2018 $ — $ — $ — $ — $ — $ — $ — $ 300.0 $ — $ — $ — $ 130.0 $ 430.0
2019 — — — 450.0 — — — — — — — 450.0
2020 500.0 — — — — — 500.0 — — — — — 1,000.0
2021 — — — — — — — — 500.0 — — — 500.0
2022 — 500.0 — — — — — — — — — — 500.0
Thereafter — — 500.0 — 600.0 600.4 — — — 500.0 500.0 — 2,700.4
Total $500.0 $500.0 $500.0 $450.0 $ 600.0 $600.4 $500.0 $ 300.0 $500.0 $ 500.0 $ 500.0 $ 130.0 $5,580.4
INTEREST EXPENSE, NET
The following table summarizes the components of interest as presented in the consolidated statements of operations:
Year Ended December 31,
2017 2016 2015
Income $ 16.0 $ 10.9 $ 9.7
Expense on borrowings (190.1) (141.9) (120.6)
Expense on UTPs and other tax related liabilities (a) (15.3) (7.8) (5.3)
Legacy Tax (b) — 0.2 0.7
Capitalized 1.0 0.8 0.4
Total $ (188.4) $ (137.8) $ (115.1)
Interest paid (c) $ 158.2 $ 136.7 $ 108.3
(a) The 2015 amount includes approximately $2 million in interest income on a tax refund and a $4 million interest reversal relating to the favorable resolutionof a tax audits.
(b) Represents a reduction of accrued interest related to the favorable resolution of Legacy Tax Matters.
(c) Interest paid includes net settlements on interest rate swaps more fully discussed in Note 5.
The Company’s debt is recorded at its carrying amount, which represents the issuance amount plus or minus any issuance premium ordiscount, except for the 2010 Senior Notes, the 2014 Senior Notes (5-Year) and the 2012 Senior Notes which are recorded at thecarrying amount adjusted for the fair value of an interest rate swap used to hedge the fair value of the note.
110 MOODY’S 2017 10-K
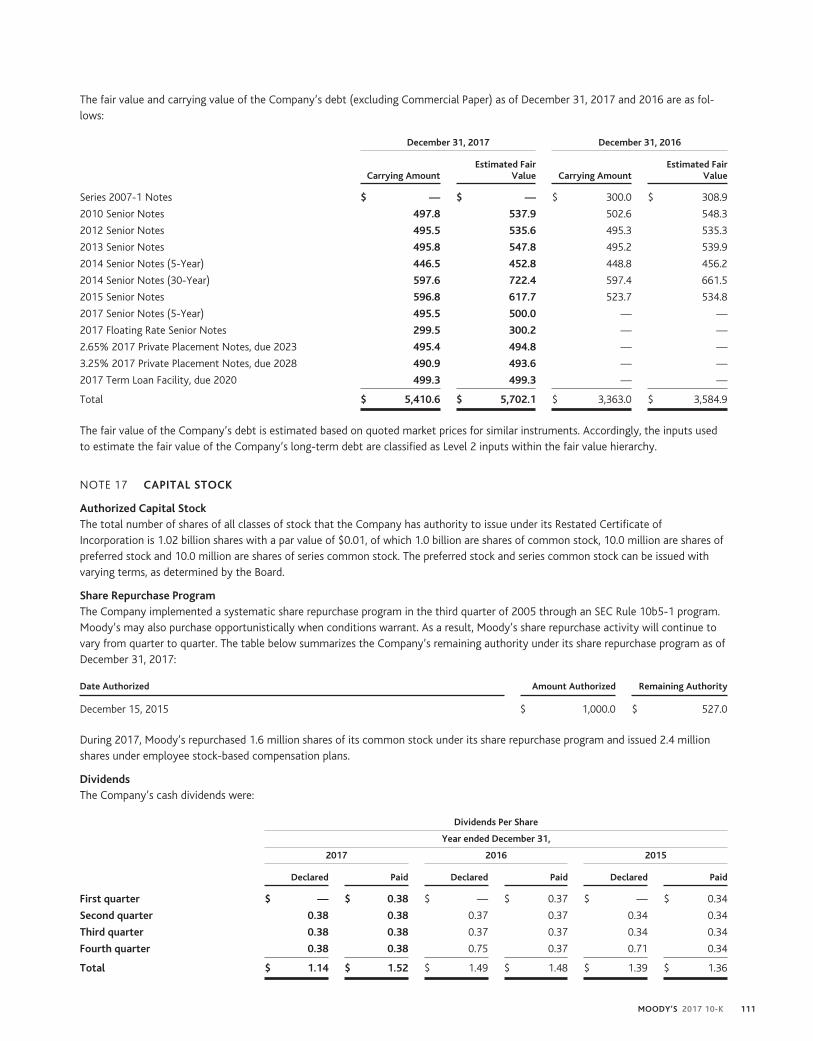
The fair value and carrying value of the Company’s debt (excluding Commercial Paper) as of December 31, 2017 and 2016 are as fol-lows:
December 31, 2017 December 31, 2016
Carrying AmountEstimated Fair
Value Carrying AmountEstimated Fair
Value
Series 2007-1 Notes $ — $ — $ 300.0 $ 308.9
2010 Senior Notes 497.8 537.9 502.6 548.3
2012 Senior Notes 495.5 535.6 495.3 535.3
2013 Senior Notes 495.8 547.8 495.2 539.9
2014 Senior Notes (5-Year) 446.5 452.8 448.8 456.2
2014 Senior Notes (30-Year) 597.6 722.4 597.4 661.5
2015 Senior Notes 596.8 617.7 523.7 534.8
2017 Senior Notes (5-Year) 495.5 500.0 — —
2017 Floating Rate Senior Notes 299.5 300.2 — —
2.65% 2017 Private Placement Notes, due 2023 495.4 494.8 — —
3.25% 2017 Private Placement Notes, due 2028 490.9 493.6 — —
2017 Term Loan Facility, due 2020 499.3 499.3 — —
Total $ 5,410.6 $ 5,702.1 $ 3,363.0 $ 3,584.9
The fair value of the Company’s debt is estimated based on quoted market prices for similar instruments. Accordingly, the inputs usedto estimate the fair value of the Company’s long-term debt are classified as Level 2 inputs within the fair value hierarchy.
NOTE 17 CAPITAL STOCK
Authorized Capital StockThe total number of shares of all classes of stock that the Company has authority to issue under its Restated Certificate ofIncorporation is 1.02 billion shares with a par value of $0.01, of which 1.0 billion are shares of common stock, 10.0 million are shares ofpreferred stock and 10.0 million are shares of series common stock. The preferred stock and series common stock can be issued withvarying terms, as determined by the Board.
Share Repurchase ProgramThe Company implemented a systematic share repurchase program in the third quarter of 2005 through an SEC Rule 10b5-1 program.Moody’s may also purchase opportunistically when conditions warrant. As a result, Moody’s share repurchase activity will continue tovary from quarter to quarter. The table below summarizes the Company’s remaining authority under its share repurchase program as ofDecember 31, 2017:
Date Authorized Amount Authorized Remaining Authority
December 15, 2015 $ 1,000.0 $ 527.0
During 2017, Moody’s repurchased 1.6 million shares of its common stock under its share repurchase program and issued 2.4 millionshares under employee stock-based compensation plans.
DividendsThe Company’s cash dividends were:
Dividends Per Share
Year ended December 31,
2017 2016 2015
Declared Paid Declared Paid Declared Paid
First quarter $ — $ 0.38 $ — $ 0.37 $ — $ 0.34
Second quarter 0.38 0.38 0.37 0.37 0.34 0.34
Third quarter 0.38 0.38 0.37 0.37 0.34 0.34
Fourth quarter 0.38 0.38 0.75 0.37 0.71 0.34
Total $ 1.14 $ 1.52 $ 1.49 $ 1.48 $ 1.39 $ 1.36
MOODY’S 2017 10-K 111

On January 24, 2018, the Board approved the declaration of a quarterly dividend of $0.44 per share of Moody’s common stock, payableon March 12, 2018 to shareholders of record at the close of business on February 20, 2018. The continued payment of dividends at therate noted above, or at all, is subject to the discretion of the Board.
NOTE 18 LEASE COMMITMENTS
Moody’s operates its business from various leased facilities, which are under operating leases that expire over the next 10 years.Moody’s also leases certain computer and other equipment under operating leases that expire over the next five years. Rent expense,including lease incentives, is amortized on a straight-line basis over the related lease term. Rent expense under operating leases for theyears ended December 31, 2017, 2016 and 2015 was $97.0 million, $95.4 million and $87.6 million, respectively.
The 21-year operating lease for the Company’s headquarters at 7WTC which commenced on October 20, 2006 contains a total of 20years of renewal options. These renewal options apply to both the original lease as well as additional floors leased by the Companybeginning in 2014. Additionally, the 17.5 year operating lease for the Company’s London, England office which commenced on Febru-ary 6, 2008 contains a total of 15 years of renewal options.
The minimum rent for operating leases at December 31, 2017 is as follows:
Year Ending December 31, Operating Leases
2018 $ 108.3
2019 87.1
2020 80.8
2021 75.7
2022 72.6
Thereafter 290.6
Total minimum lease payments $ 715.1
NOTE 19 CONTINGENCIES
Given the nature of their activities, Moody’s and its subsidiaries are subject to legal and tax proceedings, governmental, regulatory andlegislative investigations and inquiries, and claims and litigation that are based on ratings assigned by MIS or that are otherwiseincidental to the Company’s business. The Company periodically receives and responds to subpoenas and other inquiries which mayrelate to Moody’s activities or to activities of others that may result in claims and litigation, proceedings or investigations by privatelitigants or governmental, regulatory or legislative authorities. Moody’s also is subject to ongoing tax audits as addressed in Note 15 tothe financial statements.
Management periodically assesses the Company’s liabilities and contingencies in connection with these matters based upon the latestinformation available. For claims, litigation and proceedings and governmental investigations and inquiries not related to income taxes,the Company records liabilities in the consolidated financial statements when it is both probable that a liability has been incurred andthe amount of loss can be reasonably estimated and periodically adjusts these as appropriate. When the reasonable estimate of the lossis within a range of amounts, the minimum amount of the range is accrued unless some higher amount within the range is a betterestimate than another amount within the range. In instances when a loss is reasonably possible but uncertainties exist related to theprobable outcome and/or the amount or range of loss, management does not record a liability but discloses the contingency if material.As additional information becomes available, the Company adjusts its assessments and estimates of such matters accordingly. Moody’salso discloses material pending legal proceedings pursuant to SEC rules and other pending matters as it may determine to be appro-priate.
In view of the inherent difficulty of assessing the potential outcome of legal proceedings, governmental, regulatory and legislative inves-tigations and inquiries, claims and litigation and similar matters and contingencies, particularly when the claimants seek large orindeterminate damages or assert novel legal theories or the matters involve a large number of parties, the Company often cannot pre-dict what the eventual outcome of the pending matters will be or the timing of any resolution of such matters. The Company also maybe unable to predict the impact (if any) that any such matters may have on how its business is conducted, on its competitive positionor on its financial position, results of operations or cash flows. As the process to resolve any pending matters progresses, managementwill continue to review the latest information available and assess its ability to predict the outcome of such matters and the effects, ifany, on its operations and financial condition and to accrue for and disclose such matters as and when required. However, because suchmatters are inherently unpredictable and unfavorable developments or resolutions can occur, the ultimate outcome of such matters,including the amount of any loss, may differ from those estimates.
112 MOODY’S 2017 10-K

NOTE 20 SEGMENT INFORMATION
The Company is organized into two operating segments: MIS and MA and accordingly, the Company reports in two reportable seg-ments: MIS and MA.
The MIS segment consists of five LOBs. The CFG, SFG, FIG and PPIF LOBs generate revenue principally from fees for the assignment andongoing monitoring of credit ratings on debt obligations and the entities that issue such obligations in markets worldwide. The MISOther LOB primarily consists of financial instruments pricing services in the Asia-Pacific region as well as ICRA non-ratings revenue.
The MA segment develops a wide range of products and services that support the risk management activities of institutional partic-ipants in global financial markets. The MA segment consists of three LOBs—RD&A, ERS and PS.
On August 10, 2017, a subsidiary of the Company acquired Yellow Maple I B.V., an indirect parent of Bureau van Dijk, a global providerof business intelligence and company information products. Bureau van Dijk is part of the MA reportable segment and its revenue isincluded in the RD&A LOB. Refer to Note 7 for further discussion on the acquisition.
Revenue for MIS and expenses for MA include an intersegment royalty charged to MA for the rights to use and distribute content, dataand products developed by MIS. The royalty rate charged by MIS approximates the fair value of the aforementioned content, data andproducts and is generally based on comparable market transactions. Also, revenue for MA and expenses for MIS include an intersegmentfee charged to MIS from MA for certain MA products and services utilized in MIS’s ratings process. These fees charged by MA are gen-erally equal to the costs incurred by MA to produce these products and services. Additionally, overhead costs and corporate expenses ofthe Company that exclusively benefit only one segment are fully charged to that segment. Overhead costs and corporate expenses ofthe Company that benefit both segments are allocated to each segment based on a revenue-split methodology. Accordingly, a report-able segment’s share of these costs will increase as its proportion of revenue relative to Moody’s total revenue increases. Overheadexpenses include costs such as rent and occupancy, information technology and support staff such as finance, human resources andinformation technology. “Eliminations” in the table below represent intersegment revenue/expense. Moody’s does not report theCompany’s assets by reportable segment, as this metric is not used by the chief operating decision maker to allocate resources to thesegments. Consequently, it is not practical to show assets by reportable segment.
Financial Information by SegmentThe table below shows revenue, Adjusted Operating Income and operating income by reportable segment. Adjusted Operating Incomeis a financial metric utilized by the Company’s chief operating decision maker to assess the profitability of each reportable segment.
Year Ended December 31,
2017 2016
MIS MA Eliminations Consolidated MIS MA Eliminations Consolidated
Revenue $2,885.5 $1,446.3 $ (127.7) $ 4,204.1 $2,471.0 $1,246.9 $ (113.7) $ 3,604.2
Operating, SG&A 1,246.9 1,095.0 (127.7) 2,214.2 1,115.6 961.1 (113.7) 1,963.0
Adjusted OperatingIncome 1,638.6 351.3 — 1,989.9 1,355.4 285.8 — 1,641.2
Less:Depreciation andamortization 74.7 83.6 — 158.3 73.8 52.9 — 126.7
Restructuring — — — — 10.2 1.8 — 12.0
Acquisition-RelatedExpenses — 22.5 — 22.5 — — — —
Settlement Charge — — — — 863.8 — — 863.8
Operating income $1,563.9 $ 245.2 $ — $ 1,809.1 $ 407.6 $ 231.1 $ — $ 638.7
MOODY’S 2017 10-K 113

Year Ended December 31,
2015
MIS MA Eliminations Consolidated
Revenue $2,427.7 $1,163.4 $ (106.6) $ 3,484.5
Operating, SG&A 1,120.3 883.9 (106.6) 1,897.6
Adjusted Operating Income 1,307.4 279.5 — 1,586.9
Less:Depreciation and amortization 66.0 47.5 — 113.5
Operating income $1,241.4 $ 232.0 $ — $ 1,473.4
The cumulative restructuring charges related to actions taken in 2016 as more fully discussed in Note 9 for the MIS and MA reportablesegments are $10.2 and $1.8 million, respectively. The charge in MA reflects cost management initiatives in certain corporate overheadfunctions of which portion is allocated to MA based on a revenue-split methodology.
MIS AND MA REVENUE BY LINE OF BUSINESS
The tables below present revenue by LOB:
Year Ended December 31,
2017 2016 2015
MIS:
Corporate finance (CFG) $ 1,392.7 $ 1,122.3 $ 1,112.7
Structured finance (SFG) 495.5 436.8 449.1
Financial institutions (FIG) 435.8 368.9 365.6
Public, project and infrastructure finance (PPIF) 431.3 412.2 376.4
Total ratings revenue 2,755.3 2,340.2 2,303.8
MIS Other 18.5 30.6 30.4
Total external revenue 2,773.8 2,370.8 2,334.2
Intersegment royalty 111.7 100.2 93.5
Total 2,885.5 2,471.0 2,427.7
MA:
Research, data and analytics (RD&A) 832.7 667.6 626.4
Enterprise risk solutions (ERS) 448.6 418.8 374.0
Professional services (PS) 149.0 147.0 149.9
Total external revenue 1,430.3 1,233.4 1,150.3
Intersegment revenue 16.0 13.5 13.1
Total 1,446.3 1,246.9 1,163.4
Eliminations (127.7) (113.7) (106.6)
Total MCO $ 4,204.1 $ 3,604.2 $ 3,484.5
114 MOODY’S 2017 10-K

CONSOLIDATED REVENUE AND LONG-LIVED ASSETS INFORMATION BY GEOGRAPHIC AREA
Year Ended December 31,
2017 2016 2015
Revenue:
U.S. $ 2,348.4 $ 2,105.5 $ 2,009.0
International:
EMEA 1,131.7 904.4 882.3
Asia-Pacific 471.4 373.2 364.2
Americas 252.6 221.1 229.0
Total International 1,855.7 1,498.7 1,475.5
Total $ 4,204.1 $ 3,604.2 $ 3,484.5
Long-lived assets at December 31:
United States $ 672.5 $ 681.9 $ 657.5
International 5,037.4 964.0 924.3
Total $ 5,709.9 $ 1,645.9 $ 1,581.8
NOTE 21 VALUATION AND QUALIFYING ACCOUNTS
Accounts receivable allowances primarily represent adjustments to customer billings that are estimated when the related revenue isrecognized and also represents an estimate for uncollectible accounts. The valuation allowance on deferred tax assets relates to foreignnet operating tax losses for which realization is uncertain. Below is a summary of activity:
Year Ended December 31,Balance at Beginning
of the YearCharged to costs
and expenses Deductions(1)
Balance at Endof the Year
2017
Accounts receivable allowance $ (25.7) $ (19.6) $ 8.7 $ (36.6)
Deferred tax assets—valuation allowance $ (3.2) $ (9.9) $ 0.3 $ (12.8)
2016
Accounts receivable allowance $ (27.5) $ (6.2) $ 8.0 $ (25.7)
Deferred tax assets—valuation allowance $ (4.3) $ (0.9) $ 2.0 $ (3.2)
2015
Accounts receivable allowance $ (29.4) $ (9.0) $ 10.9 $ (27.5)
Deferred tax assets—valuation allowance $ (6.9) $ 2.4 $ 0.2 $ (4.3)
(1) Reflects write off of uncollectible accounts receivable or expiration of foreign net operating tax losses.
NOTE 22 OTHER NON-OPERATING (EXPENSE) INCOME, NET
The following table summarizes the components of other non-operating (expense) income, net as presented in the consolidated state-ments of operations:
Year Ended December 31,
2017 2016 2015
FX (loss)/gain (a) $ (16.8) $ 50.1 $ 1.1
Legacy Tax (b) — 1.6 6.4Joint venture income 13.3 11.4 11.8
Other (1.2) (6.0) 2.0
Total $ (4.7) $ 57.1 $ 21.3
(a) The FX gain in 2016 includes an approximate $35 million net gain relating to the substantial liquidation/sale of certain non-U.S. subsidiaries. Pursuant to ASC830, cumulative translation gains relating to these subsidiaries were reclassified to other non operating income, net in the consolidated statement ofoperations.
(b) The 2016 and 2015 amount relate to the expiration of a statute of limitations for Legacy Tax Matters.
MOODY’S 2017 10-K 115

NOTE 23 RELATED PARTY TRANSACTIONS
Moody’s Corporation made grants of $12 million, $4 million and $0 to The Moody’s Foundation during years ended December 31,2017, 2016 and 2015, respectively. The Foundation carries out philanthropic activities primarily in the areas of education and healthand human services. Certain members of Moody’s senior management are on the board of the Foundation.
NOTE 24 QUARTERLY FINANCIAL DATA (UNAUDITED)
Three Months Ended
(amounts in millions, except EPS) March 31 June 30 September 30 December 31
2017
Revenue $ 975.2 $1,000.5 $ 1,062.9 $ 1,165.5
Operating income $ 443.4 $ 457.5 $ 445.4 $ 462.8
Net income attributable to Moody’s $ 345.6 $ 312.2 $ 317.3 $ 25.5
EPS:
Basic $ 1.81 $ 1.63 $ 1.66 $ 0.13
Diluted $ 1.78 $ 1.61 $ 1.63 $ 0.13
2016
Revenue $ 816.1 $ 928.9 $ 917.1 $ 942.1
Operating income (loss) $ 304.1 $ 410.2 $ 397.5 $ (473.1)
Net income (loss) attributable to Moody’s $ 184.4 $ 255.5 $ 255.3 $ (428.6)
EPS:
Basic $ 0.95 $ 1.32 $ 1.33 $ (2.25)
Diluted $ 0.93 $ 1.30 $ 1.31 $ (2.25)
Basic and diluted EPS are computed for each of the periods presented. The number of weighted average shares outstanding changes ascommon shares are issued pursuant to employee stock-based compensation plans and for other purposes or as shares are repurchased.Therefore, the sum of basic and diluted EPS for each of the four quarters may not equal the full year basic and diluted EPS.
Net Income attributable to Moody’s for the three months ended March 31, 2017 includes the $59.7 million CCXI Gain. Net Incomeattributable to Moody’s for the three months ended June 30, 2017 and September 30, 2017 include $41.2 million ($25.3 million net oftax) and $69.9 million ($44.4 million net of tax), respectively, related to gains from FX collars and forward contracts executed to hedgeagainst variability in the euro-denominated purchase price for Bureau van Dijk. Net Income attributable to Moody’s in the threemonths ended December 31, 2017 includes a net charge of $245.6 million relating to the U.S. corporate tax reform and changes instatutory tax rates in Belgium as more fully discussed in Note 15. Both the operating loss and the net loss attributable to Moody’s inthe three months ended December 31, 2016 primarily reflect the Settlement Charge of $863.8 million ($700.7 million, net-of-tax). Inaddition, the net loss attributable to Moody’s for the three months ended December 31, 2016 includes an approximate $35 million FXgain related to the liquidation of a subsidiary as well as benefits of $1.6 million to net income related to the resolution of Legacy TaxMatters.
NOTE 25 SUBSEQUENT EVENT
On January 24, 2018, the Board approved the declaration of a quarterly dividend of $0.44 per share for Moody’s common stock, pay-able March 12, 2018 to shareholders of record at the close of business on February 20, 2018.
116 MOODY’S 2017 10-K

ITEM 9. CHANGES IN AND DISAGREEMENTS WITH ACCOUNTANTS ON ACCOUNTING ANDFINANCIAL DISCLOSURE
Not applicable
ITEM 9A. CONTROLS AND PROCEDURES
Evaluation of Disclosure Controls and ProceduresThe Company carried out an evaluation, as required by Rule 13a-15(b) under the Exchange Act, under the supervision and with theparticipation of the Company’s management, including the Company’s Chief Executive Officer and Chief Financial Officer, of the effec-tiveness of the design and operation of the Company’s disclosure controls and procedures, as defined in Rule 13a-15(e) of the ExchangeAct, as of the end of the period covered by this report (the “Evaluation Date”). Based on such evaluation, such officers have concludedthat, as of the Evaluation Date, the Company’s disclosure controls and procedures were effective to provide reasonable assurance thatinformation required to be disclosed by the Company in reports that it files or submits under the Exchange Act is recorded, processed,summarized and reported within the time periods specified in the communication to the Company’s management, including theCompany’s Chief Executive Officer and Chief Financial Officer, as appropriate to allow timely decisions regarding required disclosure.During the fiscal year ended December 31, 2017, the Company acquired Bureau van Dijk and management has excluded this acquiredbusiness from its assessment of the effectiveness of disclosure controls and procedures as of the Evaluation Date. The total assets(excluding acquired goodwill and intangible assets which are included within the scope of this assessment) and revenues of Bureau vanDijk represents approximately $322 million and $92 million, respectively, of the corresponding amounts in our consolidated financialstatements for the fiscal year ended December 31, 2017.
Changes In Internal Control Over Financial ReportingInformation in response to this Item is set forth under the caption “Management’s Report on Internal Control Over Financial Reporting”,in Part II, Item 8 of this annual report on Form 10-K.
Except as described below, the Company’s management, including the Company’s Chief Executive Officer and Chief Financial Officer,has determined that there were no changes in the Company’s internal control over financial reporting that have materially affected, orare reasonably likely to materially affect, these internal controls over financial reporting during the period covered by this report.
During the fiscal year ended December 31, 2017, the Company acquired Bureau van Dijk, and we are in the process of integrating theacquired entity into the Company’s financial reporting processes and procedures and internal controls over financial reporting.Additionally, during the fiscal year ended December 31, 2017, the Company implemented internal controls relating to the adoption andassessment of the impact of the new accounting standard relating to revenue recognition which will be adopted by Moody’s on Jan-uary 1, 2018.
ITEM 9B. OTHER INFORMATION
Not applicable.
MOODY’S 2017 10-K 117
PART III
Except for the information relating to the executive officers of the Company set forth in Part I of this annual report on Form 10-K, theinformation called for by Items 10-14 is contained in the Company’s definitive proxy statement for use in connection with its annualmeeting of stockholders scheduled to be held on April 24, 2018, and is incorporated herein by reference.
ITEM 10. DIRECTORS, EXECUTIVE OFFICERS AND CORPORATE GOVERNANCE
ITEM 11. EXECUTIVE COMPENSATION
ITEM 12. SECURITY OWNERSHIP OF CERTAIN BENEFICIAL OWNERS AND MANAGEMENT ANDRELATED STOCKHOLDER MATTERS
ITEM 13. CERTAIN RELATIONSHIPS AND RELATED TRANSACTIONS, AND DIRECTORINDEPENDENCE
ITEM 14. PRINCIPAL ACCOUNTING FEES AND SERVICES
118 MOODY’S 2017 10-K

PART IV
ITEM 15. EXHIBITS AND FINANCIAL STATEMENT SCHEDULES
LIST OF DOCUMENTS FILED AS PART OF THIS REPORT.
(1) Financial Statements.See Index to Financial Statements on page 60, in Part II. Item 8 of this Form 10-K.
(2) Financial Statement Schedules.None.
(3) Exhibits.See Index to Exhibits on pages 121-124 of this Form 10-K.
MOODY’S 2017 10-K 119
SIGNATURES
Pursuant to the requirements of Section 13 or 15(d) of the Securities Exchange Act of 1934, the Registrant has duly caused this reportto be signed on its behalf by the undersigned, thereunto duly authorized.
MOODY’S CORPORATION(Registrant)
By: /s/ RAYMOND W. MCDANIEL, JR.
Raymond W. McDaniel, Jr.President and Chief Executive Officer
Date: February 26, 2018
Pursuant to the requirements of the Securities Exchange Act of 1934, this report has been signed below by the following persons onbehalf of the Registrant and in the capacities and on the date indicated.
/s/ RAYMOND W. MCDANIEL, JR.Raymond W. McDaniel, Jr.,President and Chief Executive Officer(principal executive officer)
/s/ LINDA S. HUBERLinda S. Huber,Executive Vice President and Chief Financial Officer(principal financial officer)
/s/ MICHAEL S. CRIMMINSMichael S. Crimmins,Senior Vice President and CorporateController (principal accounting officer)
/s/ BASIL L. ANDERSONBasil L. Anderson,Director
/s/ JORGE A. BERMUDEZJorge A. Bermudez,Director
/s/ DARRELL DUFFIEDarrell Duffie,Director
/s/ KATHRYN M. HILLKathryn M. Hill,Director
/s/ EWALD KISTEwald Kist,Director
/s/ HENRY A. MCKINNELL, JR. PH.D.Henry A. McKinnell, Jr. Ph.D.,Chairman
/s/ LESLIE F. SEIDMANLeslie F. Seidman,Director
/s/ BRUCE VAN SAUNBruce Van Saun,Director
Date: February 26, 2018
120 MOODY’S 2017 10-K

INDEX TO EXHIBITS
S-K EXHIBIT NUMBER
2 Plan Of Acquisition, Reorganization, Arrangement, Liquidation or Succession
.1 Securities Purchase Agreement, dated as of May 15, 2017, among Moody’s Corporation, Moody’sHoldings NL B.V., Yellow Maple I B.V., Yellow Maple Syrup I B.V., Yellow Maple Syrup II B.V. and theSellers identified therein (incorporated by reference to Exhibit 2.1 to the Report on Form 8-K of theRegistrant, file number 1-14037, filed May 15, 2017)
.2 Warranty Agreement, dated as of May 15, 2017, between Moody’s Holdings NL B.V. and the Warran-tors identified therein (incorporated by reference to Exhibit 2.2 to the Report on Form 8-K of theRegistrant, file number 1-14037, filed May 15, 2017)
3 Articles Of Incorporation And By-laws
.1 Restated Certificate of Incorporation of the Registrant, effective April 17, 2013 (incorporated by refer-ence to Exhibit 3.4 to the Report on Form 8-K of the Registrant, file number 1-14037, filed April 22,2013)
.2 Amended and Restated By-laws of Moody’s Corporation, effective April 17, 2013 (incorporated byreference to Exhibit 3.2 to the Report on Form 8-K of the Registrant, file number 1-14037, filedApril 22, 2013)
4 Instruments Defining The Rights Of Security Holders, Including Indentures
.1 Specimen Common Stock certificate (incorporated by reference to Exhibit 4.1 to the Report on Form8-K of the Registrant, file number 1-14037, filed October 4, 2000)
.2 Note Purchase Agreement, dated as of September 7, 2007, by and among Moody’s Corporation andthe note purchasers party thereto, including the form of the 6.06% Series 2007-1 Senior UnsecuredNote due 2017 (incorporated by reference to Exhibit 4.1 to the Report on Form 8-K of the Registrant,file number 1-14037, filed September 13, 2007)
.3.1 Indenture, dated as of August 19, 2010, between Moody’s Corporation and Wells Fargo, NationalAssociation, as trustee (incorporated by reference to Exhibit 4.1 to the Report on Form 8-K of theRegistrant, file number 1-14037, filed August 19, 2010)
.3.2 Supplemental Indenture, dated as of August 19, 2010, between Moody’s Corporation and Wells Fargo,National Association, as trustee, including the form of the 5.50% Senior Notes due 2020(incorporated by reference to Exhibit 4.2 to the Report on Form 8-K of the Registrant, file number 1-14037, filed August 19, 2010)
.3.3 Second Supplemental Indenture, dated as of August 20, 2012, between Moody’s Corporation andWells Fargo, National Association, as trustee, including the form of the 4.50% Senior Notes due 2022(incorporated by reference to Exhibit 4.1 to the Report on Form 8-K of the Registrant, file number 1-14037, filed August 20, 2012)
.3.4 Third Supplemental Indenture, dated as of August 12, 2013, between Moody’s Corporation and WellsFargo, National Association, as trustee, including the form of the 4.875% Senior Notes due 2023(incorporated by reference to Exhibit 4.1 to the Report on Form 8-K of the Registrant, file number 1-14037, filed August 12, 2013)
.3.5 Fourth Supplemental Indenture, dated July 16, 2014, between the Company and Wells Fargo Bank,National Association, as trustee, including the form of 2.750% Senior Notes due 2019 and the form of5.250% Senior Notes due 2044 (incorporated by reference to Exhibit 4.1 to the Report on Form 8-K ofthe Registrant, file number 1-14037, filed July 16, 2014)
.3.6 Fifth Supplemental Indenture, dated March 9, 2015, between the Company, Wells Fargo Bank,National Association, as trustee and Elavon Financial Services Limited, UK Branch as paying agent andtransfer agent and Elavon Financial Services Limited as registrar, including the form or 1.75% SeniorNotes due 2027 (incorporated by reference to Exhibit 4.1 to the Report on Form 8-K of the Registrant,file number 1-14037, filed March 10, 2015)
.3.7 Sixth Supplemental Indenture, dated as of March 2, 2017, between the Company and Wells FargoBank, National Association, as trustee, including the form of 2.750% Senior Notes due 2021 and formof Floating Rate Senior Notes due 2018 (incorporated by reference to Exhibit 4.1 to the Report onForm 8-K of the Registrant, file number 1-14037, filed March 3, 2017)
MOODY’S 2017 10-K 121

S-K EXHIBIT NUMBER
.3.8 Seventh Supplemental Indenture, dated as of June 12, 2017, between Moody’s Corporation and WellsFargo, National Association, as trustee, including the form of 2.625% Senior Notes due 2023 and theform of 3.250% Senior Notes due 2028 (incorporated by reference to Exhibit 4.3 to the Report onForm 8-K of the Registrant, file number 1-14037, filed June 12, 2017)
.4.1 Five-Year Credit Agreement dated as of May 11, 2015, among Moody’s Corporation, the BorrowingSubsidiaries Party Thereto, the Lenders Party Thereto, JPMorgan Chase Bank, N.A., as AdministrativeAgent, Bank of America, N.A. and Citibank, N.A. as Co-Syndication Agents, and TD Bank, N.A., TheBank of Tokyo-Mitsubishi UFJ, Ltd. and Barclays Bank as Co-Documentation Agents (incorporated byreference to Exhibit 4.1 to the Report on Form 8-K of the Registrant, file number 1-14037, filedMay 14, 2015)
.4.2 Amendment No. 1, dated as of June 6, 2017, among Moody’s Corporation, the financial institutionsparty thereto and JPMorgan Chase Bank, N.A., as Administrative Agent under that certain CreditAgreement, dated as of May 11, 2015, among Moody’s Corporation, the Borrowing Subsidiaries partythereto, the Lenders party thereto and JPMorgan Chase Bank, N.A., as Administrative Agent(incorporated by reference to Exhibit 4.2 to the Report on Form 8-K of the Registrant, file number 1-14037, filed June 12, 2017)
.5 364-Day Bridge Credit Agreement dated as of May 15, 2017, among Moody’s Corporation, the Lend-ers Party thereto and JPMorgan Chase Bank, N.A., as Administrative Agent (incorporated by referenceto Exhibit 4.1 to the Report on Form 8-K of the Registrant, file number 1-14037, filed May 15, 2017)
.6 Loan Agreement, dated as of June 6, 2017, among Moody’s Corporation, the Lenders party theretoand JPMorgan Chase Bank, N.A., as Administrative Agent (incorporated by reference to Exhibit 4.1 tothe Report on Form 8-K of the Registrant, file number 1-14037, filed June 12, 2017)
.7 Registration Rights Agreement, dated as of June 12, 2017, between Moody’s Corporation and therepresentatives of the initial purchasers of the notes (incorporated by reference to Exhibit 4.6 to theReport on Form 8-K of the Registrant, file number 1-14037, filed June 12, 2017)
10 Material Contracts
.1† 1998 Moody’s Corporation Key Employees’ Stock Incentive Plan (incorporated by reference to Exhibit10.16 to the Registrant’s Quarterly Report on Form 10-Q, file number 1-14037, filed November 14,2000)
.2.1†* 1998 Moody’s Corporation Non-Employee Directors’ Stock Incentive Plan (Adopted September 8,2000; Amended and Restated as of December 11, 2012, October 20, 2015, December 14, 2015 andDecember 18, 2017)
.2.2† Form of Non-Employee Director Restricted Stock Grant Agreement (for awards granted prior to 2018)for the 1998 Moody’s Corporation Non-Employee Directors’ Stock Incentive Plan (as amended onApril 23, 2001) (incorporated by reference to Exhibit 10.3 to the Registrant’s Quarterly Report onForm 10-Q, file number 1-14037, filed November 3, 2004)
.2.3†* Form of Non-Employee Director Restricted Stock Unit Grant Agreement (for awards after 2017) forthe 1998 Moody’s Corporation Non-Employee Directors’ Stock Incentive Plan (Adopted September 8,2000; Amended and Restated as of December 11, 2012, October 20, 2015, December 14, 2015 andDecember 18, 2017).
.3† Moody’s Corporation 1999 Employee Stock Purchase Plan (as amended and restated December 15,2008) (formerly, The Dun & Bradstreet Corporation 1999 Employee Stock Purchase Plan)(incorporated by reference to Exhibit 10.38 to the Registrant’s Annual Report on Form 10-K, filenumber 1-14037, filed March 2, 2009)
.4.1†* Amended and Restated 2001 Moody’s Corporation Key Employees’ Stock Incentive Plan (as amended,December 18, 2017)
.4.2† Form of Employee Non-Qualified Stock Option and Restricted Stock Grant Agreement (for awardsgranted prior to 2017) for the Amended and Restated 2001 Moody’s Corporation Key Employees’Stock Incentive Plan (incorporated by reference to Exhibit 10.2 to the Registrant’s Quarterly Report onForm 10-Q, file number 1-14037, filed November 3, 2004)
.4.3† Form of Employee Non-Qualified Stock Option Grant Agreement for the Amended and Restated 2001Moody’s Corporation Key Employees’ Stock Incentive Plan (incorporated by reference to Exhibit 10.17to the Registrant’s Annual Report on Form 10-K, file number 1-14037, filed February 24, 2017)
.4.4† Form of Performance Share Award Letter (for awards granted prior to 2017) for the Amended andRestated 2001 Moody’s Corporation Key Employees’ Stock Incentive Plan (incorporated by referenceto Exhibit 10.48 to the Registrant’s Annual Report on Form 10-K, file number 1-14037, filedFebruary 28, 2011)
122 MOODY’S 2017 10-K

S-K EXHIBIT NUMBER
.4.5† Form of Performance Share Award Letter (for awards granted in 2017) for the Amended and Restated2001 Moody’s Corporation Key Employees’ Stock Incentive Plan (incorporated by reference to Exhibit10.16 to the Registrant’s Annual Report on Form 10-K, file number 1-14037, filed February 24, 2017)
.4.6†* Form of Performance Share Award Letter (for awards granted after 2017) for the Amended andRestated 2001 Moody’s Corporation Key Employees’ Stock Incentive Plan
.4.7† Form of Restricted Stock Unit Grant Agreement for the Amended and Restated 2001 Moody’s Corpo-ration Key Employees’ Stock Incentive Plan (incorporated by reference to Exhibit 10.18 to the Regis-trant’s Annual Report on Form 10-K, file number 1-14037, filed February 24, 2017)
.5.1† 2004 Moody’s Corporation Covered Employee Cash Incentive Plan (as amended on February 10,2015) (incorporated by reference to Exhibit 10.15 to the Registrant’s Annual Report on Form 10-K, filenumber 1-14037, filed February 26, 2015)
.6† Moody’s Corporation Deferred Compensation Plan, effective as of January 1, 2008 (incorporated byreference to Exhibit 10.1 to the Report on Form 8-K of the Registrant, file number 1-14037, filedOctober 26, 2007)
.7† Supplemental Executive Benefit Plan of Moody’s Corporation, amended and restated as of January 1,2008 (incorporated by reference to Exhibit 10.38 to the Registrant’s Annual Report on Form 10-K, filenumber 1-14037, filed February 29, 2008)
.8† Pension Benefit Equalization Plan of Moody’s Corporation, amended and restated as of January 1,2008 (incorporated by reference to Exhibit 10.39 to the Registrant’s Annual Report on Form 10-K, filenumber 1-14037, filed February 29, 2008)
.9.1† Moody’s Corporation Cafeteria Plan, effective January 1, 2008 (incorporated by reference to Exhibit10.46 to the Registrant’s Annual Report on Form 10-K, file number 1-14037, filed March 2, 2009)
.9.2† First Amendment to the Moody’s Corporation Cafeteria Plan (incorporated by reference to Exhibit10.3 to the Registrant’s Quarterly Report on form 10-Q, file number 1-14037, filed July 31, 2014)
.9.3† Second Amendment to the Moody’s Corporation Cafeteria Plan (incorporated by reference to Exhibit10.33 to the Registrant’s Annual Report on Form 10-K, file number 1-14037, filed February 26, 2015)
.10†* Moody’s Corporation Change in Control Severance Plan (as amended December 18, 2017).
.11.1† Moody’s Corporation Retirement Account, amended and restated as of December 18,2013(incorporated by reference to Exhibit 10.25 to the Registrant’s Annual Report on Form 10-K, filenumber 1-14037, filed February 27, 2014)
.11.2† First Amendment to the Moody’s Corporation Retirement Account, amended and restated as ofDecember 18, 2013 (incorporated by reference to Exhibit 10.1 to the Registrant’s Quarterly Report onForm 10-Q, file number 1-14037, filed July 30, 2015)
.12.1† Profit Participation Plan of Moody’s Corporation (amended and restated as of January 1, 2014)(incorporated by reference to Exhibit 10.26 to the Registrant’s Annual Report on Form 10-K, filenumber 1-14037, filed February 26, 2015)
.12.2† First Amendment to the Profit Participation Plan of Moody’s Corporation (amended and restated as ofJanuary 1, 2014) (incorporated by reference to Exhibit 10.1 to the Registrant’s Quarterly Report onform 10-Q, file number 1-14037, filed May 4, 2015)
.12.3† Second Amendment to the Profit Participation Plan of Moody’s Corporation (incorporated by refer-ence to Exhibit 10.1 to the Registrant’s Quarterly Report on Form 10-Q, file number 1-14037, filedMay 4, 2016)
.13† The Moody’s Corporation Nonfunded Deferred Compensation Plan for Non-Employee Directors (asamended and restated October 20, 2015) (incorporated by reference to Exhibit 10.3 to the Regis-trant’s Annual Report on Form 10-K, file number 1-14037, filed February 25, 2016)
.14.1† Amended and Restated Moody’s Corporation Career Transition Plan (incorporated by reference toExhibit 10.33 to Registrant’s Annual Report on Form 10-K, file number 1-14037, filed February 24,2017)
.14.2† Form of Separation Agreement and General Release used by the Registrant with its Career TransitionPlan (incorporated by reference to Exhibit 99.1 to the Report on Form 8-K of the Registrant, filenumber 1-14037, filed November 20, 2007)
MOODY’S 2017 10-K 123

S-K EXHIBIT NUMBER
.15† Separation Agreement and General Release between the Company and Linda S. Huber, dated January26, 2018 (incorporated by reference to Exhibit 10.1 to the Registrant’s Report on Form 8-K, file num-ber 1-14037, filed January 29, 2018)
.16 Agreement of Lease, dated September 7, 2006, between Moody’s Corporation and 7 World TradeCenter, LLC (incorporated by reference to Exhibit 10.1 to the Registrant’s Quarterly Report on Form10-Q, file number 1-14037, filed November 2, 2006)
.17.1 Agreement for Lease, dated February 6, 2008, among CWCB Properties (DS7) Limited, CWCB Proper-ties (DS7) Limited and CW Leasing DS7F Limited, Canary Wharf Holdings Limited, Moody’s InvestorsService Limited, and Moody’s Corporation (incorporated by reference to Exhibit 10.1 to the Report onForm 8-K of the Registrant, file number 1-14037, filed February 12, 2008)
.17.2 Storage Agreement for Lease dated February 6, 2008 among Canary Wharf (Car Parks) Limited, CanaryWharf Holdings Limited, Canary Wharf Management Limited, Moody’s Investors Service Limited, andMoody’s Corporation (incorporated by reference to Exhibit 10.2 to the Report on Form 8-K of theRegistrant file number 1-14037, filed February 12, 2008)
.18 Form Commercial Paper Dealer Agreement between Moody’s Corporation, as Issuer, and the Dealerparty thereto (incorporated by reference to Exhibit 10.1 to the Report on Form 8-K of the Registrant,file number 1-14037, filed August 3, 2016)
.19 Settlement Agreement dated January 13, 2017 between (1) Moody’s Corporation, Moody’s InvestorsService, Inc. and Moody’s Analytics, Inc., and (2) the United States, acting through the United StatesDepartment of Justice and the United States Attorney’s Office for the District of New Jersey, alongwith various States and the District of Columbia, acting through their respective Attorneys General(incorporated by reference to the Report on Form 8-K of the Registrant, file number 1-14037, filedJanuary 17, 2017)
.20 Form Indemnification Agreement (incorporated by reference to Exhibit 10.1 to the Report on Form 8-K of the Registrant, file number 1-14037, filed December 22, 2017)
12* Statement of Computation of Ratios of Earnings to Fixed Charges
21* Subsidiaries of the Registrant List of Active Subsidiaries as of December 31, 2017
23 Consent of Independent Registered Public Accounting Firm
.1* Consent of KPMG LLP
31 Certifications Pursuant to Section 302 of the Sarbanes-Oxley Act of 2002
.1* Chief Executive Officer Certification Pursuant to Section 302 of the Sarbanes-Oxley Act of 2002
.2* Chief Financial Officer Certification Pursuant to Section 302 of the Sarbanes-Oxley Act of 2002
32 Certifications Pursuant to Section 906 of the Sarbanes-Oxley Act of 2002
.1* Certification Pursuant to 18 U.S.C. Section 1350, as Adopted Pursuant to Section 906 of the Sarbanes-Oxley Act of 2002. (The Company has furnished this certification and does not intend for it to beconsidered filed under the Securities Exchange Act of 1934 or incorporated by reference into futurefilings under the Securities Act of 1933 or the Securities Exchange Act of 1934)
.2* Certification Pursuant to 18 U.S.C. Section 1350, as Adopted Pursuant to Section 906 of the Sarbanes-Oxley Act of 2002. (The Company has furnished this certification and does not intend for it to beconsidered filed under the Securities Exchange Act of 1934 or incorporated by reference into futurefilings under the Securities Act of 1933 or the Securities Exchange Act of 1934)
101 XBRL
.DEF* XBRL Definitions Linkbase Document
.INS* XBRL Instance Document
.SCH* XBRL Taxonomy Extension Schema Document
.CAL* XBRL Taxonomy Extension Calculation Linkbase Document
.LAB* XBRL Taxonomy Extension Labels Linkbase Document
.PRE* XBRL Taxonomy Extension Presentation Linkbase Document
* Filed herewith
† Management contract of compensatory plan or arrangement
124 MOODY’S 2017 10-K

EXHIBIT 21
SUBSIDIARIES OF MOODY’S CORPORATION
The following is a list of active, majority-owned subsidiaries of Moody’s Corporation as of December 31, 2017.
U.S. Entities
Bureau van Dijk Electronic Publishing Inc. New YorkCSI Global Education, US, Inc. DelawareDVBS, Inc. DelawareFoundation for Fiduciary Studies, Inc. DelawareGGYAXIS, Inc. DelawareLewtan Technologies, Inc. MassachusettsMIS Asset Holdings, Inc. DelawareMIS Quality Management Corp. DelawareMoody’s Advisors Inc. DelawareMoody’s Analytics, Inc. DelawareMoody’s Analytics Knowledge Services Analysis (US) Inc. DelawareMoody’s Analytics Knowledge Services Solutions (US) Inc. DelawareMoody’s Analytics Knowledge Services (US) Inc. DelawareMoody’s Analytics Solutions, LLC DelawareMoody’s Assurance Company, Inc. New YorkMoody’s Assureco, Inc. DelawareMoody’s Capital Markets Research, Inc. DelawareMoody’s Credit Assessment Holdings, LLC DelawareMoody’s Credit Assessment, Inc. DelawareMoody’s Group Holdings, Inc. DelawareMoody’s Holdings LLC DelawareMoody’s International LLC DelawareMoody’s Investors Service, Inc. DelawareMoody’s Overseas Holdings, Inc. DelawareMoody’s Risk Assessments Holdings LLC DelawareMoody’s Risk Assessments, Inc. DelawareMoody’s Shared Services, Inc. DelawareThe Moody’s Foundation New York
Non-US Entities
Administración de Calificadoras, S.A. de C.V. MexicoBureau van Dijk Editions Electroniques SA BelgiumBureau van Dijk Editions Electroniques SA SwitzerlandBureau van Dijk Editions Electroniques SAS FranceBureau van Dijk Edizioni Elettroniche SPA ItalyBureau van Dijk Electronic Publishing AB SwedenBureau van Dijk Electronic Publishing Aps DenmarkBureau van Dijk Electronic Publishing (Beijing) Co. Limited ChinaBureau van Dijk Electronic Publishing BV NetherlandsBureau van Dijk Electronic Publishing GmbH AustriaBureau van Dijk Electronic Publishing GmbH GermanyBureau van Dijk Electronic Publishing Hong Kong Limited Hong KongBureau van Dijk Electronic Publishing KK JapanBureau van Dijk Electronic Publishing LLC KoreaBureau van Dijk Electronic Publishing PTY Limited AustraliaBureau van Dijk Electronic Publishing Ltd United Kingdom
MOODY’S 2017 10-K 125

Bureau van Dijk Electronic Publishing Pte Ltd SingaporeBureau van Dijk Electronic Publishing SA de CV MexicoBureau van Dijk Electroniq Publishing SA (Pty) Ltd. South AfricaBureau van Dijk Electronic Publishing Unipessoal Lda PortugalBureau van Dijk E.P. DMCC UAEBureau van Dijk Publicacao Electronica LTDA BrazilBureau van Dijk Publicaciones Electronicas SA SpainCopal Business Consulting (Beijing) Co. Limited ChinaEquilibrium Clasificadora de Riesgo S.A. PeruEquilibrium Calificadora de Riesgo S.A. Republic of PanamaFermat Finance SPRL BelgiumFermat GmbH GermanyFermat International SA BelgiumGilliland Gold Young Consulting CanadaICRA Lanka Limited Sri LankaICRA Limited IndiaICRA Management Consulting Services Limited IndiaICRA Nepal Limited NepalICRA Online Limited IndiaKIS Pricing, Inc. KoreaKorea Investors Service, Inc. KoreaMA Knowledge Services Research (India) Private Limited IndiaMA KS Solutions (India) Private Limited IndiaMidroog Ltd IsraelMIS Support Center Private Limited IndiaMoody’s America Latina Ltda. BrazilMoody’s Analytics Australia Pty. Ltd. AustraliaMoody’s Analytics Canada Inc. CanadaMoody’s Analytics Czech Republic s.r.o. Czech RepublicMoody’s Analytics Deutschland GmbH GermanyMoody’s Analytics (DIFC) Limited UAE (Dubai International Financial Center)Moody’s Analytics do Brasil Solucoes para Gerenciamento de Risco de Credito Ltda. BrazilMoody’s Analytics Global Education (Canada) Inc. CanadaMoody’s Analytics Holdings (UK) Limited United KingdomMoody’s Analytics Hong Kong Ltd. Hong KongMoody’s Analytics International Licensing GmbH SwitzerlandMoody’s Analytics Ireland Limited IrelandMoody’s Analytics Japan KK JapanMoody’s Analytics Knowledge Services (BVI) Limited British Virgin IslandsMoody’s Analytics Knowledge Services Costa Rica Sociedad Anonima Costa RicaMoody’s Analytics Knowledge Services Holdings (Mauritius) Limited MauritiusMoody’s Analytics Knowledge Services (Hong Kong) Limited Hong KongMoody’s Analytics Knowledge Services (India) Pvt. Ltd. IndiaMoody’s Analytics Knowledge Services (Jersey) Limited JerseyMoody’s Analytics Knowledge Services Lanka (Private) Limited Sri LankaMoody’s Analytics Knowledge Services (Mauritius) Limited MauritiusMoody’s Analytics Knowledge Services Research (Mauritius) Limited MauritiusMoody’s Analytics Knowledge Services (Singapore) Pte. Ltd. SingaporeMoody’s Analytics Knowledge Services (UK) Limited United KingdomMoody’s Analytics Korea Co. Ltd. KoreaMoody’s Analytics (Malaysia) Sdn. Bhd. MalaysiaMoody’s Analytics SAS FranceMoody’s Analytics Singapore Pte. Ltd. SingaporeMoody’s Analytics Technical Services (Hong Kong) Ltd. Hong Kong
126 MOODY’S 2017 10-K

Moody’s Analytics Technical Services (UK) Limited United KingdomMoody’s Analytics (Thailand) Co. Ltd. ThailandMoody’s Analytics UK Limited United KingdomMoody’s Asia-Pacific Group (Singapore) Pte. Ltd. SingaporeMoody’s Asia Pacific Limited Hong KongMoody’s Canada Inc. CanadaMoody’s Canada LP CanadaMoody’s China (B.V.I.) Limited British Virgin IslandsMoody’s Company Holdings (BVI) I Limited British Virgin IslandsMoody’s Company Hong Kong Limited Hong KongMoody’s de Mexico S.A. de C.V. Institución Calificadora de Valores MexicoMoody’s Deutschland GmbH GermanyMoody’s Eastern Europe LLC RussiaMoody’s EMEA Financing (Cyprus) Limited CyprusMoody’s EMEA Holdings Limited United KingdomMoody’s Equilibrium I (BVI) Holding Corporation British Virgin IslandsMoody’s Equilibrium II (BVI) Holding Corporation British Virgin IslandsMoody’s Finance (BVI) Ltd. British Virgin IslandsMoody’s France SAS FranceMoody’s Financing (BVI) Limited British Virgin IslandsMoody’s Financing (Cyprus) Limited CyprusMoody’s Group Australia Pty Ltd AustraliaMoody’s Group (BVI) Ltd. British Virgin IslandsMoody’s Group Cyprus Ltd CyprusMoody’s Group Deutschland GmbH GermanyMoody’s Group Finance Limited United KingdomMoody’s Group France SAS FranceMoody’s Group Holdings (BVI) Limited British Virgin IslandsMoody’s Group Japan G.K. JapanMoody’s Group NL B.V. NetherlandsMoody’s Group UK Limited United KingdomMoody’s Group (Holdings) Unlimited United KingdomMoody’s Holdings (BVI) Limited British Virgin IslandsMoody’s Holdings Limited United KingdomMoody’s Holdings NL B.V. NetherlandsMoody’s Indonesia (B.V.I.) Limited British Virgin IslandsMoody’s Information Consulting (Shenzhen) Co. Ltd. ChinaMoody’s Interfax Rating Agency Ltd RussiaMoody’s International Holdings (Cyprus) Limited CyprusMoody’s International Holdings (UK) Limited United KingdomMoody’s International (UK) Limited United KingdomMoody’s Investment Company India Private Limited IndiaMoody’s Investors Service (Beijing), Ltd. ChinaMoody’s Investors Service (BVI) Limited British Virgin IslandsMoody’s Investors Service Cyprus Limited CyprusMoody’s Investors Service EMEA Limited United KingdomMoody’s Investors Service Espana SA SpainMoody’s Investors Service Hong Kong Limited Hong KongMoody’s Investors Service India Private Limited IndiaMoody’s Investors Service (Korea) Inc. KoreaMoody’s Investors Service Limited United KingdomMoody’s Investors Service Middle East Limited UAE (Dubai International Financial Center)Moody’s Investors Service (Nordics) AB SwedenMoody’s Investors Service Pty Limited Australia
MOODY’S 2017 10-K 127

Moody’s Investors Service Singapore Pte. Ltd. SingaporeMoody’s Investors Service South Africa (Pty) Limited South AfricaMoody’s Italia S.r.l. ItalyMoody’s Israel Holdings Inc. British Virgin IslandsMoody’s (Japan) K.K. JapanMoody’s Latin America Agente de Calificacion de Riesgo SA ArgentinaMoody’s Latin America Holding Corp British Virgin IslandsMoody’s Mauritius Holdings Limited MauritiusMoody’s Risk Assessments Limited UKMoody’s SF Japan K.K. JapanMoody’s Shared Services India Private Limited IndiaMoody’s Shared Services UK Limited United KingdomMoody’s Singapore Pte Ltd SingaporeMoody’s South Africa (BVI) Limited British Virgin IslandsMoody’s (UK) Limited United KingdomPragati Development Consulting Services Limited IndiaPT ICRA Indonesia IndonesiaPT Moody’s Indonesia IndonesiaYellow Maple I BV NetherlandsYellow Maple II B.V. NetherlandsYellow Maple Holding B.V. NetherlandsYellow Maple Syrup I B.V. NetherlandsYellow Maple Syrup II B.V. NetherlandsZephus Limited United Kingdom
128 MOODY’S 2017 10-K

EXHIBIT 23.1
Consent of Independent Registered Public Accounting Firm
The Board of Directors and Shareholders of Moody’s Corporation:
We consent to the incorporation by reference in the registration statements (No. 333-216211, No. 333-170727, No. 333-170753,No. 333-145127, No. 333-126564, No. 333-103496, No. 333-47848, No. 333-81121, No. 333-68555, No. 333-64653,No. 333-60737, No. 333-57915, No. 333-57267, No. 333-192333, No. 333-192334) on Forms S-3 and S-8 of Moody’s Corporation(the Company) of our report dated February 26, 2018, with respect to the consolidated balance sheets of Moody’s Corporation as ofDecember 31, 2017 and 2016, and the related consolidated statements of operations, comprehensive income, shareholders’ equity(deficit), and cash flows for each of the years in the three-year period ended December 31, 2017, and the related notes (collectively,the consolidated financial statements), and the effectiveness of internal control over financial reporting as of December 31, 2017,which report appears in the December 31, 2017 annual report on Form 10-K of Moody’s Corporation.
Our report dated February 26, 2018, on the effectiveness of internal control over the financial reporting as of December 31, 2017,contains an explanatory paragraph that states Moody’s Corporation acquired Bureau van Dijk in August 2017, and managementexcluded from its assessment of the effectiveness of the Company’s internal control over financial reporting as of December 31, 2017,Bureau van Dijk’s internal control over financial reporting, which is associated with total assets (excluding goodwill and intangibleswhich are included within the scope of the assessment) of $322 million and total revenues of $92 million included in the consolidatedfinancial statements of the Company as of and for the year ended December 31, 2017. Our audit of internal control over financialreporting of the Company also excluded an evaluation of the internal control over financial reporting of Bureau Van Dijk.
/s/ KPMG LLP
New York, New YorkFebruary 26, 2018
MOODY’S 2017 10-K 129

EXHIBIT 31.1
CHIEF EXECUTIVE OFFICER CERTIFICATION PURSUANT TO SECTION 302 OF THE SARBANES-OXLEY ACT OF 2002
I, Raymond W. McDaniel, Jr., President and Chief Executive Officer of Moody’s Corporation, certify that:
1. I have reviewed this annual report on Form 10-K of Moody’s Corporation;
2. Based on my knowledge, this report does not contain any untrue statement of a material fact or omit to state a material factnecessary to make the statements made, in light of the circumstances under which such statements were made, not misleadingwith respect to the periods covered by this report;
3. Based on my knowledge, the financial statements, and other financial information included in this report, fairly present in allmaterial respects the financial condition, results of operations and cash flows of the registrant as of, and for, the periods presentedin this report;
4. The registrant’s other certifying officer and I are responsible for establishing and maintaining disclosure controls and procedures (asdefined in Exchange Act Rules 13a-15(e) and 15d-15(e)) and internal control over financial reporting (as defined in Exchange ActRules 13a-15(f) and 15(d)-15(f)) for the registrant and have:
a) Designed such disclosure controls and procedures, or caused such disclosure controls and procedures to be designed under oursupervision, to ensure that material information relating to the registrant, including its consolidated subsidiaries, is made knownto us by others within those entities, particularly during the period in which this report is being prepared;
b) Designed such internal control over financial reporting, or caused such internal control over financial reporting to be designedunder our supervision, to provide reasonable assurance regarding the reliability of financial reporting and the preparation offinancial statements for external purposes in accordance with generally accepted accounting principles;
c) Evaluated the effectiveness of the registrant’s disclosure controls and procedures and presented in this report our conclusionsabout the effectiveness of the disclosure controls and procedures, as of the end of the period covered by this report based onsuch evaluation; and
d) Disclosed in this report any change in the registrant’s internal control over financial reporting that occurred during theregistrant’s most recent fiscal quarter (the registrant’s fourth fiscal quarter in the case of an annual report) that has materiallyaffected, or is reasonably likely to materially affect, the registrant’s internal control over financial reporting; and
5. The registrant’s other certifying officer and I have disclosed, based on our most recent evaluation of internal control over financialreporting, to the registrant’s auditors and the audit committee of the registrant’s board of directors (or persons performing theequivalent functions):
a) All significant deficiencies and material weaknesses in the design or operation of internal control over financial reporting whichare reasonably likely to adversely affect the registrant’s ability to record, process, summarize and report financial information;and
b) Any fraud, whether or not material, that involves management or other employees who have a significant role in the registrant’sinternal control over financial reporting.
/s/ RAYMOND W. MCDANIEL, JR.
Raymond W. McDaniel, Jr.President and Chief Executive Officer
February 26, 2018
130 MOODY’S 2017 10-K

EXHIBIT 31.2
CHIEF FINANCIAL OFFICER CERTIFICATION PURSUANT TO SECTION 302 OF THE SARBANES-OXLEY ACT OF 2002
I, Linda S. Huber, Executive Vice President and Chief Financial Officer of Moody’s Corporation, certify that:
1. I have reviewed this annual report on Form 10-K of Moody’s Corporation;
2. Based on my knowledge, this report does not contain any untrue statement of a material fact or omit to state a material factnecessary to make the statements made, in light of the circumstances under which such statements were made, not misleadingwith respect to the periods covered by this report;
3. Based on my knowledge, the financial statements, and other financial information included in this report, fairly present in allmaterial respects the financial condition, results of operations and cash flows of the registrant as of, and for, the periods presentedin this report;
4. The registrant’s other certifying officer and I are responsible for establishing and maintaining disclosure controls and procedures (asdefined in Exchange Act Rules 13a-15(e) and 15d-15(e)) and internal control over financial reporting (as defined in Exchange ActRules 13a-15(f) and 15(d)-15(f)) for the registrant and have:
a) Designed such disclosure controls and procedures, or caused such disclosure controls and procedures to be designed under oursupervision, to ensure that material information relating to the registrant, including its consolidated subsidiaries, is made knownto us by others within those entities, particularly during the period in which this report is being prepared;
b) Designed such internal control over financial reporting, or caused such internal control over financial reporting to be designedunder our supervision, to provide reasonable assurance regarding the reliability of financial reporting and the preparation offinancial statements for external purposes in accordance with generally accepted accounting principles;
c) Evaluated the effectiveness of the registrant’s disclosure controls and procedures and presented in this report our conclusionsabout the effectiveness of the disclosure controls and procedures, as of the end of the period covered by this report based onsuch evaluation; and
d) Disclosed in this report any change in the registrant’s internal control over financial reporting that occurred during theregistrant’s most recent fiscal quarter (the registrant’s fourth fiscal quarter in the case of an annual report) that has materiallyaffected, or is reasonably likely to materially affect, the registrant’s internal control over financial reporting; and
5. The registrant’s other certifying officer and I have disclosed, based on our most recent evaluation of internal control over financialreporting, to the registrant’s auditors and the audit committee of the registrant’s board of directors (or persons performing theequivalent functions):
a) All significant deficiencies and material weaknesses in the design or operation of internal control over financial reporting whichare reasonably likely to adversely affect the registrant’s ability to record, process, summarize and report financial information;and
b) Any fraud, whether or not material, that involves management or other employees who have a significant role in the registrant’sinternal control over financial reporting.
/s/ LINDA S. HUBER
Linda S. HuberExecutive Vice President and Chief Financial Officer
February 26, 2018
MOODY’S 2017 10-K 131
EXHIBIT 32.1
CERTIFICATION PURSUANT TO 18 U.S.C. SECTION 1350, AS ADOPTED PURSUANT TO SECTION 906 OF THESARBANES-OXLEY ACT OF 2002
In connection with the Annual Report of Moody’s Corporation on Form 10-K for the year ended December 31, 2017 as filed with theSEC on the date hereof (the “Report”), I, Raymond W. McDaniel, Jr., President and Chief Executive Officer of the Company, certify,pursuant to 18 U.S.C. § 1350, as adopted pursuant to Section 906 of the Sarbanes-Oxley Act of 2002, that to the best of my knowl-edge:
(1) the Report fully complies with the requirements of Section 13(a) or 15(d) of the Securities Exchange Act of 1934; and
(2) the information contained in the Report fairly presents, in all material respects, the financial condition and results of operationsof the Company.
/s/ RAYMOND W. MCDANIEL, JR.
Raymond W. McDaniel, Jr.President and Chief Executive Officer
February 26, 2018
132 MOODY’S 2017 10-K

EXHIBIT 32.2
CERTIFICATION PURSUANT TO 18 U.S.C. SECTION 1350, AS ADOPTED PURSUANT TO SECTION 906 OF THESARBANES-OXLEY ACT OF 2002
In connection with the Annual Report of Moody’s Corporation on Form 10-K for the year ended December 31, 2017 as filed with theSEC on the date hereof (the “Report”), I, Linda S. Huber, Executive Vice President and Chief Financial Officer of the Company, certify,pursuant to 18 U.S.C. § 1350, as adopted pursuant to Section 906 of the Sarbanes-Oxley Act of 2002, that to the best of my knowl-edge:
(1) the Report fully complies with the requirements of Section 13(a) or 15(d) of the Securities Exchange Act of 1934; and
(2) the information contained in the Report fairly presents, in all material respects, the financial condition and results of operationsof the Company.
/s/ LINDA S. HUBER
Linda S. HuberExecutive Vice President and Chief Financial Officer
February 26, 2018
MOODY’S 2017 10-K 133

[THIS PAGE INTENTIONALLY LEFT BLANK]

[THIS PAGE INTENTIONALLY LEFT BLANK]

[THIS PAGE INTENTIONALLY LEFT BLANK]

COMMON STOCK INFORMATION
The Company’s common stock trades on the New York Stock Exchange under the symbol “MCO”.
INVESTOR RELATIONS
+1.212.553.4857 [email protected] ir.moodys.com
CORPORATE OFFICE
7 World Trade Center 250 Greenwich Street New York, NY 10007 +1.212.553.0300 moodys.com
TRANSFER AGENT, REGISTRAR
American Stock Transfer & Trust Company, LLC 6201 15th Avenue Brooklyn, NY 11219
U.S.: +1.866.714.7299 Outside the U.S.: +1.718.921.8124 Hearing impaired: +1.866.703.9077
Online Shareholder Account Information amstock.com [email protected]
INDEPENDENT ACCOUNTANTS
KPMG LLP 345 Park Avenue New York, NY 10154
CORPORATE GOVERNANCE
The Company has filed its annual report on Form 10-K for the year ended December 31, 2017 with the Securities and Exchange Commission.
The Form 10-K, along with other Moody’s SEC filings and corporate governance documents, are available, without charge, upon request to the Investor Relations Department at the Corporate Office or on ir.moodys.com.
The Company has submitted to the New York Stock Exchange the Chief Executive Officer’s certification that he is unaware of any violation by the Company of the NYSE’s corporate governance listing standards. The Company has filed with the SEC the Chief Executive Officer and Chief Financial Officer certifications as exhibits to the most recently filed Form 10-K, pursuant to Section 302 of the Sarbanes-Oxley Act of 2002.
MOODY’S ENVIRONMENTAL POLICY
Moody’s Corporation is committed to doing our part to protect and care for the environments in which we live and work.
This commitment is demonstrated by the continuous development and implementation of practical and effective corporate policies and programs that support the more efficient use of natural resources and reduce the impact of our businesses on the environment. These programs and policies include, where feasible, the reduction and elimination of waste through re-use, recovery and recycling. As part of these efforts, Moody’s is committed to reducing its global operations’ contribution to climate change. Our environmental programs are structured to minimize the impact on our greenhouse gas emissions to the extent possible.
Please visit moodys.com/csr to read the full version of Moody’s Environmental Policy.
All paper in this report is certified to the Forest Stewardship Council® (FSC®) standards. The 10-K of this report is printed on paper that contains recycled fiber.
Moody’s Corporate Information
