annual statewide report card 2013-14 · rebecca blocher. oregon statewide ......
TRANSCRIPT
The Oregon Statewide Report Card is an annual publication required by law (ORS 329.115), which reports on the state of public schools and their progress towards the goals of the Oregon Educational Act for the 21st Century. The purpose of the Oregon Report Card is to monitor trends among school districts and Oregon’s progress toward achieving the goals referred to in ORS 329.015. In addition, this report provides a tool that makes education data accessible to researchers, media, students, and parents and creates a clear, complete, and factual picture of the state of education in Oregon. The Oregon Department of Education (ODE) also publishes an Annual Performance Progress Report (APPR) which describes ODE's yearly progress in fulfilling its mission to increase achievement for all students. The APPR tracks performance on each of ODE's key performance measures, which monitor ODE's work pertaining to the Oregon K-12 education enterprise, as well as ODE's internal operational efficiency. The APPR report is posted at: http://www.ode.state.or.us/search/page/?id=1779.
Published November 25, 2014
The 2013-14 Oregon Statewide Report Card was produced by the Oregon Department of Education
for distribution to Oregon state and federal legislators, public schools, school districts, education service districts, and members of the public.
The Oregon Statewide Report Card is also posted on the Department of Education’s website at: http://www.ode.state.or.us/search/page/?id=1821.
The Oregon Department of Education hereby gives permission to reproduce and distribute any or all of this document.
It is the policy of the State Board of Education and a priority of the Oregon Department of Education that there will be no discrimination or harassment on the grounds of race, color, religion, sex, sexual orientation, national origin, marital status, age or disability in any educational programs, activities, or employment. Persons having questions about equal
opportunity and nondiscrimination should contact the Deputy Superintendent of Public Instruction at the Oregon Department of Education.
Acknowledgements Oregon Department of Education
Crystal Greene, Communications Director Cindy Hunt, Government and Legal Affairs Manager
Doug Kosty, Assistant Superintendent; Instruction, Standards, Assessment and Accountability Jon Wiens, Manager, Assessment and Accountability
Andrew Holbrook, Research Analyst, Accountability Reporting Isabella Jacoby, Research Analyst, Accountability Reporting
Alternative Education .................................................................................................................. Bob Salazar Annual Measurable Objectives (AMO) and Assessment ........................................................... Cindy Barrick Charter Schools ......................................................................................................................... Kate Pattison Cover Page Design................................................................................................................ Sheila Somerville Diploma Requirements ........................................................................................................ Theresa Richards Discipline Incidents ...................................................................................................................... John Inglish Elementary and Secondary Education Act Waiver .................................................. Josh Rew and Jon Wiens Enrollment and Membership .................................................................................................. Isabella Jacoby English Learners .............................................................................................................................. Kim Miller Essential Skills .. ..................................................................................................................... Cristen McLean Finance & School Funding .......................................................................................................... Brian Reeder Free & Reduced Price Lunch ........................................................................ Heidi Dupuis and Jeremy Eaton Graduates and Dropouts ......................................................................................................... Isabella Jacoby Highly Qualified Teachers ........................................................................................................... Greg Houser Homeless Students ......................................................................................................................... Dona Bolt NAEP Test Results ....................................................................................................................... Beth LaDuca Persistently Dangerous Schools ................................................................................................... John Inglish Pre-Kindergarten & Early Childhood ........................................................................................ Dawn Barberis School & District Report Cards ................................................................................. Josh Rew and Jon Wiens School and District Staff Data ................................................................ Brian Reeder and Andrew Holbrook Special Education ........................................................................................................................ Trish Lutgen Talented and Gifted (TAG) ................................................................................................... Rebecca Blocher
Oregon Statewide Report Card 2013-14 Oregon Department of Education www.ode.state.or.us
Rob Saxton
Deputy Superintendent of Public Instruction
OREGON DEPARTMENT OF EDUCATION Public Service Building, 255 Capitol Street NE, Salem, Oregon 97310
Phone (503) 947-5600 • Fax (503) 378-5156 • www.ode.state.or.us
Dear Oregonians, I am pleased to present the 2013-14 edition of the Oregon Statewide Report Card. This annual report provides a statewide look at our education system including key data on our students, teachers, and schools. While no report can sum up education in our state, it is my hope that the information contained here will contribute to the conversations Oregonians are having about these important topics. The 2013-14 Statewide Report Card includes:
Student demographics and information on specific student groups
School funding and staff information
Test results
Dropout and graduation rates
Charter school data and information on alternative education programs
Early childhood data
Attendance and chronic absenteeism data
Our state has embraced ambitious educational goals to increase opportunities and outcomes for all of our students. We have put into place a number of efforts designed to improve education in our state, and I feel incredibly fortunate to be involved in this work at such an exciting time of transformation and change.
Highlights of the 2013-14 School Year This last school year saw the continuation of many of the state’s key education reform efforts. Schools and districts aligned instruction to the rigorous Common Core State Standards which more fully prepare students for success in college and the workplace. Selected schools participated in the field test of the Smarter Balanced Assessment which will be used this spring to test student’s mastery of these new, higher standards. Kindergarteners participated in the Statewide Kindergarten Assessment which provides information on the skills our youngest learners have upon kindergarten entry. We submitted our plans around educator effectiveness and evaluations to the U.S. Department of Education, and continued to invest in key leverage areas through Strategic Initiative grants to schools, districts, and community based organizations. All of this work contributes to our overarching goal of preparing students for high school graduation and success in college or workplace training programs. Improving our education system from early childhood through higher education will take all of us, and I want to thank everyone involved in this work – from the educators and policy makers to the students and parents – for their continued dedication to these efforts. I look forward to working with you all in the months and years to come as we continue to move this forward. Sincerely,
Rob Saxton Deputy Superintendent of Public Instruction
Oregon Statewide Report Card 2013-14 Oregon Department of Education www.ode.state.or.us
TABLE OF CONTENTS
OREGON STUDENTS .......................................................................................................................................................................... 1
OREGON PUBLIC SCHOOL ENROLLMENT .......................................................................................................................................................... 1 STATEWIDE STUDENT-TEACHER RATIOS .......................................................................................................................................................... 1 PERCENT OF OREGON SCHOOL DISTRICTS BY SIZE OF STUDENT ENROLLMENT ......................................................................................................... 1 OREGON PUBLIC CHARTER SCHOOL ENROLLMENT ............................................................................................................................................ 2 OREGON PUBLIC CHARTER SCHOOL PERFORMANCE .......................................................................................................................................... 3 MINORITY STUDENT POPULATION ................................................................................................................................................................. 4 LANGUAGE DIVERSITY ................................................................................................................................................................................. 5 MINORITY STUDENTS AND TEACHERS ............................................................................................................................................................. 6
OREGON STAFF .................................................................................................................................................................................. 7
EXPERIENCED, HIGHLY EDUCATED WORKFORCE ............................................................................................................................................... 7 PERCENTAGE OF POSITIONS HELD BY WOMEN .................................................................................................................................................. 7 ALL SCHOOL STAFF ..................................................................................................................................................................................... 8 ANNUAL INSTRUCTIONAL HOURS ................................................................................................................................................................... 8 HISTORICAL SALARY CHARTS ......................................................................................................................................................................... 9
SCHOOL FUNDING ........................................................................................................................................................................... 11
SCHOOL RESOURCES ................................................................................................................................................................................. 11 STUDENT ENROLLMENT ............................................................................................................................................................................. 12 HISTORY OF SCHOOL FUNDING RESPONSIBILITY IN OREGON .............................................................................................................................. 13 OPERATING REVENUES BY SOURCE (HISTORICAL) ............................................................................................................................................ 14
ELEMENTARY AND SECONDARY EDUCATION ACT (ESEA) ................................................................................................................ 15
FEDERAL PROGRAMS ................................................................................................................................................................................. 15 ELEMENTARY AND SECONDARY EDUCATION ACT (ESEA) FLEXIBILITY WAIVER ...................................................................................................... 16 ELEMENTARY AND SECONDARY EDUCATION ACT – HIGHLY QUALIFIED TEACHERS (HQT) ....................................................................................... 17 ELEMENTARY AND SECONDARY EDUCATION ACT – PERSISTENTLY DANGEROUS SCHOOLS ....................................................................................... 18 DISCIPLINE INCIDENTS BY GRADE LEVEL ......................................................................................................................................................... 18 DISCIPLINE INCIDENTS BY SUBGROUP ............................................................................................................................................................ 19
ANNUAL MEASURABLE OBJECTIVES (AMO) ..................................................................................................................................... 20
AMOS FOR READING AND MATHEMATICS .................................................................................................................................................... 20 AMOS FOR GRADUATION .......................................................................................................................................................................... 20 ACADEMIC ACHIEVEMENT DETAILS .............................................................................................................................................................. 21 GRADUATION DETAILS ............................................................................................................................................................................... 22 PARTICIPATION DETAILS ............................................................................................................................................................................. 25
SCHOOL AND DISTRICT REPORT CARDS ........................................................................................................................................... 26
NUMBER OF SCHOOLS RECEIVING EACH OVERALL RATING BY YEAR .................................................................................................................... 26 DETAILED RATINGS ................................................................................................................................................................................... 27 HISTORICAL RATINGS................................................................................................................................................................................. 27
GROWTH MODEL............................................................................................................................................................................. 28
HOMELESS STUDENTS IN OREGON .................................................................................................................................................. 29
HOMELESS STUDENT COUNTS ..................................................................................................................................................................... 30 2012-13 PERCENT MET OR EXCEEDED STANDARD ......................................................................................................................................... 31 MCKINNEY-VENTO SUBGRANT PROJECTS ...................................................................................................................................................... 32
FREE AND REDUCED PRICE LUNCH ................................................................................................................................................... 33
Oregon Statewide Report Card 2013-14 Oregon Department of Education www.ode.state.or.us
STUDENT SUCCESS ........................................................................................................................................................................... 34
SCORES REQUIRED TO MEET OR EXCEED STANDARDS ON STATEWIDE ASSESSMENTS (CUT SCORES) .......................................................................... 34 GRADE 3 PERCENT MEETING STANDARDS ..................................................................................................................................................... 35 GRADE 4 PERCENT MEETING STANDARDS ..................................................................................................................................................... 37 GRADE 5 PERCENT MEETING STANDARDS ..................................................................................................................................................... 39 GRADE 6 PERCENT MEETING STANDARDS ..................................................................................................................................................... 41 GRADE 7 PERCENT MEETING STANDARDS ..................................................................................................................................................... 43 GRADE 8 PERCENT MEETING STANDARDS ..................................................................................................................................................... 45 HIGH SCHOOL PERCENT MEETING STANDARDS .............................................................................................................................................. 47
NATIONAL COMPARISON OF STUDENT ACHIEVEMENT ................................................................................................................... 50
NATIONAL ASSESSMENT OF EDUCATIONAL PROGRESS: READING ....................................................................................................................... 51 NATIONAL ASSESSMENT OF EDUCATIONAL PROGRESS: MATHEMATICS ............................................................................................................... 54 NATIONAL ASSESSMENT OF EDUCATIONAL PROGRESS: SCIENCE ........................................................................................................................ 57
COLLEGE ADMISSION TESTS ............................................................................................................................................................ 60
AMERICAN COLLEGE TESTING PROGRAM (ACT) ............................................................................................................................................. 60 SAT REASONING TEST ............................................................................................................................................................................... 60 ADVANCED PLACEMENT (AP) EXAMS ........................................................................................................................................................... 61 TESTS BY AP SUBJECT ................................................................................................................................................................................ 61
THE OREGON DIPLOMA ................................................................................................................................................................... 62
PERSONALIZED LEARNING ........................................................................................................................................................................... 62 FRESHMEN ON-TRACK ............................................................................................................................................................................... 63 ESSENTIAL SKILLS ...................................................................................................................................................................................... 64
OREGON GRADUATION RATES ........................................................................................................................................................ 66
STATEWIDE HIGH SCHOOL GRADUATION AND COMPLETION RATES, 2008-09 HIGH SCHOOL COHORT ..................................................................... 66 STATEWIDE HIGH SCHOOL GRADUATION AND COMPLETION RATES, 2009-10 HIGH SCHOOL COHORT ..................................................................... 67 FOUR-YEAR COHORT GRADUATION RATE TRENDS FOR DISADVANTAGED SUBGROUPS ............................................................................................ 68
DROPOUT RATES ............................................................................................................................................................................. 69
OREGON STATEWIDE DROPOUT RATE CALCULATION ....................................................................................................................................... 69 OREGON HIGH SCHOOL DROPOUT RATES ..................................................................................................................................................... 69 OREGON DROPOUT RATES BY GENDER ......................................................................................................................................................... 70
ATTENDANCE AND ABSENTEEISM ................................................................................................................................................... 71
PERCENT OF STUDENTS NOT CHRONICALLY ABSENT ........................................................................................................................................ 71 STATEWIDE TOTAL ATTENDANCE AND CHRONIC ABSENTEEISM RATES ................................................................................................................. 71 OUTCOMES FIVE YEARS AFTER ENTERING HIGH SCHOOL VS. FRESHMAN YEAR ATTENDANCE .................................................................................. 72
SPECIAL PROGRAMS ........................................................................................................................................................................ 73
SPECIAL EDUCATION.................................................................................................................................................................................. 73 EARLY CHILDHOOD - OREGON HEAD START PRE-KINDERGARTEN (OHS PREK) PROGRAMS .................................................................................... 75 TALENTED AND GIFTED (TAG) .................................................................................................................................................................... 76 ALTERNATIVE EDUCATION PROGRAMS .......................................................................................................................................................... 77
RESOURCES ..................................................................................................................................................................................... 80
Oregon Statewide Report Card 2013-14 1 Oregon Department of Education www.ode.state.or.us Contact for this section: Andrew Holbrook, 503-947-5831, [email protected]
OREGON STUDENTS
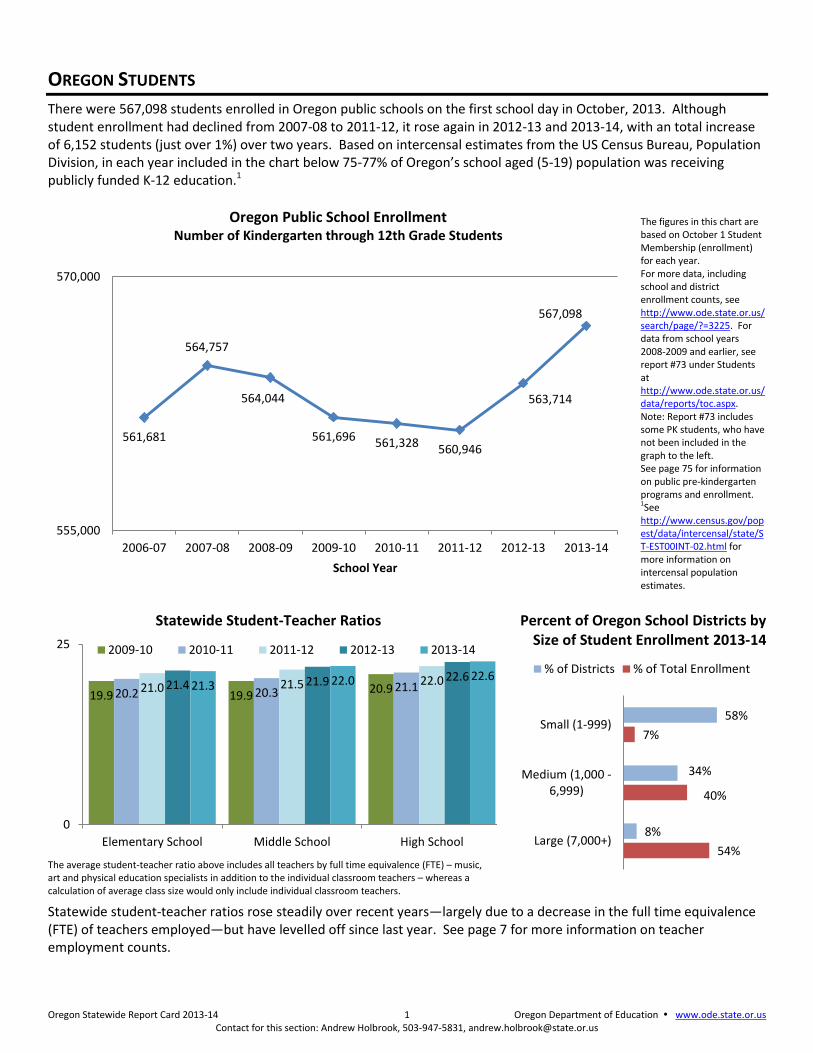
There were 567,098 students enrolled in Oregon public schools on the first school day in October, 2013. Although student enrollment had declined from 2007-08 to 2011-12, it rose again in 2012-13 and 2013-14, with an total increase of 6,152 students (just over 1%) over two years. Based on intercensal estimates from the US Census Bureau, Population Division, in each year included in the chart below 75-77% of Oregon’s school aged (5-19) population was receiving publicly funded K-12 education.1
Oregon Public School Enrollment Number of Kindergarten through 12th Grade Students
The figures in this chart are based on October 1 Student Membership (enrollment) for each year. For more data, including school and district enrollment counts, see http://www.ode.state.or.us/search/page/?=3225. For data from school years 2008-2009 and earlier, see report #73 under Students at http://www.ode.state.or.us/data/reports/toc.aspx. Note: Report #73 includes some PK students, who have not been included in the graph to the left. See page 75 for information on public pre-kindergarten programs and enrollment. 1See http://www.census.gov/popest/data/intercensal/state/ST-EST00INT-02.html for more information on intercensal population estimates.
Statewide Student-Teacher Ratios
The average student-teacher ratio above includes all teachers by full time equivalence (FTE) – music, art and physical education specialists in addition to the individual classroom teachers – whereas a calculation of average class size would only include individual classroom teachers.
Percent of Oregon School Districts by Size of Student Enrollment 2013-14
Statewide student-teacher ratios rose steadily over recent years—largely due to a decrease in the full time equivalence (FTE) of teachers employed—but have levelled off since last year. See page 7 for more information on teacher employment counts.
561,681
564,757
564,044
561,696 561,328 560,946
563,714
567,098
555,000
570,000
2006-07 2007-08 2008-09 2009-10 2010-11 2011-12 2012-13 2013-14
School Year
19.9 19.9 20.9 20.2 20.3 21.1 21.0 21.5 22.0 21.4 21.9 22.6
21.3 22.0 22.6
0
25
Elementary School Middle School High School
2009-10 2010-11 2011-12 2012-13 2013-14
58%
34%
8%
7%
40%
54%
Small (1-999)
Medium (1,000 -6,999)
Large (7,000+)
% of Districts % of Total Enrollment
Oregon Statewide Report Card 2013-14 2 Oregon Department of Education www.ode.state.or.us Contact for this section: Kate Pattison, 503-947-5691, [email protected]
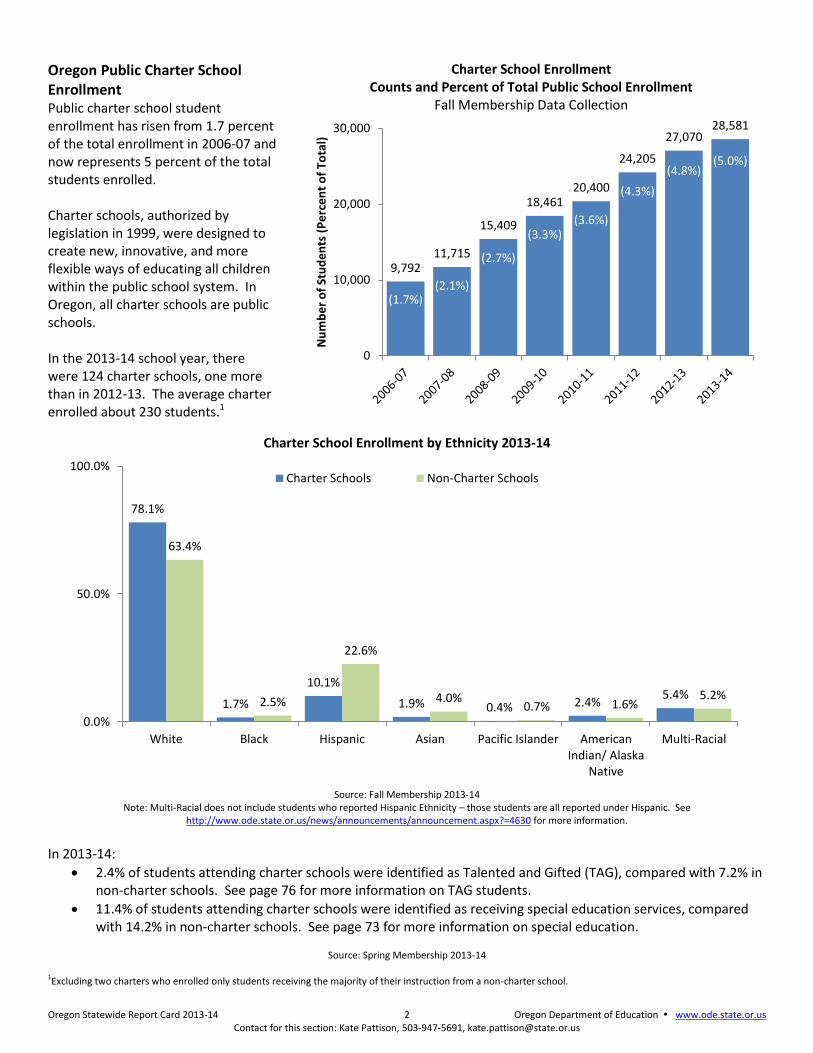
Oregon Public Charter School Enrollment Public charter school student enrollment has risen from 1.7 percent of the total enrollment in 2006-07 and now represents 5 percent of the total students enrolled. Charter schools, authorized by legislation in 1999, were designed to create new, innovative, and more flexible ways of educating all children within the public school system. In Oregon, all charter schools are public schools. In the 2013-14 school year, there were 124 charter schools, one more than in 2012-13. The average charter enrolled about 230 students.1
Charter School Enrollment Counts and Percent of Total Public School Enrollment
Fall Membership Data Collection
Charter School Enrollment by Ethnicity 2013-14
Source: Fall Membership 2013-14 Note: Multi-Racial does not include students who reported Hispanic Ethnicity – those students are all reported under Hispanic. See
http://www.ode.state.or.us/news/announcements/announcement.aspx?=4630 for more information.
In 2013-14:
2.4% of students attending charter schools were identified as Talented and Gifted (TAG), compared with 7.2% in non-charter schools. See page 76 for more information on TAG students.
11.4% of students attending charter schools were identified as receiving special education services, compared with 14.2% in non-charter schools. See page 73 for more information on special education.
Source: Spring Membership 2013-14
1Excluding two charters who enrolled only students receiving the majority of their instruction from a non-charter school.
9,792 11,715
15,409
18,461 20,400
24,205
27,070 28,581
(1.7%) (2.1%)
(2.7%)
(3.3%) (3.6%)
(4.3%)
(4.8%) (5.0%)
0
10,000
20,000
30,000
Nu
mb
er
of
Stu
de
nts
(P
erc
en
t o
f To
tal)
78.1%
1.7%
10.1%
1.9% 0.4% 2.4% 5.4%
63.4%
2.5%
22.6%
4.0% 0.7% 1.6%
5.2%
0.0%
50.0%
100.0%
White Black Hispanic Asian Pacific Islander AmericanIndian/ Alaska
Native
Multi-Racial
Charter Schools Non-Charter Schools
Oregon Statewide Report Card 2013-14 3 Oregon Department of Education www.ode.state.or.us Contact for this section: Kate Pattison, 503-947-5691, [email protected]
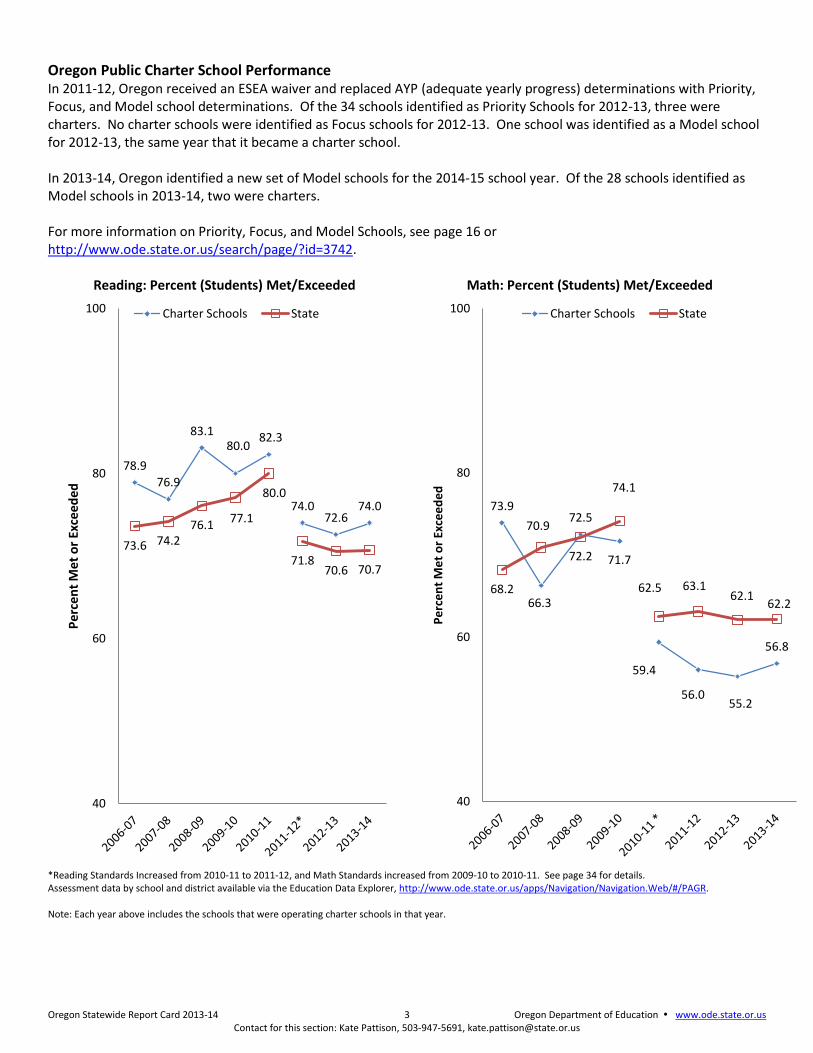
Oregon Public Charter School Performance In 2011-12, Oregon received an ESEA waiver and replaced AYP (adequate yearly progress) determinations with Priority, Focus, and Model school determinations. Of the 34 schools identified as Priority Schools for 2012-13, three were charters. No charter schools were identified as Focus schools for 2012-13. One school was identified as a Model school for 2012-13, the same year that it became a charter school. In 2013-14, Oregon identified a new set of Model schools for the 2014-15 school year. Of the 28 schools identified as Model schools in 2013-14, two were charters. For more information on Priority, Focus, and Model Schools, see page 16 or http://www.ode.state.or.us/search/page/?id=3742.
Reading: Percent (Students) Met/Exceeded
Math: Percent (Students) Met/Exceeded
*Reading Standards Increased from 2010-11 to 2011-12, and Math Standards increased from 2009-10 to 2010-11. See page 34 for details.Assessment data by school and district available via the Education Data Explorer, http://www.ode.state.or.us/apps/Navigation/Navigation.Web/#/PAGR. Note: Each year above includes the schools that were operating charter schools in that year.
78.9 76.9
83.1 80.0
82.3
74.0 72.6
74.0
73.6 74.2 76.1
77.1
80.0
71.8 70.6 70.7
40
60
80
100
Pe
rce
nt
Me
t o
r Ex
ceed
ed
Charter Schools State
73.9
66.3
72.5
71.7
59.4
56.0 55.2
56.8
68.2
70.9
72.2
74.1
62.5 63.1 62.1
62.2
40
60
80
100
Pe
rce
nt
Me
t o
r Ex
cee
de
d
Charter Schools State
Oregon Statewide Report Card 2013-14 4 Oregon Department of Education www.ode.state.or.us Contact for this section: Andrew Holbrook, 503-947-5831, [email protected]
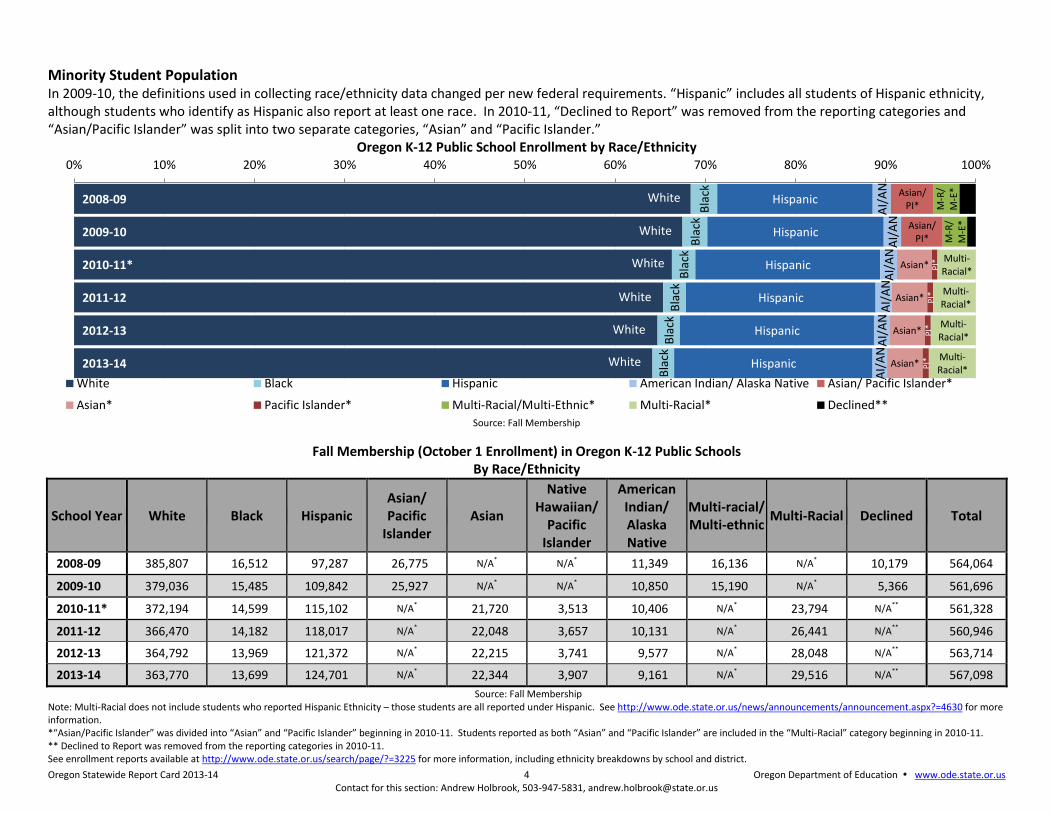
Minority Student Population In 2009-10, the definitions used in collecting race/ethnicity data changed per new federal requirements. “Hispanic” includes all students of Hispanic ethnicity, although students who identify as Hispanic also report at least one race. In 2010-11, “Declined to Report” was removed from the reporting categories and “Asian/Pacific Islander” was split into two separate categories, “Asian” and “Pacific Islander.”
Oregon K-12 Public School Enrollment by Race/Ethnicity
Source: Fall Membership
Fall Membership (October 1 Enrollment) in Oregon K-12 Public Schools By Race/Ethnicity
School Year White Black Hispanic Asian/ Pacific
Islander Asian
Native Hawaiian/
Pacific Islander
American Indian/ Alaska Native
Multi-racial/ Multi-ethnic
Multi-Racial Declined Total
2008-09 385,807 16,512 97,287 26,775 N/A* N/A* 11,349 16,136 N/A* 10,179 564,064
2009-10 379,036 15,485 109,842 25,927 N/A* N/A* 10,850 15,190 N/A* 5,366 561,696
2010-11* 372,194 14,599 115,102 N/A* 21,720 3,513 10,406 N/A* 23,794 N/A** 561,328
2011-12 366,470 14,182 118,017 N/A* 22,048 3,657 10,131 N/A* 26,441 N/A** 560,946
2012-13 364,792 13,969 121,372 N/A* 22,215 3,741 9,577 N/A* 28,048 N/A** 563,714
2013-14 363,770 13,699 124,701 N/A* 22,344 3,907 9,161 N/A* 29,516 N/A** 567,098
Source: Fall Membership Note: Multi-Racial does not include students who reported Hispanic Ethnicity – those students are all reported under Hispanic. See http://www.ode.state.or.us/news/announcements/announcement.aspx?=4630 for more information. *“Asian/Pacific Islander” was divided into “Asian” and “Pacific Islander” beginning in 2010-11. Students reported as both “Asian” and “Pacific Islander” are included in the “Multi-Racial” category beginning in 2010-11. ** Declined to Report was removed from the reporting categories in 2010-11. See enrollment reports available at http://www.ode.state.or.us/search/page/?=3225 for more information, including ethnicity breakdowns by school and district.
2008-09
2009-10
2010-11*
2011-12
2012-13
2013-14
Bla
ck
Bla
ck
Bla
ck
Bla
ck
Bla
ck
Bla
ck
Hispanic
Hispanic
Hispanic
Hispanic
Hispanic
Hispanic
AI/
AN
A
I/A
N
AI/
AN
A
I/A
N
AI/
AN
A
I/A
N
Asian/ PI*
Asian/ PI*
Asian*
Asian*
Asian*
Asian*
PI*
P
I*
PI*
P
I*
M-R
/ M
-E*
M-R
/ M
-E*
Multi- Racial*
Multi- Racial*
Multi- Racial*
Multi- Racial*
0% 10% 20% 30% 40% 50% 60% 70% 80% 90% 100%
White Black Hispanic American Indian/ Alaska Native Asian/ Pacific Islander*
Asian* Pacific Islander* Multi-Racial/Multi-Ethnic* Multi-Racial* Declined**
White
White
White
White
White
White
Oregon Statewide Report Card 2013-14 5 Oregon Department of Education www.ode.state.or.us Contact for this section: Kim Miller, 503-947-5712, [email protected]
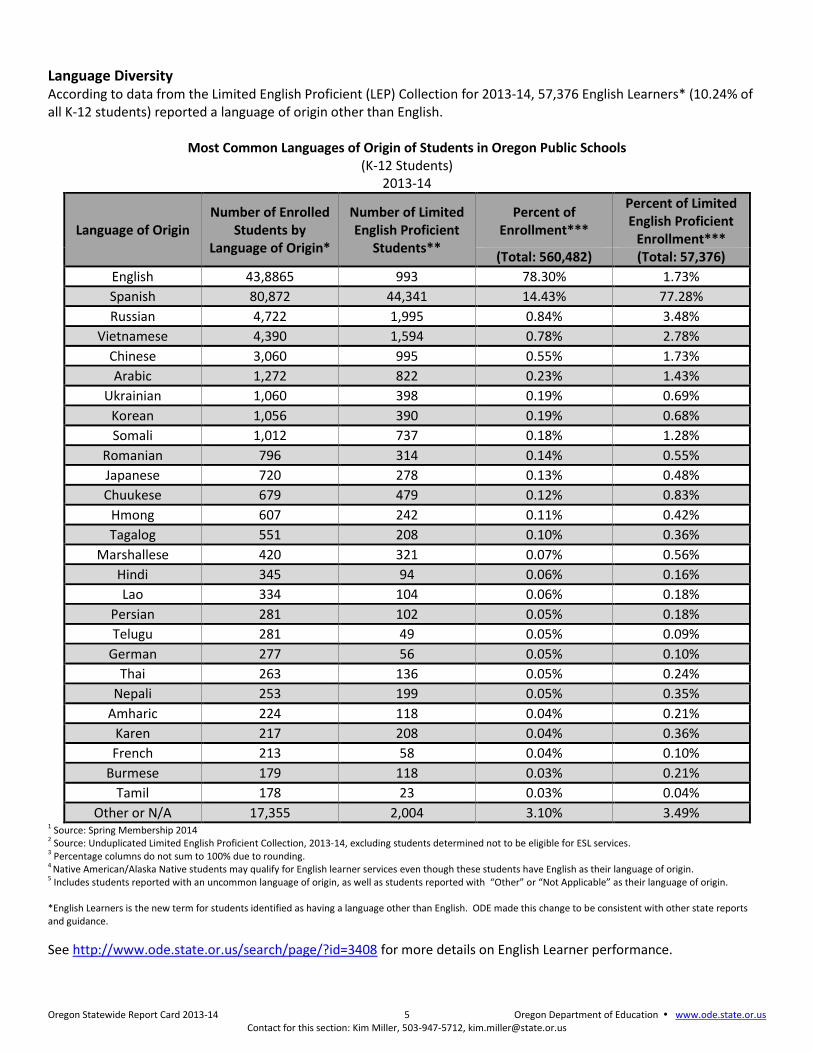
Language Diversity According to data from the Limited English Proficient (LEP) Collection for 2013-14, 57,376 English Learners* (10.24% of all K-12 students) reported a language of origin other than English.
Most Common Languages of Origin of Students in Oregon Public Schools (K-12 Students)
2013-14
Language of Origin Number of Enrolled
Students by Language of Origin*
Number of Limited English Proficient
Students**
Percent of Enrollment***
Percent of Limited English Proficient
Enrollment***
(Total: 560,482) (Total: 57,376)
English 43,8865 993 78.30% 1.73%
Spanish 80,872 44,341 14.43% 77.28%
Russian 4,722 1,995 0.84% 3.48%
Vietnamese 4,390 1,594 0.78% 2.78%
Chinese 3,060 995 0.55% 1.73%
Arabic 1,272 822 0.23% 1.43%
Ukrainian 1,060 398 0.19% 0.69%
Korean 1,056 390 0.19% 0.68%
Somali 1,012 737 0.18% 1.28%
Romanian 796 314 0.14% 0.55%
Japanese 720 278 0.13% 0.48%
Chuukese 679 479 0.12% 0.83%
Hmong 607 242 0.11% 0.42%
Tagalog 551 208 0.10% 0.36%
Marshallese 420 321 0.07% 0.56%
Hindi 345 94 0.06% 0.16%
Lao 334 104 0.06% 0.18%
Persian 281 102 0.05% 0.18%
Telugu 281 49 0.05% 0.09%
German 277 56 0.05% 0.10%
Thai 263 136 0.05% 0.24%
Nepali 253 199 0.05% 0.35%
Amharic 224 118 0.04% 0.21%
Karen 217 208 0.04% 0.36%
French 213 58 0.04% 0.10%
Burmese 179 118 0.03% 0.21%
Tamil 178 23 0.03% 0.04%
Other or N/A 17,355 2,004 3.10% 3.49% 1 Source: Spring Membership 2014 2 Source: Unduplicated Limited English Proficient Collection, 2013-14, excluding students determined not to be eligible for ESL services. 3 Percentage columns do not sum to 100% due to rounding. 4 Native American/Alaska Native students may qualify for English learner services even though these students have English as their language of origin. 5 Includes students reported with an uncommon language of origin, as well as students reported with “Other” or “Not Applicable” as their language of origin. *English Learners is the new term for students identified as having a language other than English. ODE made this change to be consistent with other state reports and guidance.
See http://www.ode.state.or.us/search/page/?id=3408 for more details on English Learner performance.
Oregon Statewide Report Card 2013-14 6 Oregon Department of Education www.ode.state.or.us Contact for this section: Andrew Holbrook, 503-947-5831, [email protected]
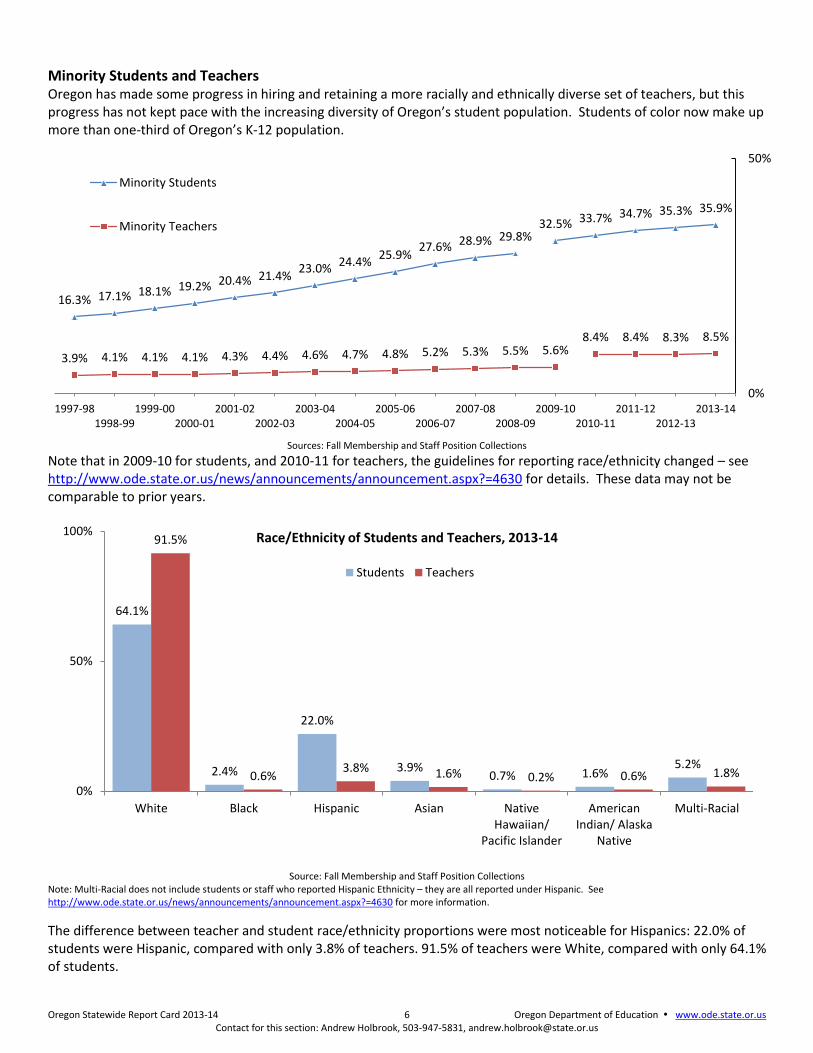
Minority Students and Teachers Oregon has made some progress in hiring and retaining a more racially and ethnically diverse set of teachers, but this progress has not kept pace with the increasing diversity of Oregon’s student population. Students of color now make up more than one-third of Oregon’s K-12 population.
Sources: Fall Membership and Staff Position Collections
Note that in 2009-10 for students, and 2010-11 for teachers, the guidelines for reporting race/ethnicity changed – see http://www.ode.state.or.us/news/announcements/announcement.aspx?=4630 for details. These data may not be comparable to prior years.
Source: Fall Membership and Staff Position Collections
Note: Multi-Racial does not include students or staff who reported Hispanic Ethnicity – they are all reported under Hispanic. See http://www.ode.state.or.us/news/announcements/announcement.aspx?=4630 for more information.
The difference between teacher and student race/ethnicity proportions were most noticeable for Hispanics: 22.0% of students were Hispanic, compared with only 3.8% of teachers. 91.5% of teachers were White, compared with only 64.1% of students.
16.3% 17.1% 18.1% 19.2% 20.4% 21.4% 23.0% 24.4%
25.9% 27.6% 28.9% 29.8%
32.5% 33.7% 34.7% 35.3% 35.9%
3.9% 4.1% 4.1% 4.1% 4.3% 4.4% 4.6% 4.7% 4.8% 5.2% 5.3% 5.5% 5.6% 8.4% 8.4% 8.3% 8.5%
0%
50%
1997-981998-99
1999-002000-01
2001-022002-03
2003-042004-05
2005-062006-07
2007-082008-09
2009-102010-11
2011-122012-13
2013-14
Minority Students
Minority Teachers
64.1%
2.4%
22.0%
3.9% 0.7% 1.6%
5.2%
91.5%
0.6% 3.8% 1.6% 0.2% 0.6% 1.8%
0%
50%
100%
White Black Hispanic Asian NativeHawaiian/
Pacific Islander
AmericanIndian/ Alaska
Native
Multi-Racial
Race/Ethnicity of Students and Teachers, 2013-14
Students Teachers
Oregon Statewide Report Card 2013-14 7 Oregon Department of Education www.ode.state.or.us Contact for this section: Andrew Holbrook, 503-947-5831, [email protected]
OREGON STAFF
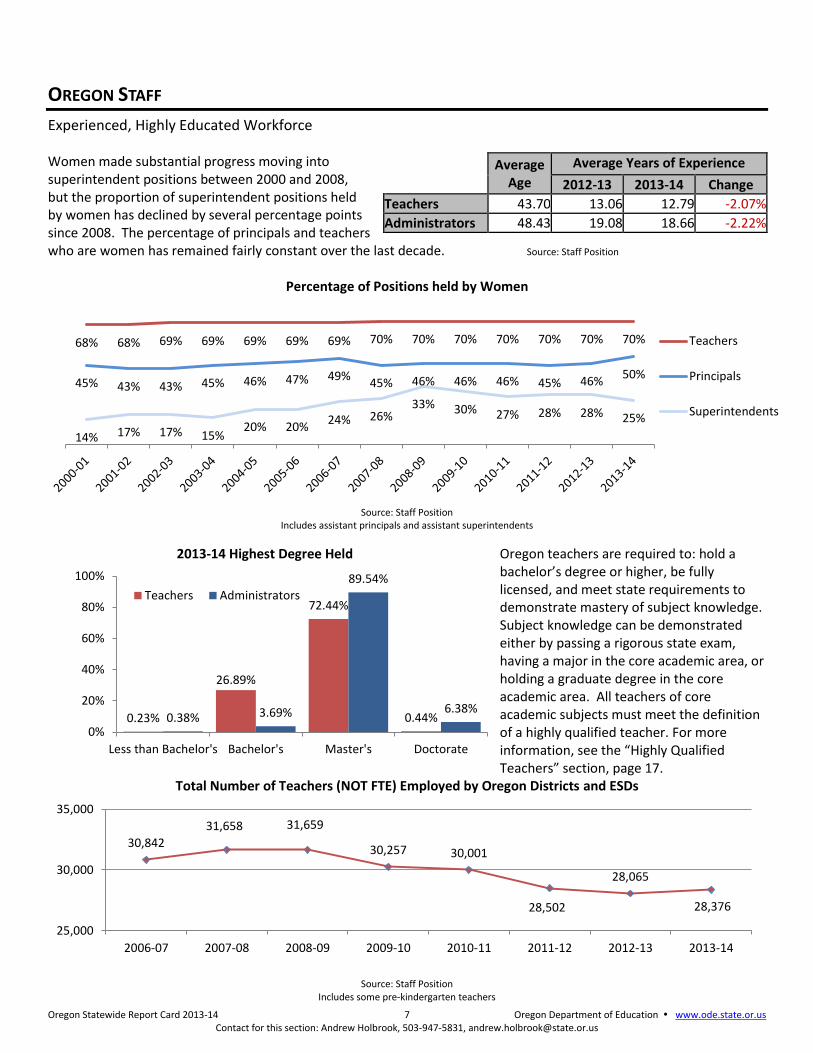
Experienced, Highly Educated Workforce Women made substantial progress moving into superintendent positions between 2000 and 2008, but the proportion of superintendent positions held by women has declined by several percentage points since 2008. The percentage of principals and teachers who are women has remained fairly constant over the last decade. Source: Staff Position
Percentage of Positions held by Women
Source: Staff Position Includes assistant principals and assistant superintendents
2013-14 Highest Degree Held
Oregon teachers are required to: hold a bachelor’s degree or higher, be fully licensed, and meet state requirements to demonstrate mastery of subject knowledge. Subject knowledge can be demonstrated either by passing a rigorous state exam, having a major in the core academic area, or holding a graduate degree in the core academic area. All teachers of core academic subjects must meet the definition of a highly qualified teacher. For more information, see the “Highly Qualified Teachers” section, page 17.
Total Number of Teachers (NOT FTE) Employed by Oregon Districts and ESDs
Source: Staff Position Includes some pre-kindergarten teachers
68% 68% 69% 69% 69% 69% 69% 70% 70% 70% 70% 70% 70% 70%
45% 43% 43% 45% 46% 47% 49% 45% 46% 46% 46% 45% 46%
50%
14% 17% 17% 15% 20% 20%
24% 26% 33% 30% 27% 28% 28% 25%
Teachers
Principals
Superintendents
0.23%
26.89%
72.44%
0.44% 0.38% 3.69%
89.54%
6.38%
0%
20%
40%
60%
80%
100%
Less than Bachelor's Bachelor's Master's Doctorate
Teachers Administrators
30,842
31,658 31,659
30,257 30,001
28,502
28,065
28,376
25,000
30,000
35,000
2006-07 2007-08 2008-09 2009-10 2010-11 2011-12 2012-13 2013-14
Average Age
Average Years of Experience
2012-13 2013-14 Change
Teachers 43.70 13.06 12.79 -2.07%
Administrators 48.43 19.08 18.66 -2.22%
Oregon Statewide Report Card 2013-14 8 Oregon Department of Education www.ode.state.or.us Contact for this section: Andrew Holbrook, 503-947-5831, [email protected]
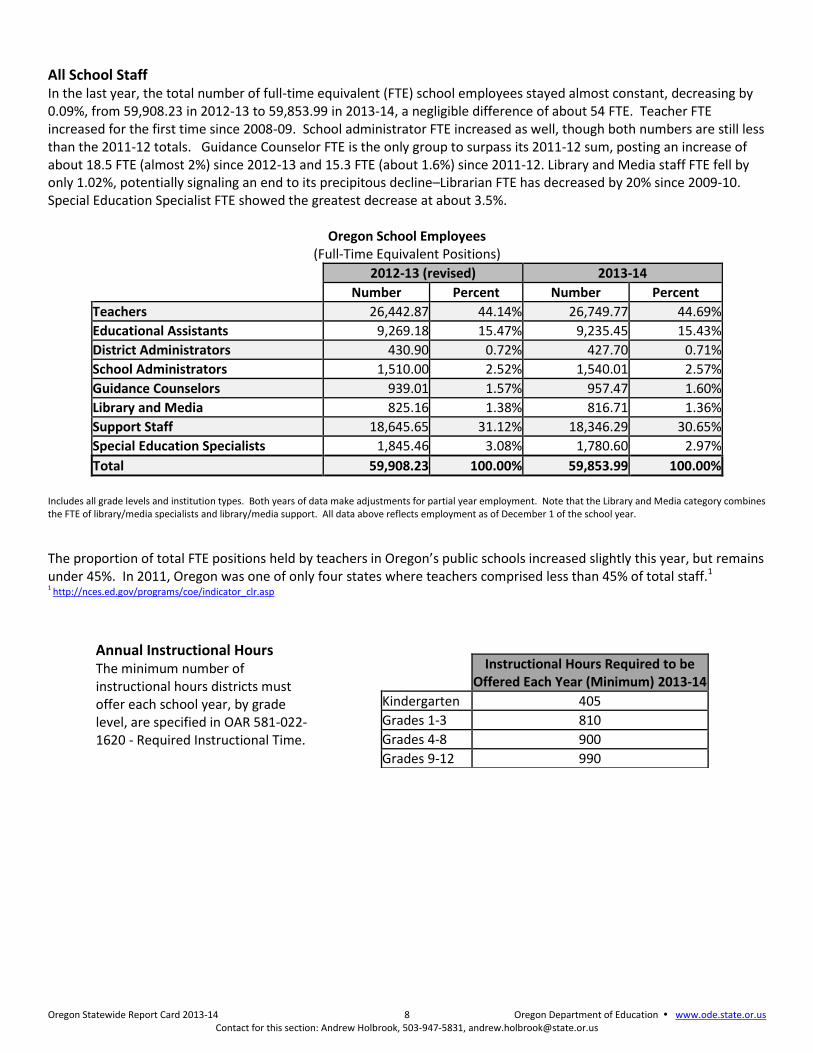
All School Staff In the last year, the total number of full-time equivalent (FTE) school employees stayed almost constant, decreasing by 0.09%, from 59,908.23 in 2012-13 to 59,853.99 in 2013-14, a negligible difference of about 54 FTE. Teacher FTE increased for the first time since 2008-09. School administrator FTE increased as well, though both numbers are still less than the 2011-12 totals. Guidance Counselor FTE is the only group to surpass its 2011-12 sum, posting an increase of about 18.5 FTE (almost 2%) since 2012-13 and 15.3 FTE (about 1.6%) since 2011-12. Library and Media staff FTE fell by only 1.02%, potentially signaling an end to its precipitous decline–Librarian FTE has decreased by 20% since 2009-10. Special Education Specialist FTE showed the greatest decrease at about 3.5%.
Oregon School Employees (Full-Time Equivalent Positions)
2012-13 (revised) 2013-14
Number Percent Number Percent
Teachers 26,442.87 44.14% 26,749.77 44.69%
Educational Assistants 9,269.18 15.47% 9,235.45 15.43%
District Administrators 430.90 0.72% 427.70 0.71%
School Administrators 1,510.00 2.52% 1,540.01 2.57%
Guidance Counselors 939.01 1.57% 957.47 1.60%
Library and Media 825.16 1.38% 816.71 1.36%
Support Staff 18,645.65 31.12% 18,346.29 30.65%
Special Education Specialists 1,845.46 3.08% 1,780.60 2.97%
Total 59,908.23 100.00% 59,853.99 100.00%
Includes all grade levels and institution types. Both years of data make adjustments for partial year employment. Note that the Library and Media category combines the FTE of library/media specialists and library/media support. All data above reflects employment as of December 1 of the school year.
The proportion of total FTE positions held by teachers in Oregon’s public schools increased slightly this year, but remains under 45%. In 2011, Oregon was one of only four states where teachers comprised less than 45% of total staff.1 1 http://nces.ed.gov/programs/coe/indicator_clr.asp
Annual Instructional Hours The minimum number of instructional hours districts must offer each school year, by grade level, are specified in OAR 581-022-1620 - Required Instructional Time.
Instructional Hours Required to be Offered Each Year (Minimum) 2013-14
Kindergarten 405
Grades 1-3 810
Grades 4-8 900
Grades 9-12 990
Oregon Statewide Report Card 2013-14 9 Oregon Department of Education • www.ode.state.or.us Contact for this section: Brian Reeder, 503-947-5670, [email protected]
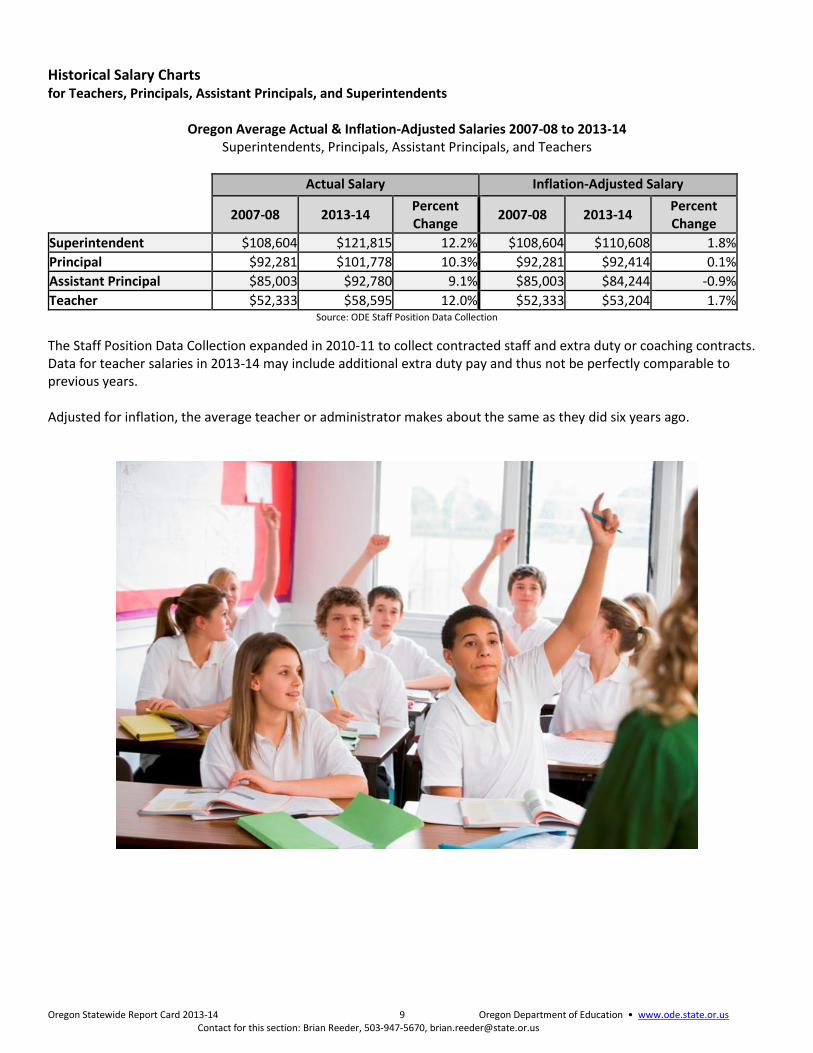
Historical Salary Charts for Teachers, Principals, Assistant Principals, and Superintendents
Oregon Average Actual & Inflation-Adjusted Salaries 2007-08 to 2013-14 Superintendents, Principals, Assistant Principals, and Teachers
Actual Salary Inflation-Adjusted Salary
2007-08 2013-14 Percent Change
2007-08 2013-14 Percent Change
Superintendent $108,604 $121,815 12.2% $108,604 $110,608 1.8%
Principal $92,281 $101,778 10.3% $92,281 $92,414 0.1%
Assistant Principal $85,003 $92,780 9.1% $85,003 $84,244 -0.9%
Teacher $52,333 $58,595 12.0% $52,333 $53,204 1.7% Source: ODE Staff Position Data Collection
The Staff Position Data Collection expanded in 2010-11 to collect contracted staff and extra duty or coaching contracts. Data for teacher salaries in 2013-14 may include additional extra duty pay and thus not be perfectly comparable to previous years. Adjusted for inflation, the average teacher or administrator makes about the same as they did six years ago.
Oregon Statewide Report Card 2013-14 10 Oregon Department of Education • www.ode.state.or.us Contact for this section: Brian Reeder, 503-947-5670, [email protected]
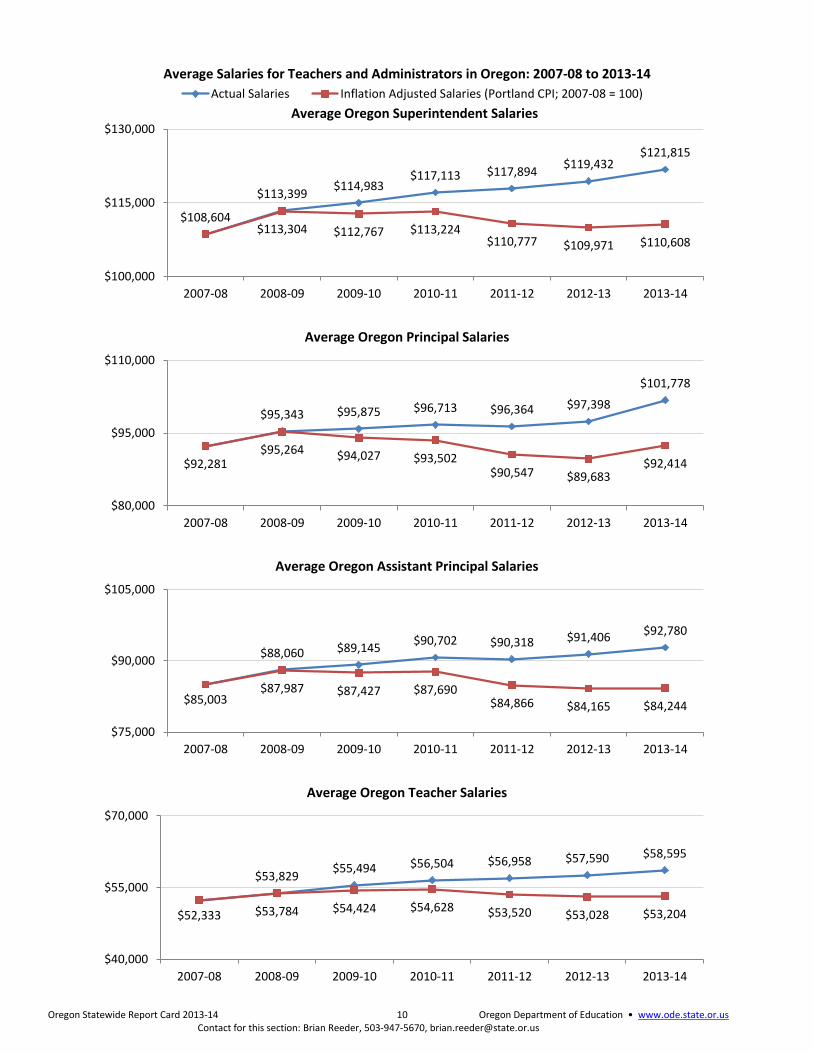
Average Salaries for Teachers and Administrators in Oregon: 2007-08 to 2013-14
Average Oregon Principal Salaries
Average Oregon Assistant Principal Salaries
Average Oregon Teacher Salaries
$108,604
$113,399 $114,983
$117,113 $117,894 $119,432
$121,815
$113,304 $112,767 $113,224 $110,777 $109,971 $110,608
$100,000
$115,000
$130,000
2007-08 2008-09 2009-10 2010-11 2011-12 2012-13 2013-14
Average Oregon Superintendent Salaries
Actual Salaries Inflation Adjusted Salaries (Portland CPI; 2007-08 = 100)
$92,281
$95,343 $95,875 $96,713 $96,364 $97,398
$101,778
$95,264 $94,027 $93,502 $90,547 $89,683
$92,414
$80,000
$95,000
$110,000
2007-08 2008-09 2009-10 2010-11 2011-12 2012-13 2013-14
$85,003
$88,060 $89,145 $90,702 $90,318 $91,406 $92,780
$87,987 $87,427 $87,690 $84,866 $84,165 $84,244
$75,000
$90,000
$105,000
2007-08 2008-09 2009-10 2010-11 2011-12 2012-13 2013-14
$52,333
$53,829 $55,494 $56,504 $56,958 $57,590 $58,595
$53,784 $54,424 $54,628 $53,520 $53,028 $53,204
$40,000
$55,000
$70,000
2007-08 2008-09 2009-10 2010-11 2011-12 2012-13 2013-14
Oregon Statewide Report Card 2013-14 11 Oregon Department of Education • www.ode.state.or.us Contact for this section: Brian Reeder, 503-947-5670, [email protected]
SCHOOL FUNDING
The majority of spending is allocated to classroom expenses. In Oregon, about 95 percent of spending is concentrated in school buildings and services to students with 5 percent spent on central support services.
Operating Expenditures per Student
Where Dollars Were Spent 2010-11 % 2011-12 % 2012-13 %
Direct Classroom $5,514 56% $5,495 56% $5,492 55%
Classroom Support $2,025 20% $1,983 20% $1,983 20%
Building Support $1,931 19% $1,943 20% $1,970 20%
Central Support $462 5% $477 5% $460 5%
TOTAL* $9,933 100% $9,898 100% $9,905 100% *Figures may not sum to TOTAL, due to rounding. Note: Per student calculation excludes students in state-run programs because spending on those students is not included. Source: School District and Education Service District (ESD) Audits
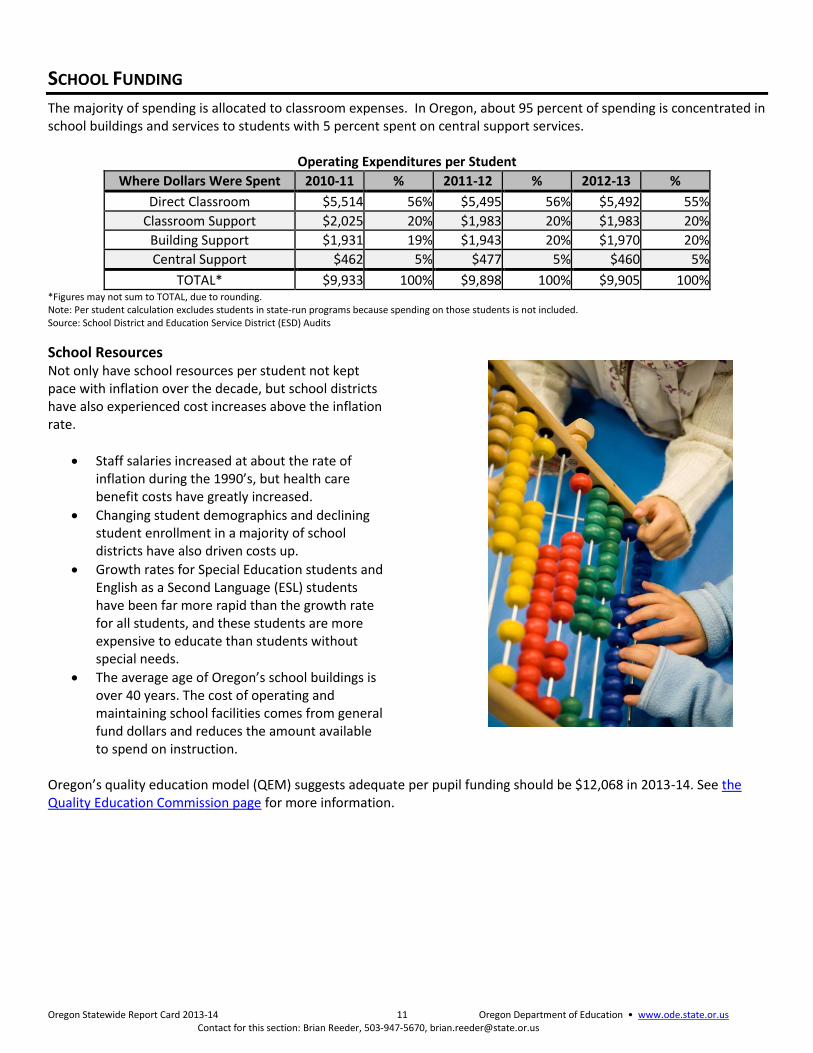
School Resources Not only have school resources per student not kept pace with inflation over the decade, but school districts have also experienced cost increases above the inflation rate.
Staff salaries increased at about the rate of inflation during the 1990’s, but health care benefit costs have greatly increased.
Changing student demographics and declining student enrollment in a majority of school districts have also driven costs up.
Growth rates for Special Education students and English as a Second Language (ESL) students have been far more rapid than the growth rate for all students, and these students are more expensive to educate than students without special needs.
The average age of Oregon’s school buildings is over 40 years. The cost of operating and maintaining school facilities comes from general fund dollars and reduces the amount available to spend on instruction.
Oregon’s quality education model (QEM) suggests adequate per pupil funding should be $12,068 in 2013-14. See the Quality Education Commission page for more information.
Oregon Statewide Report Card 2013-14 12 Oregon Department of Education • www.ode.state.or.us Contact for this section: Michael Wiltfong, 503-947-5914, [email protected]
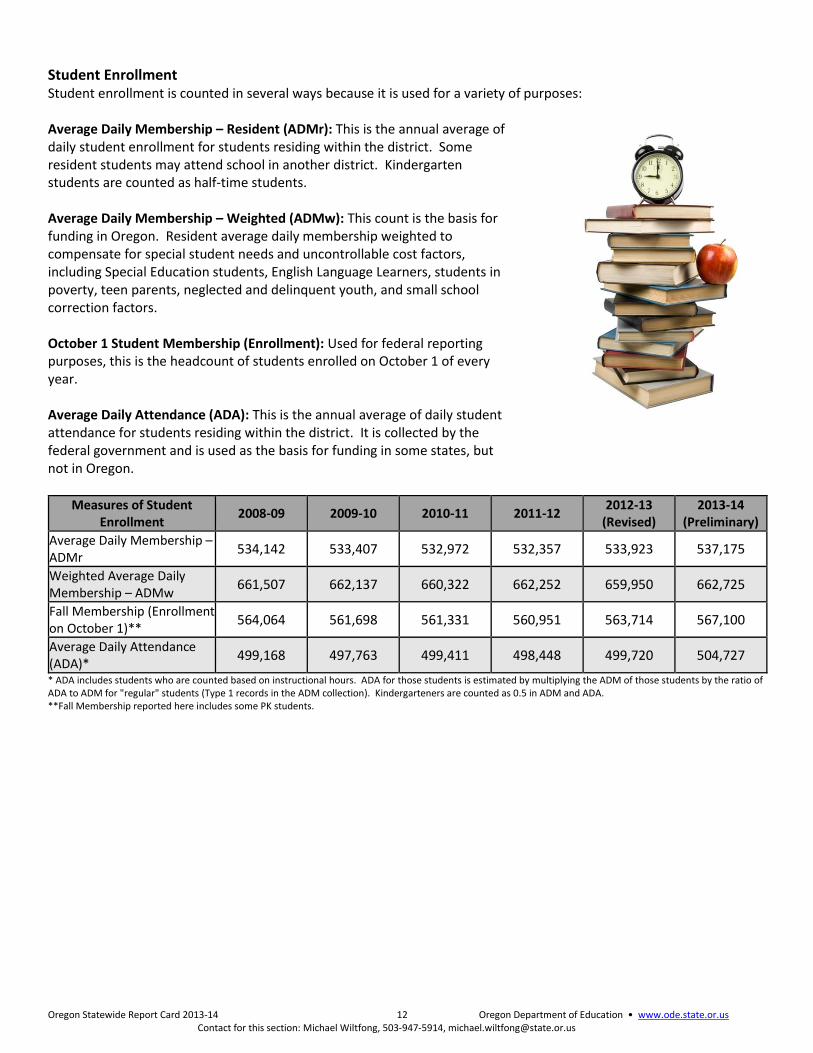
Student Enrollment Student enrollment is counted in several ways because it is used for a variety of purposes: Average Daily Membership – Resident (ADMr): This is the annual average of daily student enrollment for students residing within the district. Some resident students may attend school in another district. Kindergarten students are counted as half-time students. Average Daily Membership – Weighted (ADMw): This count is the basis for funding in Oregon. Resident average daily membership weighted to compensate for special student needs and uncontrollable cost factors, including Special Education students, English Language Learners, students in poverty, teen parents, neglected and delinquent youth, and small school correction factors. October 1 Student Membership (Enrollment): Used for federal reporting purposes, this is the headcount of students enrolled on October 1 of every year. Average Daily Attendance (ADA): This is the annual average of daily student attendance for students residing within the district. It is collected by the federal government and is used as the basis for funding in some states, but not in Oregon.
Measures of Student Enrollment
2008-09 2009-10 2010-11 2011-12 2012-13
(Revised) 2013-14
(Preliminary)
Average Daily Membership – ADMr
534,142 533,407 532,972 532,357 533,923 537,175
Weighted Average Daily Membership – ADMw
661,507 662,137 660,322 662,252 659,950 662,725
Fall Membership (Enrollment on October 1)**
564,064 561,698 561,331 560,951 563,714 567,100
Average Daily Attendance (ADA)*
499,168 497,763 499,411 498,448 499,720 504,727
* ADA includes students who are counted based on instructional hours. ADA for those students is estimated by multiplying the ADM of those students by the ratio of ADA to ADM for "regular" students (Type 1 records in the ADM collection). Kindergarteners are counted as 0.5 in ADM and ADA. **Fall Membership reported here includes some PK students.
Oregon Statewide Report Card 2013-14 13 Oregon Department of Education www.ode.state.or.us Contact for this section: Brian Reeder, 503-947-5670, [email protected]
History of School Funding Responsibility in Oregon
Historically, the largest source of revenue for public schools in Oregon has been local property taxes. Measure 5 changed that dramatically by lowering the amount of property taxes schools could raise. By 1995-96, with local property taxes for education limited to $5 per $1,000 of assessed valuation, the full impact of Measure 5 was felt. In 1997, Measure 50 further limited local property taxes for schools. Measure 5 required the state legislature to offset lost property tax revenue with money from the state general fund, which is composed primarily of state income taxes. As a result, Oregon schools are increasingly supported by state, not local, dollars. Oregon uses a formula to provide financial equity among school districts. Each school district receives (in combined state and local funds) an allocation per student, plus an additional amount for each student enrolled in more costly programs such as Special Education or English as a Second Language.
Biennial Formula Revenue (In Billions of Dollars, not adjusted for inflation)
2003-05 2005-07 2007-09** 2009-11*** 2011-13 2013-15
Local $2.3 $2.7 $2.9 $2.9* $3.0 $3.1
State $4.9 $5.2 $5.7 $5.6* $5.7 $6.7
Total $7.2 $7.9 $8.5 $8.4* $8.7 $9.7 Source: State School Fund Distribution Formula.
Includes School Districts and Education Service Districts. Note: Totals may not equal the sum of State and Local amounts due to rounding. *Revised
**2007-09 State amount does not include $260 million appropriated to the School Improvement Fund or $115 million in federal stimulus funds. ***2009-11 includes $200 million in state funds triggered by economic conditions. It does not include $227 million in federal stimulus funds.
The table above includes only funds distributed through the state’s equalization formula. Districts also receive federal, state, and local funds that are not distributed through the formula. Total Operating Revenues, which include those dollars, are shown in the table below.
Annual District and ESD Operating Revenues by Source
(Dollars in Millions)
Year Local Intermediate State Federal TOTAL
Amount % Amount % Amount % Amount % Amount %
2005-06 $1,657.8 32.6% $161.3 3.2% $2,731.7 53.8% $529.7 10.4% $5,080.5 100%
2006-07 $1,741.8 32.9% $101.7 1.9% $2,901.9 54.8% $546.7 10.3% $5,292.1 100%
2007-08 $1,841.8 32.5% $80.3 1.4% $3,193.4 56.3% $554.4 9.8% $5,669.9 100%
2008-09 $1,870.5 32.7% $69.4 1.2% $3,106.1 54.3% $670.1 11.7% $5,716.1 100%
2009-10 $1,928.0 33.5% $70.9 1.2% $2,934.2 51.0% $820.1 14.3% $5,753.1 100%
2010-11 $1,949.9 34.4% $75.1 1.3% $2,782.4 49.1% $856.5 15.1% $5,663.9 100%
2011-12 $1,987.2 34.8% $74.6 1.3% $3,028.9 53.1% $612.3 10.7% $5,703.0 100%
2012-13 $2,009.7 35.3% $88.9 1.6% $3,030.4 53.2% $565.3 9.9% $5,694.2 100.00% Source: Actuals from audited financial reports of School Districts and Education Service Districts
Columns may not sum to total due to rounding
For more information on Oregon school funding, see the most recent report produced by the Quality Education Commission: http://www.ode.state.or.us/superintendent/priorities/final-2014-qem-report-volume-i-(2).pdf.
Oregon Statewide Report Card 2013-14 14 Oregon Department of Education www.ode.state.or.us Contact for this section: Brian Reeder, 503-947-5670, [email protected]
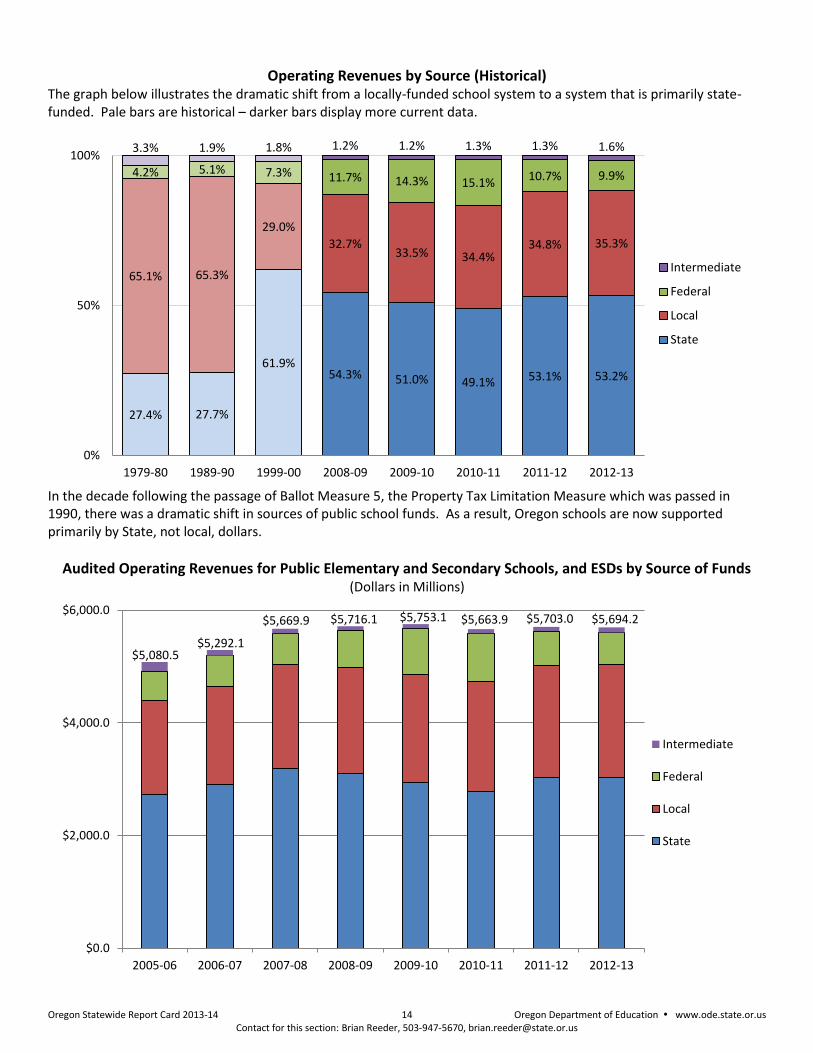
Operating Revenues by Source (Historical)
The graph below illustrates the dramatic shift from a locally-funded school system to a system that is primarily state-funded. Pale bars are historical – darker bars display more current data.
In the decade following the passage of Ballot Measure 5, the Property Tax Limitation Measure which was passed in 1990, there was a dramatic shift in sources of public school funds. As a result, Oregon schools are now supported primarily by State, not local, dollars.
Audited Operating Revenues for Public Elementary and Secondary Schools, and ESDs by Source of Funds (Dollars in Millions)
27.4% 27.7%
61.9% 54.3% 51.0% 49.1% 53.1% 53.2%
65.1% 65.3%
29.0%
32.7% 33.5% 34.4%
34.8% 35.3%
4.2% 5.1% 7.3% 11.7% 14.3% 15.1% 10.7% 9.9%
3.3% 1.9% 1.8% 1.2% 1.2% 1.3% 1.3% 1.6%
0%
50%
100%
1979-80 1989-90 1999-00 2008-09 2009-10 2010-11 2011-12 2012-13
Intermediate
Federal
Local
State
$5,080.5 $5,292.1
$5,669.9 $5,716.1 $5,753.1 $5,663.9 $5,703.0 $5,694.2
$0.0
$2,000.0
$4,000.0
$6,000.0
2005-06 2006-07 2007-08 2008-09 2009-10 2010-11 2011-12 2012-13
Intermediate
Federal
Local
State

Oregon Statewide Report Card 2013-14 15 Oregon Department of Education www.ode.state.or.us Contact for this section: Dave Cook, 503-947-5600, [email protected]
ELEMENTARY AND SECONDARY EDUCATION ACT (ESEA)
Federal Programs Through the Elementary and Secondary Education Act (ESEA), the Oregon Department of Education receives and distributes federal education funds to eligible school districts throughout Oregon. These supplemental funds support district efforts in meeting federal and state requirements and in implementing programs that improve the ability of all students to meet high academic standards. The Oregon Department of Education continues its commitment to develop processes that ensure that ESEA federal funds contribute to these opportunities. Oregon students are served through the following programs provided through the Elementary and Secondary Education Act: Title I-A Improving Basic Programs Title I-B1 Reading First Title I-B2 Early Reading First Title I-B3 Even Start Family Literacy Program Title IC Education of Migratory Children Title ID Prevention and Intervention Programs for Children and Youth Who Are Neglected, Delinquent, or At-Risk Title II-A Preparing, Training, and Recruiting High Quality Teachers and Principals Title II-B Mathematics & Science Partnerships Title II-C Troops to Teachers Title II-D Enhancing Education Through Technology Title III Language Instruction for Limited English Proficient and Immigrant Students Title IV-A Safe and Drug-Free Schools and Communities Title IV-B 21st Century Community Learning Centers Title V-A Innovative Programs Title V-B Charter Schools Title VI-A Funding Flexibility Title VI-B Rural Education Initiative Title VII Indian, Native Hawaiian, and Alaskan Native Education Title X McKinney-Vento Homeless Education Assistance Improvements In addition to the management of federal funds, the Office of Learning provides ongoing guidance, technical assistance, model programs, and monitoring to ensure that all students receive these opportunities for academic success. In 2012, Oregon received approval for a waiver of certain requirements of the ESEA. See page 16 for more information.

Oregon Statewide Report Card 2013-14 16 Oregon Department of Education www.ode.state.or.us Contact for this section: Josh Rew, 503-947-5845, [email protected]
Elementary and Secondary Education Act (ESEA) Flexibility Waiver The Elementary and Secondary Education Act (ESEA) was passed in 1965 as a part of the “War on Poverty.” The federal No Child Left Behind Act of 2001 was signed into law on January 8, 2002. This legislation reauthorized the ESEA, mandated new requirements for state-level funding, professional development of teachers, assessment of student performance, and reporting student and school information to parents and communities. In September 2011, the U.S. Department of Education invited states to request flexibility regarding specific requirements of the No Child Left Behind Act of 2001 in exchange for rigorous and comprehensive state-developed plans designed to improve educational outcomes for all students, close achievement gaps, increase equity, and improve the quality of instruction. Oregon submitted its ESEA Flexibility Request in January 2012, and the request received federal approval in July 2012. With this approval, Oregon is able to tailor the mechanisms of the ESEA to create a more accountable and responsive system that meets the needs of Oregon students and strengthens Oregon schools. As part of the federal ESEA Flexibility application, Oregon developed a new accountability system which uses multiple measures to rate schools. For high schools these measures include academic achievement, academic growth, subgroup growth, graduation rates, and subgroup graduation rates. For elementary and middle schools, only the first three measures are used. Schools receive an overall rating based on how well they are doing in each of these areas. Oregon used this system to identify 96 Oregon schools in 2012-13 (36 Priority Schools and 60 Focus Schools) to receive additional supports and interventions from the state to help increase student achievement and close persistent achievement gaps. Priority schools represent the lowest 5% of high-poverty schools (Title 1) in the state according the new accountability system, while Focus schools are additional schools in the lowest 15% of high-poverty schools in the state that have achievement gaps. The accountability system also identified 30 high-poverty Model schools for 2012-13. These Model schools have been identified as examples of successful student outcomes and will serve as models and mentors to other schools around the state.
2012-13 ESEA Flexibility Designations
Number of Schools
Number of Title I Schools
Priority Schools
Focus Schools
Model Schools
All Schools 1253 585 36 60 30
Elementary/Middle 922 533 19 57 28
High Schools 331 52 17 3 2
2013-14 ESEA Flexibility Designations
Number of Schools
Number of Title I Schools
Priority Schools1
Focus Schools1
Model Schools
All Schools 1246 574 33 60 27
Elementary/Middle 913 523 19 57 25
High Schools 333 51 14 3 2
2014-15 ESEA Flexibility Designations
Number of Schools
Number of Title I Schools
Priority Schools1
Focus Schools1
Model Schools
All Schools 1239 567 33 58 28
Elementary/Middle 909 515 19 55 27
High Schools 330 52 14 3 1 1Priority and Focus designations from 2012-13 remain in effect for four years. Changes after 2012-13 are the result of school closures.
Oregon’s ESEA Flexibility Waiver Request is available online at: http://www.ode.state.or.us/search/page/?id=3475
Oregon Statewide Report Card 2013-14 17 Oregon Department of Education www.ode.state.or.us Contact for this section: Leah Thorp, 503-947-2561, [email protected]
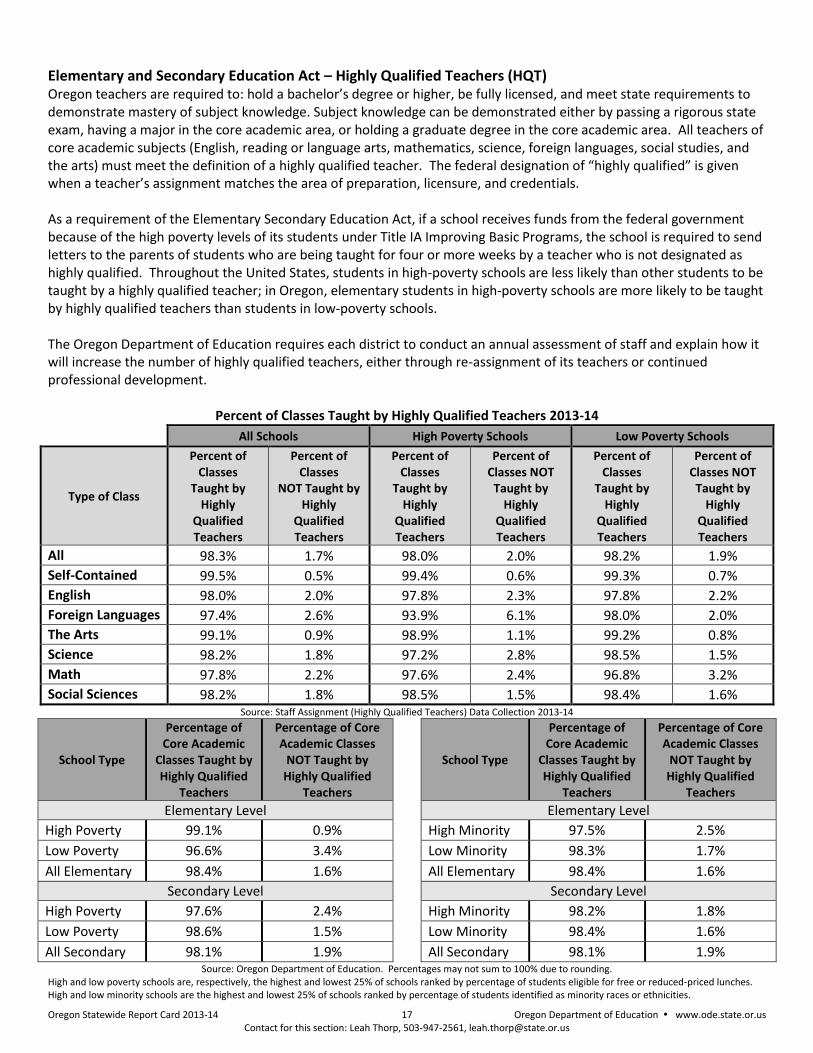
Elementary and Secondary Education Act – Highly Qualified Teachers (HQT) Oregon teachers are required to: hold a bachelor’s degree or higher, be fully licensed, and meet state requirements to demonstrate mastery of subject knowledge. Subject knowledge can be demonstrated either by passing a rigorous state exam, having a major in the core academic area, or holding a graduate degree in the core academic area. All teachers of core academic subjects (English, reading or language arts, mathematics, science, foreign languages, social studies, and the arts) must meet the definition of a highly qualified teacher. The federal designation of “highly qualified” is given when a teacher’s assignment matches the area of preparation, licensure, and credentials. As a requirement of the Elementary Secondary Education Act, if a school receives funds from the federal government because of the high poverty levels of its students under Title IA Improving Basic Programs, the school is required to send letters to the parents of students who are being taught for four or more weeks by a teacher who is not designated as highly qualified. Throughout the United States, students in high-poverty schools are less likely than other students to be taught by a highly qualified teacher; in Oregon, elementary students in high-poverty schools are more likely to be taught by highly qualified teachers than students in low-poverty schools. The Oregon Department of Education requires each district to conduct an annual assessment of staff and explain how it will increase the number of highly qualified teachers, either through re-assignment of its teachers or continued professional development.
Percent of Classes Taught by Highly Qualified Teachers 2013-14
All Schools High Poverty Schools Low Poverty Schools
Type of Class
Percent of Classes
Taught by Highly
Qualified Teachers
Percent of Classes
NOT Taught by Highly
Qualified Teachers
Percent of Classes
Taught by Highly
Qualified Teachers
Percent of Classes NOT
Taught by Highly
Qualified Teachers
Percent of Classes
Taught by Highly
Qualified Teachers
Percent of Classes NOT
Taught by Highly
Qualified Teachers
All 98.3% 1.7% 98.0% 2.0% 98.2% 1.9%
Self-Contained 99.5% 0.5% 99.4% 0.6% 99.3% 0.7%
English 98.0% 2.0% 97.8% 2.3% 97.8% 2.2%
Foreign Languages 97.4% 2.6% 93.9% 6.1% 98.0% 2.0%
The Arts 99.1% 0.9% 98.9% 1.1% 99.2% 0.8%
Science 98.2% 1.8% 97.2% 2.8% 98.5% 1.5%
Math 97.8% 2.2% 97.6% 2.4% 96.8% 3.2%
Social Sciences 98.2% 1.8% 98.5% 1.5% 98.4% 1.6% Source: Staff Assignment (Highly Qualified Teachers) Data Collection 2013-14
School Type
Percentage of Core Academic
Classes Taught by Highly Qualified
Teachers
Percentage of Core Academic Classes
NOT Taught by Highly Qualified
Teachers
Elementary Level
High Poverty 99.1% 0.9%
Low Poverty 96.6% 3.4%
All Elementary 98.4% 1.6%
Secondary Level
High Poverty 97.6% 2.4%
Low Poverty 98.6% 1.5%
All Secondary 98.1% 1.9%
School Type
Percentage of Core Academic
Classes Taught by Highly Qualified
Teachers
Percentage of Core Academic Classes
NOT Taught by Highly Qualified
Teachers
Elementary Level
High Minority 97.5% 2.5%
Low Minority 98.3% 1.7%
All Elementary 98.4% 1.6%
Secondary Level
High Minority 98.2% 1.8%
Low Minority 98.4% 1.6%
All Secondary 98.1% 1.9% Source: Oregon Department of Education. Percentages may not sum to 100% due to rounding.
High and low poverty schools are, respectively, the highest and lowest 25% of schools ranked by percentage of students eligible for free or reduced-priced lunches. High and low minority schools are the highest and lowest 25% of schools ranked by percentage of students identified as minority races or ethnicities.
Oregon Statewide Report Card 2013-14 18 Oregon Department of Education www.ode.state.or.us Contact for this section: John Inglish, 503-947-5797, [email protected]
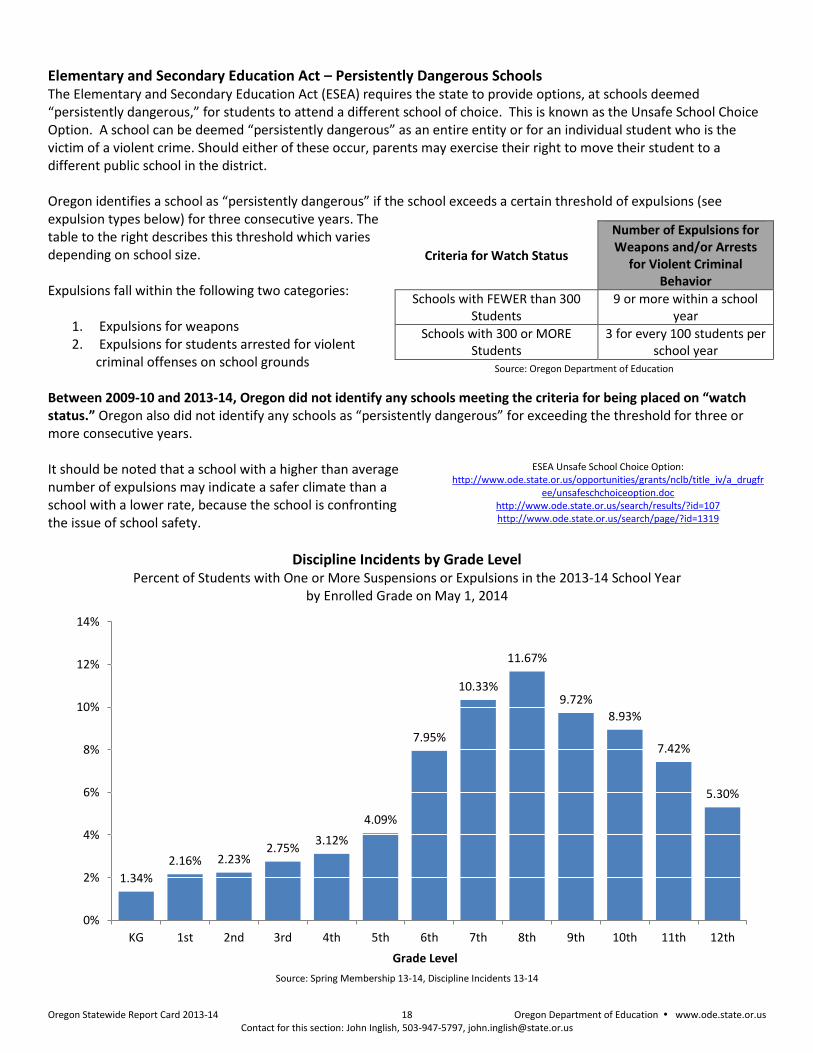
Elementary and Secondary Education Act – Persistently Dangerous Schools
The Elementary and Secondary Education Act (ESEA) requires the state to provide options, at schools deemed “persistently dangerous,” for students to attend a different school of choice. This is known as the Unsafe School Choice Option. A school can be deemed “persistently dangerous” as an entire entity or for an individual student who is the victim of a violent crime. Should either of these occur, parents may exercise their right to move their student to a different public school in the district. Oregon identifies a school as “persistently dangerous” if the school exceeds a certain threshold of expulsions (see expulsion types below) for three consecutive years. The table to the right describes this threshold which varies depending on school size. Expulsions fall within the following two categories:
1. Expulsions for weapons 2. Expulsions for students arrested for violent
criminal offenses on school grounds Between 2009-10 and 2013-14, Oregon did not identify any schools meeting the criteria for being placed on “watch status.” Oregon also did not identify any schools as “persistently dangerous” for exceeding the threshold for three or more consecutive years. It should be noted that a school with a higher than average number of expulsions may indicate a safer climate than a school with a lower rate, because the school is confronting the issue of school safety.
ESEA Unsafe School Choice Option: http://www.ode.state.or.us/opportunities/grants/nclb/title_iv/a_drugfr
ee/unsafeschchoiceoption.doc http://www.ode.state.or.us/search/results/?id=107 http://www.ode.state.or.us/search/page/?id=1319
Discipline Incidents by Grade Level Percent of Students with One or More Suspensions or Expulsions in the 2013-14 School Year
by Enrolled Grade on May 1, 2014
Source: Spring Membership 13-14, Discipline Incidents 13-14
1.34%
2.16% 2.23% 2.75%
3.12%
4.09%
7.95%
10.33%
11.67%
9.72%
8.93%
7.42%
5.30%
0%
2%
4%
6%
8%
10%
12%
14%
KG 1st 2nd 3rd 4th 5th 6th 7th 8th 9th 10th 11th 12th
Grade Level
Criteria for Watch Status
Number of Expulsions for Weapons and/or Arrests
for Violent Criminal Behavior
Schools with FEWER than 300 Students
9 or more within a school year
Schools with 300 or MORE Students
3 for every 100 students per school year
Source: Oregon Department of Education
Oregon Statewide Report Card 2013-14 19 Oregon Department of Education www.ode.state.or.us Contact for this section: John Inglish, 503-947-5797, [email protected]
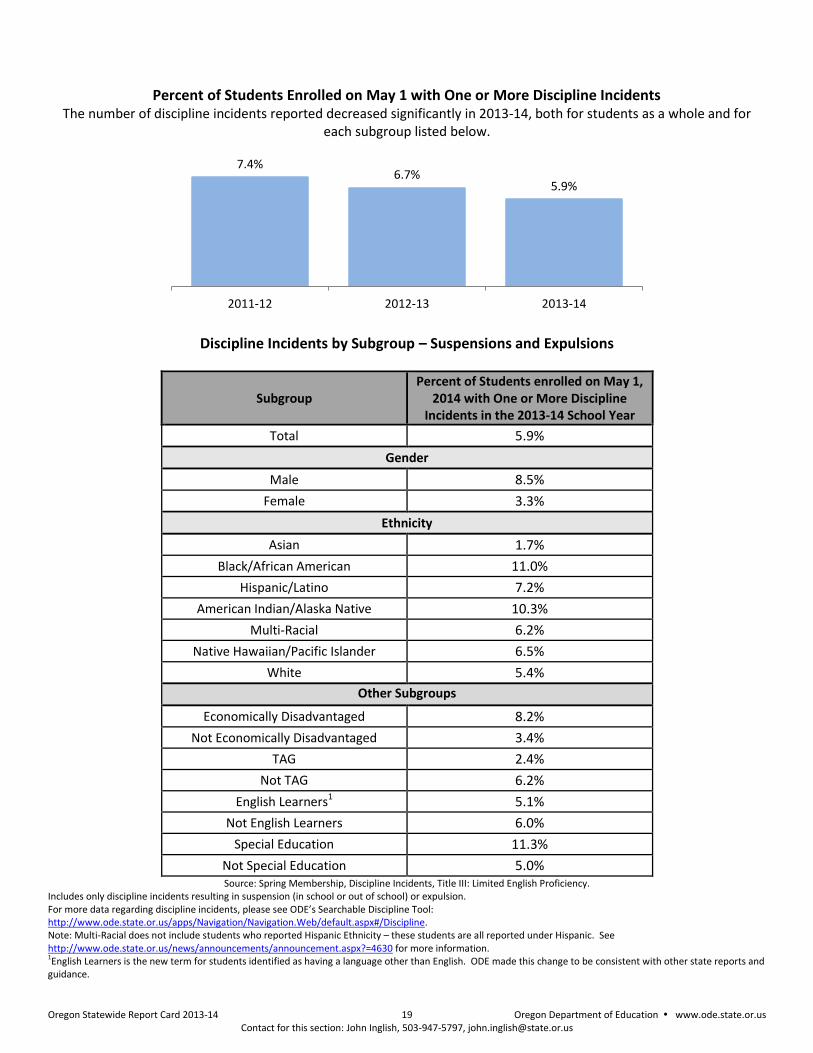
Percent of Students Enrolled on May 1 with One or More Discipline Incidents
The number of discipline incidents reported decreased significantly in 2013-14, both for students as a whole and for each subgroup listed below.
Discipline Incidents by Subgroup – Suspensions and Expulsions
Subgroup Percent of Students enrolled on May 1,
2014 with One or More Discipline Incidents in the 2013-14 School Year
Total 5.9%
Gender
Male 8.5%
Female 3.3%
Ethnicity
Asian 1.7%
Black/African American 11.0%
Hispanic/Latino 7.2%
American Indian/Alaska Native 10.3%
Multi-Racial 6.2%
Native Hawaiian/Pacific Islander 6.5%
White 5.4%
Other Subgroups
Economically Disadvantaged 8.2%
Not Economically Disadvantaged 3.4%
TAG 2.4%
Not TAG 6.2%
English Learners1 5.1%
Not English Learners 6.0%
Special Education 11.3%
Not Special Education 5.0% Source: Spring Membership, Discipline Incidents, Title III: Limited English Proficiency.
Includes only discipline incidents resulting in suspension (in school or out of school) or expulsion. For more data regarding discipline incidents, please see ODE’s Searchable Discipline Tool: http://www.ode.state.or.us/apps/Navigation/Navigation.Web/default.aspx#/Discipline. Note: Multi-Racial does not include students who reported Hispanic Ethnicity – these students are all reported under Hispanic. See http://www.ode.state.or.us/news/announcements/announcement.aspx?=4630 for more information. 1English Learners is the new term for students identified as having a language other than English. ODE made this change to be consistent with other state reports and guidance.
7.4% 6.7%
5.9%
2011-12 2012-13 2013-14
Oregon Statewide Report Card 2013-14 20 Oregon Department of Education www.ode.state.or.us Contact for this section: Josh Rew, 503-947-5845, [email protected]
ANNUAL MEASURABLE OBJECTIVES (AMO)
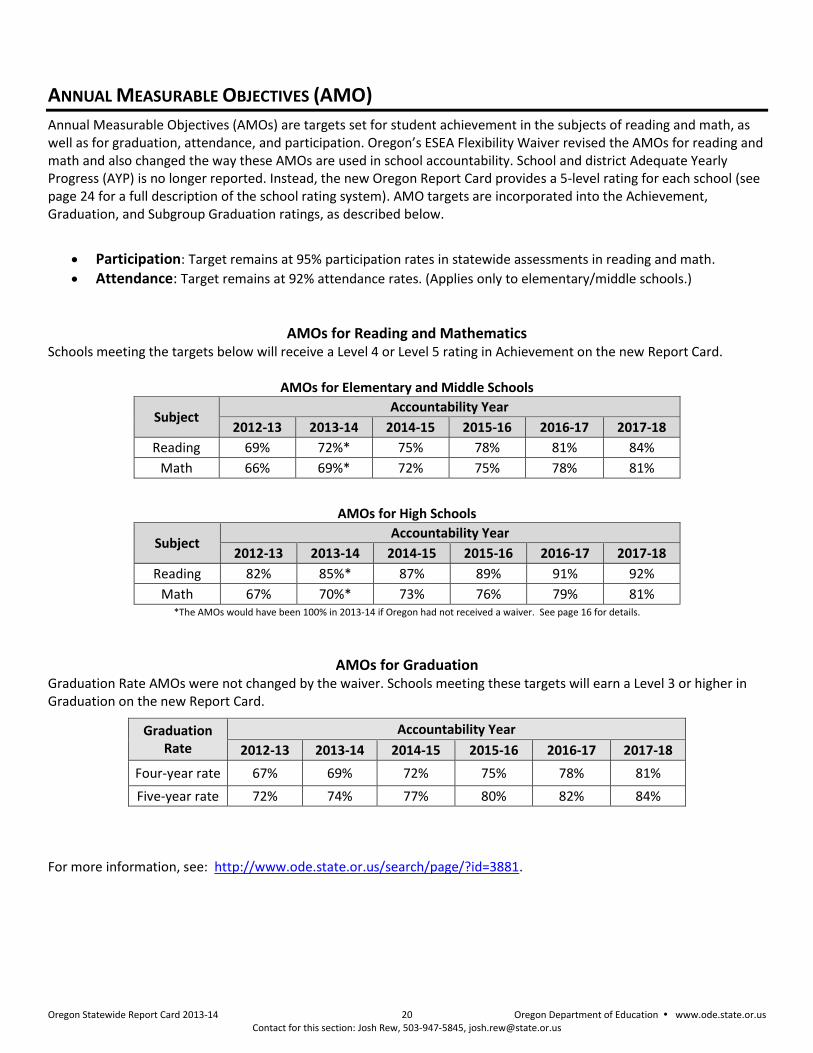
Annual Measurable Objectives (AMOs) are targets set for student achievement in the subjects of reading and math, as well as for graduation, attendance, and participation. Oregon’s ESEA Flexibility Waiver revised the AMOs for reading and math and also changed the way these AMOs are used in school accountability. School and district Adequate Yearly Progress (AYP) is no longer reported. Instead, the new Oregon Report Card provides a 5-level rating for each school (see page 24 for a full description of the school rating system). AMO targets are incorporated into the Achievement, Graduation, and Subgroup Graduation ratings, as described below.
Participation: Target remains at 95% participation rates in statewide assessments in reading and math.
Attendance: Target remains at 92% attendance rates. (Applies only to elementary/middle schools.)
AMOs for Reading and Mathematics
Schools meeting the targets below will receive a Level 4 or Level 5 rating in Achievement on the new Report Card.
AMOs for Elementary and Middle Schools
Subject Accountability Year
2012-13 2013-14 2014-15 2015-16 2016-17 2017-18
Reading 69% 72%* 75% 78% 81% 84%
Math 66% 69%* 72% 75% 78% 81%
AMOs for High Schools
Subject Accountability Year
2012-13 2013-14 2014-15 2015-16 2016-17 2017-18
Reading 82% 85%* 87% 89% 91% 92%
Math 67% 70%* 73% 76% 79% 81% *The AMOs would have been 100% in 2013-14 if Oregon had not received a waiver. See page 16 for details.
AMOs for Graduation
Graduation Rate AMOs were not changed by the waiver. Schools meeting these targets will earn a Level 3 or higher in Graduation on the new Report Card.
Graduation Rate
Accountability Year
2012-13 2013-14 2014-15 2015-16 2016-17 2017-18
Four-year rate 67% 69% 72% 75% 78% 81%
Five-year rate 72% 74% 77% 80% 82% 84%
For more information, see: http://www.ode.state.or.us/search/page/?id=3881.
Oregon Statewide Report Card 2013-14 21 Oregon Department of Education www.ode.state.or.us Contact for this section: Josh Rew, 503-947-5845, [email protected]
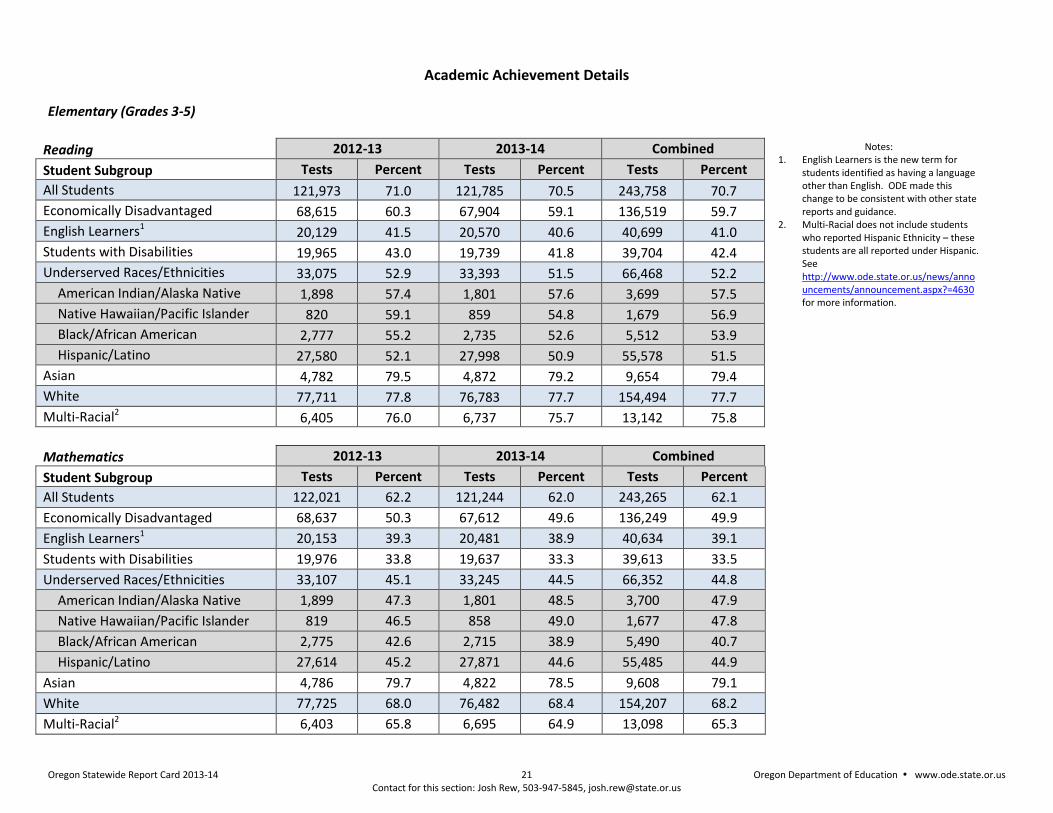
Academic Achievement Details Elementary (Grades 3-5)
Reading 2012-13 2013-14 Combined
Student Subgroup Tests Percent Tests Percent Tests Percent
All Students 121,973 71.0 121,785 70.5 243,758 70.7
Economically Disadvantaged 68,615 60.3 67,904 59.1 136,519 59.7
English Learners1 20,129 41.5 20,570 40.6 40,699 41.0
Students with Disabilities 19,965 43.0 19,739 41.8 39,704 42.4
Underserved Races/Ethnicities 33,075 52.9 33,393 51.5 66,468 52.2
American Indian/Alaska Native 1,898 57.4 1,801 57.6 3,699 57.5
Native Hawaiian/Pacific Islander 820 59.1 859 54.8 1,679 56.9
Black/African American 2,777 55.2 2,735 52.6 5,512 53.9
Hispanic/Latino 27,580 52.1 27,998 50.9 55,578 51.5
Asian 4,782 79.5 4,872 79.2 9,654 79.4
White 77,711 77.8 76,783 77.7 154,494 77.7
Multi-Racial2 6,405 76.0 6,737 75.7 13,142 75.8
Mathematics 2012-13 2013-14 Combined
Student Subgroup Tests Percent Tests Percent Tests Percent
All Students 122,021 62.2 121,244 62.0 243,265 62.1
Economically Disadvantaged 68,637 50.3 67,612 49.6 136,249 49.9
English Learners1 20,153 39.3 20,481 38.9 40,634 39.1
Students with Disabilities 19,976 33.8 19,637 33.3 39,613 33.5
Underserved Races/Ethnicities 33,107 45.1 33,245 44.5 66,352 44.8
American Indian/Alaska Native 1,899 47.3 1,801 48.5 3,700 47.9
Native Hawaiian/Pacific Islander 819 46.5 858 49.0 1,677 47.8
Black/African American 2,775 42.6 2,715 38.9 5,490 40.7
Hispanic/Latino 27,614 45.2 27,871 44.6 55,485 44.9
Asian 4,786 79.7 4,822 78.5 9,608 79.1
White 77,725 68.0 76,482 68.4 154,207 68.2
Multi-Racial2 6,403 65.8 6,695 64.9 13,098 65.3
Notes: 1. English Learners is the new term for
students identified as having a language other than English. ODE made this change to be consistent with other state reports and guidance.
2. Multi-Racial does not include students who reported Hispanic Ethnicity – these students are all reported under Hispanic. See http://www.ode.state.or.us/news/announcements/announcement.aspx?=4630 for more information.
Oregon Statewide Report Card 2013-14 22 Oregon Department of Education www.ode.state.or.us Contact for this section: Josh Rew, 503-947-5845, [email protected]
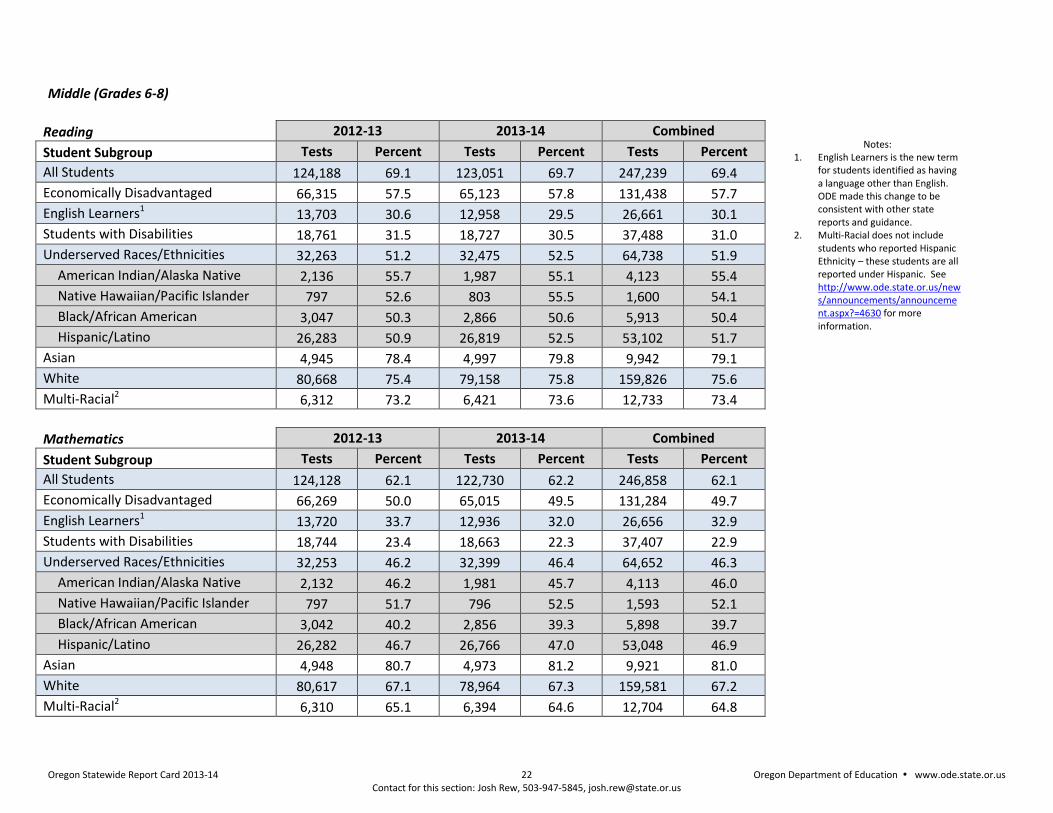
Middle (Grades 6-8)
Reading 2012-13 2013-14 Combined
Student Subgroup Tests Percent Tests Percent Tests Percent
All Students 124,188 69.1 123,051 69.7 247,239 69.4
Economically Disadvantaged 66,315 57.5 65,123 57.8 131,438 57.7
English Learners1 13,703 30.6 12,958 29.5 26,661 30.1
Students with Disabilities 18,761 31.5 18,727 30.5 37,488 31.0
Underserved Races/Ethnicities 32,263 51.2 32,475 52.5 64,738 51.9
American Indian/Alaska Native 2,136 55.7 1,987 55.1 4,123 55.4
Native Hawaiian/Pacific Islander 797 52.6 803 55.5 1,600 54.1
Black/African American 3,047 50.3 2,866 50.6 5,913 50.4
Hispanic/Latino 26,283 50.9 26,819 52.5 53,102 51.7
Asian 4,945 78.4 4,997 79.8 9,942 79.1
White 80,668 75.4 79,158 75.8 159,826 75.6
Multi-Racial2 6,312 73.2 6,421 73.6 12,733 73.4
Mathematics 2012-13 2013-14 Combined
Student Subgroup Tests Percent Tests Percent Tests Percent
All Students 124,128 62.1 122,730 62.2 246,858 62.1
Economically Disadvantaged 66,269 50.0 65,015 49.5 131,284 49.7
English Learners1 13,720 33.7 12,936 32.0 26,656 32.9
Students with Disabilities 18,744 23.4 18,663 22.3 37,407 22.9
Underserved Races/Ethnicities 32,253 46.2 32,399 46.4 64,652 46.3
American Indian/Alaska Native 2,132 46.2 1,981 45.7 4,113 46.0
Native Hawaiian/Pacific Islander 797 51.7 796 52.5 1,593 52.1
Black/African American 3,042 40.2 2,856 39.3 5,898 39.7
Hispanic/Latino 26,282 46.7 26,766 47.0 53,048 46.9
Asian 4,948 80.7 4,973 81.2 9,921 81.0
White 80,617 67.1 78,964 67.3 159,581 67.2
Multi-Racial2 6,310 65.1 6,394 64.6 12,704 64.8
Notes: 1. English Learners is the new term
for students identified as having a language other than English. ODE made this change to be consistent with other state reports and guidance.
2. Multi-Racial does not include students who reported Hispanic Ethnicity – these students are all reported under Hispanic. See http://www.ode.state.or.us/news/announcements/announcement.aspx?=4630 for more information.
Oregon Statewide Report Card 2013-14 23 Oregon Department of Education www.ode.state.or.us Contact for this section: Josh Rew, 503-947-5845, [email protected]
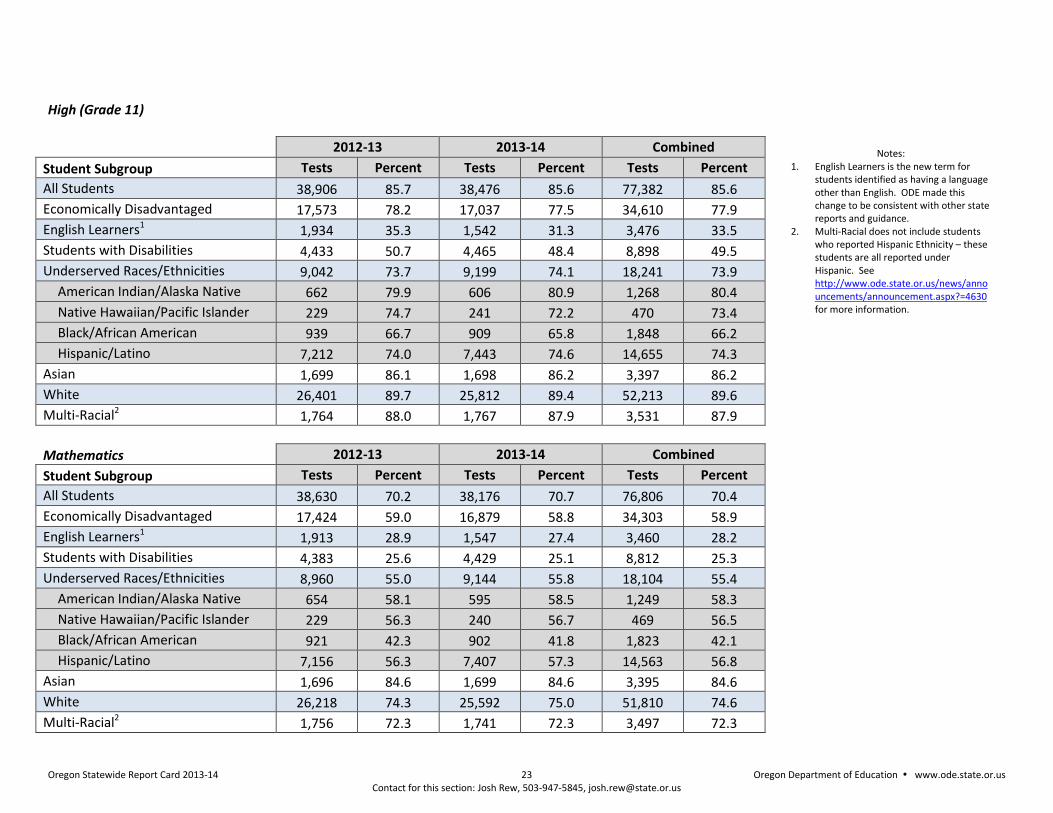
High (Grade 11)
Reading 2012-13 2013-14 Combined
Student Subgroup Tests Percent Tests Percent Tests Percent
All Students 38,906 85.7 38,476 85.6 77,382 85.6
Economically Disadvantaged 17,573 78.2 17,037 77.5 34,610 77.9
English Learners1 1,934 35.3 1,542 31.3 3,476 33.5
Students with Disabilities 4,433 50.7 4,465 48.4 8,898 49.5
Underserved Races/Ethnicities 9,042 73.7 9,199 74.1 18,241 73.9
American Indian/Alaska Native 662 79.9 606 80.9 1,268 80.4
Native Hawaiian/Pacific Islander 229 74.7 241 72.2 470 73.4
Black/African American 939 66.7 909 65.8 1,848 66.2
Hispanic/Latino 7,212 74.0 7,443 74.6 14,655 74.3
Asian 1,699 86.1 1,698 86.2 3,397 86.2
White 26,401 89.7 25,812 89.4 52,213 89.6
Multi-Racial2 1,764 88.0 1,767 87.9 3,531 87.9
Mathematics 2012-13 2013-14 Combined
Student Subgroup Tests Percent Tests Percent Tests Percent
All Students 38,630 70.2 38,176 70.7 76,806 70.4
Economically Disadvantaged 17,424 59.0 16,879 58.8 34,303 58.9
English Learners1 1,913 28.9 1,547 27.4 3,460 28.2
Students with Disabilities 4,383 25.6 4,429 25.1 8,812 25.3
Underserved Races/Ethnicities 8,960 55.0 9,144 55.8 18,104 55.4
American Indian/Alaska Native 654 58.1 595 58.5 1,249 58.3
Native Hawaiian/Pacific Islander 229 56.3 240 56.7 469 56.5
Black/African American 921 42.3 902 41.8 1,823 42.1
Hispanic/Latino 7,156 56.3 7,407 57.3 14,563 56.8
Asian 1,696 84.6 1,699 84.6 3,395 84.6
White 26,218 74.3 25,592 75.0 51,810 74.6
Multi-Racial2 1,756 72.3 1,741 72.3 3,497 72.3
Notes: 1. English Learners is the new term for
students identified as having a language other than English. ODE made this change to be consistent with other state reports and guidance.
2. Multi-Racial does not include students who reported Hispanic Ethnicity – these students are all reported under Hispanic. See http://www.ode.state.or.us/news/announcements/announcement.aspx?=4630 for more information.
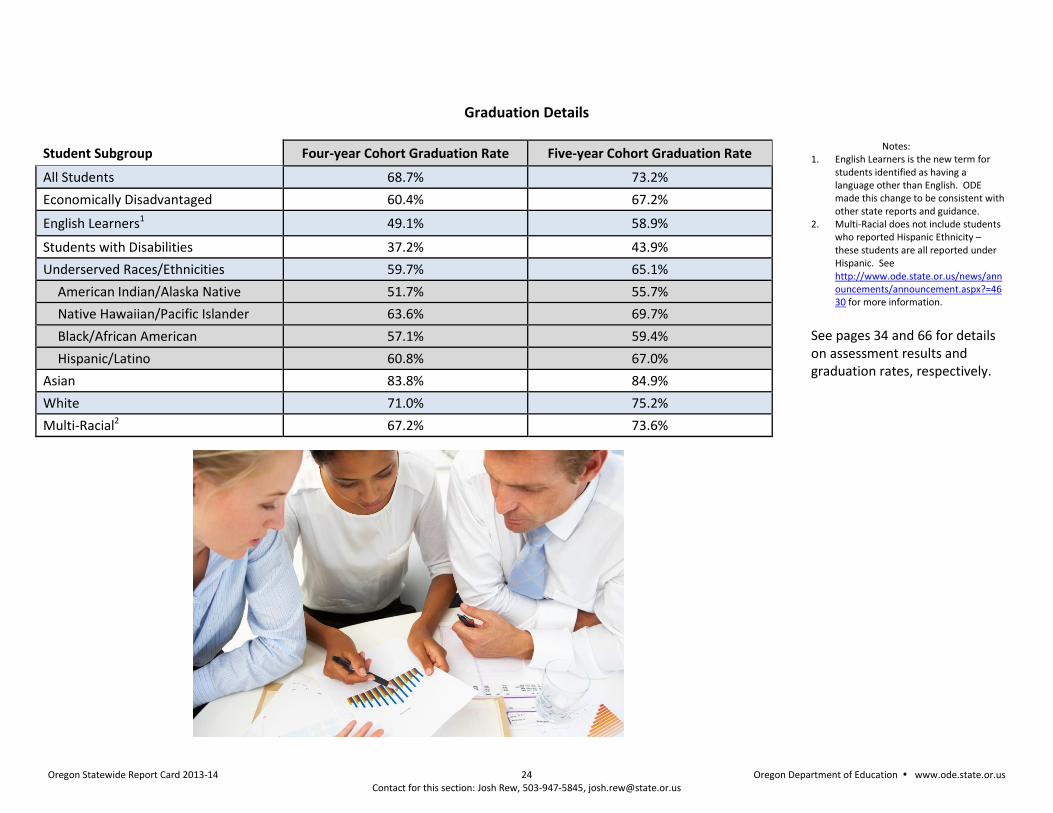
Oregon Statewide Report Card 2013-14 24 Oregon Department of Education www.ode.state.or.us Contact for this section: Josh Rew, 503-947-5845, [email protected]
Graduation Details
Student Subgroup Four-year Cohort Graduation Rate Five-year Cohort Graduation Rate
All Students 68.7% 73.2%
Economically Disadvantaged 60.4% 67.2%
English Learners1 49.1% 58.9%
Students with Disabilities 37.2% 43.9%
Underserved Races/Ethnicities 59.7% 65.1%
American Indian/Alaska Native 51.7% 55.7%
Native Hawaiian/Pacific Islander 63.6% 69.7%
Black/African American 57.1% 59.4%
Hispanic/Latino 60.8% 67.0%
Asian 83.8% 84.9%
White 71.0% 75.2%
Multi-Racial2 67.2% 73.6%
Notes: 1. English Learners is the new term for
students identified as having a language other than English. ODE made this change to be consistent with other state reports and guidance.
2. Multi-Racial does not include students who reported Hispanic Ethnicity – these students are all reported under Hispanic. See http://www.ode.state.or.us/news/announcements/announcement.aspx?=4630 for more information.
See pages 34 and 66 for details on assessment results and graduation rates, respectively.
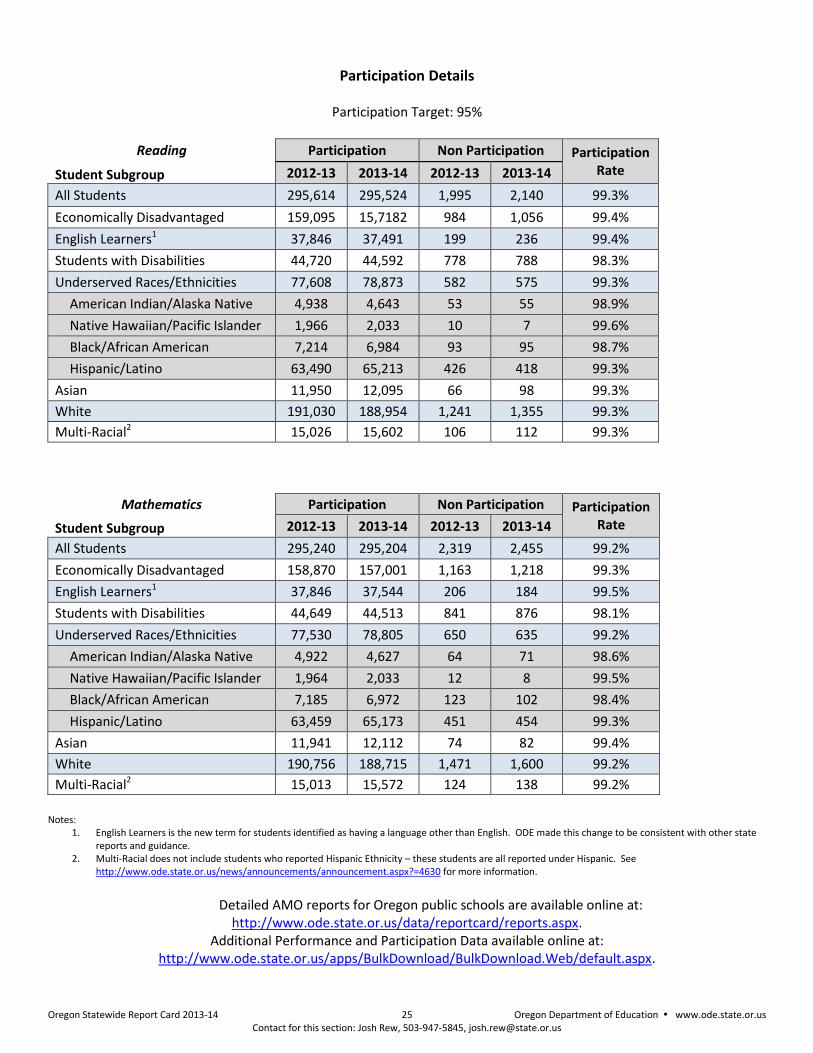
Oregon Statewide Report Card 2013-14 25 Oregon Department of Education www.ode.state.or.us Contact for this section: Josh Rew, 503-947-5845, [email protected]
Participation Details
Participation Target: 95%
Reading Participation Non Participation Participation Rate Student Subgroup 2012-13 2013-14 2012-13 2013-14
All Students 295,614 295,524 1,995 2,140 99.3%
Economically Disadvantaged 159,095 15,7182 984 1,056 99.4%
English Learners1 37,846 37,491 199 236 99.4%
Students with Disabilities 44,720 44,592 778 788 98.3%
Underserved Races/Ethnicities 77,608 78,873 582 575 99.3%
American Indian/Alaska Native 4,938 4,643 53 55 98.9%
Native Hawaiian/Pacific Islander 1,966 2,033 10 7 99.6%
Black/African American 7,214 6,984 93 95 98.7%
Hispanic/Latino 63,490 65,213 426 418 99.3%
Asian 11,950 12,095 66 98 99.3%
White 191,030 188,954 1,241 1,355 99.3%
Multi-Racial2 15,026 15,602 106 112 99.3%
Mathematics Participation Non Participation Participation Rate Student Subgroup 2012-13 2013-14 2012-13 2013-14
All Students 295,240 295,204 2,319 2,455 99.2%
Economically Disadvantaged 158,870 157,001 1,163 1,218 99.3%
English Learners1 37,846 37,544 206 184 99.5%
Students with Disabilities 44,649 44,513 841 876 98.1%
Underserved Races/Ethnicities 77,530 78,805 650 635 99.2%
American Indian/Alaska Native 4,922 4,627 64 71 98.6%
Native Hawaiian/Pacific Islander 1,964 2,033 12 8 99.5%
Black/African American 7,185 6,972 123 102 98.4%
Hispanic/Latino 63,459 65,173 451 454 99.3%
Asian 11,941 12,112 74 82 99.4%
White 190,756 188,715 1,471 1,600 99.2%
Multi-Racial2 15,013 15,572 124 138 99.2%
Notes:
1. English Learners is the new term for students identified as having a language other than English. ODE made this change to be consistent with other state reports and guidance.
2. Multi-Racial does not include students who reported Hispanic Ethnicity – these students are all reported under Hispanic. See http://www.ode.state.or.us/news/announcements/announcement.aspx?=4630 for more information.
Detailed AMO reports for Oregon public schools are available online at:
http://www.ode.state.or.us/data/reportcard/reports.aspx. Additional Performance and Participation Data available online at:
http://www.ode.state.or.us/apps/BulkDownload/BulkDownload.Web/default.aspx.
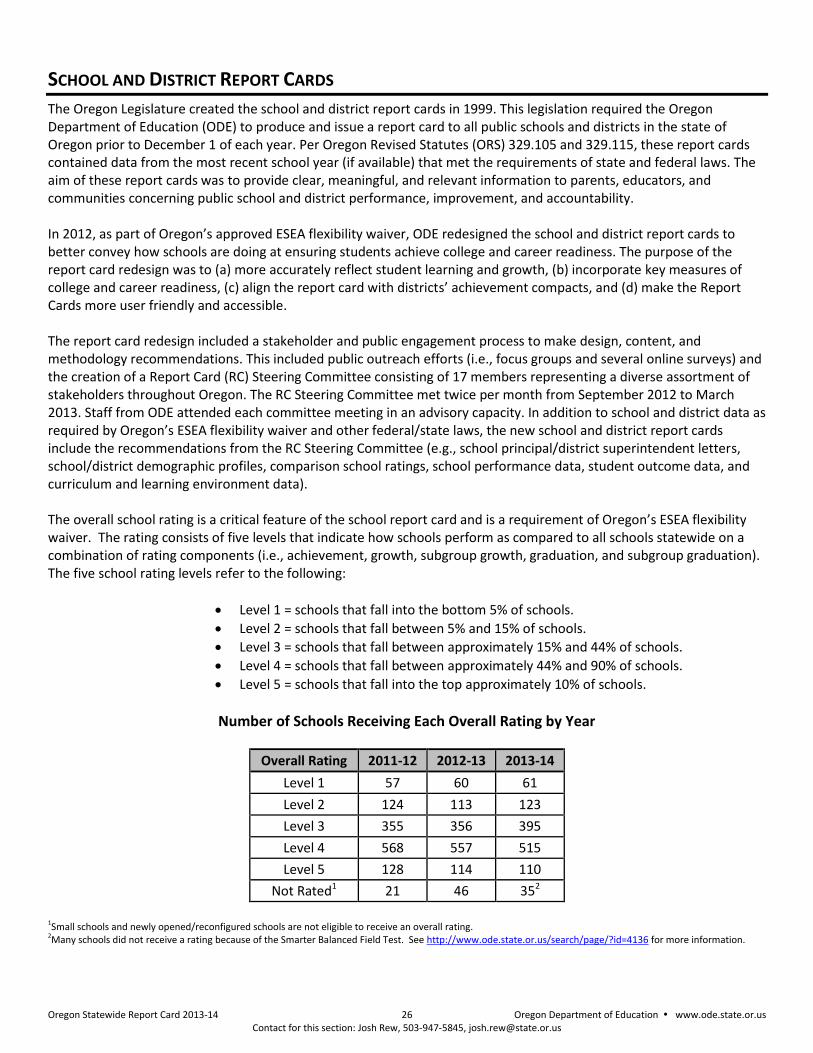
Oregon Statewide Report Card 2013-14 26 Oregon Department of Education www.ode.state.or.us Contact for this section: Josh Rew, 503-947-5845, [email protected]
SCHOOL AND DISTRICT REPORT CARDS
The Oregon Legislature created the school and district report cards in 1999. This legislation required the Oregon Department of Education (ODE) to produce and issue a report card to all public schools and districts in the state of Oregon prior to December 1 of each year. Per Oregon Revised Statutes (ORS) 329.105 and 329.115, these report cards contained data from the most recent school year (if available) that met the requirements of state and federal laws. The aim of these report cards was to provide clear, meaningful, and relevant information to parents, educators, and communities concerning public school and district performance, improvement, and accountability. In 2012, as part of Oregon’s approved ESEA flexibility waiver, ODE redesigned the school and district report cards to better convey how schools are doing at ensuring students achieve college and career readiness. The purpose of the report card redesign was to (a) more accurately reflect student learning and growth, (b) incorporate key measures of college and career readiness, (c) align the report card with districts’ achievement compacts, and (d) make the Report Cards more user friendly and accessible. The report card redesign included a stakeholder and public engagement process to make design, content, and methodology recommendations. This included public outreach efforts (i.e., focus groups and several online surveys) and the creation of a Report Card (RC) Steering Committee consisting of 17 members representing a diverse assortment of stakeholders throughout Oregon. The RC Steering Committee met twice per month from September 2012 to March 2013. Staff from ODE attended each committee meeting in an advisory capacity. In addition to school and district data as required by Oregon’s ESEA flexibility waiver and other federal/state laws, the new school and district report cards include the recommendations from the RC Steering Committee (e.g., school principal/district superintendent letters, school/district demographic profiles, comparison school ratings, school performance data, student outcome data, and curriculum and learning environment data). The overall school rating is a critical feature of the school report card and is a requirement of Oregon’s ESEA flexibility waiver. The rating consists of five levels that indicate how schools perform as compared to all schools statewide on a combination of rating components (i.e., achievement, growth, subgroup growth, graduation, and subgroup graduation). The five school rating levels refer to the following:
Level 1 = schools that fall into the bottom 5% of schools.
Level 2 = schools that fall between 5% and 15% of schools.
Level 3 = schools that fall between approximately 15% and 44% of schools.
Level 4 = schools that fall between approximately 44% and 90% of schools.
Level 5 = schools that fall into the top approximately 10% of schools.
Number of Schools Receiving Each Overall Rating by Year
Overall Rating 2011-12 2012-13 2013-14
Level 1 57 60 61
Level 2 124 113 123
Level 3 355 356 395
Level 4 568 557 515
Level 5 128 114 110
Not Rated1 21 46 352
1Small schools and newly opened/reconfigured schools are not eligible to receive an overall rating. 2Many schools did not receive a rating because of the Smarter Balanced Field Test. See http://www.ode.state.or.us/search/page/?id=4136 for more information.
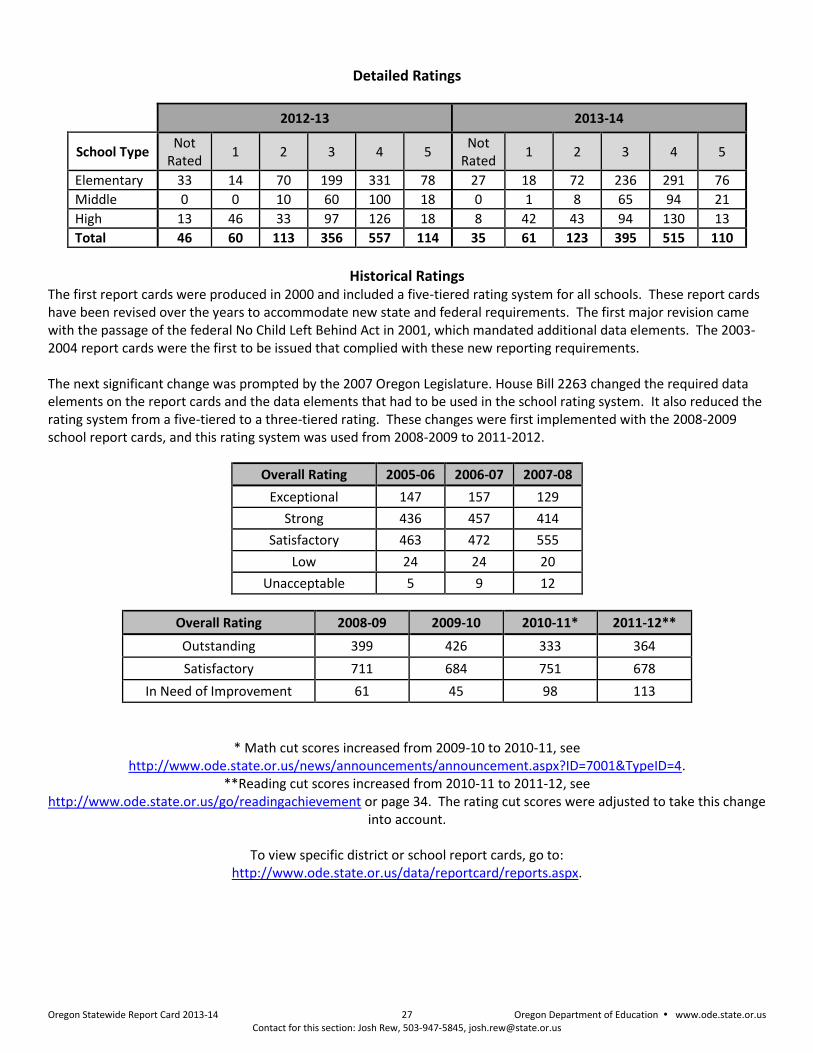
Oregon Statewide Report Card 2013-14 27 Oregon Department of Education www.ode.state.or.us Contact for this section: Josh Rew, 503-947-5845, [email protected]
Detailed Ratings
2012-13 2013-14
School Type Not
Rated 1 2 3 4 5
Not Rated
1 2 3 4 5
Elementary 33 14 70 199 331 78 27 18 72 236 291 76
Middle 0 0 10 60 100 18 0 1 8 65 94 21
High 13 46 33 97 126 18 8 42 43 94 130 13
Total 46 60 113 356 557 114 35 61 123 395 515 110
Historical Ratings The first report cards were produced in 2000 and included a five-tiered rating system for all schools. These report cards have been revised over the years to accommodate new state and federal requirements. The first major revision came with the passage of the federal No Child Left Behind Act in 2001, which mandated additional data elements. The 2003-2004 report cards were the first to be issued that complied with these new reporting requirements. The next significant change was prompted by the 2007 Oregon Legislature. House Bill 2263 changed the required data elements on the report cards and the data elements that had to be used in the school rating system. It also reduced the rating system from a five-tiered to a three-tiered rating. These changes were first implemented with the 2008-2009 school report cards, and this rating system was used from 2008-2009 to 2011-2012.
Overall Rating 2005-06 2006-07 2007-08
Exceptional 147 157 129
Strong 436 457 414
Satisfactory 463 472 555
Low 24 24 20
Unacceptable 5 9 12
Overall Rating 2008-09 2009-10 2010-11* 2011-12**
Outstanding 399 426 333 364
Satisfactory 711 684 751 678
In Need of Improvement 61 45 98 113
* Math cut scores increased from 2009-10 to 2010-11, see http://www.ode.state.or.us/news/announcements/announcement.aspx?ID=7001&TypeID=4.
**Reading cut scores increased from 2010-11 to 2011-12, see http://www.ode.state.or.us/go/readingachievement or page 34. The rating cut scores were adjusted to take this change
into account.
To view specific district or school report cards, go to: http://www.ode.state.or.us/data/reportcard/reports.aspx.
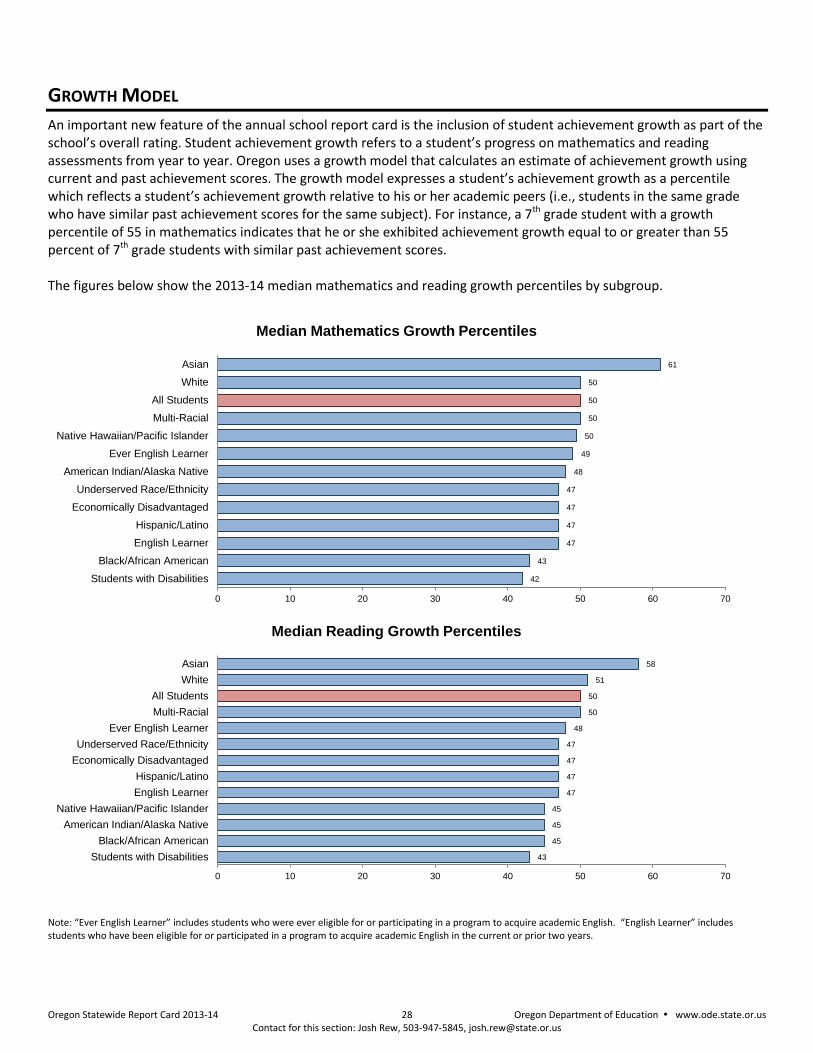
Oregon Statewide Report Card 2013-14 28 Oregon Department of Education www.ode.state.or.us Contact for this section: Josh Rew, 503-947-5845, [email protected]
GROWTH MODEL
An important new feature of the annual school report card is the inclusion of student achievement growth as part of the school’s overall rating. Student achievement growth refers to a student’s progress on mathematics and reading assessments from year to year. Oregon uses a growth model that calculates an estimate of achievement growth using current and past achievement scores. The growth model expresses a student’s achievement growth as a percentile which reflects a student’s achievement growth relative to his or her academic peers (i.e., students in the same grade who have similar past achievement scores for the same subject). For instance, a 7th grade student with a growth percentile of 55 in mathematics indicates that he or she exhibited achievement growth equal to or greater than 55 percent of 7th grade students with similar past achievement scores. The figures below show the 2013-14 median mathematics and reading growth percentiles by subgroup.
Note: “Ever English Learner” includes students who were ever eligible for or participating in a program to acquire academic English. “English Learner” includes students who have been eligible for or participated in a program to acquire academic English in the current or prior two years.
42
43
47
47
47
47
48
49
50
50
50
50
61
0 10 20 30 40 50 60 70
Students with Disabilities
Black/African American
English Learner
Hispanic/Latino
Economically Disadvantaged
Underserved Race/Ethnicity
American Indian/Alaska Native
Ever English Learner
Native Hawaiian/Pacific Islander
Multi-Racial
All Students
White
Asian
Median Mathematics Growth Percentiles
43
45
45
45
47
47
47
47
48
50
50
51
58
0 10 20 30 40 50 60 70
Students with Disabilities
Black/African American
American Indian/Alaska Native
Native Hawaiian/Pacific Islander
English Learner
Hispanic/Latino
Economically Disadvantaged
Underserved Race/Ethnicity
Ever English Learner
Multi-Racial
All Students
White
Asian
Median Reading Growth Percentiles
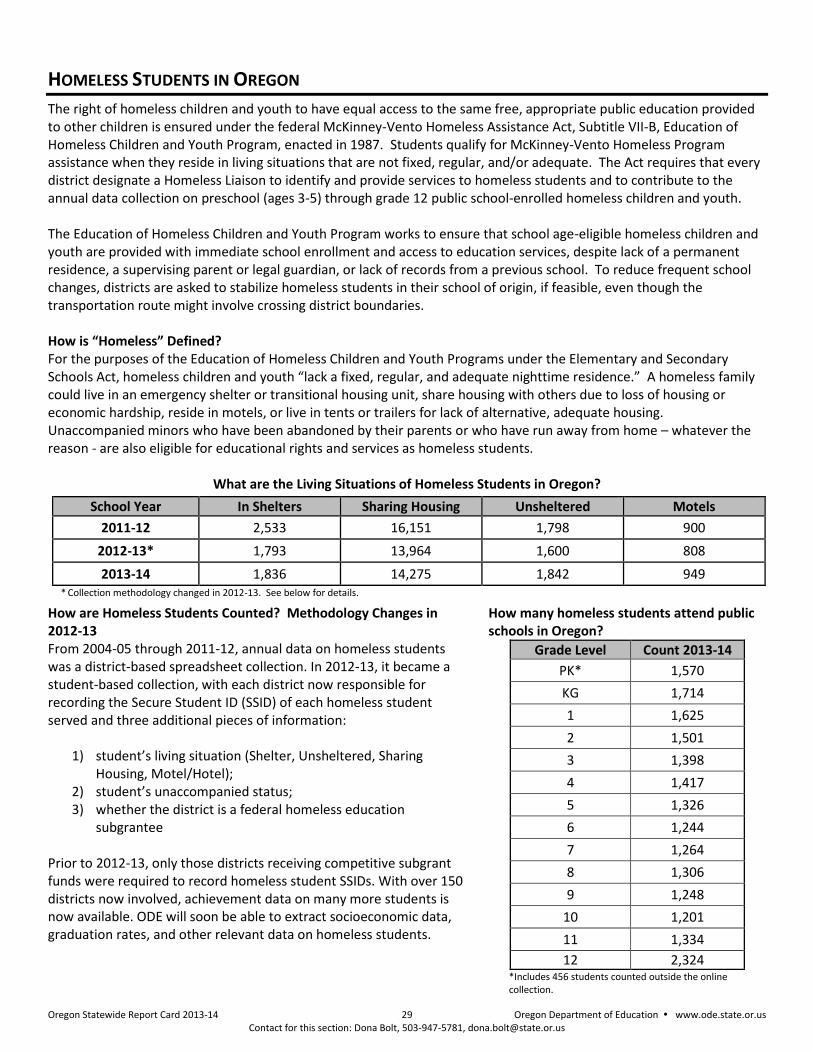
Oregon Statewide Report Card 2013-14 29 Oregon Department of Education www.ode.state.or.us Contact for this section: Dona Bolt, 503-947-5781, [email protected]
HOMELESS STUDENTS IN OREGON
The right of homeless children and youth to have equal access to the same free, appropriate public education provided to other children is ensured under the federal McKinney-Vento Homeless Assistance Act, Subtitle VII-B, Education of Homeless Children and Youth Program, enacted in 1987. Students qualify for McKinney-Vento Homeless Program assistance when they reside in living situations that are not fixed, regular, and/or adequate. The Act requires that every district designate a Homeless Liaison to identify and provide services to homeless students and to contribute to the annual data collection on preschool (ages 3-5) through grade 12 public school-enrolled homeless children and youth. The Education of Homeless Children and Youth Program works to ensure that school age-eligible homeless children and youth are provided with immediate school enrollment and access to education services, despite lack of a permanent residence, a supervising parent or legal guardian, or lack of records from a previous school. To reduce frequent school changes, districts are asked to stabilize homeless students in their school of origin, if feasible, even though the transportation route might involve crossing district boundaries. How is “Homeless” Defined? For the purposes of the Education of Homeless Children and Youth Programs under the Elementary and Secondary Schools Act, homeless children and youth “lack a fixed, regular, and adequate nighttime residence.” A homeless family could live in an emergency shelter or transitional housing unit, share housing with others due to loss of housing or economic hardship, reside in motels, or live in tents or trailers for lack of alternative, adequate housing. Unaccompanied minors who have been abandoned by their parents or who have run away from home – whatever the reason - are also eligible for educational rights and services as homeless students.
What are the Living Situations of Homeless Students in Oregon?
* Collection methodology changed in 2012-13. See below for details. How are Homeless Students Counted? Methodology Changes in 2012-13 From 2004-05 through 2011-12, annual data on homeless students was a district-based spreadsheet collection. In 2012-13, it became a student-based collection, with each district now responsible for recording the Secure Student ID (SSID) of each homeless student served and three additional pieces of information:
1) student’s living situation (Shelter, Unsheltered, Sharing Housing, Motel/Hotel);
2) student’s unaccompanied status; 3) whether the district is a federal homeless education
subgrantee Prior to 2012-13, only those districts receiving competitive subgrant funds were required to record homeless student SSIDs. With over 150 districts now involved, achievement data on many more students is now available. ODE will soon be able to extract socioeconomic data, graduation rates, and other relevant data on homeless students.
How many homeless students attend public schools in Oregon?
Grade Level Count 2013-14
PK* 1,570
KG 1,714
1 1,625
2 1,501
3 1,398
4 1,417
5 1,326
6 1,244
7 1,264
8 1,306
9 1,248
10 1,201
11 1,334
12 2,324 *Includes 456 students counted outside the online collection.
School Year In Shelters Sharing Housing Unsheltered Motels
2011-12 2,533 16,151 1,798 900
2012-13* 1,793 13,964 1,600 808
2013-14 1,836 14,275 1,842 949
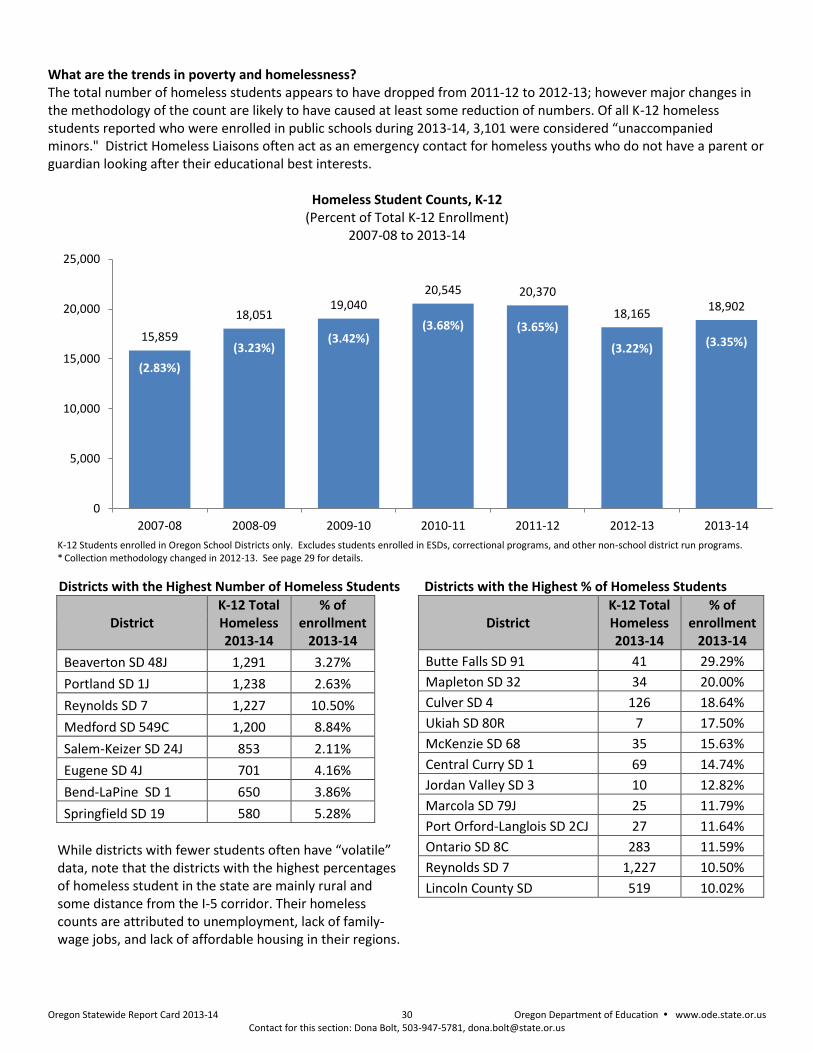
Oregon Statewide Report Card 2013-14 30 Oregon Department of Education www.ode.state.or.us Contact for this section: Dona Bolt, 503-947-5781, [email protected]
What are the trends in poverty and homelessness? The total number of homeless students appears to have dropped from 2011-12 to 2012-13; however major changes in the methodology of the count are likely to have caused at least some reduction of numbers. Of all K-12 homeless students reported who were enrolled in public schools during 2013-14, 3,101 were considered “unaccompanied minors." District Homeless Liaisons often act as an emergency contact for homeless youths who do not have a parent or guardian looking after their educational best interests.
Homeless Student Counts, K-12 (Percent of Total K-12 Enrollment)
2007-08 to 2013-14
K-12 Students enrolled in Oregon School Districts only. Excludes students enrolled in ESDs, correctional programs, and other non-school district run programs. * Collection methodology changed in 2012-13. See page 29 for details.
Districts with the Highest Number of Homeless Students
District K-12 Total Homeless 2013-14
% of enrollment
2013-14
Beaverton SD 48J 1,291 3.27%
Portland SD 1J 1,238 2.63%
Reynolds SD 7 1,227 10.50%
Medford SD 549C 1,200 8.84%
Salem-Keizer SD 24J 853 2.11%
Eugene SD 4J 701 4.16%
Bend-LaPine SD 1 650 3.86%
Springfield SD 19 580 5.28%
While districts with fewer students often have “volatile” data, note that the districts with the highest percentages of homeless student in the state are mainly rural and some distance from the I-5 corridor. Their homeless counts are attributed to unemployment, lack of family-wage jobs, and lack of affordable housing in their regions.
Districts with the Highest % of Homeless Students
District K-12 Total Homeless 2013-14
% of enrollment
2013-14
Butte Falls SD 91 41 29.29%
Mapleton SD 32 34 20.00%
Culver SD 4 126 18.64%
Ukiah SD 80R 7 17.50%
McKenzie SD 68 35 15.63%
Central Curry SD 1 69 14.74%
Jordan Valley SD 3 10 12.82%
Marcola SD 79J 25 11.79%
Port Orford-Langlois SD 2CJ 27 11.64%
Ontario SD 8C 283 11.59%
Reynolds SD 7 1,227 10.50%
Lincoln County SD 519 10.02%
15,859
18,051 19,040
20,545 20,370
18,165 18,902
(2.83%)
(3.23%) (3.42%)
(3.68%) (3.65%)
(3.22%) (3.35%)
0
5,000
10,000
15,000
20,000
25,000
2007-08 2008-09 2009-10 2010-11 2011-12 2012-13 2013-14
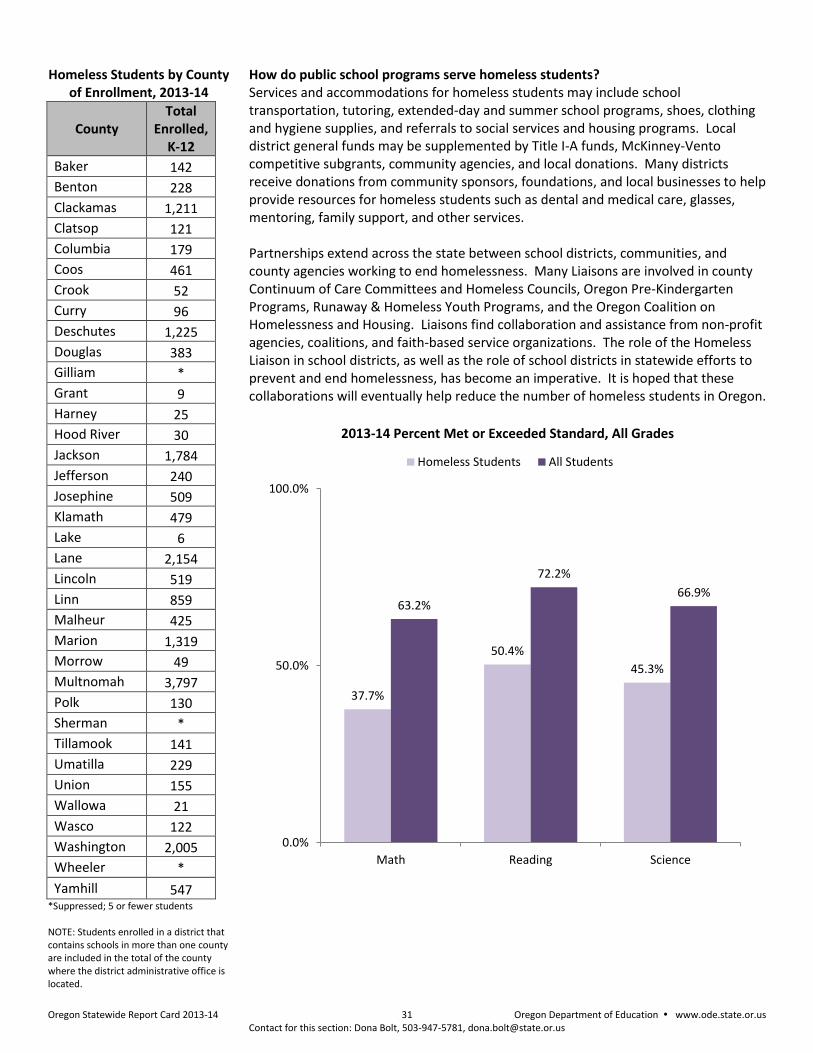
Oregon Statewide Report Card 2013-14 31 Oregon Department of Education www.ode.state.or.us Contact for this section: Dona Bolt, 503-947-5781, [email protected]
Homeless Students by County of Enrollment, 2013-14
County Total
Enrolled, K-12
Baker 142
Benton 228
Clackamas 1,211
Clatsop 121
Columbia 179
Coos 461
Crook 52
Curry 96
Deschutes 1,225
Douglas 383
Gilliam *
Grant 9
Harney 25
Hood River 30
Jackson 1,784
Jefferson 240
Josephine 509
Klamath 479
Lake 6
Lane 2,154
Lincoln 519
Linn 859
Malheur 425
Marion 1,319
Morrow 49
Multnomah 3,797
Polk 130
Sherman *
Tillamook 141
Umatilla 229
Union 155
Wallowa 21
Wasco 122
Washington 2,005
Wheeler *
Yamhill 547 *Suppressed; 5 or fewer students NOTE: Students enrolled in a district that contains schools in more than one county are included in the total of the county where the district administrative office is located.
How do public school programs serve homeless students? Services and accommodations for homeless students may include school transportation, tutoring, extended-day and summer school programs, shoes, clothing and hygiene supplies, and referrals to social services and housing programs. Local district general funds may be supplemented by Title I-A funds, McKinney-Vento competitive subgrants, community agencies, and local donations. Many districts receive donations from community sponsors, foundations, and local businesses to help provide resources for homeless students such as dental and medical care, glasses, mentoring, family support, and other services. Partnerships extend across the state between school districts, communities, and county agencies working to end homelessness. Many Liaisons are involved in county Continuum of Care Committees and Homeless Councils, Oregon Pre-Kindergarten Programs, Runaway & Homeless Youth Programs, and the Oregon Coalition on Homelessness and Housing. Liaisons find collaboration and assistance from non-profit agencies, coalitions, and faith-based service organizations. The role of the Homeless Liaison in school districts, as well as the role of school districts in statewide efforts to prevent and end homelessness, has become an imperative. It is hoped that these collaborations will eventually help reduce the number of homeless students in Oregon.
2013-14 Percent Met or Exceeded Standard, All Grades
37.7%
50.4%
45.3%
63.2%
72.2%
66.9%
0.0%
50.0%
100.0%
Math Reading Science
Homeless Students All Students
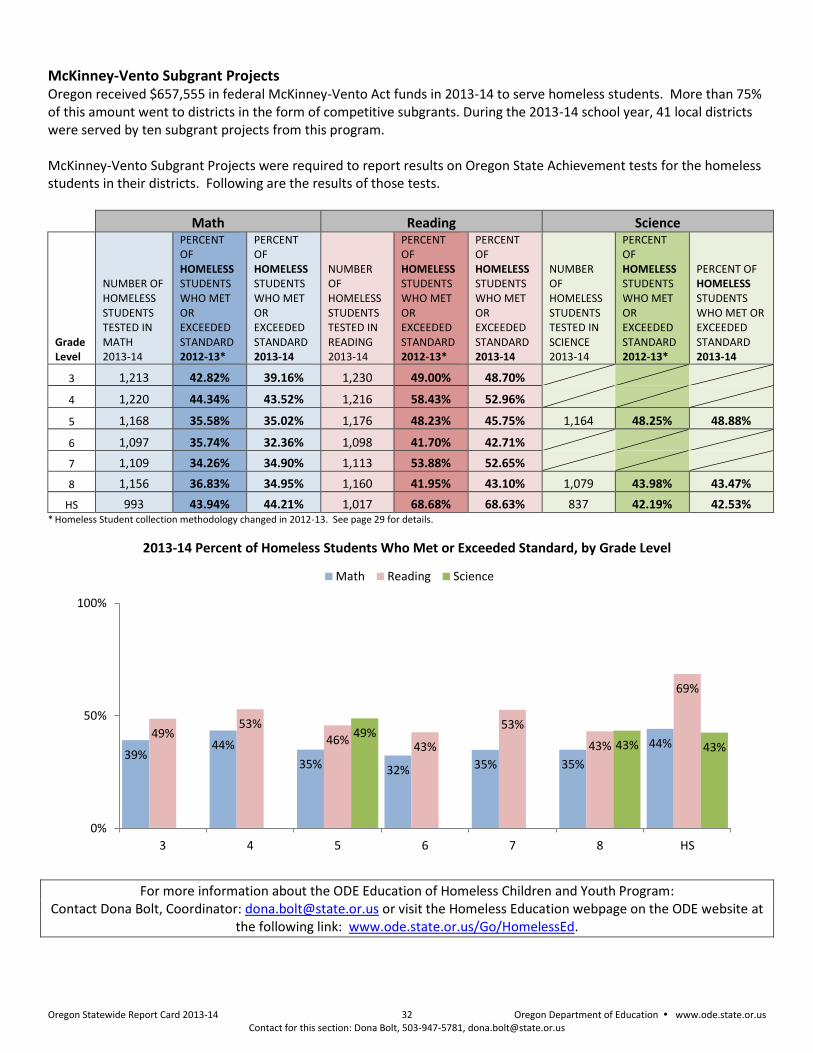
Oregon Statewide Report Card 2013-14 32 Oregon Department of Education www.ode.state.or.us Contact for this section: Dona Bolt, 503-947-5781, [email protected]
McKinney-Vento Subgrant Projects Oregon received $657,555 in federal McKinney-Vento Act funds in 2013-14 to serve homeless students. More than 75% of this amount went to districts in the form of competitive subgrants. During the 2013-14 school year, 41 local districts were served by ten subgrant projects from this program. McKinney-Vento Subgrant Projects were required to report results on Oregon State Achievement tests for the homeless students in their districts. Following are the results of those tests.
Math Reading Science
Grade Level
NUMBER OF HOMELESS STUDENTS TESTED IN MATH 2013-14
PERCENT OF HOMELESS STUDENTS WHO MET OR EXCEEDED STANDARD 2012-13*
PERCENT OF HOMELESS STUDENTS WHO MET OR EXCEEDED STANDARD 2013-14
NUMBER OF HOMELESS STUDENTS TESTED IN READING 2013-14
PERCENT OF HOMELESS STUDENTS WHO MET OR EXCEEDED STANDARD 2012-13*
PERCENT OF HOMELESS STUDENTS WHO MET OR EXCEEDED STANDARD 2013-14
NUMBER OF HOMELESS STUDENTS TESTED IN SCIENCE 2013-14
PERCENT OF HOMELESS STUDENTS WHO MET OR EXCEEDED STANDARD 2012-13*
PERCENT OF HOMELESS STUDENTS WHO MET OR EXCEEDED STANDARD 2013-14
3 1,213 42.82% 39.16% 1,230 49.00% 48.70%
4 1,220 44.34% 43.52% 1,216 58.43% 52.96%
5 1,168 35.58% 35.02% 1,176 48.23% 45.75% 1,164 48.25% 48.88%
6 1,097 35.74% 32.36% 1,098 41.70% 42.71%
7 1,109 34.26% 34.90% 1,113 53.88% 52.65%
8 1,156 36.83% 34.95% 1,160 41.95% 43.10% 1,079 43.98% 43.47%
HS 993 43.94% 44.21% 1,017 68.68% 68.63% 837 42.19% 42.53% * Homeless Student collection methodology changed in 2012-13. See page 29 for details.
2013-14 Percent of Homeless Students Who Met or Exceeded Standard, by Grade Level
For more information about the ODE Education of Homeless Children and Youth Program: Contact Dona Bolt, Coordinator: [email protected] or visit the Homeless Education webpage on the ODE website at
the following link: www.ode.state.or.us/Go/HomelessEd.
39% 44%
35% 32% 35% 35%
44% 49%
53% 46%
43%
53%
43%
69%
49% 43% 43%
0%
50%
100%
3 4 5 6 7 8 HS
Math Reading Science
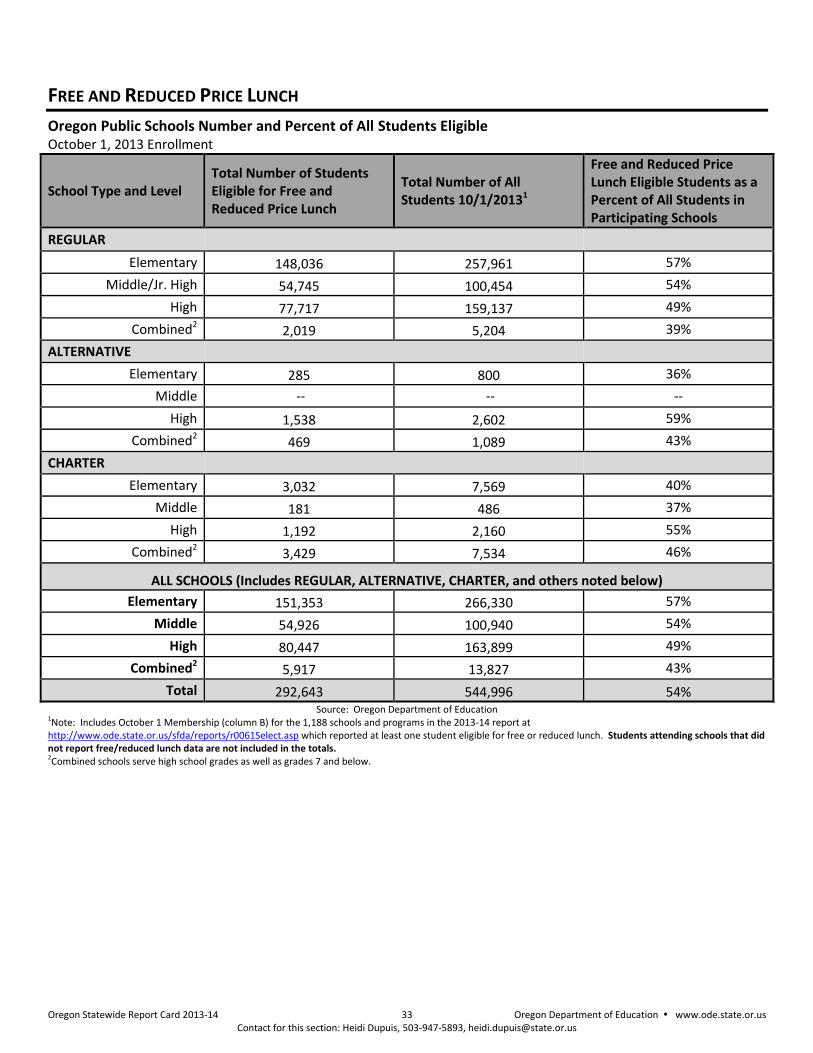
Oregon Statewide Report Card 2013-14 33 Oregon Department of Education www.ode.state.or.us Contact for this section: Heidi Dupuis, 503-947-5893, [email protected]
FREE AND REDUCED PRICE LUNCH
Oregon Public Schools Number and Percent of All Students Eligible October 1, 2013 Enrollment
School Type and Level Total Number of Students Eligible for Free and Reduced Price Lunch
Total Number of All Students 10/1/20131
Free and Reduced Price Lunch Eligible Students as a Percent of All Students in Participating Schools
REGULAR
Elementary 148,036 257,961 57%
Middle/Jr. High 54,745 100,454 54%
High 77,717 159,137 49%
Combined2 2,019 5,204 39%
ALTERNATIVE
Elementary 285 800 36%
Middle -- -- --
High 1,538 2,602 59%
Combined2 469 1,089 43%
CHARTER
Elementary 3,032 7,569 40%
Middle 181 486 37%
High 1,192 2,160 55%
Combined2 3,429 7,534 46%
ALL SCHOOLS (Includes REGULAR, ALTERNATIVE, CHARTER, and others noted below)
Elementary 151,353 266,330 57%
Middle 54,926 100,940 54%
High 80,447 163,899 49%
Combined2 5,917 13,827 43%
Total 292,643 544,996 54% Source: Oregon Department of Education
1Note: Includes October 1 Membership (column B) for the 1,188 schools and programs in the 2013-14 report at http://www.ode.state.or.us/sfda/reports/r0061Select.asp which reported at least one student eligible for free or reduced lunch. Students attending schools that did not report free/reduced lunch data are not included in the totals. 2Combined schools serve high school grades as well as grades 7 and below.
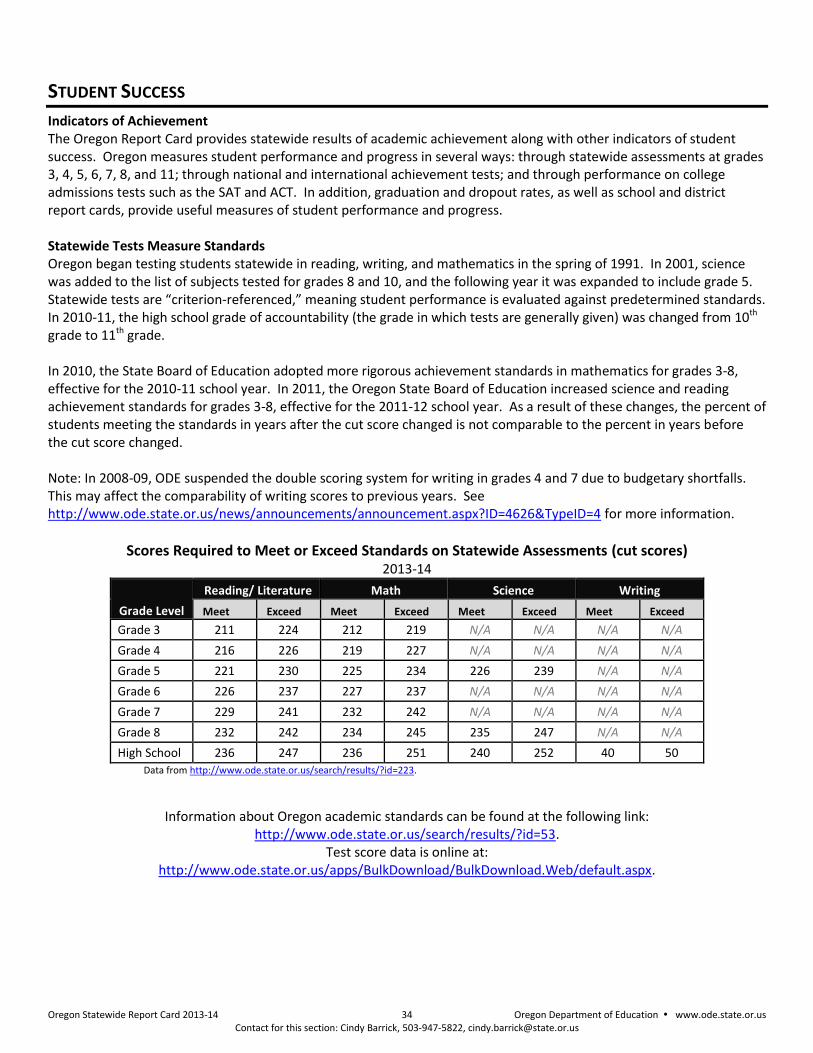
Oregon Statewide Report Card 2013-14 34 Oregon Department of Education www.ode.state.or.us Contact for this section: Cindy Barrick, 503-947-5822, [email protected]
STUDENT SUCCESS
Indicators of Achievement The Oregon Report Card provides statewide results of academic achievement along with other indicators of student success. Oregon measures student performance and progress in several ways: through statewide assessments at grades 3, 4, 5, 6, 7, 8, and 11; through national and international achievement tests; and through performance on college admissions tests such as the SAT and ACT. In addition, graduation and dropout rates, as well as school and district report cards, provide useful measures of student performance and progress. Statewide Tests Measure Standards Oregon began testing students statewide in reading, writing, and mathematics in the spring of 1991. In 2001, science was added to the list of subjects tested for grades 8 and 10, and the following year it was expanded to include grade 5. Statewide tests are “criterion-referenced,” meaning student performance is evaluated against predetermined standards. In 2010-11, the high school grade of accountability (the grade in which tests are generally given) was changed from 10th grade to 11th grade. In 2010, the State Board of Education adopted more rigorous achievement standards in mathematics for grades 3-8, effective for the 2010-11 school year. In 2011, the Oregon State Board of Education increased science and reading achievement standards for grades 3-8, effective for the 2011-12 school year. As a result of these changes, the percent of students meeting the standards in years after the cut score changed is not comparable to the percent in years before the cut score changed. Note: In 2008-09, ODE suspended the double scoring system for writing in grades 4 and 7 due to budgetary shortfalls. This may affect the comparability of writing scores to previous years. See http://www.ode.state.or.us/news/announcements/announcement.aspx?ID=4626&TypeID=4 for more information.
Scores Required to Meet or Exceed Standards on Statewide Assessments (cut scores) 2013-14
Grade Level
Reading/ Literature Math Science Writing
Meet Exceed Meet Exceed Meet Exceed Meet Exceed
Grade 3 211 224 212 219 N/A N/A N/A N/A
Grade 4 216 226 219 227 N/A N/A N/A N/A
Grade 5 221 230 225 234 226 239 N/A N/A
Grade 6 226 237 227 237 N/A N/A N/A N/A
Grade 7 229 241 232 242 N/A N/A N/A N/A
Grade 8 232 242 234 245 235 247 N/A N/A
High School 236 247 236 251 240 252 40 50
Data from http://www.ode.state.or.us/search/results/?id=223.
Information about Oregon academic standards can be found at the following link:
http://www.ode.state.or.us/search/results/?id=53. Test score data is online at:
http://www.ode.state.or.us/apps/BulkDownload/BulkDownload.Web/default.aspx.
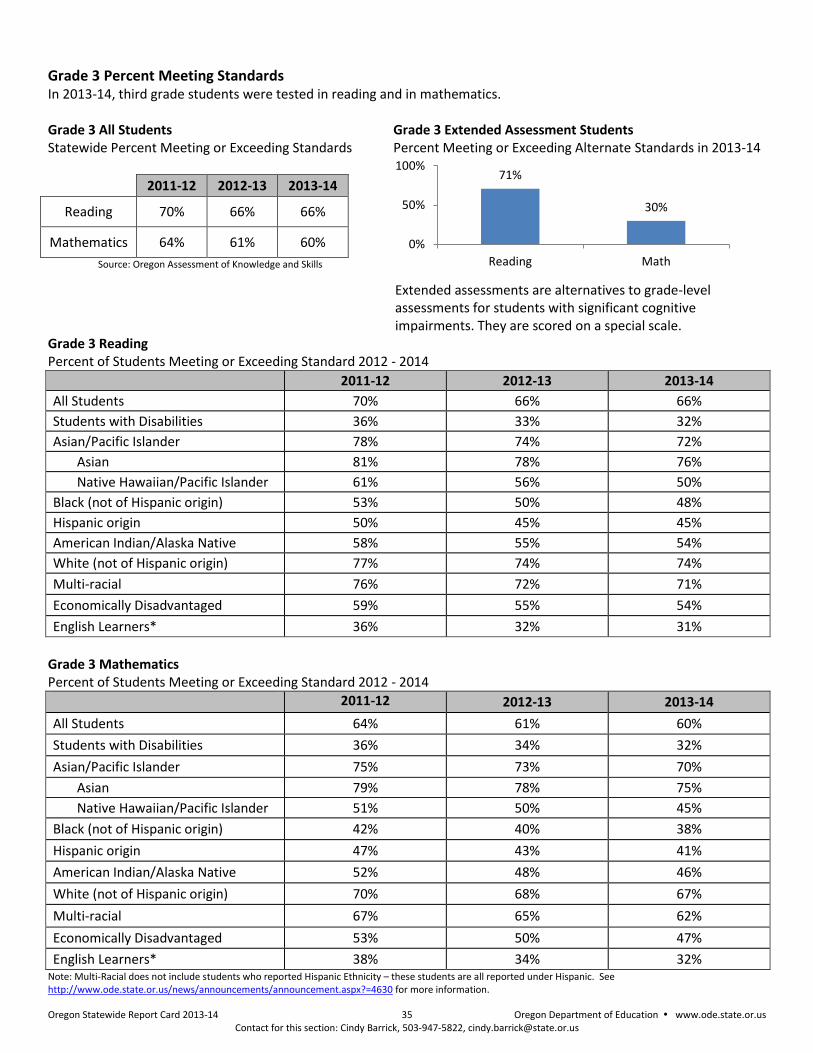
Oregon Statewide Report Card 2013-14 35 Oregon Department of Education www.ode.state.or.us Contact for this section: Cindy Barrick, 503-947-5822, [email protected]
Grade 3 Percent Meeting Standards In 2013-14, third grade students were tested in reading and in mathematics. Grade 3 All Students Statewide Percent Meeting or Exceeding Standards
2011-12 2012-13 2013-14
Reading 70% 66% 66%
Mathematics 64% 61% 60%
Source: Oregon Assessment of Knowledge and Skills
Grade 3 Extended Assessment Students Percent Meeting or Exceeding Alternate Standards in 2013-14
Extended assessments are alternatives to grade-level assessments for students with significant cognitive impairments. They are scored on a special scale.
Grade 3 Reading Percent of Students Meeting or Exceeding Standard 2012 - 2014
2011-12 2012-13 2013-14
All Students 70% 66% 66%
Students with Disabilities 36% 33% 32%
Asian/Pacific Islander 78% 74% 72%
Asian 81% 78% 76%
Native Hawaiian/Pacific Islander 61% 56% 50%
Black (not of Hispanic origin) 53% 50% 48%
Hispanic origin 50% 45% 45%
American Indian/Alaska Native 58% 55% 54%
White (not of Hispanic origin) 77% 74% 74%
Multi-racial 76% 72% 71%
Economically Disadvantaged 59% 55% 54%
English Learners* 36% 32% 31%
Grade 3 Mathematics Percent of Students Meeting or Exceeding Standard 2012 - 2014
2011-12 2012-13 2013-14
All Students 64% 61% 60%
Students with Disabilities 36% 34% 32%
Asian/Pacific Islander 75% 73% 70%
Asian 79% 78% 75%
Native Hawaiian/Pacific Islander 51% 50% 45%
Black (not of Hispanic origin) 42% 40% 38%
Hispanic origin 47% 43% 41%
American Indian/Alaska Native 52% 48% 46%
White (not of Hispanic origin) 70% 68% 67%
Multi-racial 67% 65% 62%
Economically Disadvantaged 53% 50% 47%
English Learners* 38% 34% 32% Note: Multi-Racial does not include students who reported Hispanic Ethnicity – these students are all reported under Hispanic. See http://www.ode.state.or.us/news/announcements/announcement.aspx?=4630 for more information.
71%
30%
0%
50%
100%
Reading Math
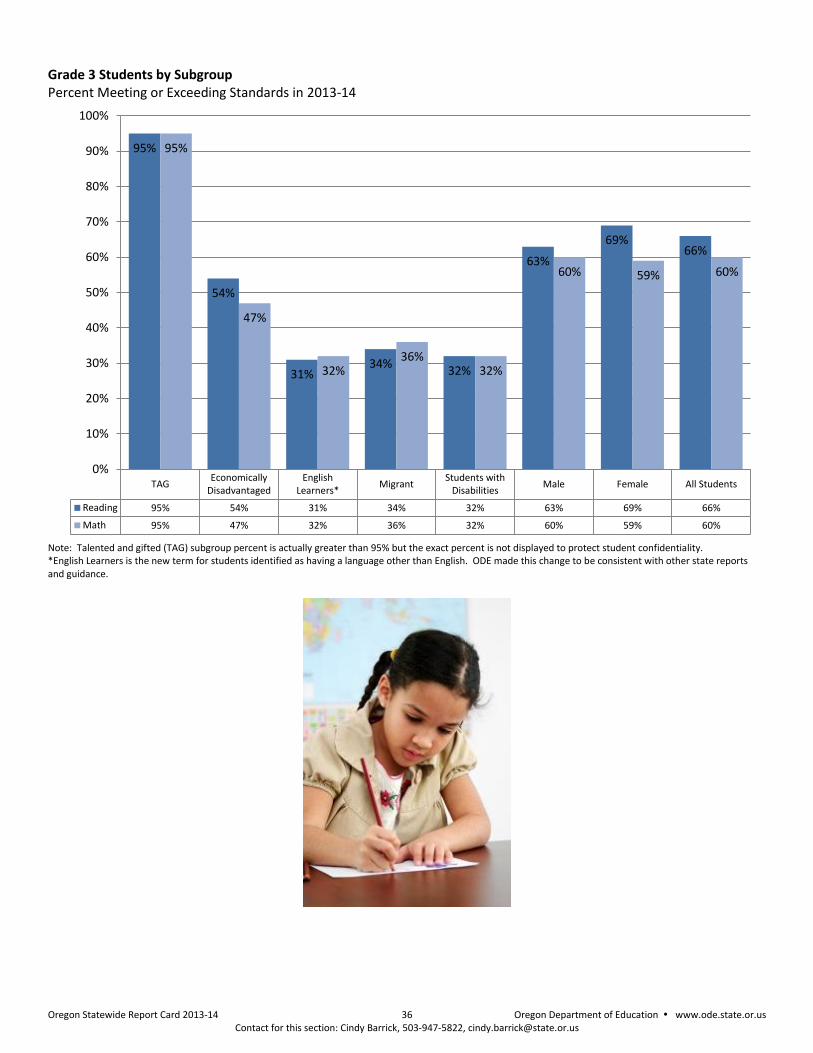
Oregon Statewide Report Card 2013-14 36 Oregon Department of Education www.ode.state.or.us Contact for this section: Cindy Barrick, 503-947-5822, [email protected]
Grade 3 Students by Subgroup Percent Meeting or Exceeding Standards in 2013-14
Note: Talented and gifted (TAG) subgroup percent is actually greater than 95% but the exact percent is not displayed to protect student confidentiality. *English Learners is the new term for students identified as having a language other than English. ODE made this change to be consistent with other state reports and guidance.
TAGEconomically
DisadvantagedEnglish
Learners*Migrant
Students withDisabilities
Male Female All Students
Reading 95% 54% 31% 34% 32% 63% 69% 66%
Math 95% 47% 32% 36% 32% 60% 59% 60%
95%
54%
31% 34%
32%
63%
69% 66%
95%
47%
32% 36%
32%
60% 59% 60%
0%
10%
20%
30%
40%
50%
60%
70%
80%
90%
100%
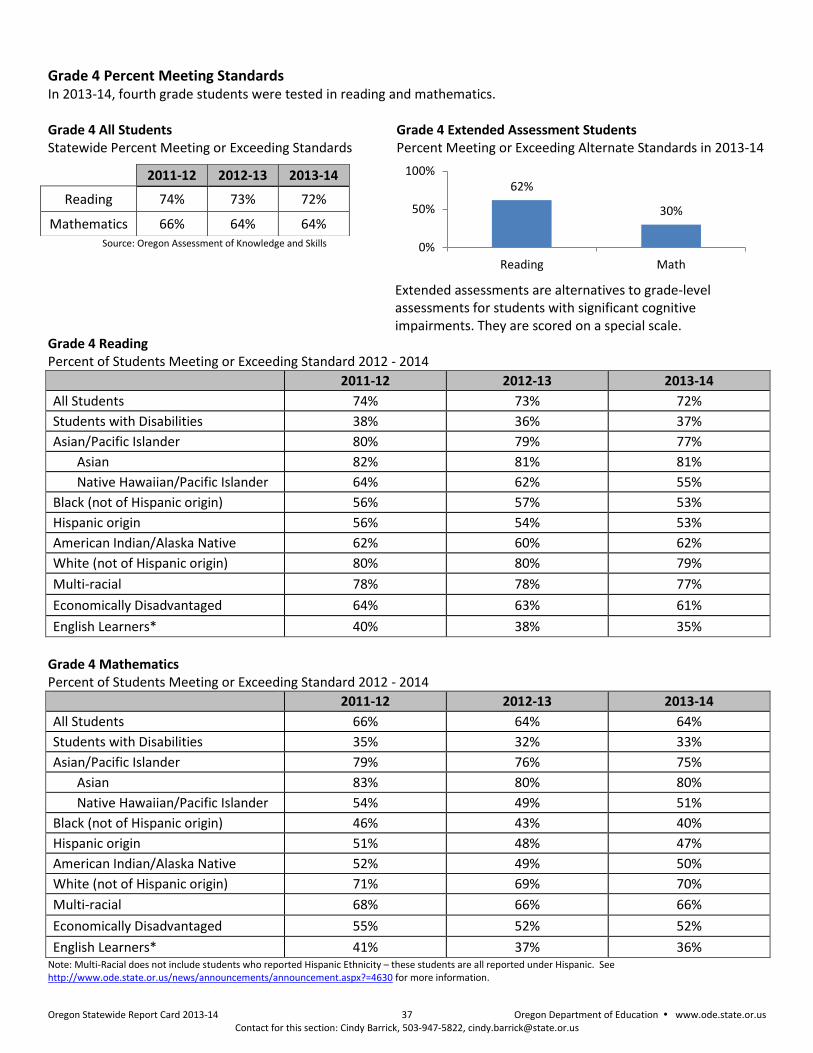
Oregon Statewide Report Card 2013-14 37 Oregon Department of Education www.ode.state.or.us Contact for this section: Cindy Barrick, 503-947-5822, [email protected]
Grade 4 Percent Meeting Standards In 2013-14, fourth grade students were tested in reading and mathematics. Grade 4 All Students Statewide Percent Meeting or Exceeding Standards
Source: Oregon Assessment of Knowledge and Skills
Grade 4 Extended Assessment Students
Percent Meeting or Exceeding Alternate Standards in 2013-14
Extended assessments are alternatives to grade-level assessments for students with significant cognitive impairments. They are scored on a special scale.
Grade 4 Reading Percent of Students Meeting or Exceeding Standard 2012 - 2014
2011-12 2012-13 2013-14
All Students 74% 73% 72%
Students with Disabilities 38% 36% 37%
Asian/Pacific Islander 80% 79% 77%
Asian 82% 81% 81%
Native Hawaiian/Pacific Islander 64% 62% 55%
Black (not of Hispanic origin) 56% 57% 53%
Hispanic origin 56% 54% 53%
American Indian/Alaska Native 62% 60% 62%
White (not of Hispanic origin) 80% 80% 79%
Multi-racial 78% 78% 77%
Economically Disadvantaged 64% 63% 61%
English Learners* 40% 38% 35%
Grade 4 Mathematics Percent of Students Meeting or Exceeding Standard 2012 - 2014
2011-12 2012-13 2013-14
All Students 66% 64% 64%
Students with Disabilities 35% 32% 33%
Asian/Pacific Islander 79% 76% 75%
Asian 83% 80% 80%
Native Hawaiian/Pacific Islander 54% 49% 51%
Black (not of Hispanic origin) 46% 43% 40%
Hispanic origin 51% 48% 47%
American Indian/Alaska Native 52% 49% 50%
White (not of Hispanic origin) 71% 69% 70%
Multi-racial 68% 66% 66%
Economically Disadvantaged 55% 52% 52%
English Learners* 41% 37% 36% Note: Multi-Racial does not include students who reported Hispanic Ethnicity – these students are all reported under Hispanic. See http://www.ode.state.or.us/news/announcements/announcement.aspx?=4630 for more information.
62%
30%
0%
50%
100%
Reading Math
2011-12 2012-13 2013-14
Reading 74% 73% 72%
Mathematics 66% 64% 64%
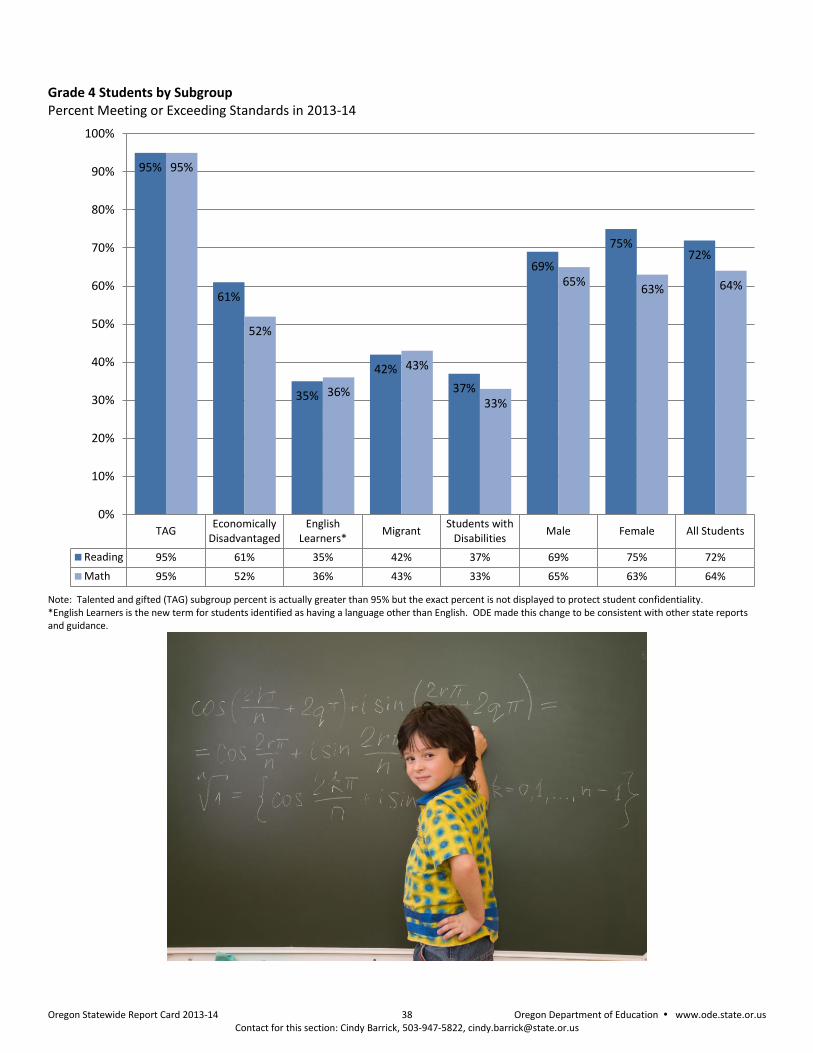
Oregon Statewide Report Card 2013-14 38 Oregon Department of Education www.ode.state.or.us Contact for this section: Cindy Barrick, 503-947-5822, [email protected]
Grade 4 Students by Subgroup Percent Meeting or Exceeding Standards in 2013-14
Note: Talented and gifted (TAG) subgroup percent is actually greater than 95% but the exact percent is not displayed to protect student confidentiality. *English Learners is the new term for students identified as having a language other than English. ODE made this change to be consistent with other state reports and guidance.
TAGEconomically
DisadvantagedEnglish
Learners*Migrant
Students withDisabilities
Male Female All Students
Reading 95% 61% 35% 42% 37% 69% 75% 72%
Math 95% 52% 36% 43% 33% 65% 63% 64%
95%
61%
35%
42%
37%
69%
75% 72%
95%
52%
36%
43%
33%
65% 63% 64%
0%
10%
20%
30%
40%
50%
60%
70%
80%
90%
100%
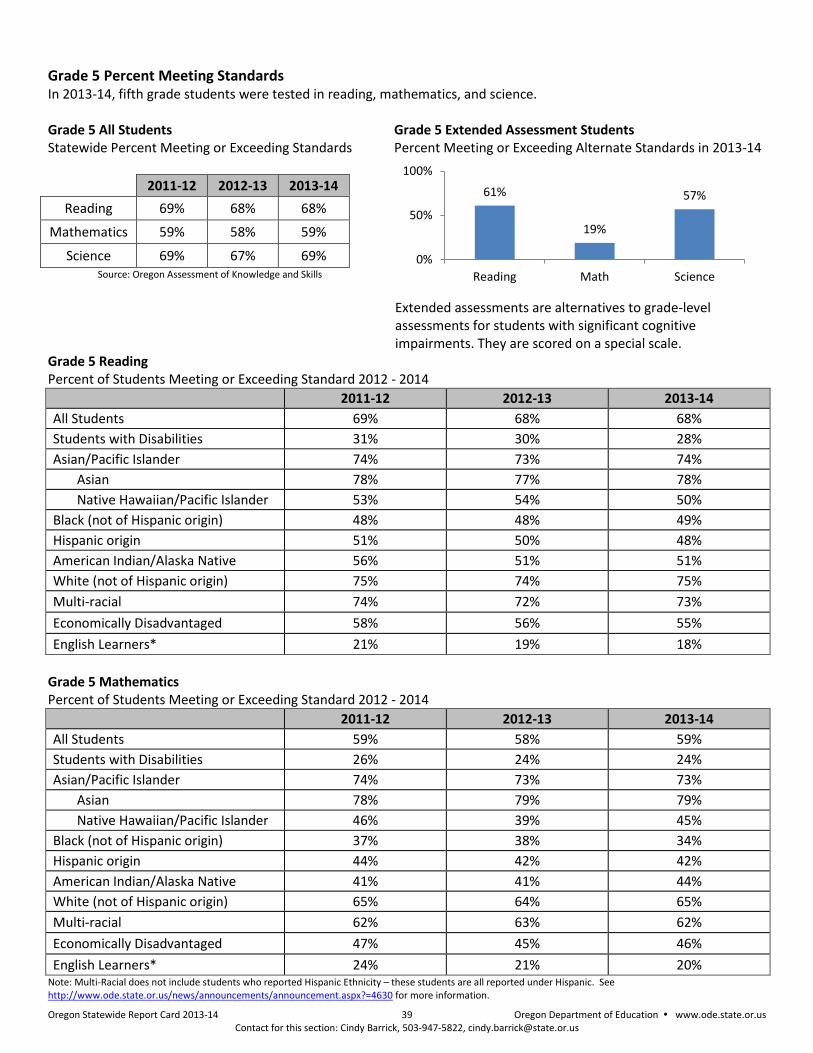
Oregon Statewide Report Card 2013-14 39 Oregon Department of Education www.ode.state.or.us Contact for this section: Cindy Barrick, 503-947-5822, [email protected]
Grade 5 Percent Meeting Standards In 2013-14, fifth grade students were tested in reading, mathematics, and science. Grade 5 All Students Statewide Percent Meeting or Exceeding Standards
2011-12 2012-13 2013-14
Reading 69% 68% 68%
Mathematics 59% 58% 59%
Science 69% 67% 69% Source: Oregon Assessment of Knowledge and Skills
Grade 5 Extended Assessment Students Percent Meeting or Exceeding Alternate Standards in 2013-14
Extended assessments are alternatives to grade-level assessments for students with significant cognitive impairments. They are scored on a special scale.
Grade 5 Reading Percent of Students Meeting or Exceeding Standard 2012 - 2014
2011-12 2012-13 2013-14
All Students 69% 68% 68%
Students with Disabilities 31% 30% 28%
Asian/Pacific Islander 74% 73% 74%
Asian 78% 77% 78%
Native Hawaiian/Pacific Islander 53% 54% 50%
Black (not of Hispanic origin) 48% 48% 49%
Hispanic origin 51% 50% 48%
American Indian/Alaska Native 56% 51% 51%
White (not of Hispanic origin) 75% 74% 75%
Multi-racial 74% 72% 73%
Economically Disadvantaged 58% 56% 55%
English Learners* 21% 19% 18%
Grade 5 Mathematics Percent of Students Meeting or Exceeding Standard 2012 - 2014
2011-12 2012-13 2013-14
All Students 59% 58% 59%
Students with Disabilities 26% 24% 24%
Asian/Pacific Islander 74% 73% 73%
Asian 78% 79% 79%
Native Hawaiian/Pacific Islander 46% 39% 45%
Black (not of Hispanic origin) 37% 38% 34%
Hispanic origin 44% 42% 42%
American Indian/Alaska Native 41% 41% 44%
White (not of Hispanic origin) 65% 64% 65%
Multi-racial 62% 63% 62%
Economically Disadvantaged 47% 45% 46%
English Learners* 24% 21% 20% Note: Multi-Racial does not include students who reported Hispanic Ethnicity – these students are all reported under Hispanic. See http://www.ode.state.or.us/news/announcements/announcement.aspx?=4630 for more information.
61%
19%
57%
0%
50%
100%
Reading Math Science
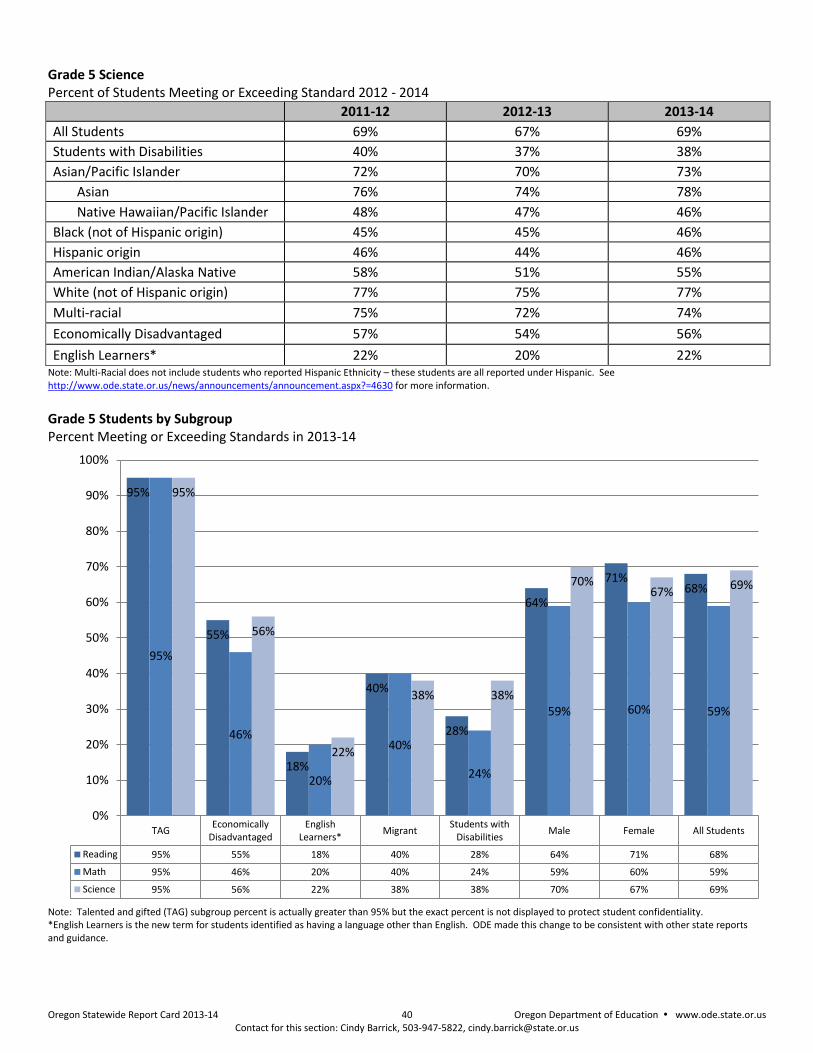
Oregon Statewide Report Card 2013-14 40 Oregon Department of Education www.ode.state.or.us Contact for this section: Cindy Barrick, 503-947-5822, [email protected]
Grade 5 Science Percent of Students Meeting or Exceeding Standard 2012 - 2014
2011-12 2012-13 2013-14
All Students 69% 67% 69%
Students with Disabilities 40% 37% 38%
Asian/Pacific Islander 72% 70% 73%
Asian 76% 74% 78%
Native Hawaiian/Pacific Islander 48% 47% 46%
Black (not of Hispanic origin) 45% 45% 46%
Hispanic origin 46% 44% 46%
American Indian/Alaska Native 58% 51% 55%
White (not of Hispanic origin) 77% 75% 77%
Multi-racial 75% 72% 74%
Economically Disadvantaged 57% 54% 56%
English Learners* 22% 20% 22% Note: Multi-Racial does not include students who reported Hispanic Ethnicity – these students are all reported under Hispanic. See http://www.ode.state.or.us/news/announcements/announcement.aspx?=4630 for more information.
Grade 5 Students by Subgroup Percent Meeting or Exceeding Standards in 2013-14
Note: Talented and gifted (TAG) subgroup percent is actually greater than 95% but the exact percent is not displayed to protect student confidentiality. *English Learners is the new term for students identified as having a language other than English. ODE made this change to be consistent with other state reports and guidance.
TAGEconomically
DisadvantagedEnglish
Learners*Migrant
Students withDisabilities
Male Female All Students
Reading 95% 55% 18% 40% 28% 64% 71% 68%
Math 95% 46% 20% 40% 24% 59% 60% 59%
Science 95% 56% 22% 38% 38% 70% 67% 69%
95%
55%
18%
40%
28%
64%
71% 68%
95%
46%
20%
40%
24%
59% 60% 59%
95%
56%
22%
38% 38%
70% 67%
69%
0%
10%
20%
30%
40%
50%
60%
70%
80%
90%
100%

Oregon Statewide Report Card 2013-14 41 Oregon Department of Education www.ode.state.or.us Contact for this section: Cindy Barrick, 503-947-5822, [email protected]
Grade 6 Percent Meeting Standards In 2013-14, sixth grade students were tested in reading and mathematics. Grade 6 All Students Statewide Percent Meeting or Exceeding Standards
2011-12 2012-13 2013-14
Reading 65% 63% 65%
Mathematics 59% 59% 59% Source: Oregon Assessment of Knowledge and Skills
Grade 6 Extended Assessment Students Percent Meeting or Exceeding Alternate Standards in 2013-14
Extended assessments are alternatives to grade-level assessments for students with significant cognitive impairments. They are scored on a special scale.
Grade 6 Reading Percent of Students Meeting or Exceeding Standard 2012 - 2014
2011-12 2012-13 2013-14
All Students 65% 63% 65%
Students with Disabilities 24% 23% 23%
Asian/Pacific Islander 72% 70% 71%
Asian 75% 74% 75%
Native Hawaiian/Pacific Islander 50% 47% 50%
Black (not of Hispanic origin) 42% 42% 46%
Hispanic origin 45% 44% 46%
American Indian/Alaska Native 49% 51% 48%
White (not of Hispanic origin) 71% 70% 72%
Multi-racial 70% 66% 68%
Economically Disadvantaged 52% 51% 51%
English Learners* 9% 8% 9%
Grade 6 Mathematics Percent of Students Meeting or Exceeding Standard 2012 - 2014
2011-12 2012-13 2013-14
All Students 59% 59% 59%
Students with Disabilities 22% 21% 19%
Asian/Pacific Islander 75% 76% 75%
Asian 79% 80% 80%
Native Hawaiian/Pacific Islander 51% 51% 47%
Black (not of Hispanic origin) 37% 36% 37%
Hispanic origin 44% 44% 43%
American Indian/Alaska Native 43% 45% 41%
White (not of Hispanic origin) 64% 64% 64%
Multi-racial 63% 62% 61%
Economically Disadvantaged 47% 47% 46%
English Learners* 19% 17% 16% Note: Multi-Racial does not include students who reported Hispanic Ethnicity – these students are all reported under Hispanic. See http://www.ode.state.or.us/news/announcements/announcement.aspx?=4630 for more information.
69%
10%
0%
50%
100%
Reading Math

Oregon Statewide Report Card 2013-14 42 Oregon Department of Education www.ode.state.or.us Contact for this section: Cindy Barrick, 503-947-5822, [email protected]
Grade 6 Students by Subgroup Percent Meeting or Exceeding Standards in 2013-14
Note: Talented and gifted (TAG) subgroup percent is actually greater than 95% but the exact percent is not displayed to protect student confidentiality. *English Learners is the new term for students identified as having a language other than English. ODE made this change to be consistent with other state reports and guidance.
TAGEconomically
DisadvantagedEnglish
Learners*Migrant
Students withDisabilities
Male Female All Students
Reading 95% 51% 9% 38% 23% 61% 68% 65%
Math 95% 46% 16% 36% 19% 60% 98% 59%
95%
51%
9%
38%
23%
61%
68% 65%
95%
46%
16%
36%
19%
60%
98%
59%
0%
20%
40%
60%
80%
100%
120%
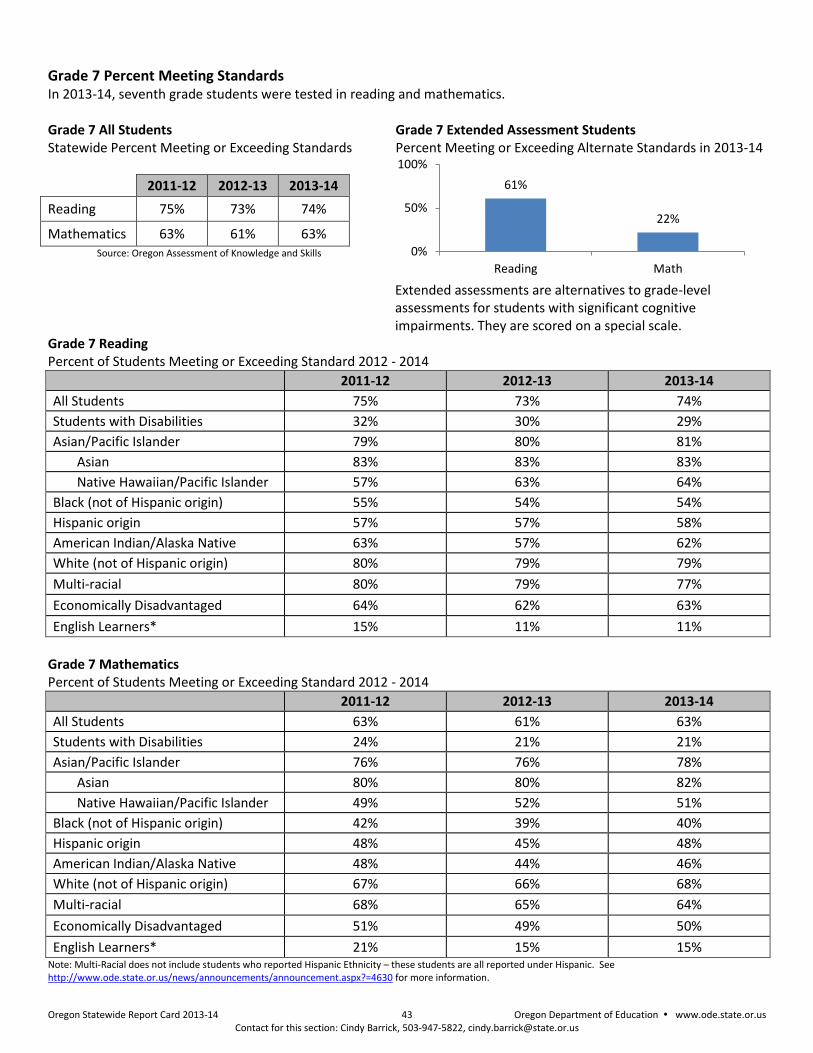
Oregon Statewide Report Card 2013-14 43 Oregon Department of Education www.ode.state.or.us Contact for this section: Cindy Barrick, 503-947-5822, [email protected]
Grade 7 Percent Meeting Standards In 2013-14, seventh grade students were tested in reading and mathematics. Grade 7 All Students Statewide Percent Meeting or Exceeding Standards
2011-12 2012-13 2013-14
Reading 75% 73% 74%
Mathematics 63% 61% 63% Source: Oregon Assessment of Knowledge and Skills
Grade 7 Extended Assessment Students Percent Meeting or Exceeding Alternate Standards in 2013-14
Extended assessments are alternatives to grade-level assessments for students with significant cognitive impairments. They are scored on a special scale.
Grade 7 Reading Percent of Students Meeting or Exceeding Standard 2012 - 2014
2011-12 2012-13 2013-14
All Students 75% 73% 74%
Students with Disabilities 32% 30% 29%
Asian/Pacific Islander 79% 80% 81%
Asian 83% 83% 83%
Native Hawaiian/Pacific Islander 57% 63% 64%
Black (not of Hispanic origin) 55% 54% 54%
Hispanic origin 57% 57% 58%
American Indian/Alaska Native 63% 57% 62%
White (not of Hispanic origin) 80% 79% 79%
Multi-racial 80% 79% 77%
Economically Disadvantaged 64% 62% 63%
English Learners* 15% 11% 11%
Grade 7 Mathematics Percent of Students Meeting or Exceeding Standard 2012 - 2014
2011-12 2012-13 2013-14
All Students 63% 61% 63%
Students with Disabilities 24% 21% 21%
Asian/Pacific Islander 76% 76% 78%
Asian 80% 80% 82%
Native Hawaiian/Pacific Islander 49% 52% 51%
Black (not of Hispanic origin) 42% 39% 40%
Hispanic origin 48% 45% 48%
American Indian/Alaska Native 48% 44% 46%
White (not of Hispanic origin) 67% 66% 68%
Multi-racial 68% 65% 64%
Economically Disadvantaged 51% 49% 50%
English Learners* 21% 15% 15% Note: Multi-Racial does not include students who reported Hispanic Ethnicity – these students are all reported under Hispanic. See http://www.ode.state.or.us/news/announcements/announcement.aspx?=4630 for more information.
61%
22%
0%
50%
100%
Reading Math
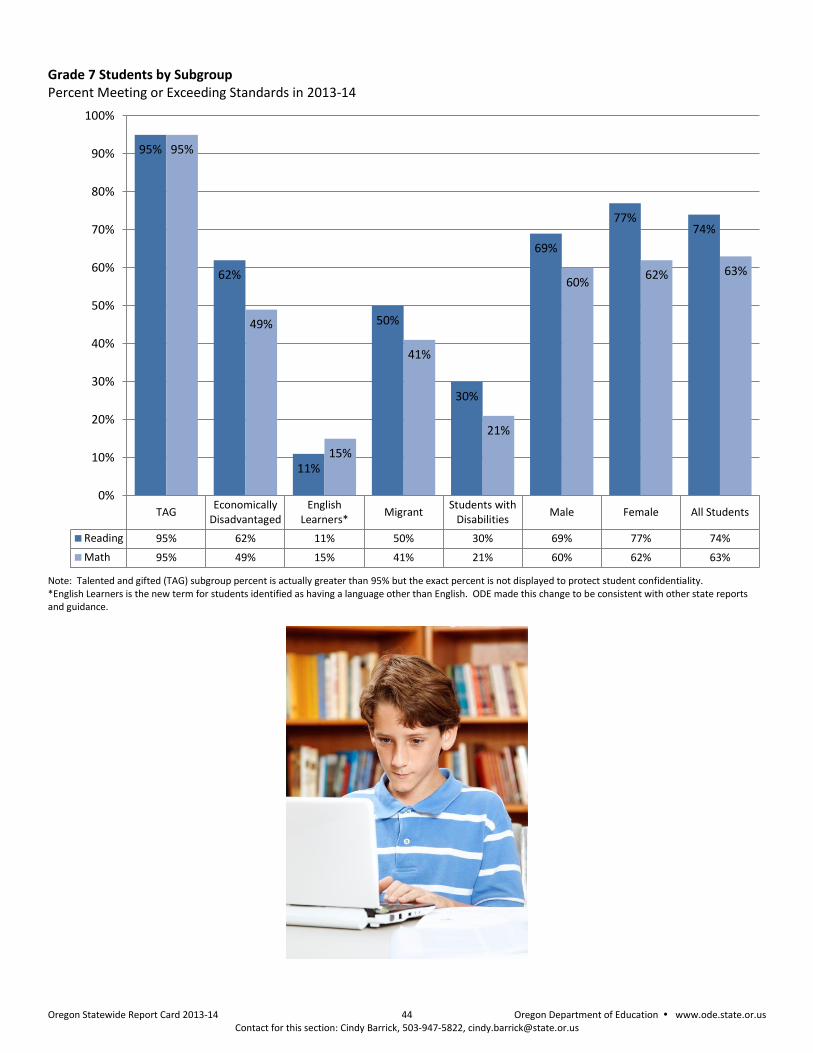
Oregon Statewide Report Card 2013-14 44 Oregon Department of Education www.ode.state.or.us Contact for this section: Cindy Barrick, 503-947-5822, [email protected]
Grade 7 Students by Subgroup Percent Meeting or Exceeding Standards in 2013-14
Note: Talented and gifted (TAG) subgroup percent is actually greater than 95% but the exact percent is not displayed to protect student confidentiality. *English Learners is the new term for students identified as having a language other than English. ODE made this change to be consistent with other state reports and guidance.
TAGEconomically
DisadvantagedEnglish
Learners*Migrant
Students withDisabilities
Male Female All Students
Reading 95% 62% 11% 50% 30% 69% 77% 74%
Math 95% 49% 15% 41% 21% 60% 62% 63%
95%
62%
11%
50%
30%
69%
77% 74%
95%
49%
15%
41%
21%
60% 62% 63%
0%
10%
20%
30%
40%
50%
60%
70%
80%
90%
100%
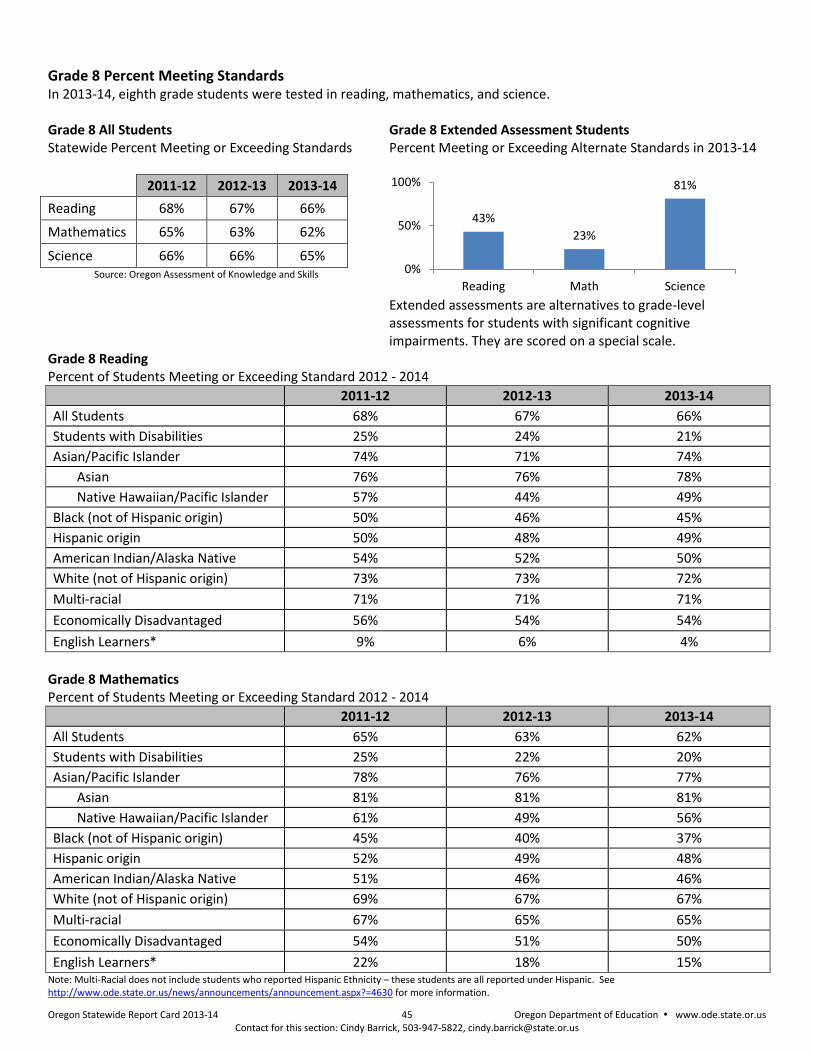
Oregon Statewide Report Card 2013-14 45 Oregon Department of Education www.ode.state.or.us Contact for this section: Cindy Barrick, 503-947-5822, [email protected]
Grade 8 Percent Meeting Standards In 2013-14, eighth grade students were tested in reading, mathematics, and science. Grade 8 All Students Statewide Percent Meeting or Exceeding Standards
2011-12 2012-13 2013-14
Reading 68% 67% 66%
Mathematics 65% 63% 62%
Science 66% 66% 65% Source: Oregon Assessment of Knowledge and Skills
Grade 8 Extended Assessment Students Percent Meeting or Exceeding Alternate Standards in 2013-14
Extended assessments are alternatives to grade-level assessments for students with significant cognitive impairments. They are scored on a special scale.
Grade 8 Reading Percent of Students Meeting or Exceeding Standard 2012 - 2014
2011-12 2012-13 2013-14
All Students 68% 67% 66%
Students with Disabilities 25% 24% 21%
Asian/Pacific Islander 74% 71% 74%
Asian 76% 76% 78%
Native Hawaiian/Pacific Islander 57% 44% 49%
Black (not of Hispanic origin) 50% 46% 45%
Hispanic origin 50% 48% 49%
American Indian/Alaska Native 54% 52% 50%
White (not of Hispanic origin) 73% 73% 72%
Multi-racial 71% 71% 71%
Economically Disadvantaged 56% 54% 54%
English Learners* 9% 6% 4%
Grade 8 Mathematics Percent of Students Meeting or Exceeding Standard 2012 - 2014
2011-12 2012-13 2013-14
All Students 65% 63% 62%
Students with Disabilities 25% 22% 20%
Asian/Pacific Islander 78% 76% 77%
Asian 81% 81% 81%
Native Hawaiian/Pacific Islander 61% 49% 56%
Black (not of Hispanic origin) 45% 40% 37%
Hispanic origin 52% 49% 48%
American Indian/Alaska Native 51% 46% 46%
White (not of Hispanic origin) 69% 67% 67%
Multi-racial 67% 65% 65%
Economically Disadvantaged 54% 51% 50%
English Learners* 22% 18% 15% Note: Multi-Racial does not include students who reported Hispanic Ethnicity – these students are all reported under Hispanic. See http://www.ode.state.or.us/news/announcements/announcement.aspx?=4630 for more information.
43%
23%
81%
0%
50%
100%
Reading Math Science
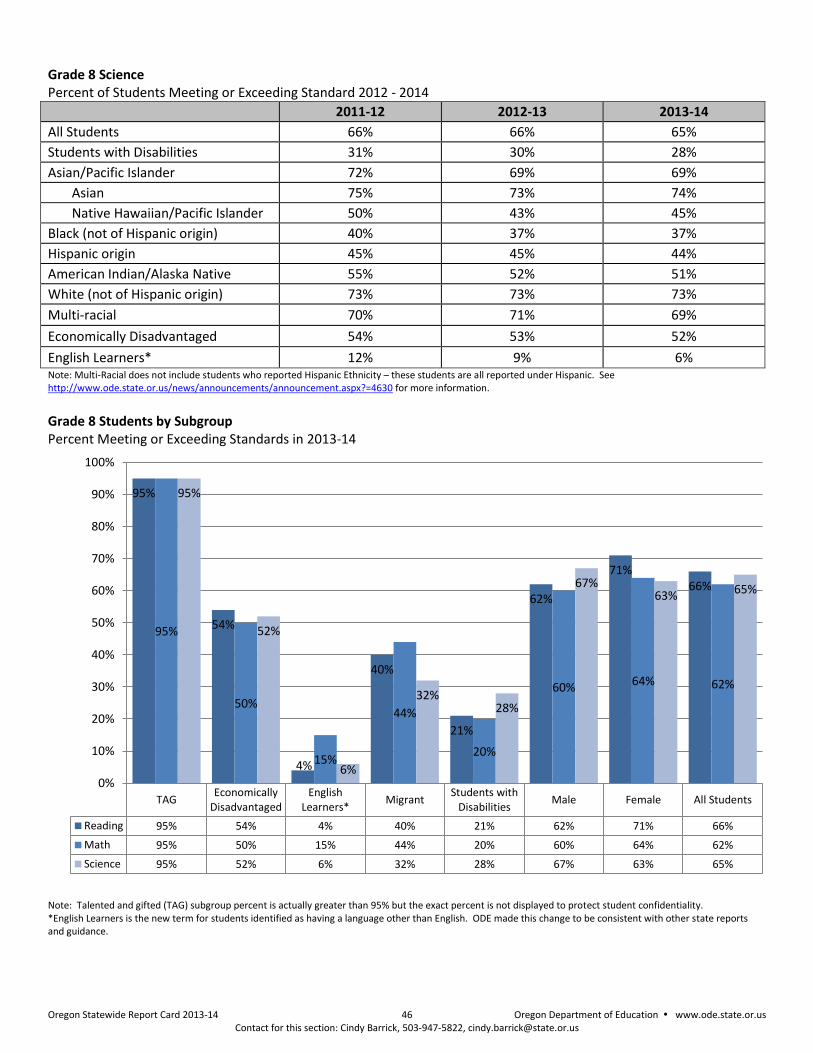
Oregon Statewide Report Card 2013-14 46 Oregon Department of Education www.ode.state.or.us Contact for this section: Cindy Barrick, 503-947-5822, [email protected]
Grade 8 Science Percent of Students Meeting or Exceeding Standard 2012 - 2014
2011-12 2012-13 2013-14
All Students 66% 66% 65%
Students with Disabilities 31% 30% 28%
Asian/Pacific Islander 72% 69% 69%
Asian 75% 73% 74%
Native Hawaiian/Pacific Islander 50% 43% 45%
Black (not of Hispanic origin) 40% 37% 37%
Hispanic origin 45% 45% 44%
American Indian/Alaska Native 55% 52% 51%
White (not of Hispanic origin) 73% 73% 73%
Multi-racial 70% 71% 69%
Economically Disadvantaged 54% 53% 52%
English Learners* 12% 9% 6% Note: Multi-Racial does not include students who reported Hispanic Ethnicity – these students are all reported under Hispanic. See http://www.ode.state.or.us/news/announcements/announcement.aspx?=4630 for more information. Grade 8 Students by Subgroup Percent Meeting or Exceeding Standards in 2013-14
Note: Talented and gifted (TAG) subgroup percent is actually greater than 95% but the exact percent is not displayed to protect student confidentiality. *English Learners is the new term for students identified as having a language other than English. ODE made this change to be consistent with other state reports and guidance.
TAGEconomically
DisadvantagedEnglish
Learners*Migrant
Students withDisabilities
Male Female All Students
Reading 95% 54% 4% 40% 21% 62% 71% 66%
Math 95% 50% 15% 44% 20% 60% 64% 62%
Science 95% 52% 6% 32% 28% 67% 63% 65%
95%
54%
4%
40%
21%
62%
71% 66%
95%
50%
15%
44%
20%
60% 64% 62%
95%
52%
6%
32% 28%
67% 63% 65%
0%
10%
20%
30%
40%
50%
60%
70%
80%
90%
100%
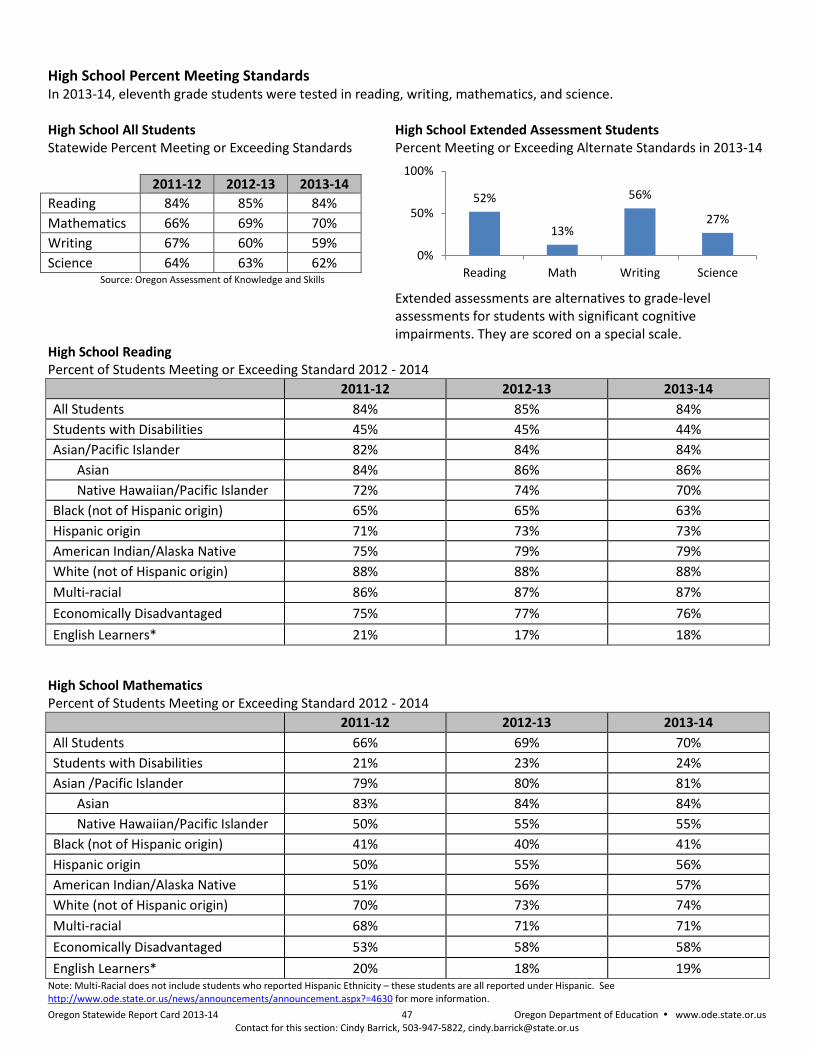
Oregon Statewide Report Card 2013-14 47 Oregon Department of Education www.ode.state.or.us Contact for this section: Cindy Barrick, 503-947-5822, [email protected]
High School Percent Meeting Standards In 2013-14, eleventh grade students were tested in reading, writing, mathematics, and science. High School All Students Statewide Percent Meeting or Exceeding Standards
2011-12 2012-13 2013-14
Reading 84% 85% 84%
Mathematics 66% 69% 70%
Writing 67% 60% 59%
Science 64% 63% 62% Source: Oregon Assessment of Knowledge and Skills
High School Extended Assessment Students Percent Meeting or Exceeding Alternate Standards in 2013-14
Extended assessments are alternatives to grade-level assessments for students with significant cognitive impairments. They are scored on a special scale.
High School Reading Percent of Students Meeting or Exceeding Standard 2012 - 2014
2011-12 2012-13 2013-14
All Students 84% 85% 84%
Students with Disabilities 45% 45% 44%
Asian/Pacific Islander 82% 84% 84%
Asian 84% 86% 86%
Native Hawaiian/Pacific Islander 72% 74% 70%
Black (not of Hispanic origin) 65% 65% 63%
Hispanic origin 71% 73% 73%
American Indian/Alaska Native 75% 79% 79%
White (not of Hispanic origin) 88% 88% 88%
Multi-racial 86% 87% 87%
Economically Disadvantaged 75% 77% 76%
English Learners* 21% 17% 18%
High School Mathematics Percent of Students Meeting or Exceeding Standard 2012 - 2014
2011-12 2012-13 2013-14
All Students 66% 69% 70%
Students with Disabilities 21% 23% 24%
Asian /Pacific Islander 79% 80% 81%
Asian 83% 84% 84%
Native Hawaiian/Pacific Islander 50% 55% 55%
Black (not of Hispanic origin) 41% 40% 41%
Hispanic origin 50% 55% 56%
American Indian/Alaska Native 51% 56% 57%
White (not of Hispanic origin) 70% 73% 74%
Multi-racial 68% 71% 71%
Economically Disadvantaged 53% 58% 58%
English Learners* 20% 18% 19% Note: Multi-Racial does not include students who reported Hispanic Ethnicity – these students are all reported under Hispanic. See http://www.ode.state.or.us/news/announcements/announcement.aspx?=4630 for more information.
52%
13%
56%
27%
0%
50%
100%
Reading Math Writing Science
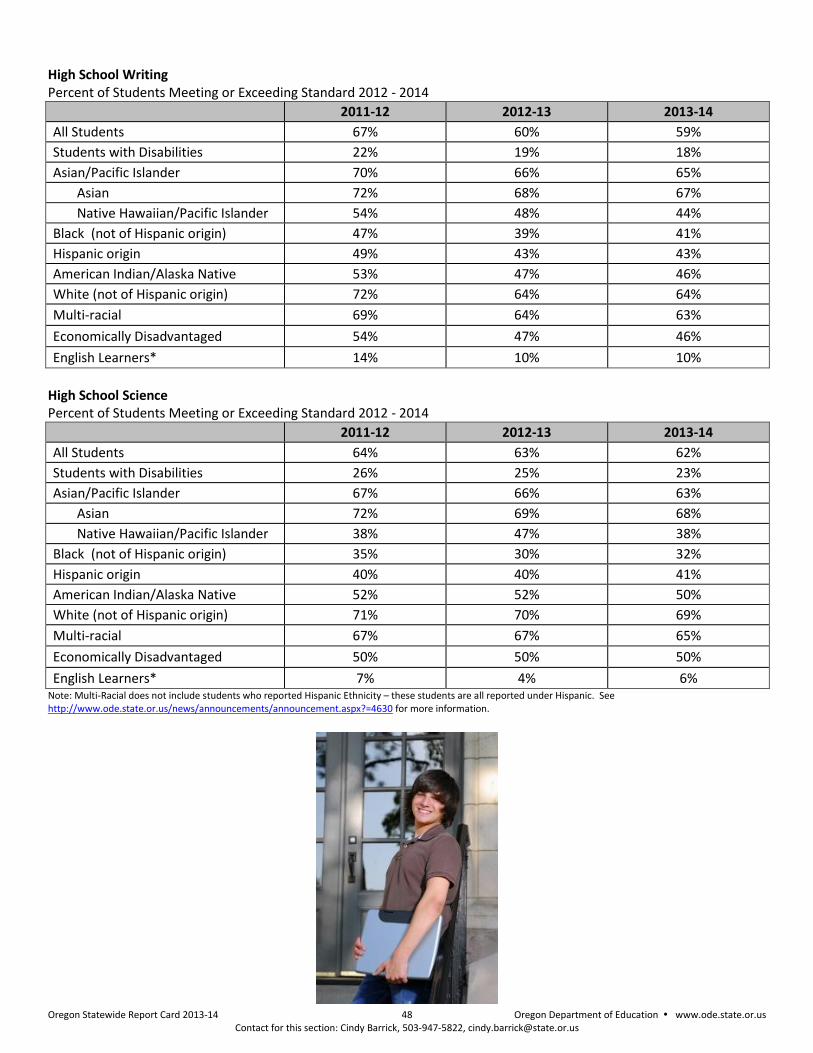
Oregon Statewide Report Card 2013-14 48 Oregon Department of Education www.ode.state.or.us Contact for this section: Cindy Barrick, 503-947-5822, [email protected]
High School Writing Percent of Students Meeting or Exceeding Standard 2012 - 2014
2011-12 2012-13 2013-14
All Students 67% 60% 59%
Students with Disabilities 22% 19% 18%
Asian/Pacific Islander 70% 66% 65%
Asian 72% 68% 67%
Native Hawaiian/Pacific Islander 54% 48% 44%
Black (not of Hispanic origin) 47% 39% 41%
Hispanic origin 49% 43% 43%
American Indian/Alaska Native 53% 47% 46%
White (not of Hispanic origin) 72% 64% 64%
Multi-racial 69% 64% 63%
Economically Disadvantaged 54% 47% 46%
English Learners* 14% 10% 10%
High School Science Percent of Students Meeting or Exceeding Standard 2012 - 2014
2011-12 2012-13 2013-14
All Students 64% 63% 62%
Students with Disabilities 26% 25% 23%
Asian/Pacific Islander 67% 66% 63%
Asian 72% 69% 68%
Native Hawaiian/Pacific Islander 38% 47% 38%
Black (not of Hispanic origin) 35% 30% 32%
Hispanic origin 40% 40% 41%
American Indian/Alaska Native 52% 52% 50%
White (not of Hispanic origin) 71% 70% 69%
Multi-racial 67% 67% 65%
Economically Disadvantaged 50% 50% 50%
English Learners* 7% 4% 6% Note: Multi-Racial does not include students who reported Hispanic Ethnicity – these students are all reported under Hispanic. See http://www.ode.state.or.us/news/announcements/announcement.aspx?=4630 for more information.
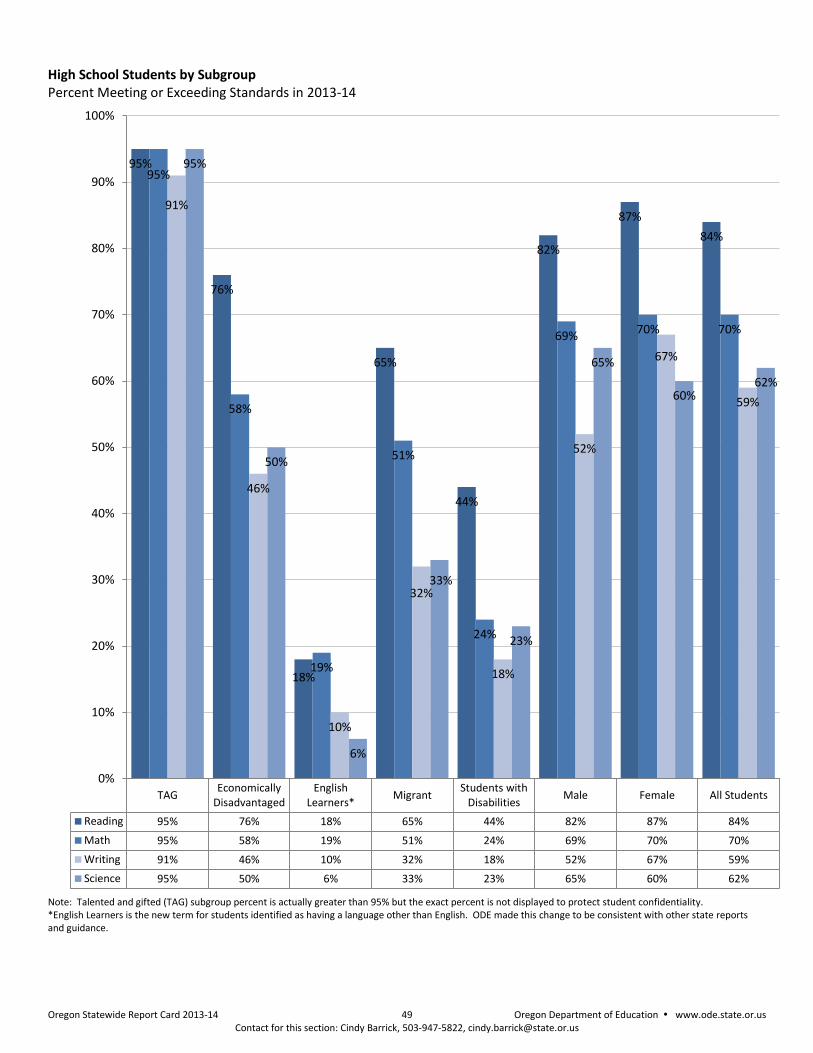
Oregon Statewide Report Card 2013-14 49 Oregon Department of Education www.ode.state.or.us Contact for this section: Cindy Barrick, 503-947-5822, [email protected]
High School Students by Subgroup Percent Meeting or Exceeding Standards in 2013-14
Note: Talented and gifted (TAG) subgroup percent is actually greater than 95% but the exact percent is not displayed to protect student confidentiality. *English Learners is the new term for students identified as having a language other than English. ODE made this change to be consistent with other state reports and guidance.
TAGEconomically
DisadvantagedEnglish
Learners*Migrant
Students withDisabilities
Male Female All Students
Reading 95% 76% 18% 65% 44% 82% 87% 84%
Math 95% 58% 19% 51% 24% 69% 70% 70%
Writing 91% 46% 10% 32% 18% 52% 67% 59%
Science 95% 50% 6% 33% 23% 65% 60% 62%
95%
76%
18%
65%
44%
82%
87%
84%
95%
58%
19%
51%
24%
69% 70% 70%
91%
46%
10%
32%
18%
52%
67%
59%
95%
50%
6%
33%
23%
65%
60% 62%
0%
10%
20%
30%
40%
50%
60%
70%
80%
90%
100%
Oregon Statewide Report Card 2013-14 50 Oregon Department of Education www.ode.state.or.us Contact for this section: Beth LaDuca, 503-947-5836, [email protected]
NATIONAL COMPARISON OF STUDENT ACHIEVEMENT
The National Assessment of Educational Progress The National Assessment of Educational Progress (NAEP), also known as "The Nation's Report Card," has conducted national assessments since 1969 in many content areas, including social studies and the arts. Since 1990, NAEP has produced reports on student achievement at the state as well as the national level in mathematics, reading, science, and writing. The National Center for Education Statistics within the U.S. Department of Education is responsible for carrying out NAEP. The independent, non-partisan National Assessment Governing Board oversees and sets policy for NAEP. Differences between NAEP and OAKS Unlike Oregon’s Assessment of Knowledge and Skills (OAKS), NAEP does not provide individual scores for students, schools, or districts in Oregon for several reasons:
NAEP is a survey assessment, so results are based on samples of students representative of the state or nation;
Each student takes a small part of the overall assessment, so only when the scores are aggregated for groups of students are the data considered valid and reliable estimates of what students know and can do in the content area;
Federal law requires that NAEP data remain confidential, so all personally identifiable information about students is removed from test booklets at the school on the day of the assessment.
There are other important differences between NAEP and OAKS assessments. NAEP produces state results only for 4th and 8th graders, while OAKS reports results for students in grades 3-8 and high school. The content tested in a NAEP assessment is determined by a national panel of experts convened by the National Assessment Governing Board. OAKS tests the knowledge and skills laid out in the content standards adopted by the Oregon State Board of Education. NAEP Assessment Schedule In 2013-2014, NAEP conducted national assessments in civics, geography, U.S. history, and technology and engineering literacy at grade 8. Results from these assessments will be released in 2015. This report includes results from the 2012-2013 NAEP state assessments in math and reading at grades 4 and 8, along with the most recent science assessment results from 2009 and 2011. In 2014-2015, NAEP will conduct national assessments in math, reading, and science at grades 4, 8, and 12 as well as state assessments in math, reading, and science at grades 4 and 8. Results from these assessments will be included in the 2014-2015 Oregon Statewide Report Card.
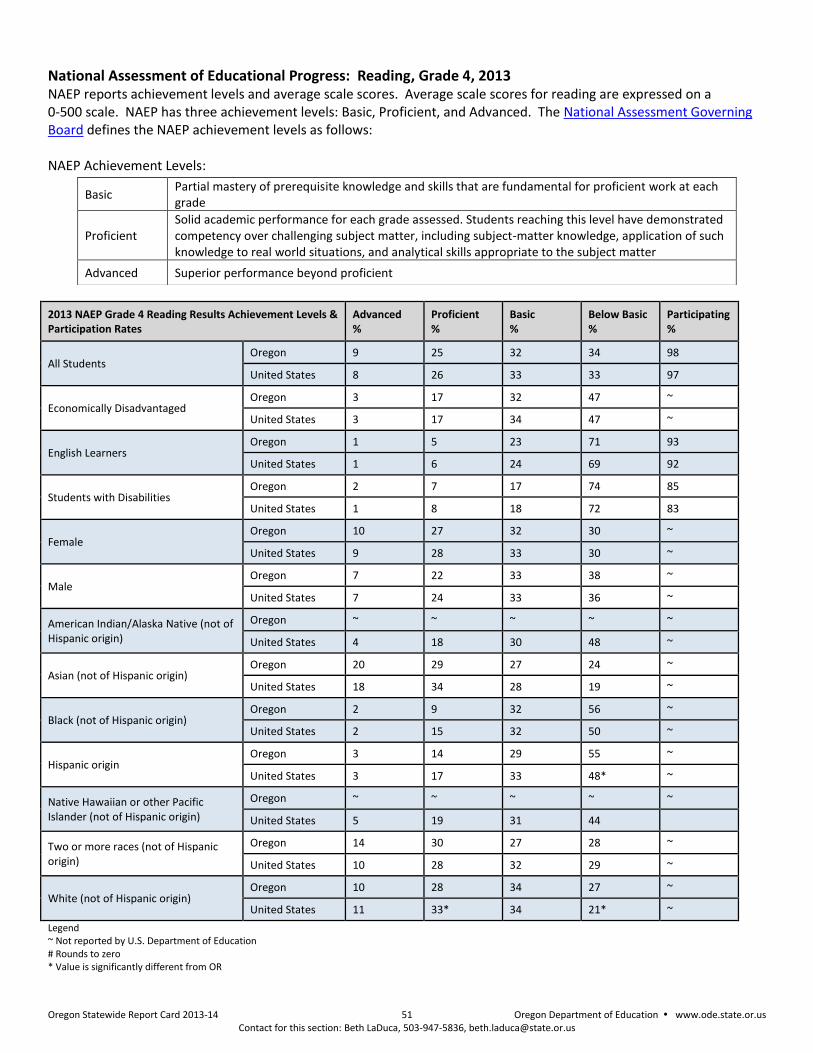
Oregon Statewide Report Card 2013-14 51 Oregon Department of Education www.ode.state.or.us Contact for this section: Beth LaDuca, 503-947-5836, [email protected]
National Assessment of Educational Progress: Reading, Grade 4, 2013 NAEP reports achievement levels and average scale scores. Average scale scores for reading are expressed on a 0-500 scale. NAEP has three achievement levels: Basic, Proficient, and Advanced. The National Assessment Governing Board defines the NAEP achievement levels as follows: NAEP Achievement Levels:
2013 NAEP Grade 4 Reading Results Achievement Levels & Participation Rates
Advanced %
Proficient %
Basic %
Below Basic %
Participating %
All Students Oregon 9 25 32 34 98
United States 8 26 33 33 97
Economically Disadvantaged Oregon 3 17 32 47 ~
United States 3 17 34 47 ~
English Learners Oregon 1 5 23 71 93
United States 1 6 24 69 92
Students with Disabilities Oregon 2 7 17 74 85
United States 1 8 18 72 83
Female Oregon 10 27 32 30 ~
United States 9 28 33 30 ~
Male Oregon 7 22 33 38 ~
United States 7 24 33 36 ~
American Indian/Alaska Native (not of Hispanic origin)
Oregon ~ ~ ~ ~ ~
United States 4 18 30 48 ~
Asian (not of Hispanic origin) Oregon 20 29 27 24 ~
United States 18 34 28 19 ~
Black (not of Hispanic origin) Oregon 2 9 32 56 ~
United States 2 15 32 50 ~
Hispanic origin Oregon 3 14 29 55 ~
United States 3 17 33 48* ~
Native Hawaiian or other Pacific Islander (not of Hispanic origin)
Oregon ~ ~ ~ ~ ~
United States 5 19 31 44
Two or more races (not of Hispanic origin)
Oregon 14 30 27 28 ~
United States 10 28 32 29 ~
White (not of Hispanic origin) Oregon 10 28 34 27 ~
United States 11 33* 34 21* ~
Legend ~ Not reported by U.S. Department of Education # Rounds to zero * Value is significantly different from OR
Basic Partial mastery of prerequisite knowledge and skills that are fundamental for proficient work at each grade
Proficient Solid academic performance for each grade assessed. Students reaching this level have demonstrated competency over challenging subject matter, including subject-matter knowledge, application of such knowledge to real world situations, and analytical skills appropriate to the subject matter
Advanced Superior performance beyond proficient
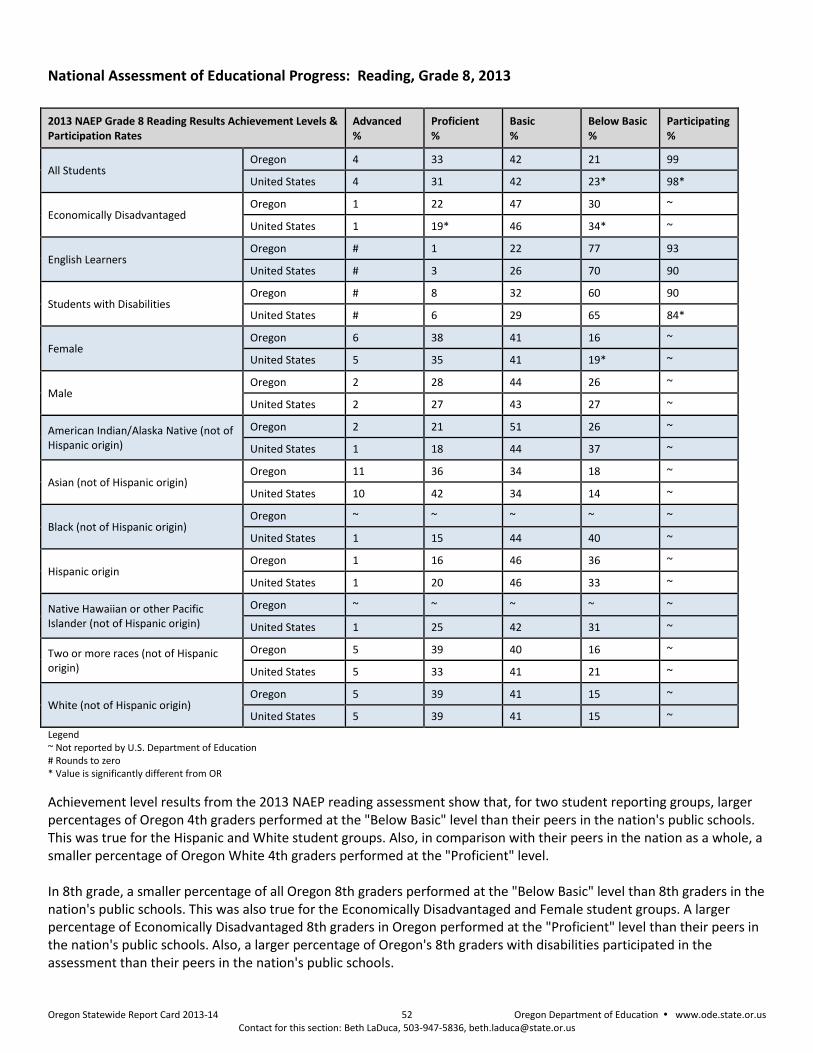
Oregon Statewide Report Card 2013-14 52 Oregon Department of Education www.ode.state.or.us Contact for this section: Beth LaDuca, 503-947-5836, [email protected]
National Assessment of Educational Progress: Reading, Grade 8, 2013
2013 NAEP Grade 8 Reading Results Achievement Levels & Participation Rates
Advanced %
Proficient %
Basic %
Below Basic %
Participating %
All Students Oregon 4 33 42 21 99
United States 4 31 42 23* 98*
Economically Disadvantaged Oregon 1 22 47 30 ~
United States 1 19* 46 34* ~
English Learners Oregon # 1 22 77 93
United States # 3 26 70 90
Students with Disabilities Oregon # 8 32 60 90
United States # 6 29 65 84*
Female Oregon 6 38 41 16 ~
United States 5 35 41 19* ~
Male Oregon 2 28 44 26 ~
United States 2 27 43 27 ~
American Indian/Alaska Native (not of Hispanic origin)
Oregon 2 21 51 26 ~
United States 1 18 44 37 ~
Asian (not of Hispanic origin) Oregon 11 36 34 18 ~
United States 10 42 34 14 ~
Black (not of Hispanic origin) Oregon ~ ~ ~ ~ ~
United States 1 15 44 40 ~
Hispanic origin Oregon 1 16 46 36 ~
United States 1 20 46 33 ~
Native Hawaiian or other Pacific Islander (not of Hispanic origin)
Oregon ~ ~ ~ ~ ~
United States 1 25 42 31 ~
Two or more races (not of Hispanic origin)
Oregon 5 39 40 16 ~
United States 5 33 41 21 ~
White (not of Hispanic origin) Oregon 5 39 41 15 ~
United States 5 39 41 15 ~
Legend ~ Not reported by U.S. Department of Education # Rounds to zero * Value is significantly different from OR
Achievement level results from the 2013 NAEP reading assessment show that, for two student reporting groups, larger percentages of Oregon 4th graders performed at the "Below Basic" level than their peers in the nation's public schools. This was true for the Hispanic and White student groups. Also, in comparison with their peers in the nation as a whole, a smaller percentage of Oregon White 4th graders performed at the "Proficient" level. In 8th grade, a smaller percentage of all Oregon 8th graders performed at the "Below Basic" level than 8th graders in the nation's public schools. This was also true for the Economically Disadvantaged and Female student groups. A larger percentage of Economically Disadvantaged 8th graders in Oregon performed at the "Proficient" level than their peers in the nation's public schools. Also, a larger percentage of Oregon's 8th graders with disabilities participated in the assessment than their peers in the nation's public schools.
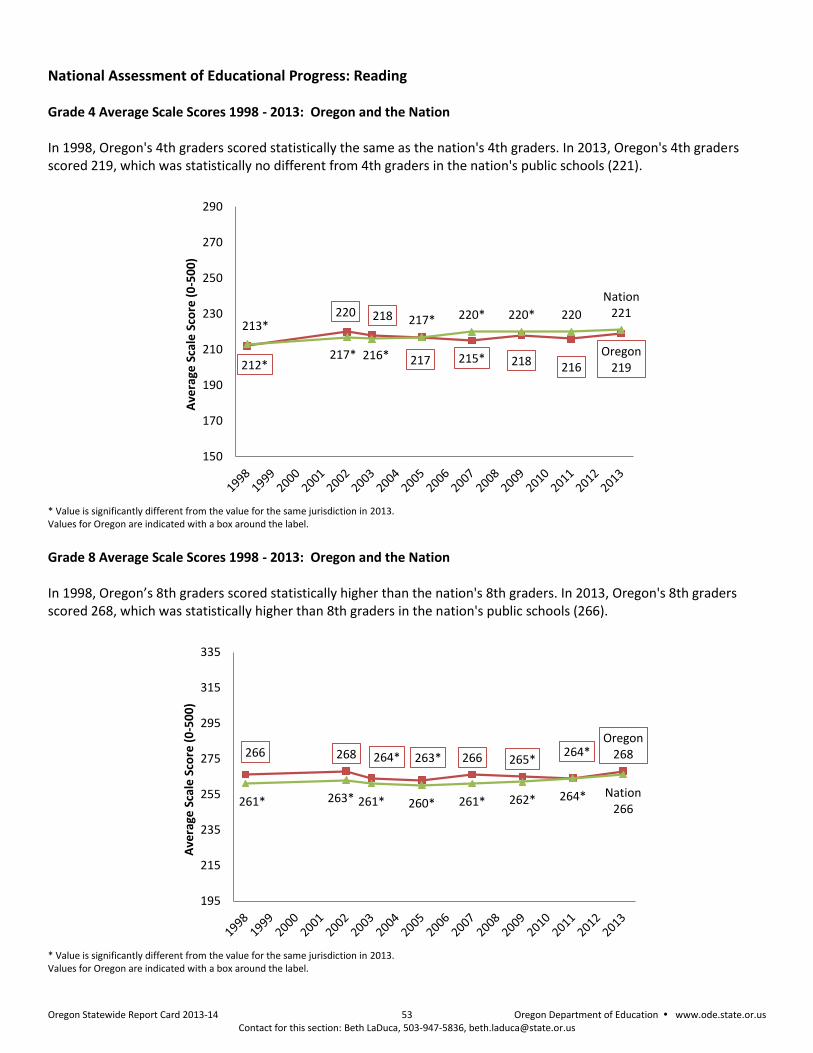
Oregon Statewide Report Card 2013-14 53 Oregon Department of Education www.ode.state.or.us Contact for this section: Beth LaDuca, 503-947-5836, [email protected]
National Assessment of Educational Progress: Reading Grade 4 Average Scale Scores 1998 - 2013: Oregon and the Nation In 1998, Oregon's 4th graders scored statistically the same as the nation's 4th graders. In 2013, Oregon's 4th graders scored 219, which was statistically no different from 4th graders in the nation's public schools (221).
* Value is significantly different from the value for the same jurisdiction in 2013. Values for Oregon are indicated with a box around the label.
Grade 8 Average Scale Scores 1998 - 2013: Oregon and the Nation In 1998, Oregon’s 8th graders scored statistically higher than the nation's 8th graders. In 2013, Oregon's 8th graders scored 268, which was statistically higher than 8th graders in the nation's public schools (266).
* Value is significantly different from the value for the same jurisdiction in 2013. Values for Oregon are indicated with a box around the label.
212*
220 218
217 215* 218 216 Oregon
219
213*
217* 216*
217* 220* 220* 220
Nation 221
150
170
190
210
230
250
270
290A
vera
ge S
cale
Sco
re (
0-5
00
)
266 268 264* 263* 266 265* 264*
Oregon 268
261* 263* 261* 260* 261* 262* 264* Nation 266
195
215
235
255
275
295
315
335
Ave
rage
Sca
le S
core
(0
-50
0)
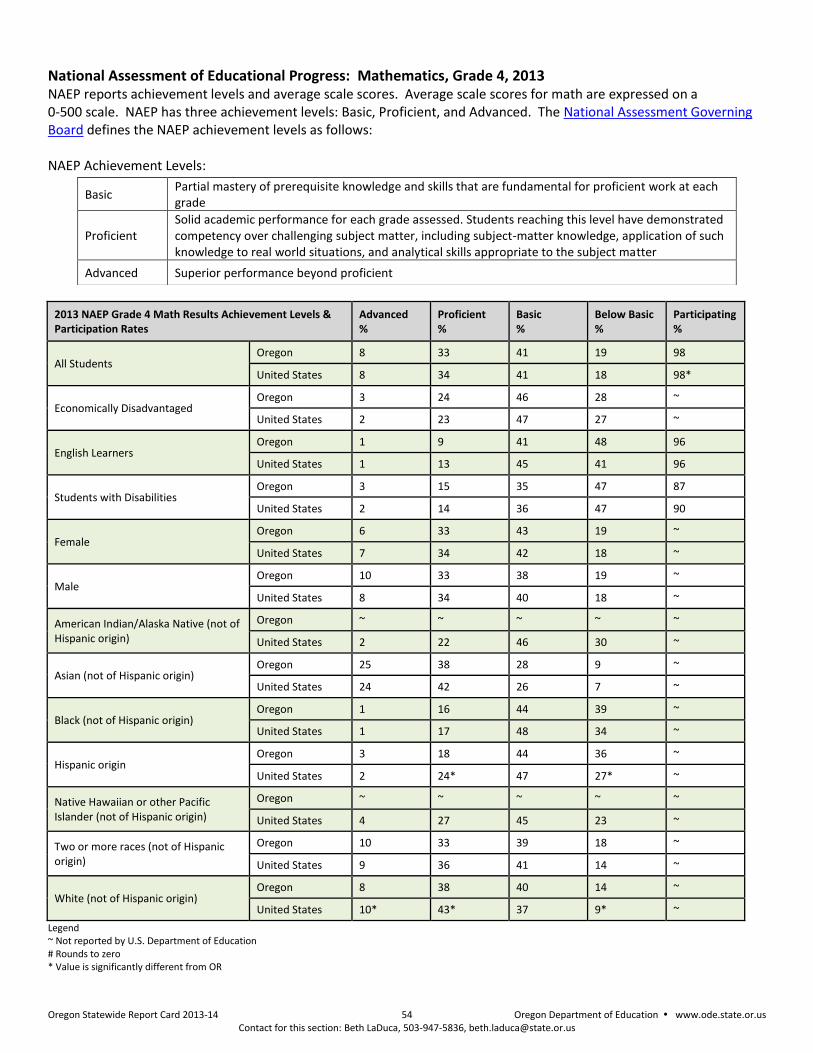
Oregon Statewide Report Card 2013-14 54 Oregon Department of Education www.ode.state.or.us Contact for this section: Beth LaDuca, 503-947-5836, [email protected]
National Assessment of Educational Progress: Mathematics, Grade 4, 2013 NAEP reports achievement levels and average scale scores. Average scale scores for math are expressed on a 0-500 scale. NAEP has three achievement levels: Basic, Proficient, and Advanced. The National Assessment Governing Board defines the NAEP achievement levels as follows: NAEP Achievement Levels:
2013 NAEP Grade 4 Math Results Achievement Levels & Participation Rates
Advanced %
Proficient %
Basic %
Below Basic %
Participating %
All Students Oregon 8 33 41 19 98
United States 8 34 41 18 98*
Economically Disadvantaged Oregon 3 24 46 28 ~
United States 2 23 47 27 ~
English Learners Oregon 1 9 41 48 96
United States 1 13 45 41 96
Students with Disabilities Oregon 3 15 35 47 87
United States 2 14 36 47 90
Female Oregon 6 33 43 19 ~
United States 7 34 42 18 ~
Male Oregon 10 33 38 19 ~
United States 8 34 40 18 ~
American Indian/Alaska Native (not of Hispanic origin)
Oregon ~ ~ ~ ~ ~
United States 2 22 46 30 ~
Asian (not of Hispanic origin) Oregon 25 38 28 9 ~
United States 24 42 26 7 ~
Black (not of Hispanic origin) Oregon 1 16 44 39 ~
United States 1 17 48 34 ~
Hispanic origin Oregon 3 18 44 36 ~
United States 2 24* 47 27* ~
Native Hawaiian or other Pacific Islander (not of Hispanic origin)
Oregon ~ ~ ~ ~ ~
United States 4 27 45 23 ~
Two or more races (not of Hispanic origin)
Oregon 10 33 39 18 ~
United States 9 36 41 14 ~
White (not of Hispanic origin) Oregon 8 38 40 14 ~
United States 10* 43* 37 9* ~
Legend ~ Not reported by U.S. Department of Education # Rounds to zero * Value is significantly different from OR
Basic Partial mastery of prerequisite knowledge and skills that are fundamental for proficient work at each grade
Proficient Solid academic performance for each grade assessed. Students reaching this level have demonstrated competency over challenging subject matter, including subject-matter knowledge, application of such knowledge to real world situations, and analytical skills appropriate to the subject matter
Advanced Superior performance beyond proficient
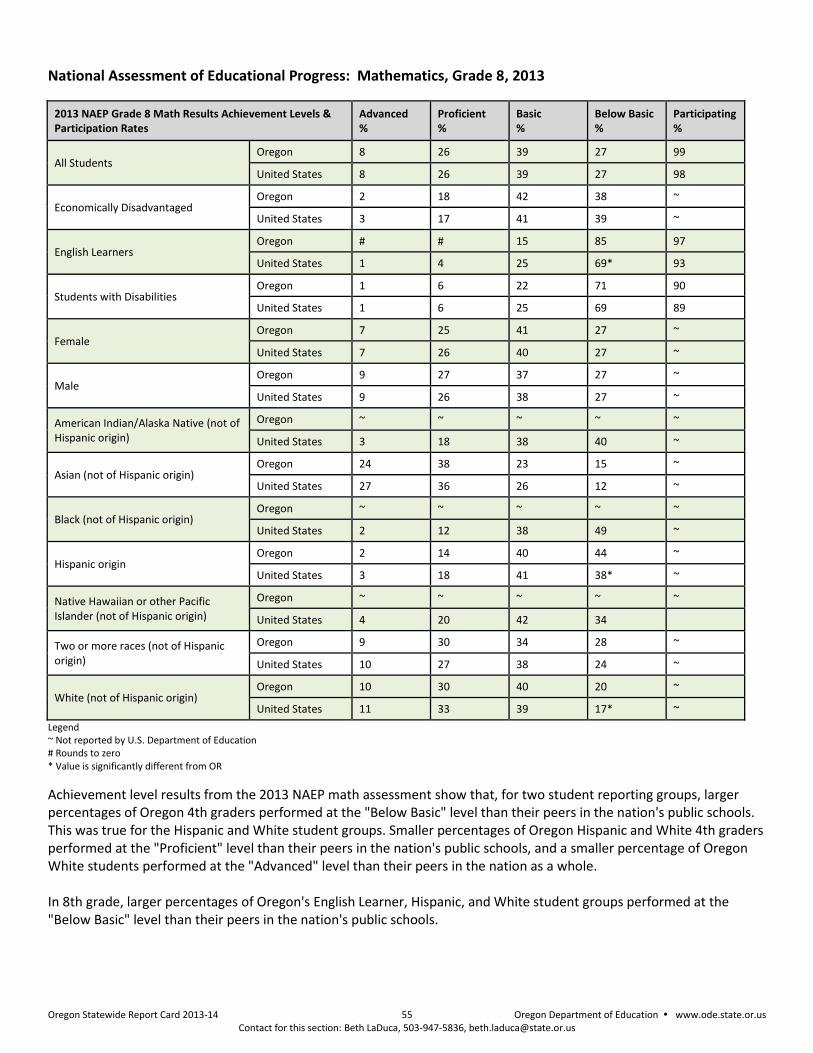
Oregon Statewide Report Card 2013-14 55 Oregon Department of Education www.ode.state.or.us Contact for this section: Beth LaDuca, 503-947-5836, [email protected]
National Assessment of Educational Progress: Mathematics, Grade 8, 2013
2013 NAEP Grade 8 Math Results Achievement Levels & Participation Rates
Advanced %
Proficient %
Basic %
Below Basic %
Participating %
All Students Oregon 8 26 39 27 99
United States 8 26 39 27 98
Economically Disadvantaged Oregon 2 18 42 38 ~
United States 3 17 41 39 ~
English Learners Oregon # # 15 85 97
United States 1 4 25 69* 93
Students with Disabilities Oregon 1 6 22 71 90
United States 1 6 25 69 89
Female Oregon 7 25 41 27 ~
United States 7 26 40 27 ~
Male Oregon 9 27 37 27 ~
United States 9 26 38 27 ~
American Indian/Alaska Native (not of Hispanic origin)
Oregon ~ ~ ~ ~ ~
United States 3 18 38 40 ~
Asian (not of Hispanic origin) Oregon 24 38 23 15 ~
United States 27 36 26 12 ~
Black (not of Hispanic origin) Oregon ~ ~ ~ ~ ~
United States 2 12 38 49 ~
Hispanic origin Oregon 2 14 40 44 ~
United States 3 18 41 38* ~
Native Hawaiian or other Pacific Islander (not of Hispanic origin)
Oregon ~ ~ ~ ~ ~
United States 4 20 42 34
Two or more races (not of Hispanic origin)
Oregon 9 30 34 28 ~
United States 10 27 38 24 ~
White (not of Hispanic origin) Oregon 10 30 40 20 ~
United States 11 33 39 17* ~
Legend ~ Not reported by U.S. Department of Education # Rounds to zero * Value is significantly different from OR
Achievement level results from the 2013 NAEP math assessment show that, for two student reporting groups, larger percentages of Oregon 4th graders performed at the "Below Basic" level than their peers in the nation's public schools. This was true for the Hispanic and White student groups. Smaller percentages of Oregon Hispanic and White 4th graders performed at the "Proficient" level than their peers in the nation's public schools, and a smaller percentage of Oregon White students performed at the "Advanced" level than their peers in the nation as a whole. In 8th grade, larger percentages of Oregon's English Learner, Hispanic, and White student groups performed at the "Below Basic" level than their peers in the nation's public schools.
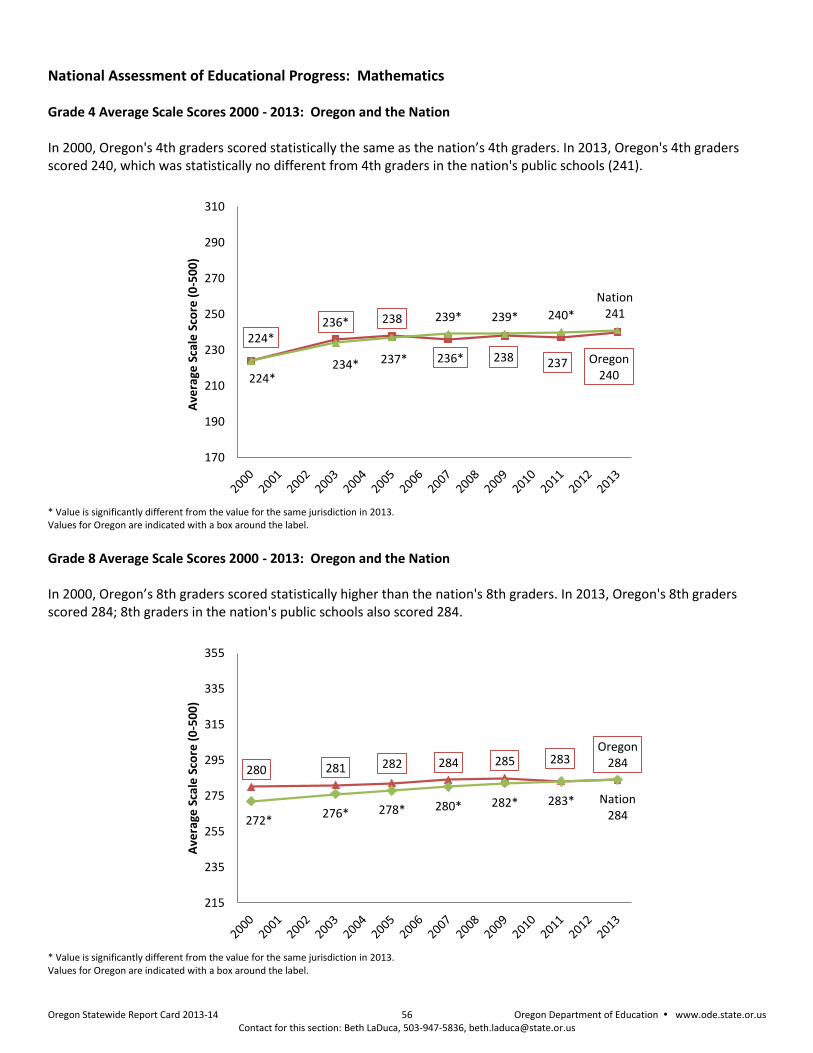
Oregon Statewide Report Card 2013-14 56 Oregon Department of Education www.ode.state.or.us Contact for this section: Beth LaDuca, 503-947-5836, [email protected]
National Assessment of Educational Progress: Mathematics Grade 4 Average Scale Scores 2000 - 2013: Oregon and the Nation In 2000, Oregon's 4th graders scored statistically the same as the nation’s 4th graders. In 2013, Oregon's 4th graders scored 240, which was statistically no different from 4th graders in the nation's public schools (241).
* Value is significantly different from the value for the same jurisdiction in 2013. Values for Oregon are indicated with a box around the label.
Grade 8 Average Scale Scores 2000 - 2013: Oregon and the Nation In 2000, Oregon’s 8th graders scored statistically higher than the nation's 8th graders. In 2013, Oregon's 8th graders scored 284; 8th graders in the nation's public schools also scored 284.
* Value is significantly different from the value for the same jurisdiction in 2013. Values for Oregon are indicated with a box around the label.
224* 236* 238
236* 238 237 Oregon 240 224*
234* 237*
239* 239* 240*
Nation 241
170
190
210
230
250
270
290
310A
vera
ge S
cale
Sco
re (
0-5
00
)
280 281 282 284 285 283 Oregon
284
272* 276* 278* 280* 282* 283* Nation
284
215
235
255
275
295
315
335
355
Ave
rage
Sca
le S
core
(0
-50
0)
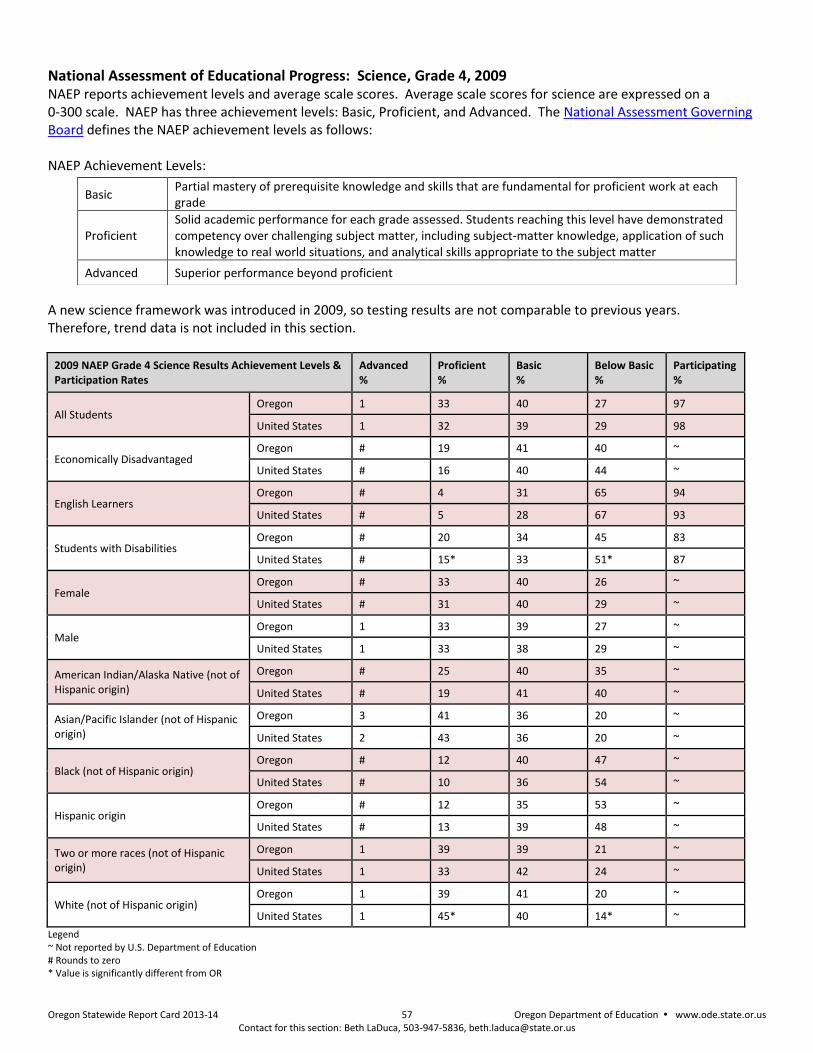
Oregon Statewide Report Card 2013-14 57 Oregon Department of Education www.ode.state.or.us Contact for this section: Beth LaDuca, 503-947-5836, [email protected]
National Assessment of Educational Progress: Science, Grade 4, 2009 NAEP reports achievement levels and average scale scores. Average scale scores for science are expressed on a 0-300 scale. NAEP has three achievement levels: Basic, Proficient, and Advanced. The National Assessment Governing Board defines the NAEP achievement levels as follows: NAEP Achievement Levels:
A new science framework was introduced in 2009, so testing results are not comparable to previous years. Therefore, trend data is not included in this section.
2009 NAEP Grade 4 Science Results Achievement Levels & Participation Rates
Advanced %
Proficient %
Basic %
Below Basic %
Participating %
All Students Oregon 1 33 40 27 97
United States 1 32 39 29 98
Economically Disadvantaged Oregon # 19 41 40 ~
United States # 16 40 44 ~
English Learners Oregon # 4 31 65 94
United States # 5 28 67 93
Students with Disabilities Oregon # 20 34 45 83
United States # 15* 33 51* 87
Female Oregon # 33 40 26 ~
United States # 31 40 29 ~
Male Oregon 1 33 39 27 ~
United States 1 33 38 29 ~
American Indian/Alaska Native (not of Hispanic origin)
Oregon # 25 40 35 ~
United States # 19 41 40 ~
Asian/Pacific Islander (not of Hispanic origin)
Oregon 3 41 36 20 ~
United States 2 43 36 20 ~
Black (not of Hispanic origin) Oregon # 12 40 47 ~
United States # 10 36 54 ~
Hispanic origin Oregon # 12 35 53 ~
United States # 13 39 48 ~
Two or more races (not of Hispanic origin)
Oregon 1 39 39 21 ~
United States 1 33 42 24 ~
White (not of Hispanic origin) Oregon 1 39 41 20 ~
United States 1 45* 40 14* ~
Legend ~ Not reported by U.S. Department of Education # Rounds to zero * Value is significantly different from OR
Basic Partial mastery of prerequisite knowledge and skills that are fundamental for proficient work at each grade
Proficient Solid academic performance for each grade assessed. Students reaching this level have demonstrated competency over challenging subject matter, including subject-matter knowledge, application of such knowledge to real world situations, and analytical skills appropriate to the subject matter
Advanced Superior performance beyond proficient
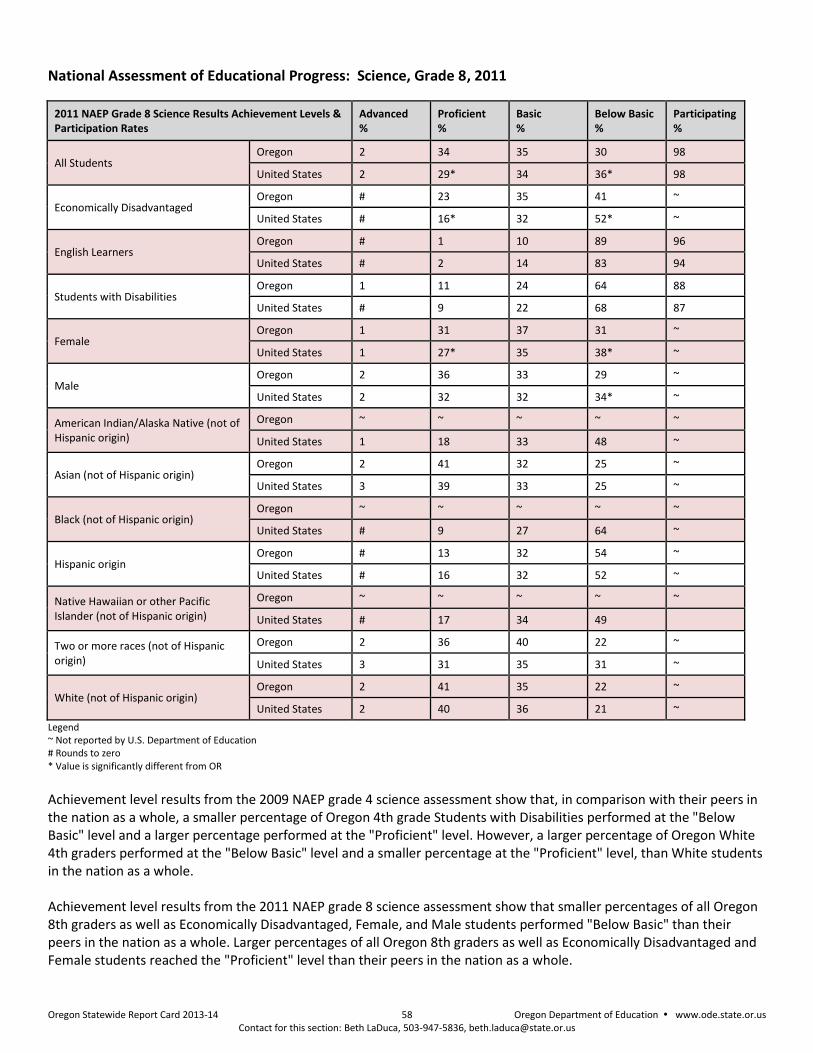
Oregon Statewide Report Card 2013-14 58 Oregon Department of Education www.ode.state.or.us Contact for this section: Beth LaDuca, 503-947-5836, [email protected]
National Assessment of Educational Progress: Science, Grade 8, 2011
2011 NAEP Grade 8 Science Results Achievement Levels & Participation Rates
Advanced %
Proficient %
Basic %
Below Basic %
Participating %
All Students Oregon 2 34 35 30 98
United States 2 29* 34 36* 98
Economically Disadvantaged Oregon # 23 35 41 ~
United States # 16* 32 52* ~
English Learners Oregon # 1 10 89 96
United States # 2 14 83 94
Students with Disabilities Oregon 1 11 24 64 88
United States # 9 22 68 87
Female Oregon 1 31 37 31 ~
United States 1 27* 35 38* ~
Male Oregon 2 36 33 29 ~
United States 2 32 32 34* ~
American Indian/Alaska Native (not of Hispanic origin)
Oregon ~ ~ ~ ~ ~
United States 1 18 33 48 ~
Asian (not of Hispanic origin) Oregon 2 41 32 25 ~
United States 3 39 33 25 ~
Black (not of Hispanic origin) Oregon ~ ~ ~ ~ ~
United States # 9 27 64 ~
Hispanic origin Oregon # 13 32 54 ~
United States # 16 32 52 ~
Native Hawaiian or other Pacific Islander (not of Hispanic origin)
Oregon ~ ~ ~ ~ ~
United States # 17 34 49
Two or more races (not of Hispanic origin)
Oregon 2 36 40 22 ~
United States 3 31 35 31 ~
White (not of Hispanic origin) Oregon 2 41 35 22 ~
United States 2 40 36 21 ~
Legend ~ Not reported by U.S. Department of Education # Rounds to zero * Value is significantly different from OR
Achievement level results from the 2009 NAEP grade 4 science assessment show that, in comparison with their peers in the nation as a whole, a smaller percentage of Oregon 4th grade Students with Disabilities performed at the "Below Basic" level and a larger percentage performed at the "Proficient" level. However, a larger percentage of Oregon White 4th graders performed at the "Below Basic" level and a smaller percentage at the "Proficient" level, than White students in the nation as a whole. Achievement level results from the 2011 NAEP grade 8 science assessment show that smaller percentages of all Oregon 8th graders as well as Economically Disadvantaged, Female, and Male students performed "Below Basic" than their peers in the nation as a whole. Larger percentages of all Oregon 8th graders as well as Economically Disadvantaged and Female students reached the "Proficient" level than their peers in the nation as a whole.
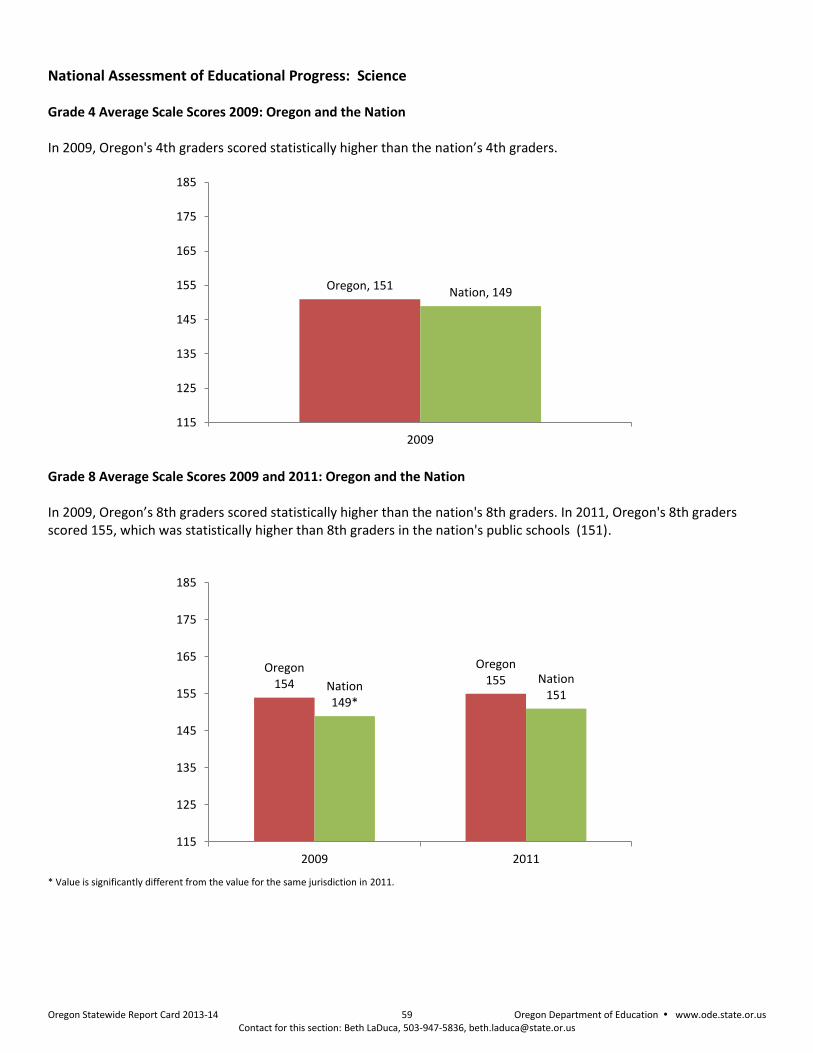
Oregon Statewide Report Card 2013-14 59 Oregon Department of Education www.ode.state.or.us Contact for this section: Beth LaDuca, 503-947-5836, [email protected]
National Assessment of Educational Progress: Science Grade 4 Average Scale Scores 2009: Oregon and the Nation In 2009, Oregon's 4th graders scored statistically higher than the nation’s 4th graders.
Grade 8 Average Scale Scores 2009 and 2011: Oregon and the Nation In 2009, Oregon’s 8th graders scored statistically higher than the nation's 8th graders. In 2011, Oregon's 8th graders scored 155, which was statistically higher than 8th graders in the nation's public schools (151).
* Value is significantly different from the value for the same jurisdiction in 2011.
Oregon, 151 Nation, 149
115
125
135
145
155
165
175
185
2009
Oregon 154
Oregon 155 Nation
149*
Nation 151
115
125
135
145
155
165
175
185
2009 2011
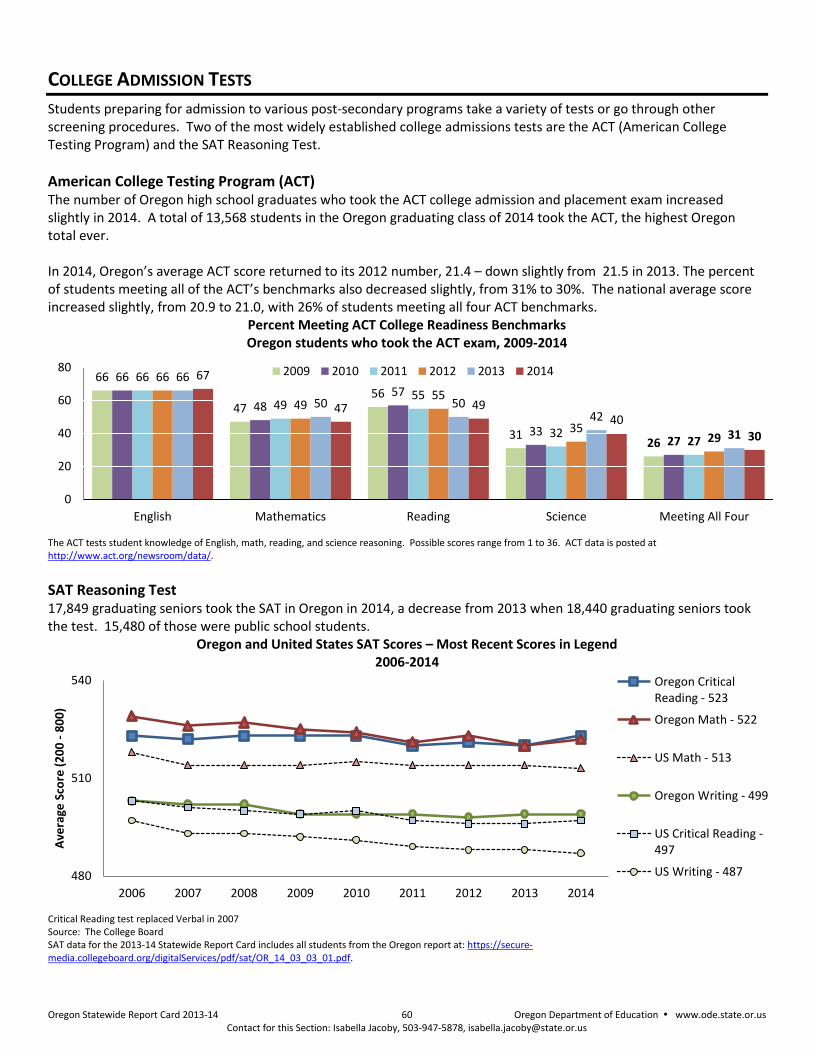
Oregon Statewide Report Card 2013-14 60 Oregon Department of Education www.ode.state.or.us Contact for this Section: Isabella Jacoby, 503-947-5878, [email protected]
COLLEGE ADMISSION TESTS
Students preparing for admission to various post-secondary programs take a variety of tests or go through other screening procedures. Two of the most widely established college admissions tests are the ACT (American College Testing Program) and the SAT Reasoning Test.
American College Testing Program (ACT) The number of Oregon high school graduates who took the ACT college admission and placement exam increased slightly in 2014. A total of 13,568 students in the Oregon graduating class of 2014 took the ACT, the highest Oregon total ever. In 2014, Oregon’s average ACT score returned to its 2012 number, 21.4 – down slightly from 21.5 in 2013. The percent of students meeting all of the ACT’s benchmarks also decreased slightly, from 31% to 30%. The national average score increased slightly, from 20.9 to 21.0, with 26% of students meeting all four ACT benchmarks.
Percent Meeting ACT College Readiness Benchmarks Oregon students who took the ACT exam, 2009-2014
The ACT tests student knowledge of English, math, reading, and science reasoning. Possible scores range from 1 to 36. ACT data is posted at http://www.act.org/newsroom/data/.
SAT Reasoning Test 17,849 graduating seniors took the SAT in Oregon in 2014, a decrease from 2013 when 18,440 graduating seniors took the test. 15,480 of those were public school students.
Oregon and United States SAT Scores – Most Recent Scores in Legend 2006-2014
Critical Reading test replaced Verbal in 2007 Source: The College Board SAT data for the 2013-14 Statewide Report Card includes all students from the Oregon report at: https://secure-media.collegeboard.org/digitalServices/pdf/sat/OR_14_03_03_01.pdf.
66
47 56
31 26
66
48 57
33 27
66
49 55
32 27
66
49 55
35 29
66
50 50 42
31
67
47 49 40
30
0
20
40
60
80
English Mathematics Reading Science Meeting All Four
2009 2010 2011 2012 2013 2014
480
510
540
2006 2007 2008 2009 2010 2011 2012 2013 2014
Ave
rage
Sco
re (
20
0 -
80
0)
Oregon CriticalReading - 523
Oregon Math - 522
US Math - 513
Oregon Writing - 499
US Critical Reading -497
US Writing - 487

Oregon Statewide Report Card 2013-14 61 Oregon Department of Education www.ode.state.or.us Contact for this Section: Isabella Jacoby, 503-947-5878, [email protected]
Advanced Placement (AP) Exams Although these exams are not required for college admission, students may choose to take them while in high school. Many colleges and universities offer course credit for certain scores on AP exams. The number of exams taken by Oregon students has more than doubled since 2005, according to data provided by the College Board. Oregon’s average score has been between 2.9 and 3.0 for the last 10 years, slightly above the national average. AP Scores “In general, the AP composite score cutpoints are set so that the lowest composite score for an AP score of 5 is equivalent to the average score for college students earning scores of A. Similarly, the lowest composite scores for AP scores of 4, 3, and 2 are equivalent to the average scores for students with college scores of B, C, and D, respectively. Students who earn AP Exam scores of 3 or above are generally considered to be qualified to receive college credit and/or placement into advanced courses due to the fact that their AP Exam scores are equivalent to a college course score of "middle C " or above. However, the awarding of credit and placement is determined by each college or university and students should check with the institution to verify its AP credit and placement policies.” – The College Board.
Tests by AP Subject, 2013-14
“Other” includes 22 subjects with fewer than 1,000 total tests taken. See http://research.collegeboard.org/programs/ap/data for more information and counts for all subjects.
1,184 1,336 1,474
2,112
3,112
1,436
3,092
1,785
3,438
1,102 1,096
5,843
842 907 972 1,366
1,917
842
1,761
1,016
1,879
597 515
4,037
Stat
isti
cs
Bio
logy
Psy
cho
logy
Cal
culu
s A
B
Engl
ish
Lan
g-&
Co
mp
osi
tio
n
Hu
man
Geo
grap
hy
Engl
ish
Lit
-&
Co
mp
osi
tio
n
Go
vern
me
nt
& P
olit
ics
U.S
.
U.S
. His
tory
Euro
pe
anH
isto
ry
Ch
em
istr
y
Oth
er
TotalTests
Testswith aScoreof 3 orHigher
12,452
14,505
17,231 19,232 19,944
22,339 24,045
24,898 26,158
27,010
0
5,000
10,000
15,000
20,000
25,000
30,000
2005 2006 2007 2008 2009 2010 2011 2012 2013 2014
Nu
mb
er
of
Test
s
Test Year
Oregon AP Scores (All AP Subjects)
5 - ExtremelyWell Qualified
4 - Well Qualified
3 - Qualified
2 - PossiblyQualified
1 - NoRecommendation
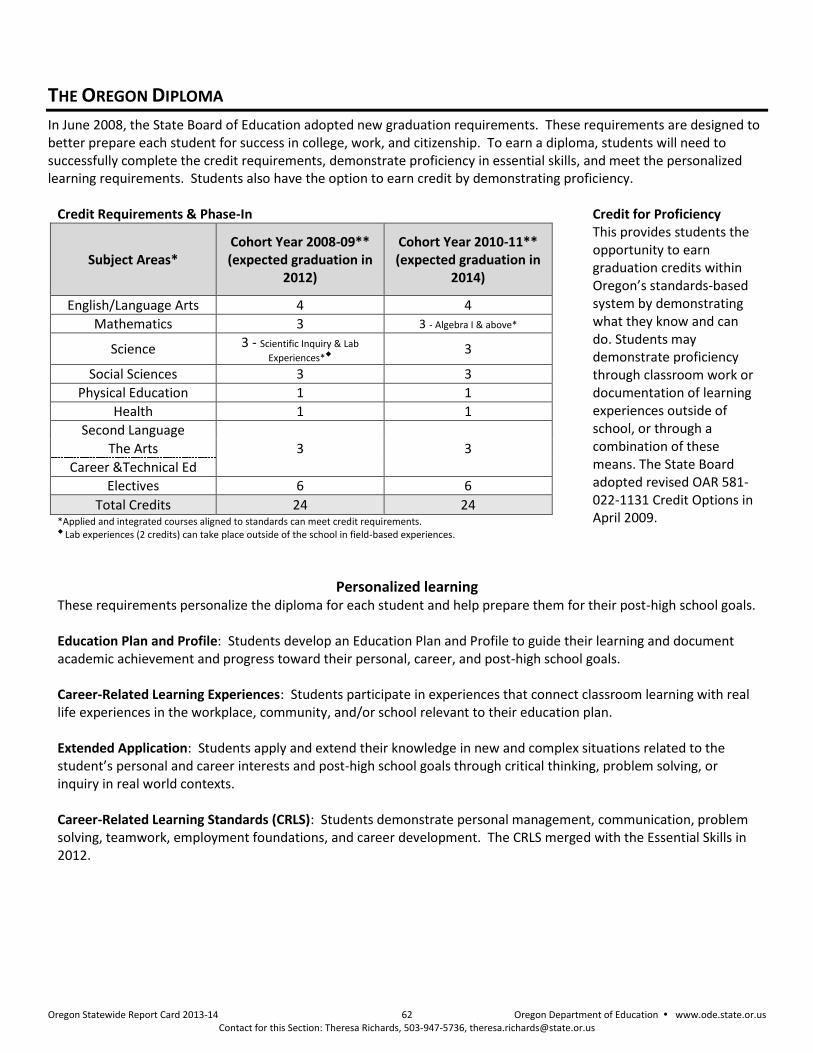
Oregon Statewide Report Card 2013-14 62 Oregon Department of Education www.ode.state.or.us Contact for this Section: Theresa Richards, 503-947-5736, [email protected]
THE OREGON DIPLOMA
In June 2008, the State Board of Education adopted new graduation requirements. These requirements are designed to better prepare each student for success in college, work, and citizenship. To earn a diploma, students will need to successfully complete the credit requirements, demonstrate proficiency in essential skills, and meet the personalized learning requirements. Students also have the option to earn credit by demonstrating proficiency.
Credit Requirements & Phase-In
Subject Areas* Cohort Year 2008-09** (expected graduation in
2012)
Cohort Year 2010-11** (expected graduation in
2014)
English/Language Arts 4 4
Mathematics 3 3 - Algebra I & above*
Science 3 - Scientific Inquiry & Lab
Experiences* 3
Social Sciences 3 3
Physical Education 1 1
Health 1 1
Second Language
3 3 The Arts
Career &Technical Ed
Electives 6 6
Total Credits 24 24 *Applied and integrated courses aligned to standards can meet credit requirements. Lab experiences (2 credits) can take place outside of the school in field-based experiences.
Credit for Proficiency This provides students the opportunity to earn graduation credits within Oregon’s standards-based system by demonstrating what they know and can do. Students may demonstrate proficiency through classroom work or documentation of learning experiences outside of school, or through a combination of these means. The State Board adopted revised OAR 581-022-1131 Credit Options in April 2009.
Personalized learning These requirements personalize the diploma for each student and help prepare them for their post-high school goals. Education Plan and Profile: Students develop an Education Plan and Profile to guide their learning and document academic achievement and progress toward their personal, career, and post-high school goals. Career-Related Learning Experiences: Students participate in experiences that connect classroom learning with real life experiences in the workplace, community, and/or school relevant to their education plan. Extended Application: Students apply and extend their knowledge in new and complex situations related to the student’s personal and career interests and post-high school goals through critical thinking, problem solving, or inquiry in real world contexts. Career-Related Learning Standards (CRLS): Students demonstrate personal management, communication, problem solving, teamwork, employment foundations, and career development. The CRLS merged with the Essential Skills in 2012.
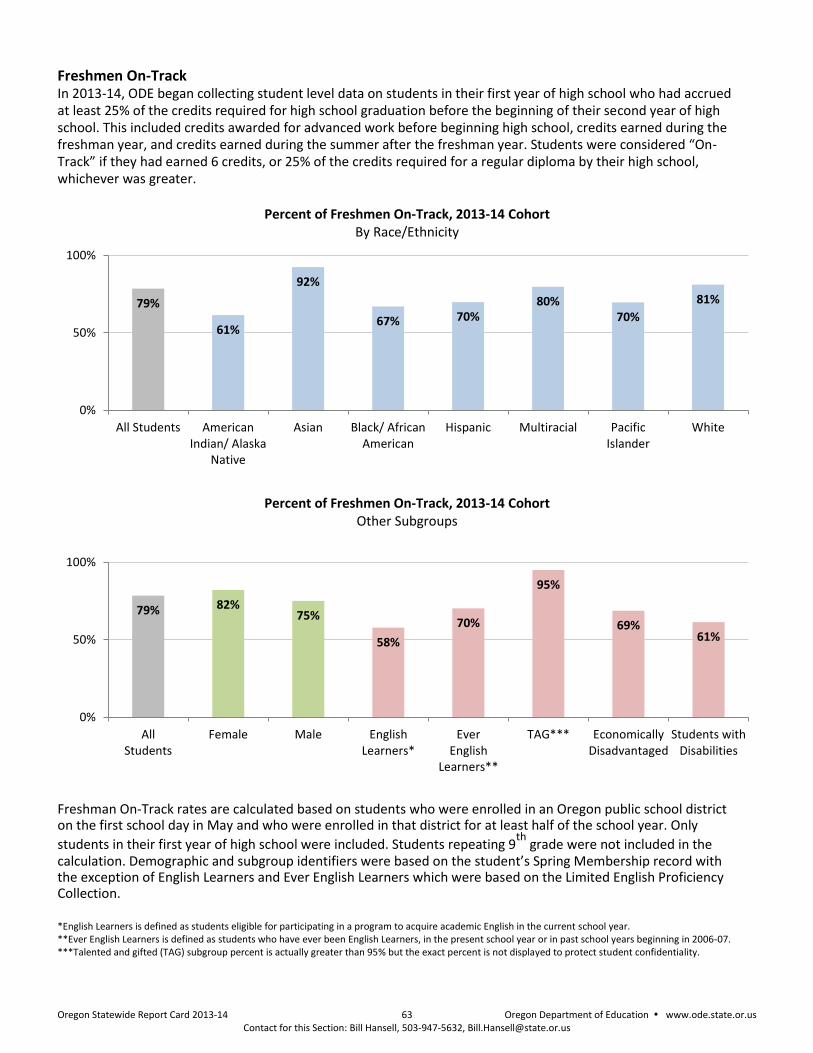
Oregon Statewide Report Card 2013-14 63 Oregon Department of Education www.ode.state.or.us Contact for this Section: Bill Hansell, 503-947-5632, [email protected]
Freshmen On-Track In 2013-14, ODE began collecting student level data on students in their first year of high school who had accrued at least 25% of the credits required for high school graduation before the beginning of their second year of high school. This included credits awarded for advanced work before beginning high school, credits earned during the freshman year, and credits earned during the summer after the freshman year. Students were considered “On-Track” if they had earned 6 credits, or 25% of the credits required for a regular diploma by their high school, whichever was greater.
Percent of Freshmen On-Track, 2013-14 Cohort By Race/Ethnicity
Percent of Freshmen On-Track, 2013-14 Cohort Other Subgroups
Freshman On-Track rates are calculated based on students who were enrolled in an Oregon public school district on the first school day in May and who were enrolled in that district for at least half of the school year. Only
students in their first year of high school were included. Students repeating 9th
grade were not included in the calculation. Demographic and subgroup identifiers were based on the student’s Spring Membership record with the exception of English Learners and Ever English Learners which were based on the Limited English Proficiency Collection. *English Learners is defined as students eligible for participating in a program to acquire academic English in the current school year. **Ever English Learners is defined as students who have ever been English Learners, in the present school year or in past school years beginning in 2006-07. ***Talented and gifted (TAG) subgroup percent is actually greater than 95% but the exact percent is not displayed to protect student confidentiality.
79%
61%
92%
67% 70% 80%
70%
81%
0%
50%
100%
All Students AmericanIndian/ Alaska
Native
Asian Black/ AfricanAmerican
Hispanic Multiracial PacificIslander
White
79% 82% 75%
58%
70%
95%
69% 61%
0%
50%
100%
AllStudents
Female Male EnglishLearners*
EverEnglish
Learners**
TAG*** EconomicallyDisadvantaged
Students withDisabilities
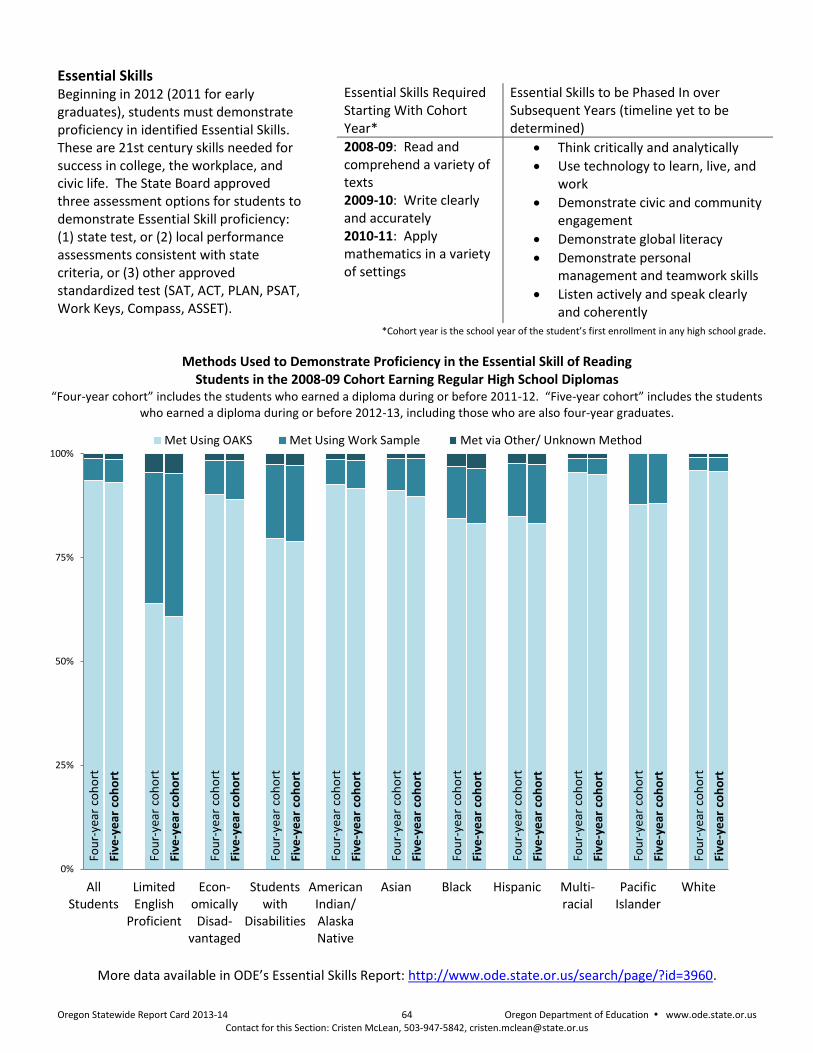
Oregon Statewide Report Card 2013-14 64 Oregon Department of Education www.ode.state.or.us Contact for this Section: Cristen McLean, 503-947-5842, [email protected]
Essential Skills Beginning in 2012 (2011 for early graduates), students must demonstrate proficiency in identified Essential Skills. These are 21st century skills needed for success in college, the workplace, and civic life. The State Board approved three assessment options for students to demonstrate Essential Skill proficiency: (1) state test, or (2) local performance assessments consistent with state criteria, or (3) other approved standardized test (SAT, ACT, PLAN, PSAT, Work Keys, Compass, ASSET).
Essential Skills Required Starting With Cohort Year*
Essential Skills to be Phased In over Subsequent Years (timeline yet to be determined)
2008-09: Read and comprehend a variety of texts 2009-10: Write clearly and accurately 2010-11: Apply mathematics in a variety of settings
Think critically and analytically
Use technology to learn, live, and work
Demonstrate civic and community engagement
Demonstrate global literacy
Demonstrate personal management and teamwork skills
Listen actively and speak clearly and coherently
*Cohort year is the school year of the student’s first enrollment in any high school grade.
Methods Used to Demonstrate Proficiency in the Essential Skill of Reading Students in the 2008-09 Cohort Earning Regular High School Diplomas
“Four-year cohort” includes the students who earned a diploma during or before 2011-12. “Five-year cohort” includes the students who earned a diploma during or before 2012-13, including those who are also four-year graduates.
More data available in ODE’s Essential Skills Report: http://www.ode.state.or.us/search/page/?id=3960.
Fou
r-ye
ar c
oh
ort
Five
-ye
ar c
oh
ort
Fou
r-ye
ar c
oh
ort
Five
-ye
ar c
oh
ort
Fou
r-ye
ar c
oh
ort
Five
-ye
ar c
oh
ort
Fou
r-ye
ar c
oh
ort
Five
-ye
ar c
oh
ort
Fou
r-ye
ar c
oh
ort
Five
-ye
ar c
oh
ort
Fou
r-ye
ar c
oh
ort
Five
-ye
ar c
oh
ort
Fou
r-ye
ar c
oh
ort
Five
-ye
ar c
oh
ort
Fou
r-ye
ar c
oh
ort
Five
-ye
ar c
oh
ort
Fou
r-ye
ar c
oh
ort
Five
-ye
ar c
oh
ort
Fou
r-ye
ar c
oh
ort
Five
-ye
ar c
oh
ort
Fou
r-ye
ar c
oh
ort
Five
-ye
ar c
oh
ort
0%
25%
50%
75%
100%
AllStudents
LimitedEnglish
Proficient
Econ-omicallyDisad-
vantaged
Studentswith
Disabilities
AmericanIndian/AlaskaNative
Asian Black Hispanic Multi-racial
PacificIslander
White
Met Using OAKS Met Using Work Sample Met via Other/ Unknown Method
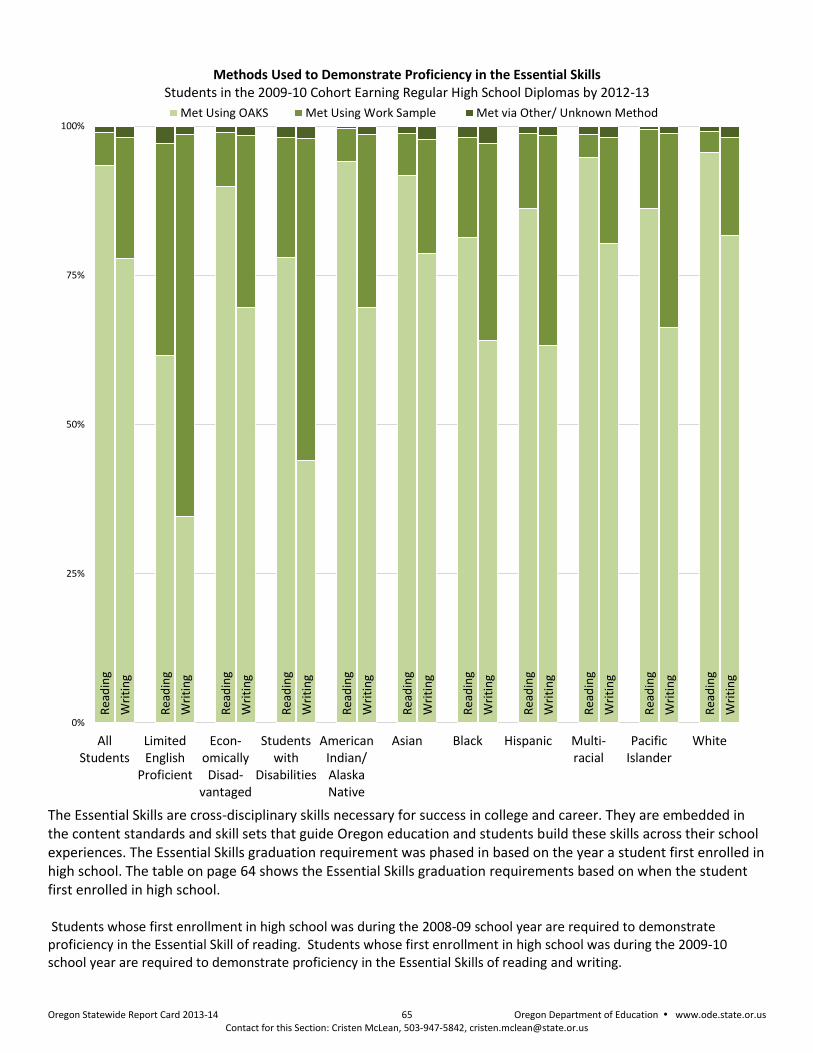
Oregon Statewide Report Card 2013-14 65 Oregon Department of Education www.ode.state.or.us Contact for this Section: Cristen McLean, 503-947-5842, [email protected]
Methods Used to Demonstrate Proficiency in the Essential Skills Students in the 2009-10 Cohort Earning Regular High School Diplomas by 2012-13
The Essential Skills are cross-disciplinary skills necessary for success in college and career. They are embedded in the content standards and skill sets that guide Oregon education and students build these skills across their school experiences. The Essential Skills graduation requirement was phased in based on the year a student first enrolled in high school. The table on page 64 shows the Essential Skills graduation requirements based on when the student first enrolled in high school. Students whose first enrollment in high school was during the 2008-09 school year are required to demonstrate proficiency in the Essential Skill of reading. Students whose first enrollment in high school was during the 2009-10 school year are required to demonstrate proficiency in the Essential Skills of reading and writing.
Rea
din
g
Wri
tin
g
Rea
din
g
Wri
tin
g
Rea
din
g
Wri
tin
g
Rea
din
g
Wri
tin
g
Rea
din
g
Wri
tin
g
Rea
din
g
Wri
tin
g
Rea
din
g
Wri
tin
g
Rea
din
g
Wri
tin
g
Rea
din
g
Wri
tin
g
Rea
din
g
Wri
tin
g
Rea
din
g
Wri
tin
g 0%
25%
50%
75%
100%
AllStudents
LimitedEnglish
Proficient
Econ-omicallyDisad-
vantaged
Studentswith
Disabilities
AmericanIndian/AlaskaNative
Asian Black Hispanic Multi-racial
PacificIslander
White
Met Using OAKS Met Using Work Sample Met via Other/ Unknown Method
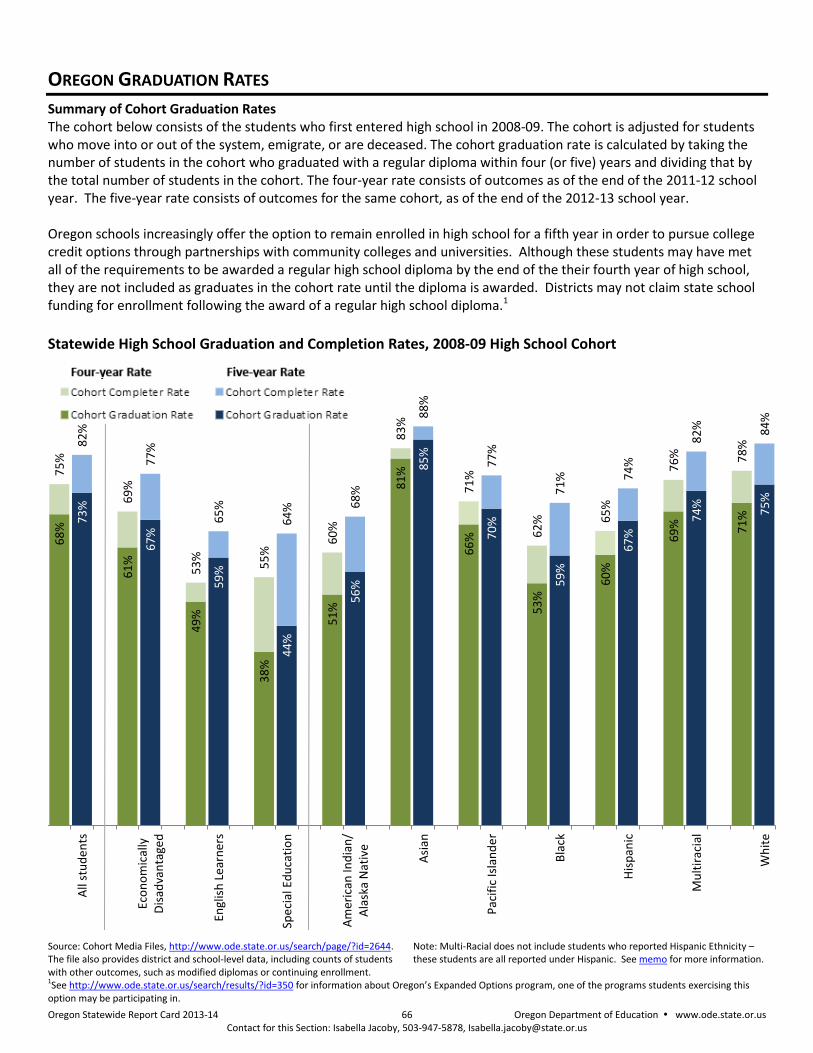
Oregon Statewide Report Card 2013-14 66 Oregon Department of Education www.ode.state.or.us Contact for this Section: Isabella Jacoby, 503-947-5878, [email protected]
OREGON GRADUATION RATES
Summary of Cohort Graduation Rates The cohort below consists of the students who first entered high school in 2008-09. The cohort is adjusted for students who move into or out of the system, emigrate, or are deceased. The cohort graduation rate is calculated by taking the number of students in the cohort who graduated with a regular diploma within four (or five) years and dividing that by the total number of students in the cohort. The four-year rate consists of outcomes as of the end of the 2011-12 school year. The five-year rate consists of outcomes for the same cohort, as of the end of the 2012-13 school year. Oregon schools increasingly offer the option to remain enrolled in high school for a fifth year in order to pursue college credit options through partnerships with community colleges and universities. Although these students may have met all of the requirements to be awarded a regular high school diploma by the end of the their fourth year of high school, they are not included as graduates in the cohort rate until the diploma is awarded. Districts may not claim state school funding for enrollment following the award of a regular high school diploma.1
Statewide High School Graduation and Completion Rates, 2008-09 High School Cohort
Source: Cohort Media Files, http://www.ode.state.or.us/search/page/?id=2644. The file also provides district and school-level data, including counts of students with other outcomes, such as modified diplomas or continuing enrollment.
Note: Multi-Racial does not include students who reported Hispanic Ethnicity – these students are all reported under Hispanic. See memo for more information.
1See http://www.ode.state.or.us/search/results/?id=350 for information about Oregon’s Expanded Options program, one of the programs students exercising this option may be participating in.
68
% 73
%
61
% 6
7%
49
%
59
%
38
% 4
4%
51
% 5
6%
81
% 85
%
66
%
70
%
53
% 5
9%
60
%
67
%
69
% 74
%
71
% 75
%
75
% 8
2%
69
%
77
%
53
%
65
%
55
%
64
%
60
%
68
%
83
% 88
%
71
% 7
7%
62
%
71
%
65
%
74
%
76
% 8
2%
78
% 8
4%
All
stu
de
nts
Eco
no
mic
ally
Dis
adva
nta
ged
Engl
ish
Le
arn
ers
Spe
cial
Ed
uca
tio
n
Am
eric
an In
dia
n/
Ala
ska
Nat
ive
Asi
an
Pac
ific
Isla
nd
er
Bla
ck
His
pan
ic
Mu
ltir
acia
l
Wh
ite

Oregon Statewide Report Card 2013-14 67 Oregon Department of Education www.ode.state.or.us Contact for this Section: Isabella Jacoby, 503-947-5878, [email protected]
Statewide High School Graduation and Completion Rates, 2009-10 High School Cohort Outcomes as of the end of the 2012-13 school year
The four-year cohort graduation rate is the percentage of students in the adjusted cohort who graduated with a regular diploma within four years of entering high school. The cohort completer rate shown below includes those students who graduated with a regular diploma, as well as those who earned a modified, extended, or adult high school diploma, or a GED within the same time period. Students who earned multiple credentials are not counted more than once. Regular Diploma: Diploma earned when students have fulfilled all school district requirements and state requirements as described in ORS 329.451 and OAR 581-022-1130. See page 62 for details. Modified Diploma, Extended Diploma, Alternative Certificate: Diploma/credential received by students who have met the requirements as defined in ORS 329.451 and OAR 581-022-1133 through 1135.
Source: Oregon Department of Education, Cohort Media File (more details available at http://www.ode.state.or.us/search/page/?id=2644)
31,440 14,783
2,333
1,575 455
1,470
175 734 5,083
1,352 22,171
2,055
1,295
260
52
50
12
9
54 281
101 1,548
847
618
795 110
20
19
5 38 182
25 558
11,449 7,794
2,891 1,469 356
253
86 460 2,815
534 6,945
0%
25%
50%
75%
100%
Tota
l
Eco
no
mic
ally
Dis
adva
nta
ged
Engl
ish
Le
arn
ers
Spe
cial
Ed
uca
tio
n
Am
eric
an In
dia
n/
Ala
ska
Nat
ive
Asi
an
Nat
ive
Haw
aiia
n/
Pac
ific
Isla
nd
er
Bla
ck
His
pan
ic
Mu
ltir
acia
l
Wh
ite
Non-completers(ContinuingEnrollment,AlternativeCertificates, orDropouts)
Other Completers(Modified Diploma,Adult High SchoolDiploma, ExtendedDiploma)
Other Completers(GED)
Regular High SchoolDiploma
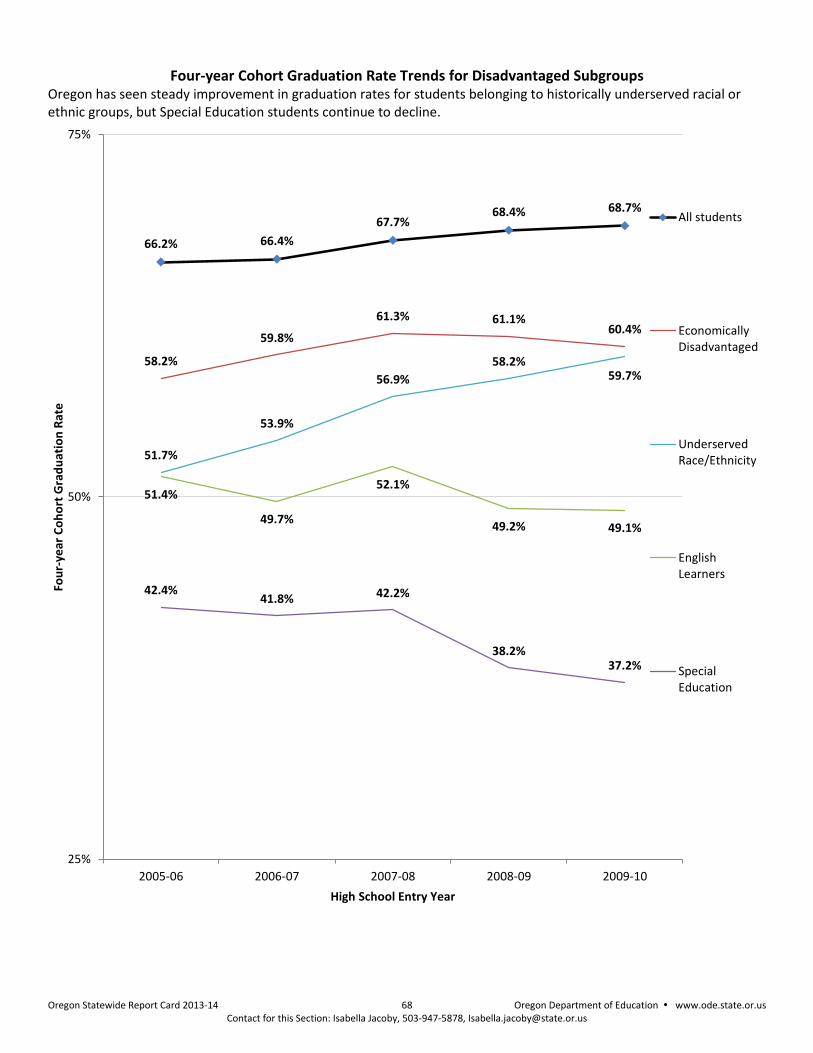
Oregon Statewide Report Card 2013-14 68 Oregon Department of Education www.ode.state.or.us Contact for this Section: Isabella Jacoby, 503-947-5878, [email protected]
Four-year Cohort Graduation Rate Trends for Disadvantaged Subgroups Oregon has seen steady improvement in graduation rates for students belonging to historically underserved racial or ethnic groups, but Special Education students continue to decline.
66.2% 66.4%
67.7% 68.4% 68.7%
58.2%
59.8%
61.3% 61.1% 60.4%
51.7%
53.9%
56.9%
58.2% 59.7%
51.4%
49.7%
52.1%
49.2% 49.1%
42.4% 41.8% 42.2%
38.2% 37.2%
25%
50%
75%
2005-06 2006-07 2007-08 2008-09 2009-10
Fou
r-ye
ar C
oh
ort
Gra
du
atio
n R
ate
High School Entry Year
All students
EconomicallyDisadvantaged
UnderservedRace/Ethnicity
EnglishLearners
SpecialEducation
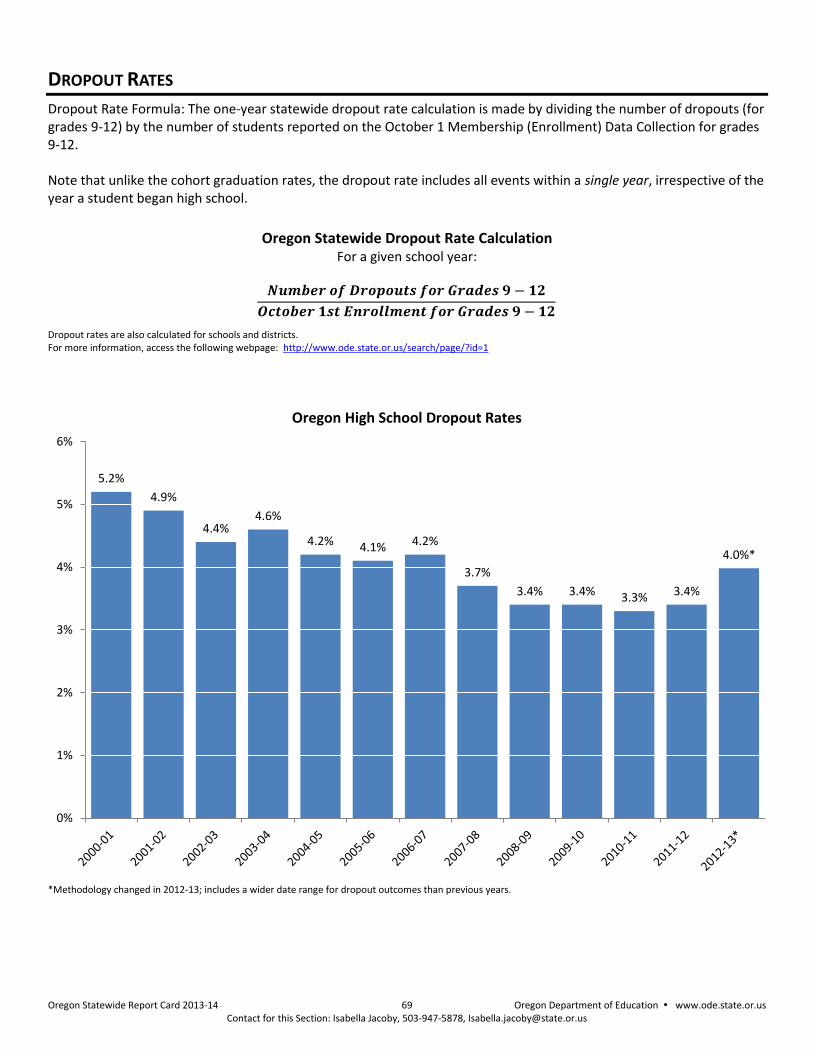
Oregon Statewide Report Card 2013-14 69 Oregon Department of Education www.ode.state.or.us Contact for this Section: Isabella Jacoby, 503-947-5878, [email protected]
DROPOUT RATES
Dropout Rate Formula: The one-year statewide dropout rate calculation is made by dividing the number of dropouts (for grades 9-12) by the number of students reported on the October 1 Membership (Enrollment) Data Collection for grades 9-12. Note that unlike the cohort graduation rates, the dropout rate includes all events within a single year, irrespective of the year a student began high school.
Oregon Statewide Dropout Rate Calculation For a given school year:
Dropout rates are also calculated for schools and districts. For more information, access the following webpage: http://www.ode.state.or.us/search/page/?id=1
Oregon High School Dropout Rates
*Methodology changed in 2012-13; includes a wider date range for dropout outcomes than previous years.
5.2%
4.9%
4.4% 4.6%
4.2% 4.1% 4.2%
3.7%
3.4% 3.4% 3.3% 3.4%
4.0%*
0%
1%
2%
3%
4%
5%
6%
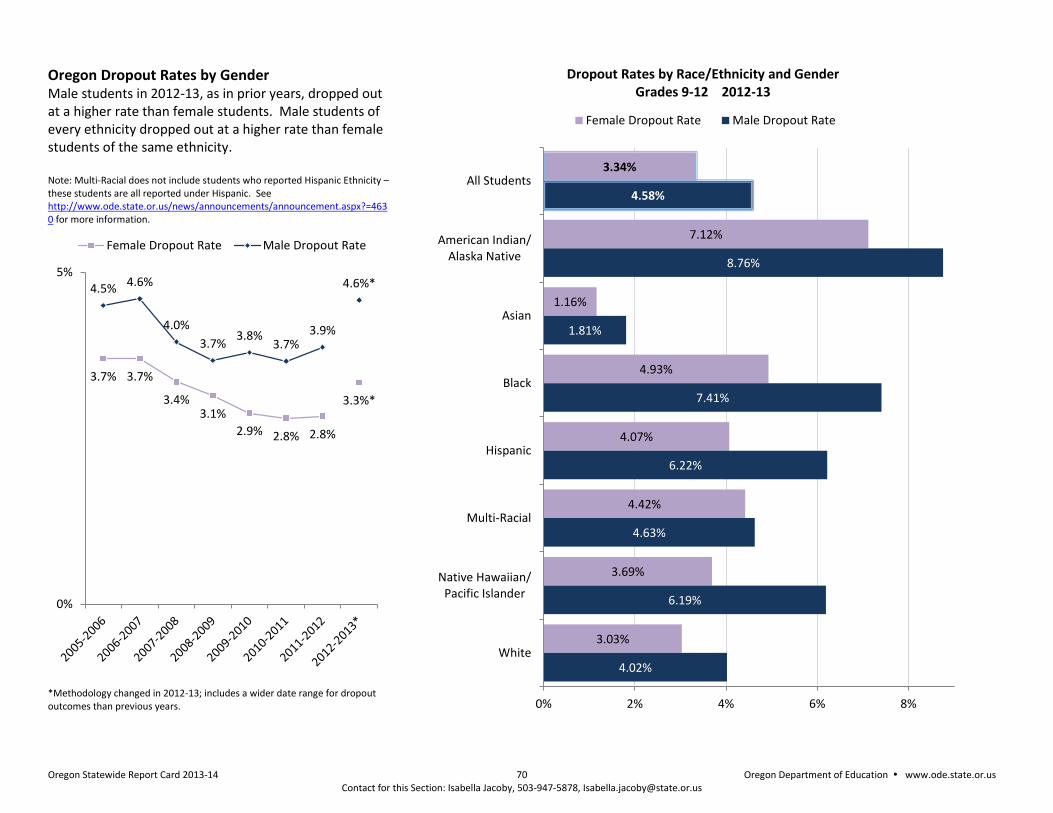
Oregon Statewide Report Card 2013-14 70 Oregon Department of Education www.ode.state.or.us Contact for this Section: Isabella Jacoby, 503-947-5878, [email protected]
Oregon Dropout Rates by Gender Male students in 2012-13, as in prior years, dropped out at a higher rate than female students. Male students of every ethnicity dropped out at a higher rate than female students of the same ethnicity. Note: Multi-Racial does not include students who reported Hispanic Ethnicity – these students are all reported under Hispanic. See http://www.ode.state.or.us/news/announcements/announcement.aspx?=4630 for more information.
*Methodology changed in 2012-13; includes a wider date range for dropout outcomes than previous years.
Dropout Rates by Race/Ethnicity and Gender Grades 9-12 2012-13
3.7% 3.7%
3.4% 3.1%
2.9% 2.8% 2.8%
3.3%*
4.5% 4.6%
4.0%
3.7% 3.8%
3.7% 3.9%
4.6%*
0%
5%
Female Dropout Rate Male Dropout Rate
3.34%
7.12%
1.16%
4.93%
4.07%
4.42%
3.69%
3.03%
4.58%
8.76%
1.81%
7.41%
6.22%
4.63%
6.19%
4.02%
0% 2% 4% 6% 8%
All Students
American Indian/Alaska Native
Asian
Black
Hispanic
Multi-Racial
Native Hawaiian/Pacific Islander
White
Female Dropout Rate Male Dropout Rate
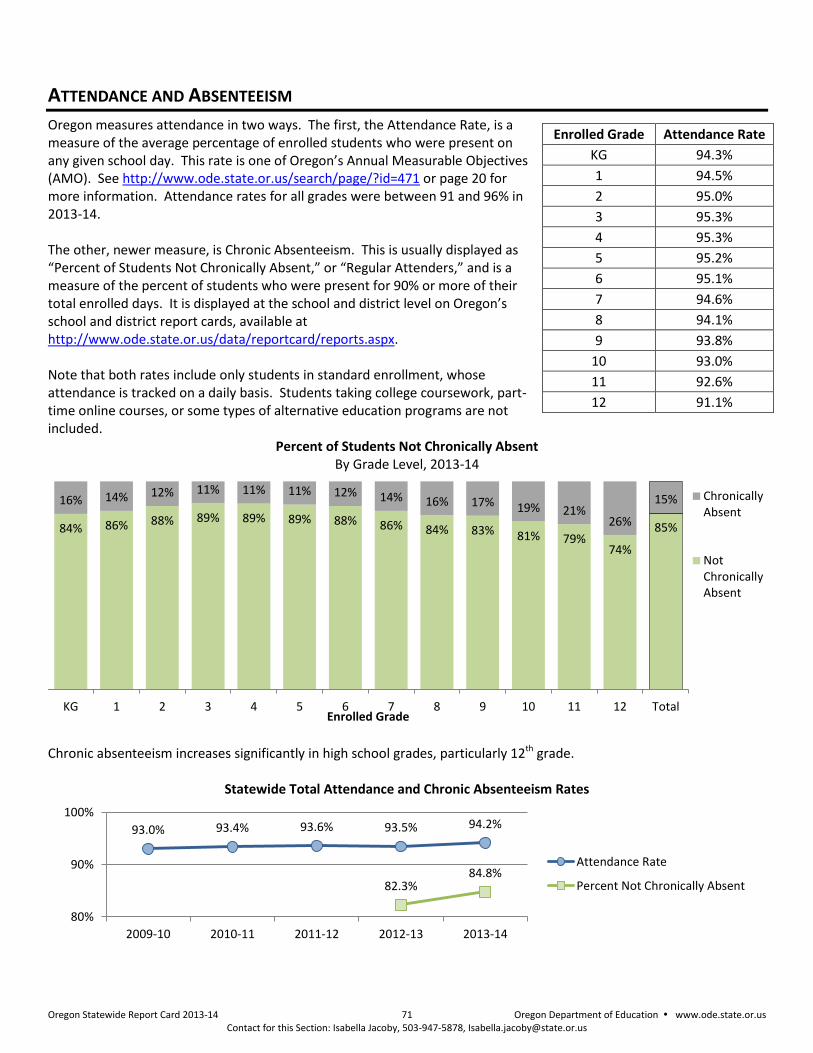
Oregon Statewide Report Card 2013-14 71 Oregon Department of Education www.ode.state.or.us Contact for this Section: Isabella Jacoby, 503-947-5878, [email protected]
ATTENDANCE AND ABSENTEEISM
Oregon measures attendance in two ways. The first, the Attendance Rate, is a measure of the average percentage of enrolled students who were present on any given school day. This rate is one of Oregon’s Annual Measurable Objectives (AMO). See http://www.ode.state.or.us/search/page/?id=471 or page 20 for more information. Attendance rates for all grades were between 91 and 96% in 2013-14. The other, newer measure, is Chronic Absenteeism. This is usually displayed as “Percent of Students Not Chronically Absent,” or “Regular Attenders,” and is a measure of the percent of students who were present for 90% or more of their total enrolled days. It is displayed at the school and district level on Oregon’s school and district report cards, available at http://www.ode.state.or.us/data/reportcard/reports.aspx. Note that both rates include only students in standard enrollment, whose attendance is tracked on a daily basis. Students taking college coursework, part-time online courses, or some types of alternative education programs are not included.
Percent of Students Not Chronically Absent By Grade Level, 2013-14
Chronic absenteeism increases significantly in high school grades, particularly 12th grade.
Statewide Total Attendance and Chronic Absenteeism Rates
84% 86% 88% 89% 89% 89% 88% 86% 84% 83% 81% 79% 74%
85%
16% 14% 12% 11% 11% 11% 12% 14% 16% 17% 19% 21% 26%
15%
KG 1 2 3 4 5 6 7 8 9 10 11 12 TotalEnrolled Grade
ChronicallyAbsent
NotChronicallyAbsent
93.0% 93.4% 93.6% 93.5% 94.2%
82.3% 84.8%
80%
90%
100%
2009-10 2010-11 2011-12 2012-13 2013-14
Attendance Rate
Percent Not Chronically Absent
Enrolled Grade Attendance Rate
KG 94.3%
1 94.5%
2 95.0%
3 95.3%
4 95.3%
5 95.2%
6 95.1%
7 94.6%
8 94.1%
9 93.8%
10 93.0%
11 92.6%
12 91.1%
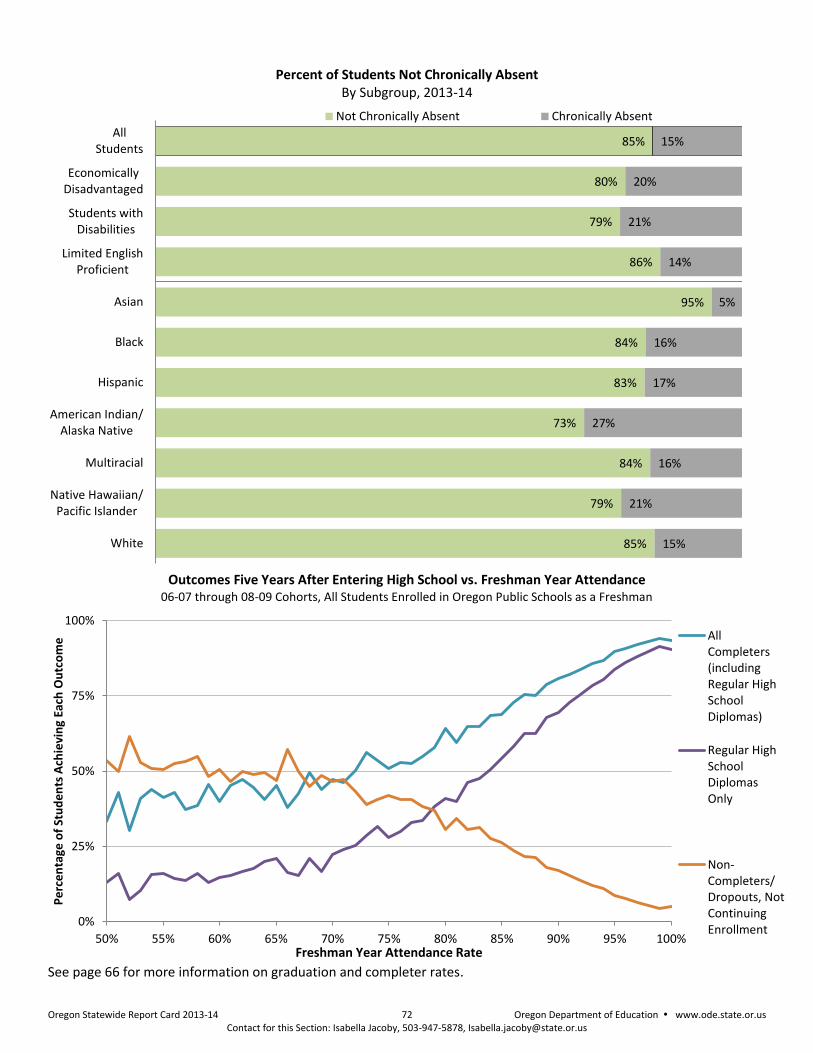
Oregon Statewide Report Card 2013-14 72 Oregon Department of Education www.ode.state.or.us Contact for this Section: Isabella Jacoby, 503-947-5878, [email protected]
Percent of Students Not Chronically Absent By Subgroup, 2013-14
Outcomes Five Years After Entering High School vs. Freshman Year Attendance 06-07 through 08-09 Cohorts, All Students Enrolled in Oregon Public Schools as a Freshman
See page 66 for more information on graduation and completer rates.
85%
80%
79%
86%
95%
84%
83%
73%
84%
79%
85%
15%
20%
21%
14%
5%
16%
17%
27%
16%
21%
15%
AllStudents
EconomicallyDisadvantaged
Students withDisabilities
Limited EnglishProficient
Asian
Black
Hispanic
American Indian/Alaska Native
Multiracial
Native Hawaiian/Pacific Islander
White
Not Chronically Absent Chronically Absent
0%
25%
50%
75%
100%
50% 55% 60% 65% 70% 75% 80% 85% 90% 95% 100%
Pe
rce
nta
ge o
f St
ud
en
ts A
chie
vin
g Ea
ch O
utc
om
e
Freshman Year Attendance Rate
AllCompleters(includingRegular HighSchoolDiplomas)
Regular HighSchoolDiplomasOnly
Non-Completers/Dropouts, NotContinuingEnrollment
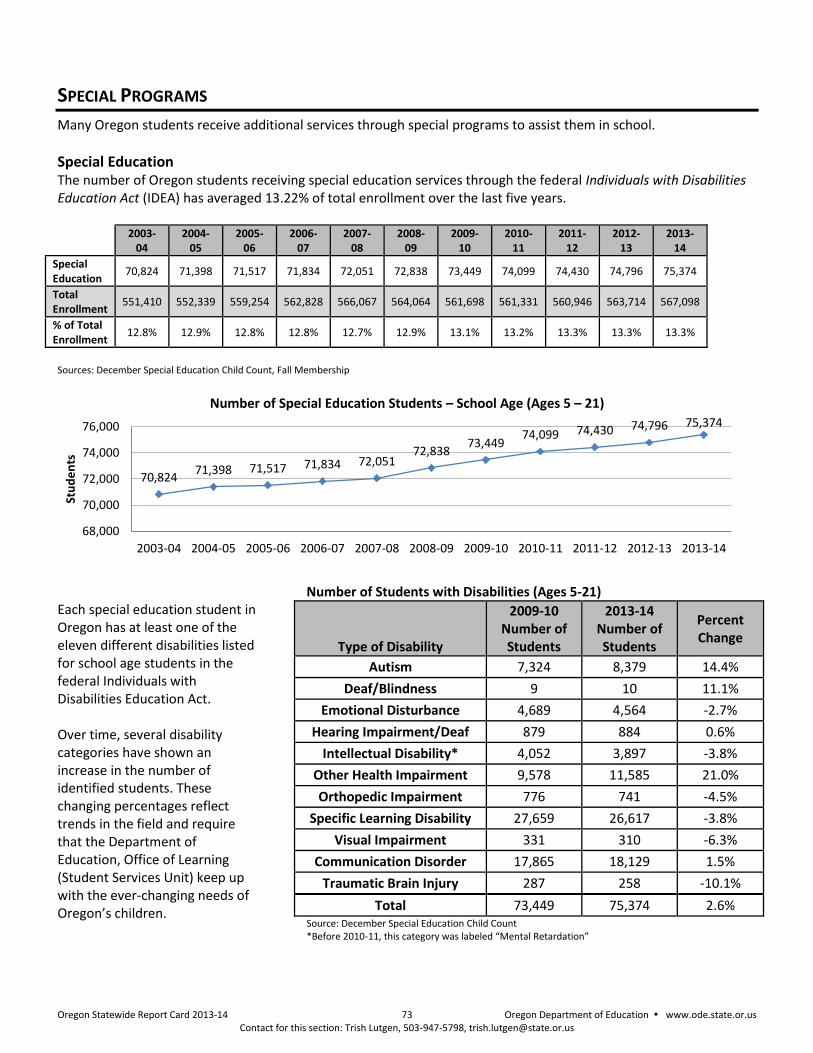
Oregon Statewide Report Card 2013-14 73 Oregon Department of Education www.ode.state.or.us Contact for this section: Trish Lutgen, 503-947-5798, [email protected]
SPECIAL PROGRAMS
Many Oregon students receive additional services through special programs to assist them in school.
Special Education The number of Oregon students receiving special education services through the federal Individuals with Disabilities Education Act (IDEA) has averaged 13.22% of total enrollment over the last five years.
2003-
04 2004-
05 2005-
06 2006-
07 2007-
08 2008-
09 2009-
10 2010-
11 2011-
12 2012-
13 2013-
14
Special Education
70,824 71,398 71,517 71,834 72,051 72,838 73,449 74,099 74,430 74,796 75,374
Total Enrollment
551,410 552,339 559,254 562,828 566,067 564,064 561,698 561,331 560,946 563,714 567,098
% of Total Enrollment
12.8% 12.9% 12.8% 12.8% 12.7% 12.9% 13.1% 13.2% 13.3% 13.3% 13.3%
Sources: December Special Education Child Count, Fall Membership
Number of Special Education Students – School Age (Ages 5 – 21)
Each special education student in Oregon has at least one of the eleven different disabilities listed for school age students in the federal Individuals with Disabilities Education Act. Over time, several disability categories have shown an increase in the number of identified students. These changing percentages reflect trends in the field and require that the Department of Education, Office of Learning (Student Services Unit) keep up with the ever-changing needs of Oregon’s children.
Number of Students with Disabilities (Ages 5-21)
Type of Disability
2009-10 Number of Students
2013-14 Number of Students
Percent Change
Autism 7,324 8,379 14.4%
Deaf/Blindness 9 10 11.1%
Emotional Disturbance 4,689 4,564 -2.7%
Hearing Impairment/Deaf 879 884 0.6%
Intellectual Disability* 4,052 3,897 -3.8%
Other Health Impairment 9,578 11,585 21.0%
Orthopedic Impairment 776 741 -4.5%
Specific Learning Disability 27,659 26,617 -3.8%
Visual Impairment 331 310 -6.3%
Communication Disorder 17,865 18,129 1.5%
Traumatic Brain Injury 287 258 -10.1%
Total 73,449 75,374 2.6% Source: December Special Education Child Count *Before 2010-11, this category was labeled “Mental Retardation”
70,824 71,398 71,517 71,834 72,051
72,838 73,449
74,099 74,430 74,796 75,374
68,000
70,000
72,000
74,000
76,000
2003-04 2004-05 2005-06 2006-07 2007-08 2008-09 2009-10 2010-11 2011-12 2012-13 2013-14
Stu
de
nts
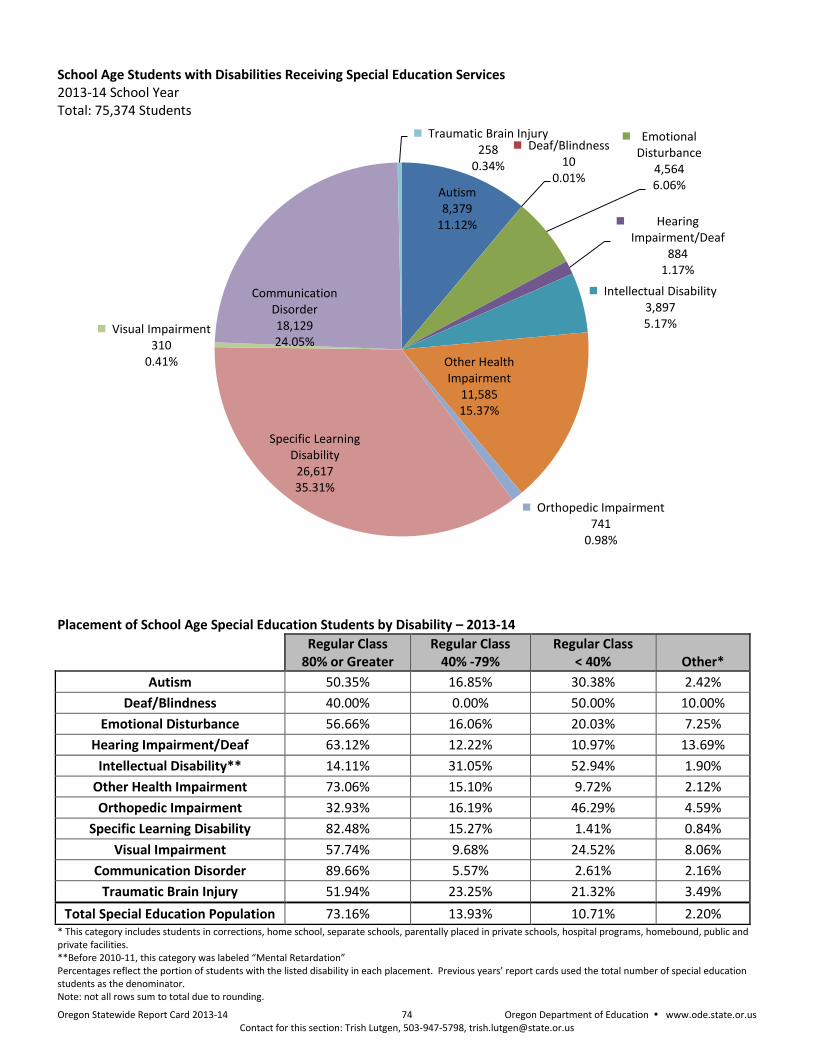
Oregon Statewide Report Card 2013-14 74 Oregon Department of Education www.ode.state.or.us Contact for this section: Trish Lutgen, 503-947-5798, [email protected]
School Age Students with Disabilities Receiving Special Education Services 2013-14 School Year Total: 75,374 Students
Placement of School Age Special Education Students by Disability – 2013-14
Regular Class
80% or Greater Regular Class
40% -79% Regular Class
< 40% Other*
Autism 50.35% 16.85% 30.38% 2.42%
Deaf/Blindness 40.00% 0.00% 50.00% 10.00%
Emotional Disturbance 56.66% 16.06% 20.03% 7.25%
Hearing Impairment/Deaf 63.12% 12.22% 10.97% 13.69%
Intellectual Disability** 14.11% 31.05% 52.94% 1.90%
Other Health Impairment 73.06% 15.10% 9.72% 2.12%
Orthopedic Impairment 32.93% 16.19% 46.29% 4.59%
Specific Learning Disability 82.48% 15.27% 1.41% 0.84%
Visual Impairment 57.74% 9.68% 24.52% 8.06%
Communication Disorder 89.66% 5.57% 2.61% 2.16%
Traumatic Brain Injury 51.94% 23.25% 21.32% 3.49%
Total Special Education Population 73.16% 13.93% 10.71% 2.20% * This category includes students in corrections, home school, separate schools, parentally placed in private schools, hospital programs, homebound, public and private facilities. **Before 2010-11, this category was labeled “Mental Retardation” Percentages reflect the portion of students with the listed disability in each placement. Previous years’ report cards used the total number of special education students as the denominator. Note: not all rows sum to total due to rounding.
Autism 8,379
11.12%
Deaf/Blindness 10
0.01%
Emotional Disturbance
4,564 6.06%
Hearing Impairment/Deaf
884 1.17%
Intellectual Disability 3,897 5.17%
Other Health Impairment
11,585 15.37%
Orthopedic Impairment 741
0.98%
Specific Learning Disability
26,617 35.31%
Visual Impairment 310
0.41%
Communication Disorder 18,129 24.05%
Traumatic Brain Injury 258
0.34%
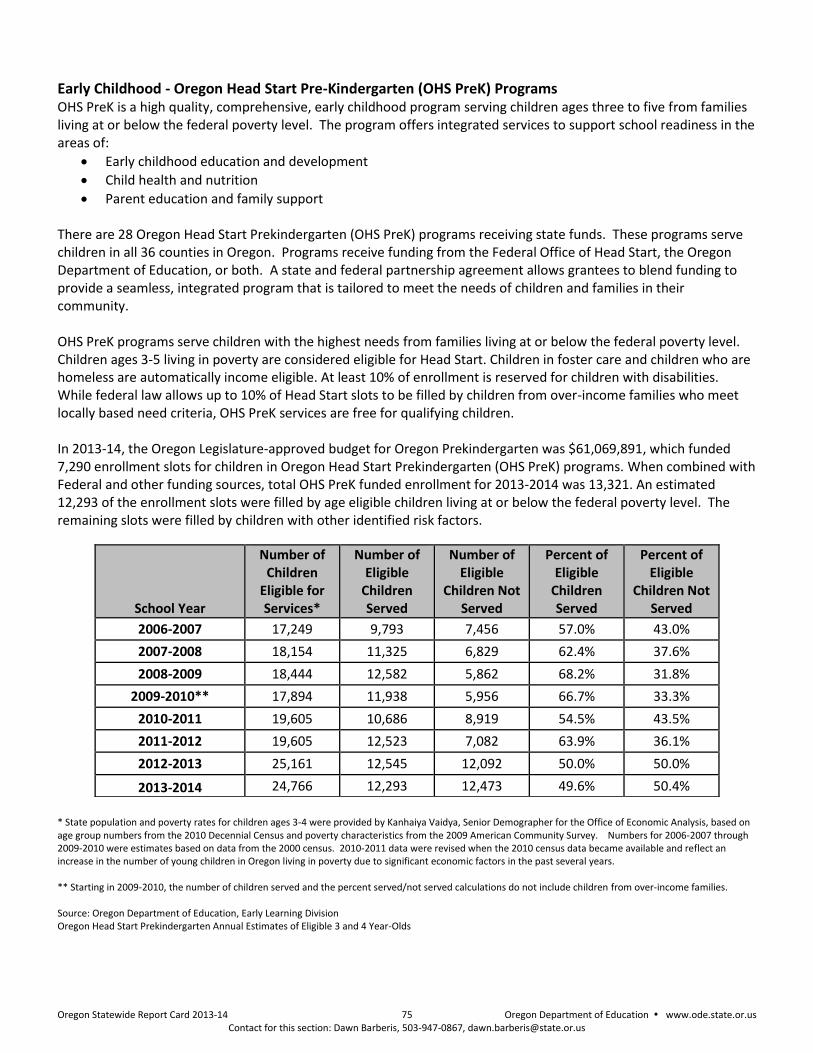
Oregon Statewide Report Card 2013-14 75 Oregon Department of Education www.ode.state.or.us Contact for this section: Dawn Barberis, 503-947-0867, [email protected]
Early Childhood - Oregon Head Start Pre-Kindergarten (OHS PreK) Programs OHS PreK is a high quality, comprehensive, early childhood program serving children ages three to five from families living at or below the federal poverty level. The program offers integrated services to support school readiness in the areas of:
Early childhood education and development
Child health and nutrition
Parent education and family support There are 28 Oregon Head Start Prekindergarten (OHS PreK) programs receiving state funds. These programs serve children in all 36 counties in Oregon. Programs receive funding from the Federal Office of Head Start, the Oregon Department of Education, or both. A state and federal partnership agreement allows grantees to blend funding to provide a seamless, integrated program that is tailored to meet the needs of children and families in their community. OHS PreK programs serve children with the highest needs from families living at or below the federal poverty level. Children ages 3-5 living in poverty are considered eligible for Head Start. Children in foster care and children who are homeless are automatically income eligible. At least 10% of enrollment is reserved for children with disabilities. While federal law allows up to 10% of Head Start slots to be filled by children from over-income families who meet locally based need criteria, OHS PreK services are free for qualifying children. In 2013-14, the Oregon Legislature-approved budget for Oregon Prekindergarten was $61,069,891, which funded 7,290 enrollment slots for children in Oregon Head Start Prekindergarten (OHS PreK) programs. When combined with Federal and other funding sources, total OHS PreK funded enrollment for 2013-2014 was 13,321. An estimated 12,293 of the enrollment slots were filled by age eligible children living at or below the federal poverty level. The remaining slots were filled by children with other identified risk factors.
* State population and poverty rates for children ages 3-4 were provided by Kanhaiya Vaidya, Senior Demographer for the Office of Economic Analysis, based on age group numbers from the 2010 Decennial Census and poverty characteristics from the 2009 American Community Survey. Numbers for 2006-2007 through 2009-2010 were estimates based on data from the 2000 census. 2010-2011 data were revised when the 2010 census data became available and reflect an increase in the number of young children in Oregon living in poverty due to significant economic factors in the past several years. ** Starting in 2009-2010, the number of children served and the percent served/not served calculations do not include children from over-income families. Source: Oregon Department of Education, Early Learning Division Oregon Head Start Prekindergarten Annual Estimates of Eligible 3 and 4 Year-Olds
School Year
Number of Children
Eligible for Services*
Number of Eligible
Children Served
Number of Eligible
Children Not Served
Percent of Eligible
Children Served
Percent of Eligible
Children Not Served
2006-2007 17,249 9,793 7,456 57.0% 43.0%
2007-2008 18,154 11,325 6,829 62.4% 37.6%
2008-2009 18,444 12,582 5,862 68.2% 31.8%
2009-2010** 17,894 11,938 5,956 66.7% 33.3%
2010-2011 19,605 10,686 8,919 54.5% 43.5%
2011-2012 19,605 12,523 7,082 63.9% 36.1%
2012-2013 25,161 12,545 12,092 50.0% 50.0%
2013-2014 24,766 12,293 12,473 49.6% 50.4%
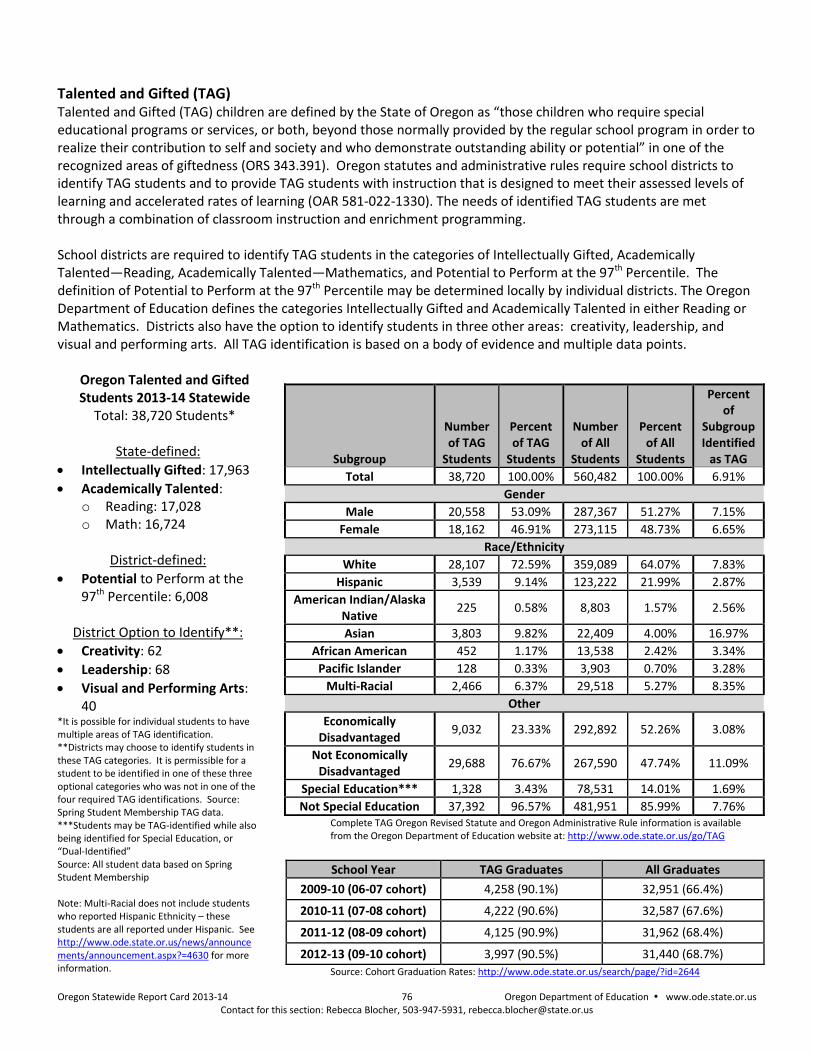
Oregon Statewide Report Card 2013-14 76 Oregon Department of Education www.ode.state.or.us Contact for this section: Rebecca Blocher, 503-947-5931, [email protected]
Talented and Gifted (TAG) Talented and Gifted (TAG) children are defined by the State of Oregon as “those children who require special educational programs or services, or both, beyond those normally provided by the regular school program in order to realize their contribution to self and society and who demonstrate outstanding ability or potential” in one of the recognized areas of giftedness (ORS 343.391). Oregon statutes and administrative rules require school districts to identify TAG students and to provide TAG students with instruction that is designed to meet their assessed levels of learning and accelerated rates of learning (OAR 581-022-1330). The needs of identified TAG students are met through a combination of classroom instruction and enrichment programming. School districts are required to identify TAG students in the categories of Intellectually Gifted, Academically Talented—Reading, Academically Talented—Mathematics, and Potential to Perform at the 97th Percentile. The definition of Potential to Perform at the 97th Percentile may be determined locally by individual districts. The Oregon Department of Education defines the categories Intellectually Gifted and Academically Talented in either Reading or Mathematics. Districts also have the option to identify students in three other areas: creativity, leadership, and visual and performing arts. All TAG identification is based on a body of evidence and multiple data points.
Oregon Talented and Gifted Students 2013-14 Statewide
Total: 38,720 Students*
State-defined:
Intellectually Gifted: 17,963
Academically Talented: o Reading: 17,028 o Math: 16,724
District-defined:
Potential to Perform at the 97th Percentile: 6,008
District Option to Identify**:
Creativity: 62
Leadership: 68
Visual and Performing Arts: 40
*It is possible for individual students to have multiple areas of TAG identification. **Districts may choose to identify students in these TAG categories. It is permissible for a student to be identified in one of these three optional categories who was not in one of the four required TAG identifications. Source: Spring Student Membership TAG data. ***Students may be TAG-identified while also being identified for Special Education, or “Dual-Identified” Source: All student data based on Spring Student Membership Note: Multi-Racial does not include students who reported Hispanic Ethnicity – these students are all reported under Hispanic. See http://www.ode.state.or.us/news/announcements/announcement.aspx?=4630 for more information.
Complete TAG Oregon Revised Statute and Oregon Administrative Rule information is available from the Oregon Department of Education website at: http://www.ode.state.or.us/go/TAG
Source: Cohort Graduation Rates: http://www.ode.state.or.us/search/page/?id=2644
Subgroup
Number of TAG
Students
Percent of TAG
Students
Number of All
Students
Percent of All
Students
Percent of
Subgroup Identified
as TAG
Total 38,720 100.00% 560,482 100.00% 6.91%
Gender
Male 20,558 53.09% 287,367 51.27% 7.15%
Female 18,162 46.91% 273,115 48.73% 6.65%
Race/Ethnicity
White 28,107 72.59% 359,089 64.07% 7.83%
Hispanic 3,539 9.14% 123,222 21.99% 2.87%
American Indian/Alaska Native
225 0.58% 8,803 1.57% 2.56%
Asian 3,803 9.82% 22,409 4.00% 16.97%
African American 452 1.17% 13,538 2.42% 3.34%
Pacific Islander 128 0.33% 3,903 0.70% 3.28%
Multi-Racial 2,466 6.37% 29,518 5.27% 8.35%
Other
Economically Disadvantaged
9,032 23.33% 292,892 52.26% 3.08%
Not Economically Disadvantaged
29,688 76.67% 267,590 47.74% 11.09%
Special Education*** 1,328 3.43% 78,531 14.01% 1.69%
Not Special Education 37,392 96.57% 481,951 85.99% 7.76%
School Year TAG Graduates All Graduates
2009-10 (06-07 cohort) 4,258 (90.1%) 32,951 (66.4%)
2010-11 (07-08 cohort) 4,222 (90.6%) 32,587 (67.6%)
2011-12 (08-09 cohort) 4,125 (90.9%) 31,962 (68.4%)
2012-13 (09-10 cohort) 3,997 (90.5%) 31,440 (68.7%)
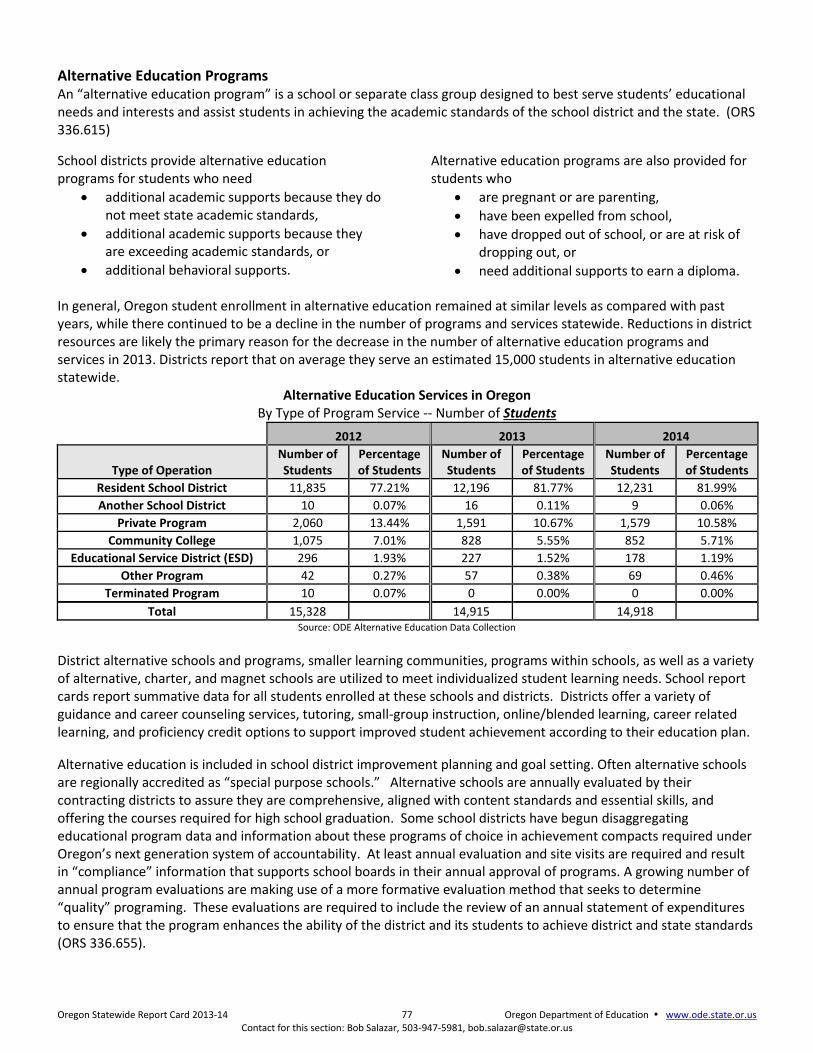
Oregon Statewide Report Card 2013-14 77 Oregon Department of Education www.ode.state.or.us Contact for this section: Bob Salazar, 503-947-5981, [email protected]
Alternative Education Programs An “alternative education program” is a school or separate class group designed to best serve students’ educational needs and interests and assist students in achieving the academic standards of the school district and the state. (ORS 336.615) School districts provide alternative education programs for students who need
additional academic supports because they do not meet state academic standards,
additional academic supports because they are exceeding academic standards, or
additional behavioral supports.
Alternative education programs are also provided for students who
are pregnant or are parenting,
have been expelled from school,
have dropped out of school, or are at risk of dropping out, or
need additional supports to earn a diploma.
In general, Oregon student enrollment in alternative education remained at similar levels as compared with past years, while there continued to be a decline in the number of programs and services statewide. Reductions in district resources are likely the primary reason for the decrease in the number of alternative education programs and services in 2013. Districts report that on average they serve an estimated 15,000 students in alternative education statewide.
Alternative Education Services in Oregon By Type of Program Service -- Number of Students
2012 2013 2014
Type of Operation Number of Students
Percentage of Students
Number of Students
Percentage of Students
Number of Students
Percentage of Students
Resident School District 11,835 77.21% 12,196 81.77% 12,231 81.99%
Another School District 10 0.07% 16 0.11% 9 0.06%
Private Program 2,060 13.44% 1,591 10.67% 1,579 10.58%
Community College 1,075 7.01% 828 5.55% 852 5.71%
Educational Service District (ESD) 296 1.93% 227 1.52% 178 1.19%
Other Program 42 0.27% 57 0.38% 69 0.46%
Terminated Program 10 0.07% 0 0.00% 0 0.00%
Total 15,328
14,915
14,918 Source: ODE Alternative Education Data Collection
District alternative schools and programs, smaller learning communities, programs within schools, as well as a variety of alternative, charter, and magnet schools are utilized to meet individualized student learning needs. School report cards report summative data for all students enrolled at these schools and districts. Districts offer a variety of guidance and career counseling services, tutoring, small-group instruction, online/blended learning, career related learning, and proficiency credit options to support improved student achievement according to their education plan.
Alternative education is included in school district improvement planning and goal setting. Often alternative schools are regionally accredited as “special purpose schools.” Alternative schools are annually evaluated by their contracting districts to assure they are comprehensive, aligned with content standards and essential skills, and offering the courses required for high school graduation. Some school districts have begun disaggregating educational program data and information about these programs of choice in achievement compacts required under Oregon’s next generation system of accountability. At least annual evaluation and site visits are required and result in “compliance” information that supports school boards in their annual approval of programs. A growing number of annual program evaluations are making use of a more formative evaluation method that seeks to determine “quality” programing. These evaluations are required to include the review of an annual statement of expenditures to ensure that the program enhances the ability of the district and its students to achieve district and state standards (ORS 336.655).
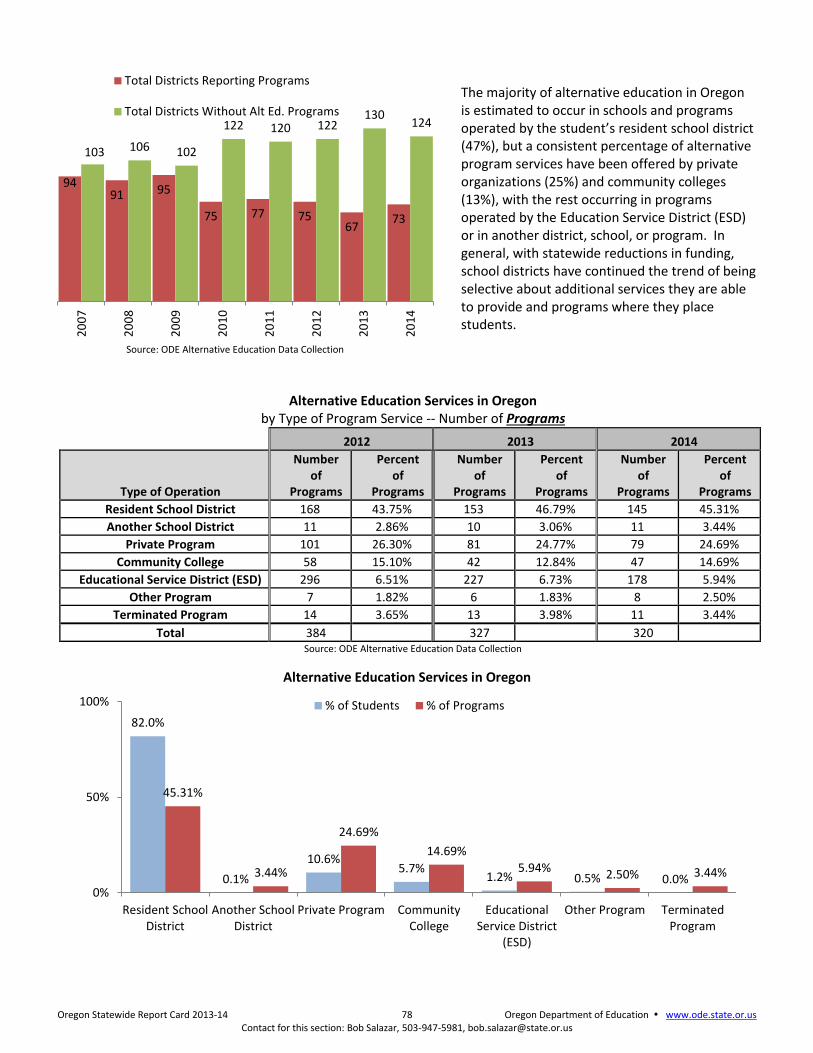
Oregon Statewide Report Card 2013-14 78 Oregon Department of Education www.ode.state.or.us Contact for this section: Bob Salazar, 503-947-5981, [email protected]
Source: ODE Alternative Education Data Collection
The majority of alternative education in Oregon is estimated to occur in schools and programs operated by the student’s resident school district (47%), but a consistent percentage of alternative program services have been offered by private organizations (25%) and community colleges (13%), with the rest occurring in programs operated by the Education Service District (ESD) or in another district, school, or program. In general, with statewide reductions in funding, school districts have continued the trend of being selective about additional services they are able to provide and programs where they place students.
Alternative Education Services in Oregon by Type of Program Service -- Number of Programs
2012 2013 2014
Type of Operation
Number of
Programs
Percent of
Programs
Number of
Programs
Percent of
Programs
Number of
Programs
Percent of
Programs
Resident School District 168 43.75% 153 46.79% 145 45.31%
Another School District 11 2.86% 10 3.06% 11 3.44%
Private Program 101 26.30% 81 24.77% 79 24.69%
Community College 58 15.10% 42 12.84% 47 14.69%
Educational Service District (ESD) 296 6.51% 227 6.73% 178 5.94%
Other Program 7 1.82% 6 1.83% 8 2.50%
Terminated Program 14 3.65% 13 3.98% 11 3.44%
Total 384
327
320
Source: ODE Alternative Education Data Collection
Alternative Education Services in Oregon
94 91 95
75 77 75 67
73
103 106 102
122 120 122 130
124
20
07
20
08
20
09
20
10
20
11
20
12
20
13
20
14
Total Districts Reporting Programs
Total Districts Without Alt Ed. Programs
82.0%
0.1%
10.6% 5.7%
1.2% 0.5% 0.0%
45.31%
3.44%
24.69%
14.69%
5.94% 2.50% 3.44%
0%
50%
100%
Resident SchoolDistrict
Another SchoolDistrict
Private Program CommunityCollege
EducationalService District
(ESD)
Other Program TerminatedProgram
% of Students % of Programs
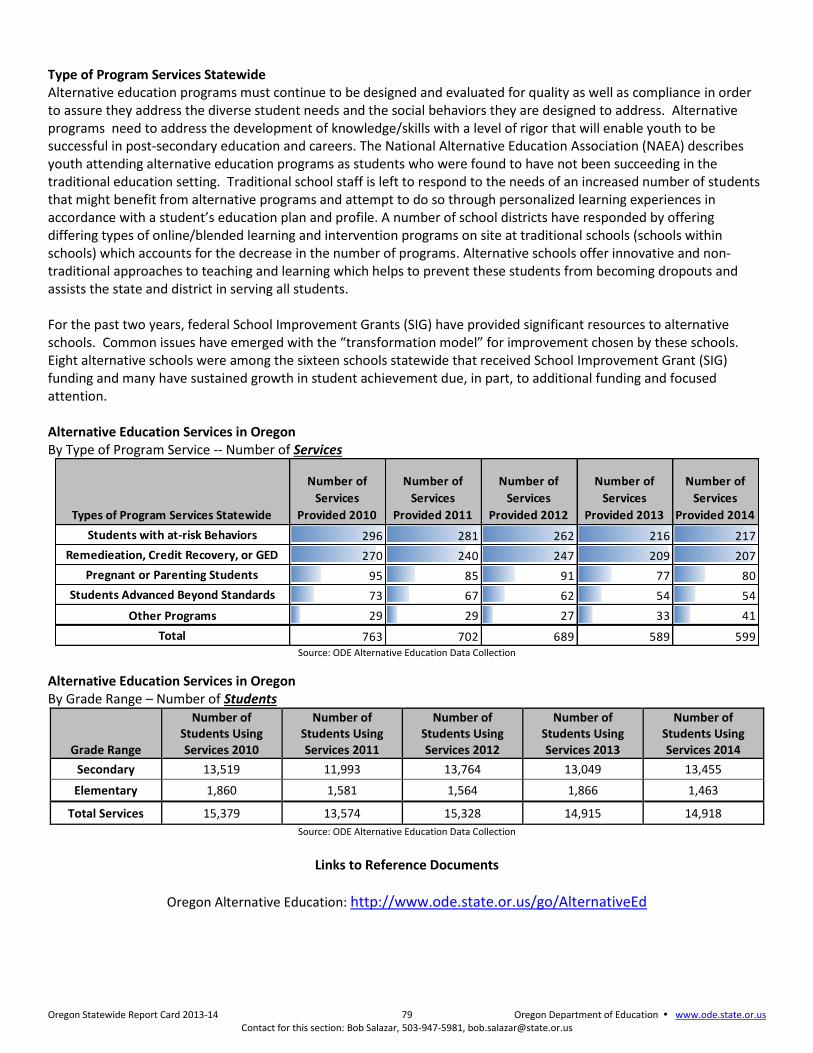
Oregon Statewide Report Card 2013-14 79 Oregon Department of Education www.ode.state.or.us Contact for this section: Bob Salazar, 503-947-5981, [email protected]
Type of Program Services Statewide Alternative education programs must continue to be designed and evaluated for quality as well as compliance in order to assure they address the diverse student needs and the social behaviors they are designed to address. Alternative programs need to address the development of knowledge/skills with a level of rigor that will enable youth to be successful in post-secondary education and careers. The National Alternative Education Association (NAEA) describes youth attending alternative education programs as students who were found to have not been succeeding in the traditional education setting. Traditional school staff is left to respond to the needs of an increased number of students that might benefit from alternative programs and attempt to do so through personalized learning experiences in accordance with a student’s education plan and profile. A number of school districts have responded by offering differing types of online/blended learning and intervention programs on site at traditional schools (schools within schools) which accounts for the decrease in the number of programs. Alternative schools offer innovative and non-traditional approaches to teaching and learning which helps to prevent these students from becoming dropouts and assists the state and district in serving all students. For the past two years, federal School Improvement Grants (SIG) have provided significant resources to alternative schools. Common issues have emerged with the “transformation model” for improvement chosen by these schools. Eight alternative schools were among the sixteen schools statewide that received School Improvement Grant (SIG) funding and many have sustained growth in student achievement due, in part, to additional funding and focused attention. Alternative Education Services in Oregon By Type of Program Service -- Number of Services
Source: ODE Alternative Education Data Collection
Alternative Education Services in Oregon By Grade Range – Number of Students
Grade Range
Number of Students Using Services 2010
Number of Students Using Services 2011
Number of Students Using Services 2012
Number of Students Using Services 2013
Number of Students Using Services 2014
Secondary 13,519 11,993 13,764 13,049 13,455
Elementary 1,860 1,581 1,564 1,866 1,463
Total Services 15,379 13,574 15,328 14,915 14,918
Source: ODE Alternative Education Data Collection
Links to Reference Documents
Oregon Alternative Education: http://www.ode.state.or.us/go/AlternativeEd
Types of Program Services Statewide
Number of
Services
Provided 2010
Number of
Services
Provided 2011
Number of
Services
Provided 2012
Number of
Services
Provided 2013
Number of
Services
Provided 2014
Students with at-risk Behaviors 296 281 262 216 217
Remedieation, Credit Recovery, or GED 270 240 247 209 207
Pregnant or Parenting Students 95 85 91 77 80
Students Advanced Beyond Standards 73 67 62 54 54
Other Programs 29 29 27 33 41
Total 763 702 689 589 599
Oregon Statewide Report Card 2013-14 80 Oregon Department of Education www.ode.state.or.us
RESOURCES
Visit the webpages below for additional information on key education topics. Contacts for each area are generally listed at the bottom of each webpage.
School and District Accountability
Elementary and Secondary Education Act http://www.ode.state.or.us/search/results/?id=75 Unsafe School Choice Option (USCO) and Persistently Dangerous Schools http://www.ode.state.or.us/search/page/?id=1319 Oregon School & District Report Cards and Annual Measurable Objectives (AMO) http://www.ode.state.or.us/data/reportcard/reports.aspx Quality Education Model http://www.ode.state.or.us/search/results/?id=166 Next Generation of Accountability http://www.ode.state.or.us/go/NextGen Accountability Reports http://www.ode.state.or.us/go/AsmtRpt Report Cards http://www.ode.state.or.us/go/ReportCard
School Funding and Finance
State School Fund http://www.ode.state.or.us/search/results/?id=168 K-12 Stimulus (ARRA) http://stimulus.k12partners.org/ Special Education Funding http://www.ode.state.or.us/search/page/?id=894
Student Information
Fall Membership Report http://www.ode.state.or.us/search/page/?=3225 Historical Student Enrollment and Demographics http://www.ode.state.or.us/data/reports/toc.aspx#Students English Learners http://www.ode.state.or.us/search/results/?id=106 School Nutrition/Free and Reduced Price Lunch http://www.ode.state.or.us/search/results/?id=207
Oregon Statewide Report Card 2013-14 81 Oregon Department of Education www.ode.state.or.us
Teacher Information
Teacher Licensure http://www.oregon.gov/tspc/Pages/index.aspx Highly Qualified Teachers http://www.ode.state.or.us/search/results/?id=102 Resources for Teachers http://www.ode.state.or.us/go/teachers
Special Programs and Information
Alternative Education http://www.ode.state.or.us/go/AlternativeEd Charter Schools http://www.ode.state.or.us/go/CharterSchools Early Childhood http://www.ode.state.or.us/search/results/?=252 Homeless Students http://www.ode.state.or.us/go/HomelessEd Special Education Programs http://www.ode.state.or.us/go/SpecialEducation Talented and Gifted http://www.ode.state.or.us/go/TAG
Title I Title I-A : Improving Basic Programs http://www.ode.state.or.us/search/results/?id=95 Title I-B1: Reading First http://www.ode.state.or.us/search/results/?id=96 Title I-B2: Early Reading First http://www.ode.state.or.us/search/results/?id=97 Administered by U.S. Dept. of Education, not ODE Title I-C: Migrant Education http://www.ode.state.or.us/search/results/?id=99 Title I-D: Neglected and Delinquent or At-Risk Children http://www.ode.state.or.us/search/results/?id=100
Oregon Statewide Report Card 2013-14 82 Oregon Department of Education www.ode.state.or.us
Student Achievement
Oregon Statewide Assessment http://www.ode.state.or.us/go/Assessment Oregon’s Education Data Explorer http://www.ode.state.or.us/apps/Navigation/Navigation.Web/#/PAGR National Assessment of Education Progress (NAEP) http://www.ode.state.or.us/go/NAEP http://nces.ed.gov/nationsreportcard Oregon University System http://www.ous.edu/ SAT Reasoning Test http://research.collegeboard.org/programs/sat/data American College Testing (ACT) http://www.act.org/research-policy/ Advanced Placement (AP) http://research.collegeboard.org/programs/ap/data Cohort Graduation Rate http://www.ode.state.or.us/search/page/?id=2644 Dropout Reports http://www.ode.state.or.us/search/page/?id=1 Essential Skills http://www.ode.state.or.us/search/page/?id=2042
Data Collections https://district.ode.state.or.us/apps/info/
Other Resources and Topic Area Information http://search.ode.state.or.us/default.aspx http://www.ode.state.or.us/search/topics/