annual technical progress report
TRANSCRIPT

DE-FC26-04NT41944
________________________________________________________________________ 10/7/2005 1 Annual Technical Progress Report
Report Title: Annual Technical Progress Report: “Adapting Wireless Technology to Lighting Control and Environmental Sensing” Type of Report: Annual Technical Progress Report Reporting Period Start Date: August 01, 2004 Reporting Period End Date: July 31, 2005 Principal Authors: Dana Teasdale, Dust Networks Francis Rubinstein, LBNL Dave Watson, LBNL Steve Purdy, SVA Lighting Reporting Date: October 2005 Award Number: DE-FC26-04NT41944 Submitting Organization: Dust Networks 30695 Huntwood Avenue Hayward, CA 94544
Annual Technical Progress Report: “Adapting Wireless Technology to
Lighting Control and Environmental Sensing”

DE-FC26-04NT41944
________________________________________________________________________ 10/7/2005 2 Annual Technical Progress Report
Disclaimer This report was prepared as an account of work sponsored by an agency of the United States Government. Neither the United States Government nor any agent thereof, nor any of their employees, makes any warranty, express or implied, or assumes any legal liability of responsibility for the accuracy, completeness, or usefulness of any information, apparatus, product, or process disclosed, or represents that its use would not infringe privately owned rights. Reference herein to any specific commercial product, process, or service by trade name, trademark, manufacturer, or otherwise does not necessarily constitute or imply its endorsement, recommendation, or favoring by the United States Government or any agency thereof. The views and opinions of authors expressed herein do not necessarily state or reflect those of the United States Government or any agency thereof.
DE-FC26-04NT41944
________________________________________________________________________ 10/7/2005 3 Annual Technical Progress Report
Abstract The high cost of retrofitting buildings with advanced lighting control systems is a barrier to adoption of this energy-saving technology. Wireless technology, however, offers a solution to mounting installation costs since it requires no additional wiring to implement. To demonstrate the feasibility of such a system, a prototype wirelessly-controlled advanced lighting system was designed and built. The system includes the following components: a wirelessly-controllable analog circuit module (ACM), a wirelessly-controllable electronic dimmable ballast, a T8 3-lamp fixture, an environmental multi-sensor, a current transducer, and control software. The ACM, dimmable ballast, multi-sensor, and current transducer were all integrated with SmartMeshTM wireless mesh networking nodes, called motes, enabling wireless communication, sensor monitoring, and actuator control. Each mote-enabled device has a reliable communication path to the SmartMesh Manager, a single board computer that controls network functions and connects the wireless network to a PC running lighting control software. The ACM is capable of locally driving one or more standard 0-10Volt electronic dimmable ballasts through relay control and a 0-10 Volt controllable output. The mote-integrated electronic dimmable ballast is designed to drive a standard 3-lamp T8 light fixture. The environmental multi-sensor measures occupancy, light level and temperature. The current transducer is used to measure the power consumed by the fixture. Control software was developed to implement advanced lighting algorithms, including daylight ramping, occupancy control, and demand response. Engineering prototypes of each component were fabricated and tested in a bench-scale system. Based on standard industry practices, a cost analysis was conducted. It is estimated that the installation cost of a wireless advanced lighting control system for a retrofit application is at least 30% lower than a comparable wired system for a typical 16,000 square-foot office building, with a payback period of less than 3 years.

DE-FC26-04NT41944
________________________________________________________________________ 10/7/2005 4 Annual Technical Progress Report
Table of Contents Disclaimer ........................................................................................................................... 2 Abstract ............................................................................................................................... 3 Table of Contents................................................................................................................ 4 List of Figures ..................................................................................................................... 5 Introduction......................................................................................................................... 6 Executive Summary ............................................................................................................ 6 Project Objectives ............................................................................................................... 6 Background & Benefits....................................................................................................... 6 Wireless-Enabled Dimmable Ballast and Analog Control Module.................................... 9
Mote-integrated Analog Control Module (ACM)........................................................... 9 Overview..................................................................................................................... 9 Testing....................................................................................................................... 11
Mote-integrated Dimming Ballast (MDB).................................................................... 12 Overview................................................................................................................... 12 Testing....................................................................................................................... 13
Wireless-enabled Environmental Sensor .......................................................................... 17 Occupancy Sensing....................................................................................................... 19 Light Level Sensing ...................................................................................................... 19
Power Meter...................................................................................................................... 21 Control Logic Software..................................................................................................... 22
Software Control Logic Diagram.................................................................................. 22 Feature Description....................................................................................................... 23 Graphical User Interface Screens.................................................................................. 24
Main Tab................................................................................................................... 24 Daylight Ramp.......................................................................................................... 26 Demand Response..................................................................................................... 27 Occupancy................................................................................................................. 28 Monitoring ................................................................................................................ 29 Advanced .................................................................................................................. 30
Commissioning ............................................................................................................. 30 System Testing.................................................................................................................. 32 Cost-Benefit Analysis ....................................................................................................... 33
Retrofit Savings ............................................................................................................ 33 Wireless vs. Wired ........................................................................................................ 34
Budget Period 2 Overview................................................................................................ 37 Appendix A – ACM and MDB Functions ........................................................................ 38 Appendix B – Ballast Testing and Qualification .............................................................. 40

DE-FC26-04NT41944
________________________________________________________________________ 10/7/2005 5 Annual Technical Progress Report
List of Figures Figure 1. Concept Drawing of Adapted Wireless Lighting Control System. .................... 8 Figure 2. Diagram showing the connection of a wirelessly controlled ACM to dimmable ballasts............................................................................................................................... 10 Figure 3. ACM block diagram. The line-powered mote passes control messages to an embedded microcontroller that controls the output voltage and relay state. .................... 10 Figure 4. Finished ACM package (left) and ACM circuit board (right) as submitted by SVA Lighting.................................................................................................................... 11 Figure 5. ACM Test Set-up.............................................................................................. 11 Figure 6. Diagram of installed Mote-integrated dimmable ballasts ................................ 12 Figure 7. Block diagram of the Mote-integrated Dimmable Ballast. The wireless Mote connects to a microcontroller that controls ballast functions............................................ 13 Figure 8. SVA Lighting Electronic Ballast Packaging (left), MDB circuit board (right) 13 Figure 9. Photograph of arc test set-up ............................................................................ 16 Figure 10. Plot of the control input vs lamp output current............................................. 16 Figure 11. Modified environmental sensor connected to Dust Networks' Mote and powered by 3 AA batteries ............................................................................................... 18 Figure 12. Dust Networks' Packaged Evaluation Kit Mote - view showing connectors. Environmental Sensor inputs are wired to terminal block connector (P1). ...................... 18 Figure 13. Plot of illuminance vs. sensor voltage for light sensor................................... 20 Figure 14. Motes connected to current transducers monitoring energy loads in building sub panels.......................................................................................................................... 21 Figure 15. Control Logic Software Flow Chart ................................................................ 22 Figure 16. Control Software Graphical User Interface: Main Tab ................................... 25 Figure 17. Control Software Graphical User Interface: Daylight Ramp .......................... 26 Figure 18. Control Software Graphical User Interface: Demand Response..................... 27 Figure 19. Control Software Graphical User Interface: Occupancy................................. 28 Figure 20. Control Software Graphical User Interface: Monitoring................................. 29 Figure 21. Control Software Graphical user Interface: Advanced ................................... 30 Figure 22. Fixture/ACM set-up for system testing .......................................................... 32 Figure 23. Cost breakdown of Wireless solution (left) and wired solution (right).......... 35

DE-FC26-04NT41944
________________________________________________________________________ 10/7/2005 6 Annual Technical Progress Report
Introduction This report summarizes the progress completed during budget period 1 (BP1) on the project titled “Adapting Wireless Technology to Lighting Control and Environmental Sensing.”
Executive Summary Accomplishments and highlights of budget period 1:
o Completed engineering prototypes of the following components were integrated with wireless networking nodes:
o 3-lamp T8 electronic dimmable ballast o Analog Control Module (can control multiple dimmable ballasts with 0-10
Volt output and relay control) o Environmental Multi-sensor o Current Transducer
o Control software implementing daylight ramping, occupancy control, and demand response functions was developed.
o Components were integrated into a bench-scale system for system-level evaluation.
o A cost analysis was conducted to determine the payback period and retrofit installation cost savings over a comparable wired system
o <3 year payback for a typical office building o Estimated 30% lower installation cost compared to a wired retrofit
Project Objectives
1. Demonstrate that wireless technology can be cost-effectively applied to the problem of retrofitting integrated lighting controls into existing buildings. The outcome of the program will be an advanced lighting control system capable of implementing all lighting control strategies in existing buildings without the need to run additional wires.
2. Demonstrate that wireless technology can be cost-effectively embedded into controllable fluorescent lamp ballasts allowing independent control of individual ballasts from and intelligent, wireless environmental sensor.
Background & Benefits The energy-saving and occupant comfort benefits of advanced lighting control, while well known within the lighting community, have not been realized on a large scale due to the cost and difficulty of installing and commissioning electronic dimmable ballasts and supporting hardware. Retrofitting existing buildings with dimmable ballasts and appropriate sensors requires running new control wires, which makes the cost and complexity of installing such systems prohibitive.

DE-FC26-04NT41944
________________________________________________________________________ 10/7/2005 7 Annual Technical Progress Report
A new class of low power, low data rate wireless mesh networking devices promises to reduce the barriers to implementing advanced lighting control systems by eliminating the need for control wires. These wireless mesh networks offer the user a reliable means of transmitting sensor data and control commands to and from remote monitoring and control points by means of a self-forming, self-healing, and multihopping network architecture. Dust Networks has developed a very low power, reliable wireless mesh network product called SmartMeshTM. Each node in the SmartMesh network is called a Mote and can be embedded into monitoring and control devices. The Dust Networks system uses a central network access point called the SmartMesh Manager (Manager). Application specific software running on a PC or building management system can communicate directly with the Manager, providing the user with monitoring and control capabilities. The purpose of this project is to apply wireless technology to lighting controls in order to develop a system capable of advanced lighting strategies that is also cost effective for commercial retrofit applications. Occupants will benefit from improved workplace comfort, building owners will benefit from improved energy efficiency and flexible lighting control, and utilities will benefit from energy savings that are responsive to peak demand periods. Commercial lighting consumes approximately 3.7 quads per year. At 35% long-term market penetration and an average of 40% energy savings resulting from advanced lighting strategies, 0.52 quads could be saved annually.
DE-FC26-04NT41944
________________________________________________________________________ 10/7/2005 8 Annual Technical Progress Report
User Interface:Programmer'sInterface
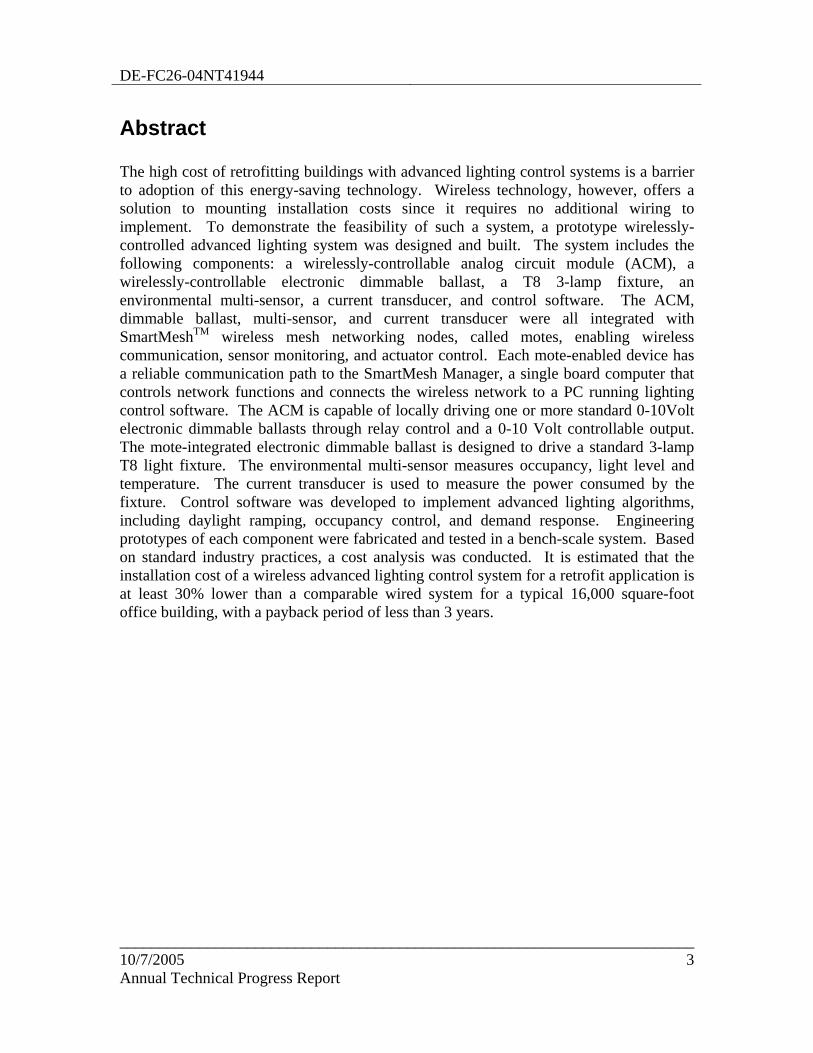
Computer w/ Control logicalgorithms for:1) Smart OFF control
a) post occupancy2) Dimmable Ballast LevelControl based on:
a) Daylightb) Demand Response
DustMngr. LAN
Lighting Panel
PowerMeter
}To Lighting Fixtures
120 VAC or 277 VAC, 1Ph.
M = Wireless MoteDB = Dimmable BallastL = Lamps in one fixtureSw. = Standard SPST
Wall Switch= Field Electrical Conn. toBallast
M
Archive files:- Power- Temperature- Illuminance
L
M/DB
N
H120 VAC or
277 VAC
Workspace Workspace
GRND
L
M/DB
GRND
Sw. Sw.
Batterypowered
Batterypowered
120 VAC
120 VAC
120 VAC
Enviro.Sensor
OccupancyTemp.
Illuminance
Enviro.Sensor
OccupancyTemp.
Illuminance
Figure 1. Concept Drawing of Adapted Wireless Lighting Control System.

DE-FC26-04NT41944
________________________________________________________________________ 10/7/2005 9 Annual Technical Progress Report
Wireless-Enabled Dimmable Ballast and Analog Control Module The development of the Mote-integrated Dimmable Ballast was performed in three parallel efforts: analog circuit module development, electronic dimming ballast design, and mote-ballast integration. This parallel approach has enabled a complete product development assessment within a shortened development cycle. The design and testing portion of the integrated dimming ballast was segmented to allow design consultants to build their respective elements independently and to avoid delays due to serial work load, learning curves and design implementation. The development activity has been completed as follows:
1) Mote-Integrated Analog Control Module (ACM) 2) Dimming ballast platform 3) Mote-Integrated Dimming Ballast (MDB)
Mote-integrated Analog Control Module (ACM)
Overview The ACM responds to commands delivered wirelessly wireless through the integrated on-board Dust Networks Mote. Commands received by the embedded Mote via wireless transmission are passed serially to a microprocessor in the ACM, which controls ACM function. Using commands from a custom command set, the ACM has the ability to open or close a 20 Amp control relay contact in addition to providing a 0-10V analog output signal. The ACM is intended to be a “bridge” product that provides wireless control of lighting and non-lighting loads of up to 20 Amp loading at 120 or 277VAC. The 0-10V output can be used to control existing 0-10 VDC dimming ballasts or other voltage-controlled components. By providing the ability to control fade rates and set levels for demand reduction, the device can be used in load shed or daylighting applications where additional energy savings can be obtained. Figure 2 illustrates a potential implementation of the ACM to control electronic dimmable ballasts. With a 20 Amp relay, each ACM can control a switchleg powering up to 16 T8 lamps at 120VAC or 47 T8 lamps at 277VAC.

DE-FC26-04NT41944
________________________________________________________________________ 10/7/2005 10 Annual Technical Progress Report
Figure 2. Diagram showing the connection of a wirelessly controlled ACM to dimmable ballasts The ACM is comprised of the Dust wireless mesh networks communication module, a microcontroller for protocol handling, and control logic to support the 0-10V output and 20 Amp relay. A block diagram is shown in Figure 3. Packaged into a standard ballast enclosure, the ACM device can be installed in a standard lighting fixture, as shown in Figure 4, or wall mounted in an electrical enclosure. Care must be taken to allow the ACM antenna to be mounted outside the metal enclosure.
Figure 3. ACM block diagram. The line-powered mote passes control messages to an embedded
microcontroller that controls the output voltage and relay state.
Universal PFC
Front-end
Control Logic for ACM input and output functions
Mote Microcontroller
Line
Neutral
Ground
0-10V input 0-10V output
20AMP relay SPST output
Standard Electrical wiring 120-277V AC 60Hz (Phase, Neutral, Ground)
ACM – Circuit control 20Amp relay output for On/Off switching
ACM – Analog 0-10V output channel for control of standard 0-10V dimming ballast or other 0-10V load control device.

DE-FC26-04NT41944
________________________________________________________________________ 10/7/2005 11 Annual Technical Progress Report
Figure 4. Finished ACM package (left) and ACM circuit board (right) as submitted by SVA Lighting The command set for the ACM (Appendix A) was implemented to mirror the custom command set that will be used for the Mote-integrated Dimming ballast (MDB). As an example the ON/OFF command when sent to an ACM address will open or close the 20 Amp relay and when sent to the ballast will turn the fluorescent lamps on and off. In this way, installed ACM devices can be used in similar applications as the MDB while retaining the flexibility to function in other control applications. Ballast development and testing time is also reduced, as the software will port from the ACM to the ballast design.
Testing ACM functions were tested by sending commands over the wireless link between the Dust Networks’ SmartMeshTM Manager (Manager) and the ACM, as depicted in Figure 5. Operation was confirmed for the commands listed in Appendix A.
Figure 5. ACM Test Set-up
1) User Enters Commands on PC
2) Manager Sends Commands to Mote
3) ACM Output is measured (0-10V
or ON/OFF)
RF Link >test1

DE-FC26-04NT41944
________________________________________________________________________ 10/7/2005 12 Annual Technical Progress Report
To meet quality and field reliability requirements of the commercial buildings market, all products will be rigorously tested. SVA Lighting subjects its designs to the tests listed in Appendix B before release. In addition to the listed quality and reliability tests, performance testing is also completed.
Mote-integrated Dimming Ballast (MDB)
Overview The MDB has been developed for compatibility with fluorescent, 3-lamp T8 120-277V fixtures. The dimming range is from 100% of maximum light output to 5%. Commands are implemented to allow full range dimming in addition to load reduction commands that will limit the light output of the ballast during a load shedding period or when adequate daylight is available. Figure 6 is a conceptual illustration showing MDB installation with lighting fixtures and standard wiring. The MDB is designed to be a “drop-in” replacement for any standard ballast allowing it to be installed by standard lighting maintenance personnel. Because the MDB would ordinarily be mounted within a fixture’s metal body, the MDB’s antenna must extend outside of the fixture. Because the MDB communicates wirelessly, low-voltage control wiring is not required.
Figure 6. Diagram of installed Mote-integrated dimmable ballasts The MDB provides a cost effective solution to lighting retrofit applications. Replacing the existing fluorescent lighting ballast with the MDB in addition to installing basic control components provides load management, occupancy light level tuning and reporting functions for the building manager. Using current market proven ballast design techniques assures that the MDB offers a reliable product solution. The resonant half bridge inverter combined with the dimming controller allows full lamp control while meeting ANSI requirements for lamp operating performance. The embedded microcontroller provides the interface control and protocol conversion between the Dust mote and the ballast control and monitoring components. A block diagram of the MDB components is shown in Figure 7.
Standard Electrical wiring 120-277V AC 60Hz (Hot, Neutral, Ground)

DE-FC26-04NT41944
________________________________________________________________________ 10/7/2005 13 Annual Technical Progress Report
Universal PFC Front-end
Half bridge Resonant Inverter / Dimming Controller
Isolated Dust mote interface
Microcontroller
Line
Neutral
Ground 3-T8 Lamps
Figure 7. Block diagram of the Mote-integrated Dimmable Ballast. The wireless Mote connects to a
microcontroller that controls ballast functions.
Figure 8. SVA Lighting Electronic Ballast Packaging (left), MDB circuit board (right)
Testing A number of tests were conducted on the ballasts to insure that they meet industry operational requirements. To qualify a product for the USA commercial lighting market, rigorous testing is required to assure the design result is a high quality product meeting market performance (ANSII) and safety (UL) standards. Although testing for the ability of a product to pass the required UL safety tests is necessary, it is also important that a ballast design operates the lamp appropriately to ensure proper light output and acceptable lamp operating life. The lamp operating performance, starting and end of life operation guidelines are documented within the ANSII standards for electronic ballasts. SVA Lighting will complete approximately 24 different tests related to product and design reliability and specification verification. Upon completion of the tests the products will be submitted to UL for safety testing and approval. Products will be available for market introduction at that time. Lamp starting and removal tests, end of lamp life tests, and product comparison tests are described in this section.
DE-FC26-04NT41944
________________________________________________________________________ 10/7/2005 14 Annual Technical Progress Report
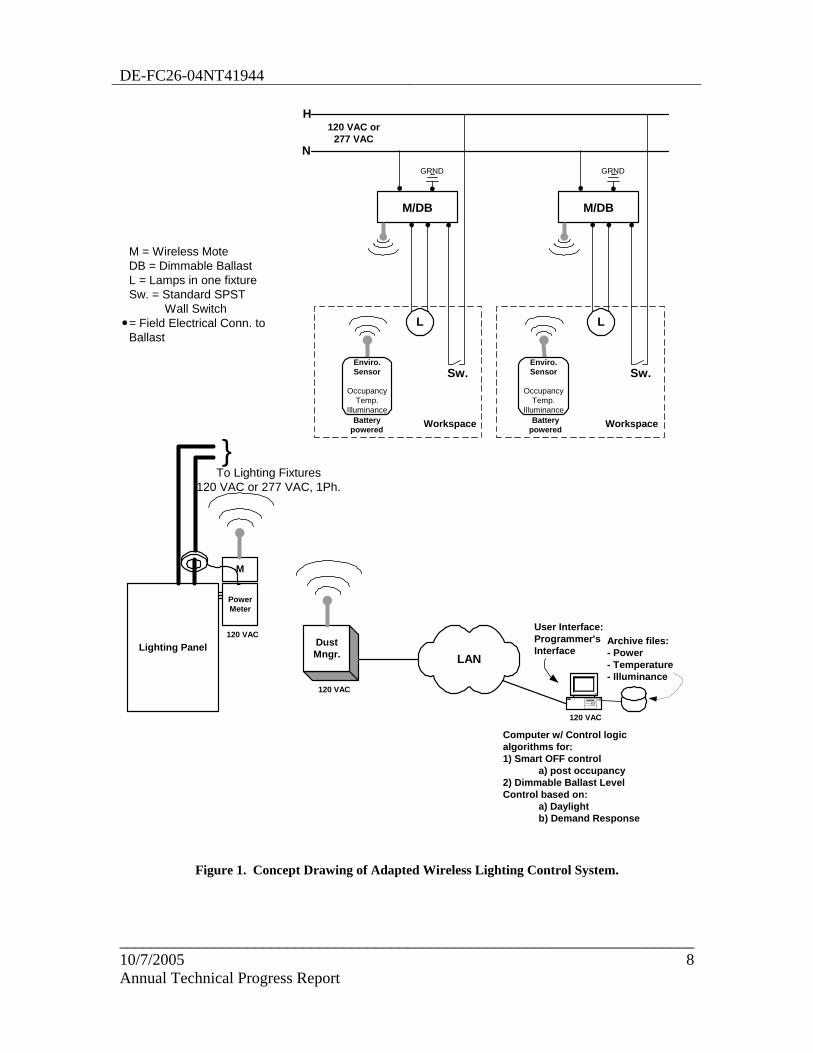
Lamp Starting and Removal Lamp life is determined by the ballast lamp current starting method, filament voltages, lamp operating current and overall smoothness of the energy supplied. The first 3 waveforms displayed below were taken from the T8-32W 3 lamp-dimming platform used for the integration of the Dust module. The waveforms show the correct operation for lamp starting characteristics. The scope photos show the lamp starting and filament voltage needed to fall within the ANSII parameters. Waveform 4 shows the lamp fault test condition.
1) Normal full light lamp voltage, current and filament voltage and current: Ch1: Blue filament voltage (5V/div. RMS =
4.25V). Ch2: Lamp voltage (3 lamps in series, 100X
probe, 500V/div. Peak= 650V) Ch3: Lamp current (toroid at blue side,
100mA/div. RMS = 218mA) Ch4: Blue filament current, (100mA/div. RMS =
413mA)
The significant point of this test is to assure that at full light output the filament, lamp current and lamp voltage parameters fall within the recommended lamp operation guidelines provided by ANSII. The design meets requirements.
2) Prior to strike, lamp voltage, current filament voltage and current: Ch1: Blue filament voltage (5V/div. RMS =
4.77V). Ch2: Lamp voltage (3 lamps in series, 100X
probe, 500V/div. Peak= 620V) Ch3: Lamp current (toroid at blue side,
100mA/div. RMS = 20.5mA) Ch4: blue filament current, (100mA/div. RMS =
369mA). The filament resistance at 25C is 2.7 Ohm. Prior
to strike, filament resistance is 4.77/0.369=12.9 Ohm. Rh/Rc = 4.787.
This test shows the current and voltage levels prior to the actual starting of the lamp. Lamp stress and damage occur during the transition stage from off to on and the way the lamp is treated prior to starting is critical to obtaining the required lamp life. Design meets requirements.

DE-FC26-04NT41944
________________________________________________________________________ 10/7/2005 15 Annual Technical Progress Report
3) During strike, lamp voltage, current and fault monitoring voltage: Ch1: Fault monitoring voltage (0.5V/div). Ch2: Lamp voltage (3 lamps in series, 100X
probe, 500V/div. Peak= 860V) Ch3: Lamp current (toroid at blue side,
100mA/div.)
Perhaps the most critical point of the lamp operation is when the lamp actually begins to strike. This is the period of time that the lamp cathodes are spitting of material. A controlled start assures that minimum damage occurs. The design is a program start operation, which is the preferred starting method to achieve the longest lamp life. Results of this test are positive and meet requirements.
4) During middle lamp removed fault, lamp voltage, current and fault monitoring voltage: Ch1: Fault monitoring voltage (0.5V/div). Ch2: Lamp voltage (3 lamps in series, 100X
probe, 500V/div. Peak= 1210V) Ch3: Lamp current (toroid at blue side,
100mA/div.)
It is important to understand how the ballast design functions during lamp failure. Fault testing is performed to assure that the lamp operating conditions are maintained within specifications for the remaining lamps and a hazardous condition does not develop. Results are positive and within recommended operating parameters.
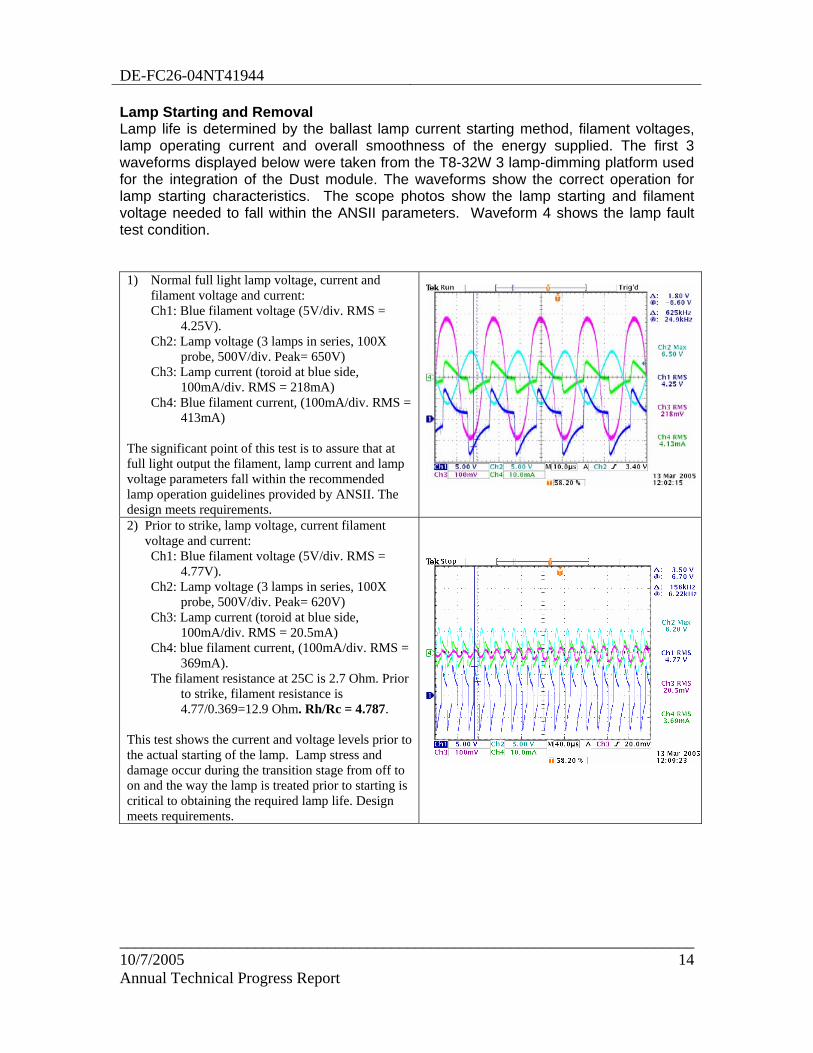
End of Lamp Life test: When a fluorescent lamp fails there is a period of time in which the lamp looks like a short circuit to the ballast circuit. During this time arcing is present in the lamp and it is important that the ballast can support the high currents generated. An end of lamp life test is important to assure that the ballast design is capable of supporting this event. An Arc tester can be used to simulate the arcing created during a lamp end of life period. The photo below shows the simulated arc test being performed on the SVA Dust integrated ballast. The ballast under test did not fail and went into the proper shutdown mode therefore passing the test requirements.
DE-FC26-04NT41944
________________________________________________________________________ 10/7/2005 16 Annual Technical Progress Report
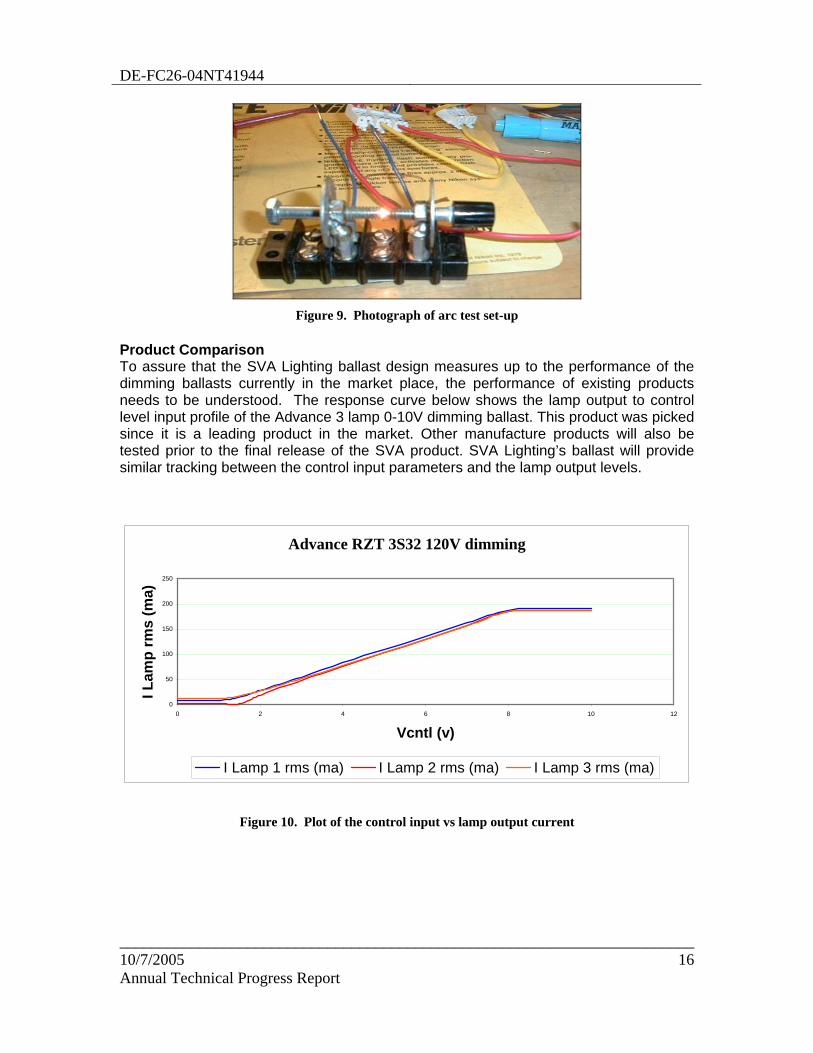
Figure 9. Photograph of arc test set-up
Product Comparison To assure that the SVA Lighting ballast design measures up to the performance of the dimming ballasts currently in the market place, the performance of existing products needs to be understood. The response curve below shows the lamp output to control level input profile of the Advance 3 lamp 0-10V dimming ballast. This product was picked since it is a leading product in the market. Other manufacture products will also be tested prior to the final release of the SVA product. SVA Lighting’s ballast will provide similar tracking between the control input parameters and the lamp output levels.
Advance RZT 3S32 120V dimming
0
50
100
150
200
250
0 2 4 6 8 10 12
Vcntl (v)
I Lam
p rm
s (m
a)
I Lamp 1 rms (ma) I Lamp 2 rms (ma) I Lamp 3 rms (ma)
Figure 10. Plot of the control input vs lamp output current

DE-FC26-04NT41944
________________________________________________________________________ 10/7/2005 17 Annual Technical Progress Report
Wireless-enabled Environmental Sensor The environmental multi-sensor being developed by LBNL is presently capable of measuring illuminance and occupancy (and vacancy). For this project, the environmental sensor was integrated with a Dust Networks’ Mote to allow wireless communication. The on-Mote temperature sensor adds temperature monitoring function to the multi-sensor.
The wireless lighting control solution under development in this project employs a control design scheme that requires environmental sensor inputs for automatic-off and daylight control functions. The system will automatically turn the light ON upon occupancy detection and OFF after a preset time upon the departure of the occupant from the zone. For the daylight control function, illuminance, as measured by the light-sensing portion of the environmental sensor, will provide a input to the control logic software, which will adjust ballast output accordingly. This strategy saves energy by reducing lighting power when daylight is available.
Two daylighting control modes are envisioned: open-loop and closed-loop. In open-loop mode, the daylighting control algorithm establishes a one-to-one correspondence (essentially a lookup table) between light level as detected by the light detector and the ballast’s light output. As the detected light level goes up, the ballast output goes down. This is the simplest control algorithm to implement. In closed-loop mode, the algorithm will drive down the light level as the light detected by the light detector increases. But unlike the open-loop case, the light detector is able to “see” the light that it controls. Using closed-loop feedback, the system continuously senses the light level and continuously adjusts the electric light output so that the signal from the light detector remains at a preset value (the setpoint). In both open and closed-loop mode, the user is able to set the light level setpoint (in lux or footcandles) from the GUI running on the Control Logic Computer.
The control logic for the closed-loop daylighting algorithm is as follows: when the illuminance sensor measures a value greater than the setpoint, the control logic will gradually reduce the output of the fluorescent lamps operated by connected dimming ballasts. The control logic will then resample the light level from the environmental sensor and do one of three things: If the newly sampled light level is close to the setpoint level, the ballast output will be unchanged. If the sampled light level is (still) higher than the setpoint, then the control logic will decrease the ballast output by a small amount and repeat the above step by resampling the environmental sensor. If the sampled light level is lower than the setpoint, then the control logic will slightly increase the ballast output and repeat the above step by resampling the environmental sensor.
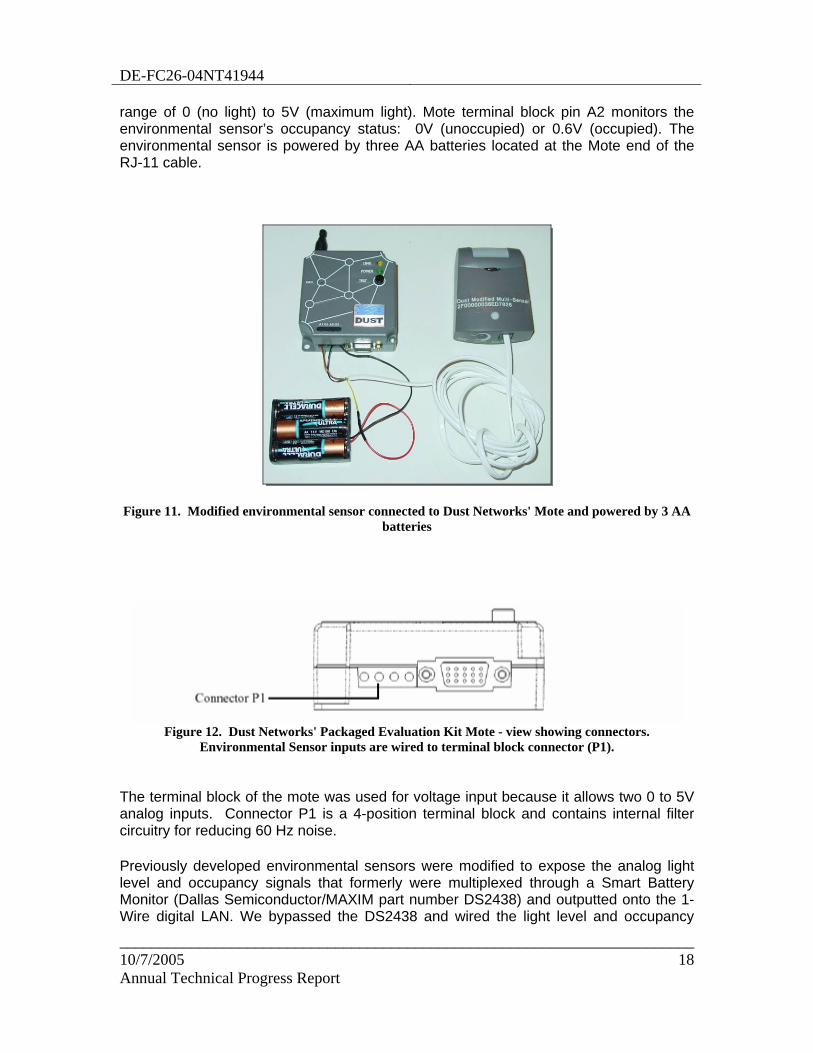
Two LBNL environmental sensors built previously around the 1-wireTM networking protocol were modified to provide occupancy sensor status and light level output to the Dust Networks’ Evaluation Kit Motes (Figure 11). Each Mote receives analog data from the environmental sensor via a 6’ RJ-11 cable connected from the environmental sensor to the Mote’s terminal block, designated as P1, and shown in Figure 12. Mote terminal block pin A1 monitors the Multi-Sensor light level, which is indicated by a voltage in the
DE-FC26-04NT41944
________________________________________________________________________ 10/7/2005 18 Annual Technical Progress Report
range of 0 (no light) to 5V (maximum light). Mote terminal block pin A2 monitors the environmental sensor’s occupancy status: 0V (unoccupied) or 0.6V (occupied). The environmental sensor is powered by three AA batteries located at the Mote end of the RJ-11 cable.
Figure 11. Modified environmental sensor connected to Dust Networks' Mote and powered by 3 AA batteries
Figure 12. Dust Networks' Packaged Evaluation Kit Mote - view showing connectors. Environmental Sensor inputs are wired to terminal block connector (P1).
The terminal block of the mote was used for voltage input because it allows two 0 to 5V analog inputs. Connector P1 is a 4-position terminal block and contains internal filter circuitry for reducing 60 Hz noise.
Previously developed environmental sensors were modified to expose the analog light level and occupancy signals that formerly were multiplexed through a Smart Battery Monitor (Dallas Semiconductor/MAXIM part number DS2438) and outputted onto the 1-Wire digital LAN. We bypassed the DS2438 and wired the light level and occupancy

DE-FC26-04NT41944
________________________________________________________________________ 10/7/2005 19 Annual Technical Progress Report
sensor outputs directly to the modular jack on the environmental sensor. Then a simple 4 wire cable with RJ-11 connectors was used to route the signals from the environmental sensor to the Dust Mote.
The original environmental sensor developed by LBNL also measured temperature by virtue of the fact that the DS2438 in the environmental sensor contained an internal thermistor. However, since the DS2438 was bypassed in our wireless implementation, the measurement of temperature must be done elsewhere. The Dust sensor board already contains a temperature sensor; therefore, the same basic functionality can eventually be provided.
It is important to realize that the environmental sensor that was modified for wireless operation in this contract was originally designed as a wired (tethered) sensor connected to an always-on 12 VDC power supply. Because of budget and scheduling constraints we did not have the luxury of designing a low-power consumption environmental sensor from scratch that might have been more suited to wireless (untethered) operation. While the light detecting portion of the environmental sensor has relatively low power requirements, the occupancy sensor portion should be replaced with a low-power consumption detector as well.
The TSLG257 photodiode was used for light sensing. When combined with a Hoya CM500 color correcting filter the spectral response of this particular photodiode is reasonably close to the desired photopic response. This results in low errors due to mismatch between the detector response and the photopic curve.
One of the environmental sensors modified for the contract was tested at LBNL. The results are below.
Occupancy Sensing The tested environmental sensor detected occupancy with a power supply voltage greater than 3.8V. The particular occupancy sensor used by LBNL contains an LED that blinks on briefly (about 1 second) when it detects occupancy. When the occupancy is sensed, the sensor sends 0.6 V to the A2 terminal of the mote. Currently, the signal duration is short (in the range of seconds). LBNL will increase the duration to detect occupancy and relay the information for the control logic software. The angular range of the sensor has been confirmed to be 120 degrees.
Light Level Sensing The maximum voltage output of the environmental sensor’s illuminance sensor is limited by the battery supply voltage, with a further unknown reduction due to losses in internal circuitry. Therefore, as supply voltage decreases with increasing battery drain, the output voltage indicating maximum light level will also decrease. This means that readings at the high end of the voltage range should be used carefully since the maximum light level measured decreases as the batteries age.
LBNL tested the light sensor for maximum illuminance level, resolution and level of accuracy. Initially, we found that the light sensor was far too sensitive for the desired
DE-FC26-04NT41944
________________________________________________________________________ 10/7/2005 20 Annual Technical Progress Report
range of iluminance (0-1000 lux). We determined that the gain of the light detector’s photo amplifier could not be easily changed. Unable to reduce the gain electrically, we elected to accomplish the same objective by using a pin hole filter over the detector. This is an inelegant, if expedient, solution since it is not easily reproducible across different sensors.
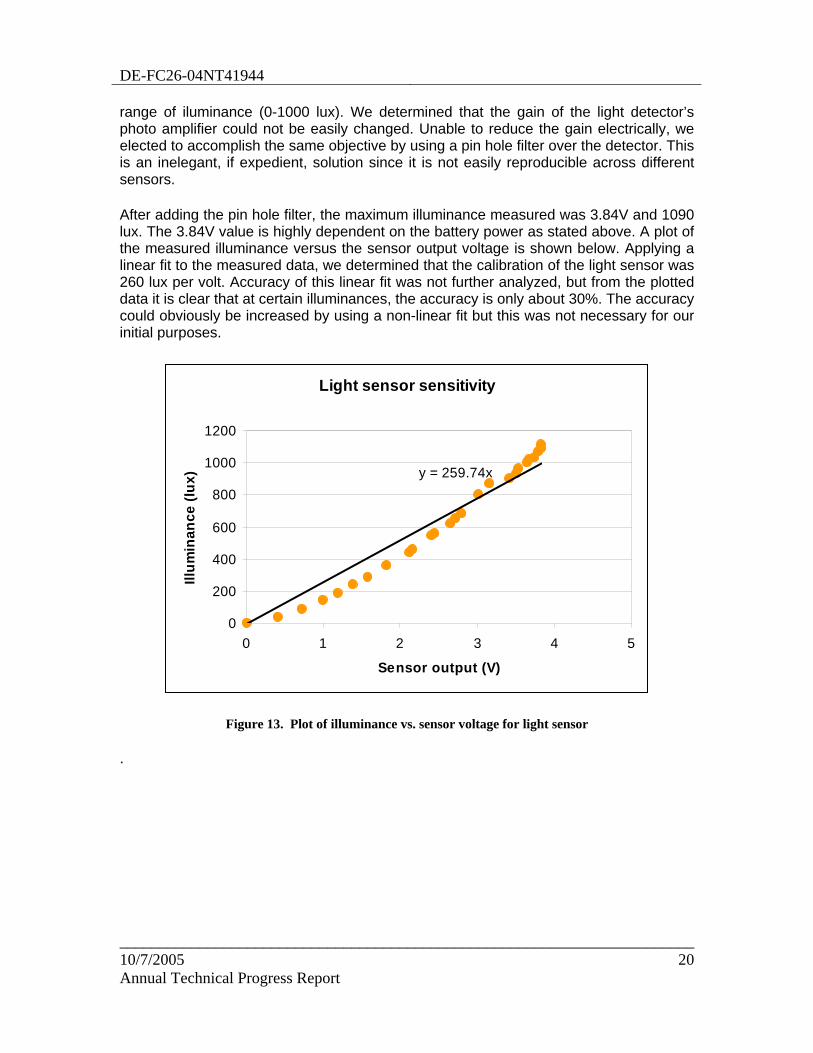
After adding the pin hole filter, the maximum illuminance measured was 3.84V and 1090 lux. The 3.84V value is highly dependent on the battery power as stated above. A plot of the measured illuminance versus the sensor output voltage is shown below. Applying a linear fit to the measured data, we determined that the calibration of the light sensor was 260 lux per volt. Accuracy of this linear fit was not further analyzed, but from the plotted data it is clear that at certain illuminances, the accuracy is only about 30%. The accuracy could obviously be increased by using a non-linear fit but this was not necessary for our initial purposes.
Light sensor sensitivity
y = 259.74x
0
200
400
600
800
1000
1200
0 1 2 3 4 5
Sensor output (V)
Illum
inan
ce (l
ux)
Figure 13. Plot of illuminance vs. sensor voltage for light sensor .
DE-FC26-04NT41944
________________________________________________________________________ 10/7/2005 21 Annual Technical Progress Report
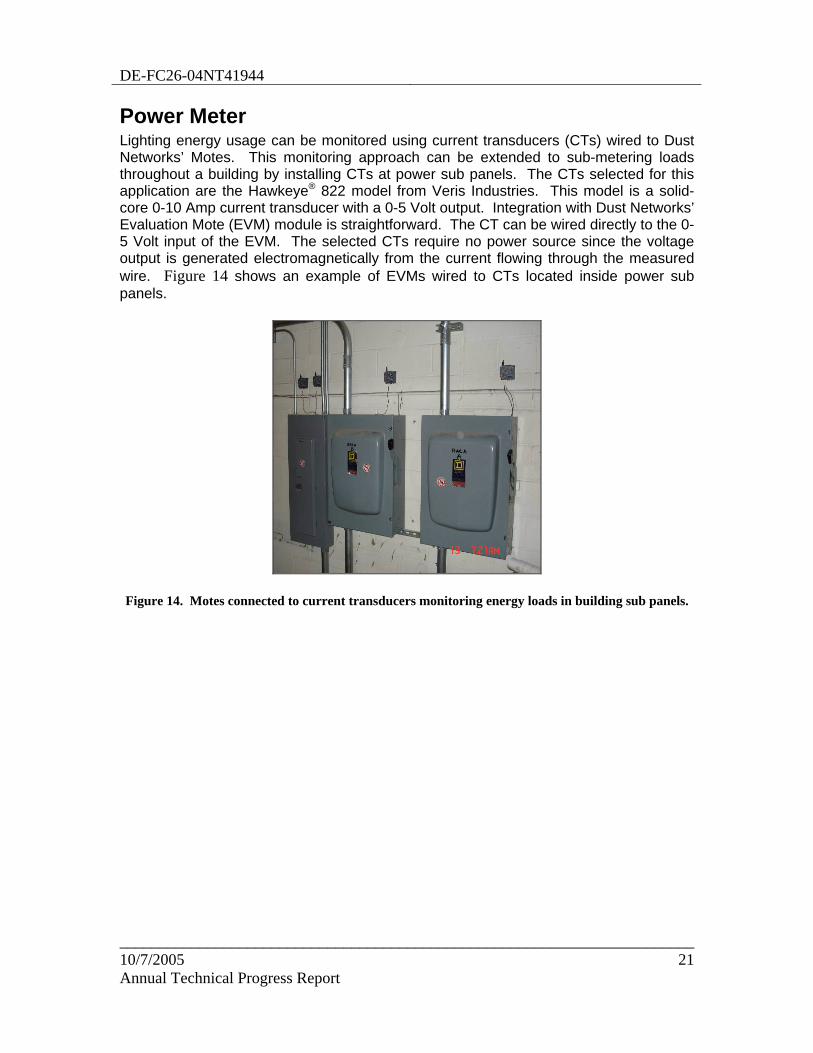
Power Meter Lighting energy usage can be monitored using current transducers (CTs) wired to Dust Networks’ Motes. This monitoring approach can be extended to sub-metering loads throughout a building by installing CTs at power sub panels. The CTs selected for this application are the Hawkeye® 822 model from Veris Industries. This model is a solid-core 0-10 Amp current transducer with a 0-5 Volt output. Integration with Dust Networks’ Evaluation Mote (EVM) module is straightforward. The CT can be wired directly to the 0-5 Volt input of the EVM. The selected CTs require no power source since the voltage output is generated electromagnetically from the current flowing through the measured wire. Figure 14 shows an example of EVMs wired to CTs located inside power sub panels.
Figure 14. Motes connected to current transducers monitoring energy loads in building sub panels.

DE-FC26-04NT41944
________________________________________________________________________ 10/7/2005 22 Annual Technical Progress Report
Control Logic Software The control software was designed to allow the sophisticated user (either the installer and/or commissioning agent) to set up different control algorithms to implement 1) a simple occupancy sensor, 2) an open-loop daylight control algorithm and 3) a simple demand response control algorithm. In addition, the software allows one to monitor a channel using a virtual strip chart recorder and to make “advanced” changes in the operation of the software.
Software Control Logic Diagram
Figure 15. Control Logic Software Flow Chart
Inputs to the Control Logic Software include:
1. User defined light level: Light level for ballast when manual control mode is selected
2. User-entered demand response setting: Light level will be reduced by an amount defined by operator.
3. User preferred light level: value (in Lumens) will be used in daylighting mode to adjust ballast light level based on the environmental sensor illuminance measurement.
4. Environmental Sensor illuminance: measured light level (in Lumens) will be used to adjust ballast light level in daylighting mode.
5. User Occupancy timeout: desired amount of time (in minutes) after the occupancy sensor indicates no occupancy in a room before the CLS reduces the room light level to 0%
Manual Control
Demand Response
Daylighting
Auto ON/OFF
USER (Light Level)
USER (DR shed percentage)
USER (Preferred Light Level)
ENV SENSOR (Light Level)
USER (Occupancy Timeout)
ENV SENSOR (Occupancy State)
Low Pass
Man. Ctrl. ON/OFF
Ballast Command
Control Logic

DE-FC26-04NT41944
________________________________________________________________________ 10/7/2005 23 Annual Technical Progress Report
6. Environmental Sensor occupancy: sensed occupancy in zone of sensor
Outputs of the Control Logic Software include:
1. Ballast commands
Feature Description The control logic software maintains control of commercial lighting systems in a manner that provides occupants with the following convenient, energy efficient features:
• On/Off Control - The light turns ON and OFF through use of the occupancy sensor in the environmental sensor.
• Manual Dimming Control - When the system is in “Manual” mode, the value of the dimming level signal to the ballast is set by the user through the Graphical User Interface (GUI).
• Automatic Control - When the system is in “Automatic” mode the lowest signal (up to and including OFF) of the following three sources is sent to the ballast:
1. Demand Response (DR) – The GUI to the Demand Response mode allows the user to enter a desired “Shed” value as a percentage of the existing ballast light level output (from the mote’s perspective). After the shed percentage is entered, a mode control switch in the GUI allows the operator to initiate and later exit the DR mode. Upon initiation of the DR mode, the existing ballast light level output is checked. Next, the DR ballast light level output is calculated and sent to the ballast. The DR ballast light level output is a percentage of the existing level (e.g., if the existing level was 80% and the DR mode called for a 50% shed, the DR ballast light level output would be 40%).
2. Automatic-OFF Function (Auto-OFF) - After manually turning ON the light, the system will automatically turn OFF the light 5 minutes (adjustable) after the occupant has left the zone. Note: upon re-entry to the zone after an Automatic-OFF shutdown, the occupant must turn the wall switch OFF and then back ON to bring the lights back on to 100% ballast light level output. After ballast start-up, the control logic computer will measure input values, make calculations and send a new signal to the ballast based on the sequence described in this document.
3. Daylighting Mode - Light level automatically adjusts to maintain predetermined user-defined illuminance levels during daylighting control mode. Saves energy by reducing lighting power when daylight is available. In daylighting control mode, the user can adjust the curve used to determine open-loop light level settings. The control logic will adjust the light level to correspond to the measured light level. For example, when the illuminance measurement increases, the control logic will reduce the ballast light level output. The control algorithm for this functionality is a

DE-FC26-04NT41944
________________________________________________________________________ 10/7/2005 24 Annual Technical Progress Report
linear (ramp) function. The characteristics of the ramp are set-up manually through a calibration procedure.
Display – Power level, although not directly used to determine actuation commands, is viewable through the software GUI.
Graphical User Interface Screens Operators/commissioners of the wireless lighting system use a computer based Graphical User Interface (GUI) to monitor and set up the system. It is not necessary for a user or occupant of a facility illuminated by the system to use a computer to operate their lights. However, the Main tab was created as an example of the kind of interface that would be useful for both operators and occupants. The other tabs are designed for operators only.
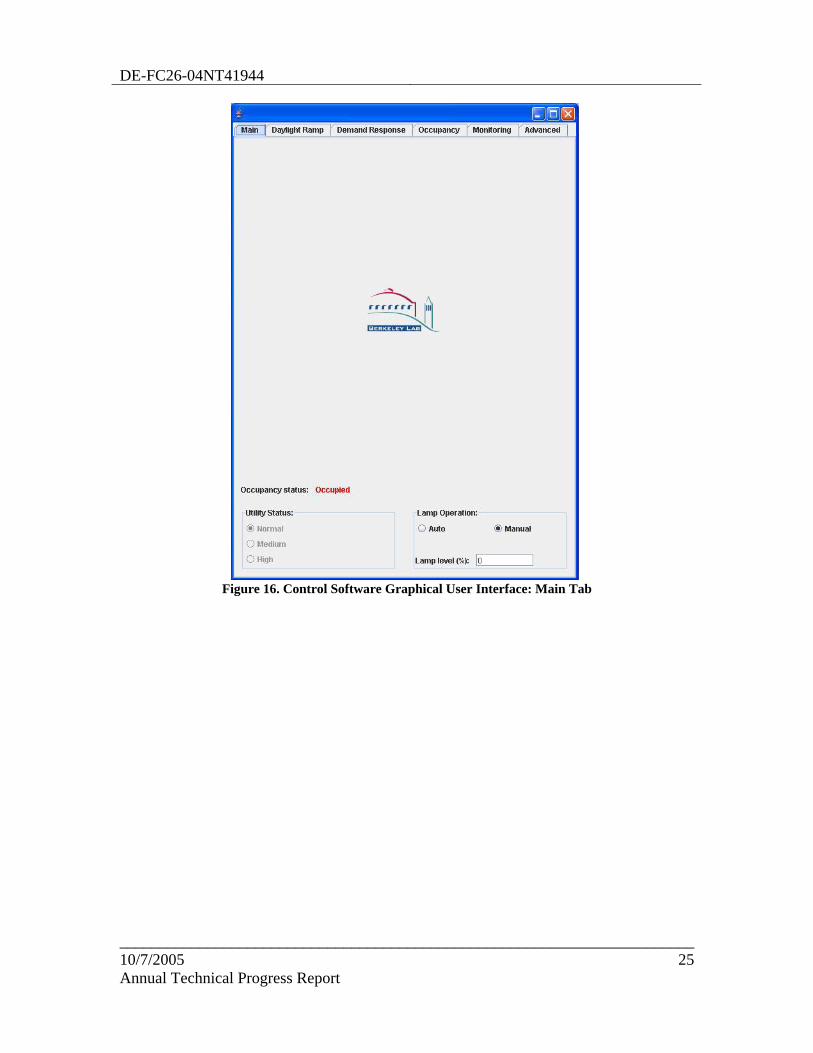
Main Tab The Main tab (Figure 16), provides the operator with an overview of the system. The current ballast command signal level is shown (lamp level %). The lamp % shown on the Main tab is the actual value of the signal sent to the ballast, regardless of the current mode of operation. The occupancy status and Demand Response (Utility Status) are also shown. The mode of lamp operation is selected by clicking either the “Auto” or “Manual” buttons. When in Manual mode, the lamp percentage is set from this screen. When in Auto mode, the lamp percentage is set by values generated by the Daylight Ramp, Demand Response, or Occupancy algorithms (Figure 17Figure 18, and Figure 19).
DE-FC26-04NT41944
________________________________________________________________________ 10/7/2005 25 Annual Technical Progress Report
Figure 16. Control Software Graphical User Interface: Main Tab
DE-FC26-04NT41944
________________________________________________________________________ 10/7/2005 26 Annual Technical Progress Report
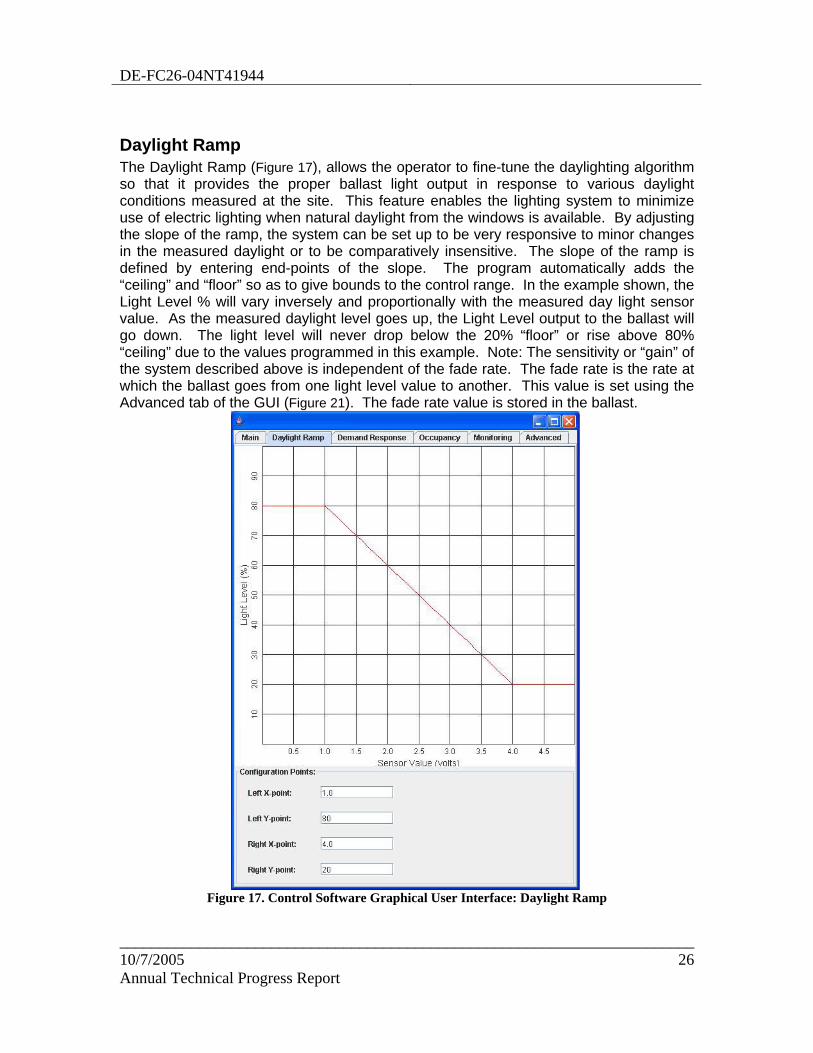
Daylight Ramp The Daylight Ramp (Figure 17), allows the operator to fine-tune the daylighting algorithm so that it provides the proper ballast light output in response to various daylight conditions measured at the site. This feature enables the lighting system to minimize use of electric lighting when natural daylight from the windows is available. By adjusting the slope of the ramp, the system can be set up to be very responsive to minor changes in the measured daylight or to be comparatively insensitive. The slope of the ramp is defined by entering end-points of the slope. The program automatically adds the “ceiling” and “floor” so as to give bounds to the control range. In the example shown, the Light Level % will vary inversely and proportionally with the measured day light sensor value. As the measured daylight level goes up, the Light Level output to the ballast will go down. The light level will never drop below the 20% “floor” or rise above 80% “ceiling” due to the values programmed in this example. Note: The sensitivity or “gain” of the system described above is independent of the fade rate. The fade rate is the rate at which the ballast goes from one light level value to another. This value is set using the Advanced tab of the GUI (Figure 21). The fade rate value is stored in the ballast.
Figure 17. Control Software Graphical User Interface: Daylight Ramp

DE-FC26-04NT41944
________________________________________________________________________ 10/7/2005 27 Annual Technical Progress Report
Demand Response The Demand Response tab (Figure 18), allows the operator to set up the behavior of the system during demand response events. The values entered under Normal, Medium and High data entry fields show the percentages that the light level will be reduced when the system enters each of those modes. The mode level can be set by the operator. This interface gives operators the ability to configure pre-determined behaviors for various levels of demand response. The existing software is designed for “operator in the loop” demand response programs. A utility or other entity would announce upcoming demand response events to the building operator via phone, e-mail, pager etc. At the agreed time, the operator changes the Demand Response mode from Normal to Medium or High reduction levels. This action would cause the system to enter a pre-determined level of demand response. Note: the control logic software is designed so as to allow future upgrades that would allow a utility or other entity to initiate the demand response event automatically, without operator in the loop.
Figure 18. Control Software Graphical User Interface: Demand Response

DE-FC26-04NT41944
________________________________________________________________________ 10/7/2005 28 Annual Technical Progress Report
Occupancy The Occupancy tab (Figure 19), allows the operator to set up the time delay until the system shuts off the lights in an unoccupied space. It also shows whether the space is currently occupied. The time delay shown in figure 5 is 30 seconds, which is useful for system demonstration purposes. In a system set up for normal use in an occupied facility, time delays between 300 and 600 seconds are more practical values.
Figure 19. Control Software Graphical User Interface: Occupancy
DE-FC26-04NT41944
________________________________________________________________________ 10/7/2005 29 Annual Technical Progress Report
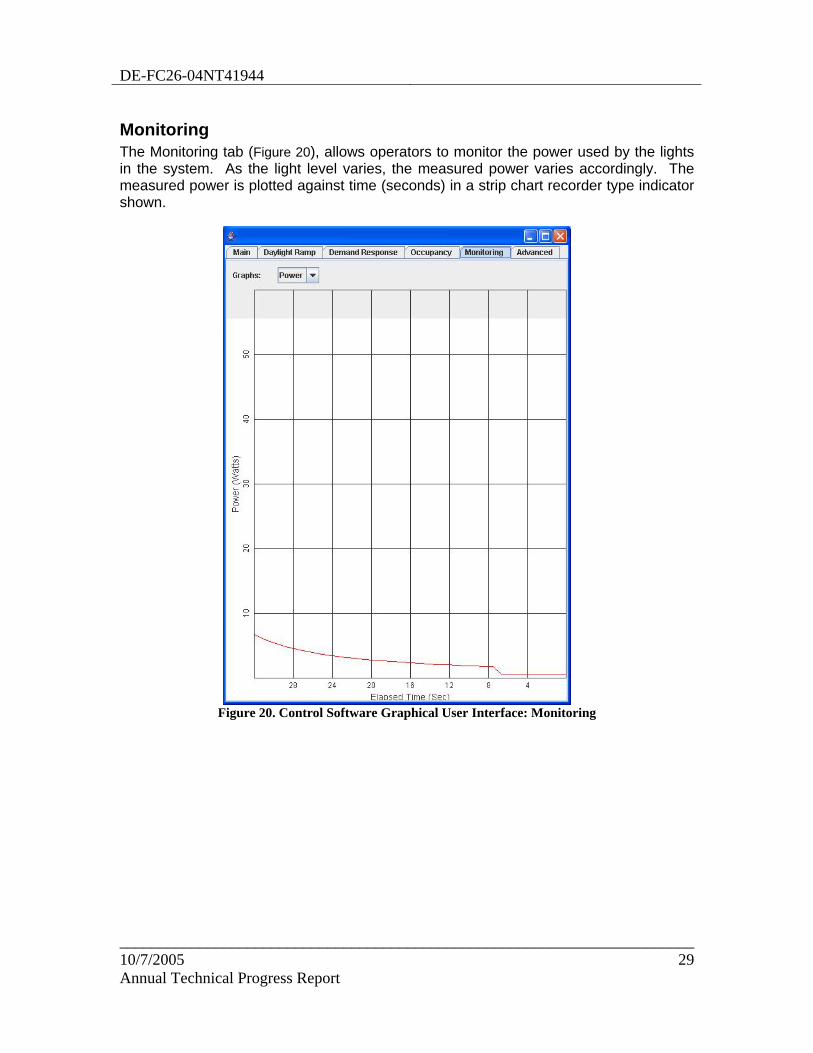
Monitoring The Monitoring tab (Figure 20), allows operators to monitor the power used by the lights in the system. As the light level varies, the measured power varies accordingly. The measured power is plotted against time (seconds) in a strip chart recorder type indicator shown.
Figure 20. Control Software Graphical User Interface: Monitoring

DE-FC26-04NT41944
________________________________________________________________________ 10/7/2005 30 Annual Technical Progress Report
Advanced The Advanced tab (Figure 21), allows operators to set-up and calibrate two advanced, seldom used functions:
1) Occupancy Sensor trigger voltage: The trigger voltage defines the threshold for which the occupancy sensor defines the occupied state.
2) ACM Fade rate: The fade rate is the rate at which the ballast goes from one light level value to another. This value (0-255) is set using the Advanced tab of the GUI (figure 7). The fade rate value is stored in the ballast.
Figure 21. Control Software Graphical user Interface: Advanced
Commissioning The Control Logic Software gives the operator tools to perform the following tasks:

DE-FC26-04NT41944
________________________________________________________________________ 10/7/2005 31 Annual Technical Progress Report
• Identification: Each network component is identified as a ballast, environmental sensor, or power meter
• Grouping: Corresponding environmental sensors, ballasts, and current sensors are grouped to determine control links (i.e. light level from sensor A drives ballasts X & Y).

DE-FC26-04NT41944
________________________________________________________________________ 10/7/2005 32 Annual Technical Progress Report
System Testing The functionality of each ballast, ACM & environmental sensor component was tested by a contractor prior to shipment to LBNL. At LBNL, system level tests were conducted. Both environmental sensors were placed within range of the SmartMesh Manager inside a cubicle. One sensor was placed on the worksurface and the other on top of the monitor in the space. As the input parameters were changed, the sensors’ readings were observed through the SmartMesh software.
After resetting the Dust Mote, it took the usual amount of time for the motes to join the network (~90 seconds). Once visible to the network, the environmental sensor profile is downloaded to the motes. From the SmartMesh Console software the voltage values for the light sensor and the occupancy sensor are both accessible. The slope and cross-over points for the trend line are entered using the tool provided by the Smart Mesh software so as to view the approximate values for the light sensor.
The system testing efforts concentrated on fixture and ACM integration. Figure 22 shows the fixture and ACM test set up.
Figure 22. Fixture/ACM set-up for system testing

DE-FC26-04NT41944
________________________________________________________________________ 10/7/2005 33 Annual Technical Progress Report
Cost-Benefit Analysis There are multiple factors weighing into the cost-benefit analysis of lighting control systems, including component pricing, installation, commissioning, energy pricing, labor, and the physical layout of the building undergoing retrofit. We have taken a dual approach by looking at the payback period of implementing such a retrofit lighting solution and at itemized costs relative to a wired retrofit solution. The payback cost analysis looks at a range of ballast prices, energy savings, and building size.
Retrofit Savings The objectives of completing a cost analysis based on retrofit savings are to determine the cost-effective component price for wireless ballasts installed as a retrofit into a typical office application, and to determine cost effectiveness for various building sizes. The important inputs are the equipment and labor costs and assumptions about the actual achievable energy savings. An analysis was prepared based on installing a wireless lighting control system in an existing building that is initially operating with fixtures containing three T-12 lamps (120 W per fixture) and simple on/off switch controls. Components required for the wireless retrofit include wireless electronic dimmable ballasts, wireless environmental sensors, high efficiency T-8 fluorescent lamps, and network management hardware. The cost of installation and commissioning was estimated by consultation with industry experts and added to the component costs. To calculate payback, the energy savings due to advanced daylighting, occupancy sensing, demand response and improved lamp efficiency was estimated as a percent of the pre-retrofit energy usage. The analysis was prepared as an Excel spreadsheet to allow for future modifications and extensions of the cost model. The common assumptions are: 3-lamp fixtures distributed evenly over the area on 8-ft centers Sensors are placed every 1200 sq. ft. Electricity cost: $0.10/kWh Annual Operating Hours: 3500 hr Old system watts/fixture: (Used 120 watts in this analysis) New system watt/fixture (100% output): Used 80 watts Assumptions were validated through discussion with industry experts and are typical of expected office environments. A Simple Payback Table is presented. We assume a 16,000 sq. ft. office and present payback over a range of energy savings as well as a range of ballast costs. (According to the DOE’s Core Data Book, the median size of US commercial buildings is around 17,000 sq. ft. so our analysis is for a “typical” size building).
DE-FC26-04NT41944
________________________________________________________________________ 10/7/2005 34 Annual Technical Progress Report
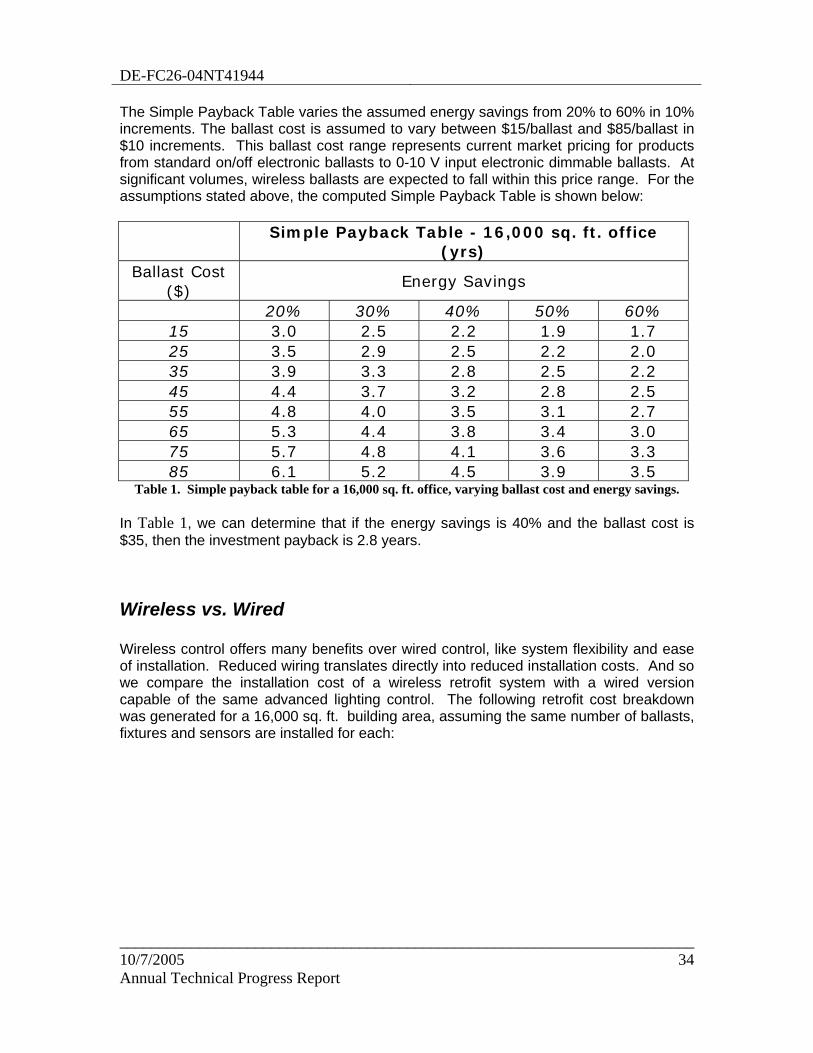
The Simple Payback Table varies the assumed energy savings from 20% to 60% in 10% increments. The ballast cost is assumed to vary between $15/ballast and $85/ballast in $10 increments. This ballast cost range represents current market pricing for products from standard on/off electronic ballasts to 0-10 V input electronic dimmable ballasts. At significant volumes, wireless ballasts are expected to fall within this price range. For the assumptions stated above, the computed Simple Payback Table is shown below:
Simple Payback Table - 16,000 sq. ft. office
(yrs) Ballast Cost
($) Energy Savings
20% 30% 40% 50% 60% 15 3.0 2.5 2.2 1.9 1.7 25 3.5 2.9 2.5 2.2 2.0 35 3.9 3.3 2.8 2.5 2.2 45 4.4 3.7 3.2 2.8 2.5 55 4.8 4.0 3.5 3.1 2.7 65 5.3 4.4 3.8 3.4 3.0 75 5.7 4.8 4.1 3.6 3.3 85 6.1 5.2 4.5 3.9 3.5
Table 1. Simple payback table for a 16,000 sq. ft. office, varying ballast cost and energy savings. In Table 1, we can determine that if the energy savings is 40% and the ballast cost is $35, then the investment payback is 2.8 years.
Wireless vs. Wired Wireless control offers many benefits over wired control, like system flexibility and ease of installation. Reduced wiring translates directly into reduced installation costs. And so we compare the installation cost of a wireless retrofit system with a wired version capable of the same advanced lighting control. The following retrofit cost breakdown was generated for a 16,000 sq. ft. building area, assuming the same number of ballasts, fixtures and sensors are installed for each:

DE-FC26-04NT41944
________________________________________________________________________ 10/7/2005 35 Annual Technical Progress Report
Wireless Retrofit Cost Breakdown Wired Retrofit Cost Breakdown Total cost: $31,912 Total Cost: $45,920
Ballasts, $18,750
Wiring, $0
Lamps, $1,500
Network Manager/Connection
Box, $400
Management SW, $5,000
Total Labor, $4,862
Ballasts, $16,250
Wiring, $3,000 Lamps, $1,500 Network Manager/Connection
Box, $3,000
Management SW, $5,000
Total Labor, $11,620
Figure 23. Cost breakdown of Wireless solution (left) and wired solution (right) The cost breakdown in Figure 23 shows that the wireless retrofit offers a 30% total savings with respect to the wired retrofit cost. This analysis assumes ballasts prices of $65 for a wired dimmable ballast and $75 for a wireless ballast. Although the wireless ballasts are slightly more expensive than the wired version, this is more than compensated for by the almost 60% reduction in labor costs, elimination of wiring costs, and over 10x reduction in network management costs. The labor required to install a wired retrofit system includes ballast and lamp replacement, control wiring installation, and commissioning. A wireless system retrofit necessitates ballast and lamp replacement, but eliminates wiring completely, and decreases commissioning labor by about half. For a typical wired installation, a significant portion of the commissioning process is dedicated to troubleshooting and testing wiring connections. By eliminating this time consuming operation, commissioning can be completed much more rapidly. Additionally, network management of a wired system requires costly gateways and signal conversions to tie the lighting controls to building control programs. A Dust Networks’ Manager can be connected directly to a building LAN. Network monitoring and control can be performed directly over this link. Since it is clear from our analysis that the most significant cost in the wireless installation is the cost of the wireless dimming ballasts, reducing investment payback times requires reductions in both the cost of the wireless mote and the dimming ballast. Currently, electronic dimmable ballasts are sold to contractors for between $40 and $65 each and motes cost tens of dollars. As wireless technologies enable the installation of energy saving lighting controls in existing buildings where the vast reservoir of energy savings resides, volume production and energy savings initiatives will drive ballast costs down and create demand. In a mature market, the cost of a dimming ballast without the wireless mote should drop to $20-30/unit contractor price. A future path towards mote cost reduction includes increased volume as the fledgling wireless mesh networking field grows, and moving towards silicon-based solutions. Motes are currently made up of several off-the-shelf components, but future versions will more likely be radically cost reduced by creating application-specific integrated circuits (ASICs). A potential system implementation that is not considered in the preceding analysis makes use of the ACM to drive several electronic dimmable ballasts. In this configuration, ballasts would be wired with 0-10 V control wires from the ACM. The ACM, integrated with a wireless mote, would eliminate costly control wiring runs from power panels to distributed control points. It is estimated that such a hybrid solution may

DE-FC26-04NT41944
________________________________________________________________________ 10/7/2005 36 Annual Technical Progress Report
prove to be cost effective in the case that ballast costs make system adoption cost prohibitive.

DE-FC26-04NT41944
________________________________________________________________________ 10/7/2005 37 Annual Technical Progress Report
Budget Period 2 Overview Budget Period 2 will proceed as originally contemplated in the project proposal, with an objective of “Applying Second Generation Wireless Technology to Controllable Ballasts.” The overall project schedule will continue with efforts towards evaluating the prototype system developed in BP 1 and building a new revision of integrated Mote/Ballasts using next generation motes. Cost analysis will show reduced cost for wireless control by implementing single chip solutions.
DE-FC26-04NT41944
________________________________________________________________________ 10/7/2005 38 Annual Technical Progress Report
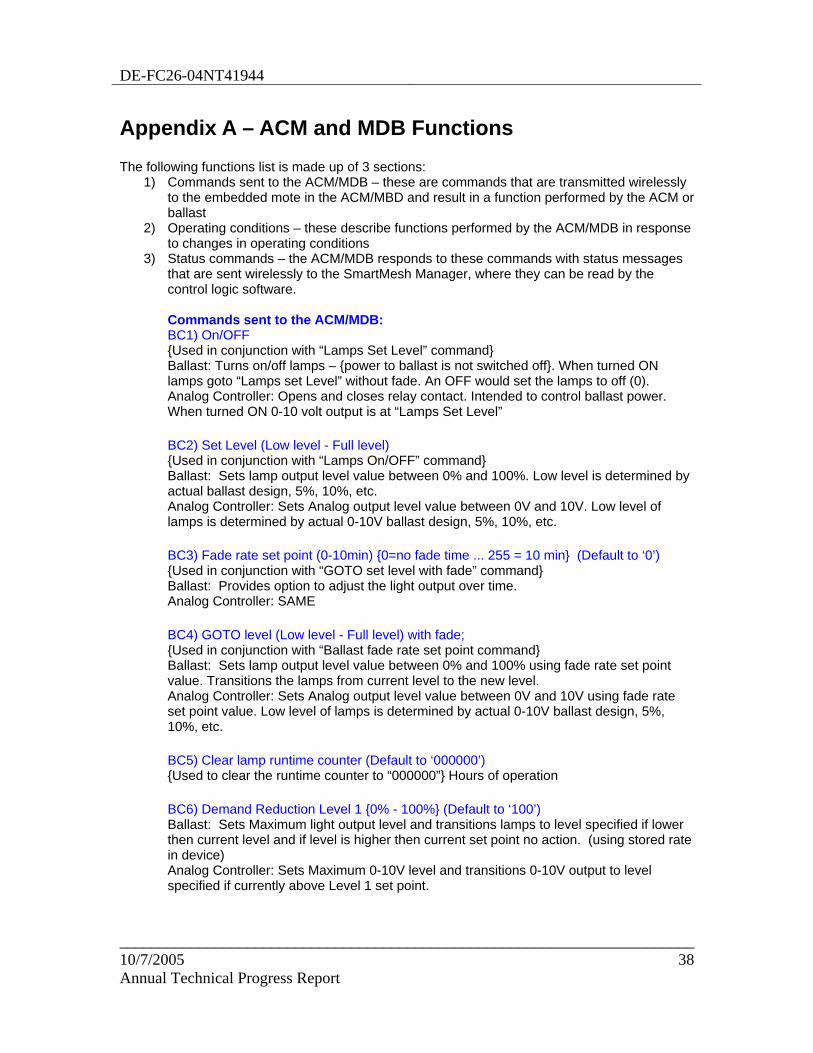
Appendix A – ACM and MDB Functions
The following functions list is made up of 3 sections: 1) Commands sent to the ACM/MDB – these are commands that are transmitted wirelessly
to the embedded mote in the ACM/MBD and result in a function performed by the ACM or ballast
2) Operating conditions – these describe functions performed by the ACM/MDB in response to changes in operating conditions
3) Status commands – the ACM/MDB responds to these commands with status messages that are sent wirelessly to the SmartMesh Manager, where they can be read by the control logic software. Commands sent to the ACM/MDB: BC1) On/OFF {Used in conjunction with “Lamps Set Level” command} Ballast: Turns on/off lamps – {power to ballast is not switched off}. When turned ON lamps goto “Lamps set Level” without fade. An OFF would set the lamps to off (0). Analog Controller: Opens and closes relay contact. Intended to control ballast power. When turned ON 0-10 volt output is at “Lamps Set Level” BC2) Set Level (Low level - Full level) {Used in conjunction with “Lamps On/OFF” command} Ballast: Sets lamp output level value between 0% and 100%. Low level is determined by actual ballast design, 5%, 10%, etc. Analog Controller: Sets Analog output level value between 0V and 10V. Low level of lamps is determined by actual 0-10V ballast design, 5%, 10%, etc. BC3) Fade rate set point (0-10min) {0=no fade time ... 255 = 10 min} (Default to ‘0’) {Used in conjunction with “GOTO set level with fade” command} Ballast: Provides option to adjust the light output over time. Analog Controller: SAME BC4) GOTO level (Low level - Full level) with fade; {Used in conjunction with “Ballast fade rate set point command} Ballast: Sets lamp output level value between 0% and 100% using fade rate set point value. Transitions the lamps from current level to the new level. Analog Controller: Sets Analog output level value between 0V and 10V using fade rate set point value. Low level of lamps is determined by actual 0-10V ballast design, 5%, 10%, etc. BC5) Clear lamp runtime counter (Default to ‘000000’) {Used to clear the runtime counter to “000000”} Hours of operation BC6) Demand Reduction Level 1 {0% - 100%} (Default to ‘100’) Ballast: Sets Maximum light output level and transitions lamps to level specified if lower then current level and if level is higher then current set point no action. (using stored rate in device) Analog Controller: Sets Maximum 0-10V level and transitions 0-10V output to level specified if currently above Level 1 set point.
DE-FC26-04NT41944
________________________________________________________________________ 10/7/2005 39 Annual Technical Progress Report
BC7) Demand Reduction Level 2 {0% - 100%} (Default to ‘100’) Ballast: Sets Maximum light output level and transitions lamps to level specified if currently above Level 2 set point. Analog Controller: Sets Maximum 0-10V level and transitions 0-10V output to level specified if currently above Level 2 set point. BC8) Demand Reduction Reset for Level 1 and Level 2 Command resets max level to 100% for level 1 and level 2 and lamp set level is know set to demand reduction {last level command is changed}. Ballast: Resets Maximum level to 100% and does no action with output. Analog Controller: SAME BC9) Lamp Warning (also known as blink or flash) Warning is done quickly < 1 sec. Ballast: Lamps go from current level to Max Level – then to 10% - and back to initial level Analog Controller: 0-10V output goes from current level to Max Level – then to 2V - and back to initial current level. BC10) GOTO previous Level Ballast: Device retains the previous level of the lights prior to a change of state. When command is received the lamps are changed to the previous level with fade. Analog Controller: Device retains the previous level of the 0-10V output prior to a change of state. When command is received output is changed to the previous level. Operating conditions: - Power ON level (Default to ‘0’) Commands for information returned back to the System: ** BR1) Lamp status On/Off Ballast: Returns the status of the Lamps (0=lamps off , value > 0 equals percent level Analog Controller: Sends back the status of the 0-10V output ** BR2) Ballast operating status (to be defined) Ballast: Returns key information of ballast (operating voltage, lamp failure Status, ?) Analog: ? ** BR3) Ballast Power level (to be confirmed for capability and defined) Ballast: Returns the power level of the ballast - Analog Controller: ? ** BR4) Diagnostic info (to be confirmed for capability and defined) Ballast: ? Analog: ? ** BR5) Lamp run time counter (to be confirmed for capability and defined) Ballast: Returns the value of the counter internal “0000” Used to identify time lamps have been ON. Analog Controller: Returns the value of the counter “0000” Used to identify time 0-10V has been above “0” level.
**These commands have not yet been implemented.

DE-FC26-04NT41944
________________________________________________________________________ 10/7/2005 40 Annual Technical Progress Report
Appendix B – Ballast Testing and Qualification LAMP FAULT TESTING Test for
Ballast Only (x)
LINE DISTURBANCE TESTING Test for Ballast Only (x)
Diode Mode Lamp Brown Out(80%) Single Lamp Short X Line Drop Out(0%) One Lamp Removed X Line Surge(150%) Red/Blue Short X Line Transients(IEEE 587) ARC Test X Inrush Test Wrong Lamp X Freq Shifts Degassed Lamp X Open Filament X AGENCY TESTS Filament Shorts X EMI Conductive Potentiometer Test X EMI Radiated
UL/Leakage X MARGIN TESTING UL/Hipot One Lamp out Voltage UL/Foil Test X 30sec/30sec Lamp Life Test Filament Temp Rise X RELIABILITY TESTING Line Regulation Multi Thermal Couple Voltage Step Stress Thermal Camera Dim Mode % Light vs Power Temp Step/Stress
Cold Strike Time COMPONENT EVALUATION Low Line 2' Lamp Strike 0C Capacitive Jar Test FMEA Magnetic Saturation ESD FET SOA ESS DOE ALT 50 piece CP,CPK,PPK Altitude Monte Carlo Simulation Humidity
Acoustic Noise The following testing requirements are added to the qualification of the product over and above the standard testing for the ACM and MDB.
1. Input Response testing, i. Power line variations (regulation, transient noise, line drop out, surge, ESD,
etc)--- ACM & MDB ii. DUST transmission testing (Multiple sequential commands, transmission
distance, lamp arcing/striking interference, Lamp faults, etc) ----ACM & MDB

DE-FC26-04NT41944
________________________________________________________________________ 10/7/2005 41 Annual Technical Progress Report
iii. Wiring faults (power line connections to 10 Volt output, Missing case ground, 10 V output shorts, Lamp current thru relay contacts, reverse +10 VIN)-----ACM
iv. Injected Noise (ground noise, 10 V sparking, Relay contact arcing, DIode mode lamps, missing lamps)-- ACM & MDB
2. Output Response testing
i. Reverse transmission of faults in the presence of interference (Lamp arcing, diode mode lamps, missing lamps) ---MDB
ii. Latent time in response to many ballast commanded to change state simultaneously. --- ACM & MDB
iii. Power line interruption in the middle of a MOTE command ---- ACM & MDB iv. Simultaneous transmission of different commands from two mote kits. ACM
& MDB v. Initialization and Last State recovery from line interruption.
3. Software validation.
i. Automatic tester for RS232 stacked Vector command injection with various sequences and time intervals. Needed to test
ii. The command set since the MOTE doesn't allow stacked commands. ACM and MDB
4. Micro interrupt structure analysis during simultaneous fault occurrences and MOTE Transmissions---MDB
5. Fault Tree analysis testing. (Resonator off frequency. low battery, stuck bit, etc) ACM &
MDB
6. d. Environmental testing. i. Excessive Cold or heat. ii. Thermal Shock iii. Excessive humidity (Condensing) iv. Vibration pseudo-random