annual water quality report - lbwater.org · area at our groundwater treatment plant. both the...
TRANSCRIPT

ANNUAL WATER QUALITY REPORT 1 / 19
Annual WaterQuality ReportWATER TESTING PERFORMED IN 2018
PROUDLY PRESENTED BY:
Long Beach Water DepartmentAward Winning Members ofPartnership for Safe Water (AWWA)PWS ID#: 1910065
Long Beach Board ofWater Commissioners:Gloria Cordero, PresidentHarry Saltzgaver, Vice PresidentFrank Martinez, Secretary Robert Shannon, Commissioner Art Levine, Commissioner

ANNUAL WATER QUALITY REPORT 2 / 19
Dear Customer:
LBWD takes our responsibilities to our community very seriously. To safeguard our continued exceptional water quality for nearly half a million customers, our skilled staff ensure that the water we serve meets or exceeds all federal and state water quality standards. Our water quality staff performed over 70,000 tests in 2018 and analyzed the samples for more than one hundred drinking water contaminants.
We are proud to provide our customers with reliable, affordable, and exceptional quality drinking water. Should you have any questions or concerns, please feel free to call our Water Quality Laboratory at 562.570.2482 for more information. In addition, we always welcome your comments and suggestions at our Board of Water Commissioner meetings. Please visit lbwater.org to view the upcoming meeting schedule.
We appreciate your reading the annual water quality report. Thank you for your time and interest.
Sincerely,
Chris GarnerWE ARE PROUD TO PROVIDE OUR CUSTOMERS WITH RELIABLE, AFFORDABLE AND EXCEPTIONAL QUALITY DRINKING WATER.
MESSAGEFROM THEGENERALMANAGER

ANNUAL WATER QUALITY REPORT 3 / 19
The Consumer Confident Report, or CCR, is an annual drinking water quality report that the Safe Drinking Water Act (SDWA) requires public water systems to provide each customer. The purpose of the CCR is to inform customers about the quality of their drinking water, where their drinking water comes from, what it takes to deliver water to businesses and homes and the importance of protecting drinking water sources.
LBWD will publish the 2018 CCR electronically at lbwater.org/annual-water-quality-report. If you would prefer to receive a hard copy of the CCR, please contact us at 562.570.2482 to request a copy or visit your neighborhood Long Beach Library branch.
El Reporte de Confianza de los Consumidores, o CCR, es un informe anual de la calidad de agua potable que la Ley de Agua Potable Segura (SDWA) requiere LBWD para ofrecer a cada cliente. El propósito de la CCR es para aumentar la conciencia de los consumidores acerca de la calidad de su agua potable, de donde proviene, lo que se necesita para suministrar agua a las empresas y los hogares y la importancia de proteger fuentes de agua potable.
El LBWD publicará el CCR del 2018 electrónicamente, en lbwater.org/ annual-water-quality-report. Si prefiere recibir una copia impresa del reporte CCR, póngase en contacto con LBWD por teléfono al 562.570.2482 para solicitar una copia o visite a una biblioteca de Long Beach en su vecindad.
CCR DELIVERY
The Long Beach Water Department is pleased to inform you that your tap water met all United States Environmental Protection Agency and State of California drinking water standards for 2018.
ConsumerConfidenceReport 2018

ANNUAL WATER QUALITY REPORT 4 / 19
LONG BEACH DRINKING WATER SOURCES
During 2018, approximately 58 percent of the potable water served by LBWD was supplied by local groundwater; the remaining 42 percent was supplied through purchased, imported surface water. LBWD purchases treated surface water from the Metropolitan Water District of Southern California (MWD) and treats the groundwater pumped from active wells around the Long Beach and Lakewood area at our Groundwater Treatment Plant. Both the purchased surface water quality and the treated groundwater quality surpass the federal and state drinking water standards. The federal regulations are set by the U.S. Environmental Protection Agency (US-EPA), and the state standards are set by the State Water Resources Control Board (State Board) Division of Drinking Water.
Two major aqueducts supply the surface waters feeding MWD’s five regional treatment plants. Colorado River water, which has the higher mineral content of the two supplies, is brought into Southern California through the 242-mile long Colorado River Aqueduct (CRA). This aqueduct, constructed and operated by MWD, originates at Lake Havasu and terminates in Southern California at Lake Mathews. State Water Project (SWP) water, which contains a lower mineral content but higher natural organic matter content, is conveyed through the California Aqueduct. This aqueduct, constructed and operated by the California Department of Water Resources, transfers water originating from Lake Oroville in Northern California through 441 miles before terminating in Southern California.
The groundwater treated at the LBWD Groundwater Treatment Plant originates from the San Gabriel watershed.
Primarily Groundwater
CITY OF LONG BEACH
City of Paramount
City of Compton
City of Angeles
City of Los Alamitos
City of Signal Hill
City of Seal Beach
City of Hawaiian Gardens
City of Lakewood
Pacific Ocean Primarily MWD Water
BOTH THE PURCHASED SURFACE WATER QUALITY AND THE TREATED GROUNDWATER QUALITY SURPASS THE FEDERAL AND STATE DRINKING WATER STANDARDS.
(Figure 1.0)

ANNUAL WATER QUALITY REPORT 5 / 19
The watershed is fed by rain and snowmelt and flows through washes and creeks into the San Gabriel River and Whittier Narrows before percolating into the underground aquifer of the central basin area of Los Angeles. The City of Long Beach is a part of the Central Basin service area.
For hydraulic reasons, the Long Beach service area may be divided into two main regions: the MWD zone, which primarily receives purchased, treated surface water, and the blended zone, which may receive a combination of treated groundwater and purchased, treated surface water. LBWD sometimes changes the blends of water in our system, and the residents may notice the associated mineral content (referred to as hardness) changes to the water quality.
Regardless of the area in Long Beach that you work or live in, LBWD’s goal is to provide water that meets or surpasses all water quality regulations at the most reasonable cost to our customers. Figure 1.0 shows the areas that may be affected by a change in the water blend.
OF POTABLE WATER SERVED BY LBWD WAS SUPPLIED BY LOCAL
GROUNDWATER58%
INFORMATION ABOUT DRINKINGWATER CONTAMINANTS
Drinking water sources (both tap water and bottled water) include rivers, lakes, streams, ponds, reservoirs, springs and wells. As the water travels over the surface of the land or through the ground, the water dissolves naturally occurring minerals - sometimes including radioactive material - and can also pick up substances resulting from the presence of animals and human activity.
In order to ensure that tap water is safe to drink, the US-EPA and the State Boardprescribe regulations that limit the amount of certain contaminants in water provided by public water systems. State Board regulations also establish limits for contaminants in bottled water that provide the same protection for public health.
Drinking water, including bottled water, may reasonably be expected to contain small amounts of some contaminants. The presence of contaminants does not necessarily indicate that water poses a health risk. More information about contaminants and potential health effects can be obtained by calling the US-EPA’s Safe Drinking Water Hotline (1.800.426.4791).

ANNUAL WATER QUALITY REPORT 6 / 19
IMMUNO-COMPROMISED PEOPLESome people may be more vulnerable to contaminants in drinking water than the general population. Immuno-compromised people (i.e. those with cancer taking chemotherapy, who have undergone organ transplants, people with HIV/AIDS or other immune system disorders, some elderly, and infants) can be particularly at risk from infections. Immuno-compromised people should seek advice about drinking water from their health care providers. US-EPA/Centers for Disease Control (CDC) guidelines on appropriate means to lessen the risk of infection by Cryptosporidium and other microbial contaminants are available from the Safe Drinking Water Hotline.
Natural Contaminants Present in Source Water Prior to Treatment May Include:
Biological Contaminants: such as viruses and bacteria may come from sewage treatment plants, septic systems, agricultural, livestock operations and wildlife.
Inorganic Chemicals: such as salts and metals can be naturally occurring or can result from urban storm water runoff, industrial or domestic wastewater discharges, oil and gas production, mining or farming.
Pesticides and herbicides: may come from a variety of sources such as agriculture, urban storm water runoff and residential uses.
Organic Chemicals: include synthetic and volatile organic chemicals, which are by-products of industrial processes and petroleum production and can also come from gas stations, urban storm water runoff, agricultural applications and septic systems.
Radioactive materials: can be naturally occurring or can be the result of oil and gas production and mining activities.
SAFEDRINKING
WATERHOTLINE
1.800.426.4791

ANNUAL WATER QUALITY REPORT 7 / 19
SOURCE WATER ASSESSMENT
The goal of the source water assessment is to inventory all potential activities that may lessen the source water quality. LBWD purchased water in 2018 from the Metropolitan Water District of Southern California (MWD) and City of Lakewood. MWD completed its source water assessment of its Colorado River and State Project water supplies in December 2002. The Colorado River supplies are most vulnerable to recreation, urban/storm water runoff, and increasing urbanization in watershed and wastewater. State Water Project water supplies are considered most vulnerable to urban/storm water runoff, wildlife, agriculture, recreation and wastewater. A copy of the assessment can be obtained by contacting MWD at 213.217.6850.
The City of Lakewood Department of Water Resources completed an assessment in 2003 of all drinking water wells that served the city’s drinking water system. The sources are considered most vulnerable to current and historic gas stations, repair shops, storage tanks and dry cleaners. A copy of the complete assessment is available at the Lakewood City Clerk’s Office at 5050 Clark Avenue or by contacting the Lakewood Department of Water Resources, at 562.866.9771, extension 2700.
LBWD completed a new source water assessment on its active wells in July 2012. New wells that are constructed after this date must also undergo a similar assessment. The assessment concluded that all active wells are considered most
vulnerable to the community sewer collection system. Depending on location, some wells are considered vulnerable to gas stations, dry cleaners, leaking underground fuel tanks, airport activities, metal plating/finishing/fabrication, plastic/synthetics producers and historic landfills. Although the wells are considered vulnerable to the aforementioned activities, the LBWD performs water quality monitoring for each active well and has not detected any constituents that suggests contamination. It is noteworthy to point out that the physical barrier (well containment) has a high effectiveness against these contaminations. Please contact the LBWD by phone at 562.570.2482 for more details or if you would like to review the assessment document.
As required under the 1996 Safe Drinking Water Act amendments, a source water assessment must be completed for all active drinking water sources.

ANNUAL WATER QUALITY REPORT 8 / 19
SamplingResults DURING THE PAST YEAR, WE HAVE TESTED
OVER 70,000 WATER SAMPLES IN ORDER TO DETERMINE THE PRESENCE OF ANY
RADIOACTIVE, BIOLOGICAL, INORGANIC, VOLATILE ORGANIC, OR SYNTHETIC ORGANIC
CONTAMINANTS.70,000Even though all the substances in these tables are under the maximum contaminant level (MCL), it is important to include in this report the list of drinking water contaminants detected during the 2018 calendar year. The presence of these substances in the water does not necessarily indicate that the water poses a health risk. Unless otherwise noted,
the data presented in this table are from the testing performed from January 1 to December 31, 2018. The State requires us to monitor for certain substances less than once per year because the concentrations of these substances do not change frequently. In these cases, the most recent sample data are included, along with the year in which the sample was taken.
PARAMETER(UNIT OF
MEASURE)
2ND MCL MWD ZONE (114) BLENDED ZONE (325) TYPICAL SOURCES OF
CONTAMINATIONAVE. MAX RANGE AVE. MAX RANGE
Chloride (ppm) 500 88 103 52–103 52 60 42–60 Runoff/leaching from natural
deposits; seawater influence
Color (CU) 15 1 2 ND–2 2 3 ND–3 Naturally-occurring organic materials
Specific Conductance
(μS/cm)1600 795 998 412–
998 509 626 424–626
Substances that form ions when dissolved in water; seawater influence
Odor3 (TON) 3 2 NA NA 2 NA NA Naturally-occurring organic materials
Sulfate (ppm) 500 167 250 67 - 250 55 82 26–82 Runoff/leaching from natural
deposits; industrial wastes
Total Dissolved Solids (ppm) 1000 509 639 279–
639 318 371 264–371
Runoff/leaching from natural deposits
SECONDARY DRINKING WATER STANDARDS–Aesthetic Standards, 2018

ANNUAL WATER QUALITY REPORT 9 / 19
PARAMETER(UNIT OF
MEASURE)
GOALS REGULATORYLEVELS
MWD ZONE (114) BLENDED ZONE (325)
TYPICAL SOURCES OF
CONTAMINATIONPHG
(MCLG) MCL 2nd MCL NL (AL) AVE MAX RANGE AVE MAX RANGE
CLARITY
Turbidity2 (NTU) NA TT 5 NS ND 0.10 ND–
0.10 ND 0.09 ND–0.09 Soil Runoff
Turbidity2 (Lowest monthly percent of samples meeting limit) = 100%MICROBIOLOGY (% POSITIVE)
Total Coliform Bacteria4 (0) 5% NS NS City-Wide: Highest Monthly-0.70%; Range
ND–0.70%Naturally present in the environment
INORGANIC CHEMICALS
Aluminum (ppb) 600 1000 200 NS 115 236 36–
236 43 187 ND–187
Erosion of natural deposits, added during water treatment
Arsenic (ppb) 0.004 10 NS NS ND 2 ND–2 ND ND NDErosion of natural deposits, runoff from orchards and industrial process
Copper1 (ppb) 300 NS 1000 (1300)
City-wide: 90th percentile = 144, 149 sites sampled; 0 sites over Action Level (AL = 1300)
Corrosion of plumbing, erosion of natural deposits
Fluoride (ppm) 1 2 NS NS 0.8 0.9 0.7–
0.9 0.7 0.8 0.7–0.8
Erosion of natural deposits, supplemental additive
Lead1 (ppb) 0.2 NS NS (15)City-wide: 90th percentile = <DLR, 149 sites sampled; 0 sites over Action Level(AL = 15)
Internal corrosion of household plumbing, erosion of natural deposits
Nitrate (N) (ppm) 10 10 NS NS 0.4 0.7 ND–
0.7 ND 0.4 ND–0.4
Erosion of natural deposits; runoff from fertilizer use and septic systems
REGULATED PRIMARY HEALTH STANDARDS, 2018

ANNUAL WATER QUALITY REPORT 10 / 19
PARAMETER(UNIT OF
MEASURE)
HA MCL (NL)
PHG MWD ZONE (114) WTP EFFLUENT DSMRT
PPB PPB PPB AVE MAX RANGE AVE MAX RANGE AVE MAX RANGE
Chlorate (ppb) NS (800) NS 92 110 78–
110 ND ND ND 53 64 31–64
Hexavalent Chromium
(ppb)NS NS 0.02 0.063 0.074 0.053–
0.074 ND 0.032 ND–0.032 0.045 0.067 ND–
0.067
Molybdenum (ppb) 40 NS NS 4.3 4.7 4.0–4.7 6.9 7.1 6.7–7.1 5.5 6.2 4.8–
6.2Strontium
(ppb) 4000 NS NS 890 970 810–970 170 180 160–180 645 750 530–
750Vanadium
(ppb) NS (50) NS 2.6 2.9 2.3–2.9 0.4 0.41 0.4–0.41 1.8 2.4 1.4–2.4
UNREGULATED CHEMICALSREQUIRING MONITORING UNDER FEDERAL UCMR3, 2013-2014
Unregulated contaminant monitoring under the US-EPA helps to determine where certain contaminants occur and whether the contaminants need to be regulated. This unregulated contaminant monitoring under Federal UCMR 3 was done in 2013-2014. LBWD will report this same result each CCR year (2016, 2017, 2018 and 2019) until 5 years of recommended reporting is completed.
DSMRT = Distribution System Maximum Retention Time (distribution system site farthest from the drinking water utility)HA = Health Advisories;WTP = Water Treatment Plant
HEALTH EFFECTS LANGUAGE: Certain minerals are radioactive and may emit forms of radiation known as alpha, beta and photons. Some people who drink water containing alpha, beta and photon emitters in excess of the MCL over many years may have an increased risk of getting cancer. SWRCB considers 50 pCi/L to be the level of concern for beta particles.
RADIOLOGICALS, 2018
PARAMETER (UNIT OF
MEASURE)GOALS REGULATORY
LEVELS MWD ZONE (114) BLENDED ZONE (325)TYPICAL
SOURCES OF CONTAMINATION
PHG (MCLG) MCL 2ND
MCLNL
(AL) AVE. MAX RANGE AVE. MAX RANGE
Gross Alpha (GA)3 Particle
Activity (pCi/L)
(0) 15 NS NSMWD plant effluents Gross Alpha detected in the range of ND - 4 pCi/L.6 Gross Alpha was not detected in the MWD Zone of LBWD distribution in 2018.
Erosion of natural deposits
Gross Beta (GB)3 Particle
Activity (pCi/L)
(0) 50 NS NSMWD plant effluents Gross Beta detected in the range of ND - 5 pCi/L.6 Gross Beta was detected at 3.5 pCi/L in the LBWD distribution in 2018.
Decay of natural and man-made deposits
Uranium (pCi/L)3 0.43 20 NS NS
MWD plant effluents Uranium detected in the range of ND - 3 pCi/L.6 Uranium was detected at 1. 3 pCi/L in the MWD Zone of LBWD distribution in 2018.
Erosion of natural deposits
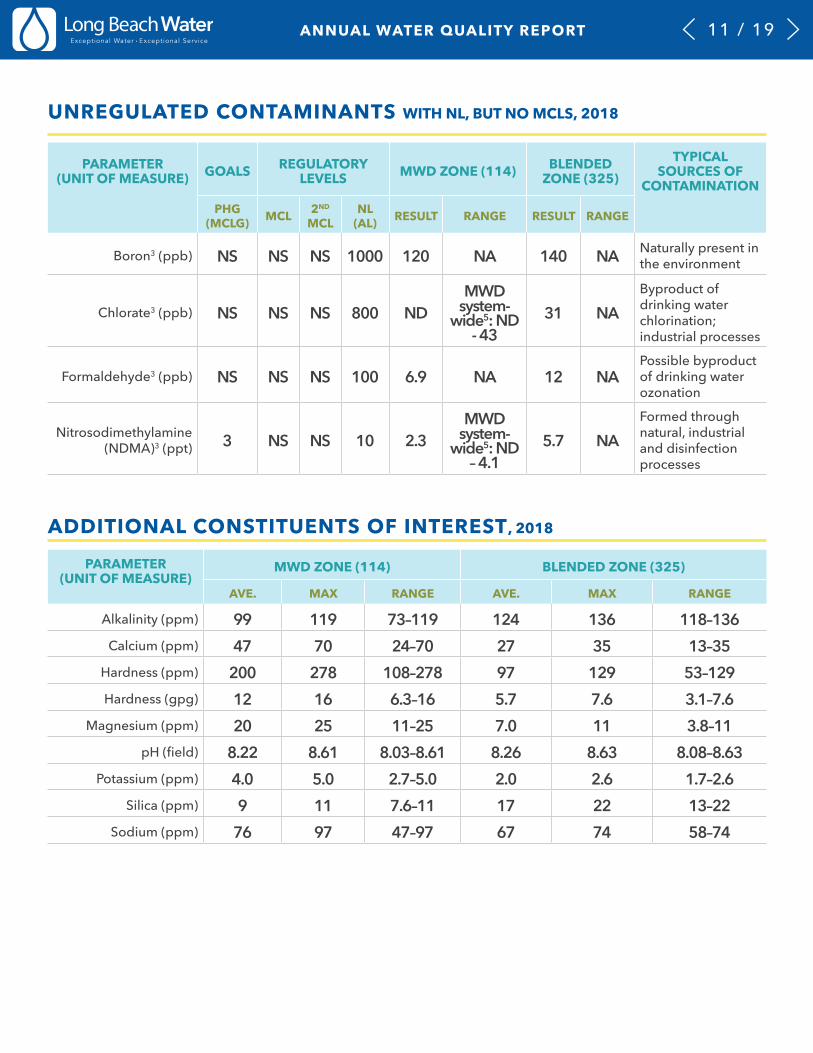
ANNUAL WATER QUALITY REPORT 11 / 19
PARAMETER(UNIT OF MEASURE) GOALS REGULATORY
LEVELS MWD ZONE (114) BLENDED ZONE (325)
TYPICAL SOURCES OF
CONTAMINATIONPHG
(MCLG) MCL 2ND MCL
NL (AL) RESULT RANGE RESULT RANGE
Boron3 (ppb) NS NS NS 1000 120 NA 140 NA Naturally present in the environment
Chlorate3 (ppb) NS NS NS 800 NDMWD
system-wide5: ND
- 4331 NA
Byproduct of drinking water chlorination; industrial processes
Formaldehyde3 (ppb) NS NS NS 100 6.9 NA 12 NAPossible byproduct of drinking water ozonation
Nitrosodimethylamine (NDMA)3 (ppt) 3 NS NS 10 2.3
MWD system-
wide5: ND – 4.1
5.7 NAFormed through natural, industrial and disinfection processes
UNREGULATED CONTAMINANTS WITH NL, BUT NO MCLS, 2018
PARAMETER(UNIT OF MEASURE)
MWD ZONE (114) BLENDED ZONE (325)
AVE. MAX RANGE AVE. MAX RANGE
Alkalinity (ppm) 99 119 73–119 124 136 118–136Calcium (ppm) 47 70 24–70 27 35 13–35
Hardness (ppm) 200 278 108–278 97 129 53–129Hardness (gpg) 12 16 6.3–16 5.7 7.6 3.1–7.6
Magnesium (ppm) 20 25 11–25 7.0 11 3.8–11pH (field) 8.22 8.61 8.03–8.61 8.26 8.63 8.08–8.63
Potassium (ppm) 4.0 5.0 2.7–5.0 2.0 2.6 1.7–2.6Silica (ppm) 9 11 7.6–11 17 22 13–22
Sodium (ppm) 76 97 47–97 67 74 58–74
ADDITIONAL CONSTITUENTS OF INTEREST, 2018

ANNUAL WATER QUALITY REPORT 12 / 19
DISINFECTION BYPRODUCTS ANDMAXIMUM RESIDUAL DISINFECTANTS, 2018
PARAMETER(UNIT OF
MEASURE)GOALS REGULATORY LEVELS
MWD ZONE (114)
BLENDED ZONE (325)
TYPICAL SOURCES OF
CONTAMINATION
PHG (MCLG) MCL 2ND MCL NL (AL)
Bromate (ppb) 0.1 10 NS NS
MWD Jensen plant effluent running annual average (RAA) was 5.2 ppb in 2018; LBWD distribution system RAA was 5.9 ppb in 2018
Byproduct of drink-ing water ozonation
Haloacetic Acids (HAA5) (ppb) NS 60 NS NS
City-wide: 9.7 ppb highest LRAA, range: 4.6 - 13 ppb
Byproduct of drink-ing water chlorina-tion
Total-Triha-lomethanes
(TTHM) (ppb)NS 80 NS NS
City-wide: 36 ppb highest LRAA, range: 27 - 47 ppb
Byproduct of drink-ing water chlorina-tion
Chloramines (ppm)
MRDL=4.0 (as Cl2 )
MRDLG=4.0 (as Cl2 )
NS NSCity-wide: 2.03 ppm high-est running annual average, HRAA; range: 0.63 – 2.65 ppm
Drinking water disinfectant added during treatment
FOOTNOTES:1. Copper and Lead – lead and copper are regulated as Treatment Technique under the Lead and Copper Rule, which
requires water samples to be collected at the consumers’ tap. If action levels are exceeded in more than 10% of consumers’ taps, water systems must take steps to reduce these levels. Compliance lead and copper monitoring was conducted in 2016 at 149 consumer taps. The values reported are in compliance with the Lead and Copper Rule. The detection limit for reporting (DLR) lead is 5 ppb. LBWD will report this same result each CCR year (2016, 2017, and 2018) until the next set of samples are taken.
2. Turbidity is a measure of the cloudiness of the water. LBWD monitors it because it is a good indicator of the effectiveness of our filtration system.
3. Single value from LBWD’s annual monitoring4. State Total Coliform Rule and Federal Revised Total Coliform Rule – The State requires, no more than 5.0% total
coliform – positive samples found in distribution system in any given month; the new Federal rule requires any positive coliform samples above 5.0% to trigger Level 1 Assessment.
5. Data triennially monitored by MWD (last monitored in 2017)6. Data from MWD’s 2017 system wide monitoring; next monitoring is scheduled for 2020.

ANNUAL WATER QUALITY REPORT 13 / 19
INFORMATION ONDETECTED SUBSTANCES
Disinfectants and Disinfection Byproducts (Trihalomethanes, Haloacetic Acids and Bromate)Disinfection of drinking water was one of the major public health advances in the 20th century. It was a major factor in reducing waterborne diseases caused by pathogenic bacteria and viruses. Long Beach Water Department achieves primary disinfection with free chlorine and utilizes chloramine as a secondary disinfectant in the distribution system. We carefully monitor the amount of disinfectant, adding the lowest quantity of chloramine necessary to protect the safety of your water throughout the distribution system. However, chlorine and chloramine can react with naturally-occurring materials in the water to form disinfection by-products (DBPs).
LONG BEACH WATER DEPARTMENT ACHIEVES PRIMARY DISINFECTION WITH FREE CHLORINE AND UTILIZES CHLORAMINE AS A SECONDARY DISINFECTANT

ANNUAL WATER QUALITY REPORT 14 / 19
Total Trihalomethanes (TTHMs) and Haloacetic Acids (HAA5) are the most common DBPs formed and are suspected to be carcinogenic in humans. Some people consuming water containing TTHM in excess of the MCL over many years may experience liver, kidney, or central nervous system problems, and may have an increased risk of getting cancer.
The values for TTHMs in the distribution system ranged from 27 – 47 ppb, with the highest locational running average (LRAA) of 36 ppb; these values are well below the MCL of 80 ppb. The distribution system HAA5 concentrations ranged from 4.6 - 13 ppb, and the highest LRAA was 9.7 ppb; also well below the MCL of 60 ppb.
Bromate, which is also a disinfection by- product, is formed when ozone reacts with naturally occurring bromide found in the source water. Systems using ozone to treat drinking water are required to monitor for bromate at the treatment plant’s effluent. While LBWD does not ozonate our water, purchased treated surface water from MWD may have detectable levels of bromate.
Exposure to high concentrations of bromate over a long period of time was shown to cause cancer in rats and kidney effects in laboratory animals, and it is suspected of potential reproductive effects in humans. US-EPA established a MCL of 10 ppb that it considers protective of non-cancer health effects from long-term exposure in humans.
In 2018, MWD’s drinking water bromate levels leaving their treatment plant were reported to be as high as 5.2 ppb (on a highest running annual average basis, HRAA). LBWD can usually decrease the bromate levels in most of our system by blending with our treated groundwater. In 2018, the HRAA for bromate was 5.9 ppb in our distribution system.
DISINFECTION OF DRINKING WATER WAS ONE OF THE MAJOR PUBLIC HEALTH ADVANCES IN THE 20TH
CENTURY. IT WAS A MAJOR FACTOR IN REDUCING WATERBORNE DISEASES CAUSED BY PATHOGENIC
BACTERIA AND VIRUSES.
ANNUAL WATER QUALITY REPORT 15 / 19
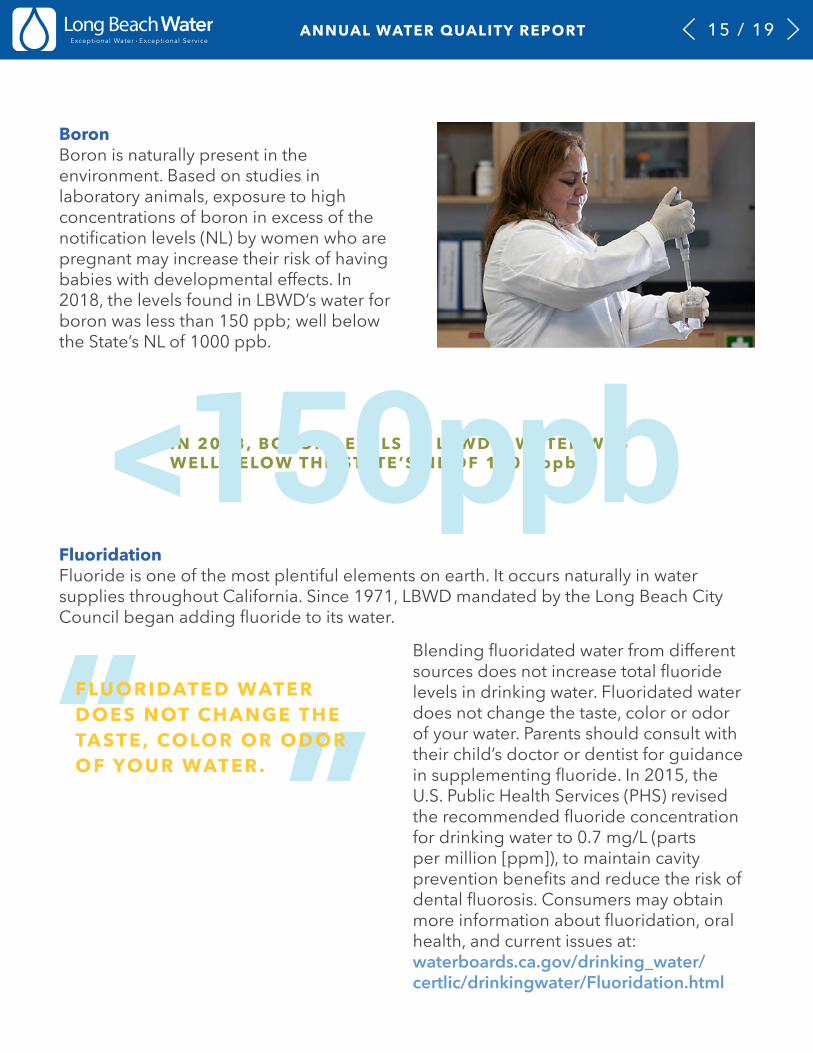
BoronBoron is naturally present in the environment. Based on studies in laboratory animals, exposure to high concentrations of boron in excess of the notification levels (NL) by women who are pregnant may increase their risk of having babies with developmental effects. In 2018, the levels found in LBWD’s water for boron was less than 150 ppb; well below the State’s NL of 1000 ppb.
FluoridationFluoride is one of the most plentiful elements on earth. It occurs naturally in water supplies throughout California. Since 1971, LBWD mandated by the Long Beach City Council began adding fluoride to its water.
IN 2018, BORON LEVELS IN LBWD’S WATER WAS WELL BELOW THE STATE’S NL OF 1000 ppb<150ppb
FLUORIDATED WATER DOES NOT CHANGE THE TASTE, COLOR OR ODOR OF YOUR WATER.
Blending fluoridated water from different sources does not increase total fluoride levels in drinking water. Fluoridated water does not change the taste, color or odor of your water. Parents should consult with their child’s doctor or dentist for guidance in supplementing fluoride. In 2015, the U.S. Public Health Services (PHS) revised the recommended fluoride concentration for drinking water to 0.7 mg/L (parts per million [ppm]), to maintain cavity prevention benefits and reduce the risk of dental fluorosis. Consumers may obtain more information about fluoridation, oral health, and current issues at: waterboards.ca.gov/drinking_water/certlic/drinkingwater/Fluoridation.html

ANNUAL WATER QUALITY REPORT 16 / 19
WATER QUALITY STANDARDS:DEFINITIONS, ACRONYMS &ABBREVIATIONS
What are Water Quality Standards?
Regulatory Action Level: The concentration of a contaminant which, if exceeded, triggers treatment or other requirements that a water system must follow.
Detection Limit for Purpose of Reporting: The level at which a contaminant is detected for compliance reporting determination
Highest Running Annual Average
Locational Running Annual Average
Maximum Contaminant Level: The highest level of a contaminant that is allowed in drinking water. Primary MCLs are set as close to the PHGs (or MCLGs) as is economically and technologically feasible. Secondary MCLs (SMCLs) are set to protect the odor, taste, and appearance of drinking water
Maximum Residual Disinfectant Level: The highest level of a disinfectant allowed in drinking water. There is convincing evidence that addition of a disinfectant is necessary for control of microbial contaminants
Notification Level: NLs are health-based advisory levels established by State Board for chemicals in drinking water that lack MCLs. When chemicals are found at concentrations greater than their notification levels, certain requirements and recommendations apply
No Standard
Primary Drinking Water Standard: MCLs and MRDLs for contaminants that affect health, along with their monitoring and reporting requirements and water treatment requirements
Revised Total Coliform Rule
Treatment Technique: A required process intended to reduce the level of a contaminant in drinking water
AL
DLR
HRAA
LRAA
MCL
MRDL
NL
NS
PDWS
RTCR
TT

ANNUAL WATER QUALITY REPORT 17 / 19
WATER QUALITY STANDARDS:DEFINITIONS, ACRONYMS &ABBREVIATIONS
What do the Measurements Mean? Grains per Gallon: Grains of compound per gallon of water
Milligram per Liter (ppm)
Microsiemens per Centimeter: A unit expressing the amount of electrical conductivity of a solution
Not Applicable
Not Detected: Indicates that the substance was not found by laboratory analysis
Nephelometric Turbidity Units: Measurement of the clarity, or turbidity, of water
Parts per Billion: One part substance per billion parts water (or micrograms per liter)
Parts per Million: One part substance per million parts water (or milligrams per liter)
Parts per Trillion: One part substance per trillion parts water (or nanograms per liter)
Threshold Odor Number: A measure of odor in water
What are Water Quality Goals?
Maximum Contaminant Level Goal: The level of a contaminant in drinking water below which there is no known or expected risk to health. MCLGs are set by the U.S. EPA
Maximum Residual Disinfectant Level Goal: The level of a drinking water disinfectant below which there is no known or expected risk to health. MRDLGs do not reflect the benefits of the use of disinfectants to control microbial contaminants
Public Health Goal: The level of a contaminant in drinking water below which there is no known or expected risk to health. PHGs are set by the California EPA
Grains/Gal mg\L
μS/cm
NA
ND
NTU
PPB
PPM
PPT
TON
MCLG
MRDLG
PHG

ANNUAL WATER QUALITY REPORT 18 / 19
Lead and Drinking WaterIf elevated levels of lead is present in your water, it can cause serious health problems, especially for pregnant women and young children. It is possible that lead levels in your home may be higher than levels found at your neighbors as a result of the materials used in your home plumbing. Lead in drinking water is primarily from materials and components associated with service lines and home plumbing. LBWD is responsible for providing high-quality drinking water, but we cannot control the variety of materials used in home plumbing components. In addition to the 2016 Lead and Copper Rule compliance monitoring at 149 customer taps, LBWD also conducted an extensive study at over 300 additional customer taps for lead and copper and found results to be in compliance with the Lead and Copper Rule. Since 2017, 3 private schools and 72 public schools in the Long Beach Unified School District requested for lead testing at drinking fountains and food preparation faucets. This year (2019), will be our lead and copper compliance monitoring in the City of Long Beach. Please be aware of receiving letters requesting your participation in this monitoring event.
When your water has been sitting for several hours, you can minimize the potential for lead exposure by flushing your tap for 30 seconds to 2 minutes before using water for drinking or cooking (this water can be captured for non-potable use). If you are concerned about lead in your water, you may wish to have your water tested by your utility or an independent laboratory. Information on lead in drinking water, testing methods, and steps you can take to minimize exposure is available from the Safe Drinking Water Hotline or at: epa.gov/safewater/lead
OTHER INFORMATION
MINIMIZE THE POTENTIAL FOR LEAD EXPOSURE BY FLUSHING YOUR TAP FOR 30 SECONDS TO 2 MINUTES BEFORE USING IT FOR DRINKING OR COOKING.

ANNUAL WATER QUALITY REPORT 19 / 19
Este informe contiene información muy importante sobre su agua potable. Tradúzcalo o hable con alguien que lo entienda bien.
Mahalaga ang impormasyong ito. Mangyaring ipasalin ito.
1800 E. Wardlow Road Long Beach, CA 90807