annualreportworksheet2014v5 - home - montgomery ... forest es (5) viers mill es (6) westbrook es (8)...
TRANSCRIPT


2013 ANNUAL LAND USE REPORT
FOR MONTGOMERY COUNTY TO
THE MARYLAND STATE
DEPARTMENT OF PLANNING
Report was compiled and prepared by the Montgomery County Planning Department and submitted to the Maryland Department of Planning as required by the State of Maryland legislation. Results found within report are part of the State of Maryland’s ongoing effort to monitor growth statewide and to determine the effectiveness of smart growth policies.
Montgomery County Planning Department
Information, Technology & Innovation (ITI)
June 12, 2014

ACKNOWLEDGEMENTS
The Information, Technology & Innovation (ITI) division would like to thank the following people for
their contributions to this report:
Montgomery County Planning Department
Larry Cole
Mary Dolan
Pamela Dunn
Renee Kamen
Rose Krasnow
Greg Russ
Valdis Lazdins
Montgomery County Public Schools
Bruce Crispell
Adrienne Karamihas
John Salamon
State of Maryland Highway Administration
Matt Baker
Kate Mazzara
Claudine Myers

Annual Report Worksheet
Reporting (Calendar) Year 2013
2
TABLE OF CONTENTS
Amendments and Growth Related Changes in Development Patterns page 3
Mapping and GIS Shapefi les page 17
Consistency of Development Changes page 18
Plan Implementation and Development Process page 20
Measures and Indicators page 22
Local ly Funded Agricultural Land Preservation page 26
Local Land Use Percentage Goals page 28
Development Capacity Analysis page 31
Adequate Public Facil ity Ordinance (APFO) Restrict ions page 33

Annual Report Worksheet
Reporting (Calendar) Year 2013
3
Jurisdiction Name: Montgomery County
Planning Contact Name: Jay Mukherjee, GIS Specialist II
Chris McGovern, GIS Manager
Planning Contact Phone Number: 301-650-5640
Planning Contact Email: [email protected]
Section I: Amendments and Growth Related Changes in Development Patterns
(A) Were any new comprehensive plan or plan elements adopted? Y N
1. If no, go to (B).
2. If yes, briefly summarize what was adopted.
Adopted 2013:
Chevy Chase Lake Master Plan (2)
Glenmont Sector Plan (1)
Long Branch Sector Plan (3)
Plans in Progress 2013: Bethesda Downtown Plan (1)
Bethesda Purple Line Station Minor MP Amendment (2)
Clarksburg Ten Mile Creek Limited Amendment (3)
White Oak Science Gateway (4)
Countywide Transit Corridors Functional Plan
Note: Numbers in parentheses correspond to numbers on map below

Annual Report Worksheet
Reporting (Calendar) Year 2013
4
(B) Were there any growth related changes in development patterns? Y N
(Note: Growth related changes in development patterns are changes in land
use, zoning, transportation capacity improvements, new subdivisions, new
schools or school additions, or changes to water and sewer service areas.)
1. If no, go to (C).
2. If yes, briefly summarize each growth related change(s).
Montgomery County, like many jurisdictions, is working on strategies to deal with the rapid and
potentially permanent slowdown in demand for new office space. This is particularly evident in the
areas farther from major transit, but even in urban areas, properties with mixed-use zoning are
choosing to develop only with residential uses.

Annual Report Worksheet
Reporting (Calendar) Year 2013
5
Transportation Capital Improvement Projects:
Project Name Agency Month Completed
Maple Avenue Storm Drain And
Roadway Improvement (1)
MCDOT January 2013
Old Georgetown Road
Pedestrian Bridge (2)
MCDOT January 2013
E. Gude Drive Bridge Over CSX
And Metro Railroads (3)
MCDOT February 2013
Town Of Chevy Chase Storm
Drain Improvement - Phase 3 (4)
MCDOT March 2013
MD 97 From Hillcroft Drive To
Old Baltimore Road (5)
SHA May 2013
Shady Grove Metro Access Bike
Path (6)
MCDOT June 2013
MD 355 From North Of Cedar
Croft Drive To MD 547 (7)
SHA July 2013
MD 355 From Mannakee Street
To King Farm Boulevard (8)
SHA July 2013
MD 27 At
Sweepstakes/Marlboro Drive (9)
SHA August 2013
MD 410 From Park Avenue To
MD 650 (10)
SHA August 2013
Note: Numbers in parentheses in chart correspond to numbers on map below

Annual Report Worksheet
Reporting (Calendar) Year 2013
6
New Schools or Revitalization/Expansion to Schools
No new schools opened this year
Revitalization/Expansion:
Gaithersburg HS (10)
Herbert Hoover MS (9)
Glenallan ES (1)
Weller Road ES (2)
Addition:
Bradley Hills ES (3)
Darnestown ES (4)
Georgian Forest ES (5)
Viers Mill ES (6)
Westbrook ES (8)
Wyngate ES (7)
Holding Center (for Schools undergoing revitalization/expansion):
Emory Grove ES Holding Center (11)
Note: Numbers in parenthesis correspond to the numbers on map below

Annual Report Worksheet
Reporting (Calendar) Year 2013
7
New Subdivisions
39 new subdivisions approved
(C) Were any amendments made to the zoning regulations? Y N
1. If no, go to (D).
2. If yes, briefly summarize any amendments that resulted in changes in
development patterns.
The following Zoning Text Amendments (ZTAs) and Subdivision Regulation Amendments
(SRAs) were introduced by the County Council. The ones enacted by the Council are noted
below. Most of the ZTAs involved changes to allowable land uses; a few are designed to
modify development standards such as building height, and one ZTA establishes a
definition and calculation of Impervious Area. The SRAs vary widely – one modifies the
approval process, another provides an exemption, and the third extends the validity
period for Adequate Public Facilities.

Annual Report Worksheet
Reporting (Calendar) Year 2013
8
The following are ZTAs and SRAs reviewed in 2013:
Zoning Text Amendment No. 13-01: Planned Development Zones ‒ Procedures
An Amendment to the Montgomery County Zoning Ordinance to:
Allow fences under certain circumstances without a site plan or a site plan amendment in
Planned Unit Development Zones; and generally amend the provisions concerning the
application and approval procedures for Planned Unit Development Zones. Enacted – Ord. No.
17-35
Zoning Text Amendment No. 13-02: Central Business District Zones – Self Storage
An Amendment to the Montgomery County Zoning Ordinance to:
Allow a self-storage facility in certain CBD zones under certain circumstances. Enacted – Ord.
No. 17-37
Zoning Text Amendment No. 13-03: Impervious Area – Calculation
An Amendment to the Montgomery County Zoning Ordinance to:
Define impervious area and permeable pavement; and regulate the calculation used to
implement impervious surface area restrictions. Introduced, not enacted in 2013.
Zoning Text Amendment No. 13-04: Zoning Ordinance – Revised
An Amendment to the Montgomery County Zoning Ordinance to replace Chapter 59 with a new
Code: Introduced, not enacted in 2013.
Zoning Text Amendment No. 13-05: US 29 Overlay Zone – Standards
An Amendment to the Montgomery County Zoning Ordinance to revise the provisions of US
29/Cherry Hill Road Employment Area Overlay Zone to:
Allow additional residential and retail uses where the underlying zone is I-1; establish
development standards for the additional uses; and generally amend the text of the zone to
make it more concise, precise, and decisive. Enacted – Ord. No. 17-38
Zoning Text Amendment No. 13-06: Fenton Village Overlay – Building Height
An Amendment to the Montgomery County Zoning Ordinance to:
Generally amend the provision for building heights in the Fenton Village Overlay zone. Enacted -
Ord. No. 17-39
Zoning Text Amendment No. 13-07: US 29 Overlay Zone – Land Use
An Amendment to the Montgomery County Zoning Ordinance to revise the provisions of the US
29/Cherry Hill Road Employment Area Overlay Zone to:
Allow retail sales and services under certain circumstances; reflect the changes proposed in ZTA
13-05 to allow for a grocery store in the overlay zone under certain circumstances; generally
amend the text of the zone to make it more concise, precise, and decisive. Enacted – Ord. No.
17-40

Annual Report Worksheet
Reporting (Calendar) Year 2013
9
Zoning Text Amendment No. 13-08: TMX – Land Uses
An Amendment to the Montgomery County Zoning Ordinance to:
Allow dry cleaning and laundry establishments in the TMX zone; allow a veterinary hospital
without a special exception under certain circumstances; allow day care for seniors and disabled
people with an unlimited number of people; and generally amend land uses in the TMX zone.
Enacted – Ord. No. 17-41
Zoning Text Amendment No.: 13-09: Noticing Signs - Local Map Amendments
An Amendment to the Montgomery County Zoning Ordinance to:
Generally amend the provision for signs required to notice residents of local map amendment
applications. Enacted – Ord. No. 17-42
Subdivision Regulation Amendment No.: 13-01: Adequate Public Facilities – Preliminary
Subdivision Plans – Validity Period
An Amendment to the Montgomery County Subdivision Regulations to:
Extend the validity period for a determination of adequate public facilities for certain
developments; extend the validity period for certain preliminary subdivision plans; and
otherwise revise the validity period for certain developments. Enacted – Ord. No. 17-31
Subdivision Regulation Amendment No.: 13-02: Platting Exemptions – Single Family Dwelling
An Amendment to the Montgomery County Subdivision Regulations to:
Exempt property that includes an involuntarily demolished single family dwelling for platting
requirements; and generally clarify limitations on the issuance of building permits. Enacted –
Ord. No. 17-36
Subdivision Regulation Amendment No.: 13-03: Record Plats – Approval
An Amendment to the Montgomery County Subdivision Regulations to:
Limit the number of agencies that are required to approve a record plat; and generally amend
the provisions relating to the approval of record plats. Introduced, not enacted in 2013.
(D) Were any amendments made to the zoning map? Y N
1. If no, go to Section II: Mapping and GIS Shapefiles.
2. If yes, briefly summarize each amendment(s).
The following are LMAs and SMAs reviewed in 2013:
LMA G-829
Property ID: 06-03142681
From: RE-2 Zone To: Country Inn Zone
Dismissed per CC resolution 17-906

Annual Report Worksheet
Reporting (Calendar) Year 2013
10
SDPA 12-1 (which amends G-851)
Property ID: 07-03669303
From: general office building To: 5-story, 58- unit residential building to provide
“productivity housing”
Approved per CC resolution 17-653
LMA G-881
Property ID: 02-00030041
From: RE-25 To: PRC
Approved per CC resolution 17-780
LMA G-910
Property ID: 09-007712621
From: R-T 12.5 and R-30 Zones To: PD-35
Denied per CC resolution 17-801
LMA G-913
Property ID: 07-03457071
From: R-60 To: C-T
Approved per CC resolution 17-654
LMA G-954 and DPA 13-01 (which amends G-843)
Property ID: 07-00490821 and 07-00487286
From: R-60 To: TS-R
Approved per CC resolution 17-863
SMA G-955 (Burtonsville Crossroads Sector Plan)
Approved per CC resolution 17-695
Area Existing Zones Proposed Zone Acres
1 C-1, O-M, RC CRT 1.5 C 1.0 R 1.25 H 75 35.28
2 C-2, RC CRT 1.5 C 1.0 R 1.25 H 70 17.83
3 C-2, 1-1, RC CRT 1.5 C 1.0 R 1.25 H 70 11.07
4 C-2 CRN 1.5 C 1.0 R 0.5 H 45 15.35
5 RC C-2 0.82
G-955 followed the approval and adoption of the Burtonsville crossroads Neighborhood Plan and will
implement through the SMA process, the Plan's recommendations for creating a community at the
crossroads. The SMA covered approximately 191 acres of the Sector Plan area; about 72.29 acres were
reclassified (as described by the table below) and the remaining 119 acres were reconfirmed.

Annual Report Worksheet
Reporting (Calendar) Year 2013
11
The following CMA’s were reviewed in 2013:
CMA G-915
Property ID: 01-00002486 and 01-00003253
From: R-200 To: C-1
Approved per CC resolution 17-655
CMA G-916
Property ID: 01-00007160
From: R-200 To: C-1
Approved per CC resolution 17-655
CMA G-917
Property ID: 11-00917033, 11-009186026, 11-00921310, 11-00917022 and 11-00914700
From: R-200 To: C-1
Approved per CC resolution 17-655
CMA G-918
Property ID: 02-00021365 and 02-00018642
From: R-200 To: C-2
Approved per CC resolution 17-655
CMA G-919
Property ID: 11-00918174, 11-00919577, 11-00915056 and 11-00919566
From: R-200 To: C-1
Approved per CC resolution 17-655
CMA G-920
Property ID: 03-0040927
From: R-200 To: C-1
Approved per CC resolution 17-655
CMA G-921
Property ID: 03-00040938
From: R-200 To: C-1
Approved per CC resolution 17-655
CMA G-922
Property ID: 03-00033864
From: R-200 To: C-1
Approved per CC resolution 17-655

Annual Report Worksheet
Reporting (Calendar) Year 2013
12
CMA G-923
Property ID: 11-00921002
From: R-200 To: C-1
Approved per CC resolution 17-655
CMA G-924
Property ID: 11-00914917
From: RDT To: C-1
Approved per CC resolution 17-655
CMA G-925
Property ID: 03-00034777 and 03-00041192
From: R-200 To: C-1
Approved per CC resolution 17-655
CMA G-926
Property ID: 08-00722694 and 08-02775033
From: R-200 To: C-1
Approved per CC resolution 17-655
CMA G-927
Property ID: 12-00941532, 12-00924687 and 12-00927715
From: RNC/TDR To: RC
Approved per CC resolution 17-655
CMA G-928
Property ID: 02-00018482
From: RMX-2 To: R-200
Approved per CC resolution 17-655
CMA G-929
Property ID: 09-02816748
From: RMX-2C/TDR To: R-90
Approved per CC resolution 17-655
CMA G-930
Property ID: 09-02164341, 09-02254976, 09-02255105, 09-02255116, 09-02615076, 09-
02255231, 09-02255242, 09-02255355, 09-02255366, 09-02255377, 09-02255390, 09-
02255402, 09-02255413, 09-02255424, 09-02164352, 09-02255537, 09-02255548, 09-
02255550, 09-02615156, 09-02615167, 09-02615178, 09-02615180, 09-02871363, 09-
02871443, 09-02871248 and 09-00771912
From: R-200/TDR To: R-90
Approved per CC resolution 17-655

Annual Report Worksheet
Reporting (Calendar) Year 2013
13
CMA G-931
Property ID: 09-02811852
From: RT-10 To: PN
Approved per CC resolution 17-655
CMA G-932
Property ID: 09-02362666
From: R-200/TDR To: PN
Approved per CC resolution 17-655
CMA G-933
Property ID: 08-03099278
From: RE-2 To: RE-1/TDR
Property ID: U330162
From: RE-1/TDR To: RE-2
Approved per CC resolution 17-655
CMA G-934
Property ID: 08-00715197
From: RC To: RE-2
Approved per CC resolution 17-655
CMA G-935
Property ID: 06-00411948; 06-00411937; 06-00411920, 06-02798318, 06-02798422,
06-02798433, 06-0279844, 06-02798455, and 06-2798466
From: R-200/TDR To: R-200
Approved per CC resolution 17-655
CMA G-936
Property ID: 04-02008201 and 04-02278824
From: I-1 To: PD-2
Approved per CC resolution 17-782
CMA G-938
Property ID: 05-01910345
From: R-200 To: R-90
Approved per CC resolution 17-782
CMA G-939
Property ID: 05-01590356
From: R-200 To: RE-2
Approved per CC resolution 17-782
CMA G-940
Property ID: 10-02676006

Annual Report Worksheet
Reporting (Calendar) Year 2013
14
From: R-12.5 To: R-90
Approved per CC resolution 17-782
CMA G-941
Property ID: 04-00045428
From: R-60 To: R-60 with the Town of Garrett Park Overlay Zone
Approved per CC resolution 17-782
CMA G-942
Property ID: 13-00983072
From: I-1 To: R-60
Approved per CC resolution 17-782
CMA G-943
Property ID: 13-01134441
From: R-30 To: R-40
Approved per CC resolution 17-782
CMA G-944
Property ID: 13-01080028
From: R-20 To: R-60
Approved per CC resolution 17-782
CMA G-945
Property ID: 13-03174777
From: RE-2 To: R-30
Approved per CC resolution 17-782
CMA G-946
Property ID: 07-00423718
From: R-60 To: R-60/TDR
Approved per CC resolution 17-782
CMA G-947
Property ID: 07-00419363
From: C-4 To: I-1
Approved per CC resolution 17-782
CMA G-948
Property ID: 05-0055068
From: RE-1 To: RC
Approved per CC resolution 17-782
CMA G-950
Property ID: 04-01817543

Annual Report Worksheet
Reporting (Calendar) Year 2013
15
From: None To: I-2
Approved per CC resolution 17-691
CMA G-951
Property ID: 04-00152546
From: None To: R-20
Approved per CC resolution 17-691
CMA G-952
Property ID: 11-00915284
From: R-200 To: C-1
Approved per CC resolution 17-782
Section 59-H-10.1(b) of the Zoning Ordinance states that the purpose of a CMA is to
“enable the District Council in lieu of a comprehensive sectional map amendment to correct
technical errors or inaccurate depictions of zoning boundary lines on an adopted map that
are known as a result of mapping, surveying or other technical information.”
In the spring of 2008, the District Council approved The Zoning Discovery document, which,
among other recommendations, proposed to modernize Montgomery County’s zoning maps
from the current hand-drawn and AutoCAD maps to ones generated through a GIS-based
mapping tool. Before proceeding with this conversion, all of the zoning shown on the
existing maps was checked for accuracy. Numerous issues were found and all of these were
addressed through the corrective map amendment process. Should there be a need for a
future comprehensive rezoning, the mapping process could be done quickly and accurately.
Map Amendments G-915 to G-926 are considered “right-of-way withholding corrective

Annual Report Worksheet
Reporting (Calendar) Year 2013
16
amendments.” Right-of-way withholdings occurred through District Map Amendments,
Sectional Map Amendments (SMA) and Local Map Amendments (LMA). The 1958 Zoning
Ordinance stated that “any area reclassified by a local or sectional or District plan map
amendment shall exclude and be held to exclude any portion of the area which lies in the
bed of a road, street or alley, whether existing or proposed on a plan adopted by the
Commission…” In 1969, the Maryland Court of Appeals found withholding future rights-of-
way from rezoning to be unconstitutional. On July 7, 1986, the District Council adopted
Ordinance 10-75 (§59-A-1.72 of the Zoning Ordinance), which required the zoning for any
previously withheld rights-of-way to match the zoning of the property from which the
zoning had been withheld.
Proposed CMAs G-915 through G-926 includes parcels where zoning designations were
withheld for purposes of right-of-way expansions. The majority of these CMAs were a result
of right-of-way withholdings that occurred with the Comprehensive District Map
Amendment, adopted in June 1958 (County Council Ordinance # 3-206). Since there was no
comprehensive rezoning action to correct all such areas, portions of these properties still
show the withholding.
Map Amendment G-927 through G-936, G-938 to G-948 and G-952 are considered technical
corrections. Section 59-H-10.1(b) of the Zoning Ordinance states that the purpose of a CMA
is to “enable the District Council in lieu of a comprehensive sectional map amendment to
correct technical errors or inaccurate depictions of zoning boundary lines on an adopted
map that are known as a result of mapping, surveying or other technical information.”
Mapping errors occur for a number of reasons, but usually involve discrepancies arising
from placing the boundary for a rezoning request along a WSSC grid line rather than a
property line, or drawing a line across two map pages. These errors are more apparent in a
GIS-based map because there are no grids or page breaks.
Lastly, G-950 and G-951 involved areas adjacent to municipal annexations. The purposes of
the two map amendments were to correct the boundary lines between the City of Rockville
and Montgomery County, and to re-designate the parcels’ zoning.
Annual Report Worksheet
Reporting (Calendar) Year 2013
17
Section II: Mapping and GIS Shapefiles
(A) Does your jurisdiction utilize GIS to prepare planning related maps? Y N
1. If no, include an address, parcel identification number or other means
to identify the type and location of all new growth related changes or
zoning map amendments listed in Sections I(B) and I(D). Provide a
paper map(s) that indexes the general location(s) of the growth
related changes or zoning map amendment(s). Contact MDP for
mapping assistance.
Maps and GIS data uploaded to MDP
2. If yes, include a map(s) of the location(s) of the amendment(s) and
submit applicable GIS shapefiles for all new growth related changes
and zoning map amendments listed in Sections I(B) and I(D). GIS
shapefiles may be uploaded on the online Annual Report Webtool or
via email or cd/dvd disk.
Maps and GIS data uploaded to MDP
(B) Were there any growth related changes identified in Sections I(B) ? Y N
1. If no, go to (C).
2. If yes, then include GIS shapefiles and map(s), that identify the
location of each growth related change identified in Section I(B). If
your jurisdiction does not utilize GIS then clearly identify the growth
related changes on a map(s).
Maps and GIS data uploaded to MDP
(C) Were there any zoning map amendments identified in Section I(D). Y N
1. If no to (A) and (B), skip to Section III: Consistency of Development
Changes.
2. If yes, then include GIS shapefiles and map(s), that identify the
location of each zoning map amendment identified in Section I(D). If
your jurisdiction does not utilize GIS then clearly identify the growth
related changes on a map(s). Contact MDP for mapping assistance.
Maps and GIS data uploaded to MDP

Annual Report Worksheet
Reporting (Calendar) Year 2013
18
Section III: Consistency of Development Changes
(A) Were there any growth related changes identified in Sections I(B) through (D)? Y N
1. If no, skip to Section IV: Planning and Development Process.
2. If yes, go to (B).
(B) For each growth related change listed in in Sections I(B) through (D), state how the
development changes were determined to be consistent with:
1. Each other;
The changes in development patterns for Montgomery County in 2013 are consistent
with one another, guided by the General Plan and the specific community and
functional plans adopted by the County Council. Subdivision approvals, Septic tiers
and zoning changes all point to reserving agricultural areas and directing development
to existing areas. All zoning density increases that were adopted in 2013 direct
development to existing areas within our PFA.
2. Any recommendations of the last annual report;
N/A
3. The adopted plans of the local jurisdiction;
Each legislative change referenced in items 1c, 1d and 1e in this report is in
accordance with Montgomery County Planning Department procedural standards for
reviewing Master Plans, ZTAs, and other land use policies for conformity with the
General Plan.
4. The adopted plans of all adjoining jurisdictions;
As part of the Maryland National Capital Park and Planning Commission (MNCPPC),
Montgomery County coordinates its planning initiatives with Prince George’s County
via regular meetings of the MNCPPC Planning Commission. The Commission consists
of ten members, five from Montgomery County and five from Prince George's County.
The Commission acts on matters of interest to both counties, and meets at least once
a month. The members of the full Commission also serve on their respective Planning
Board to facilitate, review and administer matters affecting their respective counties.
Montgomery County actively participates in the Patuxent Reservoir watershed
protection efforts with Howard and Prince Georges Counties. This rural watershed,
which drains to one of our drinking water reservoirs, is protected by low mandated
densities, special environmental guidelines, and efforts to enlarge the areas of public
parkland.
Montgomery and Prince George’s County are the second and third largest counties in

Annual Report Worksheet
Reporting (Calendar) Year 2013
19
the State. Planning decisions by the Commission affect roughly 32% of Maryland’s
population.
Montgomery County actively participates in joint planning analysis efforts with the
Washington Councils of Governments (MWCOG). A primary effort with MWCOG is
the development of the region’s demographic forecast of housing, jobs, and
population. The process offers a forum for member jurisdictions to anticipate the
collective impacts of local land use change on the metro region’s economy and
population. This forecasting effort also serves as a primary input into the regional
transportation modeling process.
5. Any adopted plans of the State and local jurisdictions that have responsibility
for financing or constructing improvements necessary to implement the
jurisdiction’s plan.
NA

Annual Report Worksheet
Reporting (Calendar) Year 2013
20
Section IV: Plan Implementation and Development Process
(A) Is the adoption date of your comprehensive plan prior to January 1, 2010? Y N
1. If no, then skip to (B). Identify adoption month and year: December 1993
2. If yes, has your jurisdiction submitted a five-year implementation update? Y N
a. If yes, skip to (B).
The General Plan is amended with each functional plan, community master
or sector plan that is approved and adopted by the County Council and the
MNCPPC. Three to six such plans are completed every year and in this way
most of the County is revisited every 15-20 years. Zoning map
amendments accompany each plan as appropriate. In addition, a few
zoning map amendments are proposed each year outside of the planning
process by individual property owners who are seeking specific changes
that would apply to that property only. Such proposals are addressed on a
case-by-case basis with recommendations from the Planning Board and
final action by the District Council.
The County is currently working with the State Highway Administration to
adapt state road standards to achieve the goals of bicycle/pedestrian
priority areas and smart growth.
Master and sector plans that are in our work program for the short term
include Sandy Spring Rural Village, Aspen Hill Property (Vitro), Bethesda
CBD, Greater Lyttonsville, Westbard, and Montgomery Village.
b. If no, include a summary of the following:
(i). Development trends contained in the previous annual reports filed during
the period covered by the narrative;
(ii). The status of comprehensive plan implementation tools such as
comprehensive rezoning to carry out the provisions of the comprehensive
plan;
(iii). Identification of any significant changes to existing programs, zoning
ordinances, regulations, financing programs, or State requirements
necessary to achieve the visions and goals of the comprehensive plan
during the remaining planning timeframe;

Annual Report Worksheet
Reporting (Calendar) Year 2013
21
(iv). Identification of any State or federal laws, regulations, or requirements
that have impeded local implementation of the comprehensive plan and
recommendations to remove any impediments;
State highway road standards.
(v). Future land use challenges and issues; and
(vi). A summary of any potential updates to the comprehensive plan.
(B) In the current reporting year, did your jurisdiction identify any recommendations for improving
the planning and development process within the jurisdiction?
1. If no, go to (C). Y N
2. If yes, what were those recommendations?
The County continues to work on streamlining the process to improve the turnaround
time on development proposals. The approved but not yet effective new zoning
ordinance establishes time frames for several review processes, and directs the
Planning Director to publish an annual calendar setting out specific time periods for
each phase of a project review.
(C) In the current reporting year, did your jurisdiction adopt any ordinances or regulations needed
to implement the 12 planning visions under §1-201 of the Land Use Article?
Y N
1. If no, go to Section V: Measures and Indicators.
2. If yes, what were those changes?

Annual Report Worksheet
Reporting (Calendar) Year 2013
22
Section V: Measures and Indicators
(Note: The Measures and Indicators Sections (D) – (G) are only required for jurisdictions issuing
more than 50 new residential building permits in the reporting year).
(A) In the Total column in Table 1, New Residential Permits Issued (Inside and Outside the PFA) in (C)
below, enter the total number of new residential building permits issued in 2013. Enter 0 if no
new residential building permits were issued in 2013.
(Note: For annual reporting purposes, tabulate the amount of new residential
building permits issued at time your jurisdiction has granted the ability for a new
residential unit to be constructed. It does not mean that the unit has been
constructed, will be constructed, or is occupied. If your local definition of building
permit varies, please indicate the definition used to tabulate new residential building
permits. Reconstruction or replacement permits should be included as new
residential permits. Additionally, tracking the amount of reconstruction,
replacement or demolition of residential units in Table 2A may be beneficial when
conducting the Development Capacity Analysis in Section VIII.)
(B) In the PFA column in Table 1, enter the total number of permits issued inside the Priority
Funding Area (PFA). Enter 0 if no new residential building permits issued inside the PFA in 2013.
(C) In the Non-PFA column in Table 1, enter the total number of permits issued outside the PFA.
Enter 0 if no new residential building permits issued outside the PFA in 2013.
Table 1: New Residential Permits Issued (Inside and Outside the PFA)
Residential PFA Non - PFA Total
# New Residential Permits Issued 1,215 224 1,439
(Note: At a minimum, each jurisdiction should submit the information requested in
Table 1: New Residential Permits Issued (Inside and Outside the PFA) as part of
their Annual Report. If no residential permits were issued, then indicate 0 in each
column.)

Annual Report Worksheet
Reporting (Calendar) Year 2013
23
(D) If the Total number of new residential permits in Table 1 is less than 50, then Tables 2A and 2B
are optional and can be used to locally monitor changes less than 50 permits. Skip to (E) if the
Total number of new residential permits in Table 1 is 50 or more.
Table 2A: Amount of Residential Growth (Inside and Outside the PFA)
Residential PFA Non - PFA Total
# Units Approved 7,041 83 7,124
# Units Constructed 3,094 239 3,333
# Subdivisions Approved 29 10 39
Total Approved Subdivision Area (Gross Acres) 241.47 296.68 538.15
# Lots Approved 692 90 782
Total Approved Lot Area (Net Acres) 266.4 256.6 523
# Units Demolished* N/A N/A N/A
# Units Reconstructed/Replaced* N/A N/A N/A
*Not required.
Table 2B: Amount of Commercial Growth (Inside and Outside the PFA)
Commercial PFA Non - PFA Total
# New Permits Issued 109 16 125
# New Lots Approved 20 1 21
Total Square Feet Approved (Gross) 2,805,869 18,376 2,824,245
Total Square Feet Constructed (Gross) 1,378,940 191,579 1,570,520
(E) Were more than 50 new residential building permits issued in 2013? Y N
1. If no, then the remainder of this Section is optional. Skip to Section VI: Locally Funded
Agricultural Land Preservation.
2. If yes, then complete Tables 3 through 5 for Residential Growth and Tables 6 through 8
for Commercial Growth in (F) and (G) below.

Annual Report Worksheet
Reporting (Calendar) Year 2013
24
(F) Amount, Net Density and Share of Residential Growth:
(Note: To calculate the amount, net density and share of residential growth,
jurisdictions must identify the total number of new residential building permits
issued; the total number of new residential units approved; the total number of new
residential lots approved; the total approved gross acreage of new residential
subdivisions; and net lot area. A number of values are repeated in Tables 1 through
5. Be sure to enter consistent values for each similar category used in these tables.)
Table 3: Amount of Residential Growth (Inside and Outside the PFA)
Residential PFA Non - PFA Total
# Permits Issued 1,215 224 1,439
# Units Approved 7,041 83 7,124
# Units Constructed 3,094 239 3,333
Total Approved Subdivision Area (Gross
Acres)
241.5 296.7 538.2
# Lots Approved 692 90 782
Table 4: Net Density of Residential Growth (Inside and Outside the PFA)
Residential PFA Non – PFA Total
# Units Approved 7,041 83 7,124
Total Approved Lot Size (Net Acres) 241.5 296.7 538.2
Table 5: Share of Residential Growth (Inside and Outside the PFA)
Residential PFA Non – PFA Total
# Units Approved 7,041 83 7,124
% of Total Units
(# Units/Total Units)
98.2% 1.8% 100%
(G) Amount, Net Density and Share of Commercial Growth:
(Note: To calculate the amount, net density and share of commercial growth, jurisdictions must
identify the total number of new commercial permits issued; the total square footage of the
commercial building approved; the total number of new commercial lots approved; the total new
commercial subdivision area (gross acres); and the total approved subdivision net lot area, in
acres for all new commercial subdivisions. The total building square footage (gross) and total lot
size values (net acres) should be the same for Tables 6 through 8. For annual report purposes, all

Annual Report Worksheet
Reporting (Calendar) Year 2013
25
approved square footage (gross) should be tabulated, with the understanding that not all
building square footage reported may be used for commercial or retail related activities.
Commercial growth should include retail, office, hotel, industrial uses and may include other
uses, such as, mixed-use, institutional and agricultural structures, if approved for commercial
use.)
Table 6: Amount of Commercial Growth (Inside and Outside the PFA)
Commercial PFA Non - PFA Total
# Permits Issued 109 16 125
Building Square Feet Approved (Gross) 2,805,869 18,376 2,824,245
# Lots Approved 20 1 21
Total Subdivision Area (Gross Acres) 113.3 2.2 115.5
Table 7: Net Density of Commercial Growth (Inside and Outside the PFA)
Commercial PFA Non – PFA Total
Building Square Feet (Gross) 2,805,869 18,376 2,824,245
Total Lot Size (Net Acres) 131.3 2.2 133.5
Table 8: Share of Commercial Growth (Inside and Outside the PFA)
Commercial PFA Non – PFA Total
Building Square Feet (Gross) 2,805,869 18,376 2,824,245
% of Total Building Sq. Ft.
(Bldg. Sq. Ft./Total Sq. Ft.)
99.3% 0.7% 100%

Annual Report Worksheet
Reporting (Calendar) Year 2013
26
Section VI: Locally Funded Agricultural Land Preservation
(A) How many acres were preserved using local agricultural land preservation funding? Enter 0 if no
acres were preserved using local funds.
337.4 Acres preserved via the County’s Transferable Development Rights (TDR) program
Tax ID Number of TDR Serial Numbers Acres
00003003 (1) 2 23-9321 and 23-
9322
160.8
00937292 (2) 5 10-9323 through
10-9327
70.6
00924596 (3) 9 12-9328 through
12-9336
106.1
707.4 Acres preserved via the County’s Building Lot Termination (BLT) program
Tax ID Number of BLT Serial Numbers Acres
03327737 (2) 2 BLT-013, BLT-014 101.7
00924585,
01728630 (3)
1 BLT-015 82.5
00003003 (1) 4 BLT-016 - BLT-019 160.8
03497407 (4) 3 BLT-020 - BLT-022 98.9
03683851 (5) 1 BLT-023 48.9
00016541 (6) 2 BLT-024, BLT- 025 108.8
00009168 (7) 3 BLT-026 - BLT-028 105.7
Note: Numbers in parenthesis correspond to the numbers on map below

Annual Report Worksheet
Reporting (Calendar) Year 2013
27

Annual Report Worksheet
Reporting (Calendar) Year 2013
28
Section VII: Local Land Use Percentage Goal Is all land within the boundaries of the jurisdiction in the PFA? Y N
Montgomery County PFA is 125,177 acres.
Share of estimated land use percentages within PFA only :
Montgomery County totals 318,743 acres.
Share of current countywide (PFA + Non-PFA) estimated land use percentages:

Annual Report Worksheet
Reporting (Calendar) Year 2013
29
1. If yes, then the local land use percentage goal does not need to be
established. Skip to Section VIII: Development Capacity Analysis.
2. If no, then the jurisdiction must establish a local percentage goal to
achieve the statewide land use goal to increase the current percentage
of growth located inside the PFAs and decrease the percentage of
growth (new lots and new residential units) located outside the PFAs.
Go to (B).
(B) What is the jurisdiction’s established local land use percentage goal? 80%
Montgomery County Planning has been operating in a largely infill and transit oriented pattern
for a sizable period of time. The agricultural preserve reinforces this. As our previous annual
land use reports have shown, our development approvals occur almost entirely within the PFA
for the County. There is very little developable land outside the PFA. Almost all the significant
development in terms of new population and employment is within the PFA. Additionally, over
the last 5 years, on average of 90% of residential units and 98% of commercially built square
footage has occurred within the PFA.
In light of this we feel comfortable in establishing a goal of 80% of approved growth to be in the
county PFA.
(C) What is the timeframe for achieving the local land use percentage goal? Ongoing
The local land use percentage goal has been consistently exceeded. Our agricultural preserve
and planning principles ensure we are in a sustain mode on this goal.
(D) Has there been any progress in achieving the local land use percentage goal?
With the exception of part of the Ten Mile Creek Amendment to the Clarksburg Master Plan, all
current planning and increases in zoning capacity are within the PFA. Even in the Ten Mile Creek
amendment, significant reductions in potential density were made in the area outside the PFA.
(E) What are the resources necessary for infrastructure inside the PFAs?
Significant investment is underway and planned to serve growth within the PFA. Transportation
projects are often built outside the PFA, but serve to make the larger network function better

Annual Report Worksheet
Reporting (Calendar) Year 2013
30
for development in the PFA. State assistance will be sought for many of these projects,
consistent with state funding guidance. The following facility improvements are planned:
Total Number of CIP Projects Within PFA Outside of PFA
505 360 (71%) 145 (28%)
(F) What are the resources necessary for land preservation outside the PFAs?
The County relies on Program Open Space funding for a significant portion of our parks budget,
especially for land acquisition. Rural Legacy and Agricultural Easement Programs are essential
for land preservation in the Agricultural Reserve.
CIP Projects by PFA
Type PFA Number of Projects (%)
Community Facilities
IN 19 76%
OUT 6 24%
Parks
IN 48 64%
OUT 27 36%
Schools
IN 34 63%
OUT 20 37%
Transportation
IN 254 75%
OUT 86 25%
Water & Sewer
IN 5 45%
OUT 6 55%

Annual Report Worksheet
Reporting (Calendar) Year 2013
31
Section VIII: Development Capacity Analysis (DCA)
(A) Has an updated DCA been submitted with your Annual Report or to MDP within the last three
years?
(Note: A DCA is required every 3-years and whenever there is a significant change in
zoning or land use pattern. See §1-208(c)(1)(iii) of the Land Use Article. A DCA may be
submitted independently from the Annual Report, such as, part of a comprehensive plan
update.)
Y N
1. If no, explain why an updated DCA has not been submitted, such as, no
substantial growth changes, etc.
2. If yes, then skip to (C):
(Note: For additional guidance on how to conduct a Development Capacity Analysis, see
the Estimating Residential Development Capacity Analysis Guidebook, August 2005,
located in the Planning Guide section of the MPD website:
http://planning.maryland.gov/OurProducts/publications.shtml#ModelsGuidelines
MDP provides technical assistance to local governments in completing development
capacity analyses. Please contact your MDP regional planner for more information.)
(B) When was the last DCA submitted? Identify Month and Year: July 2013
(C) After completing the DCA, provide the following data on capacity inside and outside the PFA in
Table 9, Residential Development Capacity (Inside and Outside the PFA):
Table 9: Residential Development Capacity (Inside and Outside the PFA)
Parcels & Lots w/ Residential Capacity PFA Non – PFA Total
Residentially Zoned Acres 94,325 52,510 146,835
Total Acres 105,026 188,264 293,293
Total Lots 238,369 31,588 269,957
Acres with Capacity 2,384 1,901 4,285
Parcels with Capacity 4,454 1,250 5,704

Annual Report Worksheet
Reporting (Calendar) Year 2013
32
Total Number of Residential
Parcels with Capacity
Within PFA Outside of PFA
5,704 4,454 (78%) 1,250 (22%)

Annual Report Worksheet
Reporting (Calendar) Year 2013
33
Section XI: Adequate Public Facility Ordinance (APFO) Restrictions (Section XI is only required by jurisdictions with adopted APFOs)
(A) Does your jurisdiction have any adopted APFOs? Y N
1. If no, skip this Section.
2. If yes, go to (B).
(B) Has any APFO resulted in a restriction within the Priority Funding Area? Y N
1. If no, skip this Section.
2. If yes, then complete (C) through (I) below for each restriction.
(C) What is the type of infrastructure affected? (List each for Schools, Roads, Water, Sewer,
Stormwater, Health Care, Fire, Police or Solid Waste.)
Montgomery County’s 2012 Subdivision Staging Policy is a growth management instrument
that guides the timing of development and the provision of adequate public services. This
policy implements a 1973 law, the Adequate Public Facilities Ordinance, which directs
development to areas where public services are in place. The policy presents guidelines that
govern where new development takes place, matching growth to the availability of public
services, like transportation and schools. The policy emphasizes two types of APFO
restrictions for new development: restrictions based on school capacity and restrictions
based on transportation capacity.
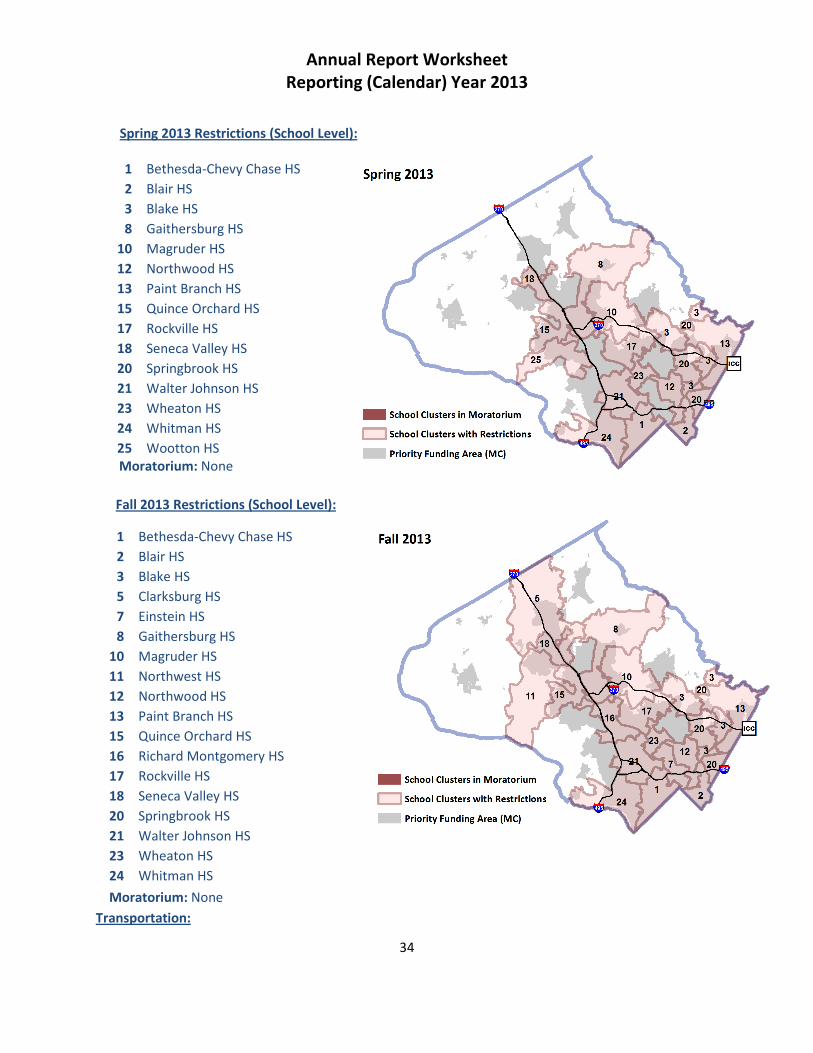
(D) Where is each restriction located? (Identify on a map if possible).
Schools:
School adequacy is determined for each school level (e.g., elementary, middle and high school).
At any level, if projected school enrollment exceeds 105% of projected school capacity then
residential development within the affected school cluster will be required to make a School
Facility Payment (SFP). The SFP is based on the number of students generated by the proposed
development and the cost of additional infrastructure needed to support it, which varies by
school type. If projected enrollment exceeds 120% of projected capacity then the entire school
cluster is in moratorium for residential development approvals. Residential development
projects in the following PFA restricted school districts require fees for the purpose of expanding
school capacity under the FY2012 Schools Test.
Source: 2013 Annual School Test, MCPS
Annual Report Worksheet
Reporting (Calendar) Year 2013
34
Spring 2013 Restrictions (School Level):
1
Bethesda-Chevy Chase HS
2 Blair HS
3 Blake HS
8 Gaithersburg HS
10 Magruder HS
12 Northwood HS
13 Paint Branch HS
15 Quince Orchard HS
17 Rockville HS
18 Seneca Valley HS
20 Springbrook HS
21 Walter Johnson HS
23 Wheaton HS
24 Whitman HS
25 Wootton HS
Moratorium: None
Fall 2013 Restrictions (School Level):
Moratorium: None Transportation:
1 Bethesda-Chevy Chase HS
2 Blair HS
3 Blake HS
5 Clarksburg HS
7 Einstein HS
8 Gaithersburg HS
10 Magruder HS
11 Northwest HS
12 Northwood HS
13 Paint Branch HS
15 Quince Orchard HS
16 Richard Montgomery HS
17 Rockville HS
18 Seneca Valley HS
20 Springbrook HS
21 Walter Johnson HS
23 Wheaton HS
24 Whitman HS

Annual Report Worksheet
Reporting (Calendar) Year 2013
35
The 2012 Subdivision Staging Policy introduced a new area-wide transportation test to balance the
number of trips against the transportation infrastructure – transit, roads and pedestrian/cycling routes.
This new test called Transportation Policy Area Review (TPAR) measures the impacts of development on
traffic flow and transit capacity in each of the county’s 30 traffic policy areas. TPAR establishes
standards for roadway and transit adequacy and determines which policy areas meet those standards.
TPAR sets different standards for transportation adequacy in urban, suburban and rural areas. If
development is proposed in a policy area that does not meet the roadway or transit standards, the
development must provide the needed capacity or make a TPAR payment.
The TPAR roadway analysis uses a regional travel demand model to assess the adequacy of main roads in the peak direction of travel during the PM peak hour
Policy Area
7 Fairland/White Oak 8 Gaithersburg City

Annual Report Worksheet
Reporting (Calendar) Year 2013
36
The TPAR transit analysis considers three facets of existing local bus transit service: Service Coverage, Peak Headways, and Span of Service.
Policy Area 3 Bethesda/Chevy Chase
4 Cloverly 6 Derwood 9 Germantown East 10 Germantown West 11 Germantown Town Center 12 Kensington/Wheaton 13 Montgomery Village/Airpark 14 North Bethesda 15 North Potomac 16 Olney 17 Potomac 18 R&D Village 19 Rockville City 21 Silver Spring/Takoma Park 33 Clarksburg
Policy Areas EXEMPT from Transit Test 2 Bethesda CBD
20 Silver Spring CBD
22 Wheaton CBD
24 Grosvernor
25 Twinbrook
32 Glenmont
34 Shady Grove Metro Station
35 Friendship Heights
(E) Describe the nature of what is causing each restriction.
School capacity restrictions are evaluated annually by Montgomery County Public Schools using estimated enrollment and capacity figures for Elementary, Middle and High school levels within each school cluster. For school levels over 105% utilization by school cluster, a school facility payment is imposed on new residential development, Similarly, road and transit capacities are evaluated for County Policy Areas. The test for these
evaluations is now made by a “Transportation Policy Area Review” (TPAR) test as an element of the
Planning Department’s four year “Subdivision Staging Policy.” The latest of these was adopted in 2012
and it identified a mitigation fee for many of the County’s Policy Areas.

Annual Report Worksheet
Reporting (Calendar) Year 2013
37
(F) What is the proposed resolution of each restriction (if available)?
In all cases, the restrictions result in mitigation fees to be collected prior to any plan approvals in the
affected areas. In the case of road and transit facilities, the fees go to the County Department of
Transportation where they are put towards the County’s CIP for road and bus route improvements,
which factor into the next TPAR test. With respect to schools, the school facility payment is placed in
an account to be used in the applicable school cluster and the school level deemed inadequate.
(G) What is the estimated date for the resolution of each restriction (if available)?
The annual test of school adequacy is based on projected enrollment and projected capacity. Funding
included in the six year CIP can be counted toward capacity and can, therefore, result in a restriction
being removed from a school cluster area.
(H) What is the resolution that lifted each restriction (if applicable)?
In the case of schools, additional funding of capacity or estimated decrease in enrollment can result in
the restriction being removed.
(I) When was each restriction lifted (if applicable)?
The adequacy of school facilities is tested annually; therefore, any restriction imposed in one year can
be removed in the next.
(J) Has your jurisdiction reported the restrictions reported in (C) through (I) above as part of the
required biennial APFO annual reporting requirements?
Y N
(Note: Jurisdictions with adopted APFOs must submit a biennial APFO report when a restriction
within the PFA occurs within the reporting period. The APFO report is due by July 1 of each even
year and covers the reporting period for the previous two calendar years, currently 2013 and
2012.)

Annual Report Worksheet
Reporting (Calendar) Year 2013
38
Section X: Submitting Annual Reports and Technical Assistance
(A) Annual Reports may be submitted via email or hyperlink to [email protected]
(preferred) or one copy may be mailed to:
Office of the Secretary
Maryland Department of Planning
301 W. Preston Street, Suite 1101
Baltimore, Maryland 21201-2305
Attn: David Dahlstrom, AICP
(B) Annual Reports should include a cover letter indicating that the Planning Commission has
approved the Annual Report and acknowledging that a copy of the Annual Report has been
filed with the local legislative body. The cover letter should indicate a point of contact(s) if
there are technical questions about your Annual Report.
1. Was this Annual Report approved by the planning commission/board? Y N
2. Was this Annual Report filed with the local legislative body? Y N
3. Does the cover letter:
a. Acknowledge that the planning commission/board has
approved the Annual Report. Y N
b. Acknowledge that the Annual Report has been filed
with the local legislative body? Y N
c. Indicate a point of contact(s)? Y N
(C) You may wish to send an additional copy of your Annual Report directly to your MDP Regional
Office via email or hyperlink (preferred) or hardcopy.
(D) If you need any technical assistance in preparing or submitting your reports, our Regional
Planners are available to assist you. Regional Planner contact information can be found at:
(E) Copies of this Annual Report worksheet and links to legislation creating these Annual Report
requirements can be found on the Maryland Department of Planning website:
(F) If you have any suggestions to improve this worksheet or any of the annual report materials,
please list or contact David Dahlstrom at [email protected].