anomalous surface segregation behaviour of some 3d elements in ferromagnetic iron
TRANSCRIPT

Anomalous surface segregation behaviour of some 3d elements in ferromagnetic iron
This content has been downloaded from IOPscience. Please scroll down to see the full text.
Download details:
IP Address: 128.135.12.127
This content was downloaded on 24/09/2013 at 12:48
Please note that terms and conditions apply.
2013 J. Phys.: Condens. Matter 25 415502
(http://iopscience.iop.org/0953-8984/25/41/415502)
View the table of contents for this issue, or go to the journal homepage for more
Home Search Collections Journals About Contact us My IOPscience

IOP PUBLISHING JOURNAL OF PHYSICS: CONDENSED MATTER
J. Phys.: Condens. Matter 25 (2013) 415502 (8pp) doi:10.1088/0953-8984/25/41/415502
Anomalous surface segregation behaviourof some 3d elements in ferromagnetic iron
Michele Gupta and Raju P Gupta
Laboratoire de Thermodynamique et Physico-chimie d’Hydrures et Oxydes, Universite de Paris-Sud,F-91405 Orsay, France
E-mail: [email protected]
Received 6 May 2013, in final form 22 July 2013Published 18 September 2013Online at stacks.iop.org/JPhysCM/25/415502
AbstractThe segregation of Cr in Fe is known to be anomalous since the barrier for surface segregation ofCr is not determined by the topmost surface layer, as one would expect, but rather by thesubsurface layer where the energy of segregation is much larger and endothermic. This has beenattributed to a complex interaction involving the antiferromagnetism of Cr and the ferromagnetismof Fe. We report in this paper the results of our ab initio electronic structure calculations on thesegregation behaviour of all the 3d elements on the (1 0 0) surface of ferromagnetic iron in thehope of better understanding this phenomenon. We find a similar behaviour for the segregation ofthe next antiferromagnetic 3d element Mn in Fe, where the subsurface layer is also found to blockthe segregation of Mn to the surface. On the other hand, ferromagnetic Co exhibits a normalsegregation behaviour. The elements Sc, Cu and Ni do not form solid solutions with ferromagneticiron. The early elements Ti and V are non-magnetic in their metallic states, but are stronglypolarized by Fe, and develop magnetic moments which are aligned antiferromagnetically to thoseof Fe atoms. While the subsurface layer blocks the segregation of Ti to the surface, no blockingbehaviour is found for the segregation of V. The segregation behaviour of all these elements isstrongly correlated with the displacement of the solute atoms on the surface of Fe. The elementsshowing anomalous segregation behaviour are all displaced upwards on the surface, while thoseshowing normal segregation are pulled inwards. These results indicate that the antiferromagnetismof the segregating element plays the key role in the anomalous segregation behaviour in Fe.
(Some figures may appear in colour only in the online journal)
1. Introduction
In alloys that form solid solutions, the energy of solutionof the solute element is necessarily exothermic but moreexothermic in the bulk than anywhere else, including onthe surface; hence energy is required for the element tosegregate to the surface. In most binary alloys, the energyof solution gradually becomes more exothermic from thesurface towards the subsurface layers until it reaches its bulkvalue far from the surface. Thus the segregation energy, themaximum energy required for segregation, can be determinedin a straightforward manner from the difference in the solutionenergies at the topmost surface layer and in the bulk [1].Unfortunately, this nice picture of surface segregation breaksdown for dilute Fe–Cr alloys since the energy of segregation
of Cr from the bulk to the subsurface layer, just below thetopmost surface layer, is not only not exothermic but is insteadlarge and endothermic, and more endothermic than on thesurface [2–6]. This means that the maximum energy for thesegregation of Cr is not determined by the topmost surfacelayer but rather by the subsurface layer, and this fact thereforehas to be included in all thermodynamic modelling involvingCr segregation. This anomalous segregation behaviour of Crhas been attributed [6] to a complex interaction that involvesthe antiferromagnetism of Cr and the ferromagnetism of Fethat changes considerably the nature of atomic relaxations,resulting in the modification of the electronic structure in sucha manner that the incorporation of Cr in the subsurface layeris not favoured.
10953-8984/13/415502+08$33.00 c© 2013 IOP Publishing Ltd Printed in the UK & the USA
J. Phys.: Condens. Matter 25 (2013) 415502 M Gupta and R P Gupta
The Fe–Cr alloys with a low concentration of Cr(∼10 at.%) are important as structural materials [7]. Thesegregation of Cr to the surface of these alloys plays a majorrole in controlling many key properties, including corrosionresistance. Consequently, it is important to understand themechanisms controlling the anomalous segregation behaviourof Cr in these alloys. As stated above, the antiferromagneticnature of Cr has been invoked [6] to be the principal cause ofthis anomalous segregation. If this is the case, one can thenexpect to find a similar segregation behaviour for Mn in Fe,since Mn is also antiferromagnetic although, in contrast to thecase of Cr, the magnetic structure of Mn in its metallic stateis exceedingly complex [8–13]. The calculations presentedbelow show that in the case of Mn also, the subsurfacelayer presents a barrier for segregation of Mn to the surface,and this clearly indicates that the antiferromagnetism ofthe segregating element is the driving mechanism for theanomalous segregation behaviour in body-centred-cubic (bcc)ferromagnetic iron. To better understand this phenomenon,we have investigated the segregation behaviour of all the 3delements in bcc Fe, and the results of our ab initio electronicstructure calculations on the surface segregation of theseelements, treated as an impurity, in ferromagnetic Fe arepresented in this paper. We find that the antiferromagneticnature of the segregating element is essential for obtaining theblocking effect of the subsurface layer for segregation to thesurface.
It is also important to mention that iron is an importantmaterial of both scientific and technological interest. Theaddition of 3d elements to Fe occurs in many technologicalapplications. Apart from the case of Fe–Cr alloys forstructural applications, we cite the use of Fe–Cr multilayersin giant magnetoresistance applications [14] and Fe–Ni alloysin INVAR effect applications [15]. Fe–Mn alloys are of greattechnological importance since small amounts of added Mnare used to greatly improve the strength and ductility of thesteel due to twinning and transformation-induced plasticity(TWIP and TRIP) effects [12]. In the atomic state, Mn hasa half-filled d-shell with the largest magnetic moment of5 µB, and it would be of considerable industrial interest ifthis moment could be retained in a solid state environment.Apart from the segregation behaviour of 3d elements, someimportant results that emerge from the present investigationare that Fe enhances considerably the magnetic moments ofCr and Mn at its surface relative to their values in their ownmetallic states or in the bulk of Fe. It also induces largemoments at Ti and V sites aligned anti-parallel to those ofFe, but it does not change the magnetic moment at the Co sitefrom its value in the metallic state of Co. These results areimportant in nanotechnology.
2. Details of calculations
The segregation energy of a solute is the difference betweenthe solution energies of the solute (denoted by M) in thefinal position and in the initial position. We use repeated slabgeometry for calculation of the segregation energies, whichare calculated in two different ways. In the first method,
denoted Method 1, we displace the impurity atom from thecentral layer (assumed to represent the bulk) towards thesurface. The solution energies in the bulk and the surfacelayers are given by the following relations:
ECsol = EC
Tot(FeN−1M)− ETot(M)+ ETot(Fe) (1)
ESsol = ES
Tot(FeN−1M)− ETot(M)+ ETot(Fe), (2)
where ECTot(FeN−1M) and ES
Tot(FeN−1M) are the total energiesof a slab containing (N − 1) Fe atoms and one M atom inthe central layer and the surface layer S, respectively, andETot(Fe) and ETot(M) are the total energies (per atom) ofpure Fe and pure M in their ferromagnetic and magneticor non-magnetic states respectively. The segregation energy,ES
seg, to the layer S is then given by
ESSeg = ES
sol − ECsol. (3)
From equations (1) and (2), one then obtains the expectedresult
ESseg = ES
Tot(FeN−1M)− ECTot(FeN−1M), (4)
showing that the segregation energy of the solute can becalculated in a straightforward manner from the difference ofthe total energies of the solute at the surface and the centrallayers. Note that the energies of solution do not enter directlyin this expression. This is the method that was used in previouscalculations [3, 4].
In the second method, denoted Method 2, the mirrorsymmetry (with respect to the central layer) along the c-axis isexploited, as in our previous work [6], when the impurity atomis put in a surface layer. In other words, the impurity atomsare placed symmetrically on each of the two surface layers,except the central layer where there is only one impurity atom.In this model with mirror symmetry, the energy of solution ofthe solute, ES
sol, in a surface layer can be obtained from thefollowing relation:
ESsol = (E
STot(FeN−2M2)− 2ETot(M)+ 2ETot(Fe)
− ETot(FeN))/2, (5)
where ESTot(FeN−2M2) is the total energy of a slab containing
(N − 2) Fe atoms and two M atoms symmetrically placed inthe surface layers S, and ETot(FeN) is the total energy withoutany M atoms. The segregation energy can then be obtainedfrom the relation
ESSeg = (E
STot(FeN−2M2)− 2EC
Tot(FeN−1M)
+ ETot(FeN))/2. (6)
One sees again from equation (6) that the energies of solutiondo not enter, in a direct manner, into the calculation of thesegregation energies.
The electronic structure calculations presented in thiswork were performed within the density functional theory(DFT) using the spin polarized version [16–18] of the Viennaab initio simulation package (VASP) in the generalizedgradient approximation (GGA). The projected augmentedwave (PAW) potentials [19] were employed in conjunctionwith the PW91 version of GGA [20] to account for the
2
J. Phys.: Condens. Matter 25 (2013) 415502 M Gupta and R P Gupta
exchange and correlation corrections. The ferromagnetismof Fe plays a critical role in determining the properties ofiron, and its inclusion is essential for a reliable determinationof the defect properties in iron, especially when we areconcerned with the 3d elements as in the present work.The semi-core electrons were treated as valence electronsin the present computations. In this work we consider theFe (1 0 0) surface since this surface is found to be the moststable. We use a slab with dimensions (2a 2a 4a) along the a-,b- and c-axes, separated by a vacuum layer of 4a (∼11.3 A)along the c-axis, where a is the lattice constant of bcc bulkFe. The supercell thus contained 36 atoms (nine layers inthe c-direction). An energy cut-off (ENCUT) of 500 eVwas employed, and the results were fully converged using a(7 7 1) k-point grid in the Monkhorst–Pack [21] scheme. Infact, the results were nearly identical with a larger k-pointgrid (9 9 3). We used the theoretically determined latticeconstant (a = 2.826 A) of ferromagnetic Fe. This correspondsto treating the impurity atom in the infinitely dilute limit. Inour calculations, none of the layers were kept fixed, and theatomic coordinates were fully relaxed until the total energieswere converged to 10−4 eV or better, and the forces on theatoms were converged to better than 10−3 eV A
−1. The
magnetic moment in bulk Fe was found to be 2.20 µB, in goodagreement with experimental measurements and previouscalculations [22–26].
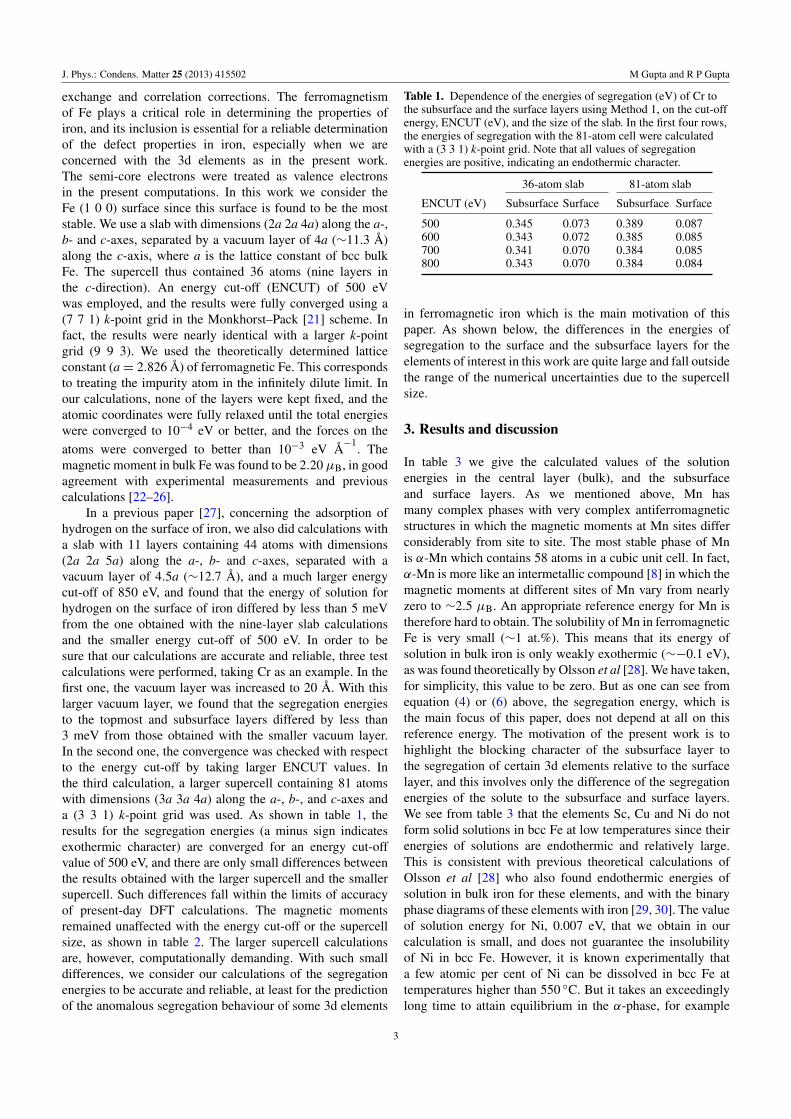
In a previous paper [27], concerning the adsorption ofhydrogen on the surface of iron, we also did calculations witha slab with 11 layers containing 44 atoms with dimensions(2a 2a 5a) along the a-, b- and c-axes, separated with avacuum layer of 4.5a (∼12.7 A), and a much larger energycut-off of 850 eV, and found that the energy of solution forhydrogen on the surface of iron differed by less than 5 meVfrom the one obtained with the nine-layer slab calculationsand the smaller energy cut-off of 500 eV. In order to besure that our calculations are accurate and reliable, three testcalculations were performed, taking Cr as an example. In thefirst one, the vacuum layer was increased to 20 A. With thislarger vacuum layer, we found that the segregation energiesto the topmost and subsurface layers differed by less than3 meV from those obtained with the smaller vacuum layer.In the second one, the convergence was checked with respectto the energy cut-off by taking larger ENCUT values. Inthe third calculation, a larger supercell containing 81 atomswith dimensions (3a 3a 4a) along the a-, b-, and c-axes anda (3 3 1) k-point grid was used. As shown in table 1, theresults for the segregation energies (a minus sign indicatesexothermic character) are converged for an energy cut-offvalue of 500 eV, and there are only small differences betweenthe results obtained with the larger supercell and the smallersupercell. Such differences fall within the limits of accuracyof present-day DFT calculations. The magnetic momentsremained unaffected with the energy cut-off or the supercellsize, as shown in table 2. The larger supercell calculationsare, however, computationally demanding. With such smalldifferences, we consider our calculations of the segregationenergies to be accurate and reliable, at least for the predictionof the anomalous segregation behaviour of some 3d elements
Table 1. Dependence of the energies of segregation (eV) of Cr tothe subsurface and the surface layers using Method 1, on the cut-offenergy, ENCUT (eV), and the size of the slab. In the first four rows,the energies of segregation with the 81-atom cell were calculatedwith a (3 3 1) k-point grid. Note that all values of segregationenergies are positive, indicating an endothermic character.
ENCUT (eV)
36-atom slab 81-atom slab
Subsurface Surface Subsurface Surface
500 0.345 0.073 0.389 0.087600 0.343 0.072 0.385 0.085700 0.341 0.070 0.384 0.085800 0.343 0.070 0.384 0.084
in ferromagnetic iron which is the main motivation of thispaper. As shown below, the differences in the energies ofsegregation to the surface and the subsurface layers for theelements of interest in this work are quite large and fall outsidethe range of the numerical uncertainties due to the supercellsize.
3. Results and discussion
In table 3 we give the calculated values of the solutionenergies in the central layer (bulk), and the subsurfaceand surface layers. As we mentioned above, Mn hasmany complex phases with very complex antiferromagneticstructures in which the magnetic moments at Mn sites differconsiderably from site to site. The most stable phase of Mnis α-Mn which contains 58 atoms in a cubic unit cell. In fact,α-Mn is more like an intermetallic compound [8] in which themagnetic moments at different sites of Mn vary from nearlyzero to ∼2.5 µB. An appropriate reference energy for Mn istherefore hard to obtain. The solubility of Mn in ferromagneticFe is very small (∼1 at.%). This means that its energy ofsolution in bulk iron is only weakly exothermic (∼−0.1 eV),as was found theoretically by Olsson et al [28]. We have taken,for simplicity, this value to be zero. But as one can see fromequation (4) or (6) above, the segregation energy, which isthe main focus of this paper, does not depend at all on thisreference energy. The motivation of the present work is tohighlight the blocking character of the subsurface layer tothe segregation of certain 3d elements relative to the surfacelayer, and this involves only the difference of the segregationenergies of the solute to the subsurface and surface layers.We see from table 3 that the elements Sc, Cu and Ni do notform solid solutions in bcc Fe at low temperatures since theirenergies of solutions are endothermic and relatively large.This is consistent with previous theoretical calculations ofOlsson et al [28] who also found endothermic energies ofsolution in bulk iron for these elements, and with the binaryphase diagrams of these elements with iron [29, 30]. The valueof solution energy for Ni, 0.007 eV, that we obtain in ourcalculation is small, and does not guarantee the insolubilityof Ni in bcc Fe. However, it is known experimentally thata few atomic per cent of Ni can be dissolved in bcc Fe attemperatures higher than 550 ◦C. But it takes an exceedinglylong time to attain equilibrium in the α-phase, for example
3
J. Phys.: Condens. Matter 25 (2013) 415502 M Gupta and R P Gupta
Table 2. Dependence of the magnetic moments (µB) of Cr in the central, subsurface and surface layers, using Method 1, on the cut-offenergy, ENCUT (eV), and the size of the slab.
ENCUT (eV)
36-atom slab 81-atom slab
Central Subsurface Surface Central Subsurface Surface
500 −1.737 −1.853 −3.124 −1.684 −1.849 −3.062600 −1.742 −1.857 −3.123 −1.690 −1.853 −3.064700 −1.744 −1.854 −3.125 −1.692 −1.854 −3.066800 −1.746 −1.855 −3.127 −1.692 −1.855 −3.066
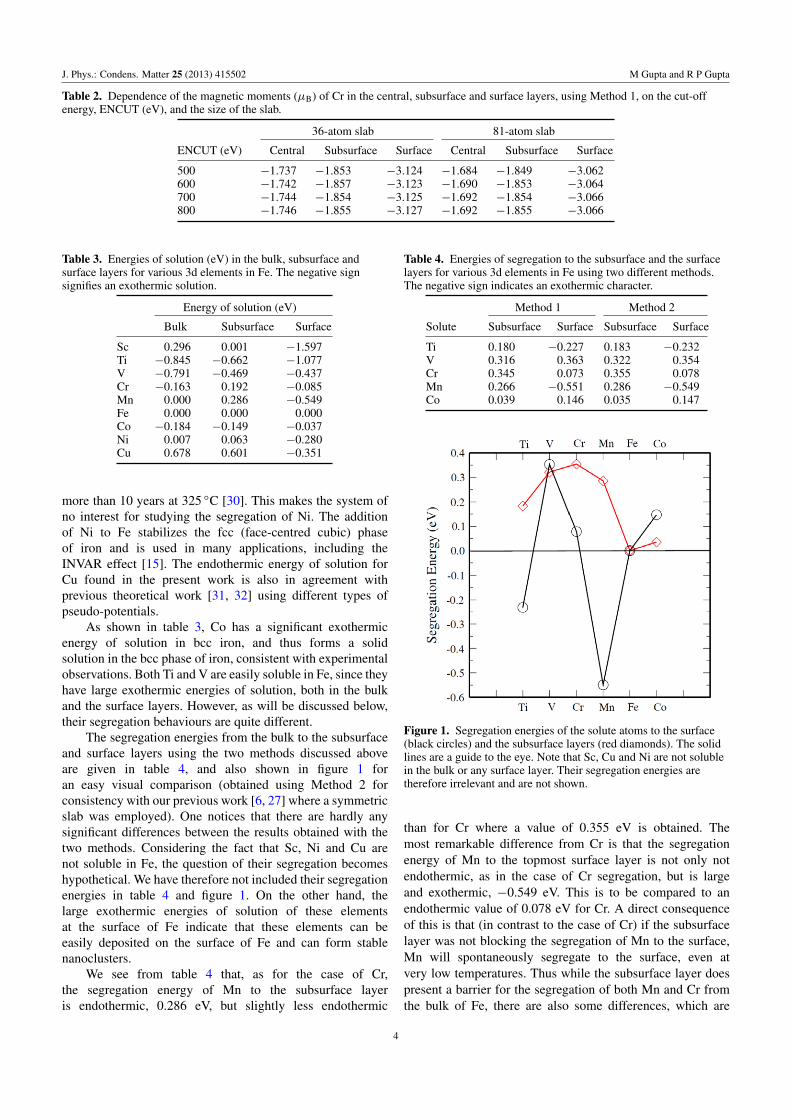
Table 3. Energies of solution (eV) in the bulk, subsurface andsurface layers for various 3d elements in Fe. The negative signsignifies an exothermic solution.
Energy of solution (eV)
Bulk Subsurface Surface
Sc 0.296 0.001 −1.597Ti −0.845 −0.662 −1.077V −0.791 −0.469 −0.437Cr −0.163 0.192 −0.085Mn 0.000 0.286 −0.549Fe 0.000 0.000 0.000Co −0.184 −0.149 −0.037Ni 0.007 0.063 −0.280Cu 0.678 0.601 −0.351
more than 10 years at 325 ◦C [30]. This makes the system ofno interest for studying the segregation of Ni. The additionof Ni to Fe stabilizes the fcc (face-centred cubic) phaseof iron and is used in many applications, including theINVAR effect [15]. The endothermic energy of solution forCu found in the present work is also in agreement withprevious theoretical work [31, 32] using different types ofpseudo-potentials.
As shown in table 3, Co has a significant exothermicenergy of solution in bcc iron, and thus forms a solidsolution in the bcc phase of iron, consistent with experimentalobservations. Both Ti and V are easily soluble in Fe, since theyhave large exothermic energies of solution, both in the bulkand the surface layers. However, as will be discussed below,their segregation behaviours are quite different.
The segregation energies from the bulk to the subsurfaceand surface layers using the two methods discussed aboveare given in table 4, and also shown in figure 1 foran easy visual comparison (obtained using Method 2 forconsistency with our previous work [6, 27] where a symmetricslab was employed). One notices that there are hardly anysignificant differences between the results obtained with thetwo methods. Considering the fact that Sc, Ni and Cu arenot soluble in Fe, the question of their segregation becomeshypothetical. We have therefore not included their segregationenergies in table 4 and figure 1. On the other hand, thelarge exothermic energies of solution of these elementsat the surface of Fe indicate that these elements can beeasily deposited on the surface of Fe and can form stablenanoclusters.
We see from table 4 that, as for the case of Cr,the segregation energy of Mn to the subsurface layeris endothermic, 0.286 eV, but slightly less endothermic
Table 4. Energies of segregation to the subsurface and the surfacelayers for various 3d elements in Fe using two different methods.The negative sign indicates an exothermic character.
Solute
Method 1 Method 2
Subsurface Surface Subsurface Surface
Ti 0.180 −0.227 0.183 −0.232V 0.316 0.363 0.322 0.354Cr 0.345 0.073 0.355 0.078Mn 0.266 −0.551 0.286 −0.549Co 0.039 0.146 0.035 0.147
Figure 1. Segregation energies of the solute atoms to the surface(black circles) and the subsurface layers (red diamonds). The solidlines are a guide to the eye. Note that Sc, Cu and Ni are not solublein the bulk or any surface layer. Their segregation energies aretherefore irrelevant and are not shown.
than for Cr where a value of 0.355 eV is obtained. Themost remarkable difference from Cr is that the segregationenergy of Mn to the topmost surface layer is not only notendothermic, as in the case of Cr segregation, but is largeand exothermic, −0.549 eV. This is to be compared to anendothermic value of 0.078 eV for Cr. A direct consequenceof this is that (in contrast to the case of Cr) if the subsurfacelayer was not blocking the segregation of Mn to the surface,Mn will spontaneously segregate to the surface, even atvery low temperatures. Thus while the subsurface layer doespresent a barrier for the segregation of both Mn and Cr fromthe bulk of Fe, there are also some differences, which are
4

J. Phys.: Condens. Matter 25 (2013) 415502 M Gupta and R P Gupta
Table 5. Magnetic moments (µB) of the solute elements in the bulk, subsurface and surface layers. The negative sign indicates theantiferromagnetic alignment with respect to Fe atoms. Up and down indicate the spin up and spin down d electron components, while totalis the total contribution of magnetic moment from all electrons of the solute.
Solute
Bulk Subsurface Surface
Up Down Total Up Down Total Up Down Total
Sc 0.52 −0.85 −0.40 0.48 −0.79 −0.39 0.41 −0.68 −0.30Ti 0.67 −1.30 −0.70 0.61 −1.34 −0.80 0.62 −1.31 −0.74V 0.94 −2.09 −1.25 0.87 −2.17 −1.40 0.71 −2.35 −1.71Cr 1.21 −2.84 −1.74 1.19 −2.88 −1.80 0.53 3.53 −3.10Mn 1.80 −3.20 −1.50 1.32 −3.65 −2.45 0.69 −4.21 −3.64Fe 3.85 −1.67 2.20 3.93 −1.61 2.32 4.17 −1.36 2.83Co 4.53 −2.71 1.73 4.52 −2.74 1.69 4.54 −2.73 1.80Ni 4.46 −3.43 0.97 4.43 −3.50 0.87 4.40 −3.61 0.77Cu 4.53 −4.27 0.20 4.50 −4.33 0.12 4.52 −4.37 0.12
Figure 2. Magnetic moments (µB) of solute atoms on the surface(black diamonds) and subsurface layers (green triangles), and in thebulk (red crosses). The full lines are a guide to the eye.
clearly related to the differing nature of the electronic andmagnetic structures of Cr and Mn in their metallic states.The large exothermic value of segregation energy of Mnfrom the bulk to the topmost surface layer should facilitatethe stable incorporation of Mn in the nanostructures onthe (1 0 0) surface of iron, given the fact that the barrierfor the penetration of Mn from the surface to the bulk isrelatively large (0.835 eV) due to both the large exothermiccharacter of Mn solution on the surface and the endothermicsolution in the subsurface layer. These nanostructures mayhave interesting properties due to a relatively large magneticmoment of Mn (−3.64 µB), shown in table 5, on the surface,antiferromagnetically coupled to both the surface Fe atomsand the Fe atoms in the bulk, the latter remaining clearlyferromagnetic. The electronic structure of Mn overlayers onthe (1 0 0) surface of Fe has been investigated by Spisak andHafner [10, 11].
As shown in table 4, the segregation behaviour of Co tothe surface of Fe is normal since it is the topmost surface layerthat determines the barrier for surface segregation. However,
the most spectacular and contrasting behaviour is exhibitedby the two elements Ti and V. Both are highly solubleeverywhere in Fe. In the case of V, the energy of solutionbecomes gradually less exothermic when moving from thebulk (central layer) to the surface so that the segregationenergy is determined by the surface layer. But in the caseof Ti the solubility is not gradual and increases considerablyat the topmost surface layer relative to the subsurface layer.Thus it is the subsurface layer that determines the barrier forsegregation.
We see from table 4 that the difference between theenergies of segregation to the surface and the subsurfacelayers is quite significant for all the solutes except V. For thecase of V, the calculations were therefore repeated with thelarger supercell with 81 atoms and an energy cut-off ENCUTof 500 eV. Energies of 0.367 eV and 0.331 eV were obtainedfor the segregation to the surface and subsurface, respectively,in good agreement with the values (0.354 V and 0.322 eV,respectively) obtained with the smaller cell, confirming thenormal segregation behaviour of V.
We now discuss the role played by the ferromagnetism ofiron in controlling the segregation behaviour of the 3d soluteelements. Since the 3d states of Fe have substantial exchangesplitting, they induce spin polarization on the neighbouringsolute sites. This clearly depends on the position of the dlevels and the d electron count of the solute, and its locationin the lattice. In table 5, we give the magnetic moments ofthe solutes in the bulk, subsurface and surface layers, andalso show them in figure 2 for visual comparison. Thesemagnetic moments correspond to the choice of atomic spheresin the PAW potentials used in the VASP calculations, and mayslightly underestimate the true values due to the neglect of thecontribution from interstitial region. But this is the standardprocedure used in such calculations. The magnetic momentsof Fe in the bulk, on the surface and in the subsurface layersare also shown in figure 2. These moments arise mainly fromthe 3d electrons of the solute atoms, and the contribution of s,p electrons to the magnetic moment is less than ∼0.1 µB inall cases. In table 5, we have also shown the spin up and spindown components of the d electrons. The contribution of thes, p electrons to the magnetic moment can be determined fromthe difference between the total magnetic moment and the sumof spin up and spin down components of d electrons. We see
5
J. Phys.: Condens. Matter 25 (2013) 415502 M Gupta and R P Gupta
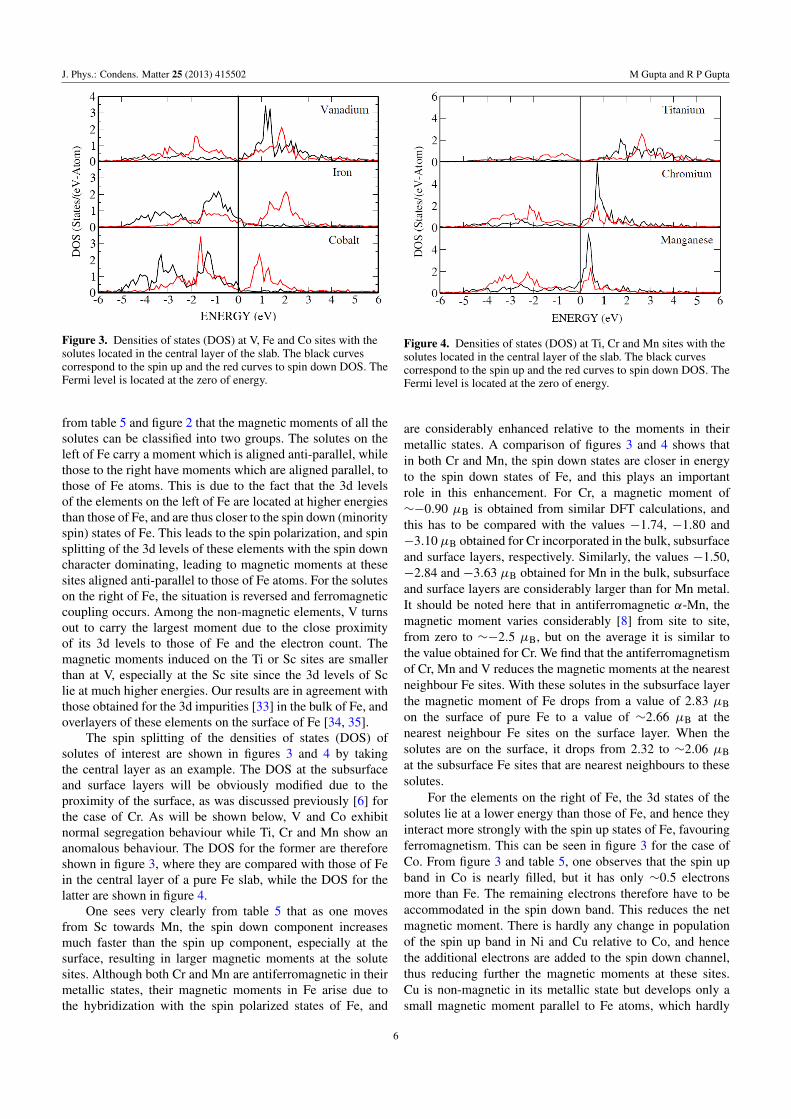
Figure 3. Densities of states (DOS) at V, Fe and Co sites with thesolutes located in the central layer of the slab. The black curvescorrespond to the spin up and the red curves to spin down DOS. TheFermi level is located at the zero of energy.
from table 5 and figure 2 that the magnetic moments of all thesolutes can be classified into two groups. The solutes on theleft of Fe carry a moment which is aligned anti-parallel, whilethose to the right have moments which are aligned parallel, tothose of Fe atoms. This is due to the fact that the 3d levelsof the elements on the left of Fe are located at higher energiesthan those of Fe, and are thus closer to the spin down (minorityspin) states of Fe. This leads to the spin polarization, and spinsplitting of the 3d levels of these elements with the spin downcharacter dominating, leading to magnetic moments at thesesites aligned anti-parallel to those of Fe atoms. For the soluteson the right of Fe, the situation is reversed and ferromagneticcoupling occurs. Among the non-magnetic elements, V turnsout to carry the largest moment due to the close proximityof its 3d levels to those of Fe and the electron count. Themagnetic moments induced on the Ti or Sc sites are smallerthan at V, especially at the Sc site since the 3d levels of Sclie at much higher energies. Our results are in agreement withthose obtained for the 3d impurities [33] in the bulk of Fe, andoverlayers of these elements on the surface of Fe [34, 35].
The spin splitting of the densities of states (DOS) ofsolutes of interest are shown in figures 3 and 4 by takingthe central layer as an example. The DOS at the subsurfaceand surface layers will be obviously modified due to theproximity of the surface, as was discussed previously [6] forthe case of Cr. As will be shown below, V and Co exhibitnormal segregation behaviour while Ti, Cr and Mn show ananomalous behaviour. The DOS for the former are thereforeshown in figure 3, where they are compared with those of Fein the central layer of a pure Fe slab, while the DOS for thelatter are shown in figure 4.
One sees very clearly from table 5 that as one movesfrom Sc towards Mn, the spin down component increasesmuch faster than the spin up component, especially at thesurface, resulting in larger magnetic moments at the solutesites. Although both Cr and Mn are antiferromagnetic in theirmetallic states, their magnetic moments in Fe arise due tothe hybridization with the spin polarized states of Fe, and
Figure 4. Densities of states (DOS) at Ti, Cr and Mn sites with thesolutes located in the central layer of the slab. The black curvescorrespond to the spin up and the red curves to spin down DOS. TheFermi level is located at the zero of energy.
are considerably enhanced relative to the moments in theirmetallic states. A comparison of figures 3 and 4 shows thatin both Cr and Mn, the spin down states are closer in energyto the spin down states of Fe, and this plays an importantrole in this enhancement. For Cr, a magnetic moment of∼−0.90 µB is obtained from similar DFT calculations, andthis has to be compared with the values −1.74, −1.80 and−3.10 µB obtained for Cr incorporated in the bulk, subsurfaceand surface layers, respectively. Similarly, the values −1.50,−2.84 and −3.63 µB obtained for Mn in the bulk, subsurfaceand surface layers are considerably larger than for Mn metal.It should be noted here that in antiferromagnetic α-Mn, themagnetic moment varies considerably [8] from site to site,from zero to ∼−2.5 µB, but on the average it is similar tothe value obtained for Cr. We find that the antiferromagnetismof Cr, Mn and V reduces the magnetic moments at the nearestneighbour Fe sites. With these solutes in the subsurface layerthe magnetic moment of Fe drops from a value of 2.83 µBon the surface of pure Fe to a value of ∼2.66 µB at thenearest neighbour Fe sites on the surface layer. When thesolutes are on the surface, it drops from 2.32 to ∼2.06 µBat the subsurface Fe sites that are nearest neighbours to thesesolutes.
For the elements on the right of Fe, the 3d states of thesolutes lie at a lower energy than those of Fe, and hence theyinteract more strongly with the spin up states of Fe, favouringferromagnetism. This can be seen in figure 3 for the case ofCo. From figure 3 and table 5, one observes that the spin upband in Co is nearly filled, but it has only ∼0.5 electronsmore than Fe. The remaining electrons therefore have to beaccommodated in the spin down band. This reduces the netmagnetic moment. There is hardly any change in populationof the spin up band in Ni and Cu relative to Co, and hencethe additional electrons are added to the spin down channel,thus reducing further the magnetic moments at these sites.Cu is non-magnetic in its metallic state but develops only asmall magnetic moment parallel to Fe atoms, which hardly
6

J. Phys.: Condens. Matter 25 (2013) 415502 M Gupta and R P Gupta
change from the bulk to the surface. Nickel is ferromagneticand remains so in ferromagnetic Fe with magnetic momentswhich are only slightly larger than in Ni metal (∼0.67 µBin our calculation). The magnetic moment of Ni is, on theother hand, larger in the bulk (0.97 µB) than on the surface(0.77 µB), contrary to the expectations of a larger moment atthe surface. Co is a ferromagnetic metal in its normal state,with a magnetic moment of ∼1.7 µB. As shown in table 5,this value is hardly affected in Fe, and remains practicallyunchanged from the bulk to the surface.
We now return to a discussion of the segregationbehaviour of the solutes in Fe. While an anomaloussegregation behaviour of Mn may be expected due to itsintrinsic antiferromagnetic character, as was the case for Cr,the spectacular difference in the segregation behaviours of Tiand V is puzzling. The segregation energies to the subsurfaceand surface sites are quite close in the case of V, despite amuch larger magnetic moment at the V sites than found on thesites of Ti, and it is the topmost surface layer that controls thebarrier for surface segregation of V. This is in contrast to thecase of Ti where it is the subsurface layer which determinesthe segregation energy, as shown in table 4. This puzzlingobservation shows that the effect of the antiferromagneticmoment induced by Fe on Ti and V is different from the onethat was found for the case of Cr and Mn.
In order to solve this puzzle, we show in table 6 theinterlayer relaxations between the two topmost surface layersof Fe, both for pure Fe and in the presence of the soluteon the surface. For the pure Fe case, there is a contractionof −0.021 A from the ideal value, which is a/2 (∼1.4 A)for the (1 0 0) surface. This is consistent with the generaltrend for relaxation expected on the transition metal surfacesfrom theoretical considerations [36]. We see that with allelements, except for Co for which the contraction is the sameas for pure Fe, there is a further contraction of the interlayerseparation in comparison to the case of pure Fe. Table 6also shows that none of the solute atoms sits exactly on thetopmost surface plane of Fe atoms, but is displaced eitherupward or downward from the surface. These displacementsare also shown in figure 5. We mention here that there isa slight dispersion (roughening) in the positions of the Featoms on the surface due to the presence of the solute.Thus the distance of the solute from the surface has beencalculated by taking an average of these positions. We obtainsimilar displacements with calculations using 81-atom slabsfor Cr (0.05 A) and V (−0.08 A). We notice immediatelyfrom table 6 that the positions of the solute atoms on thesurface of Fe can be grouped into two categories—the soluteswhich are located above the surface, and those which arebelow the surface. Leaving aside the elements such as Sc,Ni and Cu which are not soluble in bcc Fe and therefore notconsidered for segregation, the elements Cr, Mn and Ti fall inthe first category and V and Co in the second. For all threeelements in the first category, the subsurface layer presentsa barrier for surface segregation, while for the elements inthe second category, the surface segregation behaviour isnormal, and the topmost surface layer determines the barrierfor segregation. Thus it is clear that the antiferromagnetic
Table 6. Interlayer relaxation (A) between the topmost and thesubsurface layer in the presence of a solute atom on the surface; thenegative sign signifies contraction of the interlayer distance from theideal value in the bulk (a/2). The third column shows the verticaldistance (A) of the solute atom from the Fe atoms on the surface;the negative sign indicates inward displacement.
SoluteInterlayer relaxationbetween Fe layers
Vertical distancebetween solute andsurface Fe layer
Sc −0.058 0.430Ti −0.055 0.084V −0.045 −0.075Cr −0.068 0.057Mn −0.070 0.074Fe −0.021 0.000Co −0.020 −0.099Ni −0.038 −0.025Cu −0.047 0.098
Figure 5. Vertical displacements of the solute atoms from thetopmost surface layer. The positive and negative signs indicateupward and downward displacements respectively.
nature of the segregating element does play an importantrole in blocking the segregation to the surface of Fe, andin both intrinsically antiferromagnetic solutes (Cr, Mn) andFe-induced antiferromagnetic solute (Ti) the solute is locatedabove the surface. Clearly this displacement holds the keyto the puzzle concerning the unexpected difference in thesegregation behaviour of V and Ti.
The position of the solute atoms on the surface of Fe isimportant since it modifies the distance of the solute atom onthe surface with its four nearest neighbour Fe atoms locatedin the subsurface layer. In the case of Cr, Mn and Ti, themost favourable site energetically is located above the surface,and hence this distance increases, while in the case of V andCo the most favourable site energetically is located belowthe surface, and hence this distance decreases relative to thecase of pure Fe. These structural changes can be directlycorrelated with the energy of solution of the solute elementon the surface. As shown in table 3, with contraction ofthe solute–surface distance, the energy of solution on thesurface is less exothermic than in the subsurface layer, butwith expansion it becomes more exothermic and even moreexothermic than in the bulk for Mn and Ti. This relatively
7

J. Phys.: Condens. Matter 25 (2013) 415502 M Gupta and R P Gupta
large exothermic energy of solution of Ti in the surface layermeans that the barrier for Ti segregation is no longer governedby the surface layer but by the subsurface layer. Thus thereare two mechanisms that operate in blocking the segregationof the solute element to the surface layer through thesubsurface layer. They both involve the antiferromagnetism ofthe segregating element. In the first one, the subsurface layeris intrinsically hostile to accommodating the solute element,and furthermore the solution energy in this layer is much moreendothermic relative to both the bulk and the surface layer.This automatically blocks the segregation of the element tothe surface, although it is soluble both in the bulk and thesurface. This applies to the case of Cr and Mn. In the second,there is an increase in the exothermic nature of solution atthe surface relative to the subsurface and the bulk, and thiscreates a barrier at the subsurface layer, and this happens forTi. Indeed, if this barrier did not exist, Ti will not stay in thebulk, and spontaneously segregate to the surface. In the case ofMn the second mechanism also contributes since the solutionenergy at the surface is far more exothermic than in the bulk;again, if the barrier due to subsurface layer did not exist, Mnwill spontaneously segregate to the surface of bcc Fe.
4. Conclusions
In conclusion, we have investigated the segregation behaviourof 3d elements in ferromagnetic bcc iron. We have shownthat both Cr and Mn, which are antiferromagnetic in theirmetallic states, show an anomalous segregation behaviour inferromagnetic Fe. The barrier for segregation in these twocases is not determined by the topmost surface layer but bythe subsurface layer where the energy of segregation is muchmore endothermic than for the topmost surface layer. This is incontrast to the generally accepted behaviour of alloys whichform solid solutions where one expects the topmost surfacelayer to be the most endothermic due to surface termination.There is a strong hybridization and spin polarization betweenstates of these elements and those of Fe, and this results in astrong variation and enhancement of the magnetic momentsfrom the bulk to the surface. Very large magnetic moments,antiferromagnetically aligned to those of Fe, are inducedon the sites of Ti and V, and this affects their segregationbehaviour. The location of Ti above the surface of Fe resultsin a more exothermic energy of solution on the surface of Fethan in the subsurface layer, and hence the barrier for surfacesegregation of Ti to the surface is governed by the subsurfacelayer. In contrast, V is located below the surface, and showsa normal segregation behaviour, which is also the case forCo. The energy of segregation, apart from the mechanismsof diffusion, is an important parameter in the thermodynamicmodelling of iron based alloys, and we believe that theseresults should be included in such modelling.
Acknowledgment
We would like to thank IDRIS (Institut du Developpement etdes Ressources en Informatique Scientifique) for providing
us with access to the high performance computing (HPC)resources of GENCI (Grand Equipement National de CalculIntensif) under project number 90189 for the work presentedin this paper.
References
[1] Nonas B, Wildberger K, Zeller R and Dederichs P H 1998Phys. Rev. Lett. 80 4574
[2] Klaver T P C, Drautz R and Finnis M W 2006 Phys. Rev. B74 094435
[3] Ponomareva A V, Isaev E L, Skorodumova N V, Vekilov Y Kand Abrikosov I A 2007 Phys. Rev. B 75 245406
[4] Kiejna A and Wachowicz E 2008 Phys. Rev. B 78 113403[5] Geng W T 2003 Phys. Rev. B 68 233402[6] Levesque M, Gupta M and Gupta R P 2012 Phys. Rev. B
85 064111[7] Rieth M, Boutard J L, Dudarev S L, Materna Morris E and
Major J 2011 J. Nucl. Mater. 409 140[8] Hobbs D, Hafner J and Spisak D 2003 Phys. Rev. B 68 014407[9] Hafner J and Hobbs D 2003 Phys. Rev. B 68 014408
[10] Spisak D and Hafner J 2000 Phys. Rev. B 61 11569[11] Hafner J and Spisak D 2005 Phys. Rev. B 72 144420[12] Ekholm M and Abrikosov I A 2011 Phys. Rev. B 84 104423[13] Dechelette A, Tonnerre J M, Saint Lager M C, Bartolome F,
Seve L, Raoux D, Fischer H, Piecuch M, Chakarian V andKao C C 1999 Phys. Rev. B 60 6636
[14] Baibich M N, Broto J M, Fert A, Nguyen Van Dau F,Petroff F, Etienne P, Creuzet G, Friederich A andChazelas J 1988 Phys. Rev. Lett. 61 2472
[15] van Schilfgaarde M, Abrikosov I A and Johansson B 1999Nature 400 46
[16] Kresse G and Hafner J 1993 Phys. Rev. B 47 558Kresse G and Hafner J 1994 Phys. Rev. B 49 14251
[17] Kresse G and Furthmuller J 1996 Phys. Rev. B 54 11169Kresse G and Furthmuller J 1996 Comput. Mater. Sci. 6 15
[18] Kresse G and Joubert D 1999 Phys. Rev. B 59 1758[19] Blochl P E 1994 Phys. Rev. B 50 17953[20] Perdew J P and Wang Y 1992 Phys. Rev. B 45 13244[21] Monkhorst H J and Pack J D 1976 Phys. Rev. B 13 5188[22] Ropo M, Kokko K, Punkkinen M P J, Hogmark S, Kollar J,
Johansson B and Vitos L 2007 Phys. Rev. B 76 220401[23] Olsson P, Abrikosov I A, Vitos L and Wallenius J 2003
J. Nucl. Mater. 321 84[24] Olsson P, Domain C and Wallenius J 2007 Phys. Rev. B
75 014110[25] Olsson P, Abrikosov I A and Wallenius J 2006 Phys. Rev. B
73 104406[26] Lavrentiev M, Nguyen Manh D and Dudarev S L 2010 Phys.
Rev. B 81 184202[27] Gupta M, Gupta R P and Levesque M 2012 Phys. Rev. B
86 184201[28] Olsson P, Klaver T and Domain C 2010 Phys. Rev. B
81 054102[29] Okomato H 2000 Desk Handbook—Phase Diagrams of Binary
Alloys (Materials Park, OH: ASM International)[30] Pearson W B 1958 Handbook of Lattice Spacings and
Structures of Metals (New York: Pergamon)[31] Domain C and Becquart C S 2001 Phys. Rev. B 65 024103[32] Soisson F and Fu C C 2007 Phys. Rev. B 76 214102[33] Drittler B, Stefanou N, Blugel S, Zeller R and Dederichs P H
1989 Phys. Rev. B 40 8203[34] Mirbt S, Eriksson O, Johansson B and Skriver H L 1995 Phys.
Rev. B 52 15070[35] Spisak D and Hafner J 2000 Phys. Rev. B 61 4160[36] Gupta R P 1981 Phys. Rev. B 23 6265
8