anp-10293, rev. 2, 'u.s. epr design features to address ... · areva np inc. anp-10293...
TRANSCRIPT

AREVA NP Inc. ANP-10293 Revision 2
U.S. EPR Design Features to Address GSI-191 Technical Report Page D-68
For the U.S. EPR sump calculations, it is assumed that any aluminum released from
aluminum metal and from Nukon fiber precipitates as it is released to the solution. This
assumption defines the maximum amount of chemical (precipitate to use in sump
screen testing.
D.3.3.5 Microtherm
Microtherm is a dense composite comprised of granular material and a small amount of
fibrous material. For the autoclave test, it was assumed that the quilted material was
torn open during the LOCA event, releasing the granular and fibrous material to the
sump liquid.
Per the material safety data sheet, the granular material is composed of 35 to 70
percent amorphous silica, 20 to 60 percent titanium dioxide, and 0 to 25 percent
aluminum oxide [5]. Testing done by CNWRA [6] found Microtherm to be the most
reactive insulation material tested, releasing significant quantities of silica while
becoming enriched in titanium and exhibiting a marked change in surface appearance.
EDS analysis of a sample of the granular material used in the autoclave test (refer to
Table D.3-5) confirmed that silica and titanium were the major elements present.
Assuming that the silica is present as SiO2, the titanium as TiO2, and the aluminum as
Al2O3, the compound weight percentages in this sample analysis are 44.1 percent, 12.0
percent, and 0.3 percent, respectively. These results suggest that the aluminum oxide
content was at the low end of the expected range and the silica content was within the
expected range of 35 to 70 weight percent. In developing the model for the sump
calculations, the assumption was made that the Microtherm particulate material added
to the autoclave was composed of 35 weight percent of SiO2 and a negligible amount of
Al2O3.

AREVA NP Inc. ANP-10293 Revision 2
U.S. EPR Design Features to Address GSI-191 Technical Report Page D-69
Table D.3-5 Pretest SEM/EDS Composition of Microtherm
Element Weight% O 70.67 F 1.14 Al 0.16 Si 20.60 Ti 7.20 Fe 0.08 Cu 0.15
Total 100.00
Review of the autoclave silica concentration as determined by ICP-MS analysis (refer to Figure
D.3-7) suggests that there are at least two separate sources of silica. (indicated by the
dashed and solid lines) with markedly different release rates. Since Microtherm
particulate is the most reactive material, a reasonable conclusion is that the amorphous
SiO2 available from Microtherm is the primary source of silica in solution during the first
20 hours of the test. Assuming that the 2.5925 grams of Microtherm added to the
autoclave is 35 wt% SiO2, there would be approximately 0.91 grams of SiO2 (0.42
grams of Si) available for release. For an initial estimate of silica release from the
Microtherm, it is assumed that all 0.91 grams of SiO2 is released in 20 hours at a linear
rate of 6 mg/liter·hr.

AREVA NP Inc. ANP-10293 Revision 2
U.S. EPR Design Features to Address GSI-191 Technical Report Page D-70
Figure D.3-7 Measured Silica Concentration
y = 0.1441x + 64.585R2 = 0.9365
y = 2.9772x + 7.9098R2 = 0.9734
0
10
20
30
40
50
60
70
80
90
100
0 20 40 60 80 100 120 140 160 180
Elapsed Time, hours
Si C
once
ntra
tion,
ppm
Si(+4)

AREVA NP Inc. ANP-10293 Revision 2
U.S. EPR Design Features to Address GSI-191 Technical Report Page D-71
D.3.4 Validation of Chemical Release Rates
D.3.4.1 Comparison of Estimated Chemical Release Rates with Autoclave Test
The chemical masses released by each of the materials exposed to the autoclave sump
liquid as a function of time were calculated using the relationships developed in Section
D.3.3. Table D.3-6 summarizes the weight losses for these materials compared with
the predicted weight losses. The largest difference between measured and predicted is
for Microtherm. Because of Microtherm’s very small particulate size, some quantity of
the material was lost to the system and/or included in the material recovered from the
bottom of the autoclave following the test. The remaining predictions are reasonably
close to the measured values and, based on this agreement, the relationships
developed in Section D.3.3 are considered valid for calculating the material release in
the U.S. EPR LOCA event.
Table D.3-6 Measured Weight Losses of Materials
Material Weight, g Notes
Pre-test 42.5273 Post-test 42.5837 Post-test 41.4978 After cleaning Concrete
Weight Loss 1.0295 0.971 grams predicted
Pre-test 2.4013
Post-test 2.3848 Before cleaning (0.0165 grams weight loss)
Post-test 2.3732 After cleaning Aluminum
Weight Loss 0.0281 0.0245 grams predicted
Pre-test 0.4812 Post-test 0.5029 Post-test 0.2451 After drying NUKON
Weight Loss 0.2361 0.416 grams predicted
Pre-test 2.5925 Post-test 0.7200 Microtherm
Weight Loss 1.8725 Unknown quantity lost to system due to its small particle size

AREVA NP Inc. ANP-10293 Revision 2
U.S. EPR Design Features to Address GSI-191 Technical Report Page D-72
Material Weight, g Notes
Pre-test 0.5388 Pulverized cement : 0.1757 grams, bentonite: 0.1855 grams, sand: 0.1776 grams
Post-test 0.3126 Latent Debris
Weight Loss 0.2262 Assume pulverized cement is dissolved quickly. Bentonite and sand are insoluble in water.
Post test 0.4060 7% CaHPO4; 11-14% NaAlSi3O8; balance: titanium Recovered
Precip. Filtered 0.3583 Material collected on 16 filters
Total 0.7643 Precipitated material & Microtherm particulates
OLI StreamAnalyzer™ was used to calculate the at-temperature solution pH, the
concentrations of aqueous species in solution, and the identity and quantity of
precipitates formed for comparison with the measured data. The chemical species
released to the solution during the autoclave test, calculated using the relationships
developed in Section D.3.3, and other test variables input to StreamAnalyzer are
tabulated in Table D.3-7. The pH (at temperature) values (pHT) shown in Table D.3-7
are the values calculated by StreamAnalyzer.

AREVA NP Inc. ANP-10293 Revision 2
U.S. EPR Design Features to Address GSI-191 Technical Report Page D-73
Table D.3-7 Estimated Chemical Releases during Autoclave Test
The concentrations of silicon and aluminum ions in solution are available in the
StreamAnalyzer output and are plotted in Figure D.3-8 for comparison with the
measured concentrations. As discussed in Section 3.3.4, the kinetics of precipitation for
aluminum appears to be controlling as the concentration of aluminum in solution
remained at the solubility limit during the test period. To compare the predicted
releases vs. the measured values, it was necessary to “turn off” the precipitation of
aluminum species in the calculations. The resulting predicted and measured aqueous
concentrations are shown in Figure D.3-8. The agreement between the predicted and
measured values is further validation of the relationships for chemical release
developed in Section D.3.3.

AREVA NP Inc. ANP-10293 Revision 2
U.S. EPR Design Features to Address GSI-191 Technical Report Page D-74
Figure D.3-8 Comparison of Aqueous Concentrations Calculated with StreamAnalyzer with Measured Values
(Aluminum Precipitation Turned Off)
0
10
20
30
40
50
60
70
80
90
100
0 20 40 60 80 100 120 140 160 180
Elapsed Time, hours
Si C
once
ntra
tion,
ppm
0
1000
2000
3000
4000
5000
6000
7000
8000
9000
10000
Al C
once
ntra
tion,
ppb
Si(+4) OLI Si(+4) Al+++ OLI Al(+3)
If precipitation of aluminum species is allowed in the calculations, the concentration of
aluminum immediately drops to zero as there is sufficient sodium and silica in solution
to form sodium aluminum silicate, NaAlSi3O8. As indicated in Table D.3-6, the formation
of NaAlSi3O8 was confirmed by SEM/EDS as present in the solid material collected from
the autoclave following the test.
Figure D.3-9 shows the concentrations in solution when aluminum is allowed to
precipitate. Note that the aluminum concentration in solution is zero and that the silica
concentration is decreased by the formation of sodium aluminum silicate. In reality, as
noted in the previous paragraph, some quantity of aluminum did precipitate as
NaAlSi3O8 during the test even though the kinetics is slow. For U.S. EPR LOCA
calculations, it will be assumed that all aluminum released forms precipitates. For
purposes of sump screen testing, this assumption is conservative.

AREVA NP Inc. ANP-10293 Revision 2
U.S. EPR Design Features to Address GSI-191 Technical Report Page D-75
Figure D.3-9 Comparison of Aqueous Concentrations Calculated with StreamAnalyze with Measured Values
(Aluminum allowed to Precipitate)
0
10
20
30
40
50
60
70
80
90
100
0 20 40 60 80 100 120 140 160 180
Elapsed Time, hours
Si C
once
ntra
tion,
ppm
0
1000
2000
3000
4000
5000
6000
7000
8000
9000
10000
Al C
once
ntra
tion,
ppb
Si(+4) OLI Si(+4) Al+++ OLI Al(+3)
Another precipitate that was expected to form during the test was calcium phosphate,
Ca5(PO4)2. The major source of calcium is the concrete and the release rate was
assumed to be directly proportional to temperature and constant with time. As noted in
Table D.3-6, the measured weight loss for the concrete coupon in the test correlated
closely with the weight loss predicted using the estimated release rates for calcium and
silica. The amount of calcium phosphate that should have precipitated during the
autoclave test as determined by OLI StreamAnalyzer is approximately 2.1 grams. Only a
small amount of calcium phosphate was detected by EDS (refer to Table D.3-6) in the solid
material collected after the test. However, since minor amounts of calcium were detected in
most solid samples, it is believed that the calcium phosphate was distributed throughout the
autoclave and test loop, making quantification impractical. Since minor amounts of calcium
were detected in most solid samples, it is believed that calcium phosphate did in fact
precipitate and was distributed throughout the autoclave and test loop, making
quantification impractical. It is assumed that the release rate estimates for concrete

AREVA NP Inc. ANP-10293 Revision 2
U.S. EPR Design Features to Address GSI-191 Technical Report Page D-76
developed in this document are valid and can be used for the sump calculations. This
approach should be conservative, based on the results of the autoclave test.
D.3.5 Key Assumptions
Using the release rates identified in Sections D.3.3 and D.3.4, identification and
quantities of chemical precipitates formed and sump pH values were determined using
the OLI Systems, Inc. StreamAnalyzer equilibrium thermodynamic Mixed Solvent
Electrolyte (MSE) model (refer to section D.3.7). The following assumptions are implicit
in the results:
• System transients and non-equilibrium conditions are not considered. Each
phase (solid, liquid, and gas) is assumed to be in thermodynamic equilibrium with
the surrounding phases.
• Kinetic reaction rates are not included in the model. As a result, all species that
reach thermodynamic saturation are assumed to precipitate to reach equilibrium.
In reality, some degree of supersaturation is required to prompt solid nucleation
and initiate precipitation from solution. In particular, the precipitation of aluminum
compounds such as AlOOH and Al(OH)3 is complex and some degree of
supersaturation can persist for significant periods of time before precipitation
occurs. As discussed previously, this was apparently the case in the autoclave
test in which the concentration of aluminum ions in solution was constant during
the test period at the solubility limit of aluminum.
• No species-specific interactions that could potentially influence crystal nucleation
and growth are considered. As a result, reactions that inhibit precipitation are not
replicated, thereby making the calculation results conservative.
• Chemical release rates were determined from published literature test results
and verified where possible by comparison with the autoclave test results.

AREVA NP Inc. ANP-10293 Revision 2
U.S. EPR Design Features to Address GSI-191 Technical Report Page D-77
• The most stable form of calcium phosphate precipitate considered by
StreamAnalyzer is hydroxyapatite, Ca5(OH)(PO4)3, which is a metastable,
poorly-crystallized phosphate. For the sump calculations, hydroxyapatite will not
be allowed to form; instead, the precipitate allowed to form will be calcium
phosphate, Ca5(PO4)2.
D.3.6 Calculation of Chemical Precipitates Formed During LOCA
The concrete surface area identified for the autoclave test was bounded by assuming
that the entire heavy floor would be exposed to the recirculating flow. However, since
the concrete is protected with an epoxy or equivalent coating and only the coatings
within a LOCA blast radius would fail, the actual exposed surface area will be much
smaller and depend directly on the location of the break. In addition, the quantity of
debris generated by a LOCA blast and subsequent blowdown or High Energy Line
Break (HELB) has been finalized in the debris generation evaluation for the U.S. EPR.
This information was used to select the location that would generate the largest amount
of debris. The resulting debris masses and exposed concrete surface area were then
used to calculate the chemical precipitates that would form during the 30-day period
following the break.
The results of the Debris Generation Evaluation (Appendix C) conclude that the break
that generates the largest quantity of fibrous insulation is the RCS crossover leg piping
at the steam generator (SG)3 outlet nozzle. Table D.3-8 lists the debris generated for
the RCS crossover leg break at the SG3 outlet nozzle.

AREVA NP Inc. ANP-10293 Revision 2
U.S. EPR Design Features to Address GSI-191 Technical Report Page D-78
Table D.3-8 Debris Generation for RCS Crossover Leg Break at the SG3 Outlet Nozzle
Sump Pool Volume: 57,916 ft3 (1.64x10⁶ L) Class Plant Input Ratio Coolant 12,200 lbm (Na3PO4·12H2O) 0.210 lbm/ft3
NUKON fiber generated 6.62 ft3 1.143x10⁻⁴ ft3/ft3 Microtherm generated 1 ft3 1.727x10⁻⁵ ft3/ft3
37.5 lbm (NUKON fiber) 6.475x10⁻⁴ lbm/ft3
2.725x10⁻⁴ ft3/ft3 Latent Debris 212.5 lbm (particulate sand,
clay, and pulverized concrete)
3.67x10⁻³ lbm/ft3
As discussed in the Debris Generation Evaluation, the U.S. EPR heavy floor will be
coated with epoxy having a spherical 4D zone of influence (ZOI) with a radius of 10.33
feet for a 31-inch RCS pipe diameter. This means that only the epoxy floor covering
within 4 pipe diameters of the break will be potentially damaged by the water jet. To be
conservative, it is assumed that the epoxy coating within this ZOI is completely
removed, exposing the underlying concrete. The center of the ZOI sphere at the
crossover leg connection to the SG3 nozzle is located at a building elevation of
approximately 18’- 6”. Since the heavy floor elevation is at 4’-11”, the epoxy coating is
approximately 3 feet (18’-6” – 4’–11”) outside the 4D ZOI for this location and therefore
would not be damaged. To be conservative, the crossover leg elevation of 10’-0 ½” is
used to determine the exposed concrete surface area for calculation purposes.
The exposed surface area of the heavy concrete floor within the 4D ZOI sphere
centered at the crossover leg piping elevation is calculated by first determining the
radius (RHV) of a planar circle intersecting the sphere at approximately 5 feet below its
center and then the area. Figure D.3-10 illustrates the methodology for determining the
exposed concrete surface area.

AREVA NP Inc. ANP-10293 Revision 2
U.S. EPR Design Features to Address GSI-191 Technical Report Page D-79
Figure D.3-10 Methodology for Determining the Exposed Concrete Surface Area
The radius, RHF = √(R2ZOI – h2) = √((10.332) – (52)) = 9.039 feet
The heavy floor circular area, AHF = π R2HF = π (9.039)2 = 256.7 ft2
Based on these calculations, an exposed concrete surface area of 257 ft2 is used to
determine the chemical elements released from the heavy floor following the LOCA.
The surface area of metallic aluminum in the building assumed to be submerged by
recirculating sump liquid is conservatively estimated at 3000 ft2, as modeled in the
autoclave test.
Using the relationships for chemical release established in Section D.3.3, the total
amount of debris generated as listed in Table D.3-8, an exposed concrete surface area
of 257 ft2 and 3000 ft2 of submerged aluminum metal, the chemicals released versus
time were calculated and are listed in Table D.3-9. Note that the quantity of Microtherm
was reduced by the designers following the autoclave test to 1 ft3 from the initial 40 ft3. This
reduced the amount of SiO2 released to the sump liquid.
RZOI = 10.33 ft h ≈ 5 ft
Heavy floor RHF
Crossover Leg Centerline

AREVA NP Inc. ANP-10293 Revision 2
U.S. EPR Design Features to Address GSI-191 Technical Report Page D-80
Table D.3-9 Estimated Chemical Release for the RCS Crossover Leg Break at the SG3 Outlet Nozzle
time T Na3PO4 B(OH)3 Ca Al Si Mg SiO2 Al2O3 CaO MgO Na2O B2O3
hours ºF mg/l mg/l mg/l mg/l mg/l mg/l mg/l mg/l mg/l mg/l mg/l mg/l0 120.0 0 16014 0.00E+00 0.00E+00 0.00E+00 0.00E+00 0.00E+00 0.00E+00 0.00E+00 0.00E+00 0.00E+00 0.00E+00
0.25 160.0 420 16014 4.13E+00 3.50E-01 2.20E+00 3.20E-01 1.51E+00 7.16E-04 1.61E-03 6.79E-04 3.08E-03 9.76E-040.58 170.0 974 16014 4.14E+00 4.04E-01 2.20E+00 3.20E-01 3.05E+00 2.02E-03 4.53E-03 1.92E-03 8.69E-03 2.75E-030.92 180.0 1546 16014 4.15E+00 4.59E-01 2.20E+00 3.20E-01 3.08E+00 3.78E-03 8.49E-03 3.59E-03 1.63E-02 5.16E-031.25 190.0 2100 16014 4.16E+00 5.12E-01 2.21E+00 3.20E-01 3.12E+00 5.94E-03 1.33E-02 5.64E-03 2.56E-02 8.11E-031.58 200.0 2654 16014 4.17E+00 5.65E-01 2.21E+00 3.20E-01 3.17E+00 8.60E-03 1.93E-02 8.17E-03 3.71E-02 1.17E-021.92 210.0 3226 16014 4.18E+00 6.20E-01 2.21E+00 3.20E-01 3.22E+00 1.19E-02 2.68E-02 1.13E-02 5.13E-02 1.63E-022.25 220.0 3360 16014 4.19E+00 6.73E-01 2.21E+00 3.20E-01 3.29E+00 1.57E-02 3.53E-02 1.49E-02 6.77E-02 2.15E-024.50 230.0 3360 16014 4.29E+00 1.04E+00 2.23E+00 3.20E-01 3.81E+00 4.61E-02 1.04E-01 4.38E-02 1.98E-01 6.29E-026.50 220.0 3360 16014 4.36E+00 1.36E+00 2.25E+00 3.20E-01 4.20E+00 6.91E-02 1.55E-01 6.57E-02 2.98E-01 9.44E-029.50 210.0 3360 16014 4.46E+00 1.84E+00 2.27E+00 3.20E-01 4.70E+00 9.83E-02 2.21E-01 9.35E-02 4.24E-01 1.34E-01
13.50 200.0 3360 16014 4.59E+00 2.49E+00 2.30E+00 3.20E-01 5.25E+00 1.31E-01 2.94E-01 1.24E-01 5.63E-01 1.78E-0120.00 190.0 3360 16014 4.77E+00 3.54E+00 2.33E+00 3.20E-01 5.97E+00 1.73E-01 3.89E-01 1.65E-01 7.46E-01 2.36E-0131.50 180.0 3360 16014 5.06E+00 3.56E+00 2.39E+00 3.20E-01 6.99E+00 2.33E-01 5.23E-01 2.21E-01 1.00E+00 3.18E-0137.50 170.0 3360 16014 5.19E+00 3.57E+00 2.42E+00 3.20E-01 7.39E+00 2.56E-01 5.76E-01 2.44E-01 1.10E+00 3.50E-0149.50 160.0 3360 16014 5.41E+00 3.59E+00 2.46E+00 3.20E-01 7.98E+00 2.91E-01 6.53E-01 2.76E-01 1.25E+00 3.97E-0160.00 160.0 3360 16014 5.61E+00 3.60E+00 2.50E+00 3.20E-01 8.49E+00 3.21E-01 7.21E-01 3.05E-01 1.38E+00 4.38E-0180.00 160.0 3360 16014 5.98E+00 3.63E+00 2.57E+00 3.20E-01 9.47E+00 3.78E-01 8.49E-01 3.59E-01 1.63E+00 5.16E-01
120.00 160.0 3360 16014 6.72E+00 3.68E+00 2.71E+00 3.20E-01 9.47E+00 3.78E-01 8.49E-01 3.59E-01 1.63E+00 5.16E-01240.00 160.0 3360 16014 8.96E+00 3.83E+00 3.14E+00 3.20E-01 9.47E+00 3.78E-01 8.49E-01 3.59E-01 1.63E+00 5.16E-01360.00 160.0 3360 16014 1.12E+01 3.98E+00 3.58E+00 3.20E-01 9.47E+00 3.78E-01 8.49E-01 3.59E-01 1.63E+00 5.16E-01480.00 160.0 3360 16014 1.34E+01 4.13E+00 4.01E+00 3.20E-01 9.47E+00 3.78E-01 8.49E-01 3.59E-01 1.63E+00 5.16E-01600.00 160.0 3360 16014 1.57E+01 4.28E+00 4.44E+00 3.20E-01 9.47E+00 3.78E-01 8.49E-01 3.59E-01 1.63E+00 5.16E-01720.00 160.0 3360 16014 1.79E+01 4.43E+00 4.87E+00 3.20E-01 9.47E+00 3.78E-01 8.49E-01 3.59E-01 1.63E+00 5.16E-01
Nukon™ & MicrothermConcrete & Al-1100
The parameters listed in Table D.3-9 were input to StreamAnalyzer to determine the pH
at temperature versus time and both the identity and quantity of precipitates formed.
The final results including pH(t), total elements released, and total solids formed are
tabulated in Table D.3-10. Figure D.3-11 provides a plot of total solids versus time. At
720 hours (30 days) following the break, 47.2 kg (104.2 lbm) of sodium aluminum
silicate, 77.1 kg (170.1 lbm) of calcium phosphate, and 7.8 kg (17.2 lbm) of aluminum
hydroxide precipitated from the recirculating sump liquid as the chemicals listed in Table
D.3-9 were released from the exposed concrete and generated debris. Based on the
break locations reviewed in the Debris Generation Evaluation, these precipitate masses
conservatively represent the total quantity of solids formed by chemical precipitation.

AREVA NP Inc. ANP-10293 Revision 2
U.S. EPR Design Features to Address GSI-191 Technical Report Page D-81
Table D.3-10 Total Elements Released and Solids Formed from the RCS Crossover Leg Break at the SG3 Outlet Nozzle

AREVA NP Inc. ANP-10293 Revision 2
U.S. EPR Design Features to Address GSI-191 Technical Report Page D-82
Figure D.3-11 Plot of Total Solids vs. Time for the RCS Crossover Leg Break at the SG3 Outlet Nozzle
0
5
10
15
20
25
30
35
40
45
50
0 100 200 300 400 500 600 700 800Time, hours
Prec
ipita
te, k
g
NaAlSi3O8 Ca3(PO4)2 Al(OH)3
D.3.7 Computer Output
For the chemical effects studies, the OLI StreamAnalyzer was used to create
configuration files for each single analysis or multipart analyses. These configuration
files can be used by the StreamAnalyzer software to re-analyze or to re-create a
previous analysis or analyses. In addition, OLI Analyzer Tester is a plug-in to
StreamAnalyzer that is used to verify the StreamAnalyzer functionality by creating
necessary stream and calculation in the analyzer from previously saved user input data,
and comparing the calculation results against the previously saved calculation output
data. By running a test at the beginning and at the end of a series of calculations,
Tester validates the software and generates a results folder that includes the reference
case and calculation output details.

AREVA NP Inc. ANP-10293 Revision 2
U.S. EPR Design Features to Address GSI-191 Technical Report Page D-83
D.3.8 Summary
The U.S. EPR chemical effects studies were performed for the purpose of identifying
the specific compounds and bounding quantities of materials that may precipitate within
the U.S. EPR reactor containment sump pool following a design basis accident such as
a LOCA. These studies consisted of:
• developing relationships for estimating the rate at which containment debris and
exposed concrete release constituent chemical species to the sump liquid based
on information in the public domain
• validating and/or modifying these release rates by simulating a design basis
accident in a recirculating autoclave
• using these release rates and the thermodynamic model StreamAnalyzer to
calculate the pH of the sump liquid and the identity and bounding quantity of
precipitates formed during the 30-day period following a design basis accident.
Results of the chemical effects studies are summarized as follows:
1. The estimated chemical release/dissolution rates for Microtherm, NUKON fiber,
and concrete developed from literature data were validated by the autoclave test
data. The equilibrium corrosion rates reported in the literature for aluminum
under-predicted the overall corrosion rate and were subsequently increased for
the first 20 hours of exposure to represent the development of a passive
corrosion film on the surface. The modified aluminum corrosion rates closely
predicted the aluminum coupon weight loss.
2. The chemical release/dissolution rates validated in the autoclave test were used
to calculate the pH at temperature and the total solids formed following a break in
the RCS crossover leg pipe at the SG3 outlet nozzle location. This location was
selected since it generates the largest amount of fibrous debris and bounds all of
the LOCA breaks examined.

AREVA NP Inc. ANP-10293 Revision 2
U.S. EPR Design Features to Address GSI-191 Technical Report Page D-84
3. At 720 hours (30 days) following a break at the crossover leg, 47.2 kg (104.2 lbm)
of sodium aluminum silicate, 77.1 kg (170.1 lbm) of calcium phosphate, and 7.8
kg (17.2 lbm) of aluminum hydroxide precipitated from the recirculating sump
liquid as the chemicals were released from the exposed concrete and generated
debris.
The chemical precipitates formed during a LOCA serve as input the chemical debris
amounts for ECCS Strainer Performance Testing.

AREVA NP Inc. ANP-10293 Revision 2
U.S. EPR Design Features to Address GSI-191 Technical Report Page D-85
D.3.9 References
1. V. Vain, et.al, “Corrosion Rate Measurements and Chemical Speciation of
Corrosion Products Using Thermodynamic Modeling of Debris Components to
Support GSI-191,” NUREG/CR-6873, April 2005.
2. J. McMurry and X. He, "Supplementary Leaching Tests of Insulation and
Concrete for GSI-191 Chemical Effects Program", Technical Letter Report IM
20.12130.01.001.320, CNWRA, Nov 2006.
3. C.B. Bahn, et.al, “Aluminum Solubility in Boron Containing Solutions as a
Function of pH and Temperature,” NRC Contract #J-4149, Argonne National
Laboratory, September 19, 2008.
4. Tamara, Petrova and Pavel, Nikolaev, “Behavior of aluminium corrosion products
in water-steam cycle of power plant,” ICPWS XV, Berlin, September 8-11, 2008.
5. Microtherm FreeFlow MSDS, 5/29/2009.

AREVA NP Inc. ANP-10293 Revision 2
U.S. EPR Design Features to Address GSI-191 Technical Report Page E-1
Appendix E ECCS Strainer Performance Testing for the U.S. EPR
E.1 Introduction
Appendix E documents the process and results for the U.S. EPR ECCS strainer testing,
which confirms the performance of the U.S EPR ECCS strainer following a postulated
loss of coolant accident (LOCA). Strainer testing is based on guidance specified in NEI
04-07 Volumes 1 [1] and 2 [2] and the March 2008 testing guidance [3] and input from
Appendix C Debris Generation Evaluation for the U.S. EPR and Appendix D Chemical
Effects Evaluation for the U.S. EPR .
E.1.1 Background
During a postulated LOCA inside containment, pipe and equipment insulation and
coatings can be fragmented by the jet forces emitted from the break location. Chemical
precipitant debris may be created from coolant system fluid and the buffering agent
solutions interacting with the generated debris. This mixed debris potentially transports
from the area of the break to the IRWST. The generated debris consists of fibrous
material (from latent fiber and destructed insulation such as NUKON insulation),
particulates (from destructed paint coatings, latent dirt and dust, and microtherm),
reflective metallic insulation (RMI), miscellaneous debris, and chemical precipitates. A
strainer is installed upstream of the ECCS pumps to prevent debris from entering the
pump suction. Debris that transports to the IRWST must not cause a strainer head loss
that impacts net positive suction head (NPSH) and satisfactory operation of the ECCS
pumps during a LOCA condition. The overall head loss attributable to the strainer is a
combination of the debris deposited on the strainer and the head loss associated with
the clean strainer.
Strainer performance testing was performed at the Alden Research Laboratory, Inc.
(ALDEN). Initial U.S. EPR strainer testing was performed in December 2009. The

AREVA NP Inc. ANP-10293 Revision 2
U.S. EPR Design Features to Address GSI-191 Technical Report Page E-2
December testing demonstrated debris transport characteristics of RMI and other
debris, such as coating chips. This testing also illustrated the need to re-model the
retaining basket to the prototypical height to support other additional type tests.
Following the December testing, the test apparatus was re-constructed with the
retaining basket built to full scale height. In addition, selected debris generation
amounts were adjusted.
Following re-construction of the test apparatus, subsequent U.S. EPR strainer testing
was performed during the week of February 22, 2010 with one additional test performed
on March 5, 2010. The testing was conducted with a modified test flume. The strainer
performance test plans contain the debris requirements, flume description with detailed
measurements, data recoding methods, test set-up, detailed testing steps, calibration
records, and data collected while testing. All testing was performed in accordance with
the AREVA quality assurance program.
E.2 Scope and Objective
The objective of the U.S. EPR ECCS strainer performance testing is to determine the
head loss (differential pressure) across the U.S. EPR strainer based on prototypical
water flow and debris mix conditions expected in the U.S. EPR containment following a
postulated LOCA.
The ECCS strainer test program consists of two phases.
Phase 1:
• Debris Transport Test - Test No. 1 Phase 2:
• Clean Strainer Head Loss Test - Test No. 1
• Design Basis Debris Loaded Strainer Head Loss Test - Test No. 2
• Fibrous Debris Only Sample Bypass Test - Test No. 3
• Debris Loaded Strainer Head Loss Thin Bed Test - Test No. 4

AREVA NP Inc. ANP-10293 Revision 2
U.S. EPR Design Features to Address GSI-191 Technical Report Page E-3
Initial ECCS strainer performance testing was intended to include a total five (5) ECCS
strainer performance type tests. However, testing was terminated prior to completion of
all testing. To ensure the test facility design responded prototypically for all planned
testing, the test facility configuration was subsequently modified and the debris
generation amounts adjusted. Based on review of the Phase 1 test data, the results for
the Debris Transport Test (Test No. 1) were acceptable. The remainder of the four (4)
strainer performance type tests were completed in Phase 2 following modification of the
test facility configuration. Table E.2-1 lists and describes Phase 1 Testing. Table E.2-2
lists and describes Phase 2 Testing:
Table E.2-1 U.S. EPR Strainer Performance Tests - Phase 1
Phase 1 Test Type Test Test No. Title Description
1 1 Debris Transport Test
Test determines the transportability of reflective metallic insulation (RMI), coatings (in the form of paint chips), and miscellaneous debris including other miscellaneous debris (gloves, labels, etc). (performed December, 2009)

AREVA NP Inc. ANP-10293 Revision 2
U.S. EPR Design Features to Address GSI-191 Technical Report Page E-4
Table E.2-2 U.S. EPR Strainer Performance Tests - Phase 2
Phase 2 Tests Type Test Test No. Title Description 1 1 Clean Strainer
Head Loss Test Test determines the head loss of the clean strainer for five (5) different flow rates. (performed February, 2010)
2 2 Design Basis Debris Loaded Strainer Head Loss Test
Test determines the debris bed head loss for the design basis accident for the U.S. EPR design. Debris bypass sampling was performed during this test which may be used to provide debris bypass results for downstream analysis. (performed February, 2010)
3 3 Fibrous Debris Only Sample Bypass Test
Test includes fiber only to establish the transport characteristics of fibers introduced incrementally up through the maximum design basis fiber load. This test also evaluates how a fibrous debris bed forms on the retaining basket and strainer. Debris bypass testing was performed during this test which may be used to provide debris bypass results for downstream analysis. (performed February, 2010)
3 3A Fibrous Debris Only Sample Bypass Test
This test repeated the procedures for Test 3 after a small amount of fiber was discovered in the pump casing following the termination of Test 3. Debris bypass testing was performed during this test which may be used to provide debris bypass results for downstream analysis. (performed March, 2010)
4 4 Debris Loaded Strainer Head Loss Thin Bed Test
Test determines if a higher head loss is possible with a thin bed of fibers, particulate, and chemical debris present, rather than with the design basis quantity of debris. This test includes all particulates, chemical debris, and that fiber quantity determined to form a thin bed of fibers on the surface area of the strainer and retaining basket, and is expected to

AREVA NP Inc. ANP-10293 Revision 2
U.S. EPR Design Features to Address GSI-191 Technical Report Page E-5
Phase 2 Tests Type Test Test No. Title Description
cause the highest head loss in a thin bed regime. (Performed February, 2010)
E.3 Test Apparatus
The test configuration is prototypical of the U.S. EPR design. The test loop includes a
flume, strainer, retaining basket, instrumentation & controls, and associated piping and
valves for a flow recirculation loop.
The test apparatus and configuration are based on the following conservative
assumptions:
• 100% of all the debris passes through a single heavy floor opening
• 100% of the LOCA return flow passes through a single heavy floor opening.
The test apparatus is designed to simulate plant conditions and includes two simulated
plant elevations; the containment level heavy floor and the lower IRWST level that
contains the borated water supply used for ECCS operation. The test apparatus
contains one retaining basket and one strainer which is representative of one of four
ECCS trains in the U.S. EPR design. In the plant design, fluid from a postulated LOCA
flows onto the heavy floor and then falls into the IRWST through one of four heavy floor
openings. The test apparatus simulates the free-fall flow of water from the heavy floor
by introducing the return flow at an elevation above the flume water surface. As the
water enters the test flume, it flows through the retaining basket, towards the strainer
and into the strainer sump. From the strainer sump, the water enters a recirculation
loop and is pumped back to the top of the retaining basket to simulate the flow of water
on the heavy floor through the floor opening.
The test apparatus contains two flow paths. The primary flow path circulates
approximately 91% of the water from the strainer to above the retaining basket for re-
introduction into the test flume. The secondary flow path simulates the ECCS miniflow

AREVA NP Inc. ANP-10293 Revision 2
U.S. EPR Design Features to Address GSI-191 Technical Report Page E-6
lines that circulate approximately 9% of the water from the strainer suction to the
IRWST pool. The secondary flow path bypasses the retaining basket. This flow split is
based on plant design requirements and scaled for the test facility.
E.3.1 Test Configuration and Scaling
The test apparatus conservatively represents the U.S. EPR plant conditions for
developing strainer head loss. Testing involved two different test configurations and
scaling combinations for Phase 1 and Phase 2 testing. Sections 3.8 and 3.9 describe
the scaling methodology used.
Phase 1 Test Configuration and Scaling
Figure E.3-1 and Figure E.3-2 illustrate the test configuration for Phase 1 testing. Table
E.3-1 provides the test scaling summary for Phase 1 testing.
Figure E.3-1 Test Configuration for Phase 1 Testing (Side View, - inches)

AREVA NP Inc. ANP-10293 Revision 2
U.S. EPR Design Features to Address GSI-191 Technical Report Page E-7
Figure E.3-2 Test Configuration for Phase 1 Testing (Top View, - inches)

AREVA NP Inc. ANP-10293 Revision 2
U.S. EPR Design Features to Address GSI-191 Technical Report Page E-8
Table E.3-1 Scaling Summary for Phase 1 Testing
Description Value Unit Flume / Strainer Width 5.0 ft Water depth in flume 9.25 ft Strainer length in flume 6.6 ft Overhang length in flume 2.6 ft Strainer height 7.1 ft Strainer screened slant height 7.5 ft Test strainer area 70.6 ft2 Total active strainer area 753.5 ft2 Scale factor1 9.37 % Total active strainer flow rate 3,284.0 gpm Heavy floor flow rate 2,997.0 gpm Total test flume flow rate 307.8 gpm Min wetted retaining basket surface area 306.4 ft2 Flume screened retaining basket area 28.7 ft2 Flume retaining basket width 3.1 ft Retaining basket volume in plant 1,609.0 ft3 Retaining basket volume in flume 150.8 ft3 Basket depth 5.25 ft Test flume volume 4,230 gal Test flume piping 236.4 gal Total flume volume 4,467 gal Flume Turnover Time 15 min Mini-flow 26.9 gpm
Note 1: A scaling factor is applied to total flow rate, heavy flow flow rate, mini-flow
flow rate, strainer surface area, and retaining basket surface area/volume.

AREVA NP Inc. ANP-10293 Revision 2
U.S. EPR Design Features to Address GSI-191 Technical Report Page E-9
Phase 2 Test Configuration and Scaling
The Phase 2 test flume is different from the Phase 1 test flume. For Phase 2 testing the
retaining basket scaling was modified to be more consistent with the plant design. The
retaining basket height is increased. The bottom of the retaining basket is supported off
the flume floor by foot pedestals and contains a perforated screen filtering area. In
addition, the water management system is enhanced to prototypically control flume
water levels consistent with design basis conditions.
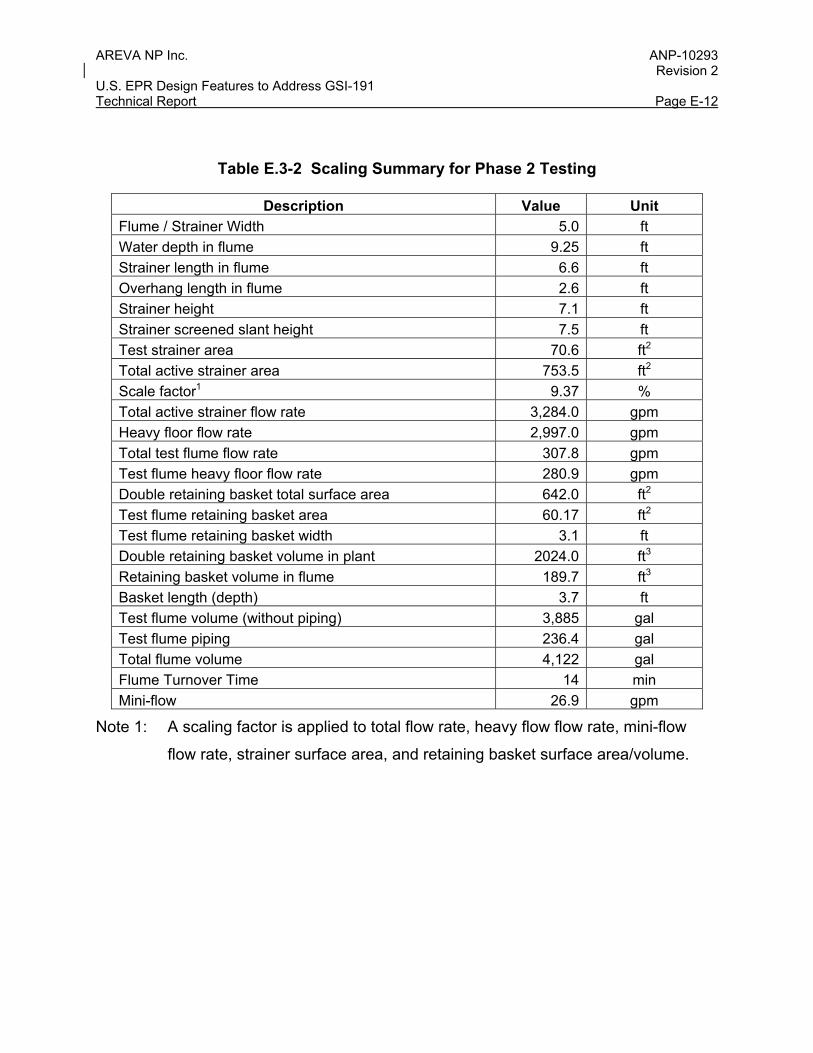
Figure E.3-3 and Figure E.3-4 illustrate the test configuration for Phase 2 testing. Table
E.3-2 provides the test scaling summary for Phase 2 testing. Figure E.3-5 and Figure
E.3-6 depict the strainer, retaining basket, and components within the Phase 2 test
flume.

AREVA NP Inc. ANP-10293 Revision 2
U.S. EPR Design Features to Address GSI-191 Technical Report Page E-10
Figure E.3-3 Test Configuration for Phase 2 Testing

AREVA NP Inc. ANP-10293 Revision 2
U.S. EPR Design Features to Address GSI-191 Technical Report Page E-11
Figure E.3-4 Test Configuration for Phase 2 Testing (Recirculation Loop and Make-up Water Tank)
AREVA NP Inc. ANP-10293 Revision 2
U.S. EPR Design Features to Address GSI-191 Technical Report Page E-12
Table E.3-2 Scaling Summary for Phase 2 Testing
Description Value Unit Flume / Strainer Width 5.0 ft Water depth in flume 9.25 ft Strainer length in flume 6.6 ft Overhang length in flume 2.6 ft Strainer height 7.1 ft Strainer screened slant height 7.5 ft Test strainer area 70.6 ft2 Total active strainer area 753.5 ft2 Scale factor1 9.37 % Total active strainer flow rate 3,284.0 gpm Heavy floor flow rate 2,997.0 gpm Total test flume flow rate 307.8 gpm Test flume heavy floor flow rate 280.9 gpm Double retaining basket total surface area 642.0 ft2 Test flume retaining basket area 60.17 ft2 Test flume retaining basket width 3.1 ft Double retaining basket volume in plant 2024.0 ft3 Retaining basket volume in flume 189.7 ft3 Basket length (depth) 3.7 ft Test flume volume (without piping) 3,885 gal Test flume piping 236.4 gal Total flume volume 4,122 gal Flume Turnover Time 14 min Mini-flow 26.9 gpm
Note 1: A scaling factor is applied to total flow rate, heavy flow flow rate, mini-flow
flow rate, strainer surface area, and retaining basket surface area/volume.