answering macro questions using micro data: advances and
TRANSCRIPT

Answering Macro Questions Using Micro Data:Advances and Challenges
Maximilian Eber and Xavier Jaravel
March 26, 2014
Maximilian Eber and Xavier Jaravel Answering Macro Questions Using Micro Data: Advances and ChallengesMarch 26, 2014 1 / 92

1 Introduction
2 Methodology
3 Data Sources
4 Examples from Different Areas
5 Jimenez et al. (2014)
6 Mian and Sufi (2011)
7 Gourinchas and Parker (2002)
8 Future Research
Maximilian Eber and Xavier Jaravel Answering Macro Questions Using Micro Data: Advances and ChallengesMarch 26, 2014 2 / 92

Section 1
Introduction
Maximilian Eber and Xavier Jaravel Answering Macro Questions Using Micro Data: Advances and ChallengesMarch 26, 2014 3 / 92

Introduction
From Chetty (2012)
Maximilian Eber and Xavier Jaravel Answering Macro Questions Using Micro Data: Advances and ChallengesMarch 26, 2014 4 / 92

Introduction
From Klenow (2008):
I found Banerjee’s paper a pleasure to read, both provocative and compelling. As
Banerjee concedes, the most important questions in development are often “macro” ones
such as how to boost growth in the fashion of China and India in recent decades. But,
Banerjee emphasizes, we don’t know very much about how to do this despite lots of
research effort. So he suggests we largely abandon macro development research and
concentrate on micro development questions such as the effect of randomized
interventions in health and education. The following Table summarizes Banerjee’s
position.
Welfare Welfare Knowledge = Research Knowledge Research
Micro 0 Low High
Macro 0? High Low
w w wx
w w w
!
|
I wholeheartedly agree with the “micro” row in this Table, so will say no more
about it. Instead I will defend the value of doing macro development research. As I
consider myself at the micro data end of the macro spectrum, I do this without feeling
particularly defensive.
I begin by drawing an analogy to potential micro vs. macro divides in medicine
and biology. Consider “micro” researchers in medicine who do carefully controlled
clinical trials and lab work. I imagine they might disdain “macro” medicine, which looks
at trends in life expectancy, heart disease, cancer, autism, etc. Their skepticism may
Maximilian Eber and Xavier Jaravel Answering Macro Questions Using Micro Data: Advances and ChallengesMarch 26, 2014 5 / 92

Macro Questions Meet Micro Data
Which papers qualify?I Must contribute to our understanding of key economy-wide variablesI Papers vary along various dimensions
F General vs. Partial EquilibriumF Quasi-experimental variation (e.g. IV) vs. Model-based identification
(e.g. structural work)F High-quality micro data (e.g. universe of firms) vs. Disaggregated data
(e.g. large sample of firms)
Maximilian Eber and Xavier Jaravel Answering Macro Questions Using Micro Data: Advances and ChallengesMarch 26, 2014 6 / 92

Plan for today
1 Introduction
2 Methodology
3 Data Sources
4 Examples from Different Areas
5 Jimenez et al. (2014)
6 Mian and Sufi (2011)
7 Gourinchas and Parker (2002)
8 Future Research
Maximilian Eber and Xavier Jaravel Answering Macro Questions Using Micro Data: Advances and ChallengesMarch 26, 2014 7 / 92
1 Introduction
2 Methodology
3 Data Sources
4 Examples from Different Areas
5 Jimenez et al. (2014)
6 Mian and Sufi (2011)
7 Gourinchas and Parker (2002)
8 Future Research
Maximilian Eber and Xavier Jaravel Answering Macro Questions Using Micro Data: Advances and ChallengesMarch 26, 2014 8 / 92

Section 2
Methodology
Maximilian Eber and Xavier Jaravel Answering Macro Questions Using Micro Data: Advances and ChallengesMarch 26, 2014 9 / 92

Quasi-Experimental Research Designs
Key: finding exogenous variationStrengths
I Transparent and credible identification
WeaknessesI Does not identify policy-invariant parameters and has limited relevance
for policy and welfare analysis
Mian and Sufi (2011) & Jimenez et al. (2014)
Maximilian Eber and Xavier Jaravel Answering Macro Questions Using Micro Data: Advances and ChallengesMarch 26, 2014 10 / 92

Structural Approach
Key: having a good modelStrengths
I Ability to make predictions about counterfactual outcomes and welfareI Addresses GE effects
WeaknessesI Difficult to credibly identify all primitive parameters (because of
selection effects, simultaneity bias and omitted variables)I Model uncertainty (robustness to small changes in assumptions)
Parker and Gourinchas (2002)
Maximilian Eber and Xavier Jaravel Answering Macro Questions Using Micro Data: Advances and ChallengesMarch 26, 2014 11 / 92

Sufficient Statistic Approach
StrengthsI Formulas for the welfare consequences of various policies are derived as
functions of reduced-form elasticities rather than structural primitivesI Less data and variation are needed than to fully identify a structural
model
WeaknessesI A new sufficient statistic formula must be derived for each questionI More easily misapplied than structural method
Chetty (2009), Shimer and Werning (2008).
Maximilian Eber and Xavier Jaravel Answering Macro Questions Using Micro Data: Advances and ChallengesMarch 26, 2014 12 / 92

Example: the Deadweight Loss of TaxationWorkers solve
maxl u(c, l) = c−ψ(l) s.t. c = y + (1− t)wl
Welfare
W (t) = {y + (1− t)wl−ψ(l)}+ twl
Therefore,
dW (t)
dt =dudt +
d [twl ]dt
=∂ u∂ t + wl + t dwl
dt
= 0 + t dwldt
= t dTIdt
Maximilian Eber and Xavier Jaravel Answering Macro Questions Using Micro Data: Advances and ChallengesMarch 26, 2014 13 / 92

Challenges compared to “Micro”
General EquilibriumI Prices change, technology responds, etc...I What is the control group?
AggregationI It is sometimes hard to map macro model (lacking heterogeneity) to
micro data (e.g. CCAPM)
Maximilian Eber and Xavier Jaravel Answering Macro Questions Using Micro Data: Advances and ChallengesMarch 26, 2014 14 / 92

Example: Dealing with GE
Adjustment Costs, Firm Responses, and Micro vs. Macro LaborSupply Elasticities: Evidence from Danish Tax Records (Raj Chetty,John Friedman, Tore Olsen, and Luigi Pistaferri), Quarterly Journal ofEconomics 126(2): 749-804, 2011
Maximilian Eber and Xavier Jaravel Answering Macro Questions Using Micro Data: Advances and ChallengesMarch 26, 2014 15 / 92

Maximilian Eber and Xavier Jaravel Answering Macro Questions Using Micro Data: Advances and ChallengesMarch 26, 2014 16 / 92

1 Introduction
2 Methodology
3 Data Sources
4 Examples from Different Areas
5 Jimenez et al. (2014)
6 Mian and Sufi (2011)
7 Gourinchas and Parker (2002)
8 Future Research
Maximilian Eber and Xavier Jaravel Answering Macro Questions Using Micro Data: Advances and ChallengesMarch 26, 2014 17 / 92

Section 3
Data Sources
Maximilian Eber and Xavier Jaravel Answering Macro Questions Using Micro Data: Advances and ChallengesMarch 26, 2014 18 / 92

Compustat
Very popularFazzari, S., Hubbard, R., & Petersen, B. (1988). FinancingConstraints and Corporate Investment. Brookings Papers onEconomic Activity.Graham, J. R. (2000). How Big Are the Tax Benefits of Debt?Journal of Finance, 55(5), 1901–1941.
Maximilian Eber and Xavier Jaravel Answering Macro Questions Using Micro Data: Advances and ChallengesMarch 26, 2014 19 / 92

Surveys
Murillo Campello & Erasmo Giambona & John R. Graham &Campbell R. Harvey, 2011. ”Liquidity Management and CorporateInvestment During a Financial Crisis,” Review of Financial Studies,Society for Financial Studies, vol. 24(6), pages 1944-1979.
Maximilian Eber and Xavier Jaravel Answering Macro Questions Using Micro Data: Advances and ChallengesMarch 26, 2014 20 / 92

Census Data
Parker, J. A., Souleles, N. S., Johnson, D. S., & McClelland, R.(2013). Consumer Spending and the Economic Stimulus Payments of2008. American Economic Review, 103(6), 2530–2553.
Maximilian Eber and Xavier Jaravel Answering Macro Questions Using Micro Data: Advances and ChallengesMarch 26, 2014 21 / 92

Tax Records: Scandinavia
Laurent E. Calvet & John Y. Campbell & Paolo Sodini, 2009.”Measuring the Financial Sophistication of Households,” AmericanEconomic Review, American Economic Association, vol. 99(2), pages393-98, May.Laurent E. Calvet & John Y. Campbell & Paolo Sodini, 2007. ”Downor Out: Assessing the Welfare Costs of Household InvestmentMistakes,” Journal of Political Economy, University of Chicago Press,vol. 115(5), pages 707-747, OctoberLaurent E. Calvet & John Y. Campbell & Paolo Sodini, 2009. ”FightOr Flight? Portfolio Rebalancing by Individual Investors,” TheQuarterly Journal of Economics, MIT Press, vol. 124(1), pages301-348, February.
Maximilian Eber and Xavier Jaravel Answering Macro Questions Using Micro Data: Advances and ChallengesMarch 26, 2014 22 / 92

Financial Regulation 1: Credit Registers
Gabriel Jimenez & Steven Ongena & Jose-Luis Peydro & JesusSaurina (2012). ”Credit Supply and Monetary Policy: Identifying theBank Balance-Sheet Channel with Loan Applications,” AmericanEconomic Review, pages 2301-26
Maximilian Eber and Xavier Jaravel Answering Macro Questions Using Micro Data: Advances and ChallengesMarch 26, 2014 23 / 92

Financial Regulation 2: Syndicated Loan Market
Chodorow-Reich, Gabriel (2014). The Employment Effects of CreditMarket Disruptions: Firm-level Evidence from the 2008-09 FinancialCrisis. Quarterly Journal of Economics129, no. 1: 1-59.
Maximilian Eber and Xavier Jaravel Answering Macro Questions Using Micro Data: Advances and ChallengesMarch 26, 2014 24 / 92
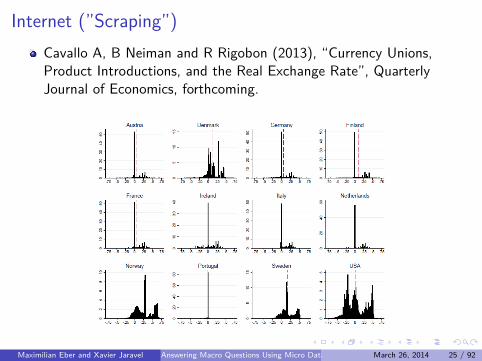
Internet (”Scraping”)Cavallo A, B Neiman and R Rigobon (2013), “Currency Unions,Product Introductions, and the Real Exchange Rate”, QuarterlyJournal of Economics, forthcoming.
Maximilian Eber and Xavier Jaravel Answering Macro Questions Using Micro Data: Advances and ChallengesMarch 26, 2014 25 / 92

Patent Applications from USPTO
Identifying Technology Spillovers and Product Market Rivalry,Nicholas Bloom, Mark Schankerman and John Van Reenen,Econometrica (2013)Aghion, Philippe, Nick Bloom, Richard Blundell, Rachel Griffith andPeter Howitt (2005). ”Competition And Innovation: An Inverted-URelationship,” Quarterly Journal of Economics, 701-728.More on this with John Van Reenen on April 9th
Maximilian Eber and Xavier Jaravel Answering Macro Questions Using Micro Data: Advances and ChallengesMarch 26, 2014 26 / 92
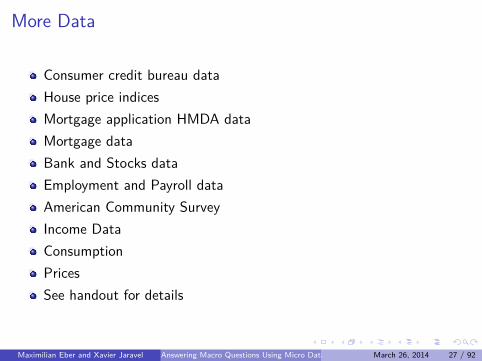
More Data
Consumer credit bureau dataHouse price indicesMortgage application HMDA dataMortgage dataBank and Stocks dataEmployment and Payroll dataAmerican Community SurveyIncome DataConsumptionPricesSee handout for details
Maximilian Eber and Xavier Jaravel Answering Macro Questions Using Micro Data: Advances and ChallengesMarch 26, 2014 27 / 92

Better Data
Still a lot to wish for...Universe of transactionsFirm Side:
I High-frequency data on firm balance sheets, prices andcustomer-supplier networks
I Trace business-cycle shocks through the economy
Consumers:I High-frequency consumption, income and asset data
Maximilian Eber and Xavier Jaravel Answering Macro Questions Using Micro Data: Advances and ChallengesMarch 26, 2014 28 / 92

1 Introduction
2 Methodology
3 Data Sources
4 Examples from Different Areas
5 Jimenez et al. (2014)
6 Mian and Sufi (2011)
7 Gourinchas and Parker (2002)
8 Future Research
Maximilian Eber and Xavier Jaravel Answering Macro Questions Using Micro Data: Advances and ChallengesMarch 26, 2014 29 / 92

Section 4
Examples from Different Areas
Maximilian Eber and Xavier Jaravel Answering Macro Questions Using Micro Data: Advances and ChallengesMarch 26, 2014 30 / 92

Growth and Productivity
Chang-Tai Hsieh & Peter J. Klenow, 2009. ”Misallocation andManufacturing TFP in China and India,” The Quarterly Journal ofEconomics, MIT Press, vol. 124(4), pages 1403-1448.Nicholas Bloom & Benn Eifert & Aprajit Mahajan & David McKenzie& John Roberts, 2013. ”Does Management Matter? Evidence fromIndia,” The Quarterly Journal of Economics, Oxford University Press,vol. 128(1), pages 1-51.
Maximilian Eber and Xavier Jaravel Answering Macro Questions Using Micro Data: Advances and ChallengesMarch 26, 2014 31 / 92

Local Multipliers
State levelI Clemens and Miran (2010), Cohen et al. (2010), Serrato and
Wingender (2010), Shoag (2010), Acconcia et al. (2011),Chodorow-Reich et al. (2011), Fishback and Kachanovskaya (2010),Nakamura and Steinsson (2013).
Firm levelI Mendel (2013)
Maximilian Eber and Xavier Jaravel Answering Macro Questions Using Micro Data: Advances and ChallengesMarch 26, 2014 32 / 92

Banking
Rajkamal Iyer, Samuel Lopes, Jose-Luis Peydro and AntoinetteSchoar (2014). ”The Interbank Liquidity Crunch and the Firm CreditCrunch: Evidence from the 2007-09 Crisis”, forthcoming in Review ofFinancial Studies
Maximilian Eber and Xavier Jaravel Answering Macro Questions Using Micro Data: Advances and ChallengesMarch 26, 2014 33 / 92

Risk-Channel of Monetary Policy
Gabriel Jimenez & Steven Ongena & Jose Luis Peydro & JesusSaurina (2014). ”Hazardous Times for Monetary Policy: What do 23Million Loans Say About the Impact of Monetary Policy on CreditRisk-Taking?”, forthcoming in Econometrica.
Maximilian Eber and Xavier Jaravel Answering Macro Questions Using Micro Data: Advances and ChallengesMarch 26, 2014 34 / 92

Real Effects of Financial Frictions
Chodorow-Reich, Gabriel. 2014. The Employment Effects of CreditMarket Disruptions: Firm-level Evidence from the 2008-09 FinancialCrisis. Quarterly Journal of Economics129, no. 1: 1-59.Rauh, Joshua D, ”Investment and Financing Constraints: Evidencefrom the Funding of Corporate Pension Plans”, Journal of Finance 61,1 (2006), pp. 33–71.
Maximilian Eber and Xavier Jaravel Answering Macro Questions Using Micro Data: Advances and ChallengesMarch 26, 2014 35 / 92

Inflation
Peter J. Klenow & Oleksiy Kryvtsov, 2008. ”State-Dependent orTime-Dependent Pricing: Does It Matter for Recent U.S. Inflation?,”The Quarterly Journal of Economics, MIT Press, vol. 123(3), pages863-904, August.Klenow, Peter J. & Malin, Benjamin A., 2010. ”MicroeconomicEvidence on Price-Setting,” Handbook of Monetary Economics, in:Benjamin M. Friedman & Michael Woodford (ed.), Handbook ofMonetary Economics, edition 1, volume 3, chapter 6, pages 231-284Elsevier.Mark Bils & Peter J. Klenow & Benjamin A. Malin, 2012. ”ResetPrice Inflation and the Impact of Monetary Policy Shocks,” AmericanEconomic Review, American Economic Association, vol. 102(6),pages 2798-2825, October.
Maximilian Eber and Xavier Jaravel Answering Macro Questions Using Micro Data: Advances and ChallengesMarch 26, 2014 36 / 92

International Macro
Gopinath, Gita, Oleg Itskhoki, and Roberto Rigobon. “CurrencyChoice and Exchange Rate Pass-through.” American EconomicReview 100(1) (2010): 304–36.
Maximilian Eber and Xavier Jaravel Answering Macro Questions Using Micro Data: Advances and ChallengesMarch 26, 2014 37 / 92

Housing Market
Mian and Sufi’s research agenda:I The Consequences of Mortgage Credit Expansion: Evidence from the
U.S. Mortgage Default Crisis (QJE 2009)I House Prices, Home Equity-Based Borrowing, and the U.S. Household
Leverage Crisis (AER 2011)I Household Balance Sheets, Consumption, and the Economic Slump
(QJE 2013)
Nathanson, Charles G, and Eric Zwick. Working Paper. ArrestedDevelopment: Theory and Evidence of Supply-Side Speculation.
Maximilian Eber and Xavier Jaravel Answering Macro Questions Using Micro Data: Advances and ChallengesMarch 26, 2014 38 / 92

Expectations and Learning
Ulrike Malmendier & Stefan Nagel (2011). ”Depression Babies: DoMacroeconomic Experiences Affect Risk Taking?,” The QuarterlyJournal of Economics, Oxford University Press, vol. 126(1), pages373-416.Ulrike Malmendier, S. Nagel (2014), “Learning from InflationExperiences”, Quarterly Journal of Economics, Forthcoming
Maximilian Eber and Xavier Jaravel Answering Macro Questions Using Micro Data: Advances and ChallengesMarch 26, 2014 39 / 92
Business Cycles
Xavier Gabaix: ”The Granular Origins of Aggregate Fluctuations,”Econometrica, 2011 vol. 79, p.733-772
Maximilian Eber and Xavier Jaravel Answering Macro Questions Using Micro Data: Advances and ChallengesMarch 26, 2014 40 / 92

1 Introduction
2 Methodology
3 Data Sources
4 Examples from Different Areas
5 Jimenez et al. (2014)
6 Mian and Sufi (2011)
7 Gourinchas and Parker (2002)
8 Future Research
Maximilian Eber and Xavier Jaravel Answering Macro Questions Using Micro Data: Advances and ChallengesMarch 26, 2014 41 / 92

Section 5
Jimenez et al. (2014)
Maximilian Eber and Xavier Jaravel Answering Macro Questions Using Micro Data: Advances and ChallengesMarch 26, 2014 42 / 92
Risk-Channel of Monetary Policy
Gabriel Jimenez, Steven Ongena, Jose Luis Peydro, and Jesus Saurina(2009): ”Hazardous times for monetary policy: What do twenty-threemillion bank loans say about the effects of monetary policy on creditrisk-taking?”, forthcoming in Econometrica.
Maximilian Eber and Xavier Jaravel Answering Macro Questions Using Micro Data: Advances and ChallengesMarch 26, 2014 43 / 92
TheoryAgency Conflicts and Risk-Taking
Story they want to tell:I Central bank lowers rates...I ... and banks with agency conflicts...I ... take on excessive risk.
Story they actually tell:I Central bank lowers rates...I ... and banks with low capital ratios...I ... lend more to risky borrowers.
Maximilian Eber and Xavier Jaravel Answering Macro Questions Using Micro Data: Advances and ChallengesMarch 26, 2014 44 / 92

Data
Spanish credit registerI all loan applications and all loans granted in Spain (above 6,000 Euros)I 1984 to 2009, includes pre-Euro and post-Euro phase and run-up and
impact of Great Recession
“Fairly exogenous” interest rateI 97% variation of Spanish rate explained by German rateI GDP correlation only 36%.I Spanish GDP only 15% of Eurozone.
Maximilian Eber and Xavier Jaravel Answering Macro Questions Using Micro Data: Advances and ChallengesMarch 26, 2014 45 / 92

Main SpecificationDo banks originate more loans to risky borrowers when rates decrease?
Specification:
∆ln (LOANbit) =α + β ∆IRt−1 + γ ∆IRt−1× ln (CAPITALb,t−1)
+ δ ∆IRt−1× ln (CAPITALb,t−1)× I(DOUBTFULi ,t)
+ CONTROLSb,i ,t + εb,i ,t
δ > 0: More lending to risky borrowers by weakly capitalized banks
∆IR ↓,CAPITAL ↓,δ > 0⇒∆(LOANb,i ,t) ↑
Maximilian Eber and Xavier Jaravel Answering Macro Questions Using Micro Data: Advances and ChallengesMarch 26, 2014 46 / 92

Economic Significance
Weakly capitalized banks (Q25, 4.26%) grant 25% more credit torisky borrowers, relative to strongly capitalized banks (Q75, 7.2%),when the interest rate declines by a standard deviation (1.6pp).
Maximilian Eber and Xavier Jaravel Answering Macro Questions Using Micro Data: Advances and ChallengesMarch 26, 2014 47 / 92
Discussion and Extensions
AdvantagesI Nice datasetI Robust empirics
Disadvantages:I Channels?I Welfare?I Policy implications?
Maximilian Eber and Xavier Jaravel Answering Macro Questions Using Micro Data: Advances and ChallengesMarch 26, 2014 48 / 92

1 Introduction
2 Methodology
3 Data Sources
4 Examples from Different Areas
5 Jimenez et al. (2014)
6 Mian and Sufi (2011)
7 Gourinchas and Parker (2002)
8 Future Research
Maximilian Eber and Xavier Jaravel Answering Macro Questions Using Micro Data: Advances and ChallengesMarch 26, 2014 49 / 92

Section 6
Mian and Sufi (2011)
Maximilian Eber and Xavier Jaravel Answering Macro Questions Using Micro Data: Advances and ChallengesMarch 26, 2014 50 / 92

House Prices, Home Equity–Based Borrowing, and the USHousehold Leverage Crisis
What is the causal effect of house price growth on homeownerborrowing?
I US household leverage sharply increased between 2002 and 2007I Wider availability of mortgage credit for riskier home buyers, driving up
house prices (Mian and Sufi (2009))I Feedback: how did homeowner borrowing respond to the increase in
house prices?
Maximilian Eber and Xavier Jaravel Answering Macro Questions Using Micro Data: Advances and ChallengesMarch 26, 2014 51 / 92

The Home-Equity Based Borrowing Channel
Theory:I unconstrained long-lived homeowners perfectly hedged against house
price fluctuations: propensity to borrow out of housing is zero.I short-lived homeowners: borrow against unexpected increases in home
equity to finance consumption, with the propensity to borrow beingstronger for older homeowners.
I credit-constrained homeowners.I homeowners with limited self-control.
Maximilian Eber and Xavier Jaravel Answering Macro Questions Using Micro Data: Advances and ChallengesMarch 26, 2014 52 / 92
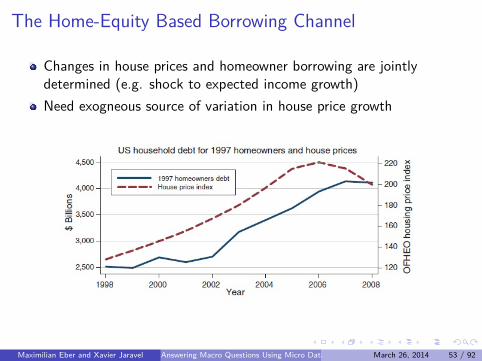
The Home-Equity Based Borrowing Channel
Changes in house prices and homeowner borrowing are jointlydetermined (e.g. shock to expected income growth)Need exogneous source of variation in house price growth
Maximilian Eber and Xavier Jaravel Answering Macro Questions Using Micro Data: Advances and ChallengesMarch 26, 2014 53 / 92

Preview of IV Strategy and Results
Across-MSA instrument: housing supply elasticity at the MSA levelfrom Saiz (QJE 2010).
I Estimate: borrowing of 25 cents for every dollar gain in home equityfrom 2002 to 2006.
Within-MSA instrument: fraction of subprime borrowers in a zip codeinteracted with MSA elasticityHeterogeneity across households:
I high vs. low credit card utilization rates; high vs. low initial creditscores
I young vs. old
Maximilian Eber and Xavier Jaravel Answering Macro Questions Using Micro Data: Advances and ChallengesMarch 26, 2014 54 / 92

Data
Credit report information from EquifaxI 74,149 homeowners in 2,307 zip codes located in 68 MSA
This “individual” data is augmented with several additional datasetsat the zip-code level: income, house prices, credit scores, ...
Maximilian Eber and Xavier Jaravel Answering Macro Questions Using Micro Data: Advances and ChallengesMarch 26, 2014 55 / 92

Across-MSA Empirical StrategyIntuition: for an equivalent housing demand shock, the slope of thehousing supply curve determines the degree to which housing pricesrise in an area (Glaeser, Gyourko, and Saiz (2008)).
Maximilian Eber and Xavier Jaravel Answering Macro Questions Using Micro Data: Advances and ChallengesMarch 26, 2014 56 / 92

Across-MSA TSLS
LeverageGrowth0206izm = θXizm + β HousePriceGrowth0206zm + vizm
HousePriceGrowth0206zm = δ Xizm + ρElasticitym,1997 + εizm
Individual i lives in zipcode z within MSA mSource of variation is ultimately at the MSA level.Second-stage estimates suggest that 1997 homeowners borrow 25cents on every dollar of additional home equity.
Maximilian Eber and Xavier Jaravel Answering Macro Questions Using Micro Data: Advances and ChallengesMarch 26, 2014 57 / 92

Across-MSA TSLS
Maximilian Eber and Xavier Jaravel Answering Macro Questions Using Micro Data: Advances and ChallengesMarch 26, 2014 58 / 92

Cross-Sectional Heterogeneity
Also serves as a Placebo test for home-equity based borrowingchannel.
Maximilian Eber and Xavier Jaravel Answering Macro Questions Using Micro Data: Advances and ChallengesMarch 26, 2014 59 / 92

Exclusion Restriction
Maximilian Eber and Xavier Jaravel Answering Macro Questions Using Micro Data: Advances and ChallengesMarch 26, 2014 60 / 92

Further Robustness Checks
Within-MSA estimation technique exploiting variation at the zip codelevel.Builds on Mian and Sufi (2009)
I from 2002 to 2005 house price appreciation in subprime zip codes wassignificantly stronger than in prime zip codes in the same MSA.
I this holds only in MSAs with inelastic supply of housingI driven by an expansion in the supply of credit to subprime zip codes
everywhere.
Maximilian Eber and Xavier Jaravel Answering Macro Questions Using Micro Data: Advances and ChallengesMarch 26, 2014 61 / 92

Macroeconomic Impact
What do people do with the borrowed money?I Not used for real estate or financial assetsI Not use to pay down credit card debt
Home Equity-Based Borrowing and DefaultsI From 2006 to 2008, homeowners in inelastic MSAs experience a sharp
increase in default ratesI Effect comes from low-credit-quality borrowers
Maximilian Eber and Xavier Jaravel Answering Macro Questions Using Micro Data: Advances and ChallengesMarch 26, 2014 62 / 92
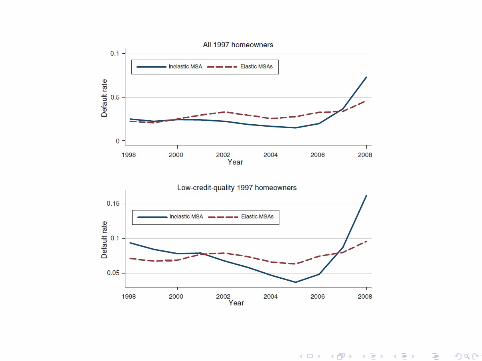

Macroeconomic Impact
Claim 1: from 2002 to 2006, house price appreciation causedaggregate borrowing to increase by $1.25 trillion dollars, which is 53%of the overall increase in debt of homeowners during this period.Claim 2: defaults due to the home equity-based borrowing channelrepresent 39% of total new defaults in the US economy after 2006.LATE vs. GE effects?
Maximilian Eber and Xavier Jaravel Answering Macro Questions Using Micro Data: Advances and ChallengesMarch 26, 2014 64 / 92

Discussion and Extensions
Nice datasetSimple instruments, exposition and Placebo testsAggregation procedure and macroeconomic implications unclear
I Bernanke-Gertler (1989), Kiyotaki-Moore (1997)I Eggertsson-Krugman (2012)
Maximilian Eber and Xavier Jaravel Answering Macro Questions Using Micro Data: Advances and ChallengesMarch 26, 2014 65 / 92

1 Introduction
2 Methodology
3 Data Sources
4 Examples from Different Areas
5 Jimenez et al. (2014)
6 Mian and Sufi (2011)
7 Gourinchas and Parker (2002)
8 Future Research
Maximilian Eber and Xavier Jaravel Answering Macro Questions Using Micro Data: Advances and ChallengesMarch 26, 2014 66 / 92

Section 7
Gourinchas and Parker (2002)
Maximilian Eber and Xavier Jaravel Answering Macro Questions Using Micro Data: Advances and ChallengesMarch 26, 2014 67 / 92
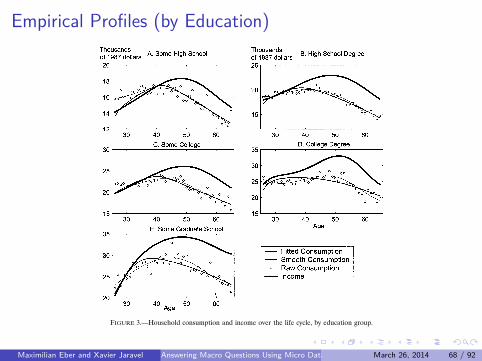
Empirical Profiles (by Education)
68 p.-o. gourinchas and j. a. parker
Figures 3 and 4 give some evidence that consumption and income track eachother across subgroups of the population defined by education and occupationgroups. These graphs are somewhat noisy. However, despite the noise, one cansee that the occupation and education groups with the most pronounced humpsin income present the most pronounced humps in consumption. Further, we canformally reject the null hypothesis that the consumption profiles are flat. This isessentially a now standard test of the linearized consumption Euler equation, asstudied by Attanasio and Weber (1995), Lusardi (1996).Our profiles differ slightly from the results of Attanasio and Browning (1995)
and Attanasio and Weber (1995). These papers employ a larger set of preferenceshifters: once controlling for these, consumption is smoother and the CEQ-LCHis not rejected. In Attanasio and Weber (1995) and in the linear Euler-equationapproach generally used in micro data, precautionary effects are omitted so thatpreference shifters absorb, correctly or incorrectly, variation in consumption thatwe attribute to uncertainty. Clearly, allowing for enough preference variation can
Figure 3.—Household consumption and income over the life cycle, by education group.
Maximilian Eber and Xavier Jaravel Answering Macro Questions Using Micro Data: Advances and ChallengesMarch 26, 2014 68 / 92

Empirical Profiles (by Profession)consumption over the life cycle 69
Figure 4.—Household consumption and income over the life cycle, by occupation group.
explain the life-cycle correlation without reference to substantial household-leveluncertainty. The approach of this paper is to adjust only for the size of the house-hold and examine how precautionary saving explains the observed consumptionbehavior. Our methodology has the potential to nest and test both explanations.It is also worth noting that our profiles represent total consumption expendituresrather than nondurable consumption.
6! results
We first estimate our model for the average household and discuss the impli-cations of the fitted structural model for household behavior. We then turn todisaggregated results, by education and occupation groups, and to evaluating therobustness of our findings.
6!1! Findings from the Entire Sample
As a useful benchmark, we begin by asking what the standard Life-Cycle theorywould predict, assuming away all uncertainty. To give the best chance to theCEQ-LCH, we perform first difference estimation, not asking it to fit the meanof the consumption profile. Under certainty, equation (2) holds, implying, after
Maximilian Eber and Xavier Jaravel Answering Macro Questions Using Micro Data: Advances and ChallengesMarch 26, 2014 69 / 92

Data
Consumer Expenditure Survey (CEX)I 40,000 households, 1980-1993I construct consumption and income patterns over the life-cycleI average income and consumption by age
Panel Study of Income Dynamics (PSID)I income by household and ageI used to estimate income process
Maximilian Eber and Xavier Jaravel Answering Macro Questions Using Micro Data: Advances and ChallengesMarch 26, 2014 70 / 92

Structural Approach
1 Write down a model of consumption over the life cycle2 Use the data to generate a path of state variables.3 Simulate the model over this path4 Compare the resulting “artificial” consumption profile to the data.5 Choose model parameters to maximize the fit
Maximilian Eber and Xavier Jaravel Answering Macro Questions Using Micro Data: Advances and ChallengesMarch 26, 2014 71 / 92

Model Setup (Simplified)
Objective function: consumption and bequests.Maximize
E0
[N
∑t=1
βtu (Ct) + β
N+1VN+1 (WN+1)
]subject to the law of motion for wealth and (self-imposed) borrowingconstraint.Parameterize u(.) and V (.) as CES and estimate those parameters.
Maximilian Eber and Xavier Jaravel Answering Macro Questions Using Micro Data: Advances and ChallengesMarch 26, 2014 72 / 92

Consumption Rule56 p.-o. gourinchas and j. a. parker
Figure 1.—A tale of two households.
age 66 characterized by !0 = 0"001#!1 = 0"071. These parameter values are thoseof our baseline estimates.15 If G and Z are constant, the finite horizon problemwould converge to the infinite horizon one, as we move further away from retire-ment. Consumption is always positive, increasing, and concave in cash on hand.Early in life, households exhibit ‘buffer stock’ behavior: for low levels of cashon hand, typically less than the permanent component of their income $x ≤ 1%,households consume most, but never all, of their financial wealth, and move tothe next period with a very low level of liquid assets. At high levels of cash onhand, the precautionary motive is small and households consume more than theincome they expect to receive (which equals 1) and so run down their assets. Aswe discuss later, our baseline retirement consumption rule implies either littleilliquid wealth or a low propensity to consume from it. Thus as households age,they must save for retirement: consumption rules decline and households accu-mulate significant amounts of liquid wealth.
15 Other relevant parameters are &= 0"960#'= 0"514#R= 1"0344, typical income uncertainty, fam-ily size, and expected income profile, as discussed in Sections 4 and 5.
Maximilian Eber and Xavier Jaravel Answering Macro Questions Using Micro Data: Advances and ChallengesMarch 26, 2014 73 / 92
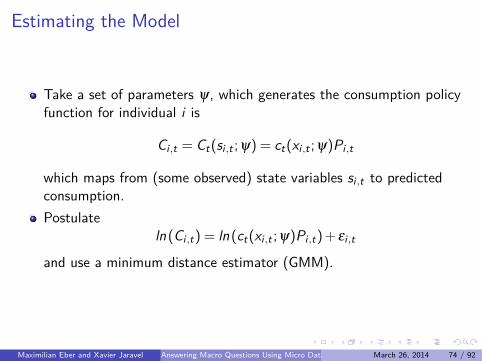
Estimating the Model
Take a set of parameters ψ, which generates the consumption policyfunction for individual i is
Ci ,t = Ct(si ,t ;ψ) = ct(xi ,t ;ψ)Pi ,t
which maps from (some observed) state variables si ,t to predictedconsumption.Postulate
ln (Ci ,t) = ln (ct(xi ,t ;ψ)Pi ,t) + εi ,t
and use a minimum distance estimator (GMM).
Maximilian Eber and Xavier Jaravel Answering Macro Questions Using Micro Data: Advances and ChallengesMarch 26, 2014 74 / 92

Method of Simulated Moments
Previous approach requires high quality data on individuals’ statevariables and consumption choices.
I We do not have those.
Method of Simulated Moments allows to use more coarse dataI Bring the model close to any moment of the data
See Pakes and Pollard (1989) for methodology
Maximilian Eber and Xavier Jaravel Answering Macro Questions Using Micro Data: Advances and ChallengesMarch 26, 2014 75 / 92

Model Fit (Full Sample)72 p.-o. gourinchas and j. a. parker
Figure 5.—The fitted consumption profile.
alternative interpretation for a low !0 is that households have a low propensityto consume out of illiquid wealth at retirement.34It should be noted that both estimation methods reject the overidentifying
restrictions at the 5% level. The 95% critical value for a "2#36$ is 50%71 and thechi-square always exceeds 150. This is not entirely surprising, given the numberof moments we use (40) and the few parameters of the model. The estimatedmodel should still be taken seriously however. As we now discuss, the modeldoes much better in an economic sense than the CEQ-LCH model with whichthis section begins.With our estimates in hand, we can address how well the stochastic model fits
the life-cycle consumption profile. The first panel of Figure 5 plots the simulatedand actual consumption data along with the income profile. The stochastic life-cycle model does a much better job at fitting the consumption profile than theconsumption profile with constant growth rate of #1/&$ ln#'R$ that would obtainunder the certainty-equivalent. The consumption profile from the fitted model
34 For instance, if the ratio of illiquid wealth to permanent income, h, were equal to 6, the marginalpropensity to consume out of illiquid wealth would be a mere 0%35%.
Maximilian Eber and Xavier Jaravel Answering Macro Questions Using Micro Data: Advances and ChallengesMarch 26, 2014 76 / 92

Counterfactuals: Savings Distribution
consumption over the life cycle 75
life-cycle consumption:
SLCt = !WLC
t+1 −WLCt "/R= !R−1"/RWLC
t +YLCt −CLC
t #
Precautionary saving is the complement of life-cycle saving.The first panel of Figure 7 plots the precautionary and life-cycle liquid saving
of the average household. Given the estimated discount rate and the profile ofexpected income, young consumers facing no income risk would like to borrowlarge amounts, so life-cycle saving is negative early in life. Young households infact hold a positive buffer stock of wealth in response to income risk, so that pre-cautionary saving is positive early in life. In the early to mid forties, in accordancewith our previous discussion, life-cycle saving becomes larger than precautionarysaving. Households begin to build their liquid wealth for retirement purposes. Asasset levels increase, the expected variance of consumption declines, decreasingthe precautionary saving motive. Since households that face income uncertaintysave more early in life due to risk, they are able to consume more and save lesswhen older, leading to negative precautionary saving late in life. This discussion
Figure 7.—The role of risk in saving and wealth accumulation.
Maximilian Eber and Xavier Jaravel Answering Macro Questions Using Micro Data: Advances and ChallengesMarch 26, 2014 77 / 92

Summary: Structural Approach
ProsI Counterfactuals and Policy analysisI Flexible data usage
ConsI Model uncertaintyI Computational complexity
Maximilian Eber and Xavier Jaravel Answering Macro Questions Using Micro Data: Advances and ChallengesMarch 26, 2014 78 / 92

1 Introduction
2 Methodology
3 Data Sources
4 Examples from Different Areas
5 Jimenez et al. (2014)
6 Mian and Sufi (2011)
7 Gourinchas and Parker (2002)
8 Future Research
Maximilian Eber and Xavier Jaravel Answering Macro Questions Using Micro Data: Advances and ChallengesMarch 26, 2014 79 / 92

Section 8
Future Research
Maximilian Eber and Xavier Jaravel Answering Macro Questions Using Micro Data: Advances and ChallengesMarch 26, 2014 80 / 92

Empirical Work to Inform Macroprudential Regulation
Aggregate Demand ExternalitiesPecuniary externalities (Fire sales etc.)Financial regulation
I Structural model / sufficient statistic for optimal interventions (e.g.liquidity requirements)
Maximilian Eber and Xavier Jaravel Answering Macro Questions Using Micro Data: Advances and ChallengesMarch 26, 2014 81 / 92
Aggregate Demand Externalities
Renewed interest in the theory of aggregate demand externalitiesI Farhi and Werning (2012)I Farhi and Werning (2013)
Can we assess empirically whether aggregate demand externalitiesexist and their quantitative importance?
Maximilian Eber and Xavier Jaravel Answering Macro Questions Using Micro Data: Advances and ChallengesMarch 26, 2014 82 / 92

Empirical Strategy
Consider exogenous shocks hitting US countiesWhat are the implications of a model with aggregate demandexternalities for the cross-sectional distribution of job losses?
I there will be more job losses in counties that are more “closed”I these job losses will be concentrated in the non-tradeable sectorI similar in spirit to Mian and Sufi (2012)I openness of the local economy could be measured by the steady-state
employment share of non-tradeables
Exogenous shocksI deleveraging shocks (as in Mian and Sufi (2012))I fiscal transfers (as in Wilson Chodrow-Reich et al. (2012) and Wilson
(2012))I military expenditures (as in Nakumura and Steinsson (2013))
Maximilian Eber and Xavier Jaravel Answering Macro Questions Using Micro Data: Advances and ChallengesMarch 26, 2014 83 / 92

Empirical Specification
Borrow the model form Farhi and Werning (2012) to characterize theresponse of the economy to a “transfer” in a dynamic model
βc,t = evt
ρ1−α
α− (1− evt)ρ
11
1−χ+ φ
I estimate the following model:
Lt+1,i −Lt,iLt,i
= γ1St,i + γ2St,i · It,i + β Xt,i + ut,i
t indexes time and i the local economy. Li is employment, Si anexogenous shock to the local economy (think of predicted value inTSLS framework) and Ii the degree of openness of the local economy.Xt,i is a rich set of covariates.
Maximilian Eber and Xavier Jaravel Answering Macro Questions Using Micro Data: Advances and ChallengesMarch 26, 2014 84 / 92

Nontradeable Employment Shares
Maximilian Eber and Xavier Jaravel Answering Macro Questions Using Micro Data: Advances and ChallengesMarch 26, 2014 85 / 92

Nontradeable Employment Shares
Maximilian Eber and Xavier Jaravel Answering Macro Questions Using Micro Data: Advances and ChallengesMarch 26, 2014 86 / 92

Deleveraging Shock
Maximilian Eber and Xavier Jaravel Answering Macro Questions Using Micro Data: Advances and ChallengesMarch 26, 2014 87 / 92

Fiscal Policy Shock
Maximilian Eber and Xavier Jaravel Answering Macro Questions Using Micro Data: Advances and ChallengesMarch 26, 2014 88 / 92

To Be Continued?
Better measure of nontradeablesBetter measure of openness of the local economy (production vs.consumption)Explanation for the cross-sectional variation in non-tradeableemployment shares
I Instrument for non-tradeable employment shares?
Maximilian Eber and Xavier Jaravel Answering Macro Questions Using Micro Data: Advances and ChallengesMarch 26, 2014 89 / 92

Macro and Networks
Daron Acemoglu & Vasco M. Carvalho & Asuman Ozdaglar & AlirezaTahbaz Salehi, 2012. ”The Network Origins of AggregateFluctuations,” Econometrica, Econometric Society, vol. 80(5), pages1977-2016, 09.Engelberg, J., Gao, P., and Parsons, C., 2012, Friends with Money,Journal of Financial Economics, 103 (1), p. 169–188.Possible directions:
I studying contagion in financial networks using Fed data
Maximilian Eber and Xavier Jaravel Answering Macro Questions Using Micro Data: Advances and ChallengesMarch 26, 2014 90 / 92

Other Topics
Thoughts?
Maximilian Eber and Xavier Jaravel Answering Macro Questions Using Micro Data: Advances and ChallengesMarch 26, 2014 91 / 92

Thank you!
Maximilian Eber and Xavier Jaravel Answering Macro Questions Using Micro Data: Advances and ChallengesMarch 26, 2014 92 / 92