antal russia_salary survey-2014-2015_english
TRANSCRIPT

2020th
ANNIVERSARY
Job Market Overview
2014 - 2015& Salary Survey
Russia | Kazakhstan

Antal Russia has earned a leading position in middle and senior managerial recruitment in Russia and the CIS and has had a significant presence in the market over the last 20 years.
Antal Kazakhstan, a leading executive recruitment company in Kazakhstan and Central Asia, opened an Almaty office in 2010. Antal Kazakhstan has an established reputation for excellent service and reliable local knowledge.
We are a part of the international group of companies, the FiveTen Group.
Please note that commercial use, distribution, reprint or publication of all or any parts of the survey is prohibited without prior written authorisation from Antal Russia and Antal Kazakhstan. The reference to Antal Russia and Antal Kazakhstan is obligatory while quoting any data contained in this survey.

CONTENTSIntroduction ...................................................................6Celebrating 20 years of Antal Russia ..............................8Our Partners ...............................................................10Outstaffing ..................................................................17Demographics .............................................................18Methodology ..............................................................21
Job Market Overview ........................22Trends .........................................................................24Relocation ...................................................................25Job Search ..................................................................27Professional education, degrees, certificates.....................................................32Motivation ....................................................................33Headcount ..................................................................34Expats .........................................................................37Salary Level ................................................................38Benefits ......................................................................41Bonuses .....................................................................43
Russia ..................................................46General Management .................................................48Sales ..........................................................................48Marketing ...................................................................53Financial Services .......................................................54Healthcare ..................................................................56Automotive .................................................................56B2B ............................................................................58Supply Chain ..............................................................58Production ..................................................................59Construction & Real Estate .........................................60IT ................................................................................62Finance & Accountancy ..............................................62Human Resources ......................................................64
Kazakhstan ..........................................66Top Management ........................................................ 68Sales ........................................................................... 70Marketing .................................................................... 72Finance & Accountancy ................................................ 73Human Resources & IT ................................................ 74Supply Chain Management & Production ................................................................ 75Banking ....................................................................... 76Healthcare ................................................................... 78Oli & Gas ..................................................................... 78Mining Sector .............................................................. 79Automotive ................................................................... 79

INTRODUCTIONIntroduction ............................ 6Celebrating 20 years .............. 8Our Partners ........................ 10Outstaffing ........................... 17Demographics ..................... 18Methodology ....................... 21


iNTROduCTiON
We are pleased to present the fifth edition of our annual “Job Market Overview and Salary Survey.” This year our partners are the Russian-German Chamber of Commerce, the leading professional social network LinkedIn and EF Education First, one of the world’s leading international education providers. We thank our partners for their effective cooperation.
2014 is a special year for us. This year the company celebrates its 20th anniversary on the Russian market. Moreover, this year for us, as for many of you, will be a defining one in determining the development of business.
An era of rapid economic growth has given way to a period of more moderate growth, when just growing sales will not guarantee success. The time when goods and services just needed to be customs cleared and almost sold themselves has finally come to an end.
Our annual Job Market Overview and Salary Survey is clearly showing signs of the economy becoming more developed.
In times of change, it is very important to stick to one’s opinion and not to react sharply to changing market conditions. Loyalty and confidence have helped us succeed in the volatile Russian market.
There are more and more employees who feel that their employer is stable and fewer employees are actually looking for something new. With less than 30% actively looking for a job, Russia and Kazakhstan coming closer to the European levels.
industrial companies continue to localise their production in the regions and to develop their work with local suppliers. However, 2014 promises to be difficult for regional business development, because neither macroeconomic nor political processes contribute to it.

7
INTR
OD
UC
TION
Retailers are also facing some difficulties and are trying to determine the right sales mix considering the recent developments in ecommerce.
However, the most important priority for all companies will be raising productivity across the board, which is affected not only by the efficiency of the employees and their level of involvement, but also by the fluctuations in the market. It is important when hiring a new employee, to be sure that the right choice is made.
We wish you success in 2014 - 2015.
Kind regards, Michael Germershausen & Anna Kovinskaya
Michael GermershausenManaging Director Eastern Europe, FiveTen Antal
Moscow office +7 (499) 550 23 83 [email protected] | www.antalrussia.com
Anna Kovinskaya Country Manager, Antal Kazakhstan Almaty office
+7 (727) 261 90 95/96 [email protected] | www.antalkazakhstan.com

2020th
ANNIVERSARY
CElEbRATiNG 20 yEARS Of ANTAl RuSSiA
Antal Russia and Antal Kazakhstan have crafted a deep specialist knowledge across 18 industries and 7 disciplines since 1994.
Our unswerving commitment to our markets across the
region has never been in question, even during the economic downturns of 1998 and 2008. We continue to follow our
clients, launching offices where they want us to be.
We are committed to valuable, long-term relationships throughout your career, whether you’re a client or a candidate. Since inception we have tracked hundreds of our strongest candidates, helping to build their careers with multiple placements over more than 20 years – a mutually rewarding commitment between candidate, consultant and client.On the client side, two-thirds of our assignments are based on repeat business, recommendations or referrals.
We strive to work in partnership with all of our clients, building rewarding relationships over many years. 15% of our existing clients have worked with us every year since 2005. building loyalty is the Antal Russia way.
1994 Antal opens its first office in Moscow
1994 Russia joins the Asia-Pacific Economic Cooperation (APEC)
1999 - 2003 The Russian economy grows by a third
2003 The Russian cartoon “Hedgehog in the Fog” wins the title of “Number 1 Animated Film of all Time” at the “All Time Animation Best 150 in Japan and Worldwide” contest in Tokyo

9
INTR
OD
UC
TION
2005Kazan celebrates its millennium (1000 year anniversary)
2007 Antal employees drink 288kg’s worth of coffee beans
2008 Antal Russia’s headcount grows to 100 people, from 3 in 2002
2008Antal Russia is acquired by the FiveTen Group
2010 Antal Russia opens a new office in Almaty (Kazakhstan)
2010 Antal Russia and Antal Kazakhstan place their 1000th candidate
2013Antal Kazakhstan opens a new office in Astana
2014Sochi hosts the Winter Olympics

OuR PARTNERSThe Russian-German Chamber of Commerce:impulse. lobby. Service.
The Russian-German Chamber of Commerce (COC) and its predecessor, the Association of the German Economy in the Russian Federation, have represented the interests of the German economy in
Russia, as well as the Russian
economy in Germany, since 1995. The COC currently incorporates approximately 860 members, largely from SMEs. The enormous success of the German economy in Russia requires a body like the COC, which provides excellent organisation and representation of interests. Being
a member of the COC means being the member of a strong
community.
In order to represent and support our members and all German enterprises operating in Russia, we have set the following objectives:
Service
• Talks and workshops on topical issues
• Comprehensive, up-to-date information
• COC magazine Impulse• Referral to service providers
(e.g. law, taxes, conveyance)• Project support, at government
level if required• Organising press conferences,
supporting PR • Information exchange
with specialists• Address searches• Maintaining contact with and
providing exclusive information on the region
Impulse
• Support entry to the market• Establish and maintain contact
with business partners• Provide market information
and adviceLobby
• Lobbying and representation of interests at the political and administrative level
• Economic and political dialogue• Contact with all Russian and
German trade organisations

11
INTR
OD
UC
TION
What you can expect:
• The COC represents, advises and supports German and Russian companies all the way from market entry to establishment of their day-to-day business
• The COC is in close contact with Russian and German trade associations and ministries, representing the interests of the German economy
• The COC attends over 100 events annually, providing information on all relevant economic topics in Germany and Russia
• The COC website provides all the latest information on economic activity in Russia: www.russland.ahk.de

Preface COC-Russia: Market, Modernisation, SMEs
Michael Harms, Chief Executive Officer, Russian-German Chamber of Commerce
A trend which has been taking shape in Russia for the past 10 years, of salary growth outstripping economic growth as a whole, continued in 2013. In fact, salary growth increased threefold last year while the economy grew by 1.3%, so real economic growth lags well behind the rate of inflation (6.5%), and does not justify the experts’ predictions. The anticipated catalysts for growth, such as modernisation, localisation of production and higher efficiency, stayed restrained. Moreover, we shouldn’t forget about the harmonisation of certain sectors’ standards after Russia joined the World Trade Organisation (WTO.) There are several factors behind this stunted growth, one of them being growing salaries and social charges, which lead to increasing
wage costs and decreasing competitiveness of
Russian enterprises.According to the Ministry of Labour and
Social Development, the average labour productivity in Russia is one third of that of the industrialised countries. Thus, the average salary is lower than, for example, in Germany, but the final product is usually more expensive and therefore uncompetitive on the world market. The negative demographic situation exacerbates the direct costs of wages. The Organisation for Economic Cooperation and Development (OECD) forecasts a reduction of able bodied citizens (20-64 years) in Russia by a third to 64 million by 2050 while the population of retirement age (65 years) will also increase by a third. According to the OECD, the number of workers employed in sectors such as manufacturing and construction appreciably reduced in the period from 2008 to 2012. Russia ranks last in the list of emerging markets.
Consequently, there is increasingly a lack of qualified staff, particularly operatives and engineers. As a result, the demand for them is growing.
A positive trend is that these professionals are identifying career development opportunities and the atmosphere in their team as key motivating factors, indicating increasing loyalty to the employer. In this difficult situation, especially for industrial organisations, a director position in the COC for promoting a dual education project was
established on January 1 2014. This person was charged with coordinating the interests of Russian educational institutions, businesses and students, and cooperating with the Agency’s strategic initiatives, as well as promoting the development of operatives’ education based on the German model.
This initiative is timely because industrial enterprises in Russia are identifying the lack of specialists as their number one problem. There is also a shortage of professionals in suppliers’ enterprises.
if we want to improve the competitiveness of Russian industry and ensure its quality and sustainability, it is necessary to hold a speedy reform in the field of (professional) education, which would reduce the gap between Russia and the industrialised countries.

13
INTR
OD
UC
TION
w kww .lin edin.com
OUR PARTNERS
LinkedIn in Russia & CIS
Phil Mogilev, Account Executive EMEA, LinkedIn Talent Solutions
LinkedIn is the largest professional network with more than 300 millionusers around the world, of which overthree million are in Russia and five millionare in the CIS. Growth in this region isamong the fastest worldwide. But who are these users and why are they members of LinkedIn?
There are a wide range of professions and experience levels. The top five roles in the region are related to sales, IT, engineering, media and communication and operations. Professionals come to LinkedIn to establish their online professional identity, connect with their network of contacts and gain access to information and knowledge to help them be great at their jobs.
On LinkedIn, only 20% of users are active candidates, this means that they are actively looking for a job. You can also reach them via job boards, your company website, etc. One of the main advantages of recruiting
through LinkedIn is access to the other 80% of professionals, who are known as ‘passive’ candidates. These professionals are not proactively looking for a job but might be interested in the right opportunity. Can
Top industries in Russia & CIS (by LinkedIn)1. IT and services2. Construction3. Oil & energy4. Education5. Banking
Founded in 2003, LinkedIn connectsthe world's professionals to make themmore productive and successful. Withmore than 300 million membersworldwide, including executives fromevery Fortune 500 company, LinkedIn isthe world's largest professional networkon the Internet. The company has adiversified business model with revenuecoming from Talent Solutions,Marketing Solutions and PremiumSubscriptions products.Headquartered in Silicon
across the globe.

OuR PARTNERS
Ef Education first – international language Centres
EF Education First is an acknowledged leader in international education. EF was founded in 1965 in Sweden. There are currently EF offices and schools in more than 50 countries of the world. EF’s mission is to break down the linguistic, cultural and geographical barriers that divide us. EF Education First offers language courses for children, youths and adults, academic programmes and university preparation programmes.
EF’s Language Courses Abroad for adults and young professionals invite you to spend your holidays in our language schools or special career focused centres! Combine an effective language course with the opportunity to expand your business network and enjoy various entertainment programmes. Travel to your dream destination and develop your language skills. EF is the smart way to relax!
EF was the official provider of language services for the Olympic and Paralympic Games in Sochi in 2014 as well as the partner of Universiade for Kazan 2013.
use a special code word - smart vacationer - when booking your language course abroad with Ef Education first and get 10 special interest classes per week instead of four! Professional vocabulary, grammar, pronunciation or history of culture - take extra lessons at our expense.
www.ef.com/language

15
INTR
OD
UC
TION
linguarati – a new word for your CV Smart vacationer – a new lifestyle
Nina Gilmizyanova, director of the programme: “language courses abroad for adults and young professionals”.
Do you easily orientate in social media, efficiently and freely communicate in English with colleagues and business partners on LinkedIn and friends on Facebook? Are you surrounded by digital media and constantly staying connected? If the answer is yes, then you can belong to the category of people called the “linguarati.”
According to the report “The Rise of The Linguarati,”* only 37% of respondents speak English at a level sufficient for communication in an online environment. They – a new generation of linguarati – have a direct influence on the corporate image of
their employers in the current market, where English has become the language of international business. They remain the most sought-after candidate group among employers, especially in emerging markets such as Russia, Brazil and China. The use of LinkedIn among this group of professionals is 30% higher than among other categories of employees, which means that linguarati establish business contacts faster and are able to find information that will help them to succeed in their career.
Many employers are willing to invest in the development of the language skills of their employees. But the majority of businesses continue to believe that their employees will improve their knowledge of English or other foreign languages by themselves.
We have noticed that a community of smart vacationers formed a long time ago in Western countries. This community embraces people eager to spend their vacation not just relaxing, but putting the time to good use: to travel, to discover a new culture, to expand their network with new friends and possibly business partners from different countries of the world. Perhaps the idea of “smart holidays” is still not as popular in Russia as in foreign countries, but it is becoming more and more attractive. Gradually, a community of smart vacationers is growing in Russia.
find out more at: www.linguarati.com
*The term of «linguarati» was first identified in the report “The Rise of The Linguarati”, prepared by Professor Michael Hulme, sponsored by EF Education First. The survey embraced 1 023 decision makers from large organisations of 10 countries. The surveys were conducted in April 2013.

OuR PARTNERSRegional Public Organisation of disabled People, “Perspektiva”
We sincerely thank participants for spending a little of their time to take part in the survey, because they not only helped us to gather interesting data, but also contributed to the support of people with disabilities. This year we continue our cooperation with Regional Public Organisation of Disabled People “Perspektiva”. Each year, we transfer 10 rubles for each completed questionnaire to support its activities.
Perspektiva was set up in 1997. It is now one of the leading organisations defending the rights of disabled people in Russia. The company’s mission is to achieve full inclusion of disabled people in all aspects of society and improve the quality of their life.
One of the key areas of activity for Perspektiva is helping people with disabilities to find a job. The organisation provides them with employment services such as advice on labour law, the selection of suitable jobs, training for further employment, job fairs and publication of helpful literature, as well as providing consultation and training for employers. Over the past three years Perspektiva has helped more than 600
people with disabilities to find a job. If you have any questions about our partnership with Perspektiva, we are happy to share our experience.
www.perspektiva-inva.ru/en
Ani Tangyan’s story
Ani became disabled after she had been ill with poliomyelitis. She has great difficulty in walking and moves with the help of a cane. In 2006 Ani took part in the competition “Clever Boys and Clever Girls” and also entered the Moscow State Institute of International Relations (University) at the Faculty of International Private and Civil Law, graduating with honours in 2012. She has a master’s degree in jurisprudence. Despite her good education, Ani doubted that she could get a prestigious job because of her disability.
Employment specialists invited her to take part in a competition for young professionals with disabilities, “The Way To A Career,” which was supported by Perspektiva and the Business Council on Disability, and offered her a legal internship.
After negotiations with a law firm, Ani had several interviews and was offered three months’ training. Ani ALSO won first place in the competition. Her internship was extended for another three months and she was then offered a long-term contract. After the competition, Ani was invited by a foreign manufacturing company to work from home as an interpreter. There were some difficulties with administration, which were resolved with the assistance of experts of Perspektiva. Currently Ani successfully performs the duties of an interpreter at home and continues to work as a lawyer. Ani is very happy with her work and is thinking about further career growth.

17
INTR
OD
UC
TION
OuTSTAffiNGAn effective solution to manage your headcount. Outstaffing is required when a company:
•Wantstohireemployeeswithoutopening a legal entity in the country;
•Haslimitedheadcountbutiswillingto hire new people;
•DoesnothavetheHRandfinancestructure in place to deal with local legal requirements;
•Wantstosavemoneyonadditionalprofessional services such as accounting, HR, legal etc. and to avoid working with a number of different providers;
•Islookingforanopportunitytolimitthe contract duration for employees.
benefits:
for your business•Freedomtofocusoncorebusiness•LowerHRadminandpayrollload•Noquotesforinternational
employees•Reductionofrisks•Completelegalityandsupport•Tryandhire•Noheadcountlimitations
for employees•Salarytwiceamonth•Documentsforembassies,state
authorities, etc.•Corporatemedicalinsurance•Freebankaccountwithcorporate
benefits
If you have any questions, please contact our Head of Outstaffing:
Alexander Pokrasov +7 (499) 550 23 83

dEMOGRAPHiCS
Gender
44%
56%
52% Generation Y (Age 18-33)
43% Generation X (Age 34-48)
5% Baby - boomers (Age 49-67)
Age
The survey covered 4 760 respondents.
Experience
2% Under 1 year
7% 1 - 3 years
15% 4 - 6 years
27% 7 - 10 years
26% 11 - 15 years
15% 16 - 20 years
8% Over 20 years
Level
26% Director
52% Manager
22% Specialist

19
INTR
OD
UC
TION
93% Permanently employed
1% Freelance/Temporary/Interim
4% Contract employed
Employment status
2% Not currently working
Location
86% Russia
12% Kazakhstan
2% Rest of the world
36% Local company
64% International company
Type of company
33% 1000+ employees
11% 500 - 999 employees
24% 100 - 499 employees
6% Fewer than 10 employees
26% 10 - 99 employees
Size of company

14% Less than 10 000 000
Revenue
8% 10 000 000 - 15 999 999
4% 20 000 000 - 24 999 999
4% 25 000 000 - 29 999 999
4% 16 000 000 - 19 999 999
5% 30 000 000 - 34 999 999
3% 35 000 000 - 39 999 999
3% 45 000 000 - 49 999 999
51% 50 000 000+
4% 40 000 000 - 44 999 999
(USD)Professional discipline
21% Sales
12% Finance and Accountancy
12% Human Resources
9% Marketing
8% IT and Technical
7% Medicine & Pharmaceutics
6% Logistics, Supply Chain & Purchasing
6% General Management
6% Production, Technology & Engineering
3% Construction & Real Estate 8%
Other
dEMOGRAPHiCS
2% Automotive

21
INTR
OD
UC
TION
Industry sector
10% Financial Services11%
Healthcare9% FMCG - Food & Drink
9% FMCG - Non Food
8% Production, Manufacturing
7% Information Technologies
6% B2B
5% Oil & Gas, Natural Resources
5% Automotive 5%
Construction, Engineering5% Retail
4% Professional Services
3% Logistics, Transport
2% Telecoms
2% Media, Entertainment
9% Other
dEMOGRAPHiCS
METHOdOlOGy
This job market overview is based on the data received from an online survey of 4 760 respondents from Russia, Kazakhstan and other countries. The survey covered experienced professionals as well as middle and senior managers, working mainly in big international companies in Moscow and Almaty. The survey was conducted in February 2014.
The salary survey is based on figures from an online questionnaire, our own database and expert estimations from our experienced consultants.
We quote average monthly gross basic salary ranges excluding bonuses. The majority of respondents fall into the quoted range. The figures are presented in rubles for Russia and
in US dollars for Kazakhstan. A salary can vary depending on a company’s size, market sector and origin, and an employee’s experience, qualifications and responsibilities.

JOB MARKET OVERVIEWTrends .................................. 24Relocation ............................ 25Job Search .......................... 27Professional Education, Degrees, Certificates ............ 32Motivation ............................ 33

Headcount ........................... 34Expats ................................. 37Salary Level ......................... 38Benefits ............................... 41Bonuses ............................. 43

TRENdS
If in 2012 and 2013 the level of optimism about the future of the economy stayed at about the same level, the picture in 2014 has changed dramatically. The economic slowdown and the unstable political situation are signs of approaching stagnation in the socio-economic sphere for many respondents, and some of them are ready to talk about a coming decline. The number of people who have a pessimistic attitude about the near future has increased by 28%.
In Russia, only 13% of respondents retain a positive attitude. Last year, 28% of people were optimists. Almost half (49%) do not expect that there will be any changes for the better in the next 12 months. The growing negative attitude is also noticeable in Kazakhstan, but it feels a little less significant there. A third of
managers (33%) look to the future with optimism and only
27% are inclined to believe that the economic situation will worsen.
Despite the deteriorating economic situation, middle and senior managers have not lost their sense of security. In Russia, indicators of confidence in the future held at the previous year’s level (83%) and in Kazakhstan this figure is slightly higher (84%).
Employee loyalty remains the same. Like last year, 72% of respondents would recommend their employer to friends and acquaintances.
The level of satisfaction continues to grow gradually. Exactly three-quarters of professionals are happy with their current job. Compared with last year, levels of dissatisfaction decreased by 2% in Russia and by 3% in Kazakhstan.

25
JOB
MA
RK
ET OVER
VIEW
Employers note that salaries in regional divisions do not differ very much from those that employees get at the central office, of course within the same country.
RElOCATiON
The largest number of respondents are ready to move to another region of the country. Current indicators do not differ much from those revealed by last year’s survey. Almost half of applicants in Kazakhstan would accept the proposal to move while in Russia, 39% of professionals expressed a willingness to move to another region.
Slightly less than a third of managers are ready to think about the possibility of moving. Many of them would accept an attractive offer from an employer which takes into account their career and salary expectations. Some also say that they would move only if it doesn’t affect their work-life
balance. Most of the respondents explained that they couldn’t make the decision to move without taking into account the interests of family members.
in Russia, the most attractive regions are Moscow and Saint Petersburg, the Krasnodar region, the Volga region, Tatarstan, the Kaluga region, Siberia and the far East. in Kazakhstan, managers are ready to move to Astana, Almaty, Aktau, Atyrau and Shemkent.
A third of Russian managers and a quarter of their Kazakh colleagues rejected the possibility of moving.
Would you consider relocating to other regions within the country for a suitably attractive opportunity?
39% Yes
32% No
29% Maybe

RElOCATiON
Would you consider relocating to another country for a suitably attractive opportunity?
59% Yes
14% No
27% Maybe
Moving to another country is, for the majority of respondents, much more attractive than relocation within the country. 58% of managers working in Russia and 64% of managers in Kazakhstan declared their willingness to leave the country if they were offered an interesting position. In Russia, the level of mobility decreased slightly compared with last year’s figures, while in Kazakhstan, it increased slightly.
The list of the most attractive countries for the move hasn’t changed. The leading positions are occupied by Western Europe (especially France, Germany, Great Britain), United
States, Canada and Australia. Slightly less popular are the countries of Eastern Europe, UAE, Singapore, China and India.
For the managers, moving to another country is an opportunity to gain new experience, get familiar with the local standards of business, make useful contacts and make their life more exciting.
Many point out that the move to another country would be only temporary, and as soon as the contract expires, they would certainly come back to their country of permanent residence.
Employers say that the paperwork is the greatest difficulty when relocating an employee to another country. This is a very painstaking process. The move may be held up for a period of 6 to 12 months due to bureaucratic delays.
65% of respondents said they would accept the proposal to move to another country. A little more than a third of professionals wouldn’t move. The most frequently mentioned reasons for refusing to move are family circumstances and duration of contract.

27
JOB
MA
RK
ET OVER
VIEW
JOb SEARCH
Plans to change job
Currently looking for a job
Will be ready for a move within 3 months
Will be ready for a move within 4 - 6 months
Will be ready for a move in 6 - 12 months
Don’t envisage moving
Online job boards, which allow people to create a CV and receive information about new interesting vacancies, are still very popular among job seekers.
The number of middle and senior managers who are not willing to trust any recruiters in their career slightly increased. These candidates prefer to address an attractive employer directly, without involving any third party.
For some respondents, successful employment was the logical conclusion of an internship with a company. There were those who received a job offer as a result of participation in specialised exhibitions and conferences. Several respondents stated that they started their own business.
Will be ready for a move in over a year’s time
2014
2013
2012
Key
28%30%36% 9%11%10% 8%9%8%
10%10%10% 17%16%15% 28%24%21%

JOb SEARCH
How managers are finding a new job
36% Recruitment consultancy/Head-hunter
2014
2013
24% Direct employer approach
21% Personal contact
5% Internal promotion
5% Advertising (online)
4% Professional network
2% Social networks (e.g: LinkedIn, Twitter, Facebook)
1% Advertising (print)
2% Other
34% Recruitment consultancy/Head-hunter
24% Direct employer approach
22% Personal contact
5% Internal promotion
5% Advertising (online)
4% Professional network
2% Social networks (e.g: LinkedIn, Twitter, Facebook)
1% Advertising (print)
3% Other
5% of respondents got an internal promotion, which corresponds to the previous year’s figure. Social networks retain their position. Over the past year, 2% of managers have found a new job using this tool.

29
JOB
MA
RK
ET OVER
VIEW
Compared to last years figures, 2% more managers turned to recruiters when searching for a new job. This method of employment has shown steady growth over the past few years.
2012
33% Recruitment consultancy/Head-hunter
24% Direct employer approach22%
Personal contact
8% Internal promotion5%
Advertising (online)
4% Professional network 1%
Social networks (e.g: LinkedIn, Twitter, Facebook)
1% Advertising (print)
2% Other

JOb SEARCH
Which tools are most important in a job search?
90% Recommendations/personal contacts
86% Recruitment consultancies/head-hunters
67% Social networks (e.g: LinkedIn, Twitter, Facebook)
15% Trade Press
82% Online job boards
5% National Press
The three most effective tools for finding a job have remained unchanged for several years. Social networks, which have increased in popularity in recent years, comfortably hold onto fourth place. National and specialised press isn’t considered an effective tool by most of the respondents.
Many managers found that the most effective way to find a job is a direct appeal to the employer. Some stated that they themselves have never looked for a job, they are always found by head-hunters. As usual, there were several lucky people among the respondents who got their job by chance.
How has the number of interesting vacancies changed in the past year?
17% Increased
31% Decreased
52% Has not changed
Respondents observed that compared to last year, the amount of interesting vacancies has decreased in many sectors. Only 17% of managers said that the number of attractive offers had increased. Over half of the respondents have not observed changes in their industry.
The number of employees in Russian who see interesting employment opportunities in the market fell by 10%, while in Kazakhstan, the figure remained unchanged at 26%.

31
JOB
MA
RK
ET OVER
VIEW
How long does it take to find a new job?
The job search still takes up to three months for most applicants. In Russia, 65% of middle and senior managers find a job during this period, and in Kazakhstan, a lucky 72% find another role within three months. These figures are almost identical to last year’s indicators.
66% of professionals who have changed jobs over the last 12 months received an offer from a new employer within three months, and 25% spent from four months to a year on the search for a suitable employer.Up to 1 month 1 - 3 months 4 - 6 months
7 - 9 months 13 - 18 months10 - 12 months
30% 32%32% 33%34%32% 15%16%16%
4% 4%4% 4%3%3% 2%2%2%
19 months - 2 years
N/AOver 2 years
1% 1%1% 1%1%1% 8%9%9%
2012
2013
2014
Key

PROfESSiONAl EduCATiON, dEGREES, CERTifiCATES
Most employers say they definitely pay attention to applicants’ professional certificates and diplomas. However, the degree or the second higher education diploma are not the main criteria for making hiring decisions. Experience and recommendations are much more valued by employers.
The survey results also show that taking several degrees, including an MBA, does not guarantee a higher revenue.
13% Guarantees above average salary
70% Depends on situation
17% Doesn’t guarantee
Most respondents believe that an MBA doesn’t always add value to the candidate. Moreover, managers note that there are many industries where the MBA degree is irrelevant in Russia.
Do you agree that a manager with a second degree is paid more than the average across your industry?
33
JOB
MA
RK
ET OVER
VIEW
Higher salary
Career development
More responsibility
Better work - life balance
Job security
Improved relationship with manager/colleagues
Career growth within company
Better location/easier to commute
Improved benefits package
Better bonus potential
End of contract
Relocation
Redundancy
Better training
Business trips (unsuitable schedule)
Other
MOTiVATiON
201220132014
Key
55%50%48%
47%45%44%
45%24%27%
19%19%17%
17%16%17%
16%14%15%
14%14%17%
13%11%13%
12%11%13%
12%11%12%
12%11%8%
6%6%5%
5%5%6%
4%4%5%
3%3%6%
3%3%3%
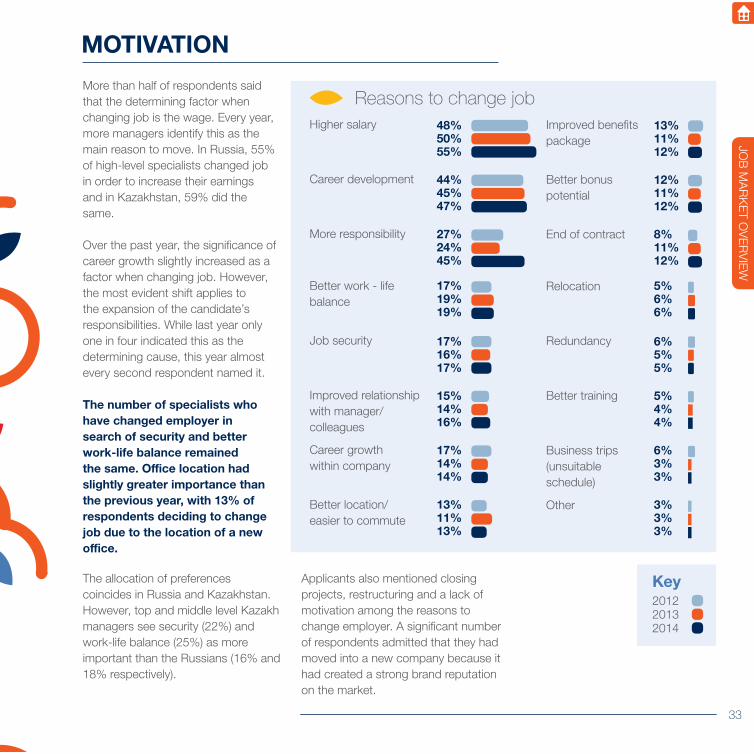
More than half of respondents said that the determining factor when changing job is the wage. Every year, more managers identify this as the main reason to move. In Russia, 55% of high-level specialists changed job in order to increase their earnings and in Kazakhstan, 59% did the same.
Over the past year, the significance of career growth slightly increased as a factor when changing job. However, the most evident shift applies to the expansion of the candidate’s responsibilities. While last year only one in four indicated this as the determining cause, this year almost every second respondent named it.
The number of specialists who have changed employer in search of security and better work-life balance remained the same. Office location had slightly greater importance than the previous year, with 13% of respondents deciding to change job due to the location of a new office.
The allocation of preferences coincides in Russia and Kazakhstan. However, top and middle level Kazakh managers see security (22%) and work-life balance (25%) as more important than the Russians (16% and 18% respectively).
Applicants also mentioned closing projects, restructuring and a lack of motivation among the reasons to change employer. A significant number of respondents admitted that they had moved into a new company because it had created a strong brand reputation on the market.
Reasons to change job

HEAdCOuNT
51% Increased
20% Decreased
22% Remained the same
7% Not sure
Headcount changes
20132014 2012
54% Increased
23% Decreased
18% Remained the same
5% Not sure
55% Increased
22% Decreased
18% Remained the same
5% Not sure
The slowdown in economic growth definitely affects the development of companies. Compared to last year, fewer companies are expanding their staff and more companies are cutting staff.
It is worthy of note that these indicators coincide in both Russia and Kazakhstan. In both countries, the number of employees has grown in half of the companies over the past year, and the number of employees has decreased in only every fifth company.
Most of the employers do not plan to decrease headcount in the remainder of the year. Those who said that they had either started the process or planned to cut staff highlighted the finance, marketing and HR departments as being among the most likely parts of the business to be affected.

35
JOB
MA
RK
ET OVER
VIEW
Reasons for headcount increase
Growth in sales/revenue
Increasing workload
Project specific
Market growth
Acquisition/merger
Other
36%38%
33%32%
11%11%
10%9%
8%8%
2%2%
20132014
KeyGrowth of sales remains the main cause of new positions appearing within companies. However, this declined compared to last year’s rate.
Respondents note that the causes for headcount increase are often interrelated, making it difficult to identify only one. Expansion of the business due to market growth inevitably leads to an increase in workload. In Kazakhstan, 36% of managers said that the main reason for the hiring of additional staff was the increasing workload and in Russia, 33% of specialists identified this factor.
Like last year, 11% of respondents said that the number of employees increased due to the specific projects being implemented at that time, and 8% said that the headcount increase was caused by mergers and acquisitions.
Restructuring, increasing the number of units, expanding the branch network, opening offices in the regions and even an aggravated struggle with competitors were named among other reasons for headcount increases.
Employers continue to open new vacancies as planned: 60% of the respondents are not going to stop hiring people for new roles; only a quarter of them will open vacancies to replace the employees who left.

HEAdCOuNT
67% Corporate headcount reductions
19% Voluntary departures
8% Not aware
6% Other
Reasons for decrease in the number of staff
2013
2014
2012
58% Corporate headcount reductions
32% Voluntary departures
5% Not aware
5% Other
59% Corporate headcount reductions
30% Voluntary departures
5% Not aware
6% Other
Voluntary departures have less of an influence on reductions in headcount than in previous years. 68% of Russian managers and 56% of Kazakh managers reported that staff departures led to a decrease in the number of employees. While last year, employees’ voluntary departures significantly affected the work of the organisation, this year the ratio has changed and dismissal by the employer has become a key tool in the management of staff.
Respondents noted that most staff reductions resulted from restructuring, changes of business strategy, business model changes, reducing costs, optimising business processes or changing ownership.
Employees leave the company voluntarily either because they are not willing to work under the new conditions, or because the company is experiencing financial difficulties that adversely affect the regularity of payment.
Some companies which are unable to keep employees on their staff transfer them to outstaffing, thereby maintaining their efficiency.

37
JOB
MA
RK
ET OVER
VIEW
ExPATS
Does the company you work with hire high-level foreign professionals?
63% Yes
37% No
While 62% of respondents in Russia said that their companies employ foreign managers, 66% of respondents in Kazakhstan gave an affirmative answer to this question. Over the past year, the number of high-level foreign professionals has not changed significantly in either Russia or Kazakhstan.
Most international companies continue to hire foreign professionals.

SAlARy lEVEl
No increase*
Fixed salary increase for the past year
1 - 4%
5 - 10%
11 - 15%
16 - 20%
21 - 25%
26 - 30%
31 - 50%
> 50%
It has decreased
33%
11%
28%
10%
6%
3%
2%
3%
2%
2%
39%
9%
24%
8%
7%
3%
2%
4%
2%
2%
Russia Kazakhstan
2013 turned out to be less successful than 2012 for many respondents. 33% of respondents in Russia and 39% in Kazakhstan noted that their salaries over the past year had not changed. In the previous year, a smaller number of managers in each country experienced this. While the absence of salary indexation in Russia is mainly due to a slowdown in economic growth, the lack of salary indexation in Kazakhstan is a result of wage increases exceeding the rate of inflation.
in Russia, wages for 28% of managers were indexed within or slightly above the inflation rate, which was 6%. The same number of specialists reported that their salary increased by more than 10%.
In Kazakhstan, the situation looks more optimistic as the official inflation rate in 2013 was slightly less than 5%. At the same time, 52% of managers saw their revenue growth exceed the inflation rate.
* percentage of the annual gross salary

39
JOB
MA
RK
ET OVER
VIEW
No increase
Salary expectations in the current year
1 - 4%
5 - 10%
11 - 15%
16 - 20%
21 - 25%
26 - 30%
31 - 50%
> 50%
It has decreased
36%
12%
33%
9%
5%
2%
1%
1%
1%
0%
37%
8%
28%
10%
7%
3%
3%
3%
1%
0%
Russia Kazakhstan
Most employers have not raised salaries and are not going to as a result of the recent developments in the exchange rate. In those companies where the annual review and indexation of salaries is in place, this process has not gone through any alterations.
More than half of managers expect their wage to increase in line with the inflation rate and some even expect that their salary increase will exceed the inflation rate.
Slightly more than a third of respondents do not expect a salary increase. About a third of the respondents who are already actively looking for a new job do not expect an increase in wage.
SAlARy lEVEl
No increase
Salary increase you would move for
1 - 4%
5 - 10%
11 - 15%
16 - 20%
21 - 25%
26 - 30%
31 - 50%
> 50%
4%
0%
7%
11%
20%
17%
15%
17%
9%
2%
1%
5%
7%
19%
16%
13%
22%
15%
Russia Kazakhstan
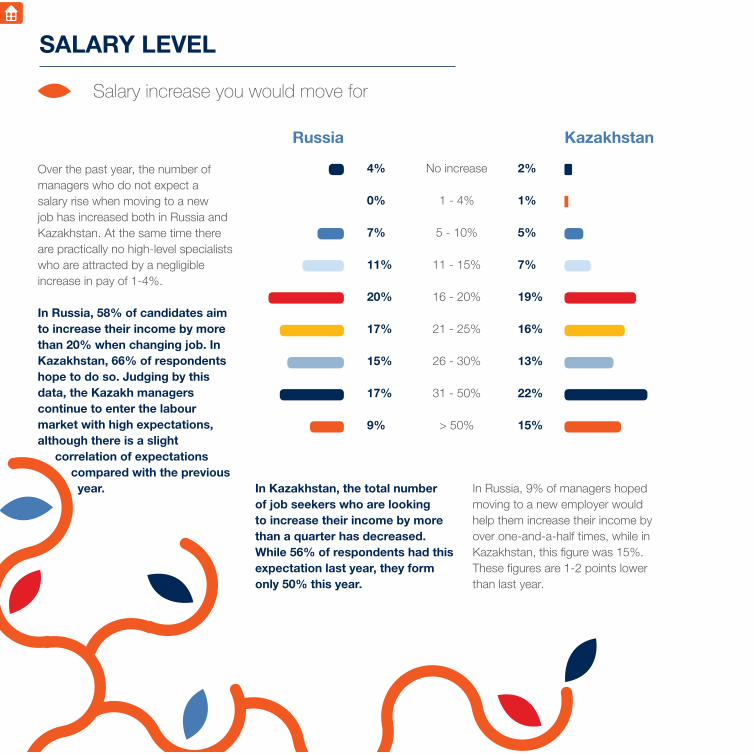
Over the past year, the number of managers who do not expect a salary rise when moving to a new job has increased both in Russia and Kazakhstan. At the same time there are practically no high-level specialists who are attracted by a negligible increase in pay of 1-4%.
in Russia, 58% of candidates aim to increase their income by more than 20% when changing job. in Kazakhstan, 66% of respondents hope to do so. Judging by this data, the Kazakh managers continue to enter the labour market with high expectations, although there is a slight
correlation of expectations compared with the previous year. in Kazakhstan, the total number
of job seekers who are looking to increase their income by more than a quarter has decreased. While 56% of respondents had this expectation last year, they form only 50% this year.
In Russia, 9% of managers hoped moving to a new employer would help them increase their income by over one-and-a-half times, while in Kazakhstan, this figure was 15%. These figures are 1-2 points lower than last year.

41
JOB
MA
RK
ET OVER
VIEW
bENEfiTSRussia
The most common benefits provided for managers in Russia are still voluntary health insurance and mobile phone allowance. The number of respondents who have life insurance in their compensation package increased by 2% compared to the previous year. Over a third of respondents get a lunch allowance.
While flexible working held sixth place among the most popular benefits last year, it has been replaced by a guaranteed parking space this year. This is most likely due to the introduction of paid parking zones all over downtown Moscow. Some employers had to change the compensation package for their employees and include the provision of a parking space.The participants of the survey also mentioned other benefits, like 100% payment for sick leave, payment of foreign language courses, additional vacation days, reimbursement for a nanny / kindergarten / school, the opportunity to purchase the company’s products with a big discount, concessional lending and even lessons with a professional vocal tutor.
Do the benefits offered by employers meet employees’ expectations? In general, the answer to this question
is “yes”. However, there are certain areas where there is a gap between employee expectations and the reality. More than two thirds of managers say that it is important for them to work flexibly. In turn, only a quarter of the respondents claim to have such flexibility.
Compared with the results of last year’s survey, the number of
respondents who want reimbursement for fitness to be included in their compensation package has increased. Some employers quickly reacted to employees’ desire to lead a healthy lifestyle and included this benefit in the compensation package. The number of managers and high-level professionals who receive reimbursement for fitness increased by 2% compared to the previous year.
Voluntary health insurance
Mobile phone allowance
Life insurance
Lunch allowance
Car or car allowance
Parking
Flexible working (homeworking/flexitime)
Fitness
Company pension scheme
77%
71%
41%
36%
34%
26%
25%
16%
9%
92%
75%
56%
50%
56%
53%
66%
28%
34%
Share incentive/EMI scheme/option scheme
Housing allowance
Flexible benefits
Other
N/A
7%
5%
4%
7%
4%
41%
34%
46%
benefits importance

bENEfiTSKazakhstan
Over the past year, the provision of benefits in Kazakhstan and Russia has changed. There has been a 3% increase in the number of senior and middle managers who have started receiving benefits, although the number of those who don’t have a benefits package is still quite significant. The highest growth rates were for benefits such as mobile phone allowance (7%) and car allowance (7%). Lunch allowance and life insurance have also become more widespread. The number of respondents who receive reimbursement for housing and fitness has slightly increased .
In Kazakhstan, there are also other benefits which apply to middle and senior management, including additional vacation days,
reimbursement for flights, tuition and discounts on products and services of the employer.
The preferences of employees have not changed over the
past year. The most popular benefits remain voluntary health insurance, mobile phone allowance and a corporate vehicle.
It’s worth mentioning that compared to last year, the number of professionals who want to have a corporate vehicle at their disposal increased by 14%. Staff began to pay a little more attention to such benefits as a guaranteed parking space, the opportunity to work on a flexible schedule, corporate pension plan and subsidised sports.
Mobile phone allowance
Voluntary health insurance
Car or car allowance
Lunch allowance
Life insurance
Parking
Flexible working (homeworking/flexitime)
Fitness
Company pension scheme
73%
59%
42%
30%
25%
20%
14%
10%
12%
85%
90%
75%
54%
62%
49%
59%
39%
39%
Share incentive/EMI scheme/option scheme
Housing allowance
Flexible benefits
Other
N/A
8%
5%
1%
8%
3%
54%
53%
55%
inc in package important
Employers attentively monitor which benefits employees use most actively. Some companies have started to revise the benefits package annually.

43
JOB
MA
RK
ET OVER
VIEW
bONuSES
RuSSiA
59% Received
15% Not entitled
26% Not received
Bonuses received for previous financial year
KAzAKHSTAN
50% Received
19% Not entitled
31% Not received
91% of respondents in Russia and 95% in Kazakhstan indicated that bonus is one of the main motivational factors for them. In Russia, bonuses are paid to 85% of middle and senior managers. In Kazakhstan, this figure is slightly lower at 81%.
The number of managers who have received a bonus payment up to the last financial year in Russia grew by 1%, while in Kazakhstan, it decreased by 1%. in general, there were no significant differences to the previous year’s data.

bONuSES
Bonus percentage of the annual gross salary
1 - 9%
10 - 19%
20 - 29%
30 - 39%
40 - 49%
50 - 59%
60 - 69%
70 - 79%
80 - 89%
18%
31%
19%
8%
4%
5%
2%
1%
1%
17%
29%
17%
9%
6%
4%
1%
0%
1%
Russia Kazakhstan
90 - 100%
> 100%
4%
7%
4%
12%
The most common annual bonus for surveyed managers in the region of 10-19% of the annual fixed salary, which is 2% less than last year. The number of those whose annual bonus ranged from 20-29% remained at the same level. The percentage of middle and senior managers who received under 10% of their salary has slightly increased.
Bonus payments in Kazakhstan were slightly less stable than in Russia. The number of respondents whose bonus payments were 10-19% increased by 3%, while the number who received 20-29% increased by 4%. However, compared with the previous year, there was almost a twofold reduction in the number of managers whose remuneration corresponded to their annual salary.
in both Kazakhstan and Russia, there is still a large number of managers who receive a year-end bonus payment that exceeds their fixed salary.

45
JOB
MA
RK
ET OVER
VIEW
Bonus changes
6% Significantly increased
29% Increased
48% Remained the same
14% Decreased
3% Significantly decreased
7% Significantly increased
34% Increased
51% Remained the same
6% Decreased
2% Significantly decreased
Compared with the results of last year’s survey, 5% fewer respondents in Russia and 3% fewer in Kazakhstan received an increased bonus. In 2012 there had been a slight increase on the previous year.
At the same time, the percentage of respondents whose bonuses remained unchanged has increased by 2% in Russia and 7% in Kazakhstan.While almost a fifth of respondents in Russia reported that their bonus had reduced, only every 12th respondent in Kazakhstan found this to be the case.
RuSSiA
KAzAKHSTAN

RUSSIAGeneral Management .......... 48Sales .................................. 48Marketing ............................ 53Financial Services ................ 54Healthcare ........................... 56Automotive .......................... 56B2B .................................... 58

Supply Chain ....................... 58Production ........................... 59Construction & Real Estate ....................... 60IT ........................................ 62Finance & Accountancy ....... 62Human Resources ............... 64

Job TitleGross Monthly Basic Salary (RUR)
average minimum average maximumCEO (large companies) 320 000 950 000
General Director/Manager (small and medium-sized companies)
280 000 625 000
Head of Representative Office 175 000 580 000
Job titleGross Monthly Basic Salary (RUR)
average minimum average maximumSales Director 230 000 420 000National Key Account Director 275 000 450 000National Key Account Manager 180 000 350 000Senior Key Account Manager 95 000 200 000Key Account Manager 90 000 240 000Regional Sales Manager 70 000 225 000Territory Sales Manager 60 000 190 000Business Development Manager 120 000 315 000Divisional Manager 190 000 380 000
Job titleGross Monthly Basic Salary (RUR)
average minimum average maximumSales Director 150 000 350 000Regional/Area Sales Manager 90 000 150 000
Business Development/Dealer Development Manager
100 000 200 000
Regional Sales/Dealer Development/Business Development Team Leader
130 000 210 000
GENERAl MANAGEMENT
SAlES
FMCG
Automotive

Job titleGross Monthly Basic Salary (RUR)
average minimum average maximumCommercial Director 280 000 430 000Sales Director 195 000 370 000Sales Manager 100 000 310 000National Sales Manager 175 000 220 000Regional Sales Director 160 000 400 000Regional Sales Manager 80 000 230 000Key Account Manager 110 000 270 000
Business Development Manager 180 000 350 000
Job titleGross Monthly Basic Salary (RUR)
average minimum average maximumCommercial Director 300 000 600 000Sales Director 180 000 460 000Sales Manager 120 000 270 000National Sales Manager 170 000 220 000Regional Sales Director 210 000 380 000Regional Sales Manager 100 000 190 000Key Account Manager 135 000 240 000Business Development Manager 160 000 250 000
Job titleGross Monthly Basic Salary (RUR)
average minimum average maximumSales Director 260 000 360 000Sales Manager / Sales Engineer 90 000 150 000Key Account Manager 150 000 250 000Business Development Manager 180 000 240 000Regional Sales Manager 100 000 220 000
49
RU
SS
IA
IT
Telecoms
B2B

Job titleGross Monthly Basic Salary (RUR)
average minimum average maximumCommercial Director 230 000 430 000Sales Director 190 000 350 000Sales Manager 120 000 200 000 Regional Sales Director 180 000 390 000 Regional Sales Manager 150 000 235 000 Territory Sales Manager 160 000 200 000 Key Account Manager 130 000 190 000 Business Development Manager 130 000 280 000
Job titleGross Monthly Basic Salary (RUR)
average minimum average maximumCommercial Director 280 000 550 000Sales Director 140 000 520 000Sales & Operations Director 180 000 290 000Regional Sales Director 130 000 210 000Area Sales Manager 115 000 185 000Key Account Manager 85 000 200 000Store Manager 70 000 180 000
Job titleGross Monthly Basic Salary (RUR)
average minimum average maximumCommercial Director 250 000 480 000Sales Director 155 000 200 000Regional Sales Director (Retail Director)
90 000 240 000
Regional Sales Manager 100 000 170 000Key Account Manager 75 000 150 000Boutique Director 70 000 170 000
SAlES
Oil & Gas (service companies)
Fashion Retail
Luxury Retail

Job titleGross Monthly Basic Salary (RUR)
average minimum average maximumCommercial Director 300 000 700 000Sales Director (Retail Director) 290 000 550 000Regional Manager 140 000 300 000Store Manager 125 000 220 000
Job titleGross Monthly Basic Salary (RUR)
average minimum average maximumCommercial Director 200 000 550 000Sales Director (Retail Director) 120 000 450 000 Regional Manager 100 000 210 000Store Manager 80 000 170 000
Job titleGross Monthly Basic Salary (RUR)
average minimum average maximumSales Director 270 000 400 000National Field Force Manager 210 000 350 000Regional Field Force Director 160 000 250 000Key Account Manager 100 000 180 000Business Development Manager 175 000 265 000
51
RU
SS
IA
Retail - Hypermarkets (S > 5 000 м2)
Retail - Supermarkets (S < 5 000 м2)
Medicine and Pharmaceutics

Eugenia lanichkina, Partner, Consumer Goods & Services
Our Consumer Goods and Services department brings together specialist consultants who are experienced in building teams of professionals in marketing, FMCG , financial services and pharmaceuticals. We are pleased to present you with an overview of current trends in these fields. The general trend for the financial services field, including the banking and insurance sectors, is the stringency of requirements for candidates. Employers pay most attention to the level of education, successful experience and specific achievements of candidates.
Generally, further consolidation is expected in the field of financial services and qualitative changes are coming, which from our point of view should improve the professional level of employees in this area.In the field of marketing, there is an increased demand for middle and senior managers in the FMCG sector and retail. The most popular specialisation is brand marketing. We have noted a significant increase in demand for digital and social media
specialists in the B2C segment. In the area of retail, the ecommerce segment is rapidly growing. The key requirements for ecommerce managers are knowledge of CRM, SEO and experience in promoting online stores. Both Russian and international retail companies point out a stagnation in sales. In this regard, many enterprises have paid attention to improving their quality of service, and some have started rebranding. Ecommerce continues to boom: in retail, the initiation of new projects is accompanied by the launch of ecommerce projects. Some companies are cutting costs, sometimes even resorting to staff reduction, and others are attracting experts from foreign companies to improve the situation. In the field of luxury retail, the world famous brands are quitting Russian distribution companies. For example, over the past two years Tiffany, Gucci, Prada, Burberry, Moncler and etc. have opened their own offices in Russia. It is understandable that the number of candidates who want to move into Western companies have increased. The FMCG labour market is actively growing. Many companies are trying to pay more attention to the building and support of their brands, and as a result, intermediate positions with the word “Group” in the title are appearing. Following the large
companies, this trend has continued with smaller enterprises, which surely pleases those candidates who are interested in top positions. This trend refers not only to account management, but also to procurement, marketing and other areas. Furthermore, the demand for candidates dealing with modern trade in the FMCG sector is much higher than in the traditional trade sphere, meaning that they are offered higher salaries.
New trends are appearing in the pharmaceutical industry, with competition increasing and the struggle for professionals getting tougher. Clinical research is a rapidly growing area in Russia. Clinical research specialists and project managers are constantly in demand. Increased competition makes pharmaceutical companies look for new ways to promote their products and increase the effectiveness of their marketing. A lot of companies face a lack of qualified product managers who are able to develop a competent marketing strategy. In the area of sales, demand is inconsistent. Many employers face a shortage of junior specialists and are ready to interview candidates from other fields, for example, FMCG, subject to their experience in sales. Pharmaceutical companies are also in need of medical advisors, specialists who promote a particular drug from a scientific point of view.

Job titleGross Monthly Basic Salary (RUR)
average minimum average maximumMarketing Director 250 000 625 000Marketing Manager 200 000 250 000Group Brand Manager (GBM) 190 000 350 000Senior Brand Manager 125 000 230 000Brand Manager 100 000 190 000Junior Brand Manager 70 000 110 000Head of Trade Marketing 240 000 330 000Trade Marketing Manager 145 000 220 000BTL Manager 75 000 115 000PR Director 190 000 270 000PR Manager 100 000 150 000Event Director 130 000 180 000Event Manager 65 000 120 000Head of Marketing Research 130 000 260 000Marketing Research Manager 110 000 190 000Ecommerce Director 120 000 350 000Digital Marketing Manager 190 000 300 000Head of Internet Projects 175 000 230 000Internet Project Manager 100 000 180 000Online Marketing Manager 120 000 175 000Online Communication Manager 130 000 200 000Social Media Manager 80 000 160 000
53
RU
SS
IA
MARKETiNG

Job titleGross Monthly Basic Salary (RUR)
average minimum average maximumMD 300 000 550 000Director 170 000 450 000VP 190 000 300 000 Associate 120 000 270 000 Analyst 90 000 160 000
Job titleGross Monthly Basic Salary (RUR)
average minimum average maximumAuto Insurance Manager 60 000 175 000Head of Department (Corporate) 145 000 600 000+Head of Underwriting/Actuary 90 000 170 000Director of Bancassurance 110 000 200 000
fiNANCiAl SERViCES
Capital Markets (ECM, DCM), Corporate Finance, M&A, Trading & Sales, Research
Insurance

Job titleGross Monthly Basic Salary (RUR)
average minimum average maximumChairman of the Board / CEO 350 000 550 000Chief Risk Officer 130 000 800 000Risk Manager 85 000 385 000Head of Retail 130 000 550 000Head of Coverage (Corporate) 80 000 600 000Head of SME 120 000 400 000Head of Distribution 100 000 380 000Head of Marketing/Product 180 000 330 000Branch Manager 75 000 200 000
Relationship/Account/Sales Manager
70 000 350 000
Product Manager - Retail/Consumer
85 000 270 000
Job titleGross Monthly Basic Salary (RUR)
average minimum average maximumSenior Portfolio Manager 170 000 360 000Portfolio Manager 180 000 285 000Head of Portfolio Management/Partner
280 000 400 000
Portfolio/Investment Analyst 80 000 210 000Relationship Manager/Private Banker
70 000 290 000
55
RU
SS
IA
Commercial Banking (Retail & Corporate)
Asset Management / Wealth Management, Private Equity
Top Demanded Professionals:1. Key Account Manager (Leasing) 2. Head of Private Banking (Wealth Management)3. Head of Retail Risk 4. AML (Anti-Money Laundering)

Job titleGross Monthly Basic Salary (RUR)
average minimum average maximum
Head of Medical Department 220 000 320 000
Medical Manager 150 000 280 000Head of Regulatory Affairs Department
240 000 300 000
Regulatory Affairs Manager 130 000 180 000Regulatory Affairs Specialist 75 000 115 000Medical Advisor 90 000 170 000Liaisons 70 000 110 000Quality Assurance Manager 60 000 245 000
CRA/CRM 95 000 120 000Product Manager 120 000 200 000Market Access Manager 130 000 200 000GR Manager 150 000 310 000
Job titleGross Monthly Basic Salary (RUR)
average minimum average maximum
Aftersales Director 140 000 300 000
Aftersales Team Leader 100 000 280 000Aftersales Regional/Area Manager 80 000 150 000Certification and Homologation Manager
160 000 230 000
Quality/Warranty Manager 120 000 200 000Marketing Director 200 000 290 000Communications Team Leader 95 000 175 000BTL and Event Manager 70 000 115 000
ATL Manager 80 000 130 000Aftersales/Dealer Marketing Manager
85 000 120 000
Product/Brand Manager 100 000 190 000
HEAlTHCARE
AuTOMOTiVE
Top Demanded Professionals:1. Product Manager2. Market Access Manager 3. Regulatory Affairs Manager
Top Demanded Professionals:1. Regional Sales Manager2. Aftersales Regional/ Area Manager 3. Dealer Development Manager

57
RU
SS
IA
Vera filatova, Partner, industrial department
The Industrial Goods and Services team at Antal Russia carries out management selection across a wide area. Focusing on specific industry sectors, our consultants are true experts in their specialisations. Most of them have extensive experience within the industry they now recruit for. We have an extensive candidate base covering such practices as B2B, production, natural resources, supply chain and purchasing. We are happy to share our labour market insights.
One of the main trends of the last six months is that counteroffers are happening more often. Most employers are ready to retain
competent people by adding new perks, thus improving the overall package or expanding
the existing list of responsibilities and tasks.
Counteroffers can have various forms such as a new title, higher salary, new working schedule and other improvements to the employee’s package. In most cases, employees are willing to consider a counteroffer and more often than not, accept it.
In the current macroeconomic landscape, we are witnessing an increasing level of competition in the industry. To retain their current market position, companies need to focus on increasing business efficiency and becoming more socially and ecologically responsible. These trends push businesses to look for specialists with a particular skill set and expertise, which makes the ongoing war for talent even fiercer and raises the importance of professional recruiters.
International companies planning to enter the Russian market are actively launching their production facilities within such clusters. In the very near future, new investments from abroad are expected in various industrial specialisations. This will definitely lead to increasing demand for R&D specialists, since the main focus will be on new technologies, mainly from international market leaders, and their launch on Russian production sites. These positions can be successfully filled by experienced professionals from other industries. Industrial construction continues to grow at a decent pace, whereas commercial estate growth has stopped.
Throughout 2013 the professionals in the highest demand were heads of contract departments and design managers.
The logistics market in Russia highly depends on developments in the world’s logistics market. Therefore, opening new representations of international players in Russia and launching new warehouse space affects companies’ plans to hire and fire. The highest demand for professionals is coming from FMCG and production companies. The most desired professionals at the moment are logistics managers, procurement managers, warehouse managers and planning managers. The demand for supply chain managers is still on the rise. Companies need more project managers whose main goals are analysis and optimisation of business processes and cost reduction, as well as correction of delivery schemes. Again, companies are being forced to evolve due to the need to increase the efficiency of management logistics and optimise business processes.

Job titleGross Monthly Basic Salary (RUR)
average minimum average maximum
Planning Manager/Head of planning Department
120 000 200 000
Planning Specialist 70 000 110 000 Logistics Director 160 000 400 000 Logistics Manager 110 000 180 000 Logistics Specialist 65 000 100 000 Purchasing Director 200 000 400 000
Purchasing Manager/Head of Department
130 000 250 000
Purchasing Specialist 90 000 120 000
Warehouse Manager 100 000 180 000
Job titleGross Monthly Basic Salary (RUR)
average minimum average maximum
Service Manager 180 000 270 000
Service Engineer 75 000 135 000
Job titleGross Monthly Basic Salary (RUR)
average minimum average maximum
Service Engineer 120 000 200 000
Field Service Engineer 80 000 160 000HSE Specialist (Manager) 125 000 265 000Project Manager 150 000 250 000
SuPPly CHAiN
*Salary range for Head of Logistics Operations/Supply Chain in large organisations, usually with local production,
can be higher. This position is quite rare so we don’t cover it in a general overview.
b2b
Oil & Gas (Service companies)
Top Demanded Professionals:1. Product Manager2. Market Access Manager 3. Regulatory Affairs Manager
Top Demanded Professionals:1. Sales Manager2. Business Development Manager3. Transportation Manager

Job titleGross Monthly Basic Salary (RUR)
average minimum average maximumSales and Marketing Director 200 000 400 000*Sales Manager (4+ years of work experience) 115 000 130 000
Key Account Manager 120 000 150 000 Customer Service Specialist 75 000 110 000
Business Development Manager 120 000 200 000
Operations Director 200 000 350 000 Transportation Manager 140 000 280 000Warehouse Director 200 000 350 000
Warehouse Manager 150 000 250 000Head of Business Development 160 000 250 000Head of Customs Department 180 000 260 000
Job titleGross Monthly Basic Salary (RUR)
average minimum average maximum
Managing Director (Several Plants) 450 000 600 000
Plant Manager 220 000 450 000Operations Manager 130 000 270 000 Technical Director 180 000 300 000 Chief Engineer 80 000 180 000 Head of Laboratory 70 000 150 000 Chief Mechanical Engineer 80 000 120 000 Production Manager 90 000 250 000
Chief Technologist 80 000 200 000R&D Manager 80 000 250 000R&D Director 200 000 500 000Quality Director 250 000 350 000 Quality Manager 80 000 220 000HSE Manager 80 000 200 000 Product Developer 50 000 130 000 Process Engineer 50 000 150 000LEAN Manager 180 000 300 000 TPM Coordinator* 70 000 150 000
59
RU
SS
IA
* Salary range depends on the structure, volumes and company size.
PROduCTiON
*the minimum is common for TPM Coordinator roles in Russian regions
Top Demanded Professionals:1. Planning Specialist2. Logistics Manager3. Warehouse Manager
Top Demanded Professionals:1. R&D Manager2. Maintenance Manager 3. Quality Manager

Job titleGross Monthly Basic Salary (RUR)
average minimum average maximum
Real Estate Director 75 000 280 000
Project Manager 80 000 250 000Development Director/Manager 120 000 480 000Chief/Senior Architect 90 000 120 000Head of Construction/Construction Manager
85 000 230 000
Head of Leasing 135 000 180 000Leasing Manager 80 000 120 000 Electrical Engineer 45 000 90 000
Mechanical Engineer 55 000 105 000Chief Engineer 90 000 170 000Technical Director 160 000 230 000Facilities Manager 75 000 140 000Expansion Manager 65 000 170 000HSE Engineer 55 000 105 000Centre Manager 135 000 230 000Tenant Coordinator 70 000 90 000
CONSTRuCTiON & REAl ESTATE
Top Demanded Professionals:1. Expansion Manager2. Construction Manager3. Leasing Manager

61
RU
SS
IA
luc Jones, Partner, Support functions
The consultants from our combined financial and HR practices recruit talented professionals for companies in all industries. Recruitment in the IT sphere is divided into two branches:
• Professionals responsible for selling IT solutions
•Techniciansofdifferentlevelsforthe internet business, the banking sector, system integrators, telecom operators and manufacturers of IT and telecom equipment.
There have been a lot of cases of relocation in the financial practice lately. Business is developing rapidly in the regions. That’s why
companies need high level financial specialists ready to tackle a broad range of tasks
locally.
While the main stream of candidates used to be from Moscow and St. Petersburg to the other regions, there is now an active movement of candidates throughout the regions.
In the field of HR, professionals with an economic or legal education are highly valued. Production companies pay attention to the mention of a technical college in a CV. Many employers are looking for professionals who are experienced in implementing changes and understand development tools. Most often these requirements apply to C&B managers and HR managers for small enterprises.
Over the last year many large IT vendors have conducted a global restructure, which has led to huge staff reduction in some cases. The number of vacancies in IT companies has decreased, and most professionals aren’t in a hurry to change jobs because of this instability.
Due to the political and economic situation, many American IT companies are reducing sales in Russia, which reflects the reduction of headcount. At the same time, new international players are entering the Russian market. As to system integrators, they are developing and increasing business volumes because of new projects in the public sector.
International companies are actively globalising their IT processes. The majority of local IT services are being outsourced or integrated into the global IT function, so the role of the local IT manager is becoming less supervisory and more coordinative. The main requirements for these positions are good communication skills, successful experience of cooperation with suppliers and work experience in a multinational team. Some IT directors, after a long time working in Russian companies and being established as experts in the technical sphere, can’t effectively collaborate with internal business units and adjust to the new market demands. In such situations, a new position emerges for a “second IT director,” who is responsible for interacting with business units and promoting new, innovative ideas. This role aims to retain important employees and establish communication between different parts of the business.

Job titleGross Monthly Basic Salary (RUR)
average minimum average maximumIT Director/CIO 180 000 470 000IT Manager 75 000 280 000Project Manager 100 000 230 000Telecommunications Project Manager
80 000 270 000
IT Architect 135 000 235 000Business/Systems Analyst 80 000 150 000Developer/Analyst 120 000 160 000Programmer 110 000 145 000
Consultant (ERP/CRM) 95 000 205 000Pre-Sale Engineer 70 000 150 000Information Security Specialist 80 000 120 000Service Engineer 65 000 110 000
System Administrator/Data Base Administrator
95 000 135 000
Technical Support Specialist 75 000 120 000Network Engineer 60 000 175 000
Job titleGross Monthly Basic Salary (RUR)
average minimum average maximumTax Manager 130 000 300 000Tax Specialist 110 000 140 000Head of Internal Audit 140 000 280 000Internal Auditor/Controller 85 000 200 000
iT
fiNANCE ANd ACCOuNTANCy
Tax/Audit/Control
Top Demanded Professionals:1. SAP Consultant 2. Business/Systems
Analyst (especially in banking sector)
3. Infrastructure Support Manager
4. IT Manager

Job titleGross Monthly Basic Salary (RUR)
average minimum average maximumCFO 500 000 1 000 000Finance Director 200 000 600 000Deputy Finance Director 165 000 470 000Business Controller 100 000 200 000Finance Controller 110 000 290 000
Finance Manager 125 000 300 000
Head of Budgeting / Budgeting Manager
140 000 240 000
Head of IFRS/GAAP Reporting 160 000 245 000
IFRS/GAAP Specialist/Accountant
80 000 125 000
Finance Analyst 70 000 170 000Credit Controller 90 000 130 000Cost Controller 65 000 135 000Management Accountant 50 000 160 000
Job titleGross Monthly Basic Salary (RUR)
average minimum average maximumChief Accountant 120 000 260 000CA/Financial Manager 90 000 230 000Deputy Chief Accountant 115 000 185 000Accountant (AR/AP) 65 000 135 000Senior Accountant 70 000 100 000Payroll Accountant 60 000 120 000
63
RU
SS
IA
Finance
Accountancy

Job titleGross Monthly Basic Salary (RUR)
average minimum average maximumHR Director 130 000 480 000HR Manager 90 000 200 000HR Specialist 80 000 130 000HR Business Partner 90 000 270 000Employer Branding Manager 130 000 210 000
Head of Compensation & Benefits
140 000 320 000
Compensation & Benefits Manager
95 000 215 000
Compensation & Benefits Specialist
70 000 120 000
Head of Training & Development 130 000 370 000
Training & Development Manager 100 000 210 000
Training & Development Specialist
65 000 135 000
Head of Recruitment 80 000 200 000
Recruitment Manager 70 000 180 000
Head of HR Administration 150 000 200 000
HR Administration Manager 65 000 120 000
Head of Internal Communications 150 000 220 000
Internal Communications Manager
90 000 160 000
HuMAN RESOuRCES
Top Demanded Professionals:1. HR Generalist2. HR Plant Manager3. Compensation & Benefits Manager

65
RU
SS
IA

KAZAKHSTANTop Management ................ 68Sales .................................. 70Marketing ............................ 72Finance & Accountancy ........ 73Human Resources ............... 74IT ........................................ 74

Supply Chain Management & Production ....................... 75Banking ............................... 76Healthcare ........................... 78Oil and Gas ......................... 78Mining Sector ...................... 79Automotive .......................... 79

Job titleGross Monthly Basic Salary (USD)
average minimum average maximum
fMCGCommercial Director 6 500 12 000Sales Director 3 800 11 500
National Key Account Manager 3 200 4 500
iTSales Director 5 000 10 000
Key Account Manager 3 600 6 500
Regional Sales Director 3 500 6 000
TelecomsSales Director 4 000 10 500
Business Development Manager 2 600 7 000
Sales Manager 2 500 6 500
b2b Business Development Manager 3 600 6 000
Regional Sales Director 2 000 7 000
Oil & Gas (Service Companies)Sales Director 5 000 11 000
Sales Manager 3 500 9 000
Regional Sales Director 3 700 10 000
TOP MANAGEMENT

Job titleGross Monthly Basic Salary (USD)
average minimum average maximum
Supply Chain Management (logistics and Purchasing)
Logistics Director 6 000 10 000Purchasing Director 3 000 8 000
Purchasing Manager 3 000 7 000
Logistics Manager 2 400 4 500
Production, Technology, Engineering
Plant Manager 4 000 9 000
Operations Manager 3 000 8 000
Technical Director 3 500 8 000
Chief Engineer 3 000 6 000
Job titleGross Monthly Basic Salary (USD)
average minimum average maximum
Commercial banking (Retail & Corporate)
Country Head/CEO 19 000 45 000Chief Risk Officer 5 000 7 500
Head of Marketing/Product 4 000 7 000
Branch Manager 5 500 6 500
Head of Coverage (Corporate) 4 500 6 200
Head of Retail 3 800 5 500
Asset Management/Wealth Management, Private Equity Senior Portfolio Manager 3 500 13 000
Head of Portfolio Management/Partner
5 000 10 000
Portfolio Manager 3 000 4 000
Relationship Manager/Private Banker
2 000 8 500
Portfolio/Investment Analyst 1 600 6 000
69
KA
ZAK
HSTA
N

Job titleGross Monthly Basic Salary (USD)
average minimum average maximumCommercial Director 6 500 12 000Sales Director 3 800 11 500National Key Account Manager 3 200 4 500Key Account Manager 2 100 3 100Regional Sales Manager 1 800 3 200Territory Sales Manager 1 600 3 000Business Development Manager 2 200 5 500
Job titleGross Monthly Basic Salary (USD)
average minimum average maximumSales Director 4 500 9 000RSM Team Leader 3 500 8 600Regional/Area Sales Manager 3 200 4 500Business Development Manager 2 000 2 500Key Account Manager 2 000 4 000
Job titleGross Monthly Basic Salary (USD)
average minimum average maximumSales Director 5 000 10 000Sales Manager 2 800 4 500Regional Sales Director 3 500 6 000Regional Sales Manager 2 500 6 000Key Account Manager 3 600 6 500Business Development Manager 2 800 8 000
SAlES
FMCG
Automotive
IT

Job titleGross Monthly Basic Salary (USD)
average minimum average maximumSales Director 4 000 10 500Sales Manager 2 500 6 500Regional Sales Director 2 800 6 000Territory Sales Manager 2 000 5 000Key Account Manager 2 700 5 500Business Development Manager 2 600 7 000
Job titleGross Monthly Basic Salary (USD)
average minimum average maximumSales Manager 2 000 4 500Sales Engineer 1 700 3 000Regional Sales Director 2 000 7 000Regional Sales Manager 1 500 6 000 Key Account Manager 2 800 6 000Technical Key Account Manager 1 800 5 000 Business Development Manager 3 600 6 000
Job titleGross Monthly Basic Salary (USD)
average minimum average maximumSales Director 5 000 11 000Sales Manager 3 500 9 000Regional Sales Director 3 700 10 000Regional Sales Manager 3 000 6 500Territory Sales Manager 2 500 6 500Key Account Manager 2 100 5 500Business Development Manager 4 000 6 000
71
KA
ZAK
HSTA
N
SAlES
Telecoms
B2B
Oil & Gas (service companies)

Job titleGross Monthly Basic Salary (USD)
average minimum average maximumMarketing Director 7 000 11 000Marketing Manager 4 000 7 000Group Brand Manager (GBM) 3 500 5 000Senior Brand Manager 3 100 5 000Junior Brand Manager 2 800 4 500Trade Marketing Manager 3 000 4 500PR Manager 2 800 3 500
MARKETiNG

Job titleGross Monthly Basic Salary (USD)
average minimum average maximumCFO/Finance Director 5 000 14 000Deputy Finance Director 3 000 5 000Business Controller 2 500 4 400Finance Controller 4 000 5 500Finance Manager 4 000 5 000Head of Budgeting/Budgeting Manager
2 500 3 800
Head of IFRS/GAAP Reporting 1 700 3 500
IFRS/GAAP Specialist/Accountant
1 200 2 500
Finance Analyst 2 000 3 000Credit Controller 2 000 2 500
Job titleGross Monthly Basic Salary (USD)
average minimum average maximumChief Accountant 3 000 4 500CA/Financial Manager 3 500 5 500Deputy Chief Accountant 2 300 3 000Accountant (AR/AP) 1 200 2 000Senior Accountant 1 700 2 500Payroll Accountant 1 000 1 600
Job titleGross Monthly Basic Salary (USD)
average minimum average maximumTax Manager 3 700 4 500Tax Specialist 1 300 2 500Head of Internal Audit 2 800 3 400Internal Auditor/Controller 2 000 3 000
73
KA
ZAK
HSTA
N
fiNANCE ANd ACCOuNTANCyFinance
Accountancy
Tax/Audit/Control

Job titleGross Monthly Basic Salary (USD)
average minimum average maximumHR Director 6 000 10 000HR Manager 3 500 6 000HR Specialist 2 000 3 000HR Business Partner 2 700 4 000
Head of Compensation & Benefits
3 800 5 500
Compensation & Benefits Manager
2 500 4 500
Compensation & Benefits Specialist
2 000 3 000
Job titleGross Monthly Basic Salary (USD)
average minimum average maximumIT Director/CIO 4 500 12 000IT Manager 2 500 6 000IT Consultant 2 000 5 000Project Manager 3 000 10 000Telecommunication Project Manager
3 000 7 000
Developer/Analyst 2 000 5 000Programmer 2 000 4 500Consultant (ERP/CRM) 2 500 8 000
Pre-Sale Engineer 2 500 6 000Informational Security Specialist 2 000 3 500Service Engineer 1 500 3 000System Administrator 1 200 4 000Technical Support Specialist 1 000 2 500
HuMAN RESOuRCES
iT

Job titleGross Monthly Basic Salary (USD)
average minimum average maximumLogistics Director 6 000 10 000Logistics Manager 2 400 4 500Transportation Specialist 1 700 2 500Import Manager 1 500 3 000Purchasing Director 3 000 8 000Purchasing Manager 3 000 7 000Purchasing Specialist 2 000 4 000
Logistics/Supply Chain Manager 2 500 4 000
Warehouse Manager 2 000 4 000
Job titleGross Monthly Basic Salary (USD)
average minimum average maximum
CEO 6 000 14 000
Deputy GM 5 000 10 000
Service Engineer 1 000 3 000
Plant Manager 4 000 9 000
Operations Manager 3 000 8 000 Technical Director 3 500 8 000 Chief Engineer 3 000 6 000 Head of Laboratory 2 500 4 000 Chief Mechanical Engineer 1 400 3 500 Production Manager 3 500 8 000 Chief Technologist 1 500 5 000
Quality Manager 2 000 5 000HSE Manager 2 500 6 000Process Engineer 1 200 3 000
75
KA
ZAK
HSTA
N
SuPPly CHAiN MANAGEMENT (lOGiSTiCS & PuRCHASiNG)
PROduCTiON

Job titleGross Monthly Basic Salary (USD)
average minimum average maximum
MD 17 000 21 000
Director 11 000 17 000VP 7 000 15 000Associate 3 500 6 500Analyst 2 500 7 000
Job titleGross Monthly Basic Salary (USD)
average minimum average maximumCountry Head / CEO 19 000 45 000Chief Risk Officer 5 000 7 500Head of Coverage (Corporate) 4 500 6 200Head of Retail 3 800 5 500Head of Marketing/Product 4 000 7 000Branch Manager 5 500 6 500Relationship/Account/Sales Manager
2 000 4 000
Credit Analyst 1 500 3 000Head of Treasury 3 500 6 000
bANKiNG
Commercial Banking (Retail & Corporate)
Investment Banking – Front Office Capital Markets (ECM, DCM), Corporate Finance, M&A, Trading & Sales, Research)

Job titleGross Monthly Basic Salary (USD)
average minimum average maximumSenior Portfolio Manager 3 500 13 000Portfolio Manager 3 000 4 000Head of Portfolio Management/Partner
5 000 10 000
Portfolio/Investment Analyst 1 600 6 000Relationship Manager/Private Banker
2 000 8 500
77
KA
ZAK
HSTA
N
Asset Management / Wealth Management, Private Equity

Job titleGross Monthly Basic Salary (USD)
average minimum average maximum
Regional Manager 1 400 2 900
Product Manager 4 000 4 000Medical Representative 1 400 1 400
Job titleGross Monthly Basic Salary (USD)
average minimum average maximum
Drilling Superviser 3 000 9 000
Drilling Engineer 2 000 6 500Geologist 3 500 5 500
HSE Manager 3 000 7 000
Geophysicist 2 000 5 000
HEAlTHCARE
Oil ANd GAS SECTOR (SERViCE COMPANiES)

Job titleGross Monthly Basic Salary (USD)
average minimum average maximum
Mining Engineer 4 000 12 000
Geologist 3 000 9 000Ecologist 2 700 8 000
Job titleGross Monthly Basic Salary (USD)
average minimum average maximum
Aftersales Director 2 400 3 000
Aftersales Regional/Area Manager 2 000 3 500Quality Manager 2 100 4 000
Marketing Director 2 500 4 500
Brand Manager 2 200 4 000
Product Manager 1 800 3 000
79
KA
ZAK
HSTA
N
MiNiNG SECTOR
AuTOMOTiVE

diSClAiMER
We thank all participants of the survey, who helped us to collect some interesting data and monitor the actual changes in the labour market.
We will be grateful if you could help us next year with the same goal.
This research was carried out by means of an electronic questionnaire and supplemented with data and market information that Antal Russia and Antal Kazakhstan have access to. The results are provided as generic market information only. We do not
make any warranties regarding the use, validity, accuracy or reliability of the results and information obtained. We will not be liable for any damages of any kind arising out of or relating to use of this information.
ACKNOWlEdGEMENTS


Executive Recruitment
A member of:
+7 (499) 550 23 83 [email protected]
www.antalrussia.com
+7 (727) 261 90 95/96 [email protected]
www.antalkazakhstan.com
Sign up for our quarterly Newsletter www.antalrussia.com/newsletter-signup
Read our regular salary surveys www.antalrussia.com/salary-survey
Connect with us
Connect with us
Antal Russia
Antal Kazakhstan