antecedents of firm performance in emerging economies: business
TRANSCRIPT

Antecedents of firm performance in emerging
economies: Business groups, strategy, industry
structure, and state support
Solmaz Filiz Karabag and Christian Berggren
Linköping University Post Print
N.B.: When citing this work, cite the original article.
Original Publication:
Solmaz Filiz Karabag and Christian Berggren, Antecedents of firm performance in emerging
economies: Business groups, strategy, industry structure, and state support, 2014, Journal of
Business Research, (67), 10, 2212-2223.
http://dx.doi.org/10.1016/j.jbusres.2014.01.004
Copyright: Elsevier
http://www.elsevier.com/
Postprint available at: Linköping University Electronic Press
http://urn.kb.se/resolve?urn=urn:nbn:se:liu:diva-105723

Antecedents of Firm Performance in Emerging Economies:
Business Groups, Strategy, Industry Structure, and State Support
Solmaz Filiz Karabag, Linköping University
Christian Berggren, Linköping University
Submission: January 2011
Revision: September 2013
Acceptance: December 2013
Acknowledgements: The authors are grateful to Arch Woodside, Ali Danisman, Ünal
Ay, Farrukh Suvankuov, Alisher Akhmedjonov, Ebru Ayas, S. Nazli Wasti Pamuksuz and
Michael A. Hitt, for their helpful comments and suggestions to earlier versions of this paper.
The authors also thank De Martin for her editorial input and Tobias Gerdin for his R
programing and Relaimpo support. The data collection of this study was partly financed by
Cukurova University Research Center (project IIBF2006D1) and the analysis by funding from
VINNOVA, Sweden.
Please send correspondence to Solmaz Filiz Karabag, Department of Management and
Economics, Linköping University, SE-581 83 Linköping/Sweden. Telephone: + 46 13 282520
([email protected]); Christian Berggren, Linköping University, Department of
Management and Economics SE-581 83 Linköping, Sweden, Telephone: +46 13 281500

ABSTRACT
A rich literature has investigated the antecedents of firm performance in developed
economies, resulting in a consensus view that firm resources and strategy are the key
determinants. Several arguments, however, suggest that in emerging economies other factors
are more important for firm performance. This study analyzes the impact of firm strategy and
industry structure as well as business group membership and state support on firm
performance in an advanced emerging economy, Turkey. Using a data set compiled from a
selection of the 1,000 largest manufacturing firms in this country, the study employs several
regression models to identify the main determinants of firm performance as measured by
productivity and net profit margin. In contrast to studies of developed economies, the
investigation finds that firm-related factors (competitive strategies) do not significantly
influence performance; instead factors related to industry structure and business group
membership are the strongest determinants of firm performance; further, state support
interacts with business group membership and is positively related to productivity.
Keywords: Industry structure, business group, competitive strategies, state support,
firm performance, emerging economy.

Antecedents of Firm Performance in Emerging Economies:
Business Groups, Strategy, Industry Structure, and State Support
1. Introduction
Which key factors make some firms more successful than others? This issue has been
a central question in strategic management studies since the beginning of the field in the
1950s. According to the classical answers, industry structure is the main determinant of both a
firm’s strategy and its performance (Bain, 1959). Later studies, however, demonstrate that
industry characteristics alone cannot explain all variation in firm performance. These findings
lead to the query why firms within the same industry perform differently (Spanos, Zaralis, and
Lioukas, 2004).
Stimulated by research on firm resources (Penrose, 1959) and competitive strategy
(Porter, 1980), a multitude of studies have analyzed the impact of industry structure versus
firm resources, for example Spanos et al. (2004). During recent years, a consensus has
emerged that firm strategy and resources tend to be more important than industry structure in
influencing performance, at least in developed OECD-economies. An increasing number of
firms competing in global and national markets originate in emerging countries, however, and
as Kim and Lim (1988) noted more than twenty years ago, these economies tend to have
different institutional structures, and these differences may have significant consequences for
firm performance. A distinguishing factor is the role played by large diversified business
groups (Nair and Kotha, 2001). According to Chang and Hong (2002), the top thirty business
groups contribute to 40% of Korea´s total output; and in Russia, 22 large business groups
account for almost half of total sales (Guriev and Rachinsky, 2005). Several studies have also
demonstrated a positive relationship between business group and firm performance (e.g. Yiu,
Bruton and Lu, 2005). Another difference between developed and emerging economies

concerns the role of state interventions in the economy. Several studies of Korea (Amsden,
1989; Amsden and Wan-wen, 2003) or China (Altenburg, Schmitz, and Stamm, 2008)
demonstrate the importance of state and government initiatives, and this tends to be a general
phenomenon in emerging economies, including Turkey (see Boratav, 2006; Kazgan, 2004).
Considering these differences, strategy research needs to specifically study factors
impacting firm performance in emerging economies. This paper contributes to such an
analysis by studying four types of factors influencing the performance of emerging economy-
firms: strategy, industry structure, state support and membership in business groups. Kearney
(2012) points out the lack of general agreement concerning how to categorize countries as
emerging economies. This paper builds on the classifications used by the Financial Times
Stock Exchange (FTSE), and Morgan Stanley Capital International. Both classify Turkey as
an emerging economy, in the FTSE system as an “advanced emerging economy”, ranked as
No. 16 in the global ordering of economies based on purchasing power adjusted GDP
(Kearney 2012:161). Using data from 231 large manufacturing companies in Turkey, the
study makes use of several different methods to investigate the key factors impacting firm
performance, and to ascertain the relative role of firm strategies compared to industry factors.
The following section presents an overview of the literature regarding factors
influencing firm performance, and formulates hypotheses related to the impact of industry
structure, strategy, state support and business group membership. Next, the method section
provides details on data collection, the dependent and independent variables, and the methods
used: hierarchical regression and importance analysis. The results section reports the main
findings in relation to the hypotheses and additional explanatory variables. The concluding
section summarizes the results and discusses ways to interpret the key findings. The paper
ends with listing some limitations and suggestion for future research.
2. Theoretical Framework and Hypotheses
2.1. The role of structure on performance
Historically, industrial organization researchers claimed that industry structure
determines firm performance (Bain, 1956). Several different dimensions of industry structure
have been used; two of the most common being competitive intensity and threat of substitute
products or services (Porter, 1980; Powell, 1996). Researchers such as Spanos et al. (2004)
have included related aspects e.g. industry concentration, entry barriers and growth as
important industry dimensions. A rich literature in the United States has attempted to establish
the precise impact of industry structure on firm performance but the results vary considerably,
from significant and substantial, explaining 30% of firm performance as measured by return
on assets (McGahan and Porter, 2003), to significant but very small (Adner & Helfat, 2003).
Studies in Europe have found significant but rather small impact of industry characteristics on
performance, Spanos et al. (2004); for example, report an impact of industry on performance
at around 7%. As for Japan, Kotha and Nair (1995), however, observed a very high impact of
industry on firm performance.
Less research of this type exists in emerging economies, but published studies indicate
a strong impact of industry characteristics on firm performance in these countries. In Korea,
for example, Chen (2010) observes a very high industry impact on the performance of IT
firms. Studies of Chinese firms also report a strong impact of industry structure and Luo
(1999) e.g. noticed that factors such as general sales growth increase in the number of firms in
the industry, and industrial uncertainty levels significantly affected the performance of firms.
As for Turkey, Karabag (2008) found that industry structure had a significant impact on firm
performance.
On the basis of these studies, and the standard argument in studies in developed
economies that competitive intensity, threat of substitute products, threat of suppliers and low

entry barriers will negatively affect firm performance (Porter, 1980) this paper proposes the
following Hypothesis H1: Industry characteristics, defined according to the dimensions above,
have a significant negative impact on firm performance in emerging economies.
2.2. The impact of strategy variables
Firm strategy and resources constitute another group of factors influencing firm
performance. According to Porter (1980), a firm can build its performance by implementing
one of three core strategies: differentiation, low-cost, or focus. This is one of most used
typologies of competitive strategies (e.g. Gopalakrishna and Subramanian, 2001), and will
also be used in this paper. Although a few researchers report a small or insignificant impact of
firm factors on performance (cf. Schmalensee¸1985), most studies of American firms show
that firm factors significantly explain performance (Davis and Schul, 1993). Porter (1980)
strongly suggests that competitive strategies differ from each other in distinctive ways.
Empirical studies in several countries, however, show that a combination strategy might be a
complementary alternative (Hill, 1988). Thus, for example, the European study by Spanos et
al. (2004) analyzes three different strategies (low cost, differentiation, and combination) and
finds them to significantly affect firm performance.
Some studies in emerging economies also report a significant impact of firm
strategies. Using the Miles and Snow-typology (1978), prospector, analyzer, defender and
reactor, Tan and Litschert (1994) find the defender strategy to significantly explain
performance, whereas the other strategies do not have any significant effects. The authors
explain this by referring to the Chinese economic environment with its high level of
uncertainty, where firms tend to prefer defensive strategies. The present study will test the
impact of firm strategies on performance in Turkey, using the Porter classification, including
combination strategy. The study suggests hypothesis H2: Firm strategy in emerging
economies has a positive and significant impact on firm performance.
2.3. Comparison of the Impact of Strategy and Structure on Firm Performance
According to the original proposition in industrial organization theory, industry
structure is a primary antecedent of firm performance, whereas recent studies in OECD-
economies find strategy to be more important for performance (McGahan and Porter, 2002;
Galbreath and Galvin, 2008). Studies of industry versus strategy outside the OECD core, for
example in Taiwan and China, tend to report a weaker impact of strategy factors. The study of
Tans and Litschert (1994) of firms in the Chinese electronic industry, using the Miles-Snow
framework, find no significant relations between most of the studied strategies and firm
performance. In a study of Taiwanese firms, Duh, Chow and Chen (2006) do not observe any
positive relation between strategy and firm performance; Dong, Liu and Yin (2008) only find
insignificant relations between strategy and performance in their study of Chinese firms.
Kotha and Nair (1995) report a much higher impact of industry factors than firm factors also
in Japan. Using growth as a performance indicator they find firm factors to be almost
insignificant (p>0.05), and none of the studied firm factors is significantly related to this
measure of performance. Summarizing this study Ofori-Dankwa and Julian (2012: 13) argue
that “conventional wisdom drawn from developed nations….” cannot be totally employed in
emerging economies and in some cases that wisdom “might work in the opposite direction”.
Studies in financial economics using stock market returns as an indicator of firm
performance try to explain the strong impact of industry on performance in emerging
economies. One important aspect is the high share of non-operating income in some
industries, especially in times of economic volatility (Bai and Green, 2010; Cavaglia,
Brightman and Aked, 2000; Phylaktis and Xia, 2006). As Kearney (2012: 162) points out,
“greater uncertainty and risk” is a common feature of emerging economies. Another factor is
the high (but uneven) growth characterizing these economies, implying that firms tend to
invest in general growth rather than in development of any specific strategy. Already

Abegglen and Stalk (1987) observed this paramount importance for firms of investing in
growth to maintain market shares in their classical analysis of Japan´s high-growth era.
Turkey presents an industrial context similar to other late industrializing countries,
with a quadrupling of GDP from 1970 to 2005 and with recurring financial crisis and
volatility, including nine destructive crises between 1980 and 2002. In a recent study,
Efendioglu and Karabulut (2010) do not observe any significant relation between firm factors
and performance. In another study Karabag (2008) argues that industry can affect firm
performance more than firm factors but her study, based on subjective (perceived)
performance does not confirm this, although several circumstances point to a huge variation
in industry characteristics in Turkey. Some sectors display high levels of concentration, with
significant entry barriers (Zeybek, 2005) related to traditions of state intervention and
protection (Kazgan, 2004).
Other sectors (e.g. vehicles, paper products and printing, food, beverage, furniture,
apparel and leather) are exposed to intensive international and domestic competition (Zeybek,
2005). Studies of R&D and innovation of Turkish firms underline this variation between
sectors. Whereas firms in the automotive and home appliance industries show a significant
increase of R&D investments in the last decade, other sectors exhibit an opposite trend
(Karabag and Berggren, 2011). Building on the studies of emerging economies referred to
above, and available evidence of the uneven characteristics of Turkish industries, the study
suggests the following hypothesis H3: The impact of industry structure on firm performance is
higher than the impact of firm strategies.
2.4. The Impact of State Support on Firm Performance
In her classical study of Korea, Amsden (1989:8) emphasizes two particular
“institutions of late industrialization… an interventionist state and large diversified business
groups”. In developed countries, the state is supposed to maintain the same distance to all

market actors and to encourage market competition (Austin, 1990). In emerging economies,
however, the state tends to intervene in the market competition in several different ways
(Christmann, Day, and Yip, 1999) and to function as a resource allocator in many industries
(Yaprak and Karademir, 2010). In their study on firms from Pakistan, Malik and Kotabe
(2009: 421) observe that “organizational learning combined with input supporting
government policies enhanced firm performance”.
Modern Turkey was founded on the ashes of the Ottoman Empire, after the
Independence War 1920-1923, when all the non-Muslim entrepreneurial population left
Turkey. To compensate for the country´s low level of industrial and entrepreneurial activities
(Kazgan, 2004), a regime of etatisme emerged, i.e. “a system with a significant degree of
centralized economic planning which may include state ownership of the means of
production” (Close, Askew and Xu, 2007: 64). This meant that the state intervened and
started state-owned firms in basically all sectors (Herslag, 1984). When private businesses
started to grow, they concentrated on local markets as contractors to the state or suppliers to
state-owned companies (Boratav, 1981).
During the 1950s the Turkish state developed a regime of import substitution (Keyder,
1987). Enjoying high tariff protection, private businesses invested in consumer goods for
local demands on the basis of licensing agreements with international firms. In the 1980s,
Turkey changed her economic policy to export promotion, inspired by Korea and other fast-
growing countries (Kazgan, 2004). Some sectors, such as textiles, garment, food and leather,
used these incentives and the availability of low-cost labor to increase their exports, but in
most sectors, firms remained focused on the domestic market. The signing of a customs union
agreement with the European Union in 1996 ended the policy of tariff protection for
manufactured goods. This significantly increased the degree of international competition in
industries such as autos and pharmaceuticals, but did not comprehensively affect the domestic

industrial concentration ratios (Zeybek, 2005). The state remains an important resource
allocator, controlling the entry in industries such as energy, telecommunications, banking, and
construction materials and also actively supports internationally competing manufacturing
industries, such as autos (Karabag, 2008; Karabag & Berggren 2011).
The present study acknowledges the role of state support for firm performance
(Boratav, 1981; Bugra 2008, Hoskisson, Wright, Filatotchev and Peng, 2012; Malik and
Kotabe, 2009; Özen and Akkemik, 2012; Özen and Özen, 2009), although the indirect effects
of state interventionism, for example on industry structure, cannot be measured. The study
proposes the following hypothesis. H4: State support affects firm performance positively.
More specifically, the study expects state support to be biased towards more focused and
internationally oriented operations, and correlated with higher levels of productivity.
2.5. The Impact of Group Membership on Firm Performance
Diversified business groups are another important characteristic in emerging
economies. Studies in several Asian countries report a strong positive relationship between
being member of a business group and firm performance, in Korea (Chang and Hong, 2002)
as well as India, Indonesia and Taiwan (Khanna and Rivkin, 2001). In Turkey, too, diversified
business groups play a large role (Yurtoglu, 1999), and of the fifty largest economic players
in 2005, as indicated by number of employees, 28 belonged to this category (Colpan and
Hikino, 2010). State-owned enterprises used to be another main group of large enterprises,
but these firms are increasingly being privatized, and sold to the private business groups.
Almost all business groups in Turkey are diversified, with businesses in highly unrelated
markets. The leading Koc group, for example, operates in industries from automotive,
consumer electronics, food, retail and petrochemicals, to banking and insurance, tourism and
construction. Unrelated diversification characterizes both the old generation of groups (e.g.,
Koc, Sabanci, Cukurova and Yasar) founded in the 1930s – 1950s period, and newer groups

which started to expand in the 1980s, such as the Zorlu and Boydak. Analysts and
policymakers expected the increase in international competition following the liberalization of
the Turkish economy to encourage specialization and focus. Colpan and Hikino (2010) note,
however, that growth by diversification persists, and may be seen as an important factor for
the orientation of Turkish top managers.
Prior studies of business groups in Turkey have investigated specific aspects such as
institutional arrangements and degree of diversification (i.e. Bugra, 2008; Yaprak and
Karademir, 2010). Based on accounting reports, Gönenç, Kan, and Karadağli (2004) report a
positive relationship between group membership and firm performance. Otherwise few
studies examine the general impact of business group membership on firm performance. In
the light of this literature, the paper suggests the following hypothesis H5: Group membership
affects firm performance positively. Furthermore, a positive interaction effect between state
support and business group membership could be expected.
3. The Model
This study calculates the relationships between firm performance and the independent
variables based on the common profitability equation (Kotha and Nair, 1995:499). According
to this equation, profitability is a function of controllable and uncontrollable independent
variables, as presented below.
Yit = β0 + β1Xi (t-1) + β2 Zi (t-1) + β3 Ki (t-1) + β4Si (t-1) + εi (1)
Herein, Yit is the performance of firm i in a year t (i.e. 2008), β0 is the constant, where
the regression line intercepts the y axis, representing the value of Y when the independent
variables are 0. Xi (t-1), Zi (t-1), Ki (t-1) and Si (t-1) represent the independent variables related to

group membership, industry structure, state support and firm strategies in a lagged year
(2007). Several authors, for example Spanos et al. (2004), suggest the use of lagged years in
the independent variables based on the argument that the results of a strategy or the impact of
external variables cannot be observed immediately.
4. Methods: Data and Statistical Procedure
The empirical analysis in this paper builds on a survey of the 1000 largest
manufacturing firms in Turkey listed by the Istanbul Chamber of Industry (ISO) in 2008. Of
these firms, 967 companies included contact information and financial data in this public list,
such as sales, net profits and number of employees. Therefore the performance variables
could be calculated directly from the list. Following Chakravarthy’s advice (1986) the paper
uses two ways of measuring performance: net profit margin (NPM) calculated as the ratio of
net profits to total sales; and productivity, based on the firm’s value added divided by its
number of employees.
The data for the independent variables were gathered via a structured survey sent to
the CEOs of these 967 firms, 243 of whom responded. Twelve surveys were not useful for
this study; omitting those, the response rate was calculated at 23%. The survey contains items
to measure the four types of variables discussed above: industry structure, competitive
strategies, state support and group membership. The items which measure strategy and
industry factors were adapted from several previous studies (see Appendix A and B). State
support items were informed by the suggestions in Bugra (2008) and Boratav (2006). See
Appendix A for an overview! Group membership was coded as a dummy variable (being a
member = 1, not a member = 0). As control variables, the study uses year of establishment,
national/international ownership and firm export. This choice builds on previous studies
which suggest a correlation between performance and age (Galbreath and Galvin, 2008),
performance and ownership (national or international shareholders) (Lau, Yiu, Yeung and Lu,

2008), and performance and export (e.g. Singla and George, 2013). For firm with foreign
shareholders, the ownership variable is coded as 1, otherwise 0; if a firm has any export, the
export variable is coded as 1, otherwise the code is 0.
To form the variables related to industry, strategy and state support from the multiple
survey items the study makes use of exploratory factor analysis with Varimax and Kaiser
Normalization. A confirmatory analysis is also conducted to analyze the structure of the
newly formed variables (see Appendix A and B). In line with suggestions by Costello &
Osborne (2005), the study uses 0.40 as a minimum commonality value for including an item
in the further analysis. The literature also recommends that the minimum loading values of
the items should be checked. As Costello and Osborne (2005) and Tabachnick and Fidell
(2012) suggest, the paper applies 0.40 as a minimum factor loading, and 1.0 as the minimum
eigenvalue. To assess reliability, Cronbach's alpha for each variable was calculated
(Cronbach, 1951). Following the suggestions of Powell (1996), the study uses variables with
alpha values exceeding 0.50.
The factor analysis lead to four reliable industry-related variables: competitive
intensity, entry barriers, power of suppliers, and threat of substitute products. The analysis of
strategy items resulted in six possible strategy variables: combination strategy, focus strategy
and cost leadership strategy and three differentiation strategies (differentiation in quality, in
marketing and in product). Calculation of the alpha values for each variable showed that the
lowest alpha value was 0.69, implying that all of them were reliable. However, a correlation
analysis revealed significant and strong relations (over 0.80) among the three differentiation
strategies. A study of Claver-Cortés, Pertusa-Ortega, & Molina-Azorín (2012) inspired the
use of another factor analysis for eliminating this source of possible multi-collinearity. As a
consequence, the variables measuring different types of differentiation strategies were
consolidated into one variable. Thus four strategy variables remained: overall differentiation,

combination, low cost and focus. See Appendix B for further information regarding formation
of the strategy variables.
Four items measure the state support variable. A reliability check found its Cronbach's
alpha to be 0.63, which confirmed that this variable is indeed reliable. For details on the
analysis and factor structures of industry and state support see Appendix A.
To investigate the relative importance of the independent variables on firm
performance the study employs two different statistical techniques, regression models and
LMG metrics. Several authors, e.g. Kotha and Nair (1995) have previously used hierarchical
multiple regressions to estimate the impact of various variables. This technique involves a
comparison of the changes in F values, from a base model containing only control variables to
more comprehensive models containing either industry or strategy variables, or both. By
doing so the method allows the researchers to determine the entry order of the independent
variables in the calculation.
This study presented here tested seven different models, using the two measurements
of firm performance. The base model, Model 1, only contains control variables such as firm
age, presence of foreign shareholders and firm exports. Model 2 enters the industry variables
in the analysis. Calculation of ΔR2 and ΔF in this model shows how much industry variables
improve the base model. Model 3 includes strategy variables in addition to the control
variables. The values of ΔR2 and ΔF show how much the strategy variables improve the base
model. Model 4 adds strategy related variables to the industry variables in Model 2. The
values of ΔR2 and ΔF show how much the strategy variables improved Model 2. Model 5
adds industry variables to Model 3 with its strategy variables. Calculating ΔR2 and ΔF shows
how much the industry variables improve this model.
As can be seen in Table 2 and Table 3, Model 4 and Model 5 contain the same
variables; but the order of entering the variables in the regressions differ and thus also the

incremental values of F and R2 (see Figure1 and 2). Model 6 constitutes the full model
regressed by the control variables and all independent variables: industry structure, firm
strategy, business group and state support. The final regression (Model 7) contains not only
all control and independent variables but also the interaction between state and other
independent variables.
This analysis employed several indicators to check for possible multi-collinearity. One
of those indicators is the variance inflation factor (VIF) of the variables. According to Hair,
Black, Babin and Anderson (2010) this should be lower than 10. As Table 2 and Table 3 show
that the VIF values for the studied variables range from 1.20 to 2.62, far below this limit.
Another indicator of potential multi-collinearity is the tolerance value of the variables. In this
study, the lowest tolerance values of the independent variables exceeded 0.65, much higher
than the minimum value suggested in Menard (1995). Thus both the VIF and tolerance values
show that multi-collinearity should be no problem in this study.
Whereas the study used hierarchical multiple regressions (Model 1 to 5) to determine
the impact of clusters of independent variables and Ordinary Least Squares (OLS) regressions
to calculate the full models (Model 6 and 7), the study applied another method to evaluate the
importance of each variable. For non-correlated independent variables, the importance of the
variables can be determined via their standardized regression coefficients. Frequently,
however, independent variables may be correlated and then these coefficients cannot be used
as an indicator of the variable´s relative importance, since “some of the variance may be
predictable from other independent variables” (Malešević-Perović, Mihaljević-Kosor, Filipić,
2011; Tabachnick and Fidell, 2012:144). To avoid this problem, methods such as ANIMP and
LMG metrics have emerged. This paper uses the LMG-method (Lindeman, Merande and
Gold, 1980) to calculate the relative importance of all the independent variables, by applying
a special software package, Relaimpo, designed by Grömping (2007).

5. Results
Table 1 shows descriptive statistics of the final variables, including the correlations
between all variables.
Table 1 here.
Below, hypotheses 1-3 are first evaluated by the hierarchical regression models. Table
2 and Table 3 show the results for the two performance variables in the seven different
models: the base model, various restricted models and the full model containing all
independent variables and interaction effects. For each model the tables contain information
regarding R, R2, F and adjusted R2. Figure 1 - 2 show the ΔF and ΔR2 of Model 1 to 5.
Here, Model 2 demonstrates that industry-related factors have strongly significant ΔF
and ΔR2 values: industry predicts firm performance both when performance is measured by
NPM (ΔF=8.26, ΔR2=0.13, p<0.001), and measured by productivity (ΔF = 4.68, ΔR2 =0.08 at
p<0.001). These results confirm H1.
Model 3 in the same figures shows that strategy factors are related to significant but
small changes in firm performance, when NPM is used as performance indicator (ΔF=3.03,
ΔR2 =0.05, p<0.05); but insignificant when productivity is used (ΔF=0.43, ΔR2 =0.01,
p=0.78). These results mean Hypothesis 2 is partly supported.
Figures 1 and 2 also show comparisons of the impact of industry- and strategy-related
variables indicated by NPM and productivity, respectively. Both indicators show that industry
has a stronger impact than strategy. Adding industry variables to the control variables (Model
2, Figure 1) results in substantial increases in explanatory power (ΔF=8.26, ΔR2=0.13,
p<0.01); adding strategy variables to the control variables (Model 3, Figure 1) has a
significant but weaker impact (ΔF=3.03, ΔR2=0.05, p<0.05). The results for industry are
similar when productivity is used as performance indicator (ΔF=4.68, ΔR2=0.08, p<0.01),

however, this is not the case for strategy. Adding strategy variables to the control variables
(Model 3, Figure 2) has an insignificant impact on firm productivity (ΔF=0.43, ΔR2=0.01,
p>0.10).
Moreover, adding industry variables to strategy variables (Model 5) results in
significant improvements: ΔF= 5.92, ΔR2 =0.09, p<0.001 when NPM is used; and ΔF= 4.82,
ΔR2 =0.08, p<0.001 when productivity is the indicator used. On the other hand, adding
strategy variables to industry variables (Model 4), leads to insignificant improvements:
ΔF=0.98, ΔR2=0.01, p>0.10 for NPM, ΔF=0.64, ΔR2=0.01, p>0.10 for productivity.
Irrespective of performance indicator the comparisons of the ΔFs and ΔR2s across the models
demonstrate that the impact of industry is higher than the impact of strategy on firm
performance.
Figures 1 and 2 here.
In addition to these comparisons, the calculation of LMG values indicates the relative
importance of the variables for firm performance. Figure 3 (NPM) and Figure 4 (productivity)
show each independent variable’s relative importance value according to its LMG metrics.
Competitive intensity is the variable with the highest relative importance level (0.45 in the
NPM regression and 0.27 in the productivity regression). The LMG metrics also highlight the
importance of two other industry variables, entry barrier and threat of substitute products
(when productivity is the dependent variable).
Figure 3 shows that the strategy variables have much lower importance values: 0.11
for differentiation strategy and 0.07 for combination strategy; negligible for other strategies.
In Figure 4, where productivity is the dependent variable, all strategy variables exhibit a low
relative importance. Figure 4 also reveals that when productivity is used as performance

measure one of the control variables, firm age, has a high importance level, second only to
competitive intensity.
To sum up, both the results of the conventional multiple regressions and the LMG
metrics show industry variables to be more important indicators of firm performance than
strategy. These results confirm H3.
Figures 3 and 4 here.
Table 2 (NPM) and 3 (productivity) present a detailed impact analysis with the β
values and LMG values of all independent variables. The tables confirm that competitive
intensity is the dominant industry variable, related both to lower NPM (β= -0.33, p<0.01 in
Table 2) and productivity (β= -0.23, p<0.01 in Table 3). As for firm strategies, the tables
show that only a combination strategy has a significant and positive effect (but smaller and
weaker than competitive intensity), when performance is measured by NPM (β=0.14, p<0.10
see Model 6, in Table 2).
Model 6 in Table 2 and 3 sheds light on H4 and H5. State support does not
significantly explain NPM (β=0.04, p>0.10), but significantly and positively predicts
productivity (β=.11, p<0.10). These findings partly confirm Hypothesis 4. According to the
descriptive statistics in Table 1, state support is positively related to firm age (a proxy for
size) and export orientation, and negatively related to a strategy of cost leadership, but these
results were not confirmed in the full regression model including interaction analysis. The
importance analysis, based on the LMG-metrics (Figures 3 and 4), shows that state support
has a substantial impact compared to other variables, more important than firm strategies
when performance is indicated by productivity.
The regression analyses also demonstrate the impact of business group membership on
performance. Model 6 in Table 2 and 3 shows that the business group variable significantly

and positively explains firms´ NPM (β=.20, p<0.001) and productivity (β=.22, p<0.001).
These findings support H5.
The LMG-based analysis of the relative importance of the independent variables (see
Figures 3 and 4) reveals that business group membership is the second most important
variable after the industry variable competitive intensity. The value of group membership is
particularly high when performance is measured by productivity. In this case, however, one
of the control variables, firm age, has an even higher importance level (Figure 4).
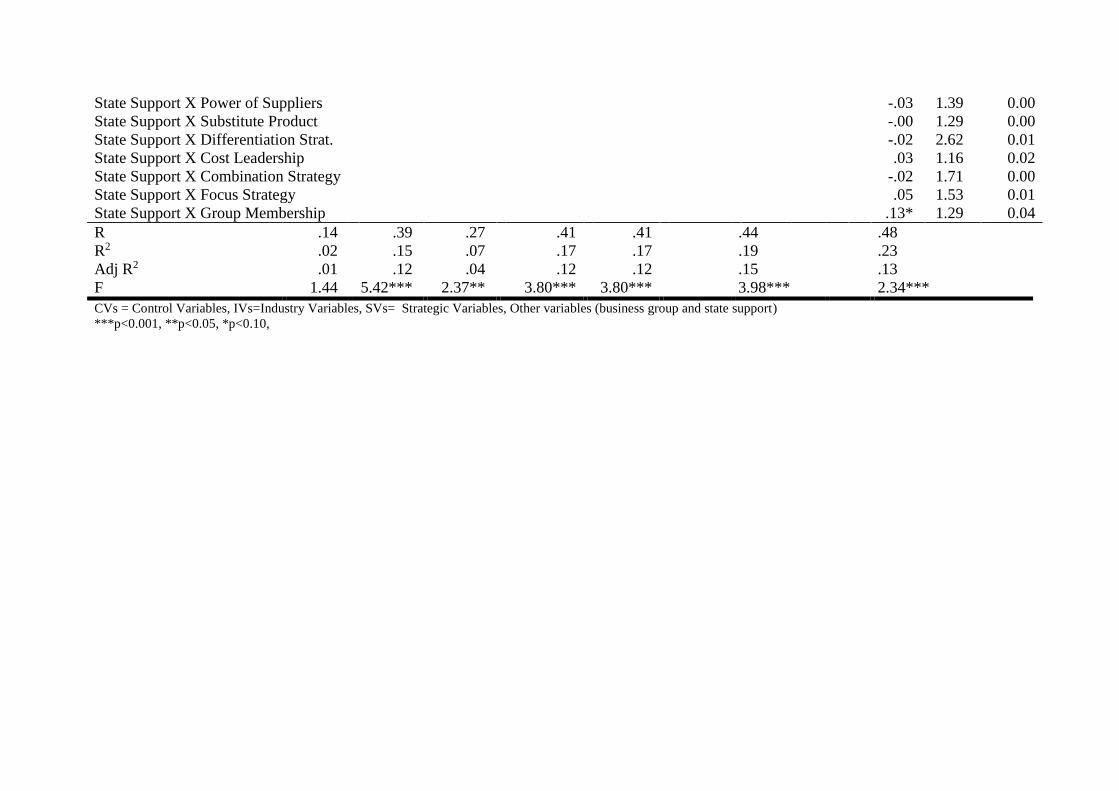
An extended regression model, (Model 7), accounts for the possible effects of
interaction between state support and all the control and independent variables. Table 2 and 3
report the results of this regression. Using profit margin as performance measure, Table 2
shows that state support and business group membership display a positive interaction (β=.13,
p<0.10 in Model 7). This positive interaction is in line with the expectations stated in
conjunction to Hypothesis 5. But this positive interaction only shows up when profit margin is
used as performance measure. Furthermore, with productivity as performance measure, state
support displays negative and significant interaction with differentiation strategy (β= -.17,
p<0.10 see Model 7 in Table 3); implying that when state support is involved firms embark on
less productive forms of differentiation.
Tables 2 and 3 here.
6. Discussion and conclusions
The starting point for this study was the question if antecedents of firm performance in
in developed economies are the same in emerging economies, with their different ownership
structures and pervasive forms of state interventionism. To examine this question, the paper
uses Turkey as an exemplar from the universe of rapidly growing emerging economies. In
addition to comparing the impact of factors related to structure and strategy, the paper
attempts to gauge the importance of two general emerging economy-factors, state support and
business group membership, and the interaction of state support with other factors.
The study tests five hypotheses. Hypotheses 1 - 3 propose that both strategy and
structure-related factors have an impact on firm performance, but that structure (industry
characteristics) trumps firm strategy. Hypotheses 4 - 5 assume a positive influence of state
support and business group membership on performance, and an interaction between these
two factors. Based on a large survey of manufacturing firms combined with accounting
information on profit margins and productivity, the study find (1) the impact of industry on
firm performance is significant for both profit margin and productivity; (2) the impact of
strategy related variables on is significant when performance is measured by profit margin;
(3) the impact of industry structure on firm performance is consistently higher than the impact
of firm strategies; 4) group membership positively influences firm performance, and 5) state
support impacts firm performance when this is measured as productivity.
Previous research on firm performance in emerging economies has generated
ambiguous results. A few studies have reported a significant impact of strategy on
performance (Acquaah and Yasai-Ardekani, 2008; Karabag, 2008); other studies find firm
factors to be insignificant or only weakly explaining firm performance (Dong, Liu and Yin,
2008:352; Ofori-Dankwa and Julian, 2012; Lou, 1999). This study supports the results of the
second group. When structure is analyzed in more detail, the most important aspect both for
profit margin and productivity turns out to be competitive intensity. A competition-induced
pressure on profit margins is in line with mainstream economics, but the negative relation to
productivity suggests that excessive competition discourages firms to invest in production
expansion or capital equipment which would boost their productivity.

The weak impact of strategy on performance in this study may be related to several
emerging economy-factors, one of them being the importance of political factors in
determining business outcomes, including access to government contracts and regulatory
opportunities (cf. Tan and Litschert, 1994). The consistent phenomenon of unrelated business
group diversification in Turkey and other emerging economies is related to this factor. Firms
need to devote their limited managerial resources more to stay tuned with political and
administrative developments and less to hone long-term competitive strategies; being in the
right business at the right time tends to be more important than developing the right strategy.
Recently, Hoskisson et al. (2012) has classified emerging countries according to their
institutional and factor market development. They categorize Turkey in a group with strong
development of infrastructure-/factor markets, but less of institutional development, and argue
that firms in such asymmetric contexts tend to focus more on the management of the
institutional environment (government policies and structures), than on their product market
environment. As a result, the measurable impact of product market based strategies, such as
those defined by Porter, will be less significant. A final factor explaining the relative
insignificance of firm strategies is the general impact of high economic growth, which tends
to make market share more important than profitability (Tan and Litschert, 1994). Several
studies offer support for such a market share-priority in Turkish firms, for example Tuzcu
(2008) and Parnell and Köseoglu, (2010); Parnell, Lester, Long, & Köseoglu (2012). From
this perspective, the current study´s use of profit-related indicators as a measurement of firm
performance needs to be complemented; however, market share data are difficult to compare
across industries, and hard to access in many industries.
Several researchers have discussed the importance of state support for specific firms
and business groups in Turkey, for example Bugra (2008), Boratav (2006) and Yaprak and
Karademir (2010). This study is the first to report a general impact of this factor in Turkey.

With state support firms in volatile economies are emboldened to invest in growth and in
more capital intensive operations. Interaction effects related to state support illustrate that the
relation is complicated; when firms with a differentiation strategy enjoy state support, their
productivity suffers. A possible interpretation is that state support encourages managers to
engage in less efficient types of differentiation. State activities also influence industry
variables, such as competitive intensity and entry barriers, but unfortunately the current study
could not measure this indirect influence. Overall, the results show that in emerging
economies the state is an important non-firm factor which managers and researchers need to
pay attention to (cf. Goldszmidt, Brito and de Vasconcelos, 2009).
The study also demonstrates that business group membership is related to significantly
better firm performance. This is in line with studies of business groups in Japan (Nair and
Kotha, 2001), Brazil, Chile and India (Khanna and Yafeh, 2005). When performance is
measured by profit margin, the study reveals a significant interaction effect between state
support and business group membership. This could be compared to the finding that state
support directly influences productivity but not NPM positively. The anomaly might be
explained by viewing business groups as vehicles for indirect state support, which may
encourage both productive investments and rent-seeking behaviors: “preferential input prices,
low-cost credits, tax rebates, foreign exchange licenses, import licenses, government
contracts, as well as through export-specific measures allowing business groups to establish
large export companies in the 1980s” (Khanna and Yafeh, 2005: 81).
To sum up, assuming that Turkey is an illustrative representative of an advanced
emerging economy, the study reveals that antecedents of firm performance in emerging
economies differ in significant respects from established economies. The study also
demonstrates the need to develop and test a broader range of performance indicators, beyond
the classical metrics used in developed economies. Such studies might include other types of

industry information, for example the SIC-code(s) and embrace both firm and corporate
strategy. Longitudinal approaches would be highly welcome. In emerging countries,
conditions tend to change fast as countries go through various stages in their catch-up
trajectory, and the findings of this study might not be relevant to all the stages in this process
(Luo, 1999). Hopefully this study will contribute to cross-country studies of different
emerging economies using different indicators of performance in order to further investigate
the ways institutional factors influence the performance of firms.

REFERENCES
Abegglen, J., & Stalk, G. (1987). Kaisha-The Japanese Corporation. Tokyo: Charles E.
Tuttle.
Acquaah, M., & Yasai-Ardekani, M. (2008). Does the implementation of a combination
competitive strategy yield incremental performance benefits? A new perspective from
a transition economy in Sub-Saharan Africa. Journal of Business Research, 61, 346–
354.
Adner, R., & Helfat, C. (2003). Dynamic managerial capabilities and corporate effects.
Strategic Management Journal, 24, 1011–1025.
Altenburg, T., Schmitz, H. & Stamm, A. (2008). Breakthrough? China’s and India’s transition
from production to innovation. World Development, 36(2), 325–344.
Amsden, A. (1989). Asia’s next giant. South Korea and late industrialization. New York:
Oxford University Press.
Amsden, A., & Wan-wen, C. (2003). Beyond late development -Taiwan's upgrading policies.
Cambridge, Massachusetts: The MIT Press.
Austin, J. E. (1990). Managing in developing countries. New York: The Free Press.
Bai, Y., & Green, C.J. (2010). International diversification strategies: revisited from the risk
perspective. Journal of Banking and Finance, 34, 236-245.
Bain, J. S. (1959). Industrial organization. New York: John Wiley & Sons.
Bain, J.S. (1956). Barriers to New Competition, Cambridge, MA: Harvard University Press.
Boratav, K. (2006). History of Turkish economy: 1908-2005 (in Turkish) (10th ed.). Istanbul:
Imge Books.
Boratav, K. (1981). Kemalist economic policies and etatsm? In Kazancigil A. & Ozbudun E.
(Eds.), Atatürk: Founder of a modern state (pp.165–191), Hamden, Connecticut:
Archon Books.

Bugra, A. (2008). State and business in Modern Turkey (in Turkish) (2nd ed.). Istanbul:
İletişim Publications.
Cavaglia, S., Brightman, C. & Aked, M., (2000). The increasing importance of industry
factors. Financial Analysts Journal, 56, 41-54.
Chakravarthy, B. S. (1986). Measuring strategic performance. Strategic Management Journal,
7: 437–458.
Chang, S., & Hong, J. (2002). How much does the business group matter in Korea?. Strategic
Management Journal, 23, 265–274.
Chen, Y. (2010). The continuing debate on firm performance: A multilevel approach to the IT
sectors of Taiwan and South Korea. Journal of Business Research, 63, 471–478.
Christmann, P., Day, D. L., & Yip, G.S. (1999). The relative influence of country conditions,
industry structure and business strategy on MNC subsidiary performance. Journal of
International Management, 5, 241–265.
Claver-Cortés, E., Pertusa-Ortega, E.M, & Molina-Azorín, JF. (2012). Characteristics of
organizational structure relating to hybrid competitive strategy: Implications for
performance, Journal of Business Research, 65(7), 993-1002.
Close, P., Askew D., & Xu, X. (2007). The Beijing Olympiad: The political economy of a
sporting mega event, New York: Rutledge.
Colpan, A. M., & Hikino T. (2010). Foundations of business groups: towards an integrated
framework." In Colpan, A., Hikino, T., & Lincoln, J.R. (eds). The Oxford Handbook
of Business Groups. Oxford: Oxford University Press.
Costello A. B., & Osborne, J. W. (2005). Best practices in exploratory factor analysis: Four
recommendations for getting the most from your analysis. Practical Assessment
Research & Evaluation, 10(7), 1-9.

Cronbach, L.J., 1951. Coefficient alpha and the internal structure of test. Psychometricka, 16,
297–334.
Davis, P.S. & Schul, P.L. (1993). Addressing the contingent effects of business unit strategic
orientation on relationships between organizational context and business unit
performance. Journal of Business Research, 27, 183-200.
DeSarbo, W.S., Benedetto, C.A., Song ,M. & Sinha, I. (2005). Revisiting the Miles and Snow
strategic framework: Uncovering interrelationships between strategic types,
capabilities, environmental uncertainty, and firm performance. Strategic Management
Journal, 26, 47-74.
Dess, G. G., & Davis, P. S. (1984). Porter’s (1980) generic strategies as determinants of
strategic group membership and organization performance. Academy of Management
Journal, 27, 467–488.
Dong, X., Liu, Q., & Yin, D. (2008). Business Performance, Business Strategy, and
Information System Strategic Alignment: An Empirical Study on Chinese Firms.
Tsinghua Science and Technology, 13(3), 348-3 54
Duh, R.-R., Chow, C.W. & Chen, H. (2006). Strategy, IT applications for planning and
control, and firm performance: The impact of impediments to IT implementation,
Information & Management, 43, 939–949.
Efendioglu, A. M., & Karabulut, T. (2010). Impact of strategic planning on financial
performance of companies in Turkey. International Journal of Business Management,
5, 3–12.
Galbreath, J., & Galvin, P. (2008). Firm factors, industry structure and performance variation:
New empirical evidence to a classical debate. Journal of Business Research, 61, 109–
117.

Goldszmidt, R. G. B., Brito, L. A. L., & de Vasconcelos, F. C. (2009). Country effect on firm
performance: A multilevel approach. Journal of Business Research, 62, 495–508.
Gopalakrishna, P., & Subramanian, R. (2001). Revisiting the pure versus hybrid dilemma:
Porter’s generic strategies in a developing economy. Journal of Global Marketing, 15,
61–79.
Gonenc, H., Kan, O. B., & Karadagli, E. C. (2004). Corporate diversification and internal
capital markets: Evidence from the Turkish business groups. Annual Meeting of
European Financial Management Association, Basel, Switzerland.
Grömping, U. (2007). Estimators of Relative Importance in Linear Regression Based on
Variance Decomposition. The American Statistician 61,139-147.
Guriev, S. and Rachinsky, A. (2005). The role of oligarchs in Russian capitalism. Journal of
Economic Perspectives. 19,131–50.
Hair, J.F., Black, W.C., Babin, B.J., & Anderson, R.E. (2010). Multivariate data analysis with
reading, Upper Saddle River, NJ: Prentice Hall.
Herslag, Z. Y. (1984). Atatürk Etatism. In Landau J.M. (Ed.), Atatürk and the modernization
of Turkey (pp. 171–180). Boulder, Colorado: Westview Press.
Hill C. (1988), Differentiation versus low cost or differentiation and low cost: A contingency
framework. Academy of Management Journal, 25, 265-298.
Hoskisson, R. E., Wright, M., Filatotchev, I. & Peng, M. W. (2012). Emerging Multinationals
from Mid-Range Economies: The Influence of Institutions and Factor Markets.
Journal of Management Studies. doi: 10.1111/j.1467-6486.2012.01085.x
Karabag, S. F. (2008). Effects of strategy and industry on firm performance: An examination
on Turkish leading manufacturing companies (in Turkish). PhD Dissertation, Adana:
the Publications of the Social Science Institute, Çukurova University.

Karabag, S. F., & Berggren, C. (2011). The Limits of R&D Internationalization and the
Importance of Local Initiatives: Turkey as a Critical Case, World Development, 39(8),
1347-1357.
Karakaya, F., & Stahl, M.J. (1989). Barriers to entry and market entry decisions in consumer
and industrial goods markets, Journal of Marketing, 53, 80-91.
Kazgan, G. (2004). Turkish economy: From the constitution of 1876 to 21 century (in
Turkish) (2nd ed.). Istanbul: Istanbul Bilgi University Publications.
Kearney, C. (2012). Emerging market research: Trends, issues and future directions,
Emerging Markets Review, 13, 159-183.
Keyder, Ç. (1987). State and class in Turkey: A study in capitalist development. London:
Verso Press.
Khanna, T., & Rivkin, J. (2001). Estimating the performance effects of business groups in
emerging markets. Strategic Management Journal, 22, 45–74.
Khanna, T., & Yafeh, Y. (2005). Business Groups in Emerging Markets: Paragons or
Parasites? ECGI Working Paper Series in Finance: Working Paper N°92/2005.
Kim, Y., & Lim, K. (1988). Environment, generic strategies, and performance in a rapidly
developing country: A taxonomic approach. Academy of Management Journal, 31,
802–827.
Kotha, S., & Nair, A. (1995). Strategy and environment as determinant of performance:
Evidence from Japanese Machine Tool Industry, Strategic Management Journal, 16,
497–518.
Lau, C.M., Yiu, D.W., Yeung, P.K. & Lu, Y. (2008). Strategic orientation of high-
technology firms in a transitional economy, Journal of Business Research, 61, 765–
777.

Lindeman, R. H., Merenda, P. F., & Gold, R. Z. (1980). Introduction to Bivariate and
Multivariate Analysis, Glenview, IL: Scott, Foresman.
Lou, Y. (1999). The structure-performance relationship in a transitional economy: An
empirical study of multinational alliances in China, Journal of Business Research, 46,
15-30.
Malešević-Perović, L., Mihaljević-Kosor, M., & Filipić, P. (2011). The relative importance of
religious denominations for life satisfaction. Journal of Applied Economics and
Business Research, 1, 162-176.
Malik, O.R., & Kotabe, M. (2009). Dynamic capabilities, government policies, and
performance in firms from emerging economies: Evidence from India and Pakistan.
Journal of Management Studies, 46(3), 421-450.
McGahan, A. M, & Porter, M. E. (2003). The emergence and sustainability of abnormal
profits. Strategic Organization, 1, 79–108.
McGahan, A. M., & Porter, M.E. (2002). What do we know about variance in accounting
profitability? Management Science, 48, 834–851.
Menard, S. (1995). Applied Logistic Regression Analysis: Sage University Series on
Quantitative Applications in the Social Sciences. Thousand Oaks, CA: Sage
Publication.
Miles, R.E., & Snow, C.C. (1978). Organizational Strategy, Structure, and Process, New
York: McGraw-Hill Press.
Miller, D. (1987). The structural and environmental correlates of business strategy. Strategic
Management Journal, 8, 55-76.
Nair, A., & Kotha, S. (2001). Does group membership matter? Evidence from the Japanese
steel industry. Strategic Management Journal, 22, 221–235.

Nayyar, P.R. (1993). On the measurement of competitive strategy: Evidence from a large
multiproduct US firm. Strategic Management Journal, 10, 101-107.
Ofori-Dankwa, J., & Julian, S.D (2012). Dynamism, capital structure, and performance in a
Sub-Saharan economy: Extending the institutional difference hypothesis.
Organization Science, http://dx.doi.org/10.1287/orsc.1220.0789.
Özen, Ş., & Akkemik, K. A. (2012). Does Illegitimate Corporate Behaviour Follow the Forms
of Polity? The Turkish Experience. Journal of Management Studies, 49, 515-537.
Özen, Ş., & Özen, H. (2009). Peasants against MNCs and the State: The Role of the Bergama
Struggle in the Institutional Construction of the Gold-Mining Field in Turkey.
Organization, 16, 547-573.
Parnell, J. A., & Koseoglu, M.A. (2010). A comparison of competitive strategy and
organizational performance in Turkey and the USA. International Journal of
Management and Enterprise Development, 8(1), 46-61.
Parnell, J. A., Lester, D. L., Long, Z., & Köseoglu, M. A. (2012). How environmental
uncertainty affects the link between business strategy and performance in SMEs:
Evidence from China, Turkey, and the USA. Management Decision, 50(4), 546-568.
Penrose, E. T. (1959). The theory of the growth of the firm. London: Basil Blackwell.
Phylaktis, K. & Xia, L, (2006). The Changing Role of Industry and Country Effects in Global
Equity Markets. Cass Business School Research Paper,
http://dx.doi.org/10.2139/ssrn.905793
Porter, M. E. (1980). Competitive strategy: Techniques for analyzing industries and
competitors. New York: Free Press.
Powell, T. C. (1996). How much industry matter? An alternative empirical test. Strategic
Management Journal, 17, 323–334.
Schmalensee, R. (1985). Do markets differ much?. American Economic Review, 75, 341–351.
Singla, C., & George, R. (2013). Internationalization and performance: A contextual analysis
of Indian firms, Journal of Business Research,
http://dx.doi.org/10.1016/j.jbusres.2013.05.041
Spanos, Y. E., Zaralis, G., & Lioukas, S. (2004). Strategy and industry effects on profitability:
Evidence from Greece. Strategic Management Journal, 25, 139–165.
Tabachnick, B. G., & Fidell, L. S. (2012). Using Multivariate Statistics. Boston: Pearson.
Tan, J.J., & Litschert, R.J. (1994). Environment-strategy relationship and its performance
implications: An empirical study of the Chinese electronics industry. Strategic
Management Journal, 15(1),1-20.
Tuzcu, A. (2008). Innovation capability under the umbrella of the holding companies in
Turkey (in Turkish: Türkiye’de Holding Çatısı Altındaki Şirketlerde İnovasyon
Yetkinliği, The Proceeding of Turkish National Management and Organization
Conference: Vol. 16 (pp. 953–961). Antalya, Turkey: Istanbul Culture University.
Yaprak, A., & Karademir, B. (2010). The internationalization of emerging market business
groups: an integrated literature review. International Marketing Review, 27, 245–262.
Yiu, D., Bruton, G. D., & Lu, Y. (2005). Understanding business group performance in an
emerging economy: Acquiring resource and capabilities in order to prosper. Journal of
Management Studies, 42, 183–206.
Yurtoglu, B. B. (1999). Ownership structure, cash flow; and investment: Evidence from
Turkish business groups. Working Paper, Vienna: University of Vienna.
Zeybek, A. (2005). The analysis of concentration ratios of the Turkish Manufacturing
industries. The Turkish Undersecretariat of Treasury: The Directorate General of State
Aid to Investment, specialist thesis, Thesis No: 6698, Ankara: The Turkish
Undersecretariat of Treasury Publication.
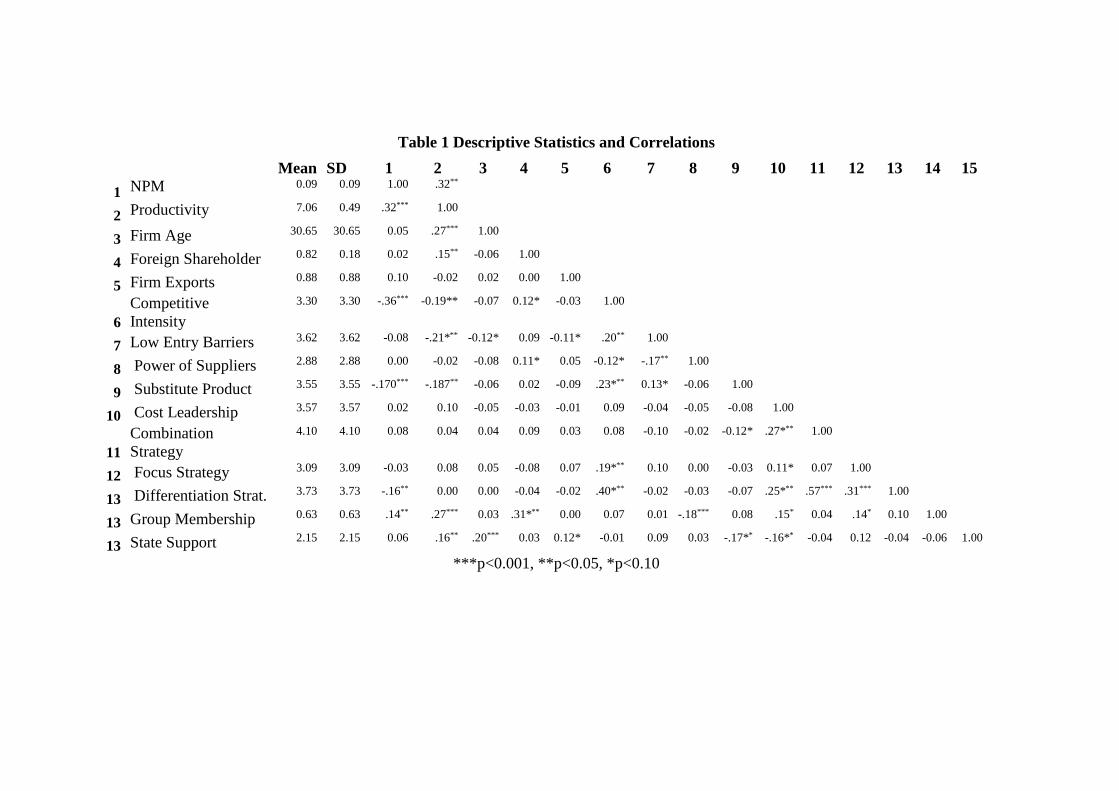
Table 1 Descriptive Statistics and Correlations
Mean SD 1 2 3 4 5 6 7 8 9 10 11 12 13 14 15
1 NPM 0.09 0.09 1.00 .32**
2 Productivity 7.06 0.49 .32*** 1.00
3 Firm Age 30.65 30.65 0.05 .27*** 1.00
4 Foreign Shareholder 0.82 0.18 0.02 .15** -0.06 1.00
5 Firm Exports 0.88 0.88 0.10 -0.02 0.02 0.00 1.00
6
Competitive
Intensity
3.30 3.30 -.36*** -0.19** -0.07 0.12* -0.03 1.00
7 Low Entry Barriers 3.62 3.62 -0.08 -.21*** -0.12* 0.09 -0.11* .20** 1.00
8 Power of Suppliers 2.88 2.88 0.00 -0.02 -0.08 0.11* 0.05 -0.12* -.17** 1.00
9 Substitute Product 3.55 3.55 -.170*** -.187** -0.06 0.02 -0.09 .23*** 0.13* -0.06 1.00
10 Cost Leadership 3.57 3.57 0.02 0.10 -0.05 -0.03 -0.01 0.09 -0.04 -0.05 -0.08 1.00
11
Combination
Strategy
4.10 4.10 0.08 0.04 0.04 0.09 0.03 0.08 -0.10 -0.02 -0.12* .27*** 1.00
12 Focus Strategy 3.09 3.09 -0.03 0.08 0.05 -0.08 0.07 .19*** 0.10 0.00 -0.03 0.11* 0.07 1.00
13 Differentiation Strat. 3.73 3.73 -.16** 0.00 0.00 -0.04 -0.02 .40*** -0.02 -0.03 -0.07 .25*** .57*** .31*** 1.00
13 Group Membership 0.63 0.63 .14** .27*** 0.03 .31*** 0.00 0.07 0.01 -.18*** 0.08 .15* 0.04 .14* 0.10 1.00
13 State Support 2.15 2.15 0.06 .16** .20*** 0.03 0.12* -0.01 0.09 0.03 -.17** -.16** -0.04 0.12 -0.04 -0.06 1.00
***p<0.001, **p<0.05, *p<0.10

Table 2: Summary of Regression Models of NPM
Mode
l 1
(CVs)
Model 2
(CVs
+IVs)
Model 3
(CVs +
SVs)
Model 4
(CVs +
IVs +
SVs)
Model 5
(CVs +
SVs +
IVs)
Model 6
(All variables)
Model 7
(All variables and
Interaction)
β Β β Β β β VIF LMG β VIF LMG
Control Variables
Firm Age .06 .03 .05 .02 .02 .02 1.09 0.00 .07 1.55 0.01
Foreign Shareholder .05 .08 .01 .06 .06 .12* 1.21 0.02 .14* 1.27 0.03
Firm Export .12* .10 .11 .09 .09 .09 1.05 0.03 .09 1.23 0.02
Industry Variables
Competitive Intensity -.34*** -.31*** -.31*** -.33*** 1.44 0.51 -.32*** 1.52 0.43
Low Entry Barriers -.03 -.02 -.02 -.02 1.15 0.01 -.03 1.21 0.01
Power of Suppliers -.02 -.02 -.02 .01 1.10 0.00 -.01 1.16 0.00
Substitute Product -.08 -.07 -.07 -.08 1.16 0.08 -.07 1.27 0.07
Strategy Variables
Cost Leadership .03 .03 .03 .01 1.15 0.00 -.02 1.25 0.00
Combination Strategy .24*** .15* .15* .14* 1.69 0.07 .12 1.78 0.06
Focus Strategy -.00 .03 .03 .01 1.19 0.01 .00 1.29 0.00
Differentiation Strategy -.26*** -.11 -.11 -.10 2.11 0.11 -.07 2.33 0.09
Other variables
Group Membership .20*** 1.20 0.13 .21*** 1.25 0.12
State Support .04 1.16 0.01 .06 1.25 0.01
Interaction
State Support X Firm Age -.07 1.84 0.01
State Support X Foreign Shareholder -.09 1.48 0.02
State Support X Internationalization -.01 1.41 0.00
State Support X Competitive Intensity -.12 1.73 0.02
State Support X Low Entry Barriers .06 1.32 0.01
State Support X Power of Suppliers -.03 1.39 0.00
State Support X Substitute Product -.00 1.29 0.00
State Support X Differentiation Strat. -.02 2.62 0.01
State Support X Cost Leadership .03 1.16 0.02
State Support X Combination Strategy -.02 1.71 0.00
State Support X Focus Strategy .05 1.53 0.01
State Support X Group Membership .13* 1.29 0.04
R .14 .39 .27 .41 .41 .44 .48
R2 .02 .15 .07 .17 .17 .19 .23
Adj R2 .01 .12 .04 .12 .12 .15 .13
F 1.44 5.42*** 2.37** 3.80*** 3.80*** 3.98*** 2.34***
CVs = Control Variables, IVs=Industry Variables, SVs= Strategic Variables, Other variables (business group and state support)
***p<0.001, **p<0.05, *p<0.10,

Table 3: Summary of Regression Models of Productivity
Model 1
(CVs)
Model 2
(CVs
+IVs)
Model 3
(CVs +
SVs)
Model 4
(CVs + IVs
+ SVs)
Model 5
(CVs +
SVs +
IVs)
Model 6
(All variables)
Model 7
(All variables and
Interaction)
Β Β Β β β β VIF LMG β VIF LMG
Control Variables
Firm Age .26*** .24*** .26*** .24*** .24*** .21*** 1.09 0.26 .24*** 1.55 0,20
Foreign Shareholder -.03 -.02 -.04 -.00 -.00 -.06 1.22 0.00 .07 1.27 0,00
Firm Export -.01 -.04 -.01 -.04 -.04 .05 1.05 0.01 -.06 1.23 0,01
Industry Variables
Competitive Intensity -.17** -.21*** -.21*** -.23*** 1.43 0.27 -.21*** 1.51 0,20
Low Entry Barriers -.09 -.09 -.09 -.10 1.15 0.07 -.11 1.20 0,06
Power of Suppliers .05 .05 .05 .07 1.11 0.01 .08 1.16 0,01
Substitute Product -.12* -.10 -.10 -.10 1.16 0.10 -.07 1.26 0,07
Strategy Variables
Cost Leadership .04 .04 .04 .03 1.16 0.01 .00 1.25 0,02
Combination Strategy .08 .02 .02 .01 1.70 0.02 -.01 1.79 0,00
Focus Strategy .00 .03 .03 .01 1.21 0.00 .02 1.30 0,01
Differentiation Strategy -.04 .07 .07 .09 2.12 0.01 .13 2.33 0,02
Other variables
Group Membership .22*** 1.21 0.16 .23*** 1.25 0,14
State Support .11* 1.16 0.08 .13* 1.24 0,07
Interaction
State Support X Firm Age -.04 1.84 0,02
State Support X Foreign Shareholder -.10 1.48 0,03
State Support X Internationalization .00 1.40 0,00
State Support X Competitive Intensity -.08 1.73 0,02
State Support X Low Entry Barriers -.09 1.32 0,05
State Support X Power of Suppliers -.05 1.40 0,00
State Support X Substitute Product -.05 1.29 0,01

State Support X Differentiation Strat. -.17*** 2.62 0,05
State Support X Cost Leadership .01 1.16 0,00
State Support X Combination Strategy .04 1.71 0,01
State Support X Focus Strategy .07 1.53 0,01
State Support X Group Membership .02 1.29 0,00
R 0.27 0.38 0.28 0.40 0.40 0.45 0.50
R2 .07 .15 .08 .16 0.16 .20 .25***
Adj R2 .06 .12 .05 .11 0.11 .16 .16
F 5.54*** 5.21*** 2.59** 3.526*** 3.53*** 4.11*** 2.66***
CVs = Control Variables, IVs=Industry Variables, SVs= Strategic Variables, Other variables (business group and state support)
***p<0.001, **p<0.05, *p<0.10,

37
Figure 1
The impact of structure versus strategy variables (Dependent variable: NPM)
Adj. R2 =0.01
Model 1
(Control Variables)
Adj. R2 =0.12
Model 2
(Control Variables + Industry)
Adj. R2 =0.04
Model 3
(Control Variables + Strategy)
Adj. R2 =0.12
Model 4 & 5
(Control Variables+ Industry + Strategy)
ΔF=3.03
ΔR2=0.05
p<0.05
(from model 1 to
model 3)
ΔF=5.92
ΔR2=0.09
p<0.001
(from model 3 to
model 5)
ΔF=8.26
ΔR2=0.13
p<0.001
(from model 1
to model 2)
ΔF=0.98
ΔR2=0.02
p>0.10
(from model 2
to model 4)

38
Figure 2
The impact of structure versus strategy variables (Dependent variable: Productivity)
Adj. R2 =0.06
Model 1
(Control Variables)
Adj. R2 =0.12
Model 2
(Control Variables + Industry)
Adj. R2 =0.05
Model 3
(Control Variables + Strategy)
Adj. R2 =0.12
Model 4 and 5
(Control Variables+ Industry + Strategy)
ΔF=0.43
ΔR2=0.01
p>0.10
(from model 1 to
model 3)
ΔF=4.82
ΔR2=0.08
p<0.001
(from model 3
to model 5)
ΔF=4.68
ΔR2=0.08
p<0.001
(from model 1
to model 2)
ΔF=0.64
ΔR2=0.01
p>0.10
(from model
2 to model 4)

39
Figure 3. Relative importance of independent variables based on LMG Metrics of Model
6 (Dependent variable: NPM)

40
Figure 4
Relative importance of independent variables based
on LMG Metrics of Model 6 (Dependent variable: productivity)

41
Appendix A: Factor Structure of Industry Variables
Industry Variables/Items a
Sta
nd
ard
Fact
or
Load
ing
Fact
or
load
ing
Competitive Intensity (CuV=24, α=0.83)
Customers try to find innovative products in our industry1, 2 .79 .74
Customer preferences change rapidly in our industry.1, 2 .80 .72
The substitute products change rapidly.3 .63 .64
There is a constant need to develop new sales and marketing strategies in our industry.1 .55 .48
The products and services are being out of date overnight. 2 .65 .71
There is constant competition in our industry.3, 4 .66 .64
The marketing practices and strategies change constantly.1 .46 .57
There is a new competitive move almost every day in our industry.1, 2 .65 .75
It is difficult to predict market change in our industry.4 .44 .66
There is price based competition in our industry.5 .52 .71
State Support Items (CuV=32, α=0.63)
It is important for us to have close ties with managers of the state and local organization.7 .71 .77
The state and the state owned institution can protect some firms in the industry.7 .52 .73
The significant buyer is the state in our industry.7 .50 .64
The state incentive towards our industry increases.7 .42 .46
Technological dynamism (CuV=39, α=0.35)
Thechonolical change creates new opportunites in our industy.2 .33 .77
Technology changes rapidly in our industry.2, 5 .10 .70
It is accepted that there will be industry growth.4 .14 .57
Power of Supplier (CuV=46, α=0.61)
Firms in our industry experience difficulty to procure raw materials or main inputs.5 .88 .79
Long term ties with suppliers are significant obstacles in our industry.6 .33 .72
There are alternative suppliers of raw materials or main inputs in our industry(R).4 .29 .53

42
Low Entry Barrier (CuV=54, α=0.57)
New firms emerge almost every day in our industry.5 .37 .76
It is difficult to enter in our industry(R)4 .94 .72
Considerable amount of capital is necessary for entering in our industry(R)6 .38 .57
Substitute Products (CuV=59, α=NA)
Substitute products in the market create significant threats in our industry.4 1.00 .77
a CuV= Cumulative variance (%),α =Cronbach's alpha of the factor
b Since Cronbach's alpha (α) of this factor was only 35, and the standard factor loading of confirmatory factor analysis shows the items have
insignificant loading, this variable (technological environment) is dropped from further analysis. 1questions were adapted or inspired from Miller, D. (1987). 2questions were adapted or inspired from DeSarbo, Benedetto, Song and Sinha, (2005). 3 questions were adapted or inspired from Galbreath and Galvin (2008). 4 questions were adapted or inspired from Powell (1996). 5 questions were adapted or inspired from Kim and Lim (1988). 6 questions were adapted or inspired from Karakaya, and Stahl (1989). 7 questions were adapted or inspired from Bugra (2008), and Boratav (2006).
Test results of Confirmatory factor analysis: χ² testi/SD= 1.80; CFI=0.90; IFI=0.91; RMSEA=0.06; SRMR= 0.09

43
Appendix B: Factor Structure of Strategy Variables
Strategy Variables /Items a Fact
or
Load
ings
(in
Mola
r S
econ
d O
rder
An
aly
sis)
Sta
nd
ard
Fact
or
Load
ing
Fact
or
load
ings
Overall Differentiation Strategy (molar second-order factor of differentiation strategy) (CuV=63, α=0.69)
Differentiation in Quality (CuV=16, α=0.79) .75
Apply strict quality control.1 .77 .80
Provide the highest quality products.2 .69 .73
Employ high quality human resource.1,2 .64 .74
Being first mover.2 .67 .60
Provide high quality customer services.1 .50 .55
Improve the production or service processes.1,2 .45 .53
Differentiation in Marketing (CuV=29, α=0.82) .78
Influence the distribution channel.1 .75 .77
Develop new marketing technique.1 .78 .72
Increase the intensity of advertisement.1,2 .64 .73
Promote the firm image.2 .61 .64
Improve the firm brands.1 .62 .61
Target customers with high income level.1 .50 .58
Using promotion strategy towards intermediates and distributers.2 .42 51
Differentiation in Product (CuV=39, α=0.79) .84
Develop new products.1, 2 .55 .73
Produce a wide variety of products.1,2 .75 .74
Provide multi-functional products.1,2 .59 .60
Adapt product mix according to the economic condition.2 .57 .54
Improve current products or services.1,2 .71 .51
Sell different products to different market segments.2 .51
Low cost strategy (CuV=48, α=0.72)
Produce at the minimum cost level.2 .79 .82
Set prices lower than the competitors.1,2 .60 .80
44
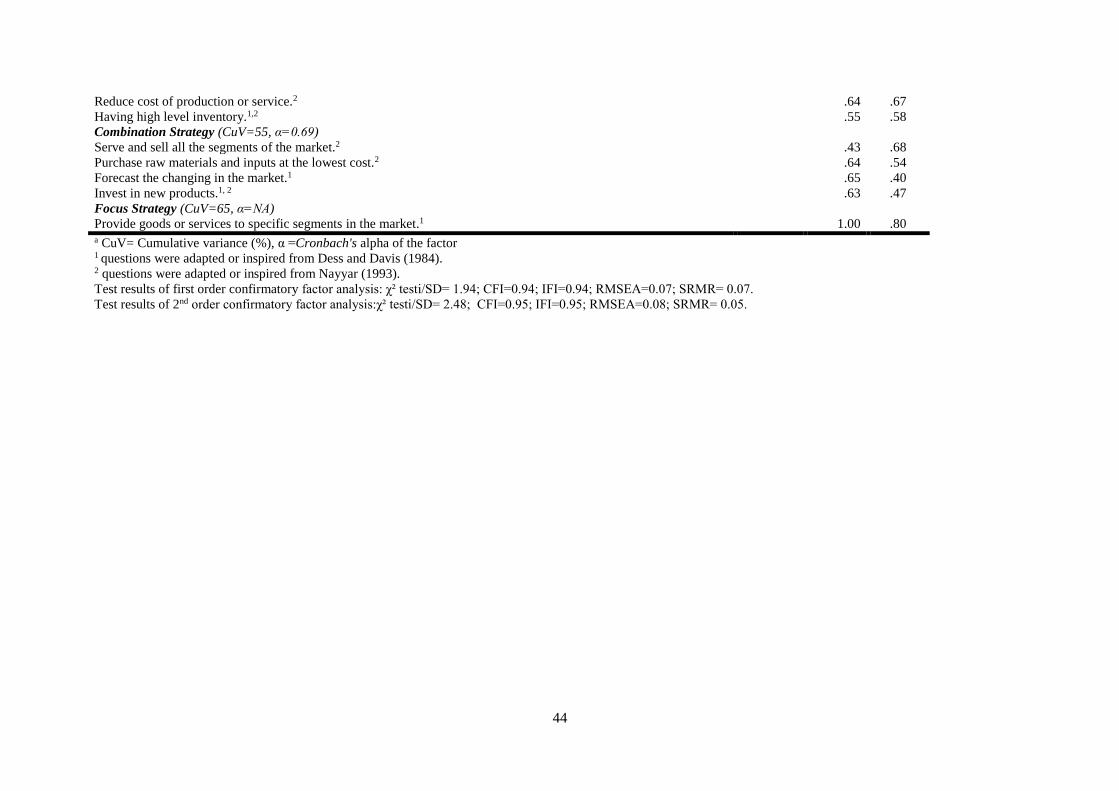
Reduce cost of production or service.2 .64 .67
Having high level inventory.1,2 .55 .58
Combination Strategy (CuV=55, α=0.69)
Serve and sell all the segments of the market.2 .43 .68
Purchase raw materials and inputs at the lowest cost.2 .64 .54
Forecast the changing in the market.1 .65 .40
Invest in new products.1, 2 .63 .47
Focus Strategy (CuV=65, α=NA)
Provide goods or services to specific segments in the market.1 1.00 .80 a CuV= Cumulative variance (%), α =Cronbach's alpha of the factor
1 questions were adapted or inspired from Dess and Davis (1984). 2 questions were adapted or inspired from Nayyar (1993).
Test results of first order confirmatory factor analysis: χ² testi/SD= 1.94; CFI=0.94; IFI=0.94; RMSEA=0.07; SRMR= 0.07.
Test results of 2nd order confirmatory factor analysis:χ² testi/SD= 2.48; CFI=0.95; IFI=0.95; RMSEA=0.08; SRMR= 0.05.