antenna & wave propagation lab - electronics club · 0 shriram college of engineering &...
TRANSCRIPT
0 ShriRam College of Engineering & Managment
National Expressway (A.B. Road), Banmore
ANTENNA & WAVE PROPAGATION LAB
CONTENTS
S. No. List of Experiment Page
No
1. To study and plot the radiation pattern of simple dipole antenna. 01 – 04
2. To study and plot the radiation pattern of Half Wave dipole antenna. 05 – 07
3. To study and plot the radiation pattern of folded dipole antenna. 08 – 10
4. To study and plot the radiation pattern of 5 Element YagiUda
antenna. 11 – 13
5. To study and plot the radiation pattern of Log Periodic antenna. 14 – 16
6. To study and plot the radiation pattern of helical antenna. 17 – 19
7. To study and plot the radiation pattern of cut parabolic antenna with
simpledipole feed . 20 - 22
8. To study various types of parabolic reflectors and their feed systems. 23 - 25
9. To study and plot the radiation pattern of broad side antenna array. 26 - 27
Lab In-charge
1 ShriRam College of Engineering & Managment
National Expressway (A.B. Road), Banmore
Experiment No.1
Objective:
To study and plot the radiation pattern of simple dipole antenna.
Apparatus:
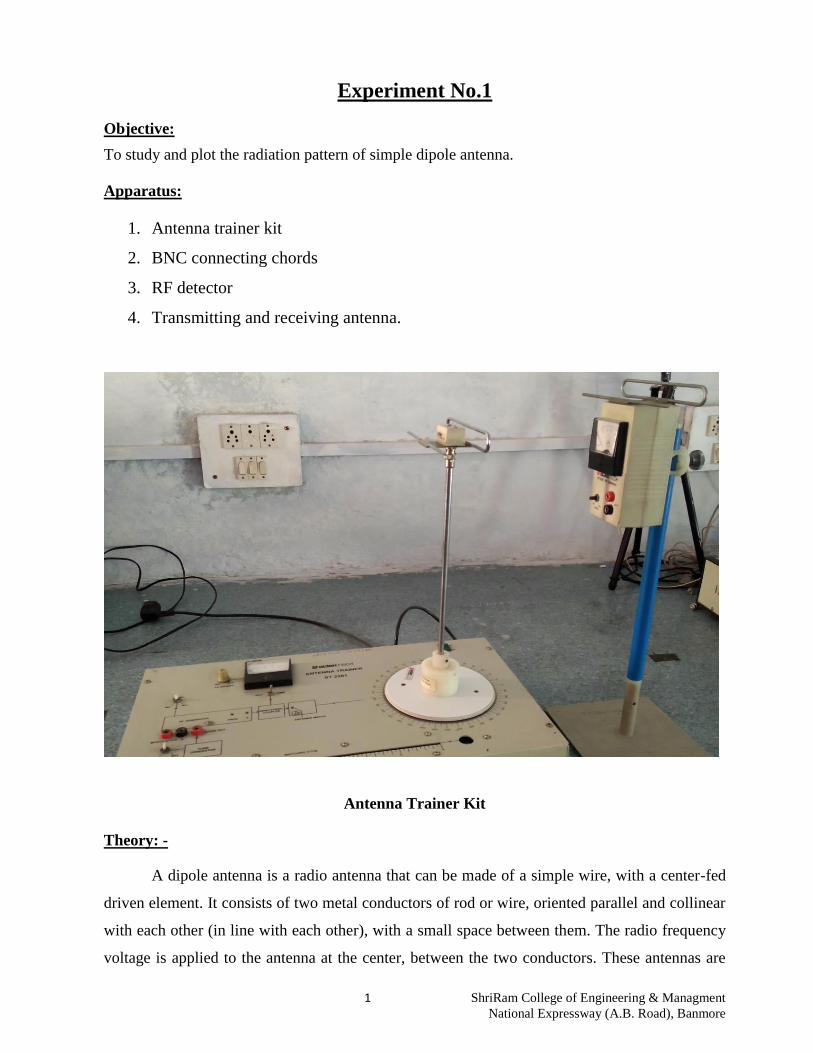
1. Antenna trainer kit
2. BNC connecting chords
3. RF detector
4. Transmitting and receiving antenna.
Antenna Trainer Kit
Theory: -
A dipole antenna is a radio antenna that can be made of a simple wire, with a center-fed
driven element. It consists of two metal conductors of rod or wire, oriented parallel and collinear
with each other (in line with each other), with a small space between them. The radio frequency
voltage is applied to the antenna at the center, between the two conductors. These antennas are

2 ShriRam College of Engineering & Managment
National Expressway (A.B. Road), Banmore
the simplest practical antennas from a theoretical point of view. They are used alone as antennas,
notably in traditional "rabbit ears" television antennas, and as the driven element in many other
types of antennas, such as the Yagi. Dipole antennas were invented by German physicist
Heinrich Hertz around 1886 in his pioneering experiments with radio waves.
A short dipole is a physically feasible dipole formed by two conductors with a total
length very small compared with the wavelength λ. The two conducting wires are fed at the
center of the dipole. We assume the hypothesis that the current is maximal at the center (where
the dipole is fed) and that it decreases linearly to be zero at the ends of the wires. Note that the
direction of the current is the same in both the dipole branches - to the right in both or to the left
in both. The far field E_θof the electromagnetic wave radiated by this dipole is:
Emission is maximal in the plane perpendicular to the dipole and zero in the direction of
wires which is the direction of the current. The emission diagram is circular section torus shaped
(right image) with zero inner diameter. In the left image the doublet is vertical in the torus center.

3 ShriRam College of Engineering & Managment
National Expressway (A.B. Road), Banmore
Procedure:
1. Mount the antenna on transmitting mast.
2. Bring the detector assembly near to the main unit and adjust the height of both Tx and Rx
antenna for same.
3. Keep detector assembly away from the main unit about 1 mts and align both of them.
Ensure that there is no reflector sort of thing in the vicinity of the experiment such as
steel structure, mobile phones etc.
4. Adjust the RF detector so that deflection in detector is approx. 30-35 microampere.
5. Align arrow mark of the disk with zero of the goniometer scale.
6. Start taking reading at the interval of 10 degree.
7. Convert the reading into dB with the help of formula.
8. Plot polar plot with all the readings and find HPBW of antenna.
4 ShriRam College of Engineering & Managment
National Expressway (A.B. Road), Banmore
Observation Table:-
Sno. Angle (in degree) Detector current (in
micro ampere)
Power (in dBs)
Result:
The radiation pattern is studied and plot is attached.
Precaution:
Connection and alignment of both antennas should be make carefully.
Reading must be taken carefully.
-------------------------------

5 ShriRam College of Engineering & Managment
National Expressway (A.B. Road), Banmore
Experiment No.2
Object:
To study and plot the radiation pattern of Half wave dipole antenna.
Apparatus:
1. Antenna trainer kit
2. BNC connecting chords
3. RF detector
4. Transmitting and receiving antenna
Antenna Trainer Kit
Theory: The half-wave dipole antenna is just a special case of the dipole antenna, but its
important enough that it will have its own section. Note that the "half-wave" term

6 ShriRam College of Engineering & Managment
National Expressway (A.B. Road), Banmore
means that the length of this dipole antenna is equal to a half wavelength at the
frequency of operation. One wavelength at 600 MHz is meters.
Hence, the half wavelength dipole antenna's length is 0.25 meters. The half-wave
dipole antenna is as you may expect, a simple half-wavelength wire fed at the
center as shown in Figure 1:
The input impedance of the half-wavelength dipole antenna is given by Zin = 73 +
j42.5 Ohms. The fields from the half-wave dipole antenna are given by:
The directivity of a half-wave dipole antenna is 1.64 (2.15 dB). The HPBW is 78
degrees. In viewing the impedance as a function of the dipole length in the section on
dipole antennas, it can be noted that by reducing the length slightly the antenna can
become resonant. If the dipole's length is reduced to 0.48, the input impedance of the
antenna becomes Zin = 70 Ohms, with no reactive component. This is a desirable
property, and hence is often done in practice. The radiation pattern remains virtually the
same.

7 ShriRam College of Engineering & Managment
National Expressway (A.B. Road), Banmore
Procedure:
1. Mount the antenna on transmitting mast.
2. Bring the detector assembly near to the main unit and adjust the height of both
Tx and Rx antenna for same.
3. Keep detector assembly away from the main unit about 1 mts and align both of
them. Ensure that there is no reflector sort of thing in the vicinity of the
experiment such as steel structure, mobile phones etc.
4. Adjust the RF detector so that deflection in detector is approx. 30-35
microampere
5. Align arrow mark of the disk with zero of the goniometer scale
6. Start taking reading at the interval of 10 degree.
7. Convert the reading into dB with the help of formula
8. Plot polar plot with all the readings and find HPBW of antenna
Observation Table:-
S.No. Angle (in degree) Detector current (in
micro ampere)
Power (in dBs)
Result: The radiation pattern is studied and plot is attached
Precaution:-
1. Connection and alignment of both antennas should be make carefully.
2. Reading must be taken carefully.
------------------------------

8 ShriRam College of Engineering & Managment
National Expressway (A.B. Road), Banmore
Experiment No.3
Object: To study and plot the radiation pattern of folded dipole antenna.
Apparatus:
1. Antenna trainer kit
2. BNC connecting chords
3. RF detector
4. Transmitting and receiving antenna
Theory:
The use of parasitic elements and various stacking arrangements causes a
reduction in the radiation resistance of a center-fed, half-wave antenna. Under these
conditions obtaining a proper impedance match between the radiator and the
transmission line is often difficult. A convenient method of overcoming these
difficulties is to use a FOLDED DIPOLE in place of the center-fed radiator. A
FOLDED DIPOLE is an ordinary half-wave antenna that has one or more additional
conductors connected across its ends. Additional conductors are mounted parallel to the
dipole elements at a distance equal to a very small fraction of a wavelength. The feed-
point impedance can be further increased by using three or four properly spaced parallel
conductors.
9 ShriRam College of Engineering & Managment
National Expressway (A.B. Road), Banmore
Standard feed-line SPREADERS are used to maintain this spacing when
required. In any folded dipole, the increase of impedance is the square of the number of
conductors used in the radiator. Thus, a three-wire dipole has nine times (32) the feed-
point impedance of a simple center-fed dipole. Second method of stepping up the
impedance of a folded dipole is to use two conductors with different radii, as shown in
view B. The directional characteristics of a folded dipole are the same as those of a
simple dipole. However, the reactance of a folded dipole varies much more slowly as
the frequency is varied from resonance. Because of this the folded dipole can be used
over a much wider frequency range than is possible with a simple dipole. A folded
dipole is a half-wave dipole with an additional wire connecting its two ends. If the
additional wire has the same diameter and cross-section as the dipole, two nearly
identical radiating currents are generated. The resulting far-field emission pattern is
nearly identical to the one for the single-wire dipole described above; however, at
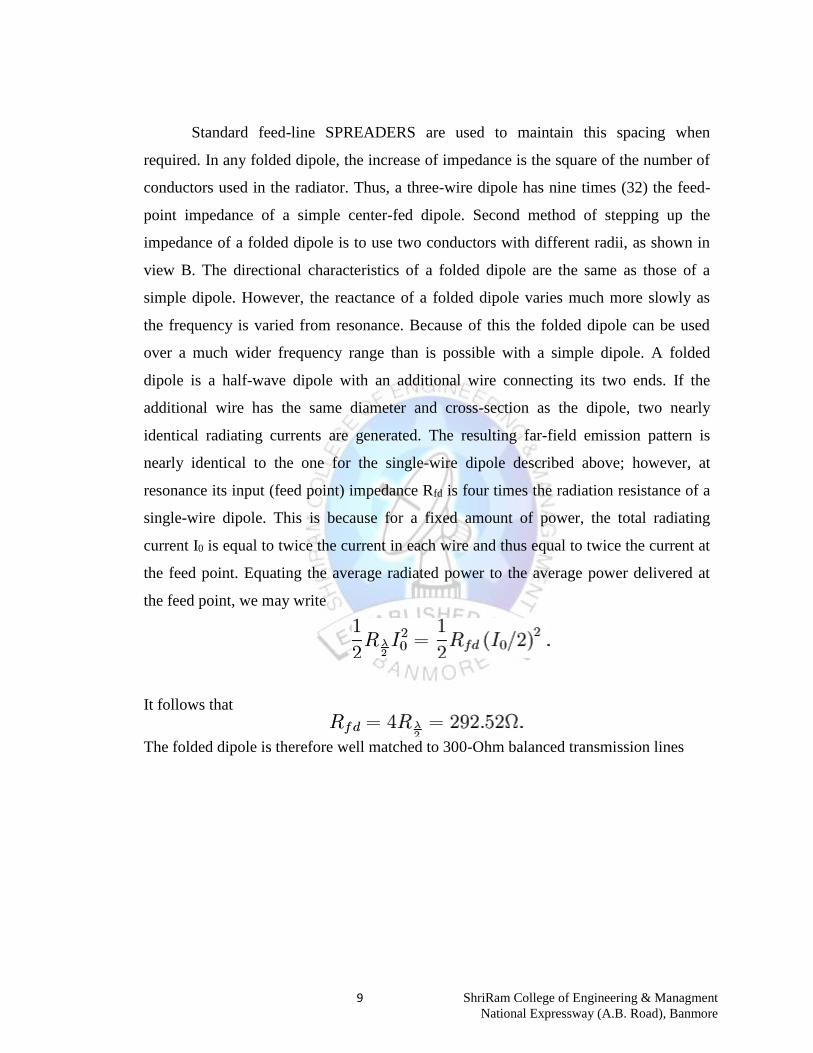
resonance its input (feed point) impedance Rfd is four times the radiation resistance of a
single-wire dipole. This is because for a fixed amount of power, the total radiating
current I0 is equal to twice the current in each wire and thus equal to twice the current at
the feed point. Equating the average radiated power to the average power delivered at
the feed point, we may write
It follows that
The folded dipole is therefore well matched to 300-Ohm balanced transmission lines

10 ShriRam College of Engineering & Managment
National Expressway (A.B. Road), Banmore
Procedure:
1. Mount the antenna on transmitting mast.
2. Bring the detector assembly near to the main unit and adjust the height of both
Tx and Rx antenna for same.
3. Keep detector assembly away from the main unit about 1 mts and align both of
them. Ensure that there is no reflector sort of thing in the vicinity of the
experiment such as steel structure, mobile phones etc.
4. Adjust the RF detector so that deflection in detector is approx. 30-35
microampere
5. Align arrow mark of the disk with zero of the goniometer scale
6. Start taking reading at the interval of 10 degree.
7. Convert the reading into dB with the help of formula
8. Plot polar plot with all the readings and find HPBW of antenna
Observation Table:-
S.No. Angle (in degree) Detector current (in
micro ampere)
Power (in dBs)
Result: The radiation pattern is studied and plot is attached
Precaution:-
1. Connection and alignment of both antennas should be make carefully.
2. Reading must be taken carefully.
-------------------------------

11 ShriRam College of Engineering & Managment
National Expressway (A.B. Road), Banmore
Experiment No.4
Object: - To study and plot the radiation pattern of YagiUda antenna.
Apparatus: -
1. Antenna trainer kit
2. BNC connecting chords
3. RF detector
4. Transmitting andreceiving antenna.
Antenna Trainer Kit
Theory:-
Yagi-Uda antennas are directional along the axis perpendicular to the dipole in the plane of
theelements, from the reflector through the driven element and out via the director(s). Typically
all elements arespaced about a quarter-wavelength apart. All elements usually lie in the same
plane, supported on a singleboom or crossbar;however, they do not have to assume this
coplanararrangement: for example, somecommercially available Yagi-Uda antennas for
television reception have several reflectors arranged to formacorner reflector behind the dipole.

12 ShriRam College of Engineering & Managment
National Expressway (A.B. Road), Banmore
The bandwidth of a Yagi-Uda antenna, which is usually defined as the frequency range
for which the antenna provides a good match to the transmission line to which it is attached, is
determined by the length, diameter and spacing of the elements. For most designs bandwidth is
typically only a few percent of the design frequency.Yagi-Uda antennas can be designed to
operate on multiple bands. Such designs are more complicated, using pairs of resonant parallel
coiland capacitor combinations (called a "trap" or LC) in the elements. The trap serves to isolate
the outer portion of an element from the inner portion at the trap design frequency. In practice
the higher frequency traps are located closest to the boom of the antenna. Typically, a triband
beam will have two pairs of traps per element. For example, a triband design covering the 10, 15
and
20 meter bands would have traps for the 10 and 15 meter bands. The use of traps is not without
disadvantages, as they reduce the bandwidth of the antenna on each band and reduce its overall
efficiency. In order to understand the operation of a Yagi-Uda, a simple antenna consisting of a
reflector, driven element and a single director as discussed in the previous section will be
studied. The driven element is typically a λ/2 dipole and is the only member of the structure that
is excited. With all the other elements being parasitic, the antenna can be thought.
The reflector being longer than λ/2 has an inductive reactance which means the current
phase lags that of the voltage. The directors on the other hand, being shorter than λ/2 has a
capacitive reactance with the voltage phase lagging that of the current. With the voltage across
the driven element being in phase with the induced voltages across the parasitic elements, the
current in the reflector lags the current in the driven element which in turn lags the current in the
director. The antenna can therefore be thought of as a phased array with each of the elements
being excited by a current with a progressive phase shift, starting from the reflector. By tuning

13 ShriRam College of Engineering & Managment
National Expressway (A.B. Road), Banmore
the lengths of the reflector and directors and the distance between the elements, theantenna beam
is directed towards one angle increasing the gain.
Procedure:-
1. Mount the antenna on transmitting mast.
2. Bring the detector assembly near to the main unit and adjust the height of both Tx and Rx
antenna for same.
3. Keep detector assembly away from the main unit about 1 mts and align both of them.
Ensure that there is no reflector sort of thing in the vicinity of the experiment such as
steel structure, mobile phones etc.
4. Adjust the RF detector so that deflection in detector is approx. 30-35 microampere
5. Align arrow mark of the disk with zero of the goniometer scale
6. Start taking reading at the interval of 10 degree.
7. Convert the reading into dB with the help of formula
8. Plot polar plot with all the readings and find HPBW of antenna
Observation Table:-
S.No. Angle (in degree) Detector current (in
micro ampere)
Power (in dBs)
Result: The radiation pattern is studied and plot is attached
Precaution:-
1. Connection and alignment of both antennas should be make carefully.
2. Reading must be taken carefully.
-------------------------------

14 ShriRam College of Engineering & Managment
National Expressway (A.B. Road), Banmore
Experiment No.5
Object: - To study and plot the radiation pattern of Log Periodic antenna.
Apparatus: -
1. Antenna trainer kit
2. BNC connecting chords
3. RF detector
4. Transmitting andreceiving antenna.
Antenna Trainer Kit
Theory:-
In telecommunication, a log-periodic antenna (LP, also known as a log-periodic array)
is abroadband,multi-element, unidirectional, narrow-beam antenna that has impedance and
radiation characteristics that are regularlyrepetitive as a logarithmic function of the excitation
frequency. The individual components are often dipoles, as ina log-periodic dipole array
(LPDA). Log-periodic antennas are designed to be self-similar andare thus also fractal antenna
arrays.

15 ShriRam College of Engineering & Managment
National Expressway (A.B. Road), Banmore
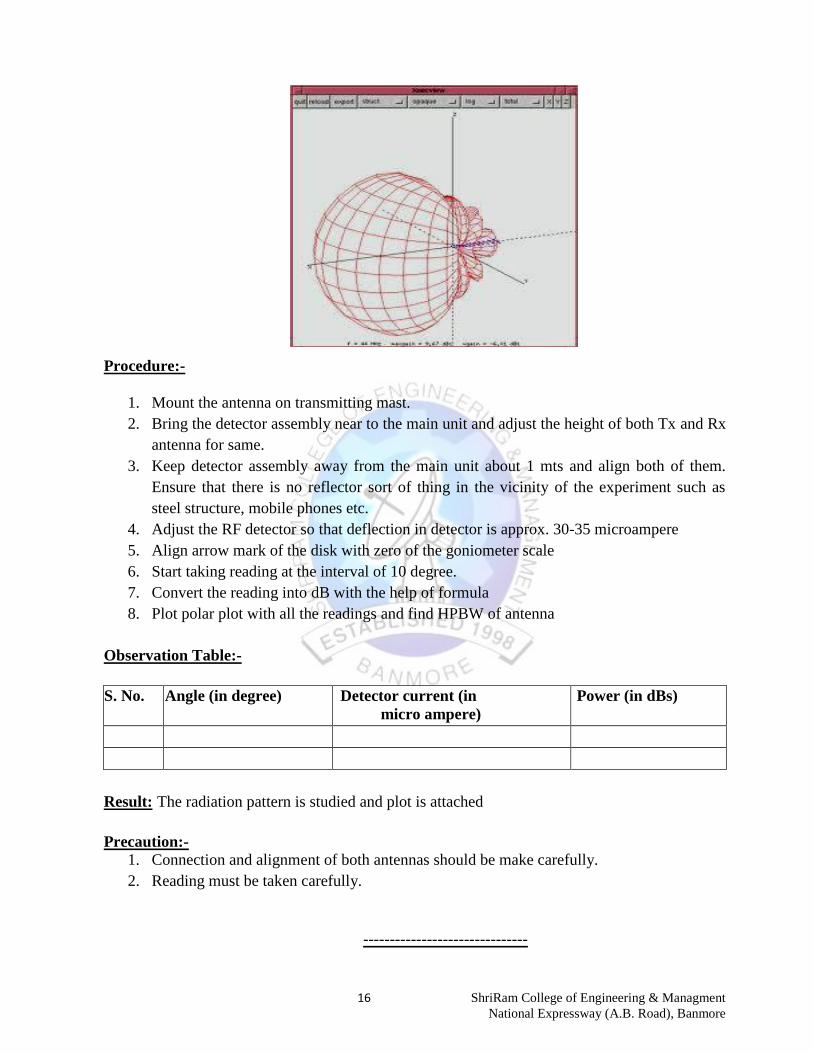
The log periodic antenna is used in a number of applications where a wide bandwidth is
requiredalong with directivity and a modest level of gain. It is sometimes used on the HF portion
of the spectrumwhere operation is required on a number of frequencies to enable communication
to be maintained. It is alsoused at VHF and UHF for a variety of applications, including some
uses as a television antenna.
It is possible to explain the operation of a log periodic array in straightforward terms. The feeder
polarity isreversed between successive elements. Take the condition when this RF antenna is
approximately in themiddle of its operating range. When the signal meets the first few elements
it will be found that they arespaced quite close together in terms of the operating wavelength.
This means that the fields from theseelements will cancel one another out as the feeder sense is
reversed between the elements. Then as the signalprogresses down the antenna a point is reached
where the feeder reversal and the distance between theelements gives a total phase shift of about
360 degrees. At this point the effect which is seen is that of twophased dipoles. The region in
which this occurs is called the active region of the RF antenna. Although theexample of only two
dipoles is given, in reality the active region can consist of more elements. The actualnumber
depends upon the angle [greek letter alpha] and a design constant.
The elements outside the active region receive little direct power. Despite this it is found that the
largerelements are resonant below the operational frequency and appear inductive. Those in front
resonate abovethe operational frequency and are capacitive. These are exactly the same criteria
that are found in the Yagi.
Accordingly the element immediately behind the active region acts as a reflector and those in
front act asdirectors. This means that the direction of maximum radiation is towards the feed
point.
16 ShriRam College of Engineering & Managment
National Expressway (A.B. Road), Banmore
Procedure:-
1. Mount the antenna on transmitting mast.
2. Bring the detector assembly near to the main unit and adjust the height of both Tx and Rx
antenna for same.
3. Keep detector assembly away from the main unit about 1 mts and align both of them.
Ensure that there is no reflector sort of thing in the vicinity of the experiment such as
steel structure, mobile phones etc.
4. Adjust the RF detector so that deflection in detector is approx. 30-35 microampere
5. Align arrow mark of the disk with zero of the goniometer scale
6. Start taking reading at the interval of 10 degree.
7. Convert the reading into dB with the help of formula
8. Plot polar plot with all the readings and find HPBW of antenna
Observation Table:-
S. No. Angle (in degree) Detector current (in
micro ampere)
Power (in dBs)
Result: The radiation pattern is studied and plot is attached
Precaution:-
1. Connection and alignment of both antennas should be make carefully.
2. Reading must be taken carefully.
-------------------------------

17 ShriRam College of Engineering & Managment
National Expressway (A.B. Road), Banmore
Experiment No.6
Objective: To study and plot the radiation pattern of Helical antenna.
Apparatus:
1. Antenna trainer kit
2. BNC connecting chords
3. RF detector
4. Transmitting and receiving antenna
Theory:
A helical antenna is an antenna consisting of a conducting wire wound in the form of a
helix. In most cases, helical antennas are mounted over a ground plane. The feed line is
connected between the bottom of the helix and the ground plane. Helical antennas can operate in
one of two principal modes: normal mode or axial mode. In the normal mode or broadside helix,
the dimensions of the helix (the diameter and the pitch) are small compared with the wavelength.
The antenna acts similarly to an electrically short dipole or monopole, and the radiation pattern,
similar to these antennas is Omni directional, with maximum radiation at right angles to the helix
axis. The radiation is linearly polarized parallel to the helix axis. In the axial mode or end-fire
helix, the dimensions of the helix are comparable to a wavelength. The antenna functions as a
directional antenna radiating a beam off the ends of the helix, along the antenna's axis. It radiates
circularly polarized radio waves.

18 ShriRam College of Engineering & Managment
National Expressway (A.B. Road), Banmore
Broadside helical
Radiating at 90 degrees from the axis of the helix this design is efficient as a practical reduced-
length radiator when compared with the operation of other types such as base-loaded, top-loaded
or center-loaded whips. They are typically used for applications where reduced size is a critical
operational factor.
End-fire helical
In the axial mode, the helix dimensions are at or above the wavelength of operation. The antenna
then falls under the class of waveguide antennas, and produces a true and consistent circular
polarization. The main lobes of the radiation pattern are along the axis of the helix, off both ends.
Since in a directional antenna only radiation in one direction is wanted, the other end of the helix
is terminated in a flat metal sheet orscreen reflector to reflect the waves forward.
Terminal impedance in axial mode ranges between 100 and 200 ohms. The resistive part is
approximated by:
where R is resistance in ohms, C is the circumference of the helix, and λ is the wavelength.
Impedance matching to the cable C is often done by a short stripline section between the helix
and the cable termination.

19 ShriRam College of Engineering & Managment
National Expressway (A.B. Road), Banmore
Procedure: -
1. Mount the antenna on transmitting mast.
2. Bring the detector assembly near to the main unit and adjust the height of both Tx and Rx
antenna for same.
3. Keep detector assembly away from the main unit about 1 mts and align both of them.
Ensure that there is no reflector sort of thing in the vicinity of the experiment such as
steel structure, mobile phones etc.
4. Adjust the RF detector so that deflection in detector is approx. 30-35 microampere
5. Align arrow mark of the disk with zero of the goniometer scale
6. Start taking reading at the interval of 10 degree.
7. Convert the reading into dB with the help of formula
8. Plot polar plot with all the readings and find HPBW of antenna
Observation Table:-
S. No. Angle (in degree) Detector current (in
micro ampere)
Power (in dBs)
Result: The radiation pattern is studied and plot is attached
Precaution:-
1. Connection and alignment of both antennas should be make carefully.
2. Reading must be taken carefully.
-------------------------------

20 ShriRam College of Engineering & Managment
National Expressway (A.B. Road), Banmore
Experiment No.7 Objective:
To study and plot the radiation pattern of Parabolic reflector antenna.
Apparatus:
1. Antenna trainer kit
2. BNC connecting chords
3. RF detector
4. Transmitting and receiving antenna.
Theory:
A parabolic antenna is an antenna that uses a parabolic reflector, a surface with the
cross-sectional shape of a parabola, to direct the radio waves. The most common form is shaped
like a dish and is popularly called a dish antenna or parabolic dish. The main advantage of a
parabolic antenna is that it is highly directive; it functions analogously to a searchlight or
flashlight reflector to direct the radio waves in a narrow beam, or receive radio waves from one
particular direction only. Parabolic antennas have some of the highest gains, that are they can
produce the narrowest beam width angles, of any antenna type. They are used as high-gain
antennas for point-to-point radio, television and data communications, and also for radiolocation
(radar), on the UHF and microwave (SHF) parts of the radio spectrum. The relatively short
wavelength of electromagnetic radiation at these frequencies allows reasonably sized reflectors
to exhibit the desired highly directional response.

21 ShriRam College of Engineering & Managment
National Expressway (A.B. Road), Banmore
The directive qualities of an antenna are measured by a dimensionless parameter called its gain,
which is the ratio of the power received by the antenna from a source along its beam axis to the
power received by a hypothetical isotropic antenna. The gain of a parabolic antenna is:
where:
A is the area of the antenna aperture, that is, the mouth of the parabolic reflector
d is the diameter of the parabolic reflector
λ is the wavelength of the radio waves.
is a dimensionless parameter called the aperture efficiency. The aperture efficiency of
typical parabolic antennas is 0.55 to 0.70.
Procedure:-
1. Mount the antenna on transmitting mast.
2. Bring the detector assembly near to the main unit and adjust the height of both Tx and
Rx antenna for same.

22 ShriRam College of Engineering & Managment
National Expressway (A.B. Road), Banmore
3. Keep detector assembly away from the main unit about 1 mts and align both of them.
Ensure that there is no reflector sort of thing in the vicinity of the experiment such as
steel structure, mobile phones etc.
4. Adjust the RF detector so that deflection in detector is approx. 30-35 microampere
5. Align arrow mark of the disk with zero of the goniometer scale
6. Start taking reading at the interval of 10 degree.
7. Convert the reading into dB with the help of formula
8. Plot polar plot with all the readings and find HPBW of antenna
Observation Table:-
S. No. Angle (in degree) Detector current (in
micro ampere)
Power (in dBs)
Result: The radiation pattern is studied and plot is attached
Precaution:-
1. Connection and alignment of both antennas should be make carefully.
2. Reading must be taken carefully.
-------------------------------

23 ShriRam College of Engineering & Managment
National Expressway (A.B. Road), Banmore
Experiment No.8
Object: To study and plot the radiation pattern of Broad side antenna array.
Apparatus:
1. Antenna trainer kit
2. BNC connecting chords
3. RF detector
4. Transmitting and receiving antenna
Theory:
When α = 0°, all the elements are in phase and pattern maxima occur at φ = 0° and φ =
180°, thatis, in the directions perpendicular to the line of the array. This configuration is called a
broadside array. Thepattern will be maximum in these directions regardless of the element
spacing, d. These will be the onlyprimary maxima if d < λ. If d = λ, additional maxima occur at φ
= 90° and φ = 270°. As d isincreased still further, additional maxima occur as cones of radiation
about the axis of the array. They areknown as grating lobes, analogous to the lobes observed in
the optical study of a diffraction or reflectiongrating. Ordinarily, therefore, the spacing of
elements in a broadside array is kept less than a wavelength.However, there is an advantage in
spacing the elements of an array by more than half a wavelength. For atwo-element array the
optimum spacing is about 0.7λ, for a four-element array it is about 0.8λ and for alarge number of
elements the optimum is about 0.95λ. The directivity increases gradually as the spacing
isincreased until the optimum is reached, then drops rather sharply with further increase. The
advantage of thewider spacing is in the directivity obtainable with a given number of elements.
In terms ofthe ratio of the directivity to the total length of the array, there is no advantage in the
wider spacing. Theseobservations can be seen in the applet. Although the above discussion is
based on a uniform linear broadsidearray of point-source isotropic radiators, they apply also to a
similar array of dipoles. These dipoles havetheir centers on the array line and their axes
perpendicular to the array line and parallel toeach other. The pattern is in the plane perpendicular
to the dipole axes, that is, the x-y planeas shown in Figure.

24 ShriRam College of Engineering & Managment
National Expressway (A.B. Road), Banmore
The polarization of the array follows the direction of the dipoles. If the array line is
horizontal and the dipole axes are vertical, the radiation is vertically polarized. If the array line is
horizontal and the dipole axes are horizontal, as shown in Figure , the radiation is horizontally
polarized .The in-phase currents in the individual dipoles, required for a broadside pattern, may
be obtained by properly connecting a branched transmission line to the feed point of each dipole.
That is, if the total line length from the transmitter to each dipole is the same the dipoles will be
fed in phase. It is important to ensure that the same side of the line is connected to the same side
of each dipole. Reversing this connection reverses the phase. Broadside arrays may also b e
formed from other types of elements, such as horns, slots, helixes and polyrods. If the elements
are unidirectional radiators, such as sectoral or pyramidal horns, waveguide slots, axial mode
helixes and polyrods, a unidirectional broadside array results.
Procedure:
1. Mount the antenna on transmitting mast.
2. Bring the detector assembly near to the main unit and adjust the height of both Tx and Rx
antenna for same.
3. Keep detector assembly away from the main unit about 1 mts and align both of them.
Ensure that there is no reflector sort of thing in the vicinity of the experiment such as
steel structure, mobile phones etc.
4. Adjust the RF detector so that deflection in detector is approx. 30-35 microampere
5. Align arrow mark of the disk with zero of the goniometer scale

25 ShriRam College of Engineering & Managment
National Expressway (A.B. Road), Banmore
6. Start taking reading at the interval of 10 degree.
7. Convert the reading into dB with the help of formula
8. Plot polar plot with all the readings and find HPBW of antenna
Observation Table:-
S. No. Angle (in degree) Detector current (in
micro ampere)
Power (in dBs)
Result: The radiation pattern is studied and plot is attached
Precaution:-
1. Connection and alignment of both antennas should be make carefully.
2. Reading must be taken carefully.
-------------------------------
26 ShriRam College of Engineering & Managment
National Expressway (A.B. Road), Banmore
Experiment No.9
Object:- To study and plot the radiation pattern of End fire antenna array.
Apparatus: -
1. Antenna trainer kit
2. BNC connecting chords
3. RF detector
4. Transmitting and receiving antenna
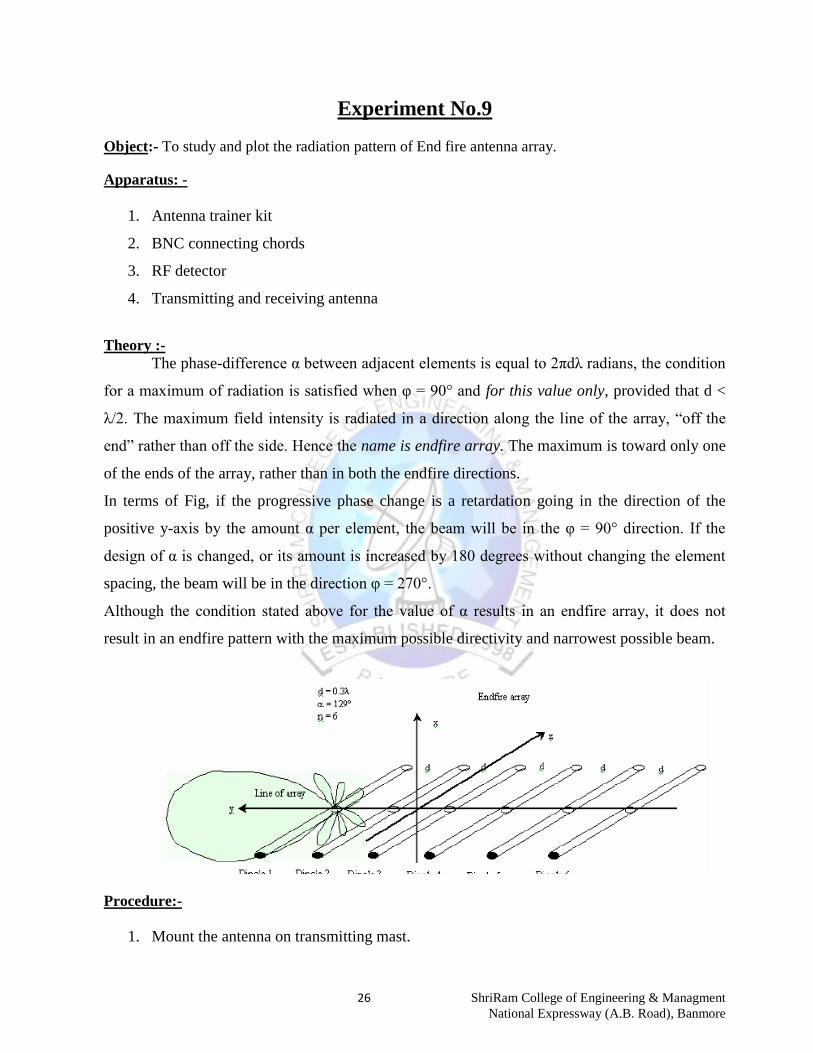
Theory :-
The phase-difference α between adjacent elements is equal to 2πdλ radians, the condition
for a maximum of radiation is satisfied when φ = 90° and for this value only, provided that d <
λ/2. The maximum field intensity is radiated in a direction along the line of the array, “off the
end” rather than off the side. Hence the name is endfire array. The maximum is toward only one
of the ends of the array, rather than in both the endfire directions.
In terms of Fig, if the progressive phase change is a retardation going in the direction of the
positive y-axis by the amount α per element, the beam will be in the φ = 90° direction. If the
design of α is changed, or its amount is increased by 180 degrees without changing the element
spacing, the beam will be in the direction φ = 270°.
Although the condition stated above for the value of α results in an endfire array, it does not
result in an endfire pattern with the maximum possible directivity and narrowest possible beam.
Procedure:-
1. Mount the antenna on transmitting mast.

27 ShriRam College of Engineering & Managment
National Expressway (A.B. Road), Banmore
2. Bring the detector assembly near to the main unit and adjust the height of both Tx and Rx
antenna for same.
3. Keep detector assembly away from the main unit about 1 mts and align both of them.
Ensure that there is no reflector sort of thing in the vicinity of the experiment such as
steel structure, mobile phones etc.
4. Adjust the RF detector so that deflection in detector is approx. 30-35 microampere
5. Align arrow mark of the disk with zero of the goniometer scale
6. Start taking reading at the interval of 10 degree.
7. Convert the reading into dB with the help of formula
8. Plot polar plot with all the readings and find HPBW of antenna
Observation Table:-
Sno. Angle (in degree) Detector current (in
micro ampere)
Power (in dBs)
Result:The radiation pattern is studied and plot is attached.
Precaution:-
1. Connection and alignment of both antennas should be make carefully.
2. Reading must be taken carefully.
-------------------------------