anthropogenic effects on activity patterns of wildlife at ... · anthropogenic effects on activity...
TRANSCRIPT

Anthropogenic effects on activity patterns of wildlifeat crossing structures
MIRJAM BARRUETO,1 ADAM T. FORD,2 AND ANTHONY P. CLEVENGER1,�
1Western Transportation Institute, Montana State University, P.O. Box 174250, Bozeman, Montana 59717 USA2Department of Zoology, University of British Columbia, Biological Sciences Building, Room 4200, 6270 University Boulevard,
Vancouver, British Columbia V6T 1Z4 Canada
Citation: Barrueto, M., A. T. Ford, and A. P. Clevenger. 2014. Anthropogenic effects on activity patterns of wildlife at
crossing structures. Ecosphere 5(3):27. http://dx.doi.org/10.1890/ES13-00382.1
Abstract. Despite the popular perception of protected areas as vestiges of remnant wilderness, the
behavior and activity patterns of wildlife in these areas are still subject to many forms of anthropogenic
disturbances, such as roads, recreation and resource extraction. In Banff National Park, Alberta, efforts to
mitigate the effects of roads on wildlife using wildlife crossing structures (WC) have been successful for a
number of large mammal species, when measured as a reduction in mortality from vehicle collisions or the
restoration of population connectivity; however, a comprehensive view of mitigation success should also
account for the restoration of animal behavior and activity patterns. We evaluated the general hypothesis
that existing WC have mitigated the effects of anthropogenic disturbance on wildlife activity, and predicted
that the activity patterns of wildlife at WC should be similar to those in areas characterized by little or no
human disturbance. We collected data from a long-term monitoring program of activity patterns, in an
assemblage of large mammal species, using a network of camera traps throughout Banff National Park. We
quantified the inter- and intra-specific overlap of diel activity patterns at 39 engineered wildlife crossings,
varying in design (e.g., over and underpasses) and age. We compared activity at WC to baseline conditions
at 126 backcountry sites (BC). In general, activity patterns at WC were found to closely match those at BC.
Of the eight species we examined, only elk and coyotes showed significantly different peaks in activity.
Activity between WC depended on the time of day, the amount of human use and age of the crossing
structure; however, the impact of these factors varied among carnivores and ungulates. Our work
demonstrates that the impact of people on wildlife activity at WC is highly context dependent and that the
restoration of native patterns of activity within protected areas will require management of human activity,
even in relatively remote areas.
Key words: activity patterns; anthropogenic disturbance; Banff National Park; camera traps; large mammals; traffic;
Trans-Canada Highway; wildlife crossing structures.
Received 7 December 2013; revised 1 February 2014; accepted 3 February 2014; published 13 March 2014.
Corresponding Editor: R. R. Parmenter.
Copyright: � 2014 Barrueto et al. This is an open-access article distributed under the terms of the Creative Commons
Attribution License, which permits unrestricted use, distribution, and reproduction in any medium, provided the
original author and source are credited. http://creativecommons.org/licenses/by/3.0/
� E-mail: [email protected]
INTRODUCTION
National parks and other protected areas were
typically created and managed for the preserva-
tion of natural heritage and conservation of
biodiversity. However, recreation, tourism and
human infrastructure within these refuges areas
can have negative consequences on wildlife
populations (Taylor and Knight 2003, Hebble-
white et al. 2005, Brown et al. 2012; Hansen et al.,
in press). Across southern Canada and the
conterminous USA, most of the land designated
v www.esajournals.org 1 March 2014 v Volume 5(3) v Article 27

as a protected area occurs in mountainouslandscapes. The complex topography of theseecosystems is characterized by a natural patternof fragmentation entailing productive and spe-ciose habitats at lower elevations, that areinterspersed with largely low quality habitats ofsteep rocks, snow and ice at higher elevations. Itis in these biologically-rich valley bottoms whereanthropogenic activity is also concentrated,including disturbances from recreational activity,residential developments, resource extractionand transportation corridors (Theobald et al.1997, Hansen et al. 2002). Despite the popularperception of these protected areas as vestiges ofremnant wilderness, the behavior and activitypatterns of wildlife moving through mountain-ous protected areas can be affected by a numberof anthropogenic disturbances. These sub-lethalchanges in wildlife activity can emerge aschanges in animal physiology (Wasser et al.1997, Millspaugh et al. 2001), the probability ofhuman-wildlife conflict (Woodroffe et al. 2005),and inter-specific interactions (Hebblewhite et al.2005, Berger and Gese 2007, Ford and Clevenger2010, Muhley et al. 2013). To ensure the safe andsustainable co-existence of people and wildlife inmountainous areas, there is a pressing need tobetter understand how wildlife activity changesin response to human activity.
Previous studies have shown that both vehicleand foot traffic can alter wildlife behavior up toseveral kilometers away from the disturbance sitefor a number of large mammal species, includingwolves (Canis lupus; Karlsson et al. 2007, Rogalaet al. 2011), elk (Cervus elaphus; Cassirer et al.1992, Naylor et al. 2009, Rogala et al. 2011), bears(Ursus sp.; McLellan and Shackleton 1988,Gibeau et al. 2002, Moen et al. 2012) and bighornsheep (Ovis sp.; Longshore et al. 2013). At thesame time, wildlife can become habituated tosuch disturbances and adjust their behavior tominimize encounters with people (Schultz andBailey 1978, Burson et al. 2000, Brown et al. 2012);perhaps with little consequence to the demo-graphic vital rates of wildlife populations. Forexample, wildlife typically cross highways atnight when traffic volumes are low (Tigas et al.2002, Chruszcz et al. 2003, Waller and Servheen2005, Graves et al. 2006, Meisingset et al. 2013),suggesting that these labile responses are animportant component of wildlife survival in
human-occupied landscapes.One of the most expensive and well-docu-
mented efforts to mitigate anthropogenic distur-bances to wildlife occurs in Canada’s nationalparks, where a series of fences and crossingstructures have been built to facilitate themovement of large mammals across a majorhighway (Ford et al. 2010). In spite of this majorhighway, over 150,000 wildlife crossings havebeen recorded at these structures (Clevenger etal. 2009), rates of wildlife-vehicle collisions havedropped off (Clevenger et al. 2001), and demo-graphic and genetic connectivity continues (Sa-waya et al. 2013, 2014). However, a clear pictureof how these mitigation measures have restoredwildlife activity has not yet emerged. Under-standing the extent to which vehicle traffic andhuman activity alters wildlife movement nearhighways will increase our ability to design moreeffective wildlife crossing structures (WC) andreduce the negative effects of habitat fragmenta-tion in mountain ecosystems (Barber et al. 2011,Leblond et al. 2013).
To address this knowledge gap, we evaluatedthe general hypothesis that WC buffer the effectsof anthropogenic disturbance on wildlife activity,and predict that the activity patterns of largemammals at WC should be similar to activitypatterns in areas characterized by little or nohuman disturbance. We employed a long-termmonitoring program (.4 years) to measureactivity patterns for an assemblage of largemammal species, using a network of motion-activated cameras (camera traps) in Banff Na-tional Park, Alberta. We quantified the overlap ofwildlife activity at 39 WC, with 126 sites thatwere undisturbed by transportation and humanactivity, located .2 km from transportationinfrastructure (hereafter referred to as backcoun-try [BC]). Specifically, we first established spe-cies-specific patterns of diel activity and thenanalyzed (1) if the differences in diel activitybetween WC and BC sites are greater for somespecies groups (i.e., carnivores) than others (i.e.,ungulates) (Hebblewhite et al. 2005, Ford andClevenger 2010), and (2) if human use of WC andtheir novelty change the diel activity of wildlife(Clevenger and Waltho 2000). We examined therole of factors that can further explain theserelationships, such as the design of the WC (e.g.,over or underpass), fluxes in daily traffic volume
v www.esajournals.org 2 March 2014 v Volume 5(3) v Article 27
BARRUETO ET AL.

and the age of the WC. Our results will assisttransportation and wildlife managers in devisingappropriate strategies for human use of WC andin designing WC structures to minimize changesin wildlife behavior.
METHODS
Study areaThe study area, located in Banff National Park,
is situated approximately 150 km west ofCalgary, Alberta, in the Bow River Valley, alongthe Trans-Canada Highway (TCH; Fig. 1). The
study area is characterized by mountainous
landscapes, with a continental climate consisting
of long winters and short summers (Holland and
Coen 1983). Vegetation characteristic of the
montane and subalpine ecoregions consists of
open forests dominated by lodgepole pine (Pinus
contorta), Douglas-fir (Pseudotsuga menziesii ),
white spruce (Picea glauca), Englemann spruce
(Picea englemannii ), trembling aspen (Populus
tremuloides), and natural grasslands.
With the exception of bison (Bison bison) and
caribou (Rangifer tarandus), Banff National Park
Fig. 1. Study area in Banff National Park, Alberta. White circles with black dots in center are the location of
camera sites at wildlife crossings (WC) along the Trans-Canada Highway (TCH). Solid black dots are locations of
backcountry cameras (BC). Stars represent the location of traffic counters along the TCH. The different phases of
highway mitigation (1, 2, 3A, 3B) are shown spanning from east to west.
v www.esajournals.org 3 March 2014 v Volume 5(3) v Article 27
BARRUETO ET AL.

retains the full complement of native largemammal species. We focused on camera imagesof wolves, coyotes (C. latrans), cougars (Pumaconcolor), black bears (U. americanus), grizzlybears (U. arctos), mule deer (Odocoileus hemionus),white-tailed deer (O. virginianus), elk, and moose(Alces alces). The two Odocoileus species (hereafterreferred to as ‘‘deer spp.’’) were pooled due tosimilarities in habitat use, life-history, and theoccasional difficulties in distinguishing the twospecies, particularly in some of the low-qualitynighttime photos.
The TCH is the major transportation corridorthrough Banff National Park, covering roughly80 km between the park’s eastern and westernboundaries. Traffic volume along the TCH isrelatively high for the region, with an average of17,970 vehicles per day in 2008 and increasing ata rate of 2.5% per year (Highway Service Centre,Parks Canada, Banff, Alberta).
In the 1970s, safety issues compelled plannersto upgrade the TCH within Banff from two tofour lanes, beginning from the eastern boundaryand working west (Ford et al. 2010). Largeanimals were excluded from the road with a2.4-m-high fence erected on both sides of thehighway, and underpasses were built to allowwildlife safe passage across the road. The first 27km of highway twinning (Phases 1 and 2)included 10 wildlife underpasses and was com-pleted in 1988 (Fig. 1). Fencing and WC on thenext 18 km section (Phase 3A) was completed inlate 1997 with 11 additional wildlife underpassesand two 50-m wide wildlife overpasses (Cle-venger and Waltho 2000, 2005). The final 30 kmof four-lane highway to the western parkboundary (Phase 3B) includes 21 crossing struc-tures, including four, 60-m wide wildlife over-passes and was completed in 2013.
Animal activityTo quantify animal activity, we employed
motion-activated cameras to record the move-ment of large mammals: (1) at 39 WC along theTCH between 2007 and 2012; (2) throughout theBC of Banff National Park between 2008 and 2012(Fig. 1). We define activity as an independentcamera trap event at both WC and BC sites,which consists of passage by an individual, orgroup of the same species. We distinguishedsequential events by a lapse in activity at the
camera lasting longer than 2 minutes. Prolongedfeeding or resting behavior was not recorded asactivity because cameras would typically recordmultiple images of the same individuals under 2minutes. Thus, at both WC and BC sites, ouractivity data represent the travelling behavior oflarge mammals. At WC sites we also estimatedthe direction of travel and whether animalsmoved through the WC or turned back withoutcrossing. We only used images captured between1 May to 31 October to minimize seasonal biascaused by migration patterns (e.g., elk; Hebble-white et al. 2002) or torpor (e.g., black andgrizzly bears). This period also coincides with thehighest levels of human use and traffic volumesin Banff National Park.
Since 2005, cameras were used to monitorwildlife use of the WC (Clevenger and Waltho2000, 2005, Ford et al. 2009). WC cameras werelocated within or adjacent to (,10 m away)wildlife underpasses and centered on top ofwildlife overpasses. Every 2–3 weeks, we in-spected camera operation and downloadedimages.
Since 2008, Parks Canada has used cameratraps to monitor wildlife activity in BC areas ofBanff National Park. At the local scale, BCcameras were set up to maximize detection ofwildlife, given presence, but at the scale of thestudy area these sites were randomized acrosshigh- and low-use hiking trails, elevation andhabitat types. BC cameras were checked 2–3times during the calendar year.
Compared to direct observation, camera trapsprovide a relatively low-impact means of mon-itoring behavior and facilitate data collection on acontinuous basis across diel periods (O’Brien2010, McCallum 2012). All cameras used in thisstudy were made by the same manufacturer(Reconyx, Holmen, Wisconsin, USA) and pro-vided information on date, time and ambienttemperature during each camera trap event.Cameras were operable 24 h/day, year-round,with occasional periods of malfunction or pre-mature battery failure. We determined camera-sampling effort (camera-days) at WC and BCsites by calculating the number of days thatcameras were operational.
We compared the number of camera trapevents between WC and BC sites, by taxa, overa 24-hr cycle (0 to 2300 h MST). We monitored
v www.esajournals.org 4 March 2014 v Volume 5(3) v Article 27
BARRUETO ET AL.

WC using cameras and other methods almostcontinuously since 2008, and found in a previousanalysis that cameras reliably detect crossingevents (Ford et al. 2009).
Traffic volume dataTraffic volume data were obtained from three
counters that measured the mean hourly trafficalong the TCH (Highway Service Centre, unpub-lished data) from 2007 to 2012 (Fig. 1). Weassociated each WC with the data from thenearest traffic counter. Weekend traffic is typi-cally higher than weekday traffic because ofrecreational use in this area (Rogala et al. 2011),creating a weekly periodicity of vehicle traffic(see Appendix: Fig. A1). We partitioned thesedata into high (weekend, Friday to Sunday) andlow (weekday, Monday to Thursday) categories.We did not expect these two categories to impactwildlife beyond a potential effect of the highertraffic volumes on weekends.
Statistical analysisTo quantify overlap in inter-specific activity
patterns, we compared the diel pattern of cameratrap events for all species-pair combinationsusing two-sample Kolmogorov-Smirnov (KS)tests, separately for the WC and for the BC data.We defined a non-significant result from the KStest as a matching activity pattern, and asignificant (at the 0.05 level) result as a non-matching activity pattern. The KS test has theadvantage of making no assumption about thedistribution of data, i.e., is non-parametric anddistribution free, and can be used when samplesizes are unequal (Justel et al. 1997, Zar 1999). Wethen measured the overlap of intra-specificactivity patterns between WC and BC sites, againusing two-sample KS tests.
To quantify the potential effects of human (i.e.,foot traffic) activity on wildlife at WC, we usedKS tests to compare overlap of intra-specificactivity patterns between WC with high and lowhuman use. High human use WC were definedas those with .50 human events per year(reference years were 2010 to 2012), while WCwith low human use had ,50 human events peryear. This cut-off was chosen because approxi-mately 75% of WC had ,50 human crossingevents each year and there was a clear separationof WC with high use (mean¼ 255, min¼ 53, max
¼ 1046) and the rest receiving relatively low use(mean¼ 14.2, min¼ 0, max¼ 47). Because humanuse was confounded by WC design and age (e.g.,overpasses and newer WC were virtually off-limits to people), we also performed this analysison a subset of WC that had the same design andwere built .15 years before this study began (i.e.,Phase 1, Fig.1).
If wildlife habituation to roads increases theiruse of WC, we would expect to see changes in theactivity patterns and frequency of use at WCvarying in age, assuming that wildlife popula-tions in the adjacent areas are the same. We usedKS tests to determine if the novelty of WC playeda role in wildlife activity patterns by pooling datafrom older WC built .15 years ago (Phases 1, 2,3A) and comparing these activity patterns withnovel (1–3 years old) WC along Phase 3B.
Finally, we assessed the impact of vehicletraffic on animal activity at WC. For the previousanalyses we had pooled data across years andsites, and measured differences in resultingactivity patterns with KS tests. To detect an effectof vehicle traffic volume on use of WC, whileaccounting for the time of day, required greateranalytical resolution than the discrete- KS testscould provide. Exploratory analysis of therelationship between hour of day and activitywas identified as non-linear, and based on earlierresearch, variation between behavior at thedifferent sites was also expected. We usedgeneralized additive mixed effects models(GAMMs) to take these non-linear and randomeffects into account (Wood 2006, Zuur et al.2009). We used the number of successful crossingevents per hour at each crossing structure as afunction of vehicle traffic volume, time of day,human use of crossing structure, and age ofcrossing structure. Based on the expectation thatchanges in behavior occurred over the years, wealso included interactions between hour of dayand age of crossing structure, as well as aninteraction of human use and age of crossingstructure. Because wildlife response to hourlyvariation in traffic volume may depend onambient or baseline traffic conditions, we parti-tioned our analysis into high (weekend) and low(week day) ambient vehicle traffic volumes.However, we did not expect the weekday factorto have an impact on animal behavior beyond thepotential effect of increased traffic volumes seen
v www.esajournals.org 5 March 2014 v Volume 5(3) v Article 27
BARRUETO ET AL.

on weekends. Thus, we did not include theweekday factor itself as a covariate in the models.All species were analysed separately.
For all models, we used a Poisson distributionand log-link function (global model shown in Eq.1).
Eventsis ; PoissonðlisÞgis ¼ aþ fPhaseðHourÞ þ f ðMean traffic volumeÞ
þb1 3 Phaseþ b2 3 Humanþ b3 3 Phase
3 Humanþ LEffort þ a ð1Þai ; Nð0;r2
aÞlogðlisÞ ¼ gis
We defined Events as the cumulative amountof activity (i.e., number of successful crossingevents) at each WC(i ) pooled across all years foreach hour (s). Mean traffic volume was defined asthe number of vehicles passing at each hour,averaged across all years. Human use (Human)was defined by a factor for ‘high’ (.50 crossingsby humans) and ‘low’ (�50 human crossingevents). Age of crossing structures was definedby Phase with the four levels 1, 2, 3A and 3B,referring to the highway mitigation phases (Fig.1). We treated WC as a random factor (a), andincluded the number of camera days (LEffort) ateach WC as an offset, to account for unequalmonitoring effort. Finally, the covariate Houraccounted for the strong diel activity patternsdisplayed by most species. To account for thecircular nature of Hour, we used cyclic cubicregression splines for the smoothers. We createda Global model and performed step-wise variableremoval until all covariates remaining weresignificant at the 0.05 level (Burnham andAnderson 2002). We returned variables to theresulting model to address heteroscedasticity inresiduals. For a given species, we only includedWC where at least one detection occurred. Allmodelling was performed with R (version 3.0.1;R Development Core Team 2008) using the mgcvpackage (Wood 2006) for the GAMMs.
RESULTS
Sampling effortWe captured .194,000 images at WC and
.254,000 of images at the BC, resulting in a totalof 33,732 and 6577 events for our eight focalspecies, respectively. Most of these imagesconsisted of deer and elk (.75% of events at
WC and .45% at BC). The total sampling effortwas 31,750 camera-days at 39 WC sites and19,097 at 126 BC sites.
Diel activity patternsMost inter-specific pairs had non-matching
activity distributions at WC and BC (Table 1).The only species pairs with matching activitypatterns at both WC and BC sites were grizzlybear-black bear and elk-cougar, suggesting thatWC buffers changes to probability of interspecificinteractions. Four additional species pairs hadmatching activity patterns at BC sites only (Table1) and no species had matching activity at WCsites only.
Intra-specific activity patterns at WC closelymatched those at BC sites (Fig. 2), with theexception of elk and coyotes (Table 2). For elk,the activity peaks at the WC sites were one hourearlier in the morning and one hour later in theevening. Coyote activity peaked at 0900 h in theBC and at 0200 h at WC. Generally, at both WCand BC, deer, elk, moose, wolves and grizzly andblack bears exhibited strong crepuscular activitypatterns (Fig. 2). Cougar activity was primarilynocturnal at both WC and BC sites (Fig. 2).
The effect of human-activity on wildlife use ofWC was significant for four species (Table 3).Black bears, deer sp., elk and wolves hadsignificantly different activity at WC with highlevels of human use compared to WC with lowhuman use. Black bears were more active in themorning and less active in the afternoon andevening at high human use WC. Deer showedmore nocturnal and less morning activity at highhuman use WC and elk were less nocturnal athigh human use WC (Fig. 3). When we looked atjust a subset of WC sites with identical designs,wolves and elk were still more nocturnal at highhuman use sites, but not black bears and deer(Table 4). This suggests that WC design maybuffer human activity to shape when somespecies attempt to use WC.
Patterns of adaptation to WC varied amongspecies. At novel WC, black bears concentratedactivity during the crepuscular periods; while atestablished WC they were primarily activeduring the day (Fig. 4). Coyotes shifted theiractivity to mostly diurnal use at novel WC, whiletheir activity was relatively constant during thenight and day at old WC. Similar shifts towards
v www.esajournals.org 6 March 2014 v Volume 5(3) v Article 27
BARRUETO ET AL.

more diurnal activity patterns at novel WC wereseen for wolves. Moose activity at novel WCpeaked earlier in the morning and later at night,while deer were more active at night at novelWC.
Effect of vehicle traffic, human use,age of structure and hour of dayon wildlife crossing structure use
Wildlife demonstrated marked interspecificvariation in diel patterns of WC use, butperiodicity in activity was present for all species.Time of day was a strong factor in determiningcrossing events of elk in all Phases except 3A(Fig. 5; see Appendix: Table A1 for full results).Elk activity in Phases 1, 2 and 3B showed twoactivity peaks in the morning and evening hours(around 0600 and 2100 h) and low activity duringthe late morning and afternoon (1000 to 1600 h).At Phases 1 and 2, there was also a second periodof low activity at night (0000 to 0300 h). WCalong Phases 1 and 2 had higher numbers of elkcrossings than those of Phases 3A and 3B.
Time of day was the most important covariatefor deer, with all crossing events in all Phasesexhibiting one peak in the morning (between0600 and 1000 h), and a second, smaller peakaround 2000 h (Fig. 5; see Appendix: Table A2 forfull results). Deer activity was lowest at 1500 hand 0200 h. Age of structure also increased deercrossing events, with Phase 1 having more eventsper hour than Phases 3A and 3B.
For wolves, time of day interacted with age ofWC and was a key driver of crossing events forwolves (Fig. 5; see Appendix: Table A3 for fullresults). While time of day was not significant inPhase 1, it was highly significant for Phase 2,with a distinct spike in crossing events at night(0500 h) and low activity during the day (1500 h);wolves moving along Phase 3A increased cross-ing events in the early morning hours (0500 h)and evening hours (2100 h). Traffic volumenegatively affected crossing events across allphases. Human activity at WC also interactedwith age of structure: crossing events weregreater at low human use structures in Phase 1,but number of events declined at low human usestructures WC along Phases 3A and 3B. In Phase2, human use was not significant.
For coyotes, at high human use structures,hour was highly significant, with a peak at 0100 h
Table 1. Results of comparisons of inter-specific
activity patterns at wildlife crossing structures and
backcountry sites using two sample Kolmogorov-
Smirnov tests. Activity (N ) is defined as the number
of independent camera events per species. Non-
significant (P . 0.05) comparisons indicate matching
activity patterns. D is the maximum vertical devia-
tion between the two distribution curves.
Species 1 (N ) Species 2 (N ) D P
Wildlife crossing structuresBlack bear (522) Cougar (254) 0.2975 ,0.001
Coyote (719) 0.2246 ,0.001Deer (16,225) 0.1826 ,0.001Elk (6410) 0.3208 ,0.001
Grizzly (622) 0.0563 0.329Moose (245) 0.1570 0.005Wolf (1161) 0.2311 ,0.001
Cougar (254) Coyote 0.1383 0.001Deer 0.1923 ,0.001Elk 0.0598 0.347
Grizzly 0.2879 ,0.001Moose 0.2065 ,0.001Wolf 0.1066 0.017
Coyote (719) Deer 0.1188 ,0.001Elk 0.1317 ,0.001
Grizzly 0.2227 ,0.001Moose 0.1363 0.002Wolf 0.0509 0.201
Deer (16,225) Elk 0.2093 ,0.001Grizzly 0.1325 ,0.001Moose 0.1014 0.013Wolf 0.0966 ,0.001
Elk (6410) Grizzly 0.3125 ,0.001Moose 0.2106 ,0.001Wolf 0.1127 ,0.001
Grizzly (622) Moose 0.1199 0.012Wolf 0.2005 ,0.001
Moose (245) Wolf 0.0999 0.035Backcountry
Black bear (165) Cougar (91) 0.2865 ,0.001Coyote (354) 0.1626 0.005Deer (2025) 0.2070 ,0.001Elk (853) 0.2074 ,0.001
Grizzly (715) 0.0830 0.314Moose (293) 0.1763 0.002Wolf (544) 0.2529 ,0.001
Cougar (91) Coyote (354) 0.1781 0.020Deer 0.1831 0.005Elk 0.1191 0.189
Grizzly 0.2809 ,0.001Moose 0.1430 0.116Wolf 0.1199 0.212
Coyote (354) Deer 0.619 0.198Elk 0.1371 ,0.001
Grizzly 0.1306 ,0.001Moose 0.1073 0.005Wolf 0.1505 ,0.001
Deer (2025) Elk 0.1830 ,0.001Grizzly 0.1495 ,0.001Moose 0.1469 ,0.001Wolf 0.1199 ,0.001
Elk (853) Grizzly 0.1972 ,0.001Moose 0.0593 0.427Wolf 0.1277 ,0.001
Grizzly (715) Moose 0.1643 ,0.001Wolf 0.2332 ,0.001
Moose (293) Wolf 0.1375 0.0015
v www.esajournals.org 7 March 2014 v Volume 5(3) v Article 27
BARRUETO ET AL.

Fig. 2. Diel activity patterns of large mammals at wildlife crossings (WC) and backcountry (BC) sites in Banff
National Park, Alberta. Activity is based on the percentage of wildlife events photographed at WC (turquoise
solid line) and at BC sites (red solid line).
Table 2. Results of two sample Kolmogorov-Smirnov tests for intra-specific activity at wildlife crossing structure
(WC) and backcountry (BC) camera sites. Listed are the number of camera events by species at WC and BC
sites used in the analysis. Significant (P , 0.05) comparisons indicate different activity patterns. D is maximum
vertical deviation between the two distribution curves.
Species
Camera location
D PBC WC
Cougar 91 254 0.0622 0.957Coyote 354 719 0.1057 0.010Wolf 544 1161 0.0274 0.943Grizzly bear 715 622 0.0420 0.600Black bear 165 522 0.0532 0.870Deer sp. 2026 16,255 0.0305 0.069Elk 853 6410 0.1437 ,0.001Moose 293 245 0.0955 0.175
v www.esajournals.org 8 March 2014 v Volume 5(3) v Article 27
BARRUETO ET AL.

Table 3. Results of two sample Kolmogorov-Smirnov tests for activity patterns at wildlife crossing structures with
high and low human use in Banff National Park, Alberta. Values for high and low refer to crossing events
detected by motion-activated cameras at 39 sites. Significant (P , 0.05) comparisons indicate different activity
patterns. D is the maximum vertical deviation between the two distribution curves.
Species
Human use
D PHigh Low
Cougar 83 171 0.0613 0.984Coyote 358 361 0.0714 0.318Wolf 172 989 0.1231 0.023Grizzly bear 183 439 0.0950 0.193Black bear 152 370 0.1345 0.041Deer sp. 4374 11,850 0.0425 ,0.001Elk 2761 3649 0.0799 ,0.001Moose 43 202 0.1171 0.716
Fig. 3. Diel activity patterns of large mammals at high human-use and low human-use wildlife crossings in
Banff National Park, Alberta. Activity is based on the percentage of wildlife events photographed at high human
use WC (red solid line) and low human use WC (turquoise solid line).
v www.esajournals.org 9 March 2014 v Volume 5(3) v Article 27
BARRUETO ET AL.

and a low at 1500 h (Fig. 6; see Appendix: TableA4 for full results). At low human use WCcoyotes showed no temporal variation in cross-ing events, as hour was not a significantpredictor. Phases 1 and 2 had significantly morecrossings than Phase 3B and Phase 1 also hadmore crossings than Phase 3A. The interaction ofphase and human use on number of crossingevents was highly significant, with high humanuse leading to fewer crossings in the newerPhases 3A and 3B, and to more crossing events inthe older Phases 1 and 2.
For grizzly bears, we pooled weekend andweekday data due to low overall detections.Within these pooled data, both time of day andtraffic volume were significant factors withactivity peaking during the day (0600 to 1900h), but otherwise decreasing with traffic volume(Fig. 6; see Appendix: Table A5 for full results).
As with grizzly bears, we pooled weekend andweekday data for cougars. Time of day wassignificant for both high and low human use WC,with more crossing events during the night andfewest around 1200 h (Fig. 6; see Appendix: TableA6 for full results). Phase 1 had more crossingevents than Phase 2 or Phase 3A, while the newerPhase 3B had no crossings by cougars at all.
For black bears, as with grizzly bears andcougars, we pooled weekend and weekday. Timeof day was an important explanatory variable,with decreasing number crossing events duringthe night (between 2100 and 0400 h) and a nearlyuniform probability of crossing events during theremainder of the day (Fig. 6; see Appendix: Table
A7 for full results). At low human use structures,the number of events was highest in the evening(2000 h), while at high human use structures,there was a dip in crossing events in theafternoon (1500 to 1600 h) and there were moreevents at Phase 1 than at all other phases.
DISCUSSION
Our results demonstrated marked variation inthe effect of anthropogenic disturbances onwildlife, including changes to the timing ofinterspecific interactions and the allocation ofactivity over daily cycles. The activity patterns ofall species at WC showed some response tohuman activity. However, some species (deer,elk, coyotes, black bears) were sensitive tospecific types of human activities, whereas largecarnivores (wolves, grizzly bears, cougars) weresensitive to all forms of human disturbance thatwe measured.
While efforts to mitigate disturbance to wild-life arising from transportation infrastructure canbe costly (McGuire and Morrall 2000, Huijser etal. 2009), this effort is leading to the restoration ofanimal movement (Gagnon et al. 2011, VanManen et al. 2012, Sawaya et al. 2013, Sawyeret al. 2013) and genetic flows (Sawaya et al. 2014)across the landscape and a reduction in the riskof wildlife-vehicle collisions (Clevenger et al.2001, McCollister and Van Manen 2010, Foundand Boyce 2011). Indeed, the large number ofwildlife using WC in our study area (Clevengeret al. 2009) may be interpreted by some observers
Table 4. Results of two-sample Kolmogorov-Smirnov tests between activity patterns at wildlife crossing (WC)
structures with high and low human use, standardized by open-span design type. Listed are the number (N ) of
camera events by species at high and low human use sites used in the analysis. Significant (P , 0.05)
comparisons indicate different activity patterns. D is the maximum vertical deviation between the two
distribution curves.
Species
Human activity
D PHigh use (N ) Low use (N )
Cougar 54 110 0.1350 0.523Coyote 283 52 0.1309 0.438Wolf 41 442 0.3290 ,0.001Grizzly bear 34 136 0.1029 0.935Black bear 126 183 0.1556 0.053Deer sp. 1336 4487 0.0330 0.213Elk 2557 2735 0.1048 ,0.001Moose 6 14 . . .
Note: Insufficient data for moose to test.
v www.esajournals.org 10 March 2014 v Volume 5(3) v Article 27
BARRUETO ET AL.

as a successful restoration of critical ecologicalflows across this human-occupied landscape.Less appreciated by these levels of wildlife useare the sub-lethal effects of highways on wildlifebehavior and the extent to which mitigationbuffers these effects.
Understanding the behavioral response ofwildlife to people is an information gap withcritical conservation and management implica-tions (Buchholz 2007, Caro 2007, Blumstein andFernandez-Juricic 2010). Previous studies haveshown that large mammals can adjust theirlocation and timing of certain behaviors to avoid
interacting with people, including hikers (Rogalaet al. 2011, Longshore et al. 2013), skiers(Ferguson and Keith 1982, Cassirer et al. 1992),aircraft (Weisenberger et al. 1996, Krausman etal. 1998) and vehicles (Burson et al. 2000, Brownet al. 2012). Some of these behaviors generatecascading effects on other human-wildlife inter-actions. For example, deer are more vulnerable tocollisions with vehicles during hunting season,but only in areas where hunting is permitted(Sudharsan et al. 2006). Here we have shown thatwildlife adjust their behavior in response tovariation in human activity, and that this
Fig. 4. Diel activity patterns of large mammals at novel vs. established wildlife crossings in Banff National
Park, Alberta. Activity is based on the percentage of wildlife events photographed at novel WC (red solid line)
and established WC (turquoise solid line). No data were obtained from cougars using novel wildlife crossings
during the study period.
v www.esajournals.org 11 March 2014 v Volume 5(3) v Article 27
BARRUETO ET AL.

response depends on the baseline levels ofhuman activity in the area. For instance, trafficvolume negatively affected crossing count ofwolves at all Phases, but the amount of wolfactivity at WC depended on how many peoplealso used the WC. Our results are consistent withothers (e.g., Ng et al. 2004, Mata et al. 2005, Griloet al. 2008) showing that the restoration of pre-disturbance activity patterns of wildlife livingnear highways will depend on the managementof human use at WC.
Though our results showed that human use ofWC affected wildlife activity, we found congru-ent overall activity patterns for most speciesamong WC and BC sites. This result suggeststhat wildlife can habituate to some types ofdisturbances (e.g., vehicle traffic) but remainsensitive to others (e.g., foot traffic at WC), and
that the WC designs used at our study site arecapable of buffering at least some of thepotentially aversive stimulus (e.g., noise, chemo-sensory emissions, light) produced by roads andtraffic (Barber et al. 2009, Brown et al. 2012,McClure et al. 2013). If wildlife habituation toroads increases use of WC, we predicted thefrequency of crossing events would increase withage of WC, which was the case for all species butwolves and grizzly bears. Gagnon et al. (2011)also found an adaptive response of elk and deerto WC in Arizona over a 4-year period and Fordet al. (2010) present data suggesting adaptiveresponses by grizzly bears to use of WC. Theseadaptive responses by wildlife support the use oflong-term monitoring (e.g., �4years) to fullyunderstand the effectiveness of mitigation (Cle-venger et al. 2009), at least for long-lived, wide-
Fig. 5. Plots showing the smooth functions of continuous covariates and term plots of parametric terms of the
best GAMM models for elk, deer and wolves in Banff National Park, Alberta. The x-axes of all smooth function
plots show the covariate values, the x-axes of the term plots show the factor levels. In all plots, the y-axis is the
covariate effect on the mean response, which is the number of animals per hour using an ‘average’ crossing
structure. Values on the y-axis are on the linear predictor scale.
v www.esajournals.org 12 March 2014 v Volume 5(3) v Article 27
BARRUETO ET AL.

ranging species like large terrestrial mammals.
Protected areas are one of the most widelyused approaches to conserving wildlife; however,conservation goals can be compromised whenpeople reside and continue to use protected areasfor resource extraction, transportation and recre-ation (Woodroffe and Ginsberg 1998, Ament etal. 2008). In an effort to restore ecosystemprocesses and structures, a central focus for themanagement of protected areas has been tomitigate the effects of people on wildlife move-ment and mortality (McNeely et al. 1990, Cooper-rider and Noss 1994). Transportation and landmanagers should be cognizant of the potentialnegative effects of anthropogenic disturbancescompromising the ecological and conservation
value of WC. Rigorous long-term monitoring ofWC and anthropogenic disturbances associatedwith them will provide sound information formanagers responsible for ensuring the efficacy ofWC. Furthermore, information on the relation-ship between wildlife and anthropogenic distur-bance will aid in assessing the performance ofmitigation efforts aimed at increasing landscapeconnectivity, reducing the risk of human-wildlifeconflict and conserving wildlife populations.
ACKNOWLEDGMENTS
Funding for this study was provided by theHighway Wilding partnership consisting of ParksCanada, the Western Transportation Institute atMontana State University, Miistakis Institute, the
Fig. 6. Plots showing the smooth functions of continuous covariates and term plots of parametric terms of the
best GAMM models for coyotes, grizzly bears, cougars and black bears in Banff National Park, Alberta. The x-
axes of all smooth function plots show the covariate values, the x-axes of the term plots show the factor levels. In
all plots, the y-axis is the covariate effect on the mean response, which is the number of animals per hour using an
‘average’ crossing structure. Values on the y-axis are on the linear predictor scale.
v www.esajournals.org 13 March 2014 v Volume 5(3) v Article 27
BARRUETO ET AL.

Woodcock Foundation and Wilburforce Foundation.We are grateful to the many volunteers that havehelped us collect field data from cameras at thewildlife crossings and assist with photo-classification.We thank Parks Canada’s Resource Conservation stafffor data collection from backcountry cameras, inparticular Jesse Whittington and Ben Dorsey forvaluable input, and managers Bill Hunt and RickKubian for their assistance and support. Additionalsupport came from the Edmonton Community Foun-dation’s John and Barbara Poole Family Fund. Wethank two anonymous reviewers and Jonathan Effa forhelpful comments on earlier drafts of this manuscript.
LITERATURE CITED
Ament, R., A. P. Clevenger, O. Wu, and A. Hardy. 2008.An assessment of road impacts on wildlife popu-lations in U.S. National Parks. EnvironmentalManagement 42:480–496.
Barber, J., C. Burdett, S. Reed, K. Warner, C.Formichella, K. Crooks, D. Theobald, and K.Fristrup. 2011. Anthropogenic noise exposure inprotected natural areas: estimating the scale ofecological consequences. Landscape Ecology26:1281–1295.
Barber, J. R., K. Crooks, and K. Fristrup. 2009. Thecosts of chronic noise exposure for terrestrialorganisms. Trends in Ecology and Evolution25:180–189.
Berger, K. M., and E. M. Gese. 2007. Does interferencecompetition with wolves limit the distribution andabundance of coyotes? Journal of Animal Ecology76:1075–1085.
Blumstein, D., and E. Fernandez-Juricic. 2010. Aprimer of conservation behavior. Sinauer, Sunder-land, Massachusetts, USA.
Brown, C., A. Hardy, J. Barber, K. Fristrup, K. Crooks,and L. Angeloni. 2012. The effect of humanactivities and their associated noise on ungulatebehavior. PLoS One 7(7):e40505.
Buchholz, R. 2007. Behavioural biology: an effectiveand relevant conservation tool. Trends in Ecologyand Evolution 22:401–407.
Burnham, K. P., and D. R. Anderson. 2002. Modelselection and multimodal inference: a practicalinformation-theoretic approach. Springer, NewYork, New York, USA.
Burson, S. L., J. Belant, K. Fortier, and W. Toimkiewicz.2000. The effect of vehicle traffic on wildlife inDenali National Park. Arctic 53:146–151.
Caro, T. 2007. Behavior and conservation: a bridge toofar? Trends in Ecology and Evolution 22:394–400.
Cassirer, E., D. Freddy, and E. Ables. 1992. Elkresponses to disturbance by cross country skiersin Yellowstone National Park. Wildlife SocietyBulletin 20:375–381.
Chruszcz, B., A. P. Clevenger, K. Gunson, and M.Gibeau. 2003. Relationships among grizzly bears,highways, and habitat in the Banff-Bow Valley,Alberta, Canada. Canadian Journal of Zoology81:1378–1391.
Clevenger, A. P., B. Chruszcz, and K. Gunson. 2001.Highway mitigation fencing reduces wildlife-vehi-cle collisions. Wildlife Society Bulletin 29:646–653.
Clevenger, A. P., A. T. Ford, and M. A. Sawaya. 2009.Banff wildlife crossings project: Integrating scienceand education in restoring population connectivityacross transportation corridors. Final report toParks Canada Agency, Radium Hot Springs, BritishColumbia, Canada.
Clevenger, A. P., and N. Waltho. 2000. Factorsinfluencing the effectiveness of wildlife underpass-es in Banff National Park, Alberta, Canada.Conservation Biology 14:47–56.
Clevenger, A. P., and N. Waltho. 2005. Performanceindices to identify attributes of highway crossingstructures facilitating movement of large mam-mals. Biological Conservation 121:453–464.
Cooperrider, A., and R. Noss. 1994. Saving nature’slegacy. Island Press, Washington, D.C., USA.
Ferguson, M., and L. Keith. 1982. Influence of Nordicskiing on distribution of moose and elk in ElkIsland National Park, Alberta. Canadian Field-Naturalist 96:69–78.
Ford, A. T., and A. P. Clevenger. 2010. Validity of theprey trap hypothesis for carnivore-ungulate inter-actions at wildlife crossing structures. Conserva-tion Biology 24:1679–1685.
Ford, A. T., A. P. Clevenger, and A. Bennett. 2009.Comparison of non-invasive methods for monitor-ing wildlife crossing structures on highways.Journal of Wildlife Management 73:1213–1222.
Ford, A. T., A. P. Clevenger, and K. Rettie. 2010. BanffWildlife Crossings, Trans-Canada Highway, Alber-ta—An international public-private partnership.Pages 157–172 in J. Beckmann, A. P. Clevenger,M. Huijser, and J. Hilty, editors. Safe passages:Highways, wildlife and habitat connectivity. IslandPress, Washington, D.C., USA.
Found, R., and M. S. Boyce. 2011. Predicting deer-vehicle collisions in an urban area. Journal ofEnvironmental Management 92:2486–2493.
Gagnon, J. W., N. L. Dodd, K. S. Ogren, and R. E.Schweinsburg. 2011. Factors associated with use ofwildlife underpasses and importance of long-termmonitoring. Journal of Wildlife Management75:1477–1487.
Gibeau, M. L., A. P. Clevenger, S. Herrero, and J.Wierzchowski. 2002. Grizzly bear response tohuman development and activities in the BowRiver watershed, Alberta. Biological Conservation103:227–236.
Graves, T., S. Farley, and C. Servheen. 2006. Frequency
v www.esajournals.org 14 March 2014 v Volume 5(3) v Article 27
BARRUETO ET AL.

and distribution of highway crossings by KenaiPeninsula brown bears. Wildlife Society Bulletin34:800–808.
Grilo, C., J. A. Bissonette, and M. Santos-Reis. 2008.Response of carnivores to existing highway cul-verts and underpasses: implications for roadplanning and mitigation. Biodiversity and Conser-vation 17:1685–1699.
Hansen, A. J., N. Piekielek, C. Davis, J. Haas, D.Theobald, J. Gross, W. Monahan, and S. Running.In press. Exposure of US National Parks to land useand climate change 1900-2100. Ecological Applica-tions.
Hansen, A. J., R. Rasker, B. Maxwell, J. Rotella, J.Johnson, A. Parmenter, U. Langner, W. Cohen, R.Lawrence, and M. Kraska. 2002. Ecological causesand consequences of demographic change in theNew West. BioScience 52:151–162.
Hebblewhite, M., D. H. Pletscher, and P. Paquet. 2002.Elk population dynamics in areas with and withoutpredation by recolonizing wolves in Banff NationalPark, Alberta. Canadian Journal of Zoology 80:789–799.
Hebblewhite, M., C. White, C. Nietvelt, J. Mckenzie, T.Hurd, J. Fryxell, S. Bayley, and P. Paquet. 2005.Human activity mediates a trophic cascade causedby wolves. Ecology 86:2135–2144.
Holland, W. D., and G. M. Coen. 1983. Ecological landclassification of Banff and Jasper national parks.Volume I. Summary. Alberta Institute of PedologyPublication M-83-2.
Huijser, M. P., J. W. Duffield, A. P. Clevenger, R. J.Ament, and P. T. McGowen. 2009. Cost-benefitanalyses of mitigation measures aimed at reducingcollisions with large ungulates in North America; adecision support tool. Ecology and Society 14(2):15.
Justel, A., D. Pena, and R. Zamar. 1997. A multivariateKolmogorov-Smirnov test of goodness of fit.Statistics and Probability Letters 35:251–259.
Karlsson, J., H. Broseth, H. Sand, and H. Andren. 2007.Predicting occurrence of wolf territories in Scandi-navia. Journal of Zoology 272:276–283.
Krausman, P., M. Wallace, C. Hayes, and D. DeYoung.1998. Effects of jet aircraft on mountain sheep.Journal of Wildlife Management 62:1246–1254.
Leblond, M., C. Dussault, and J.-P. Ouellet. 2013.Avoidance of roads by large herbivores and itsrelation to disturbance intensity. Journal of Zoology289:32–40.
Longshore, K., C. Lowrey, and D. Thompson. 2013.Detecting short-term responses to weekend recre-ation activity: Desert bighorn sheep avoidance ofhiking trails. Wildlife Society Bulletin 37:698–706.
Mata, C., I. Hervas, J. Herranz, F. Suarez, and J. E.Malo. 2005. Complementary use by vertebrates ofcrossing structures along a fenced Spanish motor-way. Biological Conservation 124:397–405.
McCallum, J. 2012. Changing use of camera traps inmammalian field research: habitats, taxa and studytypes. Mammal Review 43:196–206.
McClure, C., H. Ware, J. Carlisle, G. Kaltenecker, and J.Barber. 2013. An experimental investigation intothe effects of traffic noise on distributions of birds:avoiding the phantom road. Proceedings of theRoyal Society B 280:20132290.
McCollister, M., and F. T. Van Manen. 2010. Effective-ness of wildlife underpasses and fencing to reducewildlife-vehicle collisions. Journal of Wildlife Man-agement 74:1722–1731.
McGuire, T. M., and J. F. Morrall. 2000. Strategichighway improvements to minimize environmen-tal impacts within the Canadian Rocky Mountainnational parks. Canadian Journal of Civil Engi-neering 27:523–32.
McLellan, B., and D. Shackleton. 1988. Grizzly bearsand resource extraction industries: effects of roadson behavior, habitat use, and demography. Journalof Applied Ecology 25:451–460.
McNeely, J., K. Miller, W. Reed, R. Mittermeier, and T.Werner. 1990. Conserving the world’s biologicaldiversity. International Union for Conservation ofNature, Gland, Switzerland.
Meisingset, E., L. Loe, O. Brekkum, B. Van Moorter,and A. Mysterud. 2013. Red deer habitat selectionand movements in relation to roads. Journal ofWildlife Management 77:181–191.
Millspaugh, J., R. Woods, K. Hunt, K. Raedeke, G.Brundige, B. Washburn, and S. Wasser. 2001. Fecalglucocorticoid assays and the physiological stressresponse in elk. Wildlife Society Bulletin 29:899–907.
Moen, G., O. Stoen, V. Sahlen, and J. Swenson. 2012.Behaviour of solitary adult Scandinavian brownbears when approached by humans on foot. PLoSONE 7(2):e31699.
Muhley, T., M. Hebblewhite, D. Paton, J. Pitt, M. Boyce,and M. Musiani. 2013. Humans strengthen bottom-up effects and weaken trophic cascades in aterrestrial food web. PLoS ONE 8(5):e64311.
Naylor, L., M. Wisdom, and R. Anthony. 2009.Behavioral responses of North American elk torecreational activity. Journal of Wildlife Manage-ment 73:328–338.
Ng, S. J., J. Dole, R. Sauvajot, S. Riley, and T. Valone.2004. Use of highway undercrossings by wildlife insouthern California. Biological Conservation115:499–507.
O’Brien, T. G. 2010. The wildlife picture index andbiodiversity monitoring: issues and future direc-tions. Animal Conservation 13:350–352.
R Development Core Team. 2008. R: A language andenvironment for statistical computing. R Founda-tion for Statistical Computing, Vienna, Austria.
Rogala, K., M. Hebblewhite, J. Whittington, C. White,
v www.esajournals.org 15 March 2014 v Volume 5(3) v Article 27
BARRUETO ET AL.

J. Coleshill, and M. Musiani. 2011. Human activitydifferentially redistributes large mammals in theCanadian Rockies national parks. Ecology andSociety 16(3):16.
Sawaya, M. A., A. P. Clevenger, and S. Kalinowski.2013. Wildlife crossing structures connect Ursidpopulations in Banff National Park. ConservationBiology 27:721–730.
Sawaya, M. A., S. Kalinowski, and A. P. Clevenger.2014. Genetic connectivity for two bear species atwildlife crossing structures in Banff National Park.Proceedings of the Royal Society B 281:201131705.
Sawyer, H., C. Lebeau, and T. Hart. 2013. Mitigatingroadway impacts to migratory mule deer - a casestudy with underpasses and continuous fencing.Wildlife Society Bulletin 36:492–498.
Schultz, R., and J. Bailey. 1978. Responses of nationalpark elk to human activity. Journal of WildlifeManagement 42:91–100.
Sudharsan, K., S. Riley, and S. Winterstein. 2006.Relationship of autumn hunting season to thefrequency of deer-vehicle collisions in Michigan.Journal of Wildlife Management 70:1161–1164.
Taylor, A., and R. Knight. 2003. Wildlife responses torecreation and associated visitor perceptions. Eco-logical Applications 13:951–963.
Theobald, D., J. Miller, and N. T. Hobbs. 1997.Estimating the cumulative effects of developmenton wildlife habitat. Landscape and Urban Planning39:25–36.
Tigas, L. A., D. Van Vuren, and R. Sauvajot. 2002.Behavioral responses of bobcats and coyotes tohabitat fragmentation and corridors in an urbanenvironment. Biological Conservation 108:299–306.
Van Manen, F., M. McCollister, J. Nicholson, L.Thompson, J. Kindal, and M. Jones. 2012. Short-term impacts of a 4-lane highway on Americanblack bears in Eastern North Carolina. WildlifeMonograph 181:1–35.
Waller, J. S. and C. Servheen. 2005. Effects oftransportation infrastructure on grizzly bears innorthwestern Montana. Journal of Wildlife Man-agement 69:985–1000.
Wasser, S. K., K. Bevins, G. King, and E. Hanson. 1997.Noninvasive physiological measures of disturbancein the northern spotted owl. Conservation Biology11:1019–1022.
Weisenberger, M., P. Krausman, M. Wallace, D.DeYoung, and O. Maughan. 1996. Effects ofsimulated jet aircraft noise on heart rate andbehaviour of desert ungulates. Journal of WildlifeManagement 60:52–61.
Wood, S. N. 2006. Generalized additive models: Anintroduction with R. Chapman and Hall/CRC, BocaRaton, Florida, USA.
Woodroffe, R., and J. R. Ginsberg. 1998. Edge effectsand the extinction of populations inside protectedareas. Science 280:2126–2128.
Woodroffe, R., S. Thirgood, and A. Rabinowitz. 2005.People and wildlife: Conflict or coexistence? Cam-bridge University Press, Cambridge, UK.
Zar, J. H. 1999. Biostatistical analysis. Fourth edition.Prentice Hall, Upper Saddle River, New Jersey,USA.
Zuur, A. F., E. N. Ieno, N. Walker, A. A. Saveliev, andG. M. Smith. 2009. Mixed effects models andextensions in ecology with R. Springer, New York,New York, USA.
v www.esajournals.org 16 March 2014 v Volume 5(3) v Article 27
BARRUETO ET AL.

SUPPLEMENTAL MATERIAL
APPENDIX
Fig. A1. Plots of traffic volume in average number of vehicles/hour obtained from three traffic counters on the
Trans-Canada Highway (TCH) in Banff National Park, Alberta. Traffic volume data are shown for the four phases
of the TCH from 2007–2013. Red solid dots are weekday (Monday–Thursday) traffic, while turquoise solid dots
are weekend (Friday–Sunday) traffic volumes.
Table A1. Best generalized additive mixed models (GAMMs) for elk. N¼ 1632, R2(adj)¼ 0.514. ICC¼ Intra-class
correlation. Smooth terms are denoted with s(). r2i ¼ variance of the random intercept; r2
r ¼ variance of the
(working) residuals.
Effect Variable Coefficient SE t Estimated df F P r2i r2
r ICC
Fixed Intercept �4.210 0.419 �10.046 ,0.001Fixed Traffic� 0.000 0.000 �1.678 0.094Fixed Phase 3A �2.873 0.507 �5.667 ,0.001Fixed Phase 3B �2.721 0.510 �5.338 ,0.001Fixed Phase 2 0.467 0.612 0.762 0.446Fixed s(hr): Phase 1 7.129 43.799 ,0.001Fixed s(hr): Phase 3A 0.000 0.000 0.436Fixed s(hr): Phase 3B 3.024 1.885 ,0.001Fixed s(hr): Phase 2 7.417 37.275 ,0.001Random Crossing structure 0.815 1.535 0.347
Notes: Traffic (indicated with �) was modeled as a smooth term first, but was found to be equal to a linear effect. Estimated df¼ 1. An ANOVA for the parametric coefficient Phase resulted in a P value of ,0.001, with df¼ 3 and F¼ 22.069.
v www.esajournals.org 17 March 2014 v Volume 5(3) v Article 27
BARRUETO ET AL.

Table A2. Best generalized additive mixed models (GAMMs) for deer spp. N¼ 1680, R2(adj)¼ 0.293. ICC¼ Intra-
class correlation. Smooth terms are denoted with s().r2i ¼variance of the random intercept; r2
r ¼variance of the
(working) residuals.
Effect Variable Coefficient SE t Estimated df F P r2i r2
r ICC
Fixed Intercept �3.482 0.447 �7.791 ,0.001Fixed Phase 3A �1.229 0.528 �2.327 0.020Fixed Phase 3B �2.123 0.537 �3.953 ,0.001Fixed Phase 2 �0.541 0.671 �0.806 0.420Fixed s(hr): Phase 1 3.540 0.939 0.045Fixed s(hr): Phase 3A 4.504 2.932 ,0.001Fixed s(hr): Phase 3B 0.000 0.000 0.953Fixed s(hr): Phase 2 2.439 1.086 0.006Fixed s(Traffic) 3.960 4.391 0.002Random Crossing structure 0.987 1.881 0.344
Note: An ANOVA for the parametric coefficient Phase resulted in a P value of ,0.001, with df ¼ 3 and F¼ 22.069.
Table A3. Best generalized additive mixed models (GAMMs) for wolf. N¼ 1440, R2(adj)¼ 0.351. ICC¼ Intra-class
correlation. Smooth terms are denoted with s().r2i ¼ variance of the random intercept; r2
r ¼ variance of the
(working) residuals. HumanL ¼ Low human use.
Effect Variable Coefficient SE t Estimated df F P r2i r2
r ICC
Fixed Intercept �8.454 0.870 �9.717 ,0.001Fixed Phase 3A 2.163 1.103 1.961 0.050Fixed Phase 3B 0.510 0.966 0.528 0.598Fixed Phase 2 1.387 1.009 1.375 0.170Fixed HumanL 2.100 0.934 2.249 0.025Fixed Phase 3A: HumanL �2.616 1.170 �2.236 0.026Fixed Phase 3B: HumanL �2.468 1.086 �2.273 0.023Fixed Phase 2: HumanL �0.016 1.255 �0.013 0.990Fixed s(hr): Phase 1 3.540 0.939 0.045Fixed s(hr): Phase 3A 4.504 2.932 ,0.001Fixed s(hr): Phase 3B 0.000 0.000 0.953Fixed s(hr): Phase 2 2.439 1.086 0.006Fixed s(Traffic) 3.960 4.391 0.002Random Crossing structure 0.440 0.994 0.307
Notes: An ANOVA for the parametric coefficient Phase resulted in a P value of 0.099, with df¼ 3 and F¼ 2.096. An ANOVAfor the parametric coefficient Human resulted in a P value of 0.025, with df¼ 1 and F¼ 5.059. An ANOVA for the interaction ofPhase and Human resulted in a P value of 0.012, with df ¼ 3 and F¼ 3.649.
Table A4. Best generalized additive mixed models (GAMMs) for coyote. N¼ 1536, R2(adj)¼ 0.277. ICC¼ Intra-
class correlation. Smooth terms are denoted with s().r2i ¼variance of the random intercept; r2
r ¼variance of the
(working) residuals. HumanL ¼ Low human use. HumanH ¼High human use.
Effect Variable Coefficient SE t Estimated df F P r2i r2
r ICC
Fixed Intercept �5.684 0.354 �16.044 ,0.001Fixed Phase 3A �1.128 0.509 �2.217 0.027Fixed Phase 3B �2.647 0.501 �5.281 ,0.001Fixed Phase 2 0.022 0.411 0.053 0.958Fixed HumanL �1.472 0.417 �3.534 0.000Fixed Phase 3A: HumanL 1.054 0.570 1.850 0.064Fixed Phase 3B: HumanL 2.184 0.590 3.701 0.000Fixed Phase 2: HumanL �0.078 0.639 �0.123 0.902Fixed s(hr): HumanH 3.277 2.617 ,0.001Fixed s(hr): HumanL 0.000 0.000 0.463Random Crossing structure 0.106 1.040 0.092
Notes: An ANOVA for the parametric coefficient Phase resulted in a P value of ,0.001, with df ¼ 3 and F ¼ 15.692. AnANOVA for the parametric coefficient Human resulted in a P value of ,0.001, with df¼ 1 and F¼ 12.489. An ANOVA for theinteraction of Phase and Human resulted in a P value of ,0.001, with df ¼ 3 and F ¼ 6.094.
v www.esajournals.org 18 March 2014 v Volume 5(3) v Article 27
BARRUETO ET AL.
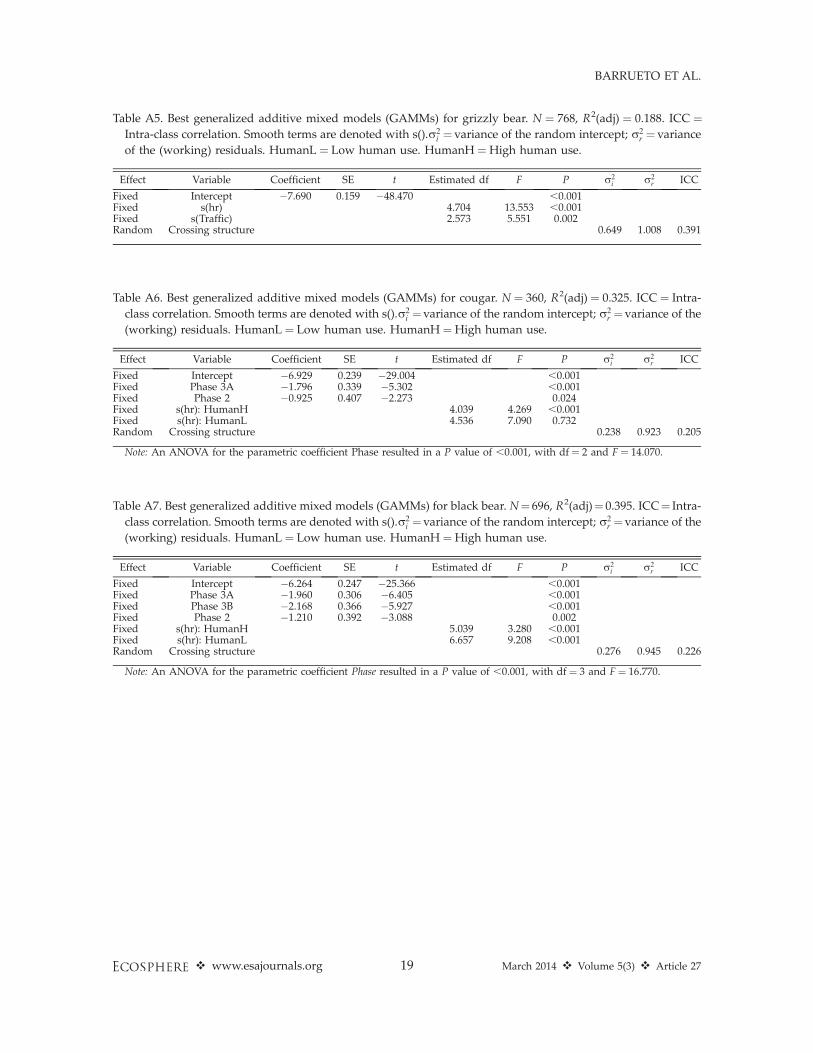
Table A5. Best generalized additive mixed models (GAMMs) for grizzly bear. N ¼ 768, R2(adj) ¼ 0.188. ICC ¼Intra-class correlation. Smooth terms are denoted with s().r2
i ¼variance of the random intercept; r2r ¼ variance
of the (working) residuals. HumanL ¼ Low human use. HumanH ¼High human use.
Effect Variable Coefficient SE t Estimated df F P r2i r2
r ICC
Fixed Intercept �7.690 0.159 �48.470 ,0.001Fixed s(hr) 4.704 13.553 ,0.001Fixed s(Traffic) 2.573 5.551 0.002Random Crossing structure 0.649 1.008 0.391
Table A6. Best generalized additive mixed models (GAMMs) for cougar. N ¼ 360, R2(adj) ¼ 0.325. ICC ¼ Intra-
class correlation. Smooth terms are denoted with s().r2i ¼variance of the random intercept; r2
r ¼variance of the
(working) residuals. HumanL ¼ Low human use. HumanH ¼High human use.
Effect Variable Coefficient SE t Estimated df F P r2i r2
r ICC
Fixed Intercept �6.929 0.239 �29.004 ,0.001Fixed Phase 3A �1.796 0.339 �5.302 ,0.001Fixed Phase 2 �0.925 0.407 �2.273 0.024Fixed s(hr): HumanH 4.039 4.269 ,0.001Fixed s(hr): HumanL 4.536 7.090 0.732Random Crossing structure 0.238 0.923 0.205
Note: An ANOVA for the parametric coefficient Phase resulted in a P value of ,0.001, with df¼ 2 and F¼ 14.070.
Table A7. Best generalized additive mixed models (GAMMs) for black bear. N¼ 696, R2(adj)¼ 0.395. ICC¼ Intra-
class correlation. Smooth terms are denoted with s().r2i ¼variance of the random intercept; r2
r ¼variance of the
(working) residuals. HumanL ¼ Low human use. HumanH ¼High human use.
Effect Variable Coefficient SE t Estimated df F P r2i r2
r ICC
Fixed Intercept �6.264 0.247 �25.366 ,0.001Fixed Phase 3A �1.960 0.306 �6.405 ,0.001Fixed Phase 3B �2.168 0.366 �5.927 ,0.001Fixed Phase 2 �1.210 0.392 �3.088 0.002Fixed s(hr): HumanH 5.039 3.280 ,0.001Fixed s(hr): HumanL 6.657 9.208 ,0.001Random Crossing structure 0.276 0.945 0.226
Note: An ANOVA for the parametric coefficient Phase resulted in a P value of ,0.001, with df ¼ 3 and F¼ 16.770.
v www.esajournals.org 19 March 2014 v Volume 5(3) v Article 27
BARRUETO ET AL.