anticipating the 2007-2008 financial crisis: who knew what and
TRANSCRIPT

Anticipating the 2007-2008 Financial Crisis: Who Knew What and When Did They Know It?
Paul Brockman, Biljana Nikolic, and Xuemin (Sterling) Yan*
October 2013
* Paul Brockman is at College of Business and Economics, Lehigh University, Bethlehem, PA 18015, Phone: 610-
758-2914, Email: [email protected]. Biljana Nikolic is at School of Business Administration, University of San
Diego, San Diego, CA 92110-2492, Phone: 619-260-4294, Email: [email protected]. Xuemin (Sterling) Yan
is at Robert J. Trulaske, Sr. College of Business, University of Missouri, Columbia, MO 65211, Phone: 573-884-
9708, Email: [email protected]. We thank Stephen Brown (the editor) and two anonymous referees and for
helpful comments.

1
Anticipating the 2007–2008 Financial Crisis:
Who Knew What and When Did They Know It?
October 2013
ABSTRACT We examine the ability of three groups of informed market participants to anticipate
the 2007–2008 financial crisis. Institutional investors and financial analysts exhibit
some awareness of the impending crisis in their preference for non-financial stocks
over financial stocks. In contrast, corporate insiders of financial firms appear to be
completely unaware of the timing and extent of the financial crisis. Net purchases
by managers of financial firms exceed those by managers of non-financial firms
over the entire 2006–2008 period. Our results add considerable weight to the
argument that the financial crisis was more a case of flawed judgment than flawed
incentives.

2
Anticipating the 2007–2008 Financial Crisis: Who Knew What and When Did They Know It?
The 2007–2008 financial crisis created the largest economic disruption since the Great
Depression. It resulted in the collapse of financial institutions, the bailout of banks by
governments, and severe downturns in stock markets around the world. By any measure of
economic activity (e.g., employment, gross domestic product, and asset values), the 2007–2008
financial crisis, the so-called Great Recession, ranks uncomfortably close to the Great
Depression. A large body of work has emerged to examine the causes and consequences of the
recent financial crisis. Much of this research focuses on the banking sector, liquidity problems,
policy reactions, and the real effects of the financial crisis.1 The purpose of this study is to
contribute to our understanding of financial crises by analyzing the behavior of major market
participants before and during the Great Recession. Specifically, we investigate the ability of
three groups of informed market participants—that is, institutional investors, financial analysts,
and corporate insiders—to forecast the impending crisis.
Previous studies have examined the informational role of institutional investors, financial
analysts, and corporate insiders during normal market conditions. These studies draw conflicting
conclusions about the extent to which institutions, analysts, and insiders are informed. Several
studies show that institutional trading predicts future earnings and stock returns (e.g., Nofsinger
and Sias, 1999; Ali et al., 2004; Yan and Zhang, 2009), while others find an inverse relation
between institutional demand and future returns (e.g., Cai and Zheng, 2004; Dasgupta et al.,
1 See, for example, Campello et al. (2010), Ivashina and Scharfstein (2010), Longstaff (2010), Erkens et al. (2012),
and Gorton and Metrick (2012) and references therein.

3
2011). Similarly, many studies find that changes in analyst recommendations are informative of
subsequent stock returns (e.g., Womack, 1996; Jegadeesh et al., 2004), while others contend that
analyst recommendations are uninformed (e.g., Altinkilic and Hansen, 2009). Finally, several
studies find that trading by corporate insiders earns abnormal returns (e.g., Rozeff and Zaman,
1988; Lakonishok and Lee, 2001), while others document zero or even negative abnormal
performance by insiders (e.g., Eckbo and Smith, 1998; Chakravarty and McConnell, 1999).
In addition to these mixed results regarding the predictive abilities of institutions,
analysts, and insiders, no previous study has examined their predictive abilities during an
extreme financial crisis. One of the difficulties faced by researchers during normal market
conditions is the lack of identifiable and significant events that would prompt intensive
information-based trading. We overcome this difficulty by focusing on the recent financial
crisis, a significant event with large wealth effects, thereby increasing the power of our tests for
private information. During the 2007–2008 crisis, the stock market in general and the financial
sector in particular suffered substantial losses.2 If institutional investors, financial analysts, and
corporate insiders possess superior knowledge about the impending crisis, we would expect them
to have acted on it.
Although the degree to which market participants are able to anticipate financial crises is
an open empirical question, Piotroski and Roulstone (2004) provide an analytical framework
from which to structure our analysis. Their study examines the relative abilities of institutions,
analysts, and insiders to process firm-level, industry-level, and market-level information. They
find that financial analysts have a comparative advantage at the industry level, while corporate
2 From June 2007 to December 2008, financial stocks lost, on average, nearly 60% of their market value, while non-
financial stocks lost less than 40%.

4
insiders have a comparative advantage at the firm level. The comparative advantage of
institutional investors is less straightforward, since it depends on whether the institution
represents an insider (firm-level advantage) or outsider (market-level advantage). Since the
2007–2008 financial crisis originated in the financial sector and then spread to the overall
market, we expect that financial analysts are in the best position to anticipate this industry-level
meltdown. In contrast, we expect that corporate insiders’ firm-level information advantage is
unlikely to have given them advance warning of an industry-based crisis. Finally, the predictive
ability of institutions should lie somewhere between that of analysts and insiders, since
institutional investors have comparative advantages at the aggregate market level.
In addition to generating evidence on the predictive ability of informed market
participants, our results have direct implications for the ongoing debate about the role of
financial firm executives. The critical issue in this debate is whether the disastrous outcomes of
2007–2008 were caused by financial firm executives’ exploitation of a fundamentally flawed
incentive system or by what proved to be bad decision making after the fact. Johnson (2011)
summarizes this debate as follows:
One view of executives at our largest banks in the run-up to the crisis of 2008 is that they were hapless fools. Unaware of how financial innovation had created toxic products and made the system fundamentally unstable, they blithely piled on more debt and inadvertently took on greater risks. The alternative view is that these people were more knaves than fools. They understood to a large degree what they and their companies were doing, and they kept at it up until the last minute – and in some cases beyond – because of incentives they might receive.
The “knaves versus fools” debate has important consequences for corporate policy and
regulatory changes, as well as for civil and criminal liabilities. Empirical evidence that might
shed light on this issue is only at the beginning stages—and rather mixed to date. Bhagat and
Bolton (2011) support the knaves’ view by arguing that poorly designed incentive packages

5
encouraged financial executives to knowingly take on excessive risk. In contrast, Fahlenbrach
and Stulz (2011) lean toward the fools’ view by arguing that the financial crisis was the result of
“unexpected poor outcomes.” These poor outcomes are the result of a bad draw from an ex post
viewpoint and not the result of excessive risk taking or the pursuit of private gains at shareholder
expense on an ex ante basis.3 Which of these two narratives, knaves or fools, best captures
actual executive behavior before and during the crisis is an open empirical question. Our
empirical results add considerable weight to this debate by examining insider trading among
financial firm executives.
Our first set of empirical tests examines the ability of institutional investors to anticipate
the financial crisis. We investigate the levels of and changes in institutional ownership of
financial versus non-financial firms for the 12-quarter period before and during the financial
crisis (2006–2008). Our results show that institutional investors significantly underweight
financial firms relative to non-financial firms (by 23.31% to 25.48%) in each of the 12 quarters
under investigation. When examining cumulative trading since the beginning of 2006, we find
evidence that institutions, particularly short-term institutions and top-performing institutions,
exhibit some predictive ability for the financial crisis. Overall, we conclude that institutional
investors had some knowledge of the impending financial crisis.
Our second set of empirical tests investigates the ability of financial analysts to anticipate
the financial crisis. We examine analyst recommendations for financial versus non-financial
firms. Our results show that analyst recommendations are significantly lower for financial firms
3 Cheng, Raina, and Xiong (2012) reach similar conclusions about the role of financial managers in the related
housing market bubble. In a related paper, Cheng, Hong, and Scheinkman (2012) show that executive compensation
and firm risk can be positively correlated, even in the absence of managerial entrenchment.

6
relative to non-financial firms in every month of our 36-month period. In addition, we find weak
evidence that analysts are more likely to downgrade financial firms relative to non-financial
firms leading up to the financial crisis. Taken together, the analyst results suggest that financial
analysts exhibit some awareness of the financial sector weaknesses around the crisis period.
Our third and perhaps most interesting set of empirical tests examines the ability of
corporate insiders to anticipate the financial crisis. Our results show that insiders of financial
firms have higher net purchases than insiders of non-financial firms in every six-month interval
of our sample period. While insiders of non-financial firms are net sellers over the entire sample
period, insiders of financial firms are net buyers in half of these six-month intervals. Even
during the periods when financial firm insiders are net sellers, the magnitude of their net selling
is significantly smaller than that of their non-financial firm counterparts. These insider trading
results are striking. Corporate insiders of financial firms reveal significantly more optimism in
their trading patterns than the insiders of non-financial firms. Contrary to the popular view that
bank executives exploited their privileged inside information during the financial crisis, our
results demonstrate that these executives were net accumulators of their own company stock
relative to executives in non-financial firms.
Several concurrent papers examine the role of institutional investors and corporate
insiders in the recent financial crisis (e.g., Manconi et al., 2011; Ben-David et al., 2012; Erkens
et al., 2012). Our paper differs from these studies in two important ways. First, we perform our
analysis at the aggregate (i.e., industry) level, rather than at the individual firm level. While
there are large variations across financial firms, the recent financial crisis is primarily an
aggregate phenomenon driven by macro and systemic risk rather than firm-specific risk. Second,
we draw most of our inferences from comparing financial firms to non-financial firms, rather

7
than by examining financial firms in isolation. This research design helps control for unobserved
factors that might influence both financial and non-financial firms while exploiting the facts that
(1) the 2007–2008 crisis originated in the finance sector, and (2) financial firms suffered
substantially greater losses than non-financial firms during the crisis.
Our study makes several contributions to the literature and provides relevant evidence to
ongoing policy debates. First, this is the first comprehensive study that analyzes the degree to
which informed market participants are able to anticipate severe economic and financial shocks.
Although researchers could not perform such an analysis for the Great Depression due to data
constraints, we are able to examine the question of “who knew what and when did they know it”
for the Great Recession.
Second, we provide new evidence that institutional investors and financial analysts
expressed their concerns about a possible crisis by underweighting financial stocks or by giving
significantly more negative recommendations to financial firms than to non-financial firms. Our
finding regarding financial analysts, in particular, is consistent with the implications of Piotroski
and Roulstone’s (2004) study that financial analysts have a relative information advantage at the
industry or market level. The authors argue that “financial analysts are outsiders who generally
have less access to firm-level idiosyncratic information than either management or significant
institutional investors. As such, analysts could focus their efforts on obtaining and mapping
industry- and market-level information into prices (p. 1121).” Our findings support this
argument by showing that financial analysts appeared anxious about the overall financial sector
during the run-up to the crisis.
Third, we show that the insiders of financial firms made significantly higher net
purchases than their non-financial firm counterparts. This finding is consistent with a growing

8
body of evidence (e.g., Fahlenbrach and Stulz, 2011; Cheng, Raina, and Xiong, 2012) suggesting
that the financial crisis was more the result of flawed judgment (or a bad draw) than flawed
managerial incentives. This conclusion suggests that recent regulatory proposals designed to
restructure managerial incentives as a means of preventing future financial crises are unlikely to
succeed.
The remainder of this paper proceeds as follows. Section I describes our data and
provide descriptive statistics. Section II presents the empirical results. Section III concludes the
study.
I. Data Sources, Sample Construction, and Descriptive Statistics
A. Data Sources and Sample Construction
We obtain data on institutional quarterly holdings from the Thomson Reuters (TFN) 13F
Holdings database for the period from 2006:Q1 to 2008:Q4. In addition to analyzing all
institutional investors as a single group, we separately examine short-term institutions, hedge
funds, and top-performing institutions. We follow Yan and Zhang (2009) and classify an
institution as a short-term institution if its turnover over the past four quarters ranks in the top
tercile of all institutions. We classify an institution as a hedge fund if its name in the TFN
database matches a name from the Center for International Securities and Derivatives Markets
(CISDM) hedge fund database. We classify an institution as a top-performing institution if its
four-factor alpha (based on Carhart, 1997) estimated over the past 36 months ranks in the top
tercile of all institutions.
We merge the institutional holdings data with the COMPUSTAT database to obtain the
book value of common equity and common stock dividends and with the Center for Research in

9
Security Prices (CRSP) monthly database to obtain Standard Industrial Classification (SIC) code,
price, return, shares outstanding, and volume information. We restrict our study to common
stocks (CRSP share code 10 or 11) and use SIC codes to determine whether a firm belongs to the
financial industry. We follow the definition of financial firm provided in the U.S. Securities and
Exchange Commission (SEC) Emergency Order from September 18, 2008; specifically, financial
firms include companies with the SIC codes 6000, 6011, 6020–22, 6025, 6030, 6035–6036,
6111, 6140, 6144, 6200, 6210-11, 6231, 6282, 6305, 6310–6311, 6320–6321, 6324, 6330–6331,
6350–6351, 6360–6361, 6712, and 6719.4,5
We obtain analyst recommendations from the Institutional Brokers’ Estimate System
(I/B/E/S) database. Analysts report their recommendations using different rating scales.
However, I/B/E/S changes those scales to maintain a standard set of recommendations with five
values, ranging from 1 = strong buy to 5 = strong sell. We re-code this recommendation system
so that larger numbers indicate better ratings (i.e., 1 = strong sell and 5 = strong buy).
4 We replicate all empirical results using two alternative definitions of financial firms, one definition that is more
restrictive than the SEC definition and a second definition that is less restrictive than the SEC definition. Our more
restrictive definition is based on that of Flannery et al. (2004) and includes only those firms with SIC codes from
6021 to 6025 and from 6710 to 6712. Our less restrictive definition includes all firms with SIC codes from 6000 to
6999. The empirical results based on both alternative definitions are consistent with those reported herein. Due to
space limitations, we provide these results in an Internet-accessible Supplemental Appendix.
5 In addition to financial versus non-financial firms, we also compare Troubled Asset Relief Program (TARP) firms
to non-TARP firms. The findings are consistent with those of the financial versus non-financial firms (i.e.,
institutions and analysts show some ability to identify financially vulnerable firms before the onset of the crisis).
We present the TARP versus non-TARP results in our Internet-accessible Supplemental Appendix.

10
We use the TFN Insider database to obtain information on insider trades. The SEC
requires insiders to report their trades within two business days of the transaction date. We
restrict our insider trading analysis to management only. Following Lakonishok and Lee (2001),
we define a firm’s management group to include the CEO, CFO, chairperson of the board,
directors, officers, presidents, and vice presidents (TFN role codes CEO, CFO, CB, D, O, P, VP).
To focus on information-driven trading, we exclude all transactions related to the exercise of
executive stock options (i.e., the acquisition and subsequent disposition of company stock).
Following Lakonishok and Lee (2001), we apply several filters to the insider trading data to
ensure accuracy. We exclude all transactions that are less than 100 shares or more than 20% of
shares outstanding, as well as transactions with prices that differ by more than 20% of the
closing price.
B. Descriptive Statistics
In Table 1 we present descriptive statistics for our full sample, as well as for subsamples
of financial and non-financial firms. We report the time-series mean and standard deviation of
cross-sectional average values for the following firm characteristics: share price (PRC), market
capitalization (SIZE), book-to-market ratio (BM), share turnover (TURN), return volatility
(VOL), firm age (AGE), previous three-month return (RETt−3,t), previous nine-month return
(RETt−12,t−3), and dividend yield (DP).6 More detailed variable definitions are provided in the
Appendix.
For the full sample, the mean values include a share price of $24.33, market
capitalization of $3.79 billion, a book-to-market ratio of 0.63, and a monthly turnover rate of
6 We exclude two financial firms from the analysis because their stock prices are above $1,000 per share. We
winsorize DP at the 99th percentile and BM at the first and 99th percentiles.

11
19%. The average age since initial public offering is a little over 218 months (18.2 years) and
the mean dividend yield is 1.22%. The mean cumulative return over the previous three months is
-2.57%, while the mean cumulative return over the nine-month period from t - 12 to t - 3 is
4.65%. For the financial (non-financial) subsample, mean values include a share price of $27.09
($23.74), market capitalization of $2.97 billion ($3.96 billion), a book-to-market ratio of 0.78
(0.59), and a monthly turnover rate of 10% (21%). The average age is 167.14 (229.55) months
and the mean dividend yield is 2.31% (0.99%). The mean cumulative return over the previous
three months is -3.66% (-2.33%), and the mean cumulative return from t - 12 to t - 3 is -1.56%
(5.98%). These results show that financial firms tend to have lower capitalizations, turnover,
volatility, and age, but higher dividend yields and book-to-market ratios, than the typical non-
financial firm. The main difference, however, is the negative cumulative return (from t - 12 to
t - 3) for financial firms compared to the positive cumulative return for non-financial firms.
II. Empirical Results
A. Institutional Investors
A.1. Institutional Ownership: Levels and Changes
To determine whether institutional investors were able to predict the financial crisis, we
first examine how institutional ownership and trading differ between financial firms and non-
financial firms. If institutions possess foresight about the impending crisis, we expect them to
underweight financial firms relative to non-financial firms. Following Gompers and Metrick
(2001), we define institutional ownership (IO) as the fraction of a firm’s shares held by
institutional investors. Specifically, for each firm in each quarter (firm–quarter) we sum the

12
shares held across all reporting institutions and divide by the total number of shares outstanding.7
We then calculate equal-weighted average institutional ownership across all financial and non-
financial firms. We define change in institutional ownership (ΔIO) for a given stock as the
quarterly change in IO between two consecutive quarters. We define cumulative change in
institutional ownership (ΔIOcum) as the cumulative change in IO since the beginning of our
sample period (2006:Q1), and Diffcum as the difference in average cumulative ΔIO between
financial and non-financial firms.
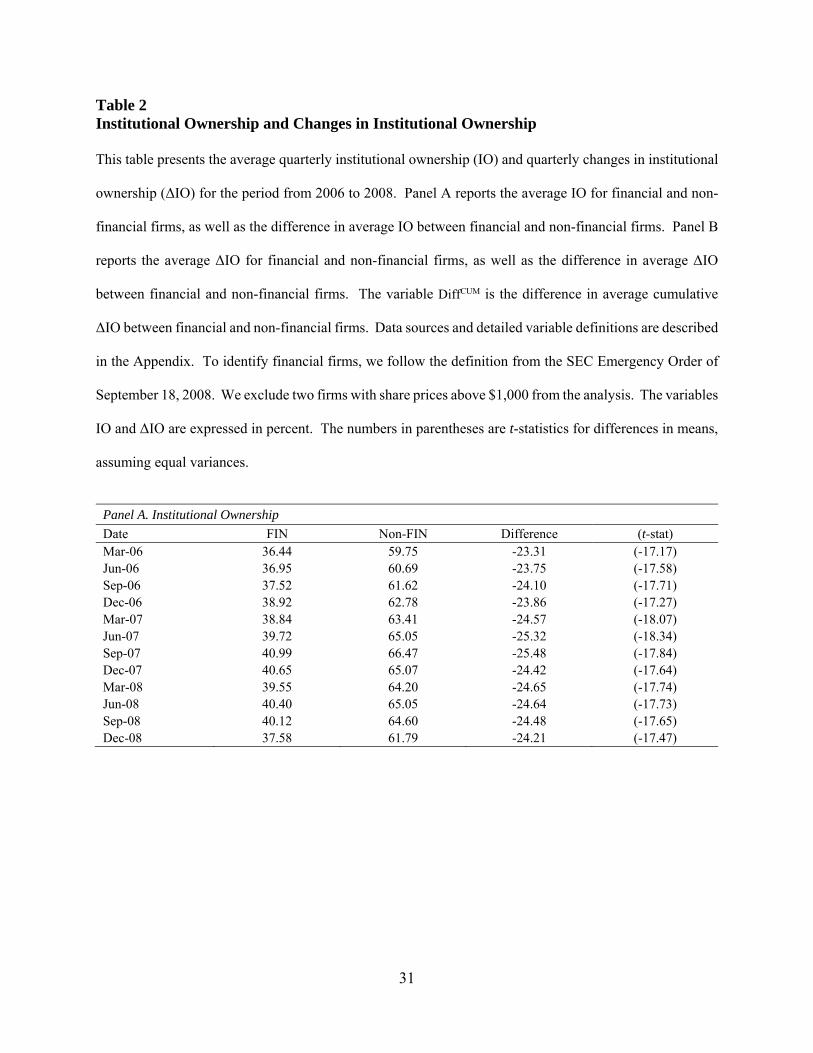
In Panel A of Table 2, we report the average IO for financial and non-financial firms, as
well as the difference in average IO between financial and non-financial firms. The IO results
show some initial evidence that institutions were able to anticipate the financial crisis.
Institutions hold a significantly smaller fraction of financial firms than non-financial firms in
every quarter of the sample period. For example, in the first quarter of 2007 the average
institutional ownership is 63.41% for non-financial firms but is only 38.84% for financial firms.
The difference in institutional ownership between financial and non-financial firms, ranging
from 23.31% at the beginning of the sample period (2006:Q1) to 25.48% when the financial
crisis was beginning to emerge (2007:Q3),8 is economically large and statistically significant.
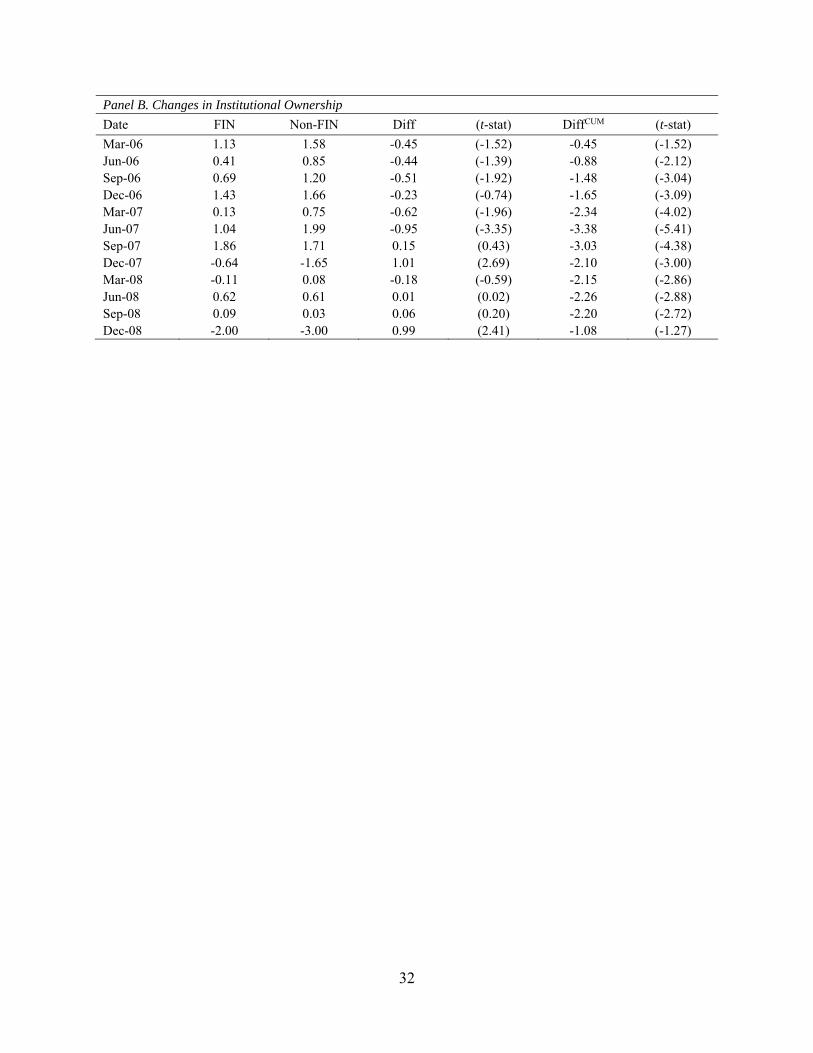
In Panel B of Table 2, we report the average ΔIO for financial and non-financial firms, as
well as the difference in average ΔIO between financial and non-financial firms. Since we are
analyzing quarterly changes over a three-year period, the results are more volatile and more
difficult to summarize than the ownership levels in Panel A. That said, the results show some
7 If a resulting IO value is greater than 100% due to stock lending for short sales, we set it equal to 100%.
8 Two Bear Stearns’ hedge funds (High-Grade Structured Credit Fund and High-Grade Structured Credit Enhanced
Leverage Fund) reported large losses in June 2007, followed by bankruptcy filings in July 2007.

13
evidence that institutions reduced their holdings of financial firms relative to non-financial firms
during the six quarters of the run-up to the financial crisis (i.e., from 2006:Q1 to 2007:Q2). All
six t-statistics for the ΔIO differences in the financial versus non-financial firms (Diff) are
negative and three of the six t-statistics are statistically significant. During the second half of our
sample period (i.e., the crisis period), institutions mostly increased their holdings of financial
firms relative to non-financial firms. This result suggests that institutions became less cautious
about holding financial firms after the crisis began than they had been during the pre-crisis
period. Five of the six t-statistics for ΔIO differences are positive and two of the five positive t-
statistics are statistically significant.
We also examine differences in cumulative IO changes (Diffcum) from the beginning of
2006 for financial versus non-financial firms. As expected, these cumulative changes are less
volatile than quarterly changes. Moreover, the cumulative changes reveal more consistent
evidence of reductions in institutional exposure to financial firms relative to non-financial firms.
Specifically, all differences in cumulative IO changes between financial and non-financial firms
are negative and 10 out of 12 are significantly negative.
A.2. Short-Term Institutions, Hedge Funds, and Top-Performing Institutions
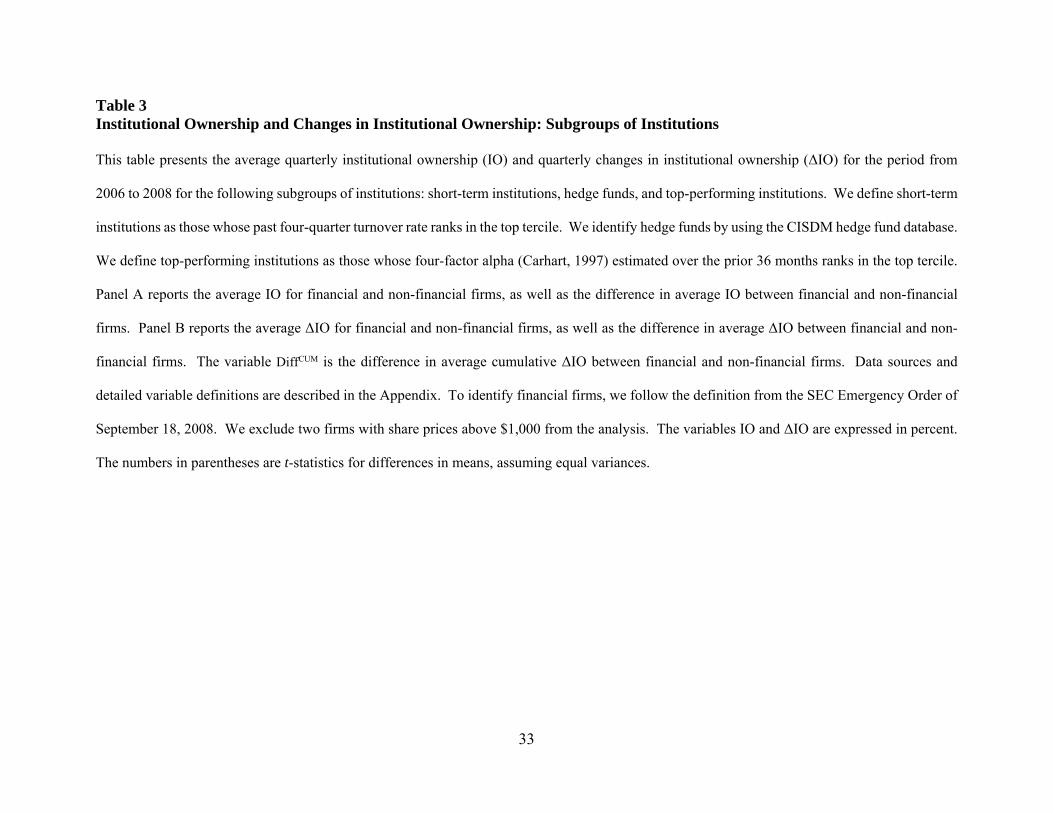
In Table 3 we refine the analysis by presenting the IO, ΔIO, and ΔIOcum results for three
subcategories of institutional investors: short-term institutions, hedge funds, and top-performing
institutions (as defined in Section I.A). We select these subcategories because we are interested
in identifying institutional traders with both the incentive and information to make informed
trades before and during a financial crisis. Short-term institutions are expected to collect and
process information that can be exploited over the short to intermediate term. Previous studies
(e.g., Ke and Ramalingegowda, 2005; Yan and Zhang, 2009) present evidence that short-term

14
institutions are better informed than long-term institutions. Hedge fund managers are often
regarded by Wall Street commentators as representing the interests of “smart money.” Top-
performing institutions have displayed superior investing skills in the recent past and therefore
might be expected to identify and trade ahead of an approaching financial crisis.
The IO results in Panel A of Table 3 show that each institutional subcategory had
significantly less exposure to financial firms than to non-financial firms during the 2006–2008
sample period. The differences are negative and significant in all 12 quarters for all three
subcategories of institutions. These results are consistent with the findings in Table 2 and
confirm that major subcategories of sophisticated institutional traders had relatively low holdings
of financial firms compared to non-financial firms heading into and during the financial crisis.
Our ΔIO and ΔIOcum results in Panel B of Table 3 are less straightforward to summarize due to
the volatile nature of quarterly changes. But again, as in Table 2, there are some discernible
patterns. First, top-performing institutions exhibit the strongest evidence of timing ability in the
run-up to the financial crisis. These institutions significantly reduced their exposure to financial
firms relative to non-financial firms in four out of six quarters, resulting in a cumulative
reduction of 4.77% between January 2006 and June 2007. Second, short-term institutions also
reduced their exposure to financial firms relative to non-financial firms in the run-up to the
financial crisis (significant in three out of six quarters). We also note that during the second half
of the sample period (i.e., in the midst of the crisis) short-term institutional ownership toggled
back and forth between large negative and large positive changes. Finally, hedge funds tended to
decrease their exposures to financial firms significantly more in the second half of the period.
This pattern could be the result of redemptions on the part of nervous limited partners, as
suggested by Ben-David et al. (2012).

15
A.3. Regression Analysis
Overall, our univariate findings in Tables 2 and 3 provide some initial evidence that
institutions were aware of potential trouble in the financial sector before the outbreak of the
crisis. While the univariate results indicate that institutions prefer non-financial to financial
firms prior to and during the financial crisis, prior literature identifies several variables that
influence institutional preferences for stocks (e.g., Gompers and Metrick, 2001). It may be that
these preferences, rather than information about the impending financial crisis, are actually
driving the results. To control for this possibility, we follow Gompers and Metrick (2001) and
estimate the following cross-sectional regression in each quarter:
IOi,t or ΔIOi,t,t+1 = β0 + β1FINi,t + β2SIZEi,t + β3BMi,t + β4RETi,t-3,t +β5RETi,t-12,t-3 +
β6TURNi,t + β7VOLi,t+ β8AGEi,t + β9PRCi,t + β10DPi,t + β11SP500i,t + ei,t (1)
where IO represents institutional ownership and ΔIO represents institutional trading, FIN is an
indicator variable for financial firms, and SP500 is an indicator variable for membership in the
Standard & Poor’s (S&P) 500 index. All variables except for prior returns and indicator
variables are in natural logarithms. To reduce the impact of outliers, we winsorize DP at the
99th percentile and BM at both the first and 99th percentiles. We estimate regression (1) for all
institutions, as well as for the subcategories of short-term institutions, hedge funds, and top-
performing institutions. For brevity, we report only the estimated coefficients for the FIN
indicator variable, our main variable of interest, in Table 4.
The IO results in Table 4 show that institutions held significantly lower percentages of
financial firm shares than non-financial firm shares, even after controlling for the variables
known to impact institutional investor preferences. In the first column (all institutions), the
coefficient estimates of FIN are negative and highly significant in every quarter of our sample.

16
We find similar results for each subcategory of institution; namely, the FIN coefficient estimates
are negative and highly significant in every quarter of the IO regressions. These multivariate
findings clearly show that institutions favored non-financial firms over financial firms in the run-
up to and during the financial crisis.
In contrast to the IO regressions, the ΔIO regressions reveal weaker evidence of informed
trading on a quarter-by-quarter basis. The ΔIO regressions based on all institutions contain three
statistically significant FIN coefficients, two negative and significant coefficients in the first half
of the sample period (i.e., pre-crisis period), and one positive and significant coefficient in the
second half of the sample period. Short-term institutions also have two negative and significant
coefficients in the first half of the sample period, followed by three positive and significant
coefficients and one negative and significant coefficient in the second half. Hedge funds have
one negative and significant coefficient in the first half of the period and two negative and
significant coefficients in the second half. As in Table 3, the top-performing institutions show
the strongest ability to anticipate the financial crisis, with four negative and significant
coefficients in the pre-crisis period. They then reverse their aversion to financial stock in the
second half of the period, with three positive and significant coefficients and one negative and
significant coefficient. During the last quarter of 2008, in particular, top-performing and short-
term institutions made fairly aggressive moves into financial sector stocks. One possible
explanation is that top-performing and short-term institutions anticipated that the government
would bail out the troubled financial institutions (i.e., through the TARP).
On the whole, these regression results are similar to the univariate results. Institutional
investors seem to have had the foresight to underweight financial firms relative to non-financial

17
firms before the financial crisis.9 Although the findings suggest that institutions were informed
with respect to the vulnerability of the financial sector, we find less clear evidence that
institutions were able to time adverse market moves on a quarter-by-quarter basis. The results
suggest that institutions possessed general, if vague, knowledge of the impending crisis.
B. Financial Analysts
B.1. Analyst Recommendations
Our first set of results is based on average analyst recommendations. For each month in
our sample period, we obtain the most recent recommendation for a given firm issued by an
analyst within the previous 12 months. The consensus recommendation is the average of all
outstanding recommendations for a given stock. Similar to our previous analyses, we focus on
differences between financial firms and non-financial firms. If analysts are informed about the
financial crisis, we expect that the average consensus analyst recommendations for financial
firms will be significantly lower than those for non-financial firms.
The results in Panel A of Table 5 show that analyst recommendations are significantly
lower for financial firms than for non-financial firms in every month of our sample. These
findings are consistent with considerable foresight on the part of financial analysts. Not only are
the differences negative and significant in each month (ranging from -0.15 to -0.39), but the
absolute values of the t-statistics are quite large (ranging from -6.18 to -16.23).
9 We also perform difference-in-differences analyses that compare institutional investors’ underweighting of
financial firms during the crisis period to their underweighting of financial firms during a non-crisis benchmark
period. These regression results confirm that institutional investors underweight financial firms significantly more
during the crisis than during a non-crisis benchmark period. We provide these difference-in-differences results in
our Internet-accessible Supplemental Appendix.

18
To ensure that our univariate results are not driven by other variables that analysts rely on
when issuing recommendations (Jegadeesh et al., 2004), we examine how analyst
recommendations for financials versus non-financials differ while controlling for firm size,
book-to-market ratio, and prior stock returns. In particular, we estimate the following Fama–
MacBeth (1973) type regression for each month in our sample:
RECi,t = β0 + β1FINi,t + β2SIZEi,t+ β3BMi,t + β4RETi,t-3,t + β5RETi,t-12,t-3 + ei,t (2)
where REC is the consensus recommendation for the firm and the other variables are described
in the Appendix. We average the coefficients across months and adjust the resulting standard
errors for heteroskedasticity and autocorrelation for up to 12 monthly lags using the Newey–
West (1987) procedure. Our main variable of interest is the FIN dummy variable.
We report the results from regression model (2) in Panel B of Table 5. The estimated
FIN coefficient (-0.19) is negative and significant (t-statistic = -11.39). This finding confirms
that analyst recommendations were significantly lower for financial firms than for non-financial
firms during period from 2006:01 to 2008:12, after controlling for other known variables that
affect analyst recommendations.10, 11
10 We also perform difference-in-differences analyses that compare analyst recommendations for financial versus
non-financial firms during the financial crisis to their relative (i.e., financial versus non-financial firms)
recommendations during a non-crisis benchmark period. The difference-in-differences regressions confirm that
analyst recommendations for financial firms are significantly lower (relative to non-financial firms) during the crisis
than during a non-crisis benchmark period. We present these results in our Internet-accessible Supplemental
Appendix.
11 Our results are similar if we use the sample period 2006:01 to 2007:06.

19
B.2. Changes in Analyst Recommendations
Our next set of results is based on changes in analyst recommendations. The results in
Panel A of Table 6 show that monthly changes in analyst recommendations are quite volatile
during this three-year period. The differences (Diff) in monthly changes in analyst
recommendations between financial and non-financial firms are statistically significant at the
10% level or better in approximately half of the months (17 out of 36) and slightly more than
half of these significant differences are negative (10 out of 17). The differences in cumulative
changes in analyst recommendations (Diffcum) reveal a more consistent pattern; that is, there are
18 negative and significant differences and zero positive and significant differences.
While we hesitate to draw strong conclusions based on volatile monthly changes, the
results do show more negative recommendation changes for financial firms relative to non-
financial firms. This overall trend toward negative differences is more apparent when viewing
the cumulative changes in analyst recommendations. There are 18 instances of negative and
significant differences in cumulative changes in analyst recommendations between financial and
non-financial firms and not a single instance of a positive and significant difference in
cumulative changes. It should be noted, however, that most of the significantly negative Diffcum
values occur after the financial crisis had begun (especially after November 2007). That is, this
result captures more of a reaction to the crisis than a prediction of the crisis. There is a shorter
four- to five-month run of significantly negative Diffcum values before the crisis period.
Next, we examine changes in analyst recommendations for financials versus non-
financials in a regression setting while controlling for firm size, book-to-market ratio, and prior
stock returns. We estimate the following Fama–MacBeth (1973) type regression for each month
in our sample:

20
ΔRECi,t,t+1 = β0 + β1FINi,t + β2SIZEi,t + β3BMi,t + β4RETi,t-3,t + β5RETi,t-12,t-3 + ei,t (3)
where ΔREC is the average change in recommendation for a stock across the analysts who issue
recommendations within the past 12 months and all other variables are described in the
Appendix. Panel B of Table 6 shows that the estimated FIN coefficient (-0.29) is negative and
insignificant. In summary, we find a negative and significant relation between analyst
recommendations and financial firms in regression (2) and a negative but insignificant relation
between changes in analyst recommendations and financial firms in regression (3).
C. Corporate Insiders
After finding some confirmatory evidence that outsiders (i.e., institutions and analysts)
possessed superior information about the vulnerability of the financial sector, we now focus our
analysis on corporate insiders. Corporate insiders would presumably have the best information
about what is going on inside their firms. Furthermore, many commentators in the popular press
maintain that insiders of financial institutions sold their company shares in expectation of the
financial crisis. As discussed in the introduction, the critical issue in this debate is whether the
executives of financial firms behaved more as knaves or fools during the financial crisis.
The knave argument states that flawed incentives allowed executives to (knowingly) take
on excessive debt in an effort to maximize personal wealth while risking shareholder wealth.
Since these executives were fully aware of their excessive risk taking, they also would have been
fully prepared to abandon ship (sell shares) at the first sign of trouble. The fool argument states
that financial executives did not knowingly subject their firms to excessive risks. They might
have exercised poor judgment or might have simply gotten a bad draw from a random
distribution, but they did not anticipate financial collapse. Fortunately, these competing
narratives have completely opposite implications with respect to insider trading. If most

21
financial firm executives behave as knaves, then we should find significantly more insider selling
before and during the financial crisis when compared to non-financial firm executives; if most
financial executives behaved as fools, then there should be no significant difference between the
trading patterns of insiders at financial firms and insiders at non-financial firms.
C.1. Univariate Analysis
Following Lakonishok and Lee (2001), we measure insider trading as net insider
purchases over the previous six months divided by total shares outstanding (NIT). In particular,
for each firm-month we sum purchases (sales) across all management insiders who traded in the
past six months. We subtract sales from purchases and divide by total shares outstanding. The
choice of shares outstanding as opposed to total transactions used by Lakonishok and Lee (2001)
is driven by data frequency and the cross-sectional nature of our analysis. If no insider traded in
the prior six months, the NIT variable is set to zero.
We first examine differences in mean insider trading for financial versus non-financial
firms during six half-year intervals from January 2006 to December 2008. We present the
results of this analysis in Table 7. The results are striking. The insiders of financial firms
consistently buy more (sell less) of their company shares than the insiders of non-financial firms.
Differences in net insider purchases (financial minus non-financial firm purchases) are positive
in all six half-year trading intervals and statistically significant in four of the six half-year
periods. While non-financial firm insiders are net sellers during the entire sample period,
financial firms’ insiders become net buyers in the latter half of this period.12 This evidence is
12 Because corporate executives receive large option and stock grants (and due to liquidity and diversification
concerns), insiders tend to be net sellers of their companies’ stocks. Consequently, one cannot interpret the net
selling by financial firm insiders during the first half of our sample period alone as evidence of superior information

22
contrary to the popular view that insiders of financial firms exploited their information advantage
by selling company shares before the general public learned the full extent of their companies’
poor performance. Indeed, the trading behavior of financial firm insiders shows that they
believed their companies to be undervalued relative to non-financial firms both before and
during the financial crisis.
C.2. Multivariate Analysis
Next, we explore insider trading between financial and non-financial firms in a
multivariate setting by including control variables. We estimate the following cross-sectional
regression:
NITi,t-6,t = β0 + β1FIN i,t-6 + β2SIZEi,t-6+ β3BMi,t-6 + β4RETi,t-30,t-6 + ei,t (4)
where the dependent variable, NIT, represents net insider purchases over the previous six months
divided by total shares outstanding. The other independent variables are described in the
Appendix. We estimate six regressions, one for each half-year period.
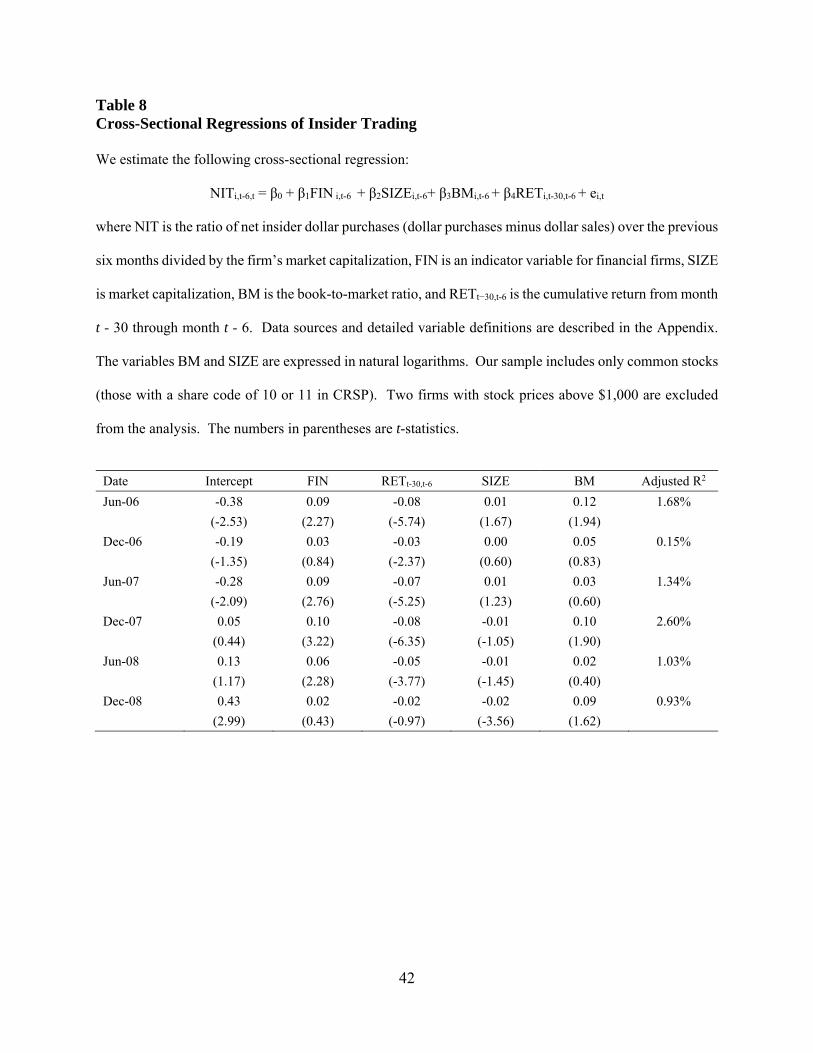
The results in Table 8 show that net insider purchases are significantly larger for financial
firms than for non-financial firms in four of the six regressions, after other determinants of
insider trading are controlled for. The estimated FIN coefficient is positive for all six regressions
and its magnitude ranges from an insignificant 0.03 in December 2008 to a significant 0.10 in
December 2007. These multivariate results are consistent with the univariate results, both of
which confirm that corporate insiders of financial firms were trading more optimistically in their
company stock than were their non-financial firm counterparts. Thus, contrary to the view that
about the impending financial crisis. A comparison of financial firm insider trading with non-financial firm insider
trading is more revealing about the abnormal trading of financial firm insiders.

23
bank executives exploited their privileged inside information before and during the financial
crisis, our results show that these executives are net accumulators of company stock relative to
executives in the non-financial sector.
Before ending this section, we also note that while our results indicate that insiders were
unaware of the impending crisis, they do not necessarily mean that insiders are completely
uninformed. Insiders could be informed, particularly with respect to firm-specific information,
but still be relatively unaware of the systemic risks faced by their firms leading up to and during
the financial crisis.
III. Conclusions
This study examines the degree to which the recent financial crisis was anticipated by
three categories of informed market participants: institutional investors, financial analysts, and
corporate insiders. The Great Recession (2007–2008 financial crisis) offers a unique opportunity
to examine the underlying dynamics of a catastrophic financial collapse. Unlike the Great
Depression, the Great Recession occurs at a time when financial data on the major market
participants are abundant and publicly available. This data-rich environment should yield a
much deeper understanding of the underlying processes of severe financial crises than was
generated in the roughly eight decades since the start of the Great Depression. The purpose of
this study is to examine the behavior of informed market participants before and during the
2007–2008 financial crisis. In addition to analyzing the abilities of institutional investors,
financial analysts, and corporate insiders to anticipate an impending collapse, our empirical
results have direct implications for regulatory changes designed to prevent future collapses.

24
Our empirical results show that institutional investors and financial analysts exhibit some
awareness of the impending crisis in their preference for non-financial stocks over financial
stocks. Institutional investors underweighted financial firms relative to non-financial firms and
financial analysts gave consistently lower recommendations for financial firms compared to non-
financial firms. These analyst-related results are consistent with Piotroski and Roulstone’s
(2004) claim that financial analyst have an information advantage at the industry level.
While institutions and analysts could see the industry-level forest and act accordingly,
bank executives appear to have focused on individual firm-level trees. Our results show that the
executives of financial firms were buying more and selling less of their own companies than
were the executives of non-financial firms both before and during the financial crisis. Our
finding that financial firm managers were net purchasers during the height of the crisis casts
considerable doubt on Johnson’s (2011) knave narrative, as well as on regulations designed to
prevent future crises by curtailing knave behavior.

25
REFERENCES
Ali, A., C. Durtschi, B. Lev, and M. Trombley, 2004, Changes in institutional ownership and
subsequent earnings announcement abnormal returns, Journal of Accounting, Auditing,
and Finance (Summer), 221–248.
Altinkilic, O., and R. Hansen, 2009, On the information role of analyst recommendations, Journal
of Accounting and Economics 48, 17–36.
Ben-David, I., F. Franzoni, and R. Moussawi, 2012, Hedge fund stock trading in the financial crisis
of 2007–2008, Review of Financial Studies 25, 1–54.
Bhagat, S., and B. Bolton, 2011, Bank compensation and capital requirements reform, Working
paper, University of Colorado at Boulder.
Cai, F., and L. Zheng, 2004, Institutional trading and stock returns, Finance Research Letters 1,
178–189.
Campello, M., J. Graham, and C. Harvey, 2010, The real effects of financial constraints: Evidence
from a financial crisis, Journal of Financial Economics 97, 470–487.
Carhart, M., 1997, On persistence in mutual fund performance, Journal of Finance 52, 57–82.
Chakravarty, S., and J. McConnell, 1999, Does insider trading really move stock prices? Journal
of Financial and Quantitative Analysis 34, 191–209.
Cheng, I.-H., Hong, H., and J. A. Scheinkman, 2012, Yesterday’s heroes: Compensation and
creative risk-taking, Working paper, Princeton University.
Cheng, I.-H., Raina, S., and W. Xiong, 2012, Wall Street and the housing bubble, Working paper,
Princeton University.
Cziraki, P., 2011, Trading by bank insiders before and during the financial crisis, Working paper,
Tilburg University.
26
Dasgupta, A., A. Prat, and M. Verardo, 2011, Institutional trade persistence and long-term equity
returns, Journal of Finance 66, 635–653.
Eckbo, B. E., and D. Smith, 1998, The conditional performance of insider trades, Journal of
Finance 53, 467–498.
Erkens, D. H., M. Hung, and P. Matos, 2012, Corporate governance in the 2007–2008 financial
crisis: Evidence from financial institutions worldwide, Journal of Corporate Finance 18,
389–411.
Fahlenbrach, R., and R. M. Stulz, 2011, Bank CEO incentives and the credit crisis, Journal of
Financial Economics 99, 11–26.
Fama, E., and J. MacBeth, 1973, Risk, return, and equilibrium: Empirical tests, Journal of Political
Economy 81, 607–636.
Flannery, M. J., S. H. Kwan, and M. Nimalendran, 2004, Market evidence on the opaqueness of
banking firms’ assets, Journal of Financial Economics 71, 419–460.
Gompers, P. A., and A. Metrick, 2001, Institutional investors and equity prices, Quarterly Journal
of Economics 116, 229–259.
Gorton, G., and A. Metrick, 2012, Securitized banking and the run on repo, Journal of Financial
Economics 104, 425–451.
Ivashina, V., and D. Scharfstein, 2010, Bank lending during the financial crisis of 2008, Journal
of Financial Economics 97, 319–338.
Jegadeesh, N., J. Kim, S. D. Krische, and C. M. C. Lee, 2004, Analyzing the analysts: When do
recommendations add value? Journal of Finance 59, 1083–1124.
Johnson, S., 2011, Ship of knaves, Wall Street Journal, Online Economics Section, February 10.

27
Ke, B., and S. Ramalingegowda, 2005, Do institutional investors exploit the post-earnings
announcement drift? Journal of Accounting and Economics 39, 25-53.
Lakonishok, J., and I. Lee, 2001, Are insider trades informative? Review of Financial Studies 14,
79–111.
Longstaff, F., 2010, The subprime credit crisis and contagion in financial markets, Journal of
Financial Economics 97, 436–450.
Manconi, A., M. Massa, and A. Yasuda, 2011, The behavior of intoxicated investors: The role of
institutional investors in propagating the crisis of 2007–2008, forthcoming, Journal of
Financial Economics.
Newey, W. K., and K. D. West, 1987, A simple, positive semidefinite, heteroskedasticity and
autocorrelation consistent covariance matrix, Econometrica 55, 703–708.
Nofsinger, J., and R. Sias, 1999, Herding and feedback trading by institutional and individual
investors, Journal of Finance 54, 2263–2295.
Piotroski, J. D., and D. T. Roulstone, 2004, The influence of analysts, institutional investors, and
insiders on the incorporation of market, industry, and firm-specific information into stock
prices, The Accounting Review 79, 1119–1151.
Rozeff, M., and M. Zaman, 1988, Market efficiency and insider trading: Evidence from growth
and value portfolios, Journal of Finance 53, 701–716.
Womack, K., 1996, Do brokerage analysts’ recommendations have investment value? Journal of
Finance 51, 137–167.
Yan, X., and Z. Zhang, 2009, Institutional investors and equity returns: Are short-term institutions
better informed? Review of Financial Studies 22, 893–924.

28
Appendix. Data Sources and Variable Definitions
Our study combines data from several sources. We obtain data on quarterly institutional
holdings from the TFN 13F database. We obtain analyst recommendations from the I/B/E/S
database. Insider trading data are from the TFN Insider database. Book value of common equity
and common stock dividends are from COMPUSTAT. The SIC code, price, return, shares
outstanding, and volume information are from the CRSP monthly database.
Our sample includes only common stocks (CRSP share code 10 or 11) for the period from
January 2006 through December 2008. Following the definition from the SEC Emergency Order
of September 18, 2008, we identify financial firms as those with the following SIC codes: 6000,
6011, 6020–6022, 6025, 6030, 6035–6036, 6111, 6140, 6144, 6200, 6210–6211, 6231, 6282, 6305,
6310–6311, 6320–6321, 6324, 6330–6331, 6350–6351, 6360–6361, 6712, and 6719. The
variables used throughout the paper are as follows.
IO: Institutional ownership, fraction of shares outstanding held by institutional
investors, from the TFN 13F database and the CRSP.
ΔIO: Change in institutional ownership between two consecutive quarters.
REC: Consensus analyst recommendation of all analysts following a firm, based on the
most recent recommendation issued by an analyst in the prior 12 months, from the
I/B/E/S.
ΔREC: Change in consensus analyst recommendation between two consecutive months.
NIT: Ratio of net insider dollar purchases (dollar purchases minus dollar sales) over the
previous six months divided by the firm’s market capitalization, from the TFN
Insider database and the CRSP. We include only trades by the firm’s management
29
(role code = CEO, CFO, CO, CB, P, D, VP, and O) and exclude option-related
trades.
FIN: Indicator variable that takes a value of one if a firm is classified as a financial firm
based on the SEC Emergency Order of September 18, 2008.
SIZE: Market capitalization, calculated as share price times shares outstanding, from the
CRSP.
AGE: Firm age, the number of months since the first return appeared in the CRSP.
DP: Dividend yield, calculated as the ratio of common dividends divided by share price,
from Compustat and the CRSP. Winsorized at the 99th percentile.
BM: Book-to-market ratio, calculated using book value of equity for the fiscal year
ended in year t - 1, divided by market capitalization as of December 31 of year t -
1, from Compustat and the CRSP. Winsorized at the first and 99th percentiles.
PRC: End-of-month share price from the CRSP.
TURN: Average monthly share turnover (monthly share trading volume divided by total
shares outstanding) over the preceding three months, from the CRSP.
VOL: Return volatility, standard deviation of monthly returns over the previous 24
months, from the CRSP.
SP500: Indicator variable that equals one if a firm belongs to the S&P 500 Index, from the
CRSP.
RETt−3,t: Cumulative return over the past three months, from the CRSP.
RETt−12,t−3: Cumulative return between month t - 12 and month t - 3, from the CRSP.
RETt−30,t-6: Cumulative return between month t - 30 and month t - 6, from the CRSP.

30
Table 1 Descriptive Statistics This table presents the descriptive statistics for our full sample, as well as subsamples of financial and non-
financial firms, for the period from 2006 to 2008. We report the time-series means and standard deviations
of the cross-sectional average values for the following firm characteristics: share price (PRC), market
capitalization (SIZE), book-to-market ratio (BM), share turnover (TURN), return volatility (VOL), firm
age (AGE), prior three-month return (RETt−3,t), prior nine-month return (RETt−12,t−3), and dividend yield
(DP). Data sources and detailed variable definitions are described in the Appendix. Our sample includes
only common stocks (those with a share code of 10 or 11 in CRSP). Two firms with stock price above
$1,000 are excluded from the analysis. To identify financial firms, we follow the definition from the SEC
Emergency Order of September 18, 2008.
All Firms Financial Firms Non-Financial Firms
Mean Standard Deviation
Mean Standard Deviation
Mean Standard Deviation
PRC ($) 24.33 3.54 27.09 5.34 23.74 3.28
SIZE ($bil) 3.79 0.45 2.97 0.65 3.96 0.45
BM 0.63 0.16 0.78 0.27 0.59 0.14
TURN 0.19 0.02 0.10 0.03 0.21 0.02
VOL 0.11 0.01 0.07 0.02 0.12 0.01
AGE (months) 218.55 2.40 167.14 1.70 229.55 2.62
RETt-3,t -2.57% 12.55% -3.66% 7.76% -2.33% 13.71%
RETt-12,t-3 4.65% 12.14% -1.56% 12.95% 5.98% 12.28%
DP 1.22% 0.32% 2.31% 0.60% 0.99% 0.27%
31
Table 2 Institutional Ownership and Changes in Institutional Ownership This table presents the average quarterly institutional ownership (IO) and quarterly changes in institutional
ownership (ΔIO) for the period from 2006 to 2008. Panel A reports the average IO for financial and non-
financial firms, as well as the difference in average IO between financial and non-financial firms. Panel B
reports the average ΔIO for financial and non-financial firms, as well as the difference in average ΔIO
between financial and non-financial firms. The variable DiffCUM is the difference in average cumulative
ΔIO between financial and non-financial firms. Data sources and detailed variable definitions are described
in the Appendix. To identify financial firms, we follow the definition from the SEC Emergency Order of
September 18, 2008. We exclude two firms with share prices above $1,000 from the analysis. The variables
IO and ΔIO are expressed in percent. The numbers in parentheses are t-statistics for differences in means,
assuming equal variances.
Panel A. Institutional Ownership
Date FIN Non-FIN Difference (t-stat) Mar-06 36.44 59.75 -23.31 (-17.17) Jun-06 36.95 60.69 -23.75 (-17.58) Sep-06 37.52 61.62 -24.10 (-17.71) Dec-06 38.92 62.78 -23.86 (-17.27) Mar-07 38.84 63.41 -24.57 (-18.07) Jun-07 39.72 65.05 -25.32 (-18.34) Sep-07 40.99 66.47 -25.48 (-17.84) Dec-07 40.65 65.07 -24.42 (-17.64) Mar-08 39.55 64.20 -24.65 (-17.74) Jun-08 40.40 65.05 -24.64 (-17.73) Sep-08 40.12 64.60 -24.48 (-17.65) Dec-08 37.58 61.79 -24.21 (-17.47)
32
Panel B. Changes in Institutional Ownership
Date FIN Non-FIN Diff (t-stat) DiffCUM (t-stat)
Mar-06 1.13 1.58 -0.45 (-1.52) -0.45 (-1.52) Jun-06 0.41 0.85 -0.44 (-1.39) -0.88 (-2.12) Sep-06 0.69 1.20 -0.51 (-1.92) -1.48 (-3.04) Dec-06 1.43 1.66 -0.23 (-0.74) -1.65 (-3.09) Mar-07 0.13 0.75 -0.62 (-1.96) -2.34 (-4.02) Jun-07 1.04 1.99 -0.95 (-3.35) -3.38 (-5.41) Sep-07 1.86 1.71 0.15 (0.43) -3.03 (-4.38) Dec-07 -0.64 -1.65 1.01 (2.69) -2.10 (-3.00) Mar-08 -0.11 0.08 -0.18 (-0.59) -2.15 (-2.86) Jun-08 0.62 0.61 0.01 (0.02) -2.26 (-2.88) Sep-08 0.09 0.03 0.06 (0.20) -2.20 (-2.72) Dec-08 -2.00 -3.00 0.99 (2.41) -1.08 (-1.27)
33
Table 3 Institutional Ownership and Changes in Institutional Ownership: Subgroups of Institutions This table presents the average quarterly institutional ownership (IO) and quarterly changes in institutional ownership (ΔIO) for the period from
2006 to 2008 for the following subgroups of institutions: short-term institutions, hedge funds, and top-performing institutions. We define short-term
institutions as those whose past four-quarter turnover rate ranks in the top tercile. We identify hedge funds by using the CISDM hedge fund database.
We define top-performing institutions as those whose four-factor alpha (Carhart, 1997) estimated over the prior 36 months ranks in the top tercile.
Panel A reports the average IO for financial and non-financial firms, as well as the difference in average IO between financial and non-financial
firms. Panel B reports the average ΔIO for financial and non-financial firms, as well as the difference in average ΔIO between financial and non-
financial firms. The variable DiffCUM is the difference in average cumulative ΔIO between financial and non-financial firms. Data sources and
detailed variable definitions are described in the Appendix. To identify financial firms, we follow the definition from the SEC Emergency Order of
September 18, 2008. We exclude two firms with share prices above $1,000 from the analysis. The variables IO and ΔIO are expressed in percent.
The numbers in parentheses are t-statistics for differences in means, assuming equal variances.

34
Panel A. Institutional Ownership Short-Term Institutions Hedge Funds Top-Performing Institutions Date FIN NF Diff (t-stat) FIN NF Diff (t-stat) FIN NF Diff (t-stat) Mar-06 15.61 31.48 -15.87 (-18.46) 1.85 3.74 -1.89 (-10.42) 6.63 10.47 -3.84 (-9.49) Jun-06 15.89 32.05 -16.17 (-18.60) 1.98 3.86 -1.88 (-10.30) 7.70 12.32 -4.62 (-9.95) Sep-06 15.92 31.69 -15.77 (-18.35) 1.88 3.69 -1.82 (-10.15) 7.32 12.01 -4.69 (-10.28) Dec-06 14.85 30.07 -15.22 (-18.75) 1.94 3.59 -1.66 (-9.37) 7.96 14.29 -6.33 (-12.62) Mar-07 15.37 31.27 -15.91 (-18.94) 1.94 3.78 -1.85 (-9.84) 7.70 15.98 -8.27 (-15.17) Jun-07 16.62 34.05 -17.43 (-19.70) 2.03 3.89 -1.85 (-9.78) 6.89 14.67 -7.78 (-14.67) Sep-07 15.66 30.24 -14.58 (-18.35) 2.01 3.80 -1.79 (-9.75) 5.11 12.93 -7.81 (-16.39) Dec-07 15.76 30.61 -14.84 (-18.33) 1.98 3.94 -1.95 (-10.05) 5.22 13.26 -8.04 (-16.99) Mar-08 16.43 30.55 -14.12 (-17.50) 2.18 4.54 -2.36 (-11.49) 6.34 14.14 -7.81 (-15.81) Jun-08 17.53 33.41 -15.88 (-17.86) 2.10 4.51 -2.41 (-11.48) 6.41 13.65 -7.24 (-14.98) Sep-08 16.43 31.44 -15.02 (-18.04) 1.98 4.21 -2.23 (-10.77) 5.00 10.62 -5.62 (-13.47) Dec-08 13.81 26.99 -13.18 (-17.37) 2.17 4.63 -2.46 (-10.36) 3.74 7.95 -4.21 (-12.06)
Panel B. Changes in Institutional Ownership Short-Term Institutions Hedge Funds Top-Performing Institutions
Date FIN NF Diff (t-stat) Diffcum (t-stat) FIN NF Diff (t-stat) Diffcum (t-stat) FIN NF Diff (t-stat) Diffcum (t-stat) Mar-06 0.71 1.34 -0.63 (-2.43) -0.63 (-2.43) 0.20 0.36 -0.16 (-2.23) -0.16 (-2.23) -1.51 -0.71 -0.80 (-2.77) -0.80 (-2.77) Jun-06 0.23 0.46 -0.24 (-1.02) -0.84 (-2.67) 0.13 0.15 -0.01 (-0.20) -0.14 (-1.49) 1.01 1.88 -0.87 (-3.71) -1.67 (-5.10) Sep-06 -0.06 -0.44 0.38 (1.38) -0.52 (-1.36) -0.08 -0.13 0.05 (0.81) -0.08 (-0.77) -0.34 -0.31 -0.03 (-0.16) -1.70 (-5.17) Dec-06 -1.12 -1.37 0.25 (0.91) -0.31 (-0.73) 0.06 -0.07 0.13 (1.65) -0.01 (-0.07) 0.63 2.36 -1.73 (-7.25) -3.47 (-8.94) Mar-07 0.57 1.22 -0.64 (-2.50) -0.99 (-2.17) -0.01 0.17 -0.18 (-2.25) -0.17 (-1.25) -0.28 1.68 -1.96 (-8.54) -5.38 (-12.45) Jun-07 1.21 2.78 -1.57 (-5.87) -2.69 (-5.23) 0.10 0.19 -0.09 (-1.21) -0.22 (-1.54) -0.82 -1.35 0.53 (1.86) -4.77 (-10.52) Sep-07 -0.93 -3.91 2.98 (8.91) 0.45 (-0.83) -0.03 -0.03 0.00 (0.03) -0.20 (-1.25) -1.69 -1.79 0.10 (0.35) -4.53 (-9.89) Dec-07 0.06 0.42 -0.36 (-1.38) 0.02 (0.03) 0.00 0.17 -0.17 (-2.13) -0.35 (-2.19) 0.08 0.45 -0.36 (-1.45) -4.69 (-9.88) Mar-08 0.97 0.01 0.96 (3.31) 0.99 (1.69) 0.24 0.63 -0.40 (-4.34) -0.75 (-4.28) 1.26 0.91 0.35 (1.33) -4.22 (-8.80) Jun-08 0.90 2.85 -1.95 (-5.78) -0.99 (-1.63) -0.09 0.00 -0.09 (-0.99) -0.84 (-4.75) -0.16 -0.47 0.31 (1.24) -3.78 (-7.85) Sep-08 -0.92 -1.93 1.01 (3.26) -0.01 (-0.02) -0.09 -0.26 0.17 (2.39) -0.66 (-3.80) -1.45 -3.01 1.57 (5.82) -2.07 (-4.52) Dec-08 -2.45 -4.63 2.18 (7.06) 2.16 (3.62) 0.21 0.44 -0.22 (-2.13) -0.80 (-3.92) -1.08 -2.69 1.61 (6.38) -0.26 (-0.57)

35
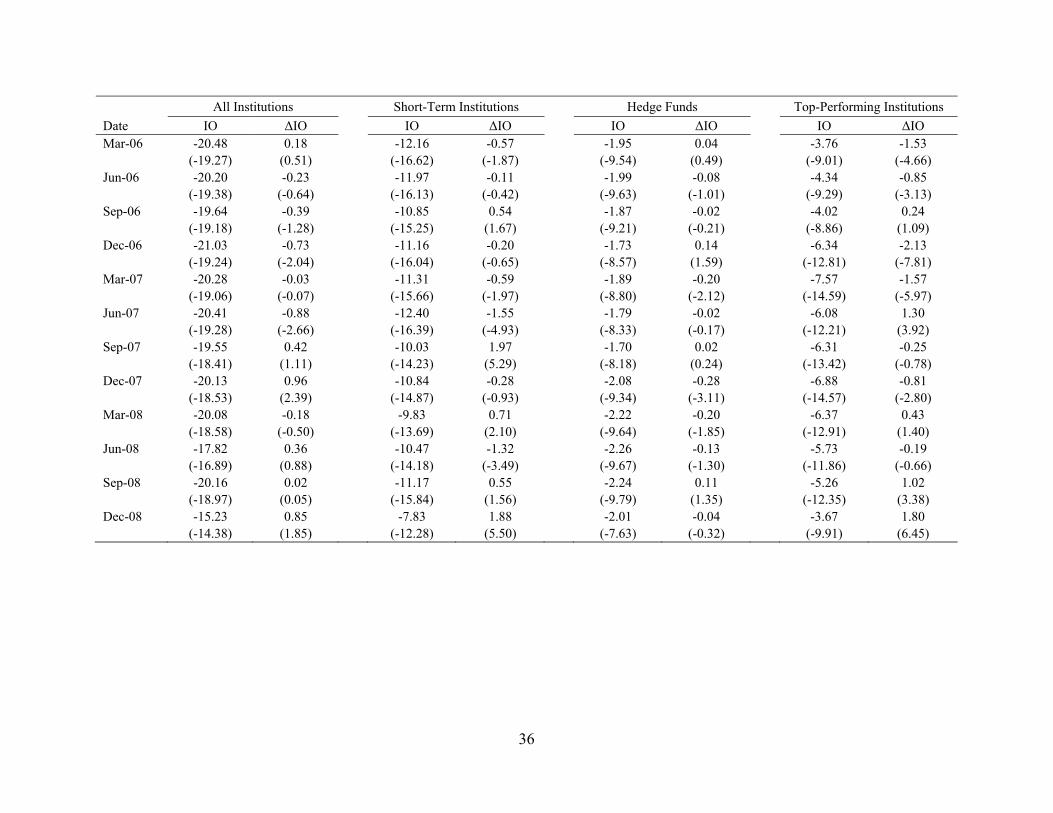
Table 4 Cross-Sectional Regressions of Institutional Ownership and Changes in Institutional Ownership This table presents the coefficient of the financial indicator variable from the following regression:
IOi,t or ΔIOi,t,t+1=β0+β1FINi,t+β2SIZEi,t+β3BMi,t+β4RETi,t-3,t+β5RETi,t-12,t-3+β6TURNi,t +β7VOLi,t+β8AGEi,t+β9PRCi,t+β10DPi,t+β11SP500i,t+ei,t
We estimate the above regression each quarter for all institutions and for the following subgroups of institutions: short-term institutions, hedge funds,
and top-performing institutions. The variable IO is quarterly institutional ownership, ΔIO is changes in quarterly institutional ownership, FIN is an
indicator variable for financial firms, SIZE is market capitalization, BM is the book-to-market ratio, RETt−3,t is the prior three-month return,
RETt−12,t−3 is the cumulative return between month t - 12 to month t - 3, TURN is share turnover, VOL is return volatility, AGE is firm age, DP is
dividend yield, PRC is share price, and SP500 is an indicator variable for S&P 500 membership. Data sources and detailed variable definitions are
described in the Appendix. All variables except IO, ΔIO, RETt-3,t ,RETt-12,t-3, FIN, and SP500 are expressed in natural logarithms. Our sample
includes only common stocks (those with a share code of 10 or 11 in CRSP). Two firms with stock prices above $1,000 are excluded from the
analysis. The coefficients of FIN are in percent. The numbers in parentheses are t-statistics.
36
All Institutions Short-Term Institutions Hedge Funds Top-Performing Institutions Date IO ΔIO IO ΔIO IO ΔIO IO ΔIO Mar-06 -20.48 0.18 -12.16 -0.57 -1.95 0.04 -3.76 -1.53 (-19.27) (0.51) (-16.62) (-1.87) (-9.54) (0.49) (-9.01) (-4.66) Jun-06 -20.20 -0.23 -11.97 -0.11 -1.99 -0.08 -4.34 -0.85 (-19.38) (-0.64) (-16.13) (-0.42) (-9.63) (-1.01) (-9.29) (-3.13) Sep-06 -19.64 -0.39 -10.85 0.54 -1.87 -0.02 -4.02 0.24 (-19.18) (-1.28) (-15.25) (1.67) (-9.21) (-0.21) (-8.86) (1.09) Dec-06 -21.03 -0.73 -11.16 -0.20 -1.73 0.14 -6.34 -2.13 (-19.24) (-2.04) (-16.04) (-0.65) (-8.57) (1.59) (-12.81) (-7.81) Mar-07 -20.28 -0.03 -11.31 -0.59 -1.89 -0.20 -7.57 -1.57 (-19.06) (-0.07) (-15.66) (-1.97) (-8.80) (-2.12) (-14.59) (-5.97) Jun-07 -20.41 -0.88 -12.40 -1.55 -1.79 -0.02 -6.08 1.30 (-19.28) (-2.66) (-16.39) (-4.93) (-8.33) (-0.17) (-12.21) (3.92) Sep-07 -19.55 0.42 -10.03 1.97 -1.70 0.02 -6.31 -0.25 (-18.41) (1.11) (-14.23) (5.29) (-8.18) (0.24) (-13.42) (-0.78) Dec-07 -20.13 0.96 -10.84 -0.28 -2.08 -0.28 -6.88 -0.81 (-18.53) (2.39) (-14.87) (-0.93) (-9.34) (-3.11) (-14.57) (-2.80) Mar-08 -20.08 -0.18 -9.83 0.71 -2.22 -0.20 -6.37 0.43 (-18.58) (-0.50) (-13.69) (2.10) (-9.64) (-1.85) (-12.91) (1.40) Jun-08 -17.82 0.36 -10.47 -1.32 -2.26 -0.13 -5.73 -0.19 (-16.89) (0.88) (-14.18) (-3.49) (-9.67) (-1.30) (-11.86) (-0.66) Sep-08 -20.16 0.02 -11.17 0.55 -2.24 0.11 -5.26 1.02 (-18.97) (0.05) (-15.84) (1.56) (-9.79) (1.35) (-12.35) (3.38) Dec-08 -15.23 0.85 -7.83 1.88 -2.01 -0.04 -3.67 1.80 (-14.38) (1.85) (-12.28) (5.50) (-7.63) (-0.32) (-9.91) (6.45)

37
Table 5 Analyst Recommendations This table presents the average consensus analyst recommendations (REC) and cross-sectional regressions
of analyst recommendations for the period from January 2006 to December 2008. Panel A reports the
average consensus analyst recommendations for financial and non-financial firms, as well as the difference
in average consensus analyst recommendations between financial and non-financial firms. The numbers in
parentheses are t-statistics for the differences in means, assuming equal variances. Panel B reports the
Fama–MacBeth (1973) coefficients from the following cross sectional regression:
RECi,t = β0 + β1FINi,t + β2SIZEi,t+ β3BMi,t + β4RETi,t-3,t + β5RETi,t-12,t-3 + ei,t
where FIN is an indicator variable for financial firms, SIZE is market capitalization, BM is the book-to-
market ratio, RETt−3,t is the prior three-month return, and RETt−12,t−3 is the cumulative return between month
t - 12 to month t - 3. Data sources and detailed variable definitions are described in the Appendix. The
variables BM and SIZE are expressed in natural logarithms. Our sample includes only common stocks
(those with a share code of 10 or 11 in CRSP). Two firms with stock prices above $1,000 are excluded
from the analysis. We report the average coefficients across all months from January 2006 to December
2008. The t-statistics are based on Fama and MacBeth (1973) with a Newey–West (1987) adjustment for
autocorrelation up to 12 lags.

38
Panel A. Average Analyst Recommendations Date FIN Non-FIN Diff (t-stat) Jan-06 3.37 3.64 -0.27 (-11.06)
Feb-06 3.38 3.63 -0.25 (-10.32) Mar-06 3.39 3.63 -0.24 (-9.69) Apr-06 3.39 3.62 -0.23 (-9.08) May-06 3.43 3.64 -0.21 (-8.34) Jun-06 3.46 3.67 -0.20 (-8.18) Jul-06 3.46 3.68 -0.22 (-9.05) Aug-06 3.43 3.67 -0.24 (-9.71) Sep-06 3.39 3.65 -0.26 (-10.56) Oct-06 3.32 3.60 -0.28 (-11.66) Nov-06 3.31 3.57 -0.25 (-10.49) Dec-06 3.31 3.56 -0.24 (-9.95) Jan-07 3.32 3.53 -0.21 (-8.46) Feb-07 3.34 3.53 -0.19 (-7.77) Mar-07 3.36 3.55 -0.20 (-8.06) Apr-07 3.35 3.54 -0.19 (-7.90) May-07 3.34 3.54 -0.20 (-8.44) Jun-07 3.34 3.54 -0.20 (-8.25) Jul-07 3.40 3.55 -0.15 (-6.18) Aug-07 3.41 3.59 -0.18 (-7.20) Sep-07 3.42 3.59 -0.17 (-6.93) Oct-07 3.42 3.60 -0.18 (-7.17) Nov-07 3.42 3.62 -0.20 (-8.17) Dec-07 3.38 3.63 -0.26 (-10.27) Jan-08 3.37 3.67 -0.30 (-12.20) Feb-08 3.32 3.66 -0.34 (-13.66) Mar-08 3.30 3.65 -0.34 (-13.92) Apr-08 3.29 3.63 -0.34 (-13.82) May-08 3.30 3.62 -0.31 (-12.67) Jun-08 3.32 3.61 -0.29 (-11.80) Jul-08 3.30 3.62 -0.32 (-12.97) Aug-08 3.27 3.60 -0.33 (-13.24) Sep-08 3.19 3.58 -0.39 (-16.23) Oct-08 3.26 3.59 -0.32 (-13.59) Nov-08 3.26 3.58 -0.33 (-13.42) Dec-08 3.26 3.55 -0.29 (-11.37)
Panel B. Regressions of Analyst Recommendations
Intercept FIN SIZE BM RETt-3,t RETt-12,t-3
4.19 -0.19 -0.02 -0.39 0.20 0.21 (54.00) (-11.39) (-5.91) (-8.01) (14.96) (7.92)

39
Table 6 Changes in Analyst Recommendations This table presents the average change in analyst recommendations (∆REC) and cross-sectional regressions
of changes in analyst recommendations for the period from January 2006 to December 2008. Panel A
reports the average ΔREC for financial and non-financial firms, as well as the difference in average ΔREC
between financial and non-financial firms. The variable DiffCUM is the difference in average cumulative
ΔREC between financial and non-financial firms. The numbers in parentheses are t-statistics for the
differences in means, assuming equal variances. Panel B reports Fama–Macbeth coefficients from the
following cross sectional regression:
ΔRECi,t,t+1 = β0 + β1FINi,t + β2SIZEi,t + β3BMi,t + β4RETi,t-3,t + β5RETi,t-12,t-3 + ei,t
where FIN is an indicator variable for financial firms, SIZE is market capitalization, BM is the book-to-
market ratio, RETt−3,t is the prior three-month return, and RETt−12,t−3 is the cumulative return between
month t - 12 and month t - 3. Data sources and detailed variable definitions are described in the Appendix.
The variables BM and SIZE are expressed in natural logarithms. Our sample includes only common stocks
(those with a share code of 10 or 11 in CRSP). Two firms with stock prices above $1,000 are excluded
from the analysis. We report the average coefficients across all months from January 2006 to December
2008. The t-statistics are based on Fama and MacBeth (1973) with a Newey–West (1987) adjustment for
autocorrelation up to 12 lags.

40
Panel A. Average Changes in Analyst Recommendations
Date FIN NF Diff (t-stat) Diffcum (t-stat)
Jan-06 -0.10 -0.08 -0.02 (-0.18) -0.02 (-0.18) Feb-06 0.02 0.00 0.02 (0.58) 0.00 (-0.03) Mar-06 0.00 -0.01 0.01 (0.44) 0.02 (0.30) Apr-06 0.00 -0.01 0.01 (0.51) 0.03 (0.69) May-06 0.06 0.03 0.03 (1.78) 0.07 (1.71) Jun-06 0.02 0.03 -0.01 (-0.60) 0.03 (0.87) Jul-06 -0.02 0.02 -0.03 (-2.19) 0.00 (0.01) Aug-06 -0.02 0.00 -0.02 (-1.38) -0.02 (-0.69) Sep-06 -0.03 -0.02 -0.02 (-1.84) -0.04 (-1.32) Oct-06 -0.10 -0.04 -0.06 (-4.97) -0.09 (-3.30) Nov-06 0.00 -0.02 0.02 (2.18) -0.06 (-2.23) Dec-06 -0.02 -0.01 0.00 (-0.46) -0.06 (-2.49) Jan-07 0.01 0.00 0.02 (1.91) -0.04 (-1.80) Feb-07 0.02 0.01 0.01 (1.53) -0.03 (-1.38) Mar-07 0.01 0.02 -0.01 (-1.04) -0.03 (-1.36) Apr-07 0.00 -0.01 0.01 (0.87) -0.03 (-1.26) May-07 0.00 0.00 0.00 (-0.04) -0.05 (-2.12) Jun-07 0.01 0.00 0.01 (1.16) -0.03 (-1.44) Jul-07 0.03 0.00 0.03 (2.76) -0.01 (-0.29) Aug-07 0.00 0.03 -0.03 (-3.14) -0.04 (-1.46) Sep-07 -0.01 0.00 0.00 (-0.62) -0.04 (-1.62) Oct-07 -0.04 -0.02 -0.02 (-2.11) -0.03 (-1.06) Nov-07 -0.01 0.01 -0.02 (-1.59) -0.04 (-1.40) Dec-07 -0.04 0.00 -0.04 (-5.07) -0.07 (-2.68) Jan-08 -0.02 0.01 -0.04 (-3.33) -0.09 (-3.34) Feb-08 -0.04 -0.01 -0.03 (-3.29) -0.12 (-4.60) Mar-08 -0.01 0.00 -0.01 (-0.81) -0.13 (-4.81) Apr-08 0.00 -0.02 0.02 (1.81) -0.11 (-4.07) May-08 0.00 -0.01 0.01 (0.84) -0.10 (-3.83) Jun-08 0.02 0.00 0.01 (1.89) -0.08 (-3.03) Jul-08 -0.02 0.00 -0.03 (-2.92) -0.12 (-4.36) Aug-08 -0.02 -0.01 -0.01 (-0.78) -0.11 (-4.04) Sep-08 -0.06 -0.01 -0.05 (-5.38) -0.17 (-6.22) Oct-08 0.06 0.01 0.05 (4.38) -0.12 (-4.64) Nov-08 0.00 -0.01 0.01 (1.31) -0.09 (-3.53) Dec-08 -0.02 -0.03 0.01 (0.76) -0.07 (-2.72)
Panel B. Regressions of Changes in Analyst Recommendations
Intercept FIN SIZE BM RETt-3,t RETt-12,t-3 -4.85 -0.29 0.22 -0.74 -0.46 0.52
(-3.56) (-0.82) (3.56) (-0.62) (-0.48) (1.05)

41
Table 7 Insider Trading
This table presents the average insider trading for the period from 2006 to 2008. We include only trades
by the firm’s management (TFN role code = CEO, CFO, CO, CB, P, D, VP and O) and exclude option-
related trades. The variable NIT is the ratio of net insider dollar purchases (dollar purchases minus dollar
sales) over the previous six months divided by the firm’s market capitalization. Data sources and detailed
variable definitions are described in the Appendix. This table reports the average NIT for financial and
non-financial firms, as well as the difference in average NIT between financial and non-financial firms. To
identify financial firms, we follow the definition from the SEC Emergency Order of September 18, 2008.
The numbers in parentheses are Student’s t-statistic for differences in means, assuming equal variances.
Date FIN Non-FIN Difference (t-stat) Jun-06 -0.04 -0.12 0.08 (2.05) Dec-06 -0.07 -0.10 0.04 (0.90) Jun-07 -0.03 -0.13 0.11 (2.86) Dec-07 0.06 -0.06 0.12 (4.10) Jun-08 0.05 -0.02 0.08 (2.99) Dec-08 0.04 -0.01 0.05 (1.43)
42
Table 8 Cross-Sectional Regressions of Insider Trading We estimate the following cross-sectional regression:
NITi,t-6,t = β0 + β1FIN i,t-6 + β2SIZEi,t-6+ β3BMi,t-6 + β4RETi,t-30,t-6 + ei,t
where NIT is the ratio of net insider dollar purchases (dollar purchases minus dollar sales) over the previous
six months divided by the firm’s market capitalization, FIN is an indicator variable for financial firms, SIZE
is market capitalization, BM is the book-to-market ratio, and RETt−30,t-6 is the cumulative return from month
t - 30 through month t - 6. Data sources and detailed variable definitions are described in the Appendix.
The variables BM and SIZE are expressed in natural logarithms. Our sample includes only common stocks
(those with a share code of 10 or 11 in CRSP). Two firms with stock prices above $1,000 are excluded
from the analysis. The numbers in parentheses are t-statistics.
Date Intercept FIN RETt-30,t-6 SIZE BM Adjusted R2
Jun-06 -0.38 0.09 -0.08 0.01 0.12 1.68%
(-2.53) (2.27) (-5.74) (1.67) (1.94)
Dec-06 -0.19 0.03 -0.03 0.00 0.05 0.15%
(-1.35) (0.84) (-2.37) (0.60) (0.83)
Jun-07 -0.28 0.09 -0.07 0.01 0.03 1.34%
(-2.09) (2.76) (-5.25) (1.23) (0.60)
Dec-07 0.05 0.10 -0.08 -0.01 0.10 2.60%
(0.44) (3.22) (-6.35) (-1.05) (1.90)
Jun-08 0.13 0.06 -0.05 -0.01 0.02 1.03%
(1.17) (2.28) (-3.77) (-1.45) (0.40)
Dec-08 0.43 0.02 -0.02 -0.02 0.09 0.93%
(2.99) (0.43) (-0.97) (-3.56) (1.62)