anticipating the future - john keells plc report 2015/16 3 contents financial highlights...
TRANSCRIPT


futureAnticipating the
At John Keells PLC, we believe that corporate agility, adaptability and resilience have driven our success for over 147 years. We have always embraced the challenges of change, transforming and growing through far-sighted strategies, ethical processes and innovative new products.
Today we look to the future with confidence, anticipating the growing value we can generate through our disruptive approach, proactive attitude and willingness to change.
We know we can achieve our goals in a competitive environment, as we grow through our challenges towards the future success we confidently anticipate today.

2 John Keells PlC
VisionTo be internationally recognised as the best Produce Broker in the world.
MissionTo retain the pre-eminent position as sri Lanka’s leading Tea and Rubber broker; To uphold the traditions and ethics of the Tea and Rubber trades; To ensure superior customer service through a dedicated and motivated workforce.
VaLuesWe are committed to the highest level of integrity and ethical conduct in all our business activities.We will look towards exceeding shareholder and customer expectations by achieving excellence in all areas of operations.We recognise the right of every individual to be treated with fairness, dignity and respect and assist our employees to improve their skills and reward their accomplishments.We will focus on corporate social responsibility and look to protect and safeguard the environment.
3Annual Report 2015/16
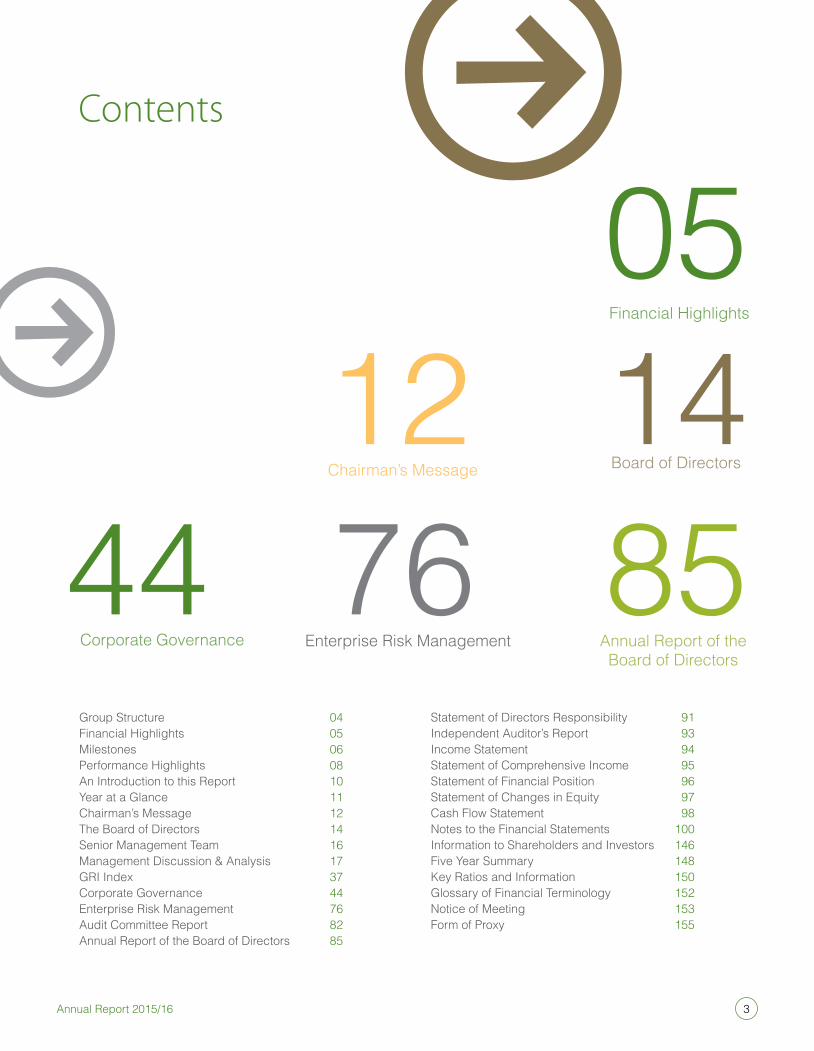
Contents
Financial Highlights
Chairman’s Message
Corporate Governance enterprise Risk Management
0512
44 76annual Report of the Board of Directors
85 Board of Directors14
Group structure 04 Financial Highlights 05Milestones 06Performance Highlights 08an introduction to this Report 10Year at a Glance 11Chairman’s Message 12The Board of Directors 14senior Management Team 16Management Discussion & analysis 17GRi index 37Corporate Governance 44enterprise Risk Management 76audit Committee Report 82annual Report of the Board of Directors 85
statement of Directors Responsibility 91independent auditor’s Report 93income statement 94statement of Comprehensive income 95statement of Financial Position 96statement of Changes in equity 97Cash Flow statement 98notes to the Financial statements 100information to shareholders and investors 146Five Year summary 148Key Ratios and information 150Glossary of Financial Terminology 152notice of Meeting 153Form of Proxy 155
4 John Keells PlC
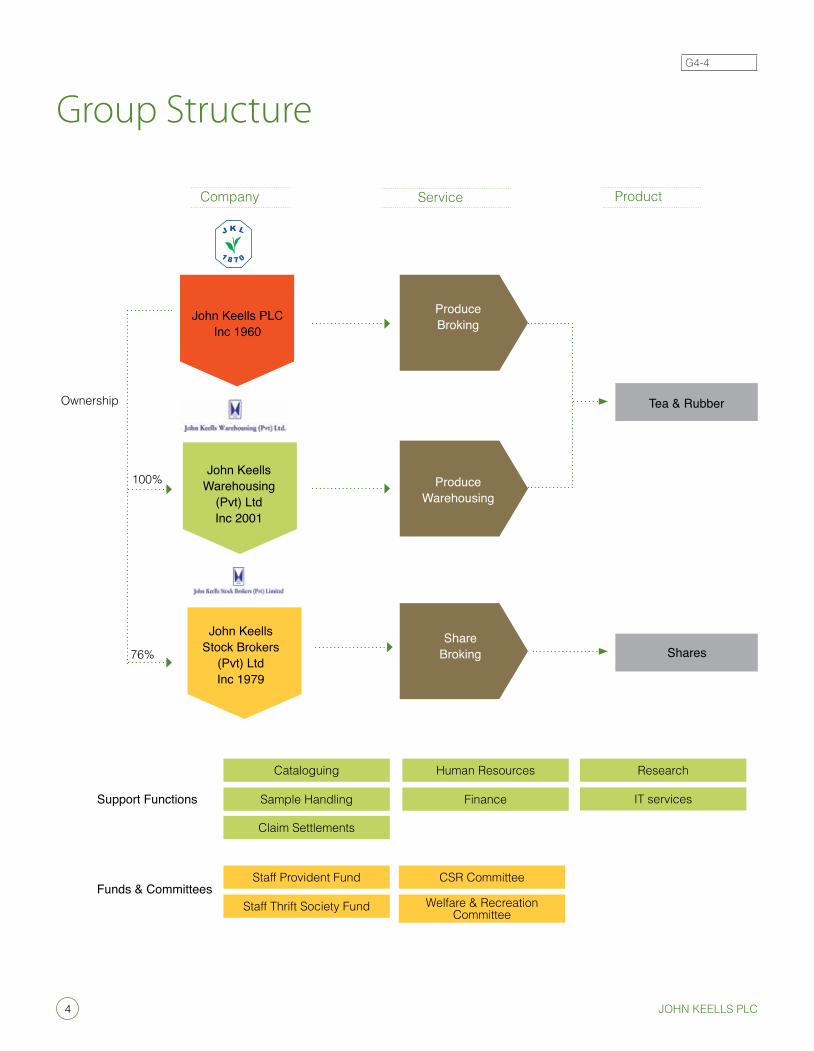
Group Structure
Company service Product
John Keells Stock Brokers
(Pvt) Ltd Inc 1979
John Keells Warehousing
(Pvt) LtdInc 2001
John Keells PLC Inc 1960
Produce Broking
Produce Warehousing
Share Broking
Tea & Rubber
Shares
Human Resources
Staff Provident Fund
Finance
Staff Thrift Society Fund
CSR Committee
Welfare & Recreation Committee
Claim Settlements
IT services
Research
Support Functions
Funds & Committees
ownership
100%
76%
Cataloguing
Sample Handling
G4-4
5Annual Report 2015/16
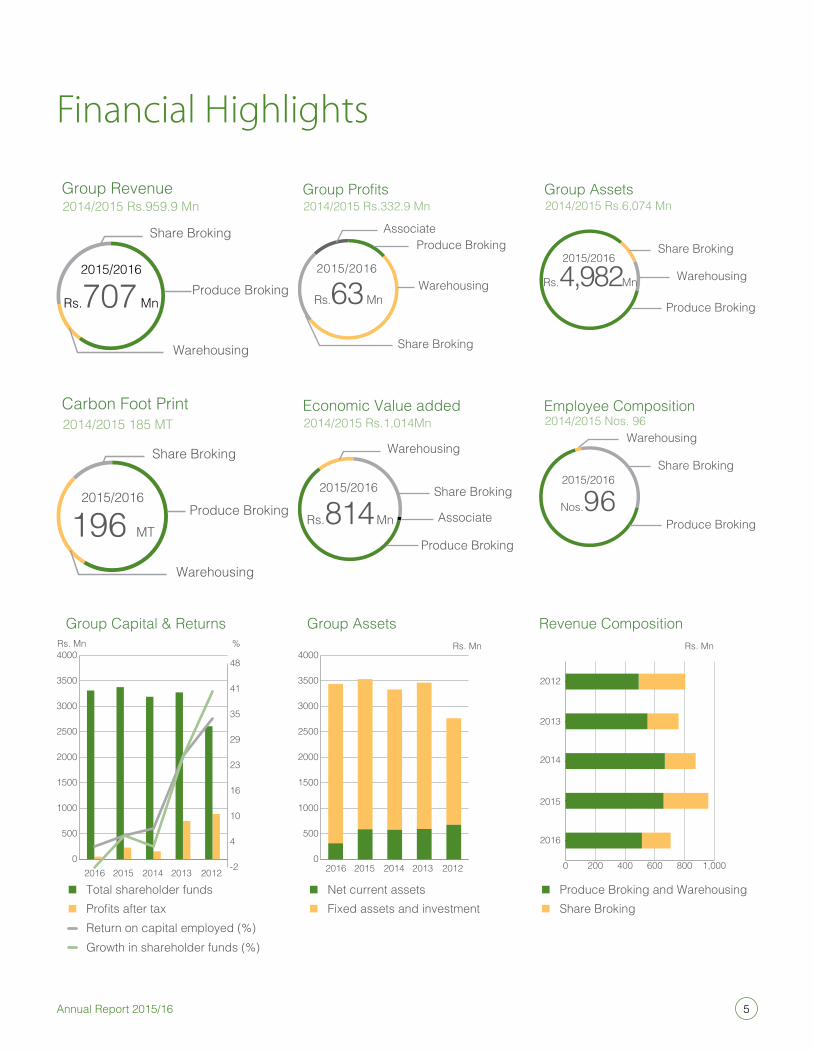
Financial Highlights
Carbon Foot Print
2015/2016
196 MT
Share Broking
Produce Broking
Warehousing
2014/2015 185 MTEconomic Value added
2015/2016
Rs.814 Mn
Warehousing
Share Broking
Associate
Produce Broking
2014/2015 Rs.1,014Mn
Group Assets
Net current assets
0
500
1000
1500
2000
2500
3000
3500
4000
2016 2015 2014 2013 2012
Rs. Mn
Fixed assets and investment
Group Assets
2015/2016
Rs.4,982Mn
Share Broking
Warehousing
Produce Broking
2014/2015 Rs.6,074 Mn
Group Capital & Returns
Total shareholder funds
0
500
1000
1500
2000
2500
3000
3500
4000
2016 2015 2014 2013 2012
Rs. Mn %
Profits after taxReturn on capital employed (%)Growth in shareholder funds (%)
-2
4
10
16
23
29
35
41
48
Revenue Composition
Produce Broking and Warehousing
0 200 400 600 800 1,000
2016
2015
2014
2013
2012
Rs. Mn
Share Broking
Group Profits
2015/2016
Rs.63 Mn
Share Broking
Produce Broking
Warehousing
Associate
2014/2015 Rs.332.9 MnGroup Revenue
2015/2016
Rs.707 Mn
Share Broking
2014/2015 Rs.959.9 Mn
Produce Broking
Warehousing
Employee Composition
2015/2016
Nos.96Share Broking
Warehousing
Produce Broking
2014/2015 Nos. 96
6 John Keells PlC
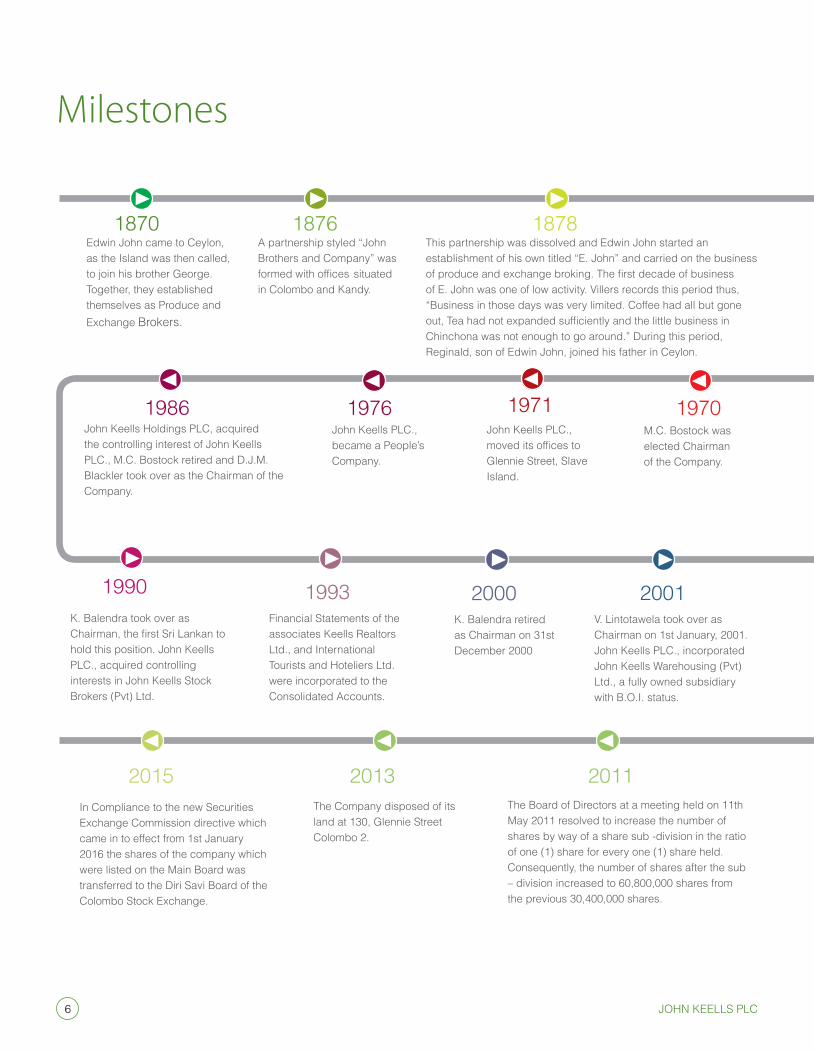
Milestones
1870edwin John came to Ceylon, as the island was then called, to join his brother George. Together, they established themselves as Produce and exchange Brokers.
1876a partnership styled “John Brothers and Company” was formed with offices situated in Colombo and Kandy.
This partnership was dissolved and edwin John started an establishment of his own titled “e. John” and carried on the business of produce and exchange broking. The first decade of business of e. John was one of low activity. Villers records this period thus, “Business in those days was very limited. Coffee had all but gone out, Tea had not expanded sufficiently and the little business in Chinchona was not enough to go around.” During this period, Reginald, son of edwin John, joined his father in Ceylon.
1878
1986John Keells Holdings PLC, acquired the controlling interest of John Keells PLC., M.C. Bostock retired and D.J.M. Blackler took over as the Chairman of the Company.
2011The Board of Directors at a meeting held on 11th May 2011 resolved to increase the number of shares by way of a share sub -division in the ratio of one (1) share for every one (1) share held. Consequently, the number of shares after the sub – division increased to 60,800,000 shares from the previous 30,400,000 shares.
2013The Company disposed of its land at 130, Glennie street Colombo 2.
2015in Compliance to the new securities exchange Commission directive which came in to effect from 1st January 2016 the shares of the company which were listed on the Main Board was transferred to the Diri savi Board of the Colombo stock exchange.
1971John Keells PLC., moved its offices to Glennie street, slave island.
1976John Keells PLC., became a People’s Company.
1993Financial statements of the associates Keells Realtors Ltd., and international Tourists and Hoteliers Ltd. were incorporated to the Consolidated accounts.
1990K. Balendra took over as Chairman, the first Sri Lankan to hold this position. John Keells PLC., acquired controlling interests in John Keells stock Brokers (Pvt) Ltd.
2000K. Balendra retired as Chairman on 31st December 2000
2001V. Lintotawela took over as Chairman on 1st January, 2001. John Keells PLC., incorporated John Keells Warehousing (Pvt) Ltd., a fully owned subsidiary with B.o.i. status.
1970M.C. Bostock was elected Chairman of the Company.
7Annual Report 2015/16
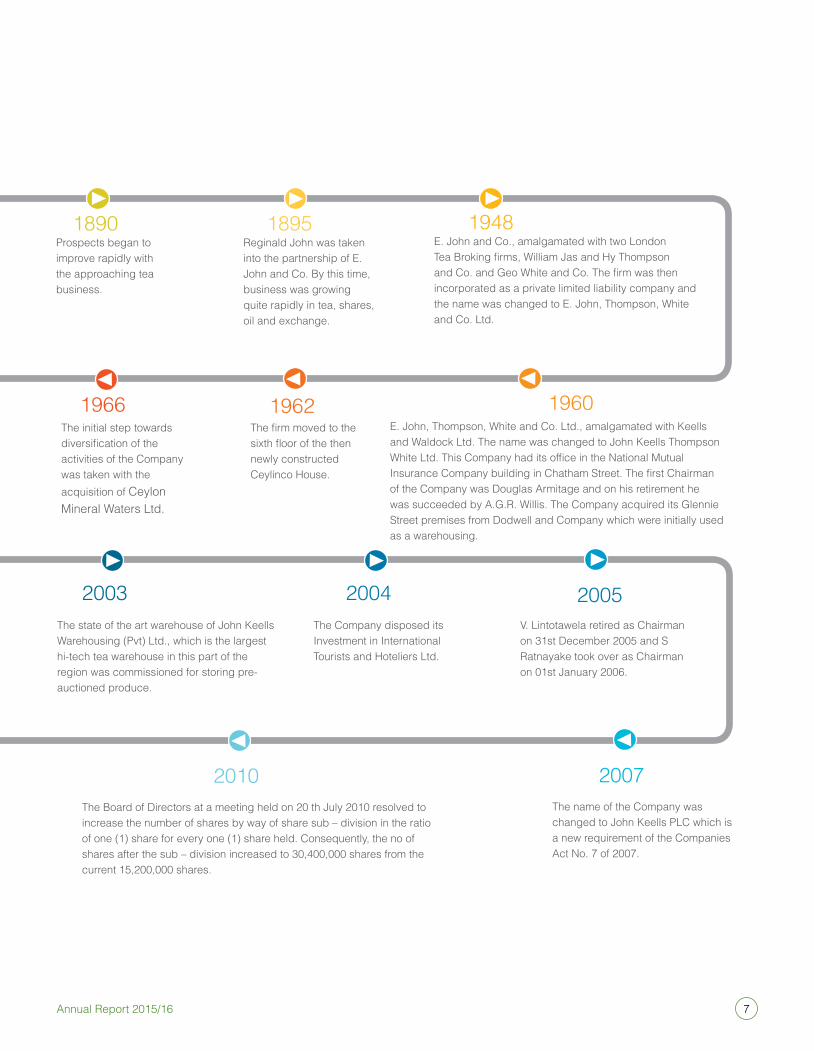
Prospects began to improve rapidly with the approaching tea business.
1890Reginald John was taken into the partnership of e. John and Co. By this time, business was growing quite rapidly in tea, shares, oil and exchange.
1895e. John and Co., amalgamated with two London Tea Broking firms, William Jas and Hy Thompson and Co. and Geo White and Co. The firm was then incorporated as a private limited liability company and the name was changed to e. John, Thompson, White and Co. Ltd.
1948
e. John, Thompson, White and Co. Ltd., amalgamated with Keells and Waldock Ltd. The name was changed to John Keells Thompson White Ltd. This Company had its office in the National Mutual Insurance Company building in Chatham Street. The first Chairman of the Company was Douglas armitage and on his retirement he was succeeded by a.G.R. Willis. The Company acquired its Glennie street premises from Dodwell and Company which were initially used as a warehousing.
1960
2003The state of the art warehouse of John Keells Warehousing (Pvt) Ltd., which is the largest hi-tech tea warehouse in this part of the region was commissioned for storing pre-auctioned produce.
2004The Company disposed its investment in international Tourists and Hoteliers Ltd.
2005V. Lintotawela retired as Chairman on 31st December 2005 and s Ratnayake took over as Chairman on 01st January 2006.
2010The Board of Directors at a meeting held on 20 th July 2010 resolved to increase the number of shares by way of share sub – division in the ratio of one (1) share for every one (1) share held. Consequently, the no of shares after the sub – division increased to 30,400,000 shares from the current 15,200,000 shares.
1962
The name of the Company was changed to John Keells PLC which is a new requirement of the Companies act no. 7 of 2007.
2007
1966The firm moved to the sixth floor of the then newly constructed Ceylinco House.
The initial step towards diversification of the activities of the Company was taken with the acquisition of Ceylon Mineral Waters Ltd.
8 John Keells PlC
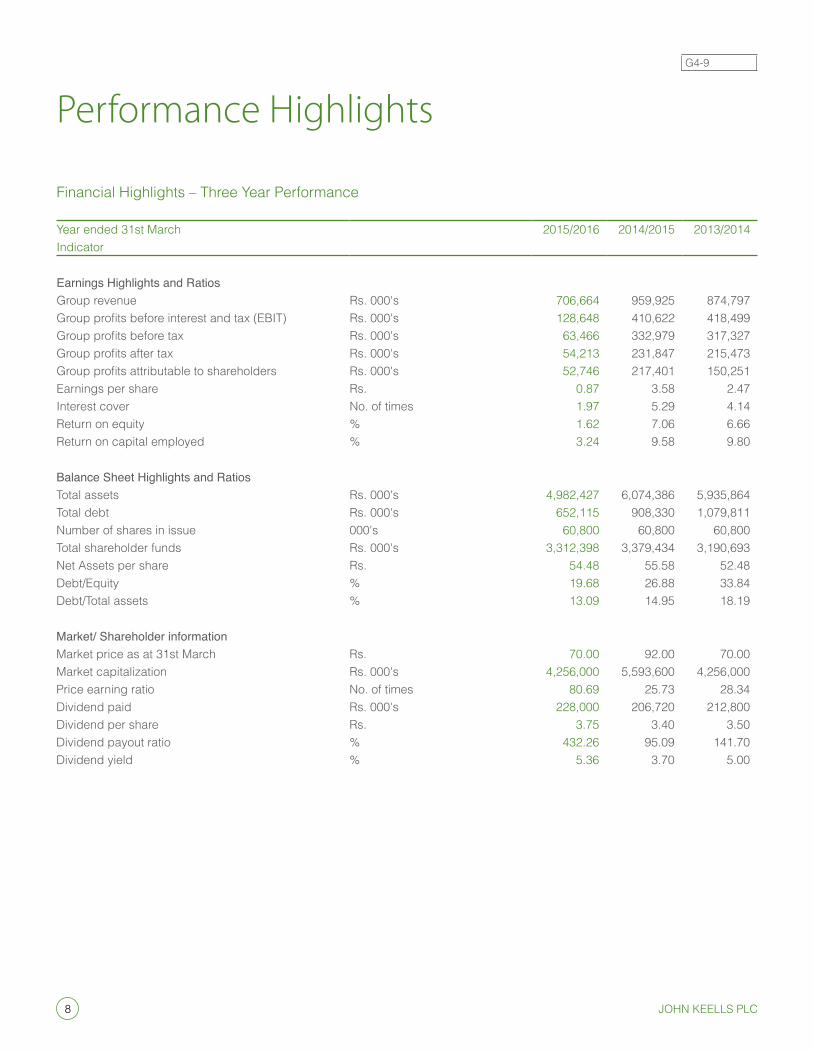
Performance Highlights
Financial Highlights – Three Year Performance
Year ended 31st March 2015/2016 2014/2015 2013/2014indicator
Earnings Highlights and RatiosGroup revenue Rs. 000's 706,664 959,925 874,797 Group profits before interest and tax (EBIT) Rs. 000's 128,648 410,622 418,499 Group profits before tax Rs. 000's 63,466 332,979 317,327 Group profits after tax Rs. 000's 54,213 231,847 215,473 Group profits attributable to shareholders Rs. 000's 52,746 217,401 150,251 earnings per share Rs. 0.87 3.58 2.47 interest cover no. of times 1.97 5.29 4.14 Return on equity % 1.62 7.06 6.66Return on capital employed % 3.24 9.58 9.80
Balance Sheet Highlights and RatiosTotal assets Rs. 000's 4,982,427 6,074,386 5,935,864 Total debt Rs. 000's 652,115 908,330 1,079,811 number of shares in issue 000's 60,800 60,800 60,800 Total shareholder funds Rs. 000's 3,312,398 3,379,434 3,190,693 net assets per share Rs. 54.48 55.58 52.48 Debt/equity % 19.68 26.88 33.84Debt/Total assets % 13.09 14.95 18.19
Market/ Shareholder informationMarket price as at 31st March Rs. 70.00 92.00 70.00 Market capitalization Rs. 000's 4,256,000 5,593,600 4,256,000 Price earning ratio no. of times 80.69 25.73 28.34 Dividend paid Rs. 000's 228,000 206,720 212,800 Dividend per share Rs. 3.75 3.40 3.50Dividend payout ratio % 432.26 95.09 141.70Dividend yield % 5.36 3.70 5.00
G4-9
9Annual Report 2015/16
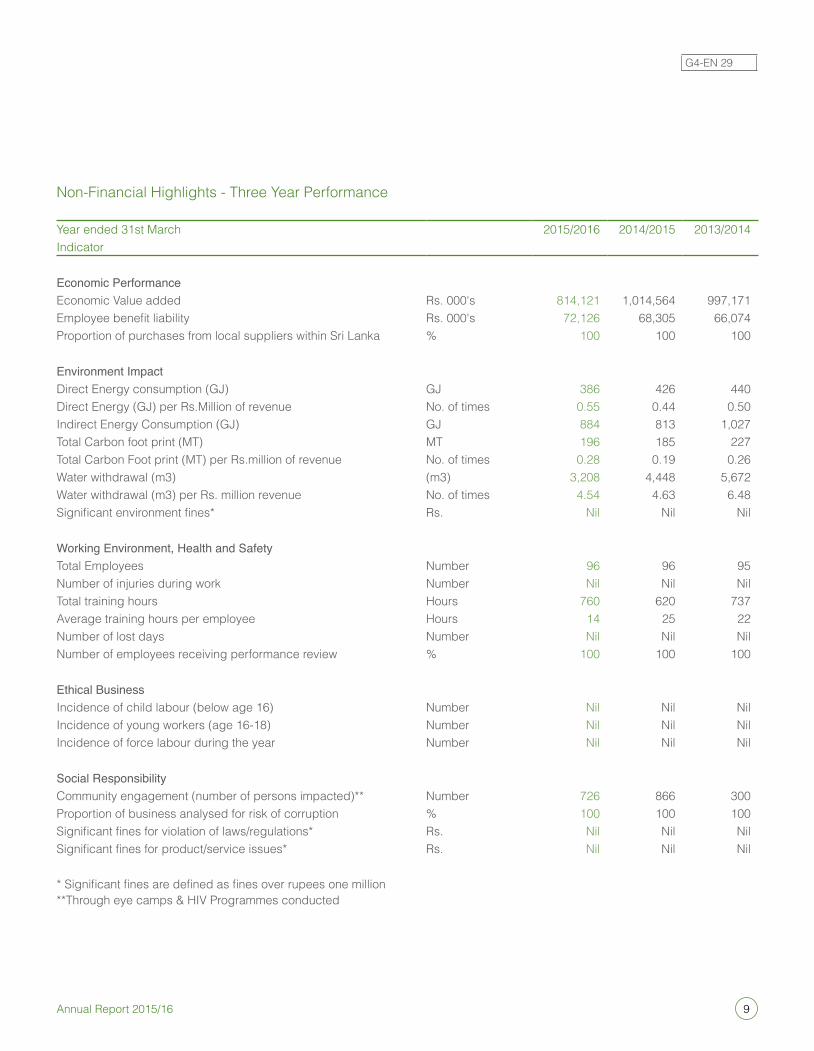
non-Financial Highlights - Three Year Performance
Year ended 31st March 2015/2016 2014/2015 2013/2014indicator
Economic Performanceeconomic Value added Rs. 000's 814,121 1,014,564 997,171 Employee benefit liability Rs. 000's 72,126 68,305 66,074 Proportion of purchases from local suppliers within sri Lanka % 100 100 100
Environment Impact Direct energy consumption (GJ) GJ 386 426 440 Direct energy (GJ) per Rs.Million of revenue no. of times 0.55 0.44 0.50 indirect energy Consumption (GJ) GJ 884 813 1,027 Total Carbon foot print (MT) MT 196 185 227 Total Carbon Foot print (MT) per Rs.million of revenue no. of times 0.28 0.19 0.26 Water withdrawal (m3) (m3) 3,208 4,448 5,672 Water withdrawal (m3) per Rs. million revenue no. of times 4.54 4.63 6.48 Significant environment fines* Rs. nil nil nil
Working Environment, Health and SafetyTotal employees number 96 96 95number of injuries during work number nil nil nilTotal training hours Hours 760 620 737 average training hours per employee Hours 14 25 22 number of lost days number nil nil nilnumber of employees receiving performance review % 100 100 100
Ethical Businessincidence of child labour (below age 16) number nil nil nilincidence of young workers (age 16-18) number nil nil nilincidence of force labour during the year number nil nil nil
Social ResponsibilityCommunity engagement (number of persons impacted)** number 726 866 300Proportion of business analysed for risk of corruption % 100 100 100Significant fines for violation of laws/regulations* Rs. nil nil nilSignificant fines for product/service issues* Rs. nil nil nil
* Significant fines are defined as fines over rupees one million **Through eye camps & HIV Programmes conducted
G4-en 29
10 John Keells PlC
An Introduction to this Report
We are pleased to present our second integrated annual Report to our stakeholders. This report covers the activities and operation of John Keells PLC., John Keells Warehousing (Pvt) Ltd., and John Keells stock Brokers (Pvt) Ltd., (herein referred to as “Group”) for the period 1st april 2015 to 31st March 2016. Further this report will describe and quantify how we create financial and nonfinancial value to our stakeholders to provide a longer-term view of the business.
This integrated annual report is broadly in line with the “Preparer’s Guide to integrated Corporate Reporting”. The corporate governance aspects in this report are based on the Code of Best Practice on Corporate Governance issued jointly by the institute of Chartered accountants of sri Lanka and the securities and exchange Commission of sri Lanka. Further the Group has voluntarily adopted GRi G4 guidelines to report sustainability information.
Being focused on transparency and accountability, we confirm that the statutory/obligations in the report is in compliance with the laws and regulation of Chartered accounting of sri Lanka, the Companies act no. 7 of the 2007 and Listing Rules of the Colombo stock exchange (Cse).
Financial statements in this report have been prepared on an accrual basis and under the historical cost convention, unless otherwise specifically stated with detailed discussions where applicable. in order to ensure faithful representation, materiality, relevance, accuracy and reliability this report has been audited by Messrs. ernst & Young whose
independent auditor’s Report to the shareholders of the Group is given on page 93.
in our effort to reduce the carbon footprint of our Group, we have created this report in the form of a CD-Rom and made it available to all shareholders. This report is also available online at www.johnkeellstea.com. in addition, we have taken measures to post or deliver a printed copy to any shareholder upon request.
any feedback or inquiries regarding the content of this report can be directed to:
Financial ControllerJohn Keells PLCno.186 Vauxhall streetColombo 2.e-mail: [email protected]
G4-3, G4-17, G4-18, G4-28

11Annual Report 2015/16
Year at a Glance
Year at a glance with operating highlights and significant events• Galpaditenne Tea Factory sold 3.8
million kilograms (Jan–Dec.2015) which is the highest quantity sold by a single tea factory.
• Avissawella Tea Factory secured the best average prices in the sabaragamuwa province. The average of Rs.502.99 was Rs.87.04 above the low grown net sale average for 2015.
• Berubela Tea Factory was able to achieve a significant improvement in the quality of the tea produced during the year. They were able to secure a rank of 25 for the year ended 2015 in the Low Grown Category.
• Nawalakanda Tea Factory, a 100% mark sold by John Keells PLC, had manufactured 2.0million kilograms for the year (Jan - Dec 2015). The factory also managed to achieve 79 top prices during the year.
• Ceciliyan Tea Factory sold 3.4 million kilograms for the year 2015 which is the third largest volume manufactured by a single tea factory.
• Mr. S M Munasinghe the CEO of John Keells PLC resigned during the year and Mr. H G R De Mel was appointed as acting Ceo of John Keells PLC.
• Bogoda Tea Factory achieved a commendable sale average of Rs.448.18 attaining a rank of 54 for the year 2015 compared to the rank of 122 in 2014 in the Low Grown Category.
• Kiruwanagala Estate secured the highest average in the RPC category all island, with an average of Rs.473.13 which was Rs.57.18 above the Low Grown net sale average price.
• Hingalgoda Estate was able to achieve the best average price of Rs.446.71 which was Rs.70.39 above the net sale average for the CTC Low Grown Category. The estate also obtained 93 top prices during the year.
• Watawala Plantations PLC recorded the highest quantity sold amongst all regional plantation companies.Quantity sold was 9.6 million kilograms for the year. (Jan- Dec 2015).
• Talawakelle Tea Estates PLC was ranked first in all elevations amongst all Regional Plantation Companies (RPC) with an average price of Rs.459.84 (quantity sold 7,117,144 kilograms).
• Conducted eye camps in Nayabedde Tea estate and Derangala Hills Factory with a total of 621 patients being screened, donated spectacles and directed patients to cataract operations.
• Delta Estate achieved the first position in the CTC Medium Grown Category.
• Rothschild Estate recorded the highest quantity by a single tea factory amongst the RPC factories from all elevations for the year 2015 with a sold quantity of 1,602,746 kilograms.
• In order to ensure transparency and accuracy on granting advances and Loans to Clients, John Keells PLC successfully implemented an automated Tea advance system.
• John Keells PLC was lauded with a Bronze award in the “Diversified Holdings (Groups up to 5 subsidiaries)” category at the 51st annual Report award competition conducted by the institute of Chartered accountants of sri Lanka.
• John Keells Warehousing was recertified for compliance of Health & safety assessment series (oHsas) and certification of ISO 22000:2005 Food and safety Management systems during the year.
• John Keells Stock Brokers received the “Best stockbroking Research Team” award at the Chartered Financial analyst sri Lanka Capital Market awards 2015.
• Mattakelle Estates was able to secure the number one position in the Western High Grown elevation with an average price of Rs.516.20 for the seventh consecutive year.
• Pedro Estate achieved 154 top prices for nuwara eliya Teas during the year.
• Kenilworth Estate achieved 100 top prices, and was ranked second in the Western Medium Grown elevation.
• Dunsinane Estate achieved 49 top prices for CTC High Grown Category during the year.
• Nuwara Eliya Estate achieved 64 top prices in the category of Western High Grown Teas.
• Carolina Estate achieved the second position in the CTC Medium Grown Category.
• The Group conducted a series of awareness sessions to all staff categories on “Working against Violence through education” (WaVe). expanding the Code of conduct and the Group nondiscrimination policy to cover Gender identity.
12 John Keells PlC
Chairman’s Message
Going forward the focus will be on reaping the full potential of the
technology platform developed in the
prior financial year and emphasis
placed on improving efficiency of its
processes.
i am pleased to present to you the integrated annual Report and Financial statements for the year ended 31st March 2016 of your Company in what has been a challenging year for the entire industry in terms of market conditions.
Your Company remained resilient during the year, undertaking many initiatives to improve its operations and efficiencies. underpinned by our emphasis on quality, during the year, we initiated widespread efforts to rally our growers and encourage them to improve the quality of their output in order to be able to command a premium price at the auctions. internally, we simplified our cost structures to become leaner whilst we also implemented process improvements and rationalized our warehousing operations to improve capacity utilization for the future.
Macro-economic overview in 2015, sri Lanka’s economy expanded by 4.8 per cent, a marginal drop from the 4.9 per cent recorded in 2014. although the agriculture sector expanded by 5.5 per cent for the year, both the Tea and Rubber sectors contracted by 2.7 per cent and 10.1 per cent respectively in 2015.
The improvement in the us economy resulted in short-term capital outflows from emerging markets, particularly in the latter part of the year. This affected the performance of the Colombo stock Exchange, which saw a net outflow of foreign capital in 2015 together with a noticeably lower level of foreign participants in the market. Meanwhile, the Rupee, which remained broadly stable during the first eight months of the year, depreciated at a faster pace from early september 2015 following the Central
Bank of sri Lanka’s decision to allow greater flexibility in the determination of the exchange rate.
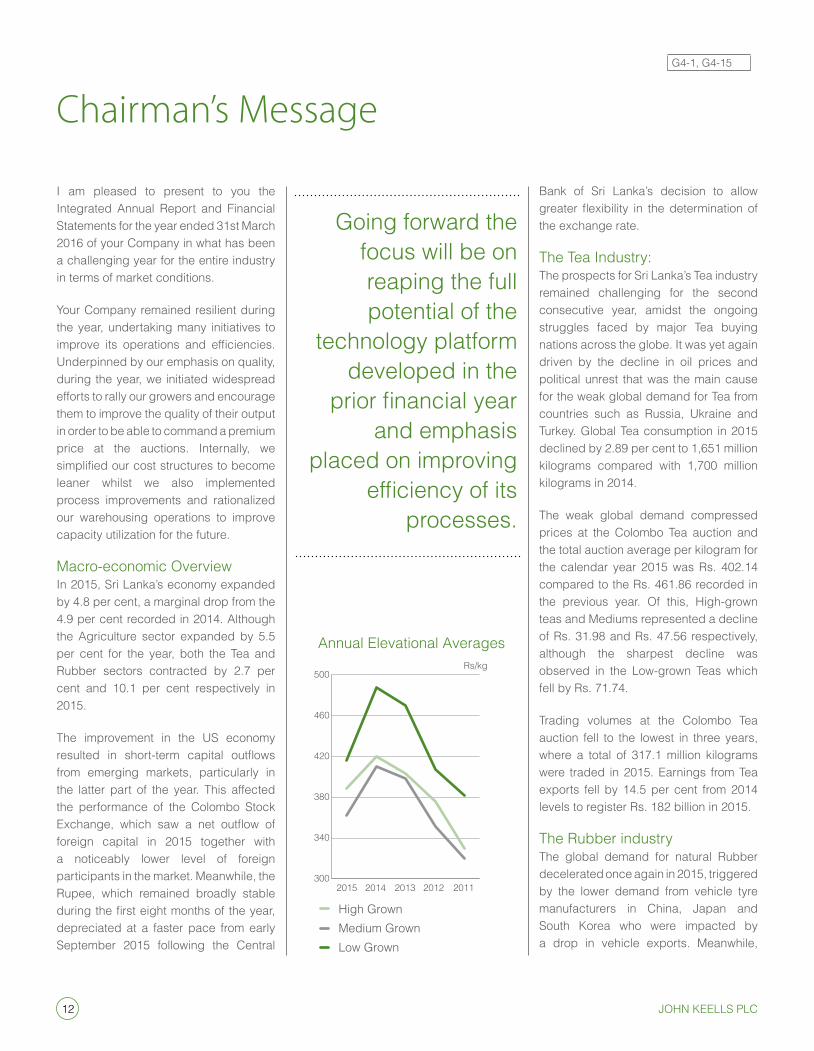
The Tea industry: The prospects for sri Lanka’s Tea industry remained challenging for the second consecutive year, amidst the ongoing struggles faced by major Tea buying nations across the globe. it was yet again driven by the decline in oil prices and political unrest that was the main cause for the weak global demand for Tea from countries such as Russia, ukraine and Turkey. Global Tea consumption in 2015 declined by 2.89 per cent to 1,651 million kilograms compared with 1,700 million kilograms in 2014.
The weak global demand compressed prices at the Colombo Tea auction and the total auction average per kilogram for the calendar year 2015 was Rs. 402.14 compared to the Rs. 461.86 recorded in the previous year. of this, High-grown teas and Mediums represented a decline of Rs. 31.98 and Rs. 47.56 respectively, although the sharpest decline was observed in the Low-grown Teas which fell by Rs. 71.74.
Trading volumes at the Colombo Tea auction fell to the lowest in three years, where a total of 317.1 million kilograms were traded in 2015. earnings from Tea exports fell by 14.5 per cent from 2014 levels to register Rs. 182 billion in 2015.
The Rubber industry The global demand for natural Rubber decelerated once again in 2015, triggered by the lower demand from vehicle tyre manufacturers in China, Japan and south Korea who were impacted by a drop in vehicle exports. Meanwhile,
Annual Elevational Averages
High Grown
300
340
380
420
460
500
2015 2014 2013 2012 2011
Rs/kg
Medium GrownLow Grown
G4-1, G4-15
13Annual Report 2015/16
increased production from other Rubber producing countries such as Thailand and Vietnam created oversupply in the market resulting in a buildup of stockpiles in the market.
Resultantly, the price of all types of Rubber declined steadily throughout 2015 with the average price per kilogram of Rss at the Colombo auctions being Rs. 247.74 compared with Rs. 258.81 at the end of 2014, while Crepe prices fell to Rs. 301.67 from Rs. 309.79.
sri Lanka’s Rubber exports for 2015 declined by 5,900 metric tons compared to the previous year, with the volume of sheet Rubber and Latex Crepe being the lowest seen for the past 10 years. Consequently, earnings from exports fell by 36 per cent for the twelve months ending 31st December 2015.
stock BrokingThe all share index (asPi) fell by 12.2 per cent while the s&P sL20 index fell by 17.8 per cent during the financial year. average daily turnover volumes declined by 35 per cent to Rs.962 million compared to the previous financial year. Market conditions were challenging throughout the year with the reduced activity concentrated among the leading brokerage firms.Net foreign outflows were Rs.9.3 billion for the financial year, which was a reversal from the net foreign inflows seen in FY 2014/15, as a consequence of economic and currency weakness in China as well as the anticipation of the us Federal Reserve tightening rates which eventually happened in December 2015.
During the year, the Central Bank of sri Lanka commenced a process of
monetary tightening, raising the statutory Reserve Ratio (sRR) by 1.5 per cent to 7.5 per cent in December 2015 and the benchmark interest rates by 50 basis points to 8 per cent in February 2016. Despite the higher interest rates, activity on the Colombo stock exchange was driven by local investors, primarily High net worth individuals and institutional clients, as valuations of certain counters were attractive.
Performance summary Consolidated revenue, for the financial year ended 31st March 2016, from Tea and Rubber Broking, Warehousing and stock Broking activities declined by 26 per cent to Rs. 707 million as against Rs. 960 million recorded in the previous year. Profit after tax (PAT) was Rs. 54 million, 77 per cent lower than the PaT recorded in the previous financial year.
Future outlook The demand for tea is expected to remain subdued in the short term against the backdrop of the uncertain political environment in Russia and ukraine, turmoil in the Middle eastern markets and significant currency depreciation in key tea importing countries. However, the lifting of sanctions on iran is expected to augur well for Ceylon Tea and the Group expects an uptick in the demand for low grown tea in the near term.
Your Company will focus on reaping the full potential of the technology platform developed in the prior financial year and also place emphasis on improving efficiency of its processes.
appreciations i wish to thank each and every member of the JKPLC team as well as our
stakeholders, for their loyalty and commitment that has been vital during these challenging times.
Ms Y a. Hansen comes up for re-election in terms of section 83 of the articles of association. Having served the Board for nine years, she has informed us that she would not be seeking re-election. in a similar vein, Mr. T De Zoysa and Ms s T Ratwatte, having served the Board for more than nine years from the date of first appointment, have also informed us that they would be resigning after the annual General Meeting of the Company. i would like to place on record our sincere appreciation to all of them for the valuable contribution made during their tenure and wish them all the best in their future endeavors. i also take this opportunity to welcome Mr V a a Perera to the Board of Directors and thank my colleagues on the Board for their guidance and support.
.
S C RatnayakeChairman
27th May 2016

14 John Keells PlC
The Board of Directors
susantha RatnayakeNon Independent Non Executive Chairmansusantha Ratnayake was appointed as the Chairman and Ceo of John Keells Holdings PLC (JKH) in January 2006 and has served on the JKH Board since 1992/1993 and has 38 years of management experience, all of which is within the John Keells Group. a past Chairman of the sri Lanka Tea Board and Ceylon Chamber of Commerce, he is also the Chairman of employers’ Federation of Ceylon.
ajit GunewardeneNon-Independent Non-Executive Directorajit Gunewardene is the Deputy Chairman of John Keells Holdings PLC and has been a member of the Board for over 21 years. He is a Director of several companies in the John Keells Group and is the Chairman of union assurance PLC. He is a member of the Board of sLinTeC, a company established for the development of nanotechnology in sri Lanka under the auspices of the Ministry of science and Technology. He is also a member of the Tourism advisory Committee appointed by the Minister of Tourism Development, a member of the advisory committee for investment Promotion appointed by the Minister of Development strategy and international Trade and a member of the steering Committee for establishment of the national science Centre in sri Lanka appointed by the Minister of science, Technology and Research. He has also served as the Chairman of the Colombo stock exchange and nations Trust Bank PLC. ajit has a Degree in economics and brings over 33 years of management experience.
Ronnie PeirisNon-Independent Non-Executive Directorappointed to the John Keells Holdings PLC Board during 2002/03, Ronnie, as Group Finance Director, has overall responsibility for the Group’s Finance and accounting, Taxation, Corporate Finance, Treasury, and the information Technology functions. He is also a Director of several companies in the John Keells Group. He was previously the Managing Director of anglo american Corporation (Central africa) Limited in Zambia.
He has over 40 years of finance and general management experience in sri Lanka and abroad. He is a Fellow of the Chartered institute of Management accountants, uK, association of Chartered Certified Accountants, UK, and the Society of Certified Management accountants, sri Lanka and holds an MBa from the university of Cape Town, south africa. Previously, the Chairman of the sri Lanka institute of Directors, he is currently a member of the Committee of the Ceylon Chamber of Commerce.
sanjeeva FernandoNon-Independent Executive Directorsanjeeva Fernando is responsible for the iT industry group and the Plantation services sector. He possesses over 28 years of senior managerial experience in diverse businesses and capacities. He joined the John Keells Group in 1993 and has headed the Group’s Printing and Packaging businesses, Bunkering businesses and has served as Head of the Transportation and Logistics sector overseeing the Group’s airline, travel, freight forwarding, shipping and bunkering businesses in sri Lanka, india and the Maldives. sanjeeva was also
given the responsibility of setting up and developing the Group’s iT enabled services business (BPo) in Gurgaon, india and resided in india from 2007 until 2012 whilst overlooking the rest of the iT businesses in the Group. He is a Director of John Keells PLC and Tea smallholder Factories PLC. a printer by profession, Sanjeeva qualified from the London school of Printing and is a member of the London institute of Printing.
anil PereraNon-Independent Non-Executive Directoranil Perera has over 37 years’ experience in the Tea industry having started his career at the Janatha estates Development Board. He has served in the Plantation Regions of Hatton, avissawella, Kegalle and nawalapitiya. He has held the positions of operations Director - namunukula Plantations, Deputy Chairman – Colombo Tea Traders’ association, Chairman – sri Lanka Tea Factory owners association and Governor – national institute of Plantation Management. Currently he is also the Chief Executive Officer of Tea smallholder Factories PLC and is a Director of the sri Lanka Tea Board.
Yolande HansenIndependent Non Executive DirectorYolande Hansen was appointed as an independent non executive Director to the Board of John Keells PLC, in July 2005. she joined John Keells Group (Walkers Tours) in June 1972, as one of the pioneers in tourism, and worked for 16 years for the Group. she is presently the Ceo and Proprietor of Columbus Tours Pvt Ltd., and has been for the past 25 years.
15Annual Report 2015/16
sharmini RatwatteIndependent Non Executive Directorsharmini Ratwatte was appointed as an independent non executive Director to the Board of John Keells PLC in May 2007.
she is a Fellow of the Chartered institute of Management accountants, uK and also holds a Masters in Business administration from the university of Colombo.
she holds non-executive Directorships in Mas investments (Pvt) Ltd, the non- apparel investment arm of the Mas Group, is a Trustee of sunera Foundation, a non profit organization empowering differently-abled persons using the performing arts and is a Trustee and Chairman of the Federation of environmental organisations, which works to support environmental organizations operating in sri Lanka.
Tilak de Zoysa Independent Non Executive DirectorA well-known figure in the Sri Lankan business community, Tilak de Zoysa, FCMi (uK) FPRi (sL), Honorary Consul for Croatia and Global ambassador for Helpage international was conferred the title of “Deshabandu” by His excellency the President of sri Lanka, in recognition of his services to the country and was the recipient of “The order of the Rising sun. Gold Rays with neck Ribbon” conferred by His Majesty the emperor of Japan.
in addition to being the Chairman of the supervisory Board and advisor to the al-Futtaim Group of Companies in sri Lanka, he chairs Carsons Cumberbatch PLC, associated CeaT (Pvt) Ltd., amaya
Hotels and Resorts usa (Radisson), aMW Capital Leasing and Finance PLC, Jetwing Zinc Journey Lanka (Pvt) Ltd and Helpage sri Lanka, Trinity steel (Pvt) Ltd., and CG Corp Global sri Lanka.
He is also the Vice Chairman of Ceat Kelani Holdings (Pvt) Ltd., orient insurance Ltd. and serves on the boards of several listed and private companies which include John Keells PLC, Taj Lanka Hotels PLC, TaL Hotels and Resorts Ltd, Lanka Walltiles PLC, nawaloka Hospitals PLC, Dutch Lanka Trailer Manufacturers (Tata Group), associated electrical Corporation Ltd., inoac Polymer Lanka (Pvt) Ltd., Cinnovation inC., GVR Lanka (Pvt) Ltd and Varun Beverages Lanka (Pvt) Ltd (Pepsi).
Mr. Tilak de Zoysa is a past Chairman of the Ceylon Chamber of Commerce, the national Chamber of Commerce of sri Lanka, Helpage international (uK) and served as Member of the Monetary Board of sri Lanka (2003-2009).
16 John Keells PlC
Senior Management Team
John Keells PLCHishantha De Melassistant Vice President/ acting Chief Executive Officer
Asha Perera assistant Vice President/Financial Controller
Dasarath Dasanayaka Head of Manufacturing – High Grown
Sanjay KarunaratneManager, Tea
Kushani Daluwatte Manager, Tea
Ravin VannitambyManager, Tea
Kumar BharetiManager, Manufacturing
Vige JohnpillaiManufacturing Consultant
Deshan BandaranayakeManager, Tea
Shehan MeegamaManager, Rubber
Shane Ingram Manager, Finance
Hisham NazeemHead of iT GRC, Head of Business systems strategic Group iT
John Keells Warehousing (Pvt) LtdAshok Jayawickremeassistant Vice President/Head of operations
John Keells stock Brokers (Pvt) LtdTivanka RatnayakeVice PresidentChief Executive Officer
Suran Wijesingheexecutive Vice PresidentChief Financial OfficerFinancial services sector
Akmal Mashoorassistant Vice PresidentHead of sales
Navin RatnayakeManager,Head of Research
Chryshanthi ManuelCompliance Officer
Samantha SiriwardeneHead of Process and system
Nithila TalgaswatteManager, Foreign sales
Marinus FernandoManager, iT
** Senior Management Team as at 31.03.2016
17Annual Report 2015/16
Management Discussion & Analysis
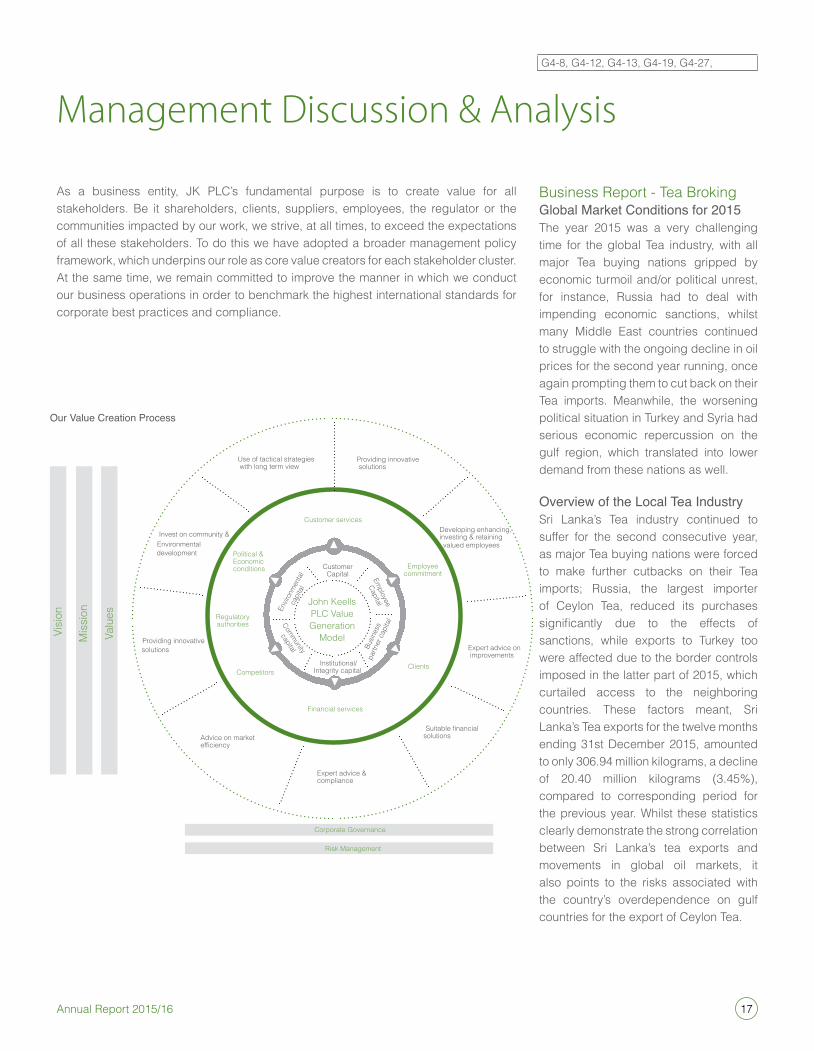
Business Report - Tea BrokingGlobal Market Conditions for 2015The year 2015 was a very challenging time for the global Tea industry, with all major Tea buying nations gripped by economic turmoil and/or political unrest, for instance, Russia had to deal with impending economic sanctions, whilst many Middle east countries continued to struggle with the ongoing decline in oil prices for the second year running, once again prompting them to cut back on their Tea imports. Meanwhile, the worsening political situation in Turkey and syria had serious economic repercussion on the gulf region, which translated into lower demand from these nations as well.
Overview of the Local Tea Industrysri Lanka’s Tea industry continued to suffer for the second consecutive year, as major Tea buying nations were forced to make further cutbacks on their Tea imports; Russia, the largest importer of Ceylon Tea, reduced its purchases significantly due to the effects of sanctions, while exports to Turkey too were affected due to the border controls imposed in the latter part of 2015, which curtailed access to the neighboring countries. These factors meant, sri Lanka’s Tea exports for the twelve months ending 31st December 2015, amounted to only 306.94 million kilograms, a decline of 20.40 million kilograms (3.45%), compared to corresponding period for the previous year. Whilst these statistics clearly demonstrate the strong correlation between sri Lanka’s tea exports and movements in global oil markets, it also points to the risks associated with the country’s overdependence on gulf countries for the export of Ceylon Tea.
G4-8, G4-12, G4-13, G4-19, G4-27,
as a business entity, JK PLC’s fundamental purpose is to create value for all stakeholders. Be it shareholders, clients, suppliers, employees, the regulator or the communities impacted by our work, we strive, at all times, to exceed the expectations of all these stakeholders. To do this we have adopted a broader management policy framework, which underpins our role as core value creators for each stakeholder cluster. at the same time, we remain committed to improve the manner in which we conduct our business operations in order to benchmark the highest international standards for corporate best practices and compliance.
18 John Keells PlC
Management Discussion & Analysis
However, during the period January to March 2016 Sri Lanka was able to benefit from the lifting of us-led sanctions on iran. This led to increase in export volumes to trading centers in Dubai and india, both major Tea blending hubs, where Tea is blended and re-exported to iraq. Meanwhile, exports of specialty light liquoring High-grown Teas to China also increased marginally during this period.
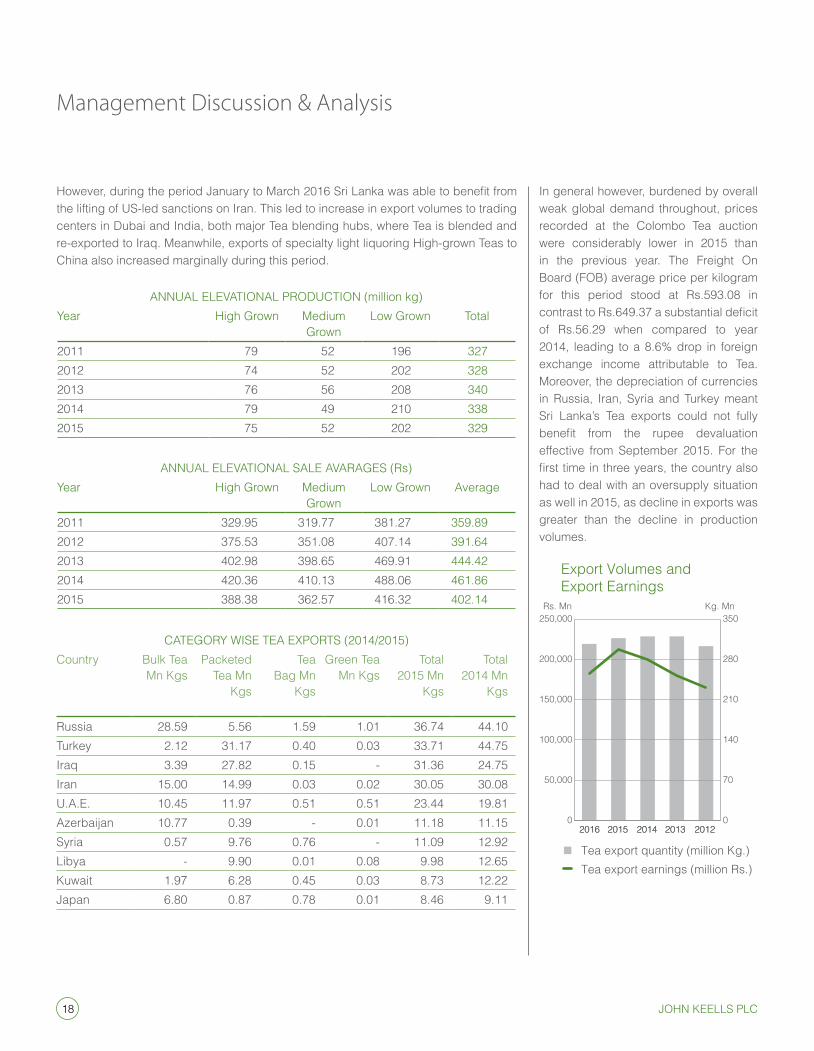
in general however, burdened by overall weak global demand throughout, prices recorded at the Colombo Tea auction were considerably lower in 2015 than in the previous year. The Freight on Board (FoB) average price per kilogram for this period stood at Rs.593.08 in contrast to Rs.649.37 a substantial deficit of Rs.56.29 when compared to year 2014, leading to a 8.6% drop in foreign exchange income attributable to Tea. Moreover, the depreciation of currencies in Russia, iran, syria and Turkey meant sri Lanka’s Tea exports could not fully benefit from the rupee devaluation effective from september 2015. For the first time in three years, the country also had to deal with an oversupply situation as well in 2015, as decline in exports was greater than the decline in production volumes.
0
70
140
210
280
350
2016 2015 2014 2013 2012
Kg. Mn
Export Volumes andExport Earnings
Tea export quantity (million Kg.)
0
50,000
100,000
150,000
200,000
250,000
2016 2015 2014 2013 2012
Rs. Mn
Tea export earnings (million Rs.)
CaTeGoRY Wise Tea exPoRTs (2014/2015)Country Bulk Tea
Mn KgsPacketed
Tea MnKgs
TeaBag Mn
Kgs
Green TeaMn Kgs
Total2015 Mn
Kgs
Total2014 Mn
Kgs
Russia 28.59 5.56 1.59 1.01 36.74 44.10Turkey 2.12 31.17 0.40 0.03 33.71 44.75iraq 3.39 27.82 0.15 - 31.36 24.75iran 15.00 14.99 0.03 0.02 30.05 30.08u.a.e. 10.45 11.97 0.51 0.51 23.44 19.81azerbaijan 10.77 0.39 - 0.01 11.18 11.15syria 0.57 9.76 0.76 - 11.09 12.92Libya - 9.90 0.01 0.08 9.98 12.65Kuwait 1.97 6.28 0.45 0.03 8.73 12.22Japan 6.80 0.87 0.78 0.01 8.46 9.11
annuaL eLeVaTionaL PRoDuCTion (million kg)Year High Grown Medium
GrownLow Grown Total
2011 79 52 196 327 2012 74 52 202 328 2013 76 56 208 340 2014 79 49 210 338 2015 75 52 202 329
annuaL eLeVaTionaL saLe aVaRaGes (Rs)Year High Grown Medium
GrownLow Grown average
2011 329.95 319.77 381.27 359.892012 375.53 351.08 407.14 391.642013 402.98 398.65 469.91 444.422014 420.36 410.13 488.06 461.862015 388.38 362.57 416.32 402.14
19Annual Report 2015/16
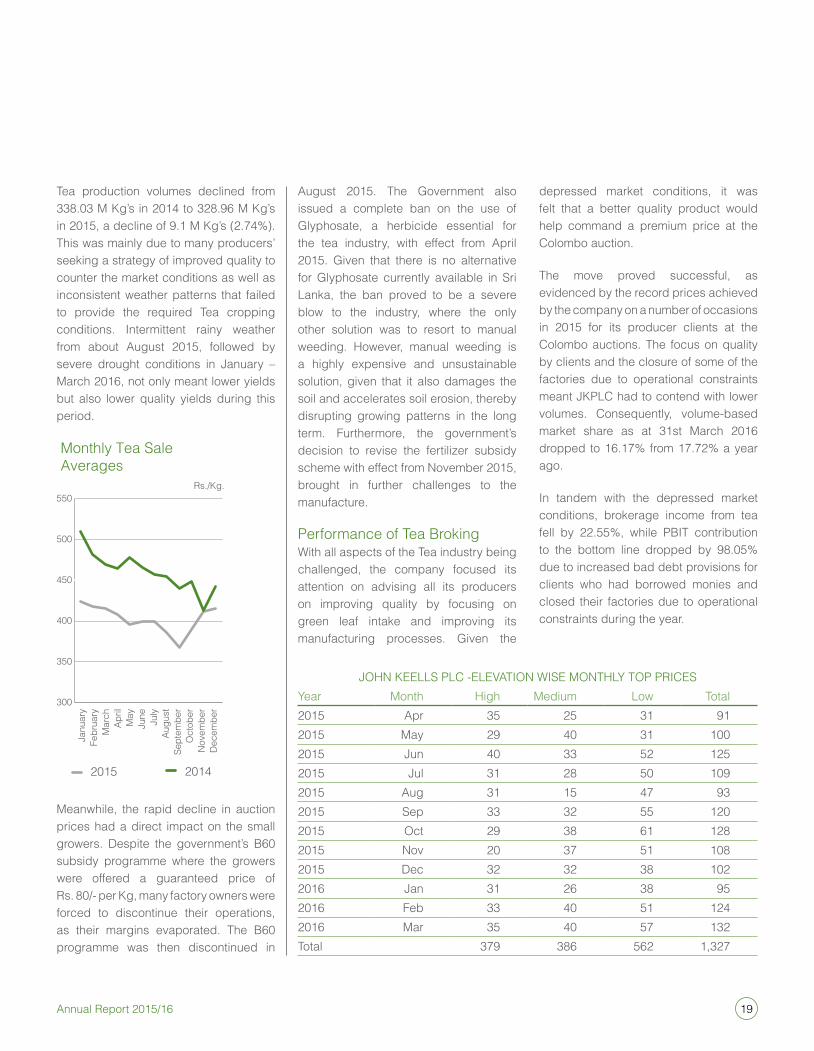
Tea production volumes declined from 338.03 M Kg’s in 2014 to 328.96 M Kg’s in 2015, a decline of 9.1 M Kg’s (2.74%). This was mainly due to many producers’ seeking a strategy of improved quality to counter the market conditions as well as inconsistent weather patterns that failed to provide the required Tea cropping conditions. intermittent rainy weather from about august 2015, followed by severe drought conditions in January – March 2016, not only meant lower yields but also lower quality yields during this period.
Monthly Tea SaleAverages
2015
300
350
400
450
500
550
Janu
ary
Febr
uary
Mar
chAp
rilM
ayJu
ne July
Augu
stSe
ptem
ber
Oct
ober
Nov
embe
rD
ecem
ber
Rs./Kg.
2014
Meanwhile, the rapid decline in auction prices had a direct impact on the small growers. Despite the government’s B60 subsidy programme where the growers were offered a guaranteed price of Rs. 80/- per Kg, many factory owners were forced to discontinue their operations, as their margins evaporated. The B60 programme was then discontinued in
august 2015. The Government also issued a complete ban on the use of Glyphosate, a herbicide essential for the tea industry, with effect from april 2015. Given that there is no alternative for Glyphosate currently available in sri Lanka, the ban proved to be a severe blow to the industry, where the only other solution was to resort to manual weeding. However, manual weeding is a highly expensive and unsustainable solution, given that it also damages the soil and accelerates soil erosion, thereby disrupting growing patterns in the long term. Furthermore, the government’s decision to revise the fertilizer subsidy scheme with effect from november 2015, brought in further challenges to the manufacture.
Performance of Tea Broking With all aspects of the Tea industry being challenged, the company focused its attention on advising all its producers on improving quality by focusing on green leaf intake and improving its manufacturing processes. Given the
depressed market conditions, it was felt that a better quality product would help command a premium price at the Colombo auction.
The move proved successful, as evidenced by the record prices achieved by the company on a number of occasions in 2015 for its producer clients at the Colombo auctions. The focus on quality by clients and the closure of some of the factories due to operational constraints meant JKPLC had to contend with lower volumes. Consequently, volume-based market share as at 31st March 2016 dropped to 16.17% from 17.72% a year ago.
in tandem with the depressed market conditions, brokerage income from tea fell by 22.55%, while PBiT contribution to the bottom line dropped by 98.05% due to increased bad debt provisions for clients who had borrowed monies and closed their factories due to operational constraints during the year.
JoHn KeeLLs PLC -eLeVaTion Wise MonTHLY ToP PRiCesYear Month High Medium Low Total2015 apr 35 25 31 912015 May 29 40 31 1002015 Jun 40 33 52 1252015 Jul 31 28 50 1092015 aug 31 15 47 932015 sep 33 32 55 1202015 oct 29 38 61 1282015 nov 20 37 51 1082015 Dec 32 32 38 1022016 Jan 31 26 38 952016 Feb 33 40 51 1242016 Mar 35 40 57 132Total 379 386 562 1,327
20 John Keells PlC
Management Discussion & Analysis
8
26
5
9
10
7 1
43
11
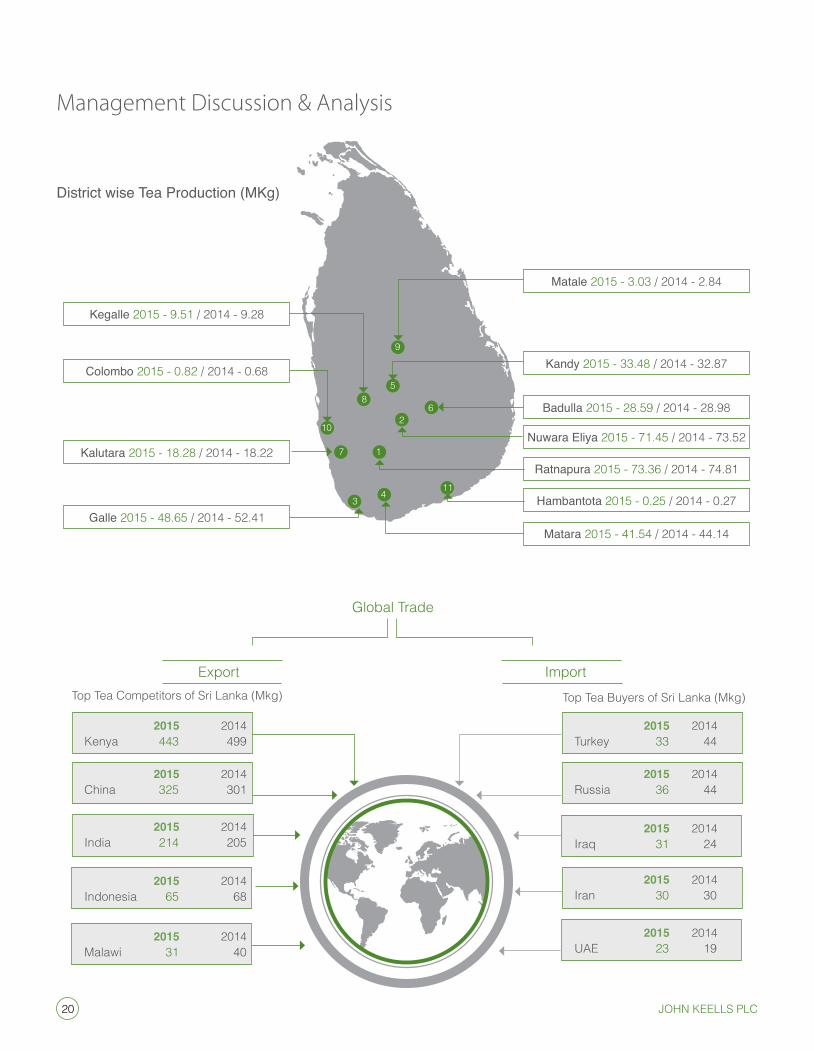
Matale 2015 - 3.03 / 2014 - 2.84
Kandy 2015 - 33.48 / 2014 - 32.87
Kegalle 2015 - 9.51 / 2014 - 9.28
Badulla 2015 - 28.59 / 2014 - 28.98
Colombo 2015 - 0.82 / 2014 - 0.68
Nuwara Eliya 2015 - 71.45 / 2014 - 73.52
Ratnapura 2015 - 73.36 / 2014 - 74.81Kalutara 2015 - 18.28 / 2014 - 18.22
Hambantota 2015 - 0.25 / 2014 - 0.27
Matara 2015 - 41.54 / 2014 - 44.14Galle 2015 - 48.65 / 2014 - 52.41
District wise Tea Production (MKg)
export import
Global Trade
2015 2014
2015 2014
2015 2014
2015 2014
Kenya 443 499
China 325 301
indonesia 65 68
Malawi 31 40
2015 2014india 214 205
2015 2014
2015 2014
2015 2014
Turkey 33 44
Russia 36 44
2015 2014iran 30 30
2015 2014iraq 31 24
uae 23 19
Top Tea Buyers of sri Lanka (Mkg)Top Tea Competitors of sri Lanka (Mkg)
21Annual Report 2015/16
Responsible sourcing:as in the past, efforts to develop the quality of the produce continues to be a key priority for JKPLC. as part of the company’s responsible sourcing practices, strengthening relationships with established Tea Producers remain critical to achieving this objective. Frequent field visits by JKPLC manufacturing advisers are aimed at providing continuous management advisory services to help growers improve estate yields and develop a sustainable framework for Growth. Meanwhile regular technical training workshops seek to enhance the quality of each Tea grade in line with international standards.
During the year estates which obtained top prices at the weekly auctions were acknowledged with a commendation certificate.
Manufacturing, Tasting and Marketing of Tea With the rapidly deteriorating market conditions, the manufacturing strategy shifted towards improving the quality of tea produced rather than quantity as a means of claiming a premium price at the auctions. The JKPLC team, of manufacturing advisers increased their frequency of estate visits with the view of advising, inspecting and implementing improvements in the processes of green leaf intake and other manufacturing processes which were essential in achieving success in this strategy. in addition to these a number of workshops were conducted for factory staff of different categories in tea growing regions with the view of giving the necessary know how of current market trends, practices and new processes
and balances at different stages to facilitate the timely and fair disbursement of monies requested by clients for their day to day working capital requirement based on the stocks available for sale.
The Company also extended the “mauction” platform to some of its clients enabling them to view online real time information of the auction. This was an interim step implemented by the Company until the complete implementation of the “mauction’’ is rolled out. “mauction” as stated in our previous year annual report is an electronic auction platform that was a collaborative effort between JKPLC and Mobitel (Pvt) Ltd. Currently the industry is awaiting the rolling out of the platform by the relevant governing authorities.
Business Report-Rubber BrokingGlobal Market Conditions for 2015The global demand for natural rubber declined for the second consecutive year, as the demand from key rubber buying markets, in india and China slowed amidst signs of a serious economic slowdown in these countries.
Meanwhile, higher yields emerging from Thailand and Vietnam resulted in larger volumes of raw rubber coming into the global market. With no ready takers, this created a serious over supply situation and only further depressed the market.
on the other hand, the rapid decline in world crude oil prices meant synthetic rubber became even cheaper. This was yet another serious blow that caused a drastic drop in the demand for natural rubber as the year progressed.
available in improving the quality of the produce and the improvements in their standard of living.
in addition reviews of performance were presented to Plantation companies on a quarterly basis.
supplier Development as part of the multi faceted role demanded of modern day brokers, JKPLC is often called upon to function as lead financier for estates with which the company has established long standing relationships. Governed by the lending model mandated by the Colombo Brokers association all lending for the year was done as per the minimum lending rates stipulated by the association. The ability to secure low- cost borrowings by leveraging on low interest rates at the beginning of the year helped JKPLC maintain a healthy spread in this business line initially although the spread decreased marginally towards the latter part of the year due to increase in borrowing rates
Delivery and logisticsJKPLC continues to be rated in the trade as a top tier broking house who is at the forefront of sri Lanka’s Tea trade. it is also recognized for its ethical standards and fairness while embracing and introducing innovative iT solutions which have benefitted all stakeholders of the Tea industry. as in the past the company continues to look for new cutting edge technology which will benefit the industry wide growth and survival.
innovationDuring the year a transparent, robust and efficient new advance processing module was implemented with different checks
22 John Keells PlC
Management Discussion & Analysis
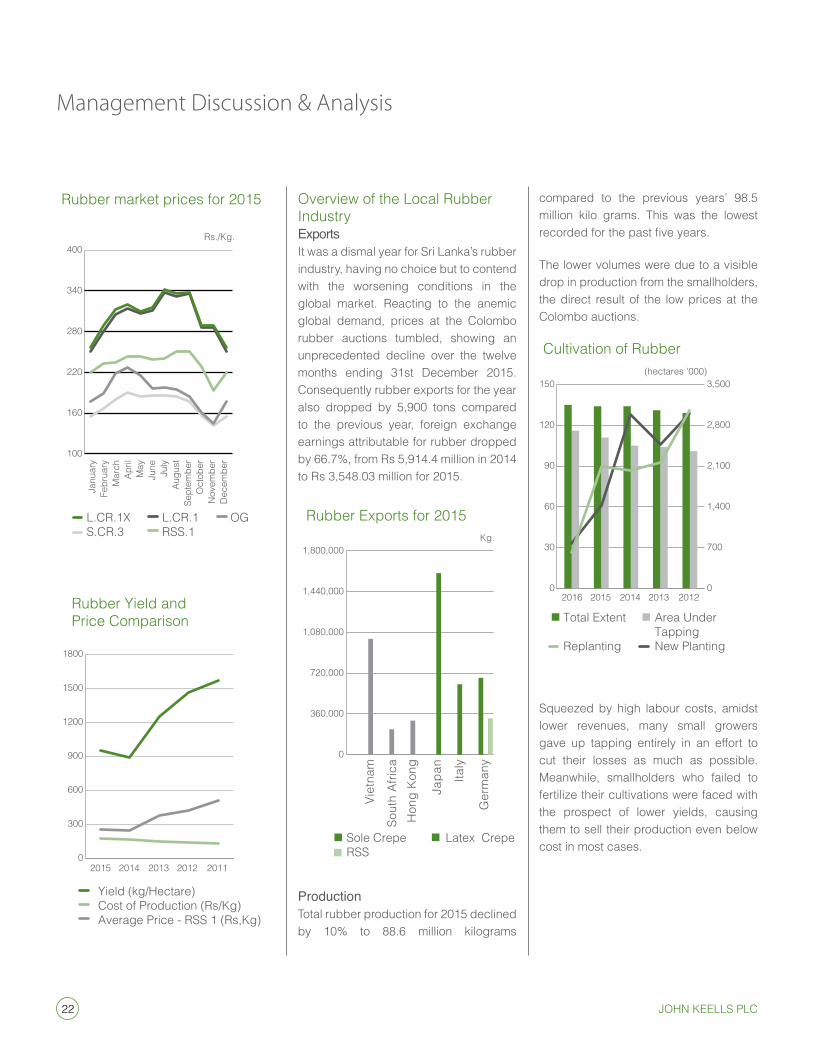
Rubber market prices for 2015
100
160
220
280
340
400
Janu
ary
Febr
uary
Mar
chAp
rilM
ayJu
ne July
Augu
stSe
ptem
ber
Oct
ober
Nov
embe
rD
ecem
ber
Rs./Kg.
L.CR.1X L.CR.1 OGS.CR.3 RSS.1
Rubber Yield andPrice Comparison
0
300
600
900
1200
1500
1800
Yield (kg/Hectare)Cost of Production (Rs/Kg)Average Price - RSS 1 (Rs,Kg)
2015 2014 2013 2012 2011
overview of the Local Rubber industryExportsit was a dismal year for sri Lanka’s rubber industry, having no choice but to contend with the worsening conditions in the global market. Reacting to the anemic global demand, prices at the Colombo rubber auctions tumbled, showing an unprecedented decline over the twelve months ending 31st December 2015. Consequently rubber exports for the year also dropped by 5,900 tons compared to the previous year, foreign exchange earnings attributable for rubber dropped by 66.7%, from Rs 5,914.4 million in 2014 to Rs 3,548.03 million for 2015.
Rubber Exports for 2015
0
360,000
720,000
1,080,000
1,440,000
1,800,000Kg.
Sole Crepe Latex Crepe RSS
Vie
tnam
Sou
th A
frica
H
ong
Kong
Jap
an
Ital
y
Ger
man
y
ProductionTotal rubber production for 2015 declined by 10% to 88.6 million kilograms
compared to the previous years’ 98.5 million kilo grams. This was the lowest recorded for the past five years.
The lower volumes were due to a visible drop in production from the smallholders, the direct result of the low prices at the Colombo auctions.
0
30
60
90
120
150
2016 2015 2014 2013 2012
(hectares '000)
Cultivation of Rubber
0
700
1,400
2,100
2,800
3,500
Total Extent Area Under TappingReplanting New Planting
squeezed by high labour costs, amidst lower revenues, many small growers gave up tapping entirely in an effort to cut their losses as much as possible. Meanwhile, smallholders who failed to fertilize their cultivations were faced with the prospect of lower yields, causing them to sell their production even below cost in most cases.
23Annual Report 2015/16
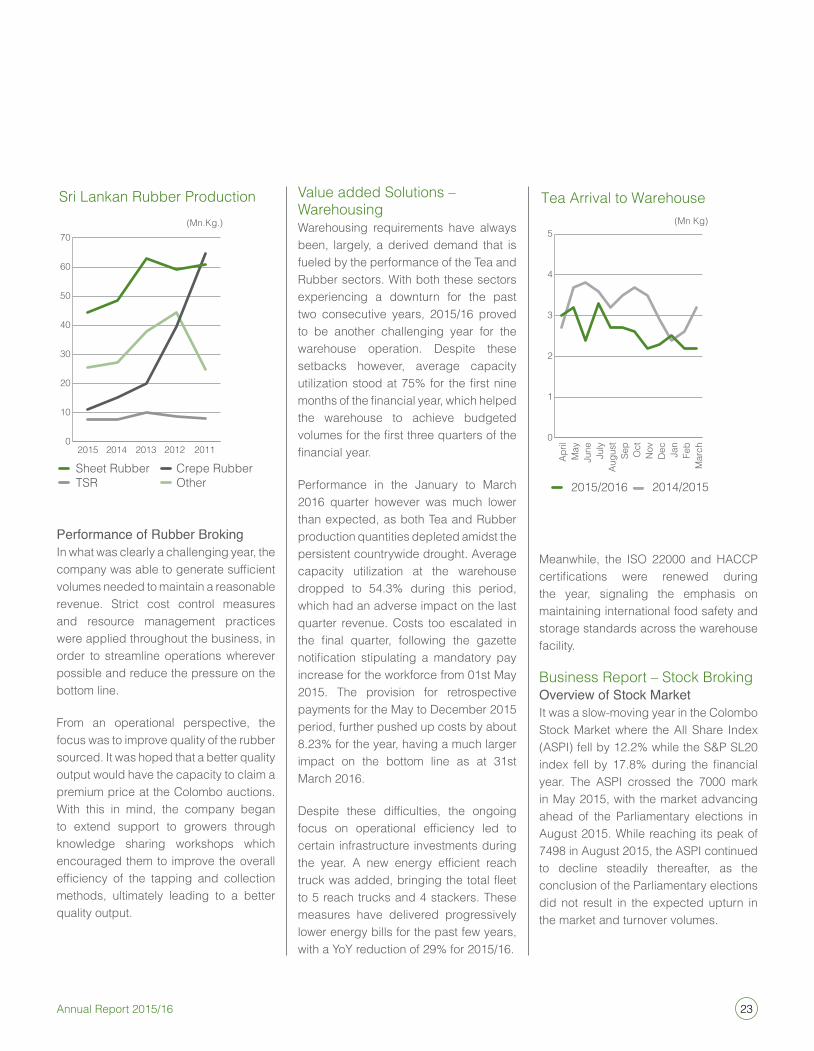
Sri Lankan Rubber Production
Sheet Rubber Crepe RubberTSR Other
0
10
20
30
40
50
60
70(Mn.Kg.)
2015 2014 2013 2012 2011
Performance of Rubber Broking in what was clearly a challenging year, the company was able to generate sufficient volumes needed to maintain a reasonable revenue. strict cost control measures and resource management practices were applied throughout the business, in order to streamline operations wherever possible and reduce the pressure on the bottom line.
From an operational perspective, the focus was to improve quality of the rubber sourced. it was hoped that a better quality output would have the capacity to claim a premium price at the Colombo auctions. With this in mind, the company began to extend support to growers through knowledge sharing workshops which encouraged them to improve the overall efficiency of the tapping and collection methods, ultimately leading to a better quality output.
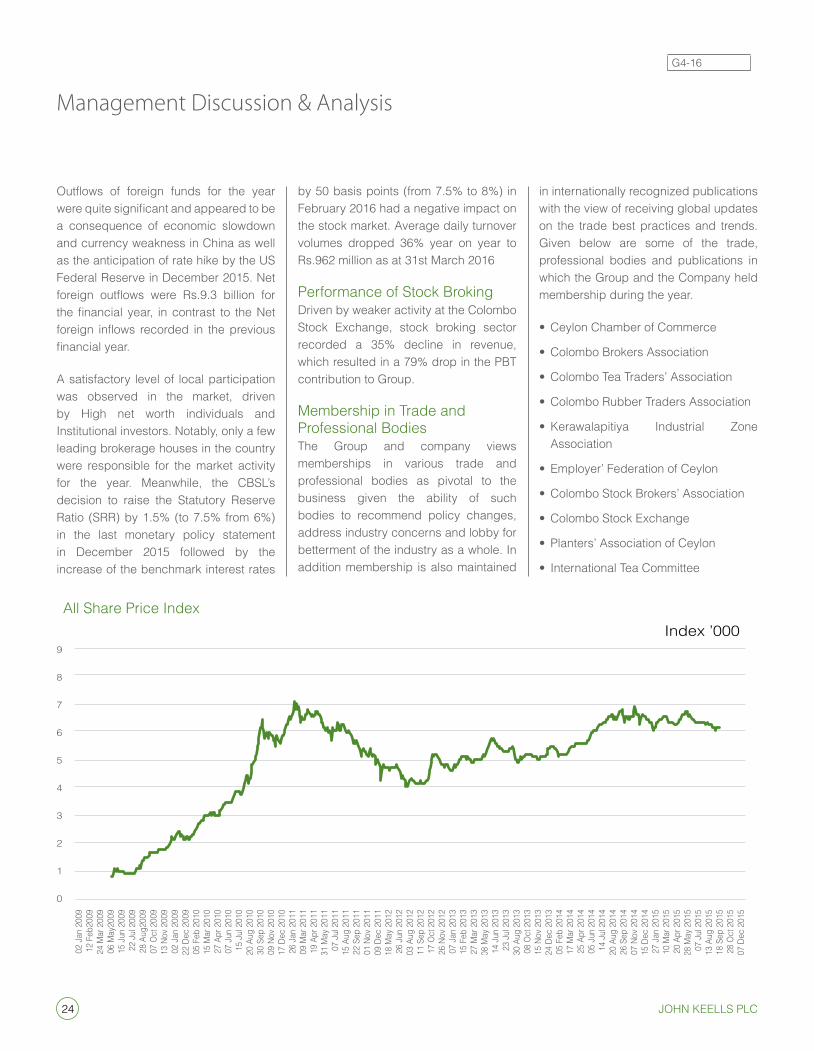
Value added solutions – WarehousingWarehousing requirements have always been, largely, a derived demand that is fueled by the performance of the Tea and Rubber sectors. With both these sectors experiencing a downturn for the past two consecutive years, 2015/16 proved to be another challenging year for the warehouse operation. Despite these setbacks however, average capacity utilization stood at 75% for the first nine months of the financial year, which helped the warehouse to achieve budgeted volumes for the first three quarters of the financial year.
Performance in the January to March 2016 quarter however was much lower than expected, as both Tea and Rubber production quantities depleted amidst the persistent countrywide drought. average capacity utilization at the warehouse dropped to 54.3% during this period, which had an adverse impact on the last quarter revenue. Costs too escalated in the final quarter, following the gazette notification stipulating a mandatory pay increase for the workforce from 01st May 2015. The provision for retrospective payments for the May to December 2015 period, further pushed up costs by about 8.23% for the year, having a much larger impact on the bottom line as at 31st March 2016.
Despite these difficulties, the ongoing focus on operational efficiency led to certain infrastructure investments during the year. A new energy efficient reach truck was added, bringing the total fleet to 5 reach trucks and 4 stackers. These measures have delivered progressively lower energy bills for the past few years, with a YoY reduction of 29% for 2015/16.
Tea Arrival to Warehouse
2015/2016
0
1
2
3
4
5(Mn Kg)
2014/2015
April
May
June July
Augu
stSe
pO
ctN
ovD
ec Jan
Feb
Mar
ch
Meanwhile, the iso 22000 and HaCCP certifications were renewed during the year, signaling the emphasis on maintaining international food safety and storage standards across the warehouse facility.
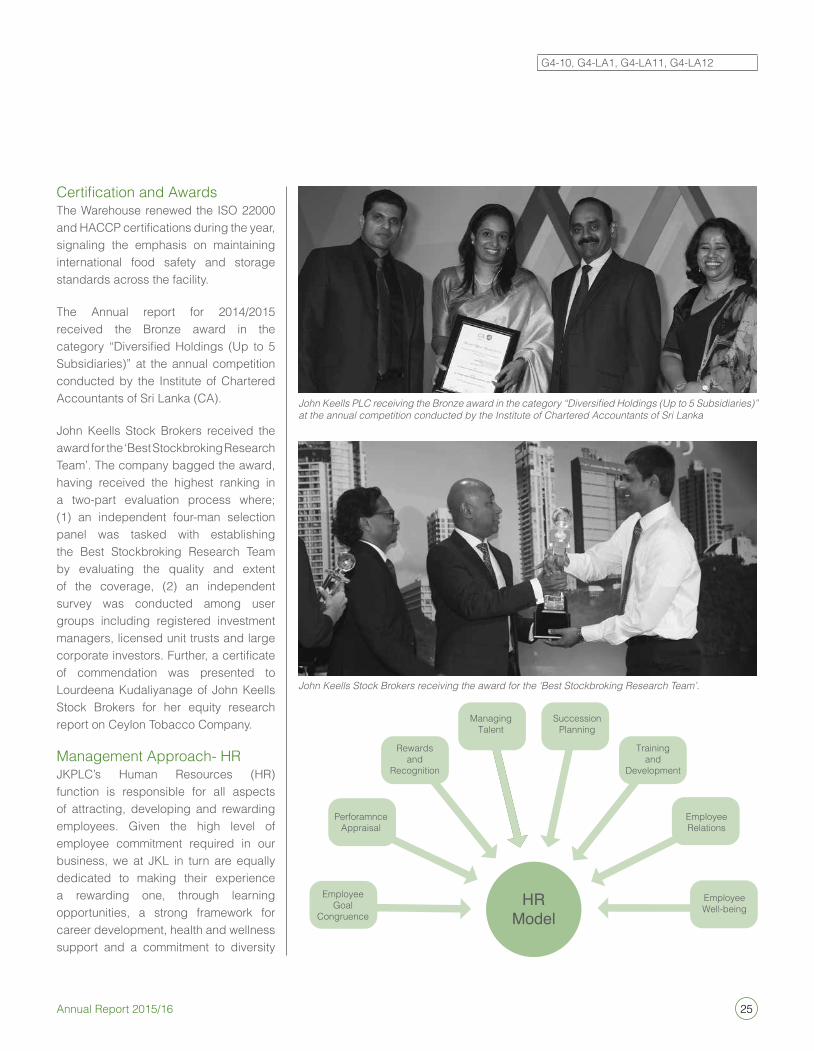
Business Report – stock BrokingOverview of Stock Marketit was a slow-moving year in the Colombo stock Market where the all share index (asPi) fell by 12.2% while the s&P sL20 index fell by 17.8% during the financial year. The asPi crossed the 7000 mark in May 2015, with the market advancing ahead of the Parliamentary elections in august 2015. While reaching its peak of 7498 in august 2015, the asPi continued to decline steadily thereafter, as the conclusion of the Parliamentary elections did not result in the expected upturn in the market and turnover volumes.
24 John Keells PlC
Management Discussion & Analysis
Outflows of foreign funds for the year were quite significant and appeared to be a consequence of economic slowdown and currency weakness in China as well as the anticipation of rate hike by the us Federal Reserve in December 2015. net foreign outflows were Rs.9.3 billion for the financial year, in contrast to the Net foreign inflows recorded in the previous financial year.
a satisfactory level of local participation was observed in the market, driven by High net worth individuals and institutional investors. notably, only a few leading brokerage houses in the country were responsible for the market activity for the year. Meanwhile, the CBsL’s decision to raise the statutory Reserve Ratio (sRR) by 1.5% (to 7.5% from 6%) in the last monetary policy statement in December 2015 followed by the increase of the benchmark interest rates
by 50 basis points (from 7.5% to 8%) in February 2016 had a negative impact on the stock market. average daily turnover volumes dropped 36% year on year to Rs.962 million as at 31st March 2016
Performance of stock BrokingDriven by weaker activity at the Colombo stock exchange, stock broking sector recorded a 35% decline in revenue, which resulted in a 79% drop in the PBT contribution to Group.
Membership in Trade and Professional BodiesThe Group and company views memberships in various trade and professional bodies as pivotal to the business given the ability of such bodies to recommend policy changes, address industry concerns and lobby for betterment of the industry as a whole. in addition membership is also maintained
in internationally recognized publications with the view of receiving global updates on the trade best practices and trends. Given below are some of the trade, professional bodies and publications in which the Group and the Company held membership during the year.
• Ceylon Chamber of Commerce
• Colombo Brokers Association
• Colombo Tea Traders’ Association
• Colombo Rubber Traders Association
• Kerawalapitiya Industrial Zone association
• Employer’ Federation of Ceylon
• Colombo Stock Brokers’ Association
• Colombo Stock Exchange
• Planters’ Association of Ceylon
• International Tea Committee
All Share Price Index
02 J
an 2
009
12 F
eb20
0924
Mar
200
906
May
2009
15 J
un 2
009
22 J
ul 2
009
28 A
ug20
0907
Oct
200
913
Nov
200
902
Jan
200
922
Dec
200
905
Feb
201
015
Mar
201
027
Apr
201
007
Jun
201
015
Jul
201
020
Aug
201
030
Sep
201
009
Nov
201
017
Dec
201
026
Jan
201
109
Mar
201
119
Apr
201
131
May
201
107
Jul
201
115
Aug
201
122
Sep
201
101
Nov
201
109
Dec
201
118
May
201
226
Jun
201
203
Aug
201
211
Sep
201
217
Oct
201
226
Nov
201
207
Jan
201
315
Feb
201
327
Mar
201
308
May
201
314
Jun
201
323
Jul
201
330
Aug
201
308
Oct
201
315
Nov
201
324
Dec
201
305
Feb
201
417
Mar
201
425
Apr
201
405
Jun
201
414
Jul
201
420
Aug
201
426
Sep
201
407
Nov
201
415
Dec
201
427
Jan
201
510
Mar
201
520
Apr
201
528
May
201
507
Jul
201
513
Aug
201
518
Sep
201
528
Oct
201
507
Dec
201
5
9
8
7
6
5
4
3
2
1
0
Index ’000
G4-16
25Annual Report 2015/16
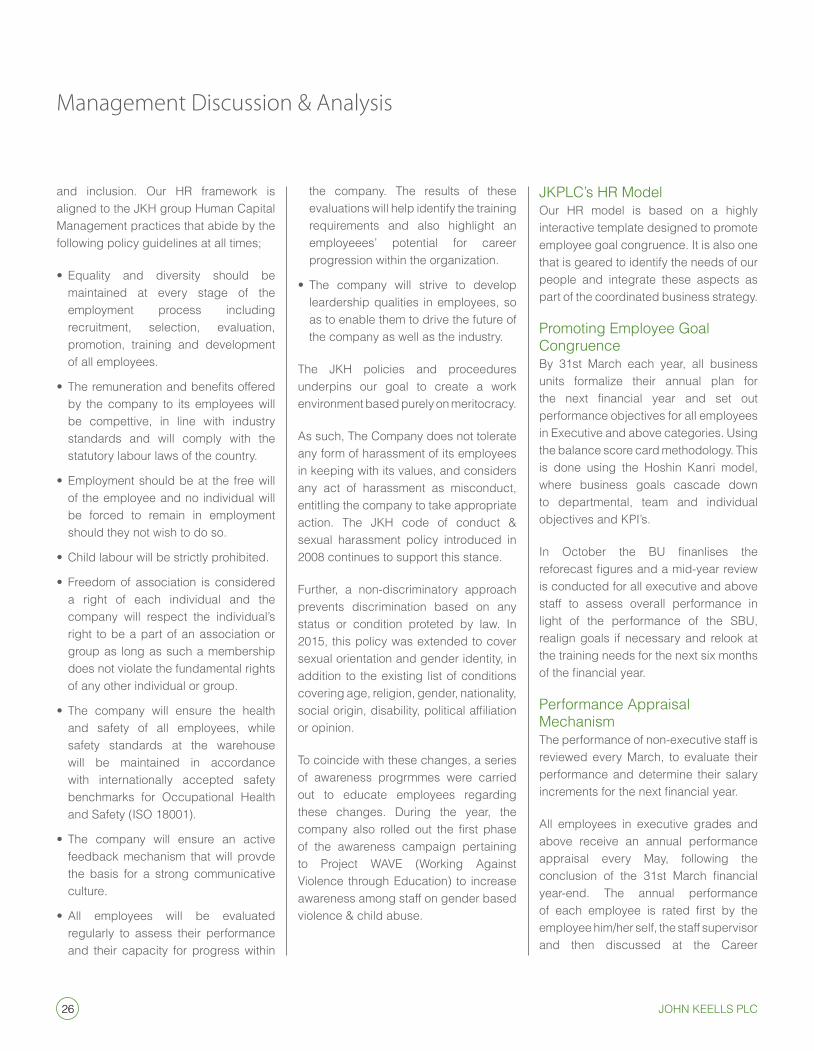
Certification and Awards The Warehouse renewed the ISO 22000 and HACCP certifications during the year, signaling the emphasis on maintaining international food safety and storage standards across the facility.
The Annual report for 2014/2015 received the Bronze award in the category “Diversified Holdings (Up to 5 Subsidiaries)” at the annual competition conducted by the Institute of Chartered Accountants of Sri Lanka (CA).
John Keells Stock Brokers received the award for the ‘Best Stockbroking Research Team’. The company bagged the award, having received the highest ranking in a two-part evaluation process where; (1) an independent four-man selection panel was tasked with establishing the Best Stockbroking Research Team by evaluating the quality and extent of the coverage, (2) an independent survey was conducted among user groups including registered investment managers, licensed unit trusts and large corporate investors. Further, a certificate of commendation was presented to Lourdeena Kudaliyanage of John Keells Stock Brokers for her equity research report on Ceylon Tobacco Company.
Management Approach- HRJKPLC’s Human Resources (HR) function is responsible for all aspects of attracting, developing and rewarding employees. Given the high level of employee commitment required in our business, we at JKL in turn are equally dedicated to making their experience a rewarding one, through learning opportunities, a strong framework for career development, health and wellness support and a commitment to diversity
HRModel
Employee Goal
Congruence
Employee Well-being
Perforamnce Appraisal
Employee Relations
Rewards and
Recognition
Managing Talent
Succession Planning
Trainingand
Development
John Keells Stock Brokers receiving the award for the ‘Best Stockbroking Research Team’.
John Keells PLC receiving the Bronze award in the category “Diversified Holdings (Up to 5 Subsidiaries)” at the annual competition conducted by the Institute of Chartered Accountants of Sri Lanka
G4-10, G4-LA1, G4-LA11, G4-LA12
26 John Keells PlC
Management Discussion & Analysis
and inclusion. our HR framework is aligned to the JKH group Human Capital Management practices that abide by the following policy guidelines at all times;
• Equality and diversity should be maintained at every stage of the employment process including recruitment, selection, evaluation, promotion, training and development of all employees.
• The remuneration and benefits offered by the company to its employees will be compettive, in line with industry standards and will comply with the statutory labour laws of the country.
• Employment should be at the free will of the employee and no individual will be forced to remain in employment should they not wish to do so.
• Child labour will be strictly prohibited.
• Freedom of association is considered a right of each individual and the company will respect the individual’s right to be a part of an association or group as long as such a membership does not violate the fundamental rights of any other individual or group.
• The company will ensure the health and safety of all employees, while safety standards at the warehouse will be maintained in accordance with internationally accepted safety benchmarks for occupational Health and safety (iso 18001).
• The company will ensure an active feedback mechanism that will provde the basis for a strong communicative culture.
• All employees will be evaluated regularly to assess their performance and their capacity for progress within
the company. The results of these evaluations will help identify the training requirements and also highlight an employeees’ potential for career progression within the organization.
• The company will strive to develop leardership qualities in employees, so as to enable them to drive the future of the company as well as the industry.
The JKH policies and proceedures underpins our goal to create a work environment based purely on meritocracy.
as such, The Company does not tolerate any form of harassment of its employees in keeping with its values, and considers any act of harassment as misconduct, entitling the company to take appropriate action. The JKH code of conduct & sexual harassment policy introduced in 2008 continues to support this stance.
Further, a non-discriminatory approach prevents discrimination based on any status or condition proteted by law. in 2015, this policy was extended to cover sexual orientation and gender identity, in addition to the existing list of conditions covering age, religion, gender, nationality, social origin, disability, political affiliation or opinion.
To coincide with these changes, a series of awareness progrmmes were carried out to educate employees regarding these changes. During the year, the company also rolled out the first phase of the awareness campaign pertaining to Project WaVe (Working against Violence through education) to increase awareness among staff on gender based violence & child abuse.
JKPLC’s HR Modelour HR model is based on a highly interactive template designed to promote employee goal congruence. it is also one that is geared to identify the needs of our people and integrate these aspects as part of the coordinated business strategy.
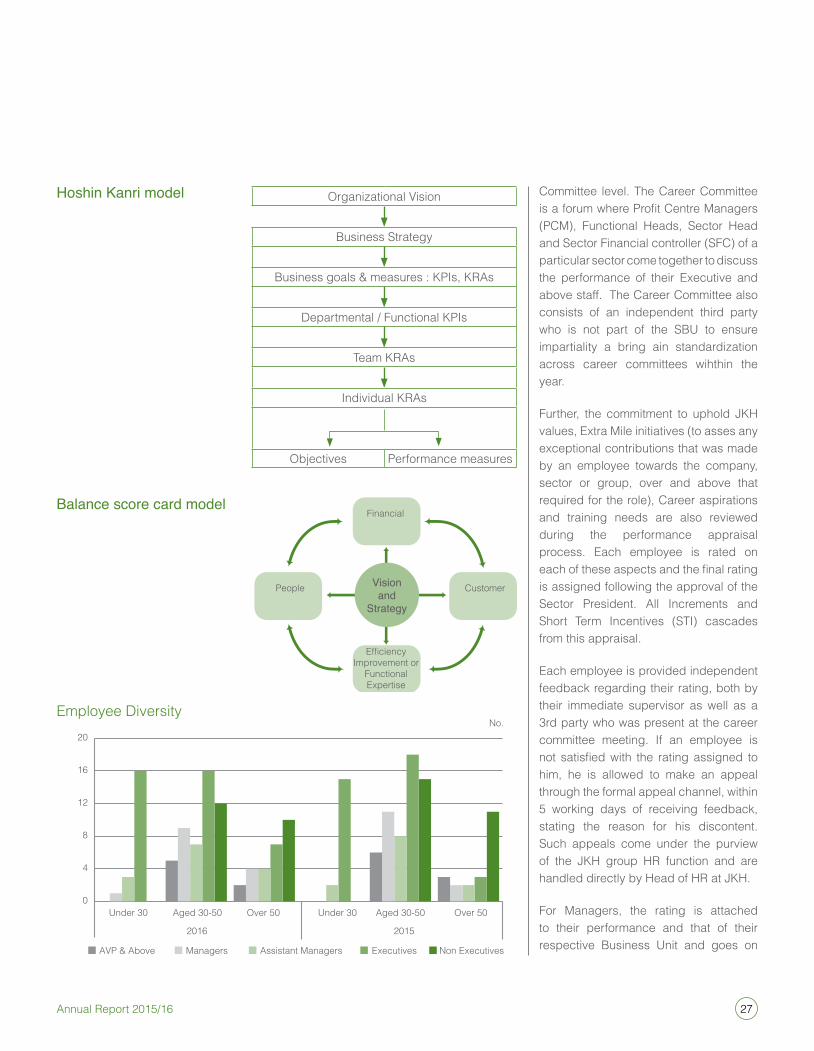
Promoting employee Goal CongruenceBy 31st March each year, all business units formalize their annual plan for the next financial year and set out performance objectives for all employees in executive and above categories. using the balance score card methodology. This is done using the Hoshin Kanri model, where business goals cascade down to departmental, team and individual objectives and KPi’s.
In October the BU finanlises the reforecast figures and a mid-year review is conducted for all executive and above staff to assess overall performance in light of the performance of the sBu, realign goals if necessary and relook at the training needs for the next six months of the financial year.
Performance appraisal MechanismThe performance of non-executive staff is reviewed every March, to evaluate their performance and determine their salary increments for the next financial year.
all employees in executive grades and above receive an annual performance appraisal every May, following the conclusion of the 31st March financial year-end. The annual performance of each employee is rated first by the employee him/her self, the staff supervisor and then discussed at the Career
27Annual Report 2015/16
Financial
Efficiency Improvement or
Functional Expertise
People CustomerVisionand
Strategy
Committee level. The Career Committee is a forum where Profit Centre Managers (PCM), Functional Heads, sector Head and sector Financial controller (sFC) of a particular sector come together to discuss the performance of their executive and above staff. The Career Committee also consists of an independent third party who is not part of the sBu to ensure impartiality a bring ain standardization across career committees wihthin the year.
Further, the commitment to uphold JKH values, extra Mile initiatives (to asses any exceptional contributions that was made by an employee towards the company, sector or group, over and above that required for the role), Career aspirations and training needs are also reviewed during the performance appraisal process. each employee is rated on each of these aspects and the final rating is assigned following the approval of the sector President. all increments and short Term incentives (sTi) cascades from this appraisal.
each employee is provided independent feedback regarding their rating, both by their immediate supervisor as well as a 3rd party who was present at the career committee meeting. if an employee is not satisfied with the rating assigned to him, he is allowed to make an appeal through the formal appeal channel, within 5 working days of receiving feedback, stating the reason for his discontent. such appeals come under the purview of the JKH group HR function and are handled directly by Head of HR at JKH.
For Managers, the rating is attached to their performance and that of their respective Business unit and goes on
organizational Vision
Business strategy
Business goals & measures : KPis, KRas
Departmental / Functional KPis
Team KRas
individual KRas
objectives Performance measures
Employee Diversity
0
4
8
12
16
20
AVP & Above Managers Assistant Managers Executives Non Executives
Under 30 Aged 30-50 Over 50 Under 30 Aged 30-50 Over 50
No.
20152016
Hoshin Kanri model
Balance score card model
28 John Keells PlC
Management Discussion & Analysis
to impact their short term incentives (sTi),which is the variable portion of their remuneration package. all managers are also subjected to a 3600
evaluation process, which helps to ascertain the views of the employees within the immediate work circle. a strictly confidential process, the results of the 3600 survey is discussed with the respective Manager at their annual appraisal and used as a development tool to motivate Managers to address possible improvement areas.
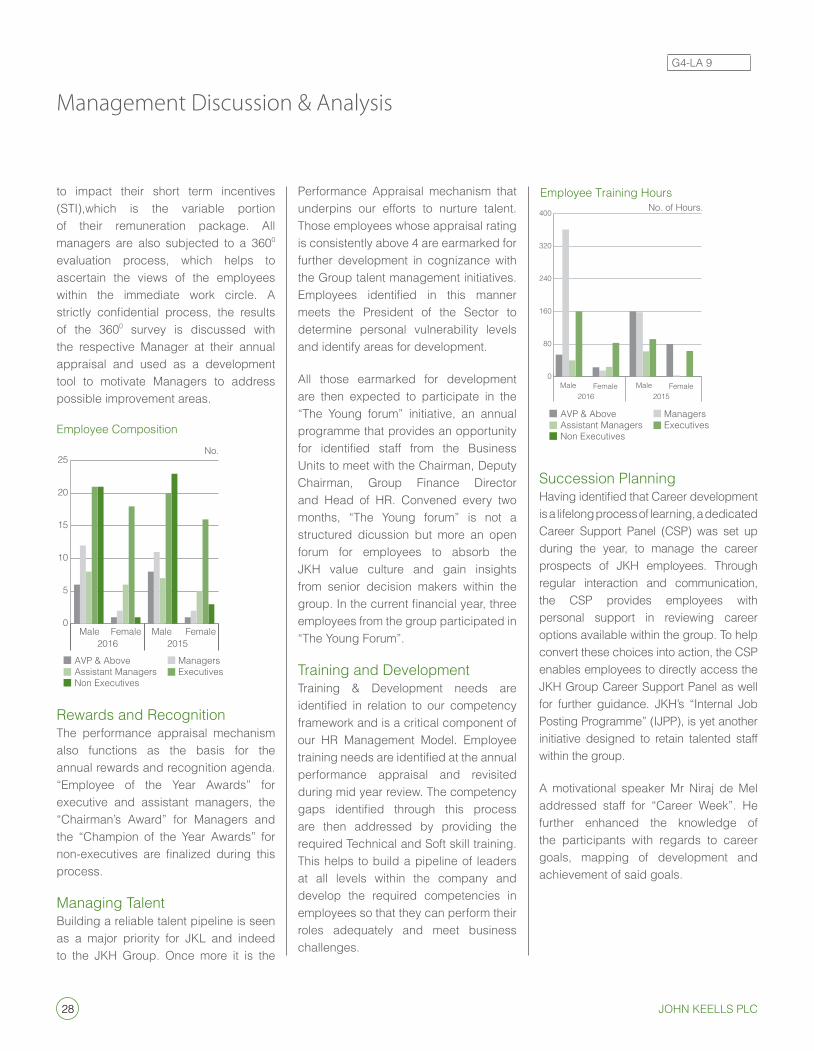
Employee Composition
0
5
10
15
20
25
Male Female Male Female2016 2015
AVP & Above ManagersAssistant Managers ExecutivesNon Executives
No.
Rewards and Recognition The performance appraisal mechanism also functions as the basis for the annual rewards and recognition agenda. “employee of the Year awards” for executive and assistant managers, the “Chairman’s award” for Managers and the “Champion of the Year awards” for non-executives are finalized during this process.
Managing Talent Building a reliable talent pipeline is seen as a major priority for JKL and indeed to the JKH Group. once more it is the
Performance appraisal mechanism that underpins our efforts to nurture talent. Those employees whose appraisal rating is consistently above 4 are earmarked for further development in cognizance with the Group talent management initiatives. Employees identified in this manner meets the President of the sector to determine personal vulnerability levels and identify areas for development.
all those earmarked for development are then expected to participate in the “The Young forum” initiative, an annual programme that provides an opportunity for identified staff from the Business units to meet with the Chairman, Deputy Chairman, Group Finance Director and Head of HR. Convened every two months, “The Young forum” is not a structured dicussion but more an open forum for employees to absorb the JKH value culture and gain insights from senior decision makers within the group. In the current financial year, three employees from the group participated in “The Young Forum”.
Training and DevelopmentTraining & Development needs are identified in relation to our competency framework and is a critical component of our HR Management Model. employee training needs are identified at the annual performance appraisal and revisited during mid year review. The competency gaps identified through this process are then addressed by providing the required Technical and soft skill training. This helps to build a pipeline of leaders at all levels within the company and develop the required competencies in employees so that they can perform their roles adequately and meet business challenges.
Employee Training Hours
0
80
160
240
320
400
Male2016 2015
Female Male Female
AVP & Above ManagersAssistant Managers ExecutivesNon Executives
No. of Hours.
succession PlanningHaving identified that Career development is a lifelong process of learning, a dedicated Career support Panel (CsP) was set up during the year, to manage the career prospects of JKH employees. Through regular interaction and communication, the CsP provides employees with personal support in reviewing career options available within the group. To help convert these choices into action, the CsP enables employees to directly access the JKH Group Career support Panel as well for further guidance. JKH’s “internal Job Posting Programme” (iJPP), is yet another initiative designed to retain talented staff within the group.
a motivational speaker Mr niraj de Mel addressed staff for “Career Week”. He further enhanced the knowledge of the participants with regards to career goals, mapping of development and achievement of said goals.
G4-La 9
29Annual Report 2015/16
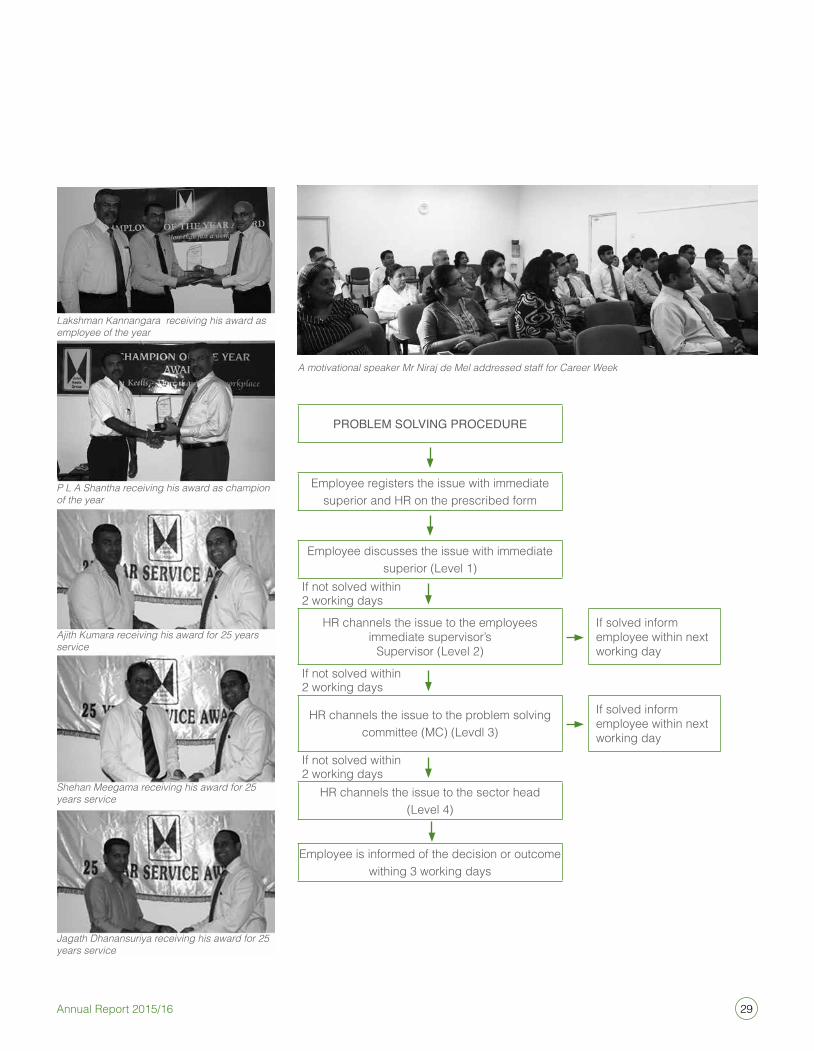
PROBLEM SOLVING PROCEDuRE
employee registers the issue with immediate superior and HR on the prescribed form
employee discusses the issue with immediate superior (Level 1)
if not solved within 2 working days
HR channels the issue to the employees immediate supervisor’s
supervisor (Level 2)
if solved inform employee within next working day
if not solved within 2 working days
HR channels the issue to the problem solving committee (MC) (Levdl 3)
if solved inform employee within next working day
if not solved within 2 working days
HR channels the issue to the sector head (Level 4)
employee is informed of the decision or outcome withing 3 working days
A motivational speaker Mr Niraj de Mel addressed staff for Career Week
Lakshman Kannangara receiving his award as employee of the year
P L A Shantha receiving his award as champion of the year
Ajith Kumara receiving his award for 25 years service
Shehan Meegama receiving his award for 25 years service
Jagath Dhanansuriya receiving his award for 25 years service
30 John Keells PlC
Management Discussion & Analysis
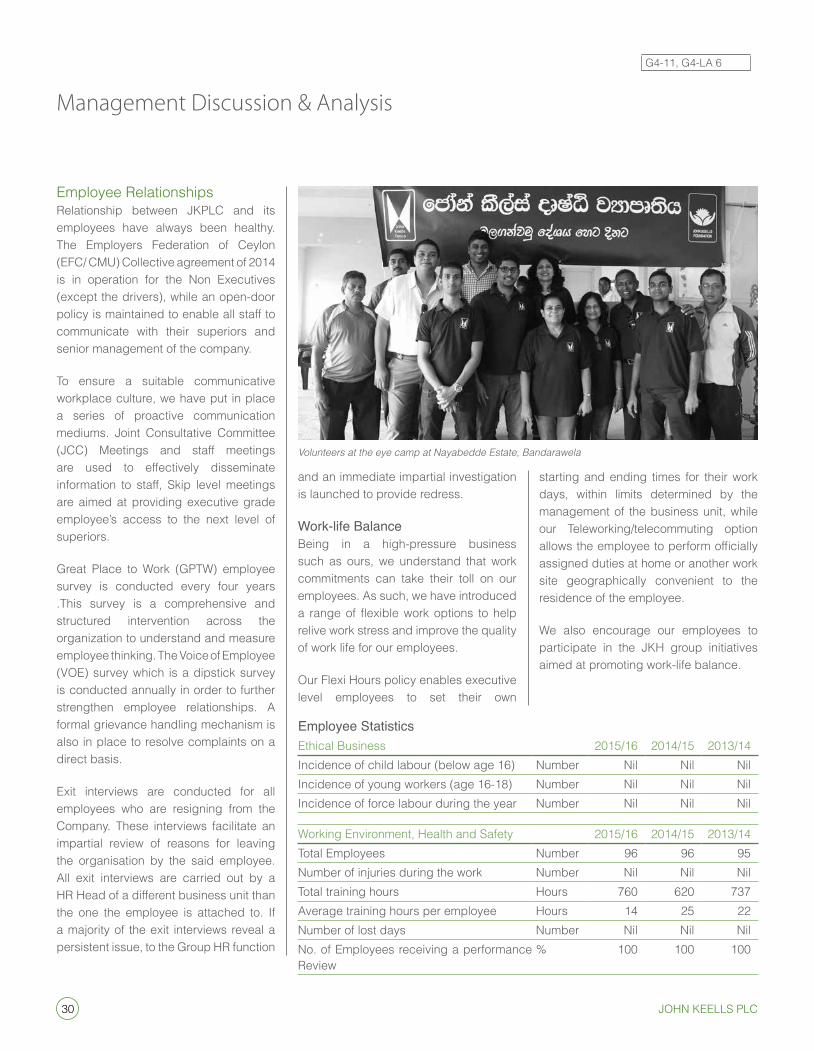
employee RelationshipsRelationship between JKPLC and its employees have always been healthy. The employers Federation of Ceylon (eFC/ CMu) Collective agreement of 2014 is in operation for the non executives (except the drivers), while an open-door policy is maintained to enable all staff to communicate with their superiors and senior management of the company.
To ensure a suitable communicative workplace culture, we have put in place a series of proactive communication mediums. Joint Consultative Committee (JCC) Meetings and staff meetings are used to effectively disseminate information to staff, skip level meetings are aimed at providing executive grade employee’s access to the next level of superiors.
Great Place to Work (GPTW) employee survey is conducted every four years .This survey is a comprehensive and structured intervention across the organization to understand and measure employee thinking. The Voice of employee (Voe) survey which is a dipstick survey is conducted annually in order to further strengthen employee relationships. a formal grievance handling mechanism is also in place to resolve complaints on a direct basis.
exit interviews are conducted for all employees who are resigning from the Company. These interviews facilitate an impartial review of reasons for leaving the organisation by the said employee. all exit interviews are carried out by a HR Head of a different business unit than the one the employee is attached to. if a majority of the exit interviews reveal a persistent issue, to the Group HR function
and an immediate impartial investigation is launched to provide redress.
Work-life BalanceBeing in a high-pressure business such as ours, we understand that work commitments can take their toll on our employees. as such, we have introduced a range of flexible work options to help relive work stress and improve the quality of work life for our employees.
our Flexi Hours policy enables executive level employees to set their own
starting and ending times for their work days, within limits determined by the management of the business unit, while our Teleworking/telecommuting option allows the employee to perform officially assigned duties at home or another work site geographically convenient to the residence of the employee.
We also encourage our employees to participate in the JKH group initiatives aimed at promoting work-life balance.
Volunteers at the eye camp at Nayabedde Estate, Bandarawela
Employee Statisticsethical Business 2015/16 2014/15 2013/14 incidence of child labour (below age 16) number nil nil nilincidence of young workers (age 16-18) number nil nil nilincidence of force labour during the year number nil nil nil
Working environment, Health and safety 2015/16 2014/15 2013/14 Total employees number 96 96 95number of injuries during the work number nil nil nilTotal training hours Hours 760 620 737 average training hours per employee Hours 14 25 22 number of lost days number nil nil nilno. of employees receiving a performance Review
% 100 100 100
G4-11, G4-La 6
31Annual Report 2015/16
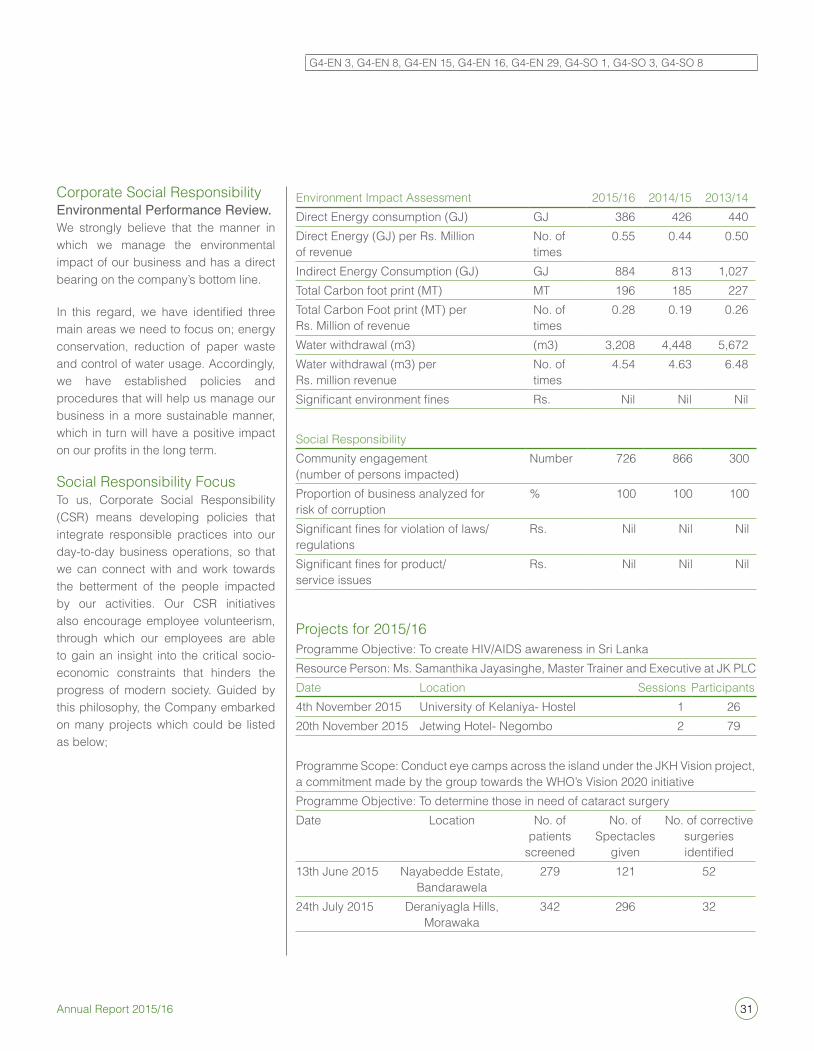
environment impact assessment 2015/16 2014/15 2013/14 Direct energy consumption (GJ) GJ 386 426 440 Direct energy (GJ) per Rs. Million of revenue
no. of times
0.55 0.44 0.50
indirect energy Consumption (GJ) GJ 884 813 1,027 Total Carbon foot print (MT) MT 196 185 227 Total Carbon Foot print (MT) per Rs. Million of revenue
no. of times
0.28 0.19 0.26
Water withdrawal (m3) (m3) 3,208 4,448 5,672 Water withdrawal (m3) per Rs. million revenue
no. of times
4.54 4.63 6.48
Significant environment fines Rs. nil nil nil
social ResponsibilityCommunity engagement (number of persons impacted)
number 726 866 300
Proportion of business analyzed for risk of corruption
% 100 100 100
Significant fines for violation of laws/regulations
Rs. nil nil nil
Significant fines for product/ service issues
Rs. nil nil nil
Projects for 2015/16Programme objective: To create HiV/aiDs awareness in sri LankaResource Person: Ms. samanthika Jayasinghe, Master Trainer and executive at JK PLCDate Location sessions Participants4th november 2015 university of Kelaniya- Hostel 1 2620th november 2015 Jetwing Hotel- negombo 2 79
Programme scope: Conduct eye camps across the island under the JKH Vision project, a commitment made by the group towards the WHo’s Vision 2020 initiative Programme objective: To determine those in need of cataract surgeryDate Location no. of
patients screened
no. of spectacles
given
no. of corrective surgeries identified
13th June 2015 nayabedde estate, Bandarawela
279 121 52
24th July 2015 Deraniyagla Hills, Morawaka
342 296 32
Corporate social Responsibility Environmental Performance Review.We strongly believe that the manner in which we manage the environmental impact of our business and has a direct bearing on the company’s bottom line.
In this regard, we have identified three main areas we need to focus on; energy conservation, reduction of paper waste and control of water usage. accordingly, we have established policies and procedures that will help us manage our business in a more sustainable manner, which in turn will have a positive impact on our profits in the long term.
social Responsibility Focus To us, Corporate social Responsibility (CsR) means developing policies that integrate responsible practices into our day-to-day business operations, so that we can connect with and work towards the betterment of the people impacted by our activities. our CsR initiatives also encourage employee volunteerism, through which our employees are able to gain an insight into the critical socio-economic constraints that hinders the progress of modern society. Guided by this philosophy, the Company embarked on many projects which could be listed as below;
G4-en 3, G4-en 8, G4-en 15, G4-en 16, G4-en 29, G4-so 1, G4-so 3, G4-so 8
32 John Keells PlC
Management Discussion & Analysis
Financial ReviewRevenue The Group recorded consolidated revenue of Rs 707 million for the year under review, 26 percent lower than the 960 million recorded in the previous financial year. The drop in revenue was mainly due to adverse global conditions during the year under review, which affected both the produce broking and share broking segments. The warehousing segment revenue too was impacted, though to a lesser degree.
Revenue Compositiona change in the revenue composition was observed during the year under review, with Produce Broking contributing 60 percent to the total revenue, share broking 27 percent and the warehousing operation accounting for the balance 13 percent. This was a shift from the previous year mix, where produce broking, share broking and warehousing accounted for 59 percent, 31 percent and 10 percent respectively, of the total revenue for that year.
Revenue Composition
2015/2016
Warehousing
Produce broking
Share broking
Produce Brokering RevenueRevenue generated from produce brokering was Rs 425 million for the year. This was a decline of 24 percent from the Rs. 559 million recorded in the previous year. This was mainly due to the significant drop in average selling
price of a kilogram of Tea, which was the result of demand volatility in all major Tea exporting destinations during the year. The average selling price achieved by John Keells brokers (JK) was Rs 401.45 per kilogram of Tea, a decrease of 9.6 percent from the Rs 444.04 average recorded in the previous year. The revenue decline was made sharper by a 14.4 percent drop in the Tea sale volumes handled as many of JK clients were found opting for a high quality: low volume strategy to counter negative market conditions. Consequently, Tea sales volumes handled by JK stood at 50.95 Million kilograms for the year. This constitutes a market share of 16.19 percent as against a 17.70 percent market share recorded for the corresponding period in the previous year.
Broker Market Share-Tea Qty Sold
0
5
10
15
20
25%
JKPL
C
FW Asia
LCBL
MPB
L
CTB
BPBL EB
2015/16 2014/15
Tea Average Sale Prices
Trade JKPLC
0 100 200 300 400 500
2016
2015
2014
2013
2012
Rs
Rubber continued to experience low prices during the year due to a sharp decline in global demand for natural rubber. JK thus recorded an average price of Rs 254.92 per kilogram in comparison to the previous year‘s average of Rs 255.53 per kilogram. alongside this 0.24 percent drop in prices, Rubber production also declined as a result of inclement weather patterns
0
125
250
375
500
JKPLC Rubber saleQty and Prices
Average Price Quantity Sold
3
4
5
6
2015 2014 2013 2012 2011
Kg. MnRs.
G4-22, G4-23
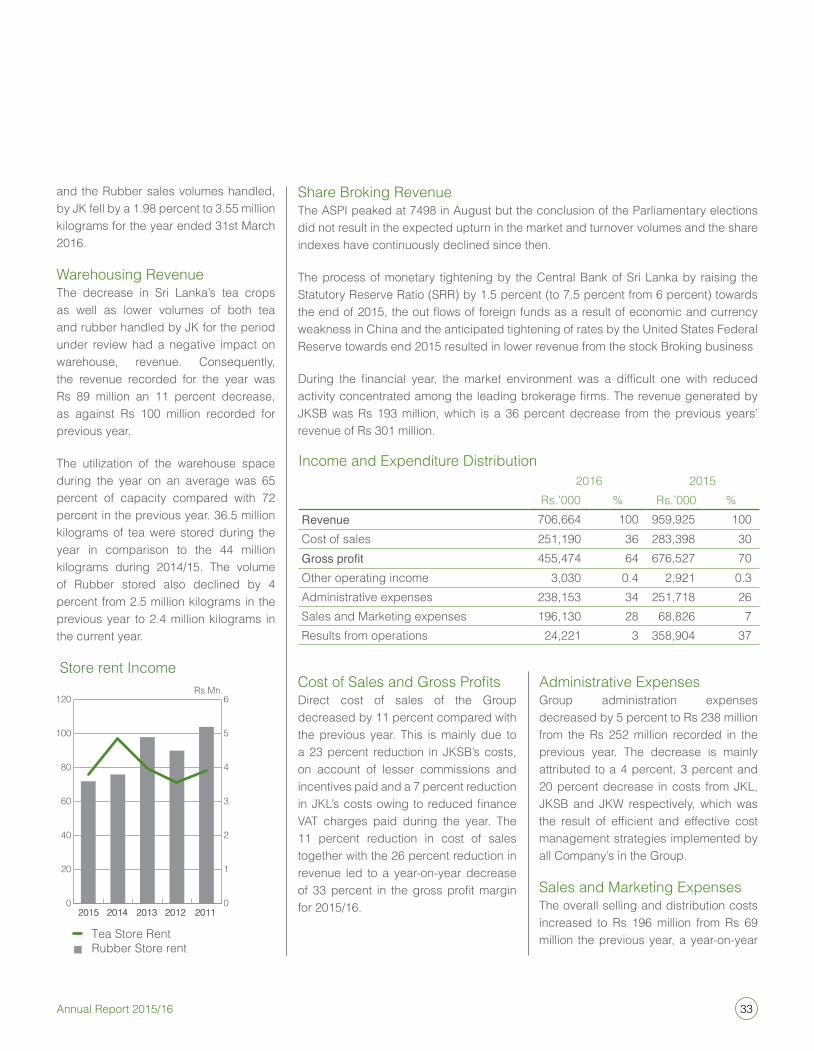
33Annual Report 2015/16
and the Rubber sales volumes handled, by JK fell by a 1.98 percent to 3.55 million kilograms for the year ended 31st March 2016.
Warehousing RevenueThe decrease in sri Lanka’s tea crops as well as lower volumes of both tea and rubber handled by JK for the period under review had a negative impact on warehouse, revenue. Consequently, the revenue recorded for the year was Rs 89 million an 11 percent decrease, as against Rs 100 million recorded for previous year.
The utilization of the warehouse space during the year on an average was 65 percent of capacity compared with 72 percent in the previous year. 36.5 million kilograms of tea were stored during the year in comparison to the 44 million kilograms during 2014/15. The volume of Rubber stored also declined by 4 percent from 2.5 million kilograms in the previous year to 2.4 million kilograms in the current year.
Tea Store RentRubber Store rent
0
1
2
3
4
5
6
2015 2014 2013 2012 2011
Store rent Income
0
20
40
60
80
100
120
2015 2014 2013 2012 2011
Rs/kgRs.Mn.
share Broking RevenueThe asPi peaked at 7498 in august but the conclusion of the Parliamentary elections did not result in the expected upturn in the market and turnover volumes and the share indexes have continuously declined since then.
The process of monetary tightening by the Central Bank of sri Lanka by raising the statutory Reserve Ratio (sRR) by 1.5 percent (to 7.5 percent from 6 percent) towards the end of 2015, the out flows of foreign funds as a result of economic and currency weakness in China and the anticipated tightening of rates by the united states Federal Reserve towards end 2015 resulted in lower revenue from the stock Broking business
During the financial year, the market environment was a difficult one with reduced activity concentrated among the leading brokerage firms. The revenue generated by JKsB was Rs 193 million, which is a 36 percent decrease from the previous years’ revenue of Rs 301 million.
Cost of Sales and Gross ProfitsDirect cost of sales of the Group decreased by 11 percent compared with the previous year. This is mainly due to a 23 percent reduction in JKsB’s costs, on account of lesser commissions and incentives paid and a 7 percent reduction in JKL’s costs owing to reduced finance VaT charges paid during the year. The 11 percent reduction in cost of sales together with the 26 percent reduction in revenue led to a year-on-year decrease of 33 percent in the gross profit margin for 2015/16.
administrative expensesGroup administration expenses decreased by 5 percent to Rs 238 million from the Rs 252 million recorded in the previous year. The decrease is mainly attributed to a 4 percent, 3 percent and 20 percent decrease in costs from JKL, JKsB and JKW respectively, which was the result of efficient and effective cost management strategies implemented by all Company’s in the Group.
sales and Marketing expenses The overall selling and distribution costs increased to Rs 196 million from Rs 69 million the previous year, a year-on-year
income and expenditure Distribution2016 2015
Rs.’000 % Rs.’000 % Revenue 706,664 100 959,925 100 Cost of sales 251,190 36 283,398 30 Gross profit 455,474 64 676,527 70 other operating income 3,030 0.4 2,921 0.3 administrative expenses 238,153 34 251,718 26 sales and Marketing expenses 196,130 28 68,826 7 Results from operations 24,221 3 358,904 37
34 John Keells PlC
Management Discussion & Analysis
increase of 185 percent. The main cause for the increase was the doubtful debts provision of Rs 179 million made by JKL, on account of advances granted to tea clients who were forced to shut down during the year, amidst severe market adversity. While the group prudency policy ensures that adequate provisions are made for such eventualities, the company remains hopeful that with favorable market conditions the clients will be able to recommence operations and settle their dues in due course.
Finance income Finance income consists of interest income and dividend income from shareholdings in Group companies. The Group’s surplus cash flows during the year reduced in comparison to the previous year, mainly due to reduced activity in the stock market, but despite a lower cash surplus, the higher overnight interest rates contributed to a marginally higher interest income.
Dividend income of the group includes the dividends received from Keells Food Products PLC (KFP) and the higher dividend income received from KFP led to a 50 percent increase in finance income during the year.
Finance expenses (net)a reduction in the loans and advances granted to tea clients coupled with focused cash management strategies resulted in lowering finance expenses by 16 percent, when compared with the previous year. accordingly, net interest expenses also reduced by 69 percent when compared with the previous year. The interest cover for the year was 0.37 compared to the 4.62 recorded in the previous year. This is attributed to the
reduced profit due to lower revenue and increase selling and distribution expenses.
ProfitabilityThe macro economic factors continued to cause both direct and indirect impacts on the profitability of all segments of the Group in varying degrees. The continuing volatility in sri Lanka’s main tea export markets contributed negatively to the broking and warehousing segment, while the CBsL’s tightening of monetary policy and the us Federal Bank rate increases had an adverse impact on the stock broking segment. Consequently the Group profit before tax decreased by 81 percent from Rs 333 million recorded in the previous year, to Rs. 64 million for the current financial year. PBT for the current year includes Rs 45 million fair value adjustment of investment properties in comparison to the Rs 15 million recorded in the previous year.
Change in Fair Value of investment PropertyThe investment properties were valued by Mr P B Kalugalagedera using the open market value method and the change in value was a positive of Rs 45 million as at 31st March 2016, as against Rs 15 million at the end of the previous year.
Taxationas per the current tax regulations, Produce brokering and stock brokering income are subject to a tax of 28 percent whilst the tax bracket for the warehousing operation reduced to 10 percent from the previous 12 percent. However, the reduction in profits had a direct impact on the amount of taxes paid to the government during the year.
statement of Financial PositionRevenue ReserveThe Group revenue reserve reduced by 9 percent to 2,603 million from the Rs 2,860 million recorded in the previous year. This was on account of profit for the current year reducing by 76 percent over the previous year, the payment of super gains tax of Rs. 93.9 million and increase in dividend payout by 10 percent over the previous year.
available for sale ReserveThe “available for sale Reserve” balance increased by 110 percent to Rs 304 million from the Rs 145 million recorded last year. This was mainly due to Fair value increase of investments held in Keells Food Products PLC by Rs 159 million during the year.
non- Controlling interestThe non- controlling interest decreased by 49 percent to 24 million from the Rs 47 million recorded in the previous year, on account of higher dividend payout by John Keells stock Brokers (Pvt) Ltd (JKsB) during the year. The non – controlling interest in JKsB is 24 percent.
Cash Flow The net movement in cash and cash equivalents for the year under review was an outflow of Rs. 516 million. This was an increase of Rs 383 million when compared to the previous years’ Rs 132 million. The main reasons for this increase was the lower cash generated from operations amounting to Rs. 416 million, an increase in the amount paid as income tax by Rs 57 million and increase of Rs 38 million on account of dividend paid out by the Group.
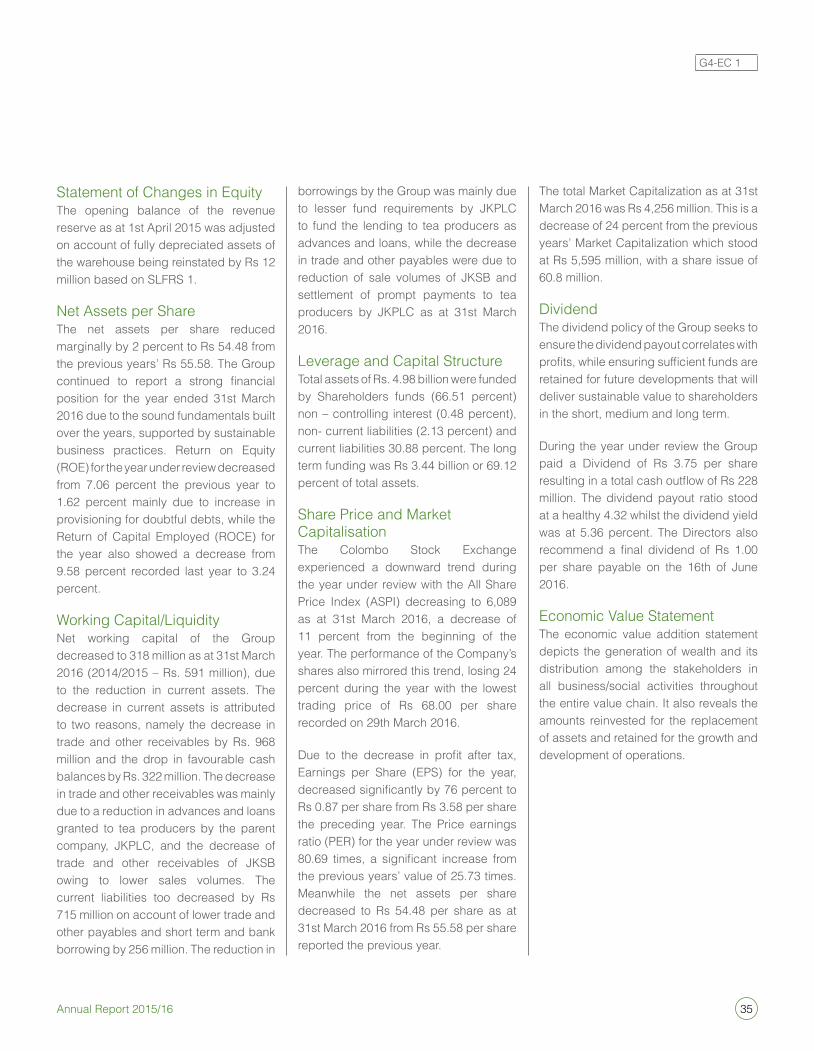
35Annual Report 2015/16
statement of Changes in equityThe opening balance of the revenue reserve as at 1st april 2015 was adjusted on account of fully depreciated assets of the warehouse being reinstated by Rs 12 million based on sLFRs 1.
net assets per share The net assets per share reduced marginally by 2 percent to Rs 54.48 from the previous years’ Rs 55.58. The Group continued to report a strong financial position for the year ended 31st March 2016 due to the sound fundamentals built over the years, supported by sustainable business practices. Return on equity (Roe) for the year under review decreased from 7.06 percent the previous year to 1.62 percent mainly due to increase in provisioning for doubtful debts, while the Return of Capital employed (RoCe) for the year also showed a decrease from 9.58 percent recorded last year to 3.24 percent.
Working Capital/Liquiditynet working capital of the Group decreased to 318 million as at 31st March 2016 (2014/2015 – Rs. 591 million), due to the reduction in current assets. The decrease in current assets is attributed to two reasons, namely the decrease in trade and other receivables by Rs. 968 million and the drop in favourable cash balances by Rs. 322 million. The decrease in trade and other receivables was mainly due to a reduction in advances and loans granted to tea producers by the parent company, JKPLC, and the decrease of trade and other receivables of JKsB owing to lower sales volumes. The current liabilities too decreased by Rs 715 million on account of lower trade and other payables and short term and bank borrowing by 256 million. The reduction in
borrowings by the Group was mainly due to lesser fund requirements by JKPLC to fund the lending to tea producers as advances and loans, while the decrease in trade and other payables were due to reduction of sale volumes of JKsB and settlement of prompt payments to tea producers by JKPLC as at 31st March 2016.
Leverage and Capital structureTotal assets of Rs. 4.98 billion were funded by shareholders funds (66.51 percent) non – controlling interest (0.48 percent), non- current liabilities (2.13 percent) and current liabilities 30.88 percent. The long term funding was Rs 3.44 billion or 69.12 percent of total assets.
share Price and Market CapitalisationThe Colombo stock exchange experienced a downward trend during the year under review with the all share Price index (asPi) decreasing to 6,089 as at 31st March 2016, a decrease of 11 percent from the beginning of the year. The performance of the Company’s shares also mirrored this trend, losing 24 percent during the year with the lowest trading price of Rs 68.00 per share recorded on 29th March 2016.
Due to the decrease in profit after tax, earnings per share (ePs) for the year, decreased significantly by 76 percent to Rs 0.87 per share from Rs 3.58 per share the preceding year. The Price earnings ratio (PeR) for the year under review was 80.69 times, a significant increase from the previous years’ value of 25.73 times. Meanwhile the net assets per share decreased to Rs 54.48 per share as at 31st March 2016 from Rs 55.58 per share reported the previous year.
The total Market Capitalization as at 31st March 2016 was Rs 4,256 million. This is a decrease of 24 percent from the previous years’ Market Capitalization which stood at Rs 5,595 million, with a share issue of 60.8 million.
DividendThe dividend policy of the Group seeks to ensure the dividend payout correlates with profits, while ensuring sufficient funds are retained for future developments that will deliver sustainable value to shareholders in the short, medium and long term.
During the year under review the Group paid a Dividend of Rs 3.75 per share resulting in a total cash outflow of Rs 228 million. The dividend payout ratio stood at a healthy 4.32 whilst the dividend yield was at 5.36 percent. The Directors also recommend a final dividend of Rs 1.00 per share payable on the 16th of June 2016.
economic Value statementThe economic value addition statement depicts the generation of wealth and its distribution among the stakeholders in all business/social activities throughout the entire value chain. it also reveals the amounts reinvested for the replacement of assets and retained for the growth and development of operations.
G4-eC 1
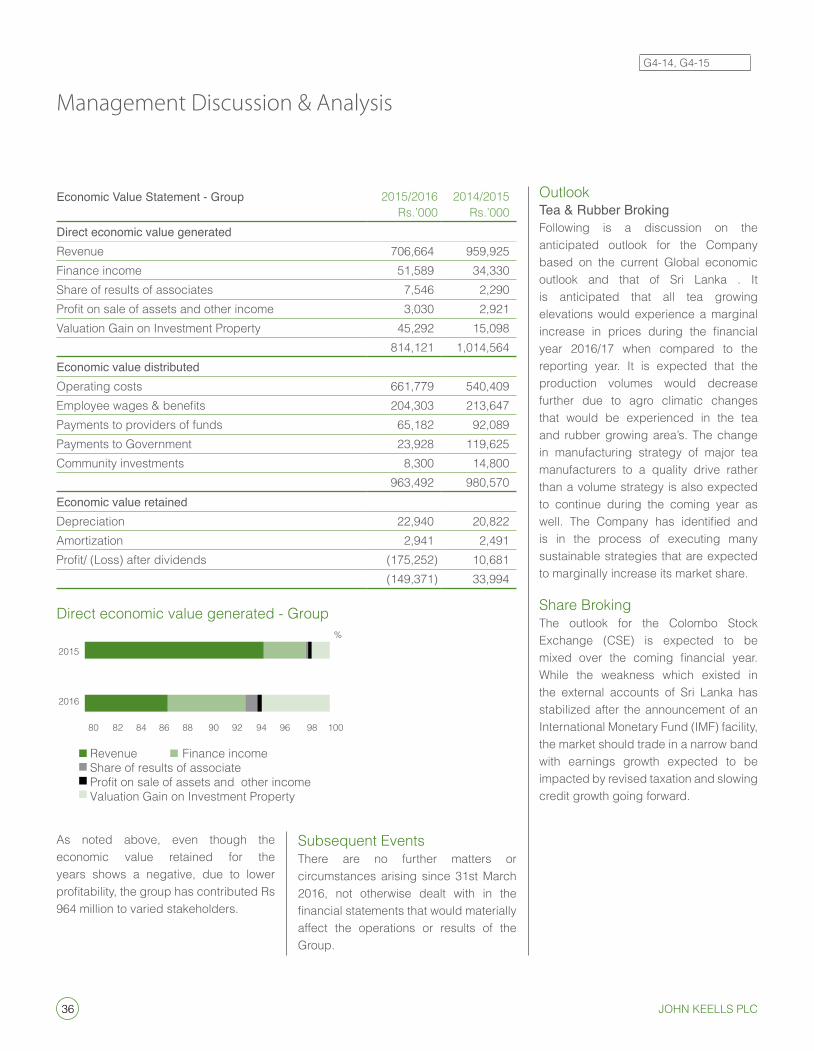
36 John Keells PlC
Management Discussion & Analysis
Economic Value Statement - Group 2015/2016Rs.’000
2014/2015Rs.’000
Direct economic value generatedRevenue 706,664 959,925 Finance income 51,589 34,330 share of results of associates 7,546 2,290 Profit on sale of assets and other income 3,030 2,921 Valuation Gain on investment Property 45,292 15,098 814,121 1,014,564 Economic value distributed operating costs 661,779 540,409 Employee wages & benefits 204,303 213,647 Payments to providers of funds 65,182 92,089 Payments to Government 23,928 119,625 Community investments 8,300 14,800 963,492 980,570 Economic value retained Depreciation 22,940 20,822 amortization 2,941 2,491 Profit/ (Loss) after dividends (175,252) 10,681
(149,371) 33,994
as noted above, even though the economic value retained for the years shows a negative, due to lower profitability, the group has contributed Rs 964 million to varied stakeholders.
subsequent eventsThere are no further matters or circumstances arising since 31st March 2016, not otherwise dealt with in the financial statements that would materially affect the operations or results of the Group.
outlookTea & Rubber BrokingFollowing is a discussion on the anticipated outlook for the Company based on the current Global economic outlook and that of sri Lanka . it is anticipated that all tea growing elevations would experience a marginal increase in prices during the financial year 2016/17 when compared to the reporting year. it is expected that the production volumes would decrease further due to agro climatic changes that would be experienced in the tea and rubber growing area’s. The change in manufacturing strategy of major tea manufacturers to a quality drive rather than a volume strategy is also expected to continue during the coming year as well. The Company has identified and is in the process of executing many sustainable strategies that are expected to marginally increase its market share.
share BrokingThe outlook for the Colombo stock exchange (Cse) is expected to be mixed over the coming financial year. While the weakness which existed in the external accounts of sri Lanka has stabilized after the announcement of an international Monetary Fund (iMF) facility, the market should trade in a narrow band with earnings growth expected to be impacted by revised taxation and slowing credit growth going forward.
Direct economic value generated - Group
Revenue Finance income Share of results of associate Profit on sale of assets and other income Valuation Gain on Investment Property
2016
8280 84 86 88 90 92 94 96 98 100
2015
%
G4-14, G4-15
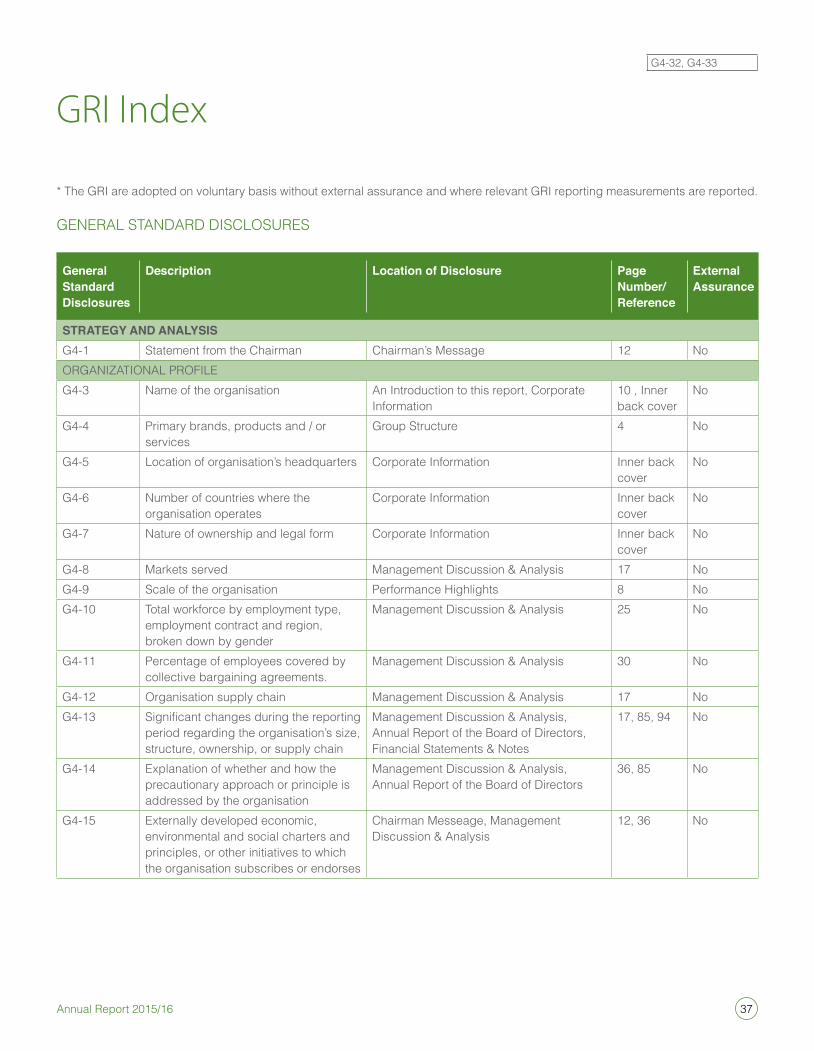
37Annual Report 2015/16
GRI Index
* The GRI are adopted on voluntary basis without external assurance and where relevant GRI reporting measurements are reported.
GeneRaL sTanDaRD DisCLosuRes
General Standard Disclosures
Description Location of Disclosure Page Number/ Reference
External Assurance
STRATEGY AND ANALYSISG4-1 statement from the Chairman Chairman’s Message 12 nooRGaniZaTionaL PRoFiLeG4-3 name of the organisation an introduction to this report, Corporate
information10 , inner back cover
no
G4-4 Primary brands, products and / or services
Group structure 4 no
G4-5 Location of organisation’s headquarters Corporate information inner back cover
no
G4-6 number of countries where the organisation operates
Corporate information inner back cover
no
G4-7 nature of ownership and legal form Corporate information inner back cover
no
G4-8 Markets served Management Discussion & analysis 17 noG4-9 scale of the organisation Performance Highlights 8 noG4-10 Total workforce by employment type,
employment contract and region, broken down by gender
Management Discussion & analysis 25 no
G4-11 Percentage of employees covered by collective bargaining agreements.
Management Discussion & analysis 30 no
G4-12 organisation supply chain Management Discussion & analysis 17 noG4-13 Significant changes during the reporting
period regarding the organisation’s size, structure, ownership, or supply chain
Management Discussion & analysis, annual Report of the Board of Directors, Financial statements & notes
17, 85, 94 no
G4-14 explanation of whether and how the precautionary approach or principle is addressed by the organisation
Management Discussion & analysis, annual Report of the Board of Directors
36, 85 no
G4-15 externally developed economic, environmental and social charters and principles, or other initiatives to which the organisation subscribes or endorses
Chairman Messeage, Management Discussion & analysis
12, 36 no
G4-32, G4-33
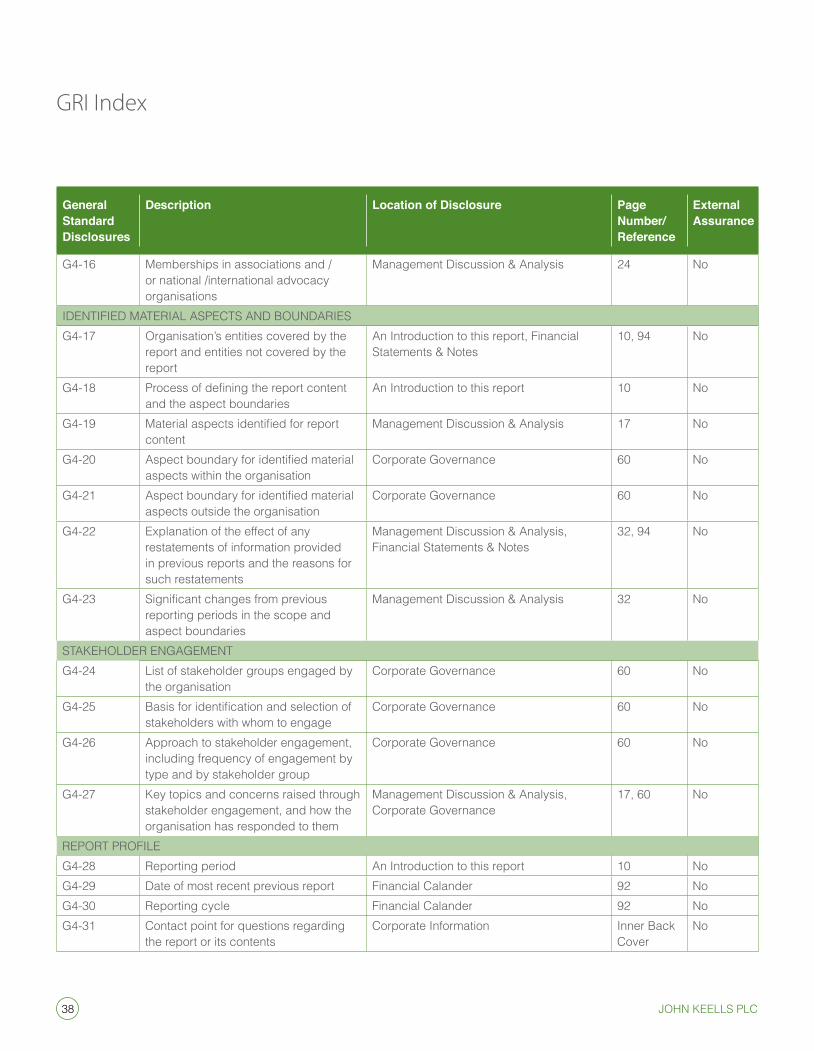
38 John Keells PlC
GRI Index
General Standard Disclosures
Description Location of Disclosure Page Number/ Reference
External Assurance
G4-16 Memberships in associations and / or national /international advocacy organisations
Management Discussion & analysis 24 no
iDenTiFieD MaTeRiaL asPeCTs anD BounDaRiesG4-17 organisation’s entities covered by the
report and entities not covered by the report
an introduction to this report, Financial statements & notes
10, 94 no
G4-18 Process of defining the report content and the aspect boundaries
an introduction to this report 10 no
G4-19 Material aspects identified for report content
Management Discussion & analysis 17 no
G4-20 Aspect boundary for identified material aspects within the organisation
Corporate Governance 60 no
G4-21 Aspect boundary for identified material aspects outside the organisation
Corporate Governance 60 no
G4-22 explanation of the effect of any restatements of information provided in previous reports and the reasons for such restatements
Management Discussion & analysis, Financial statements & notes
32, 94 no
G4-23 Significant changes from previous reporting periods in the scope and aspect boundaries
Management Discussion & analysis 32 no
sTaKeHoLDeR enGaGeMenTG4-24 List of stakeholder groups engaged by
the organisationCorporate Governance 60 no
G4-25 Basis for identification and selection of stakeholders with whom to engage
Corporate Governance 60 no
G4-26 approach to stakeholder engagement, including frequency of engagement by type and by stakeholder group
Corporate Governance 60 no
G4-27 Key topics and concerns raised through stakeholder engagement, and how the organisation has responded to them
Management Discussion & analysis, Corporate Governance
17, 60 no
RePoRT PRoFiLeG4-28 Reporting period an introduction to this report 10 noG4-29 Date of most recent previous report Financial Calander 92 noG4-30 Reporting cycle Financial Calander 92 noG4-31 Contact point for questions regarding
the report or its contentsCorporate information inner Back
Coverno
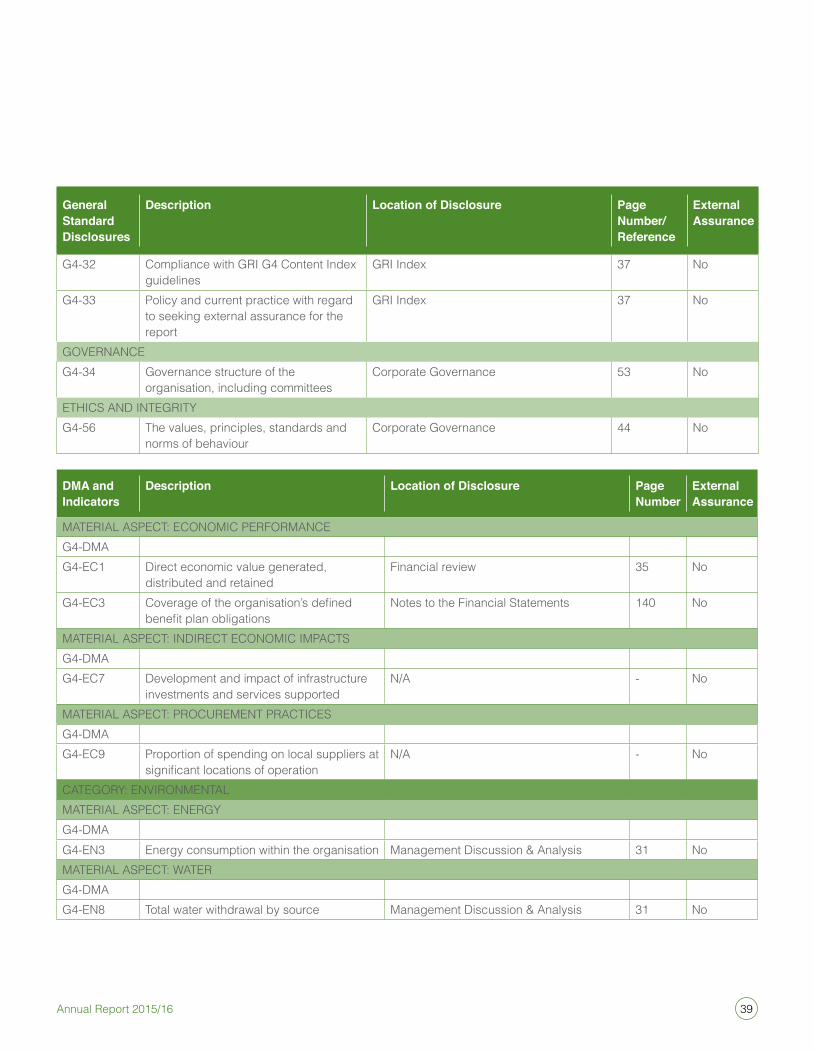
39Annual Report 2015/16
General Standard Disclosures
Description Location of Disclosure Page Number/ Reference
External Assurance
G4-32 Compliance with GRi G4 Content index guidelines
GRi index 37 no
G4-33 Policy and current practice with regard to seeking external assurance for the report
GRi index 37 no
GoVeRnanCeG4-34 Governance structure of the
organisation, including committeesCorporate Governance 53 no
eTHiCs anD inTeGRiTYG4-56 The values, principles, standards and
norms of behaviourCorporate Governance 44 no
DMA and Indicators
Description Location of Disclosure Page Number
External Assurance
MaTeRiaL asPeCT: eConoMiC PeRFoRManCeG4-DMaG4-eC1 Direct economic value generated,
distributed and retainedFinancial review 35 no
G4-eC3 Coverage of the organisation’s defined benefit plan obligations
notes to the Financial statements 140 no
MaTeRiaL asPeCT: inDiReCT eConoMiC iMPaCTsG4-DMaG4-eC7 Development and impact of infrastructure
investments and services supportedn/a - no
MaTeRiaL asPeCT: PRoCuReMenT PRaCTiCesG4-DMaG4-eC9 Proportion of spending on local suppliers at
significant locations of operationn/a - no
CaTeGoRY: enViRonMenTaLMaTeRiaL asPeCT: eneRGYG4-DMaG4-en3 energy consumption within the organisation Management Discussion & analysis 31 noMaTeRiaL asPeCT: WaTeRG4-DMaG4-en8 Total water withdrawal by source Management Discussion & analysis 31 no
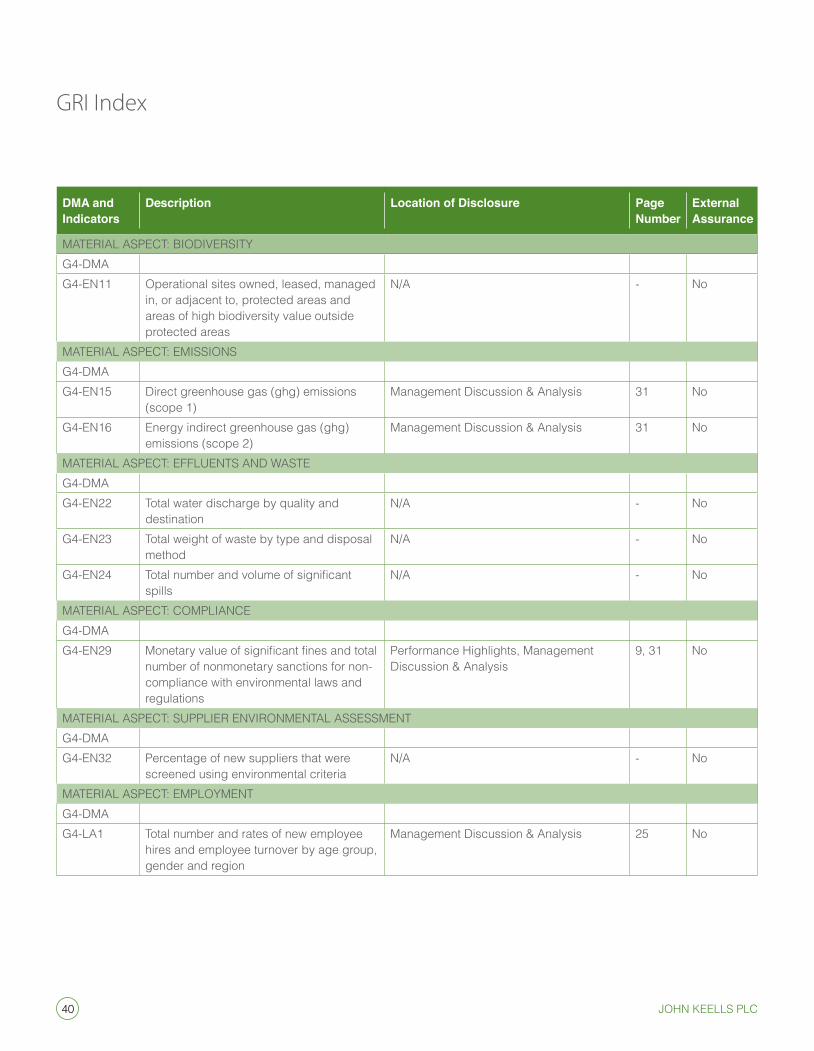
40 John Keells PlC
GRI Index
DMA and Indicators
Description Location of Disclosure Page Number
External Assurance
MaTeRiaL asPeCT: BioDiVeRsiTYG4-DMaG4-en11 operational sites owned, leased, managed
in, or adjacent to, protected areas and areas of high biodiversity value outside protected areas
n/a - no
MaTeRiaL asPeCT: eMissionsG4-DMaG4-en15 Direct greenhouse gas (ghg) emissions
(scope 1)Management Discussion & analysis 31 no
G4-en16 energy indirect greenhouse gas (ghg) emissions (scope 2)
Management Discussion & analysis 31 no
MaTeRiaL asPeCT: eFFLuenTs anD WasTeG4-DMaG4-en22 Total water discharge by quality and
destinationn/a - no
G4-en23 Total weight of waste by type and disposal method
n/a - no
G4-en24 Total number and volume of significant spills
n/a - no
MaTeRiaL asPeCT: CoMPLianCeG4-DMaG4-en29 Monetary value of significant fines and total
number of nonmonetary sanctions for non-compliance with environmental laws and regulations
Performance Highlights, Management Discussion & analysis
9, 31 no
MaTeRiaL asPeCT: suPPLieR enViRonMenTaL assessMenTG4-DMaG4-en32 Percentage of new suppliers that were
screened using environmental criterian/a - no
MaTeRiaL asPeCT: eMPLoYMenTG4-DMaG4-La1 Total number and rates of new employee
hires and employee turnover by age group, gender and region
Management Discussion & analysis 25 no
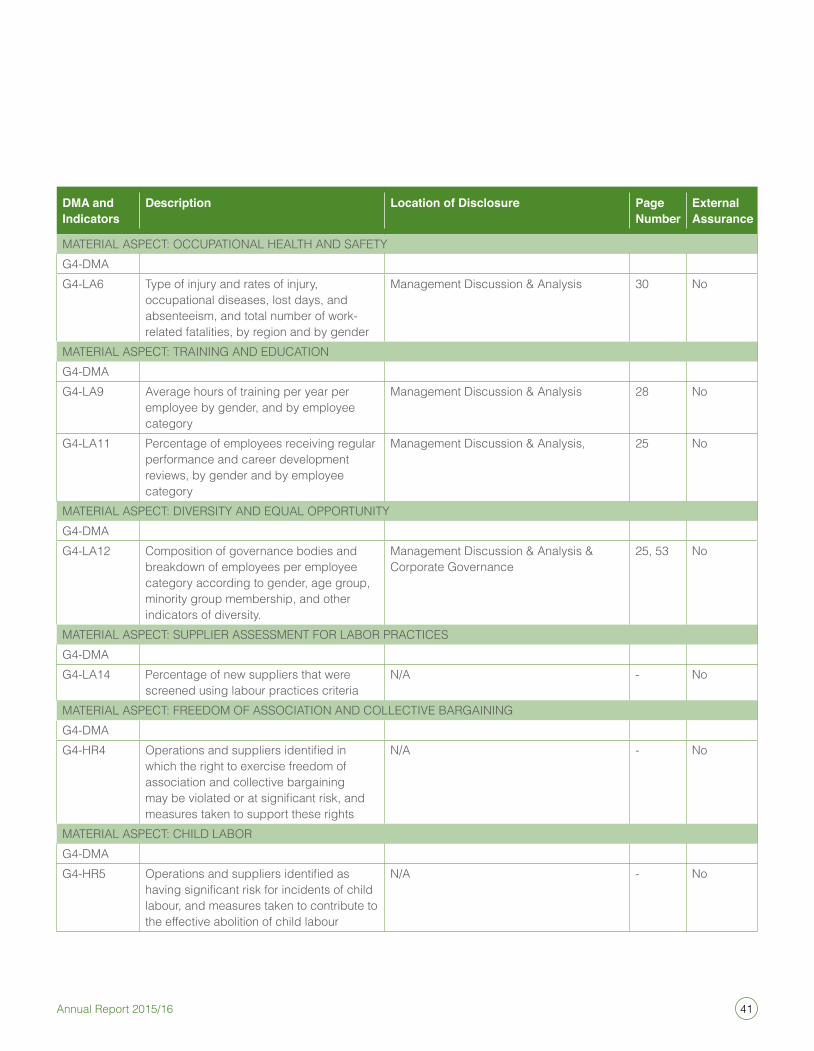
41Annual Report 2015/16
DMA and Indicators
Description Location of Disclosure Page Number
External Assurance
MaTeRiaL asPeCT: oCCuPaTionaL HeaLTH anD saFeTYG4-DMaG4-La6 Type of injury and rates of injury,
occupational diseases, lost days, and absenteeism, and total number of work-related fatalities, by region and by gender
Management Discussion & analysis 30 no
MaTeRiaL asPeCT: TRaininG anD eDuCaTionG4-DMaG4-La9 average hours of training per year per
employee by gender, and by employee category
Management Discussion & analysis 28 no
G4-La11 Percentage of employees receiving regular performance and career development reviews, by gender and by employee category
Management Discussion & analysis, 25 no
MaTeRiaL asPeCT: DiVeRsiTY anD eQuaL oPPoRTuniTYG4-DMaG4-La12 Composition of governance bodies and
breakdown of employees per employee category according to gender, age group, minority group membership, and other indicators of diversity.
Management Discussion & analysis & Corporate Governance
25, 53 no
MaTeRiaL asPeCT: suPPLieR assessMenT FoR LaBoR PRaCTiCesG4-DMaG4-La14 Percentage of new suppliers that were
screened using labour practices criterian/a - no
MaTeRiaL asPeCT: FReeDoM oF assoCiaTion anD CoLLeCTiVe BaRGaininGG4-DMaG4-HR4 Operations and suppliers identified in
which the right to exercise freedom of association and collective bargaining may be violated or at significant risk, and measures taken to support these rights
n/a - no
MaTeRiaL asPeCT: CHiLD LaBoRG4-DMaG4-HR5 Operations and suppliers identified as
having significant risk for incidents of child labour, and measures taken to contribute to the effective abolition of child labour
n/a - no
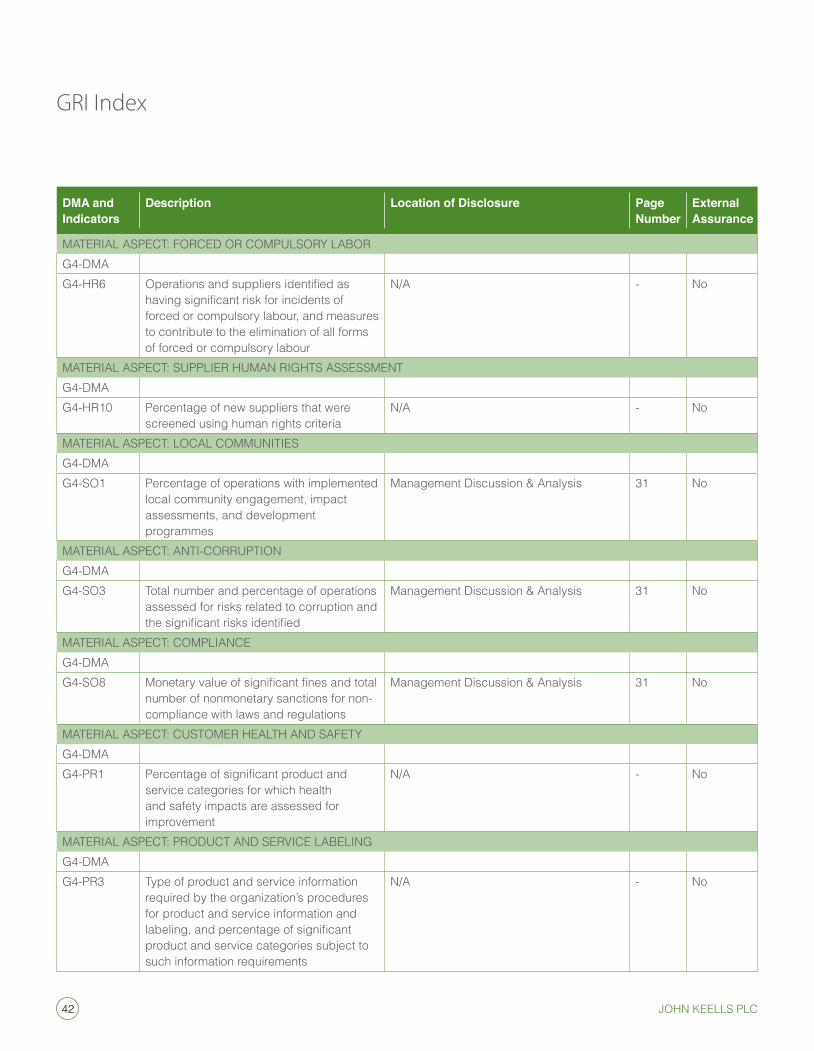
42 John Keells PlC
GRI Index
DMA and Indicators
Description Location of Disclosure Page Number
External Assurance
MaTeRiaL asPeCT: FoRCeD oR CoMPuLsoRY LaBoRG4-DMaG4-HR6 Operations and suppliers identified as
having significant risk for incidents of forced or compulsory labour, and measures to contribute to the elimination of all forms of forced or compulsory labour
n/a - no
MaTeRiaL asPeCT: suPPLieR HuMan RiGHTs assessMenTG4-DMaG4-HR10 Percentage of new suppliers that were
screened using human rights criterian/a - no
MaTeRiaL asPeCT: LoCaL CoMMuniTiesG4-DMaG4-so1 Percentage of operations with implemented
local community engagement, impact assessments, and development programmes
Management Discussion & analysis 31 no
MaTeRiaL asPeCT: anTi-CoRRuPTionG4-DMaG4-so3 Total number and percentage of operations
assessed for risks related to corruption and the significant risks identified
Management Discussion & analysis 31 no
MaTeRiaL asPeCT: CoMPLianCeG4-DMaG4-so8 Monetary value of significant fines and total
number of nonmonetary sanctions for non-compliance with laws and regulations
Management Discussion & analysis 31 no
MaTeRiaL asPeCT: CusToMeR HeaLTH anD saFeTYG4-DMaG4-PR1 Percentage of significant product and
service categories for which health and safety impacts are assessed for improvement
n/a - no
MaTeRiaL asPeCT: PRoDuCT anD seRViCe LaBeLinGG4-DMaG4-PR3 Type of product and service information
required by the organization’s procedures for product and service information and labeling, and percentage of significant product and service categories subject to such information requirements
n/a - no
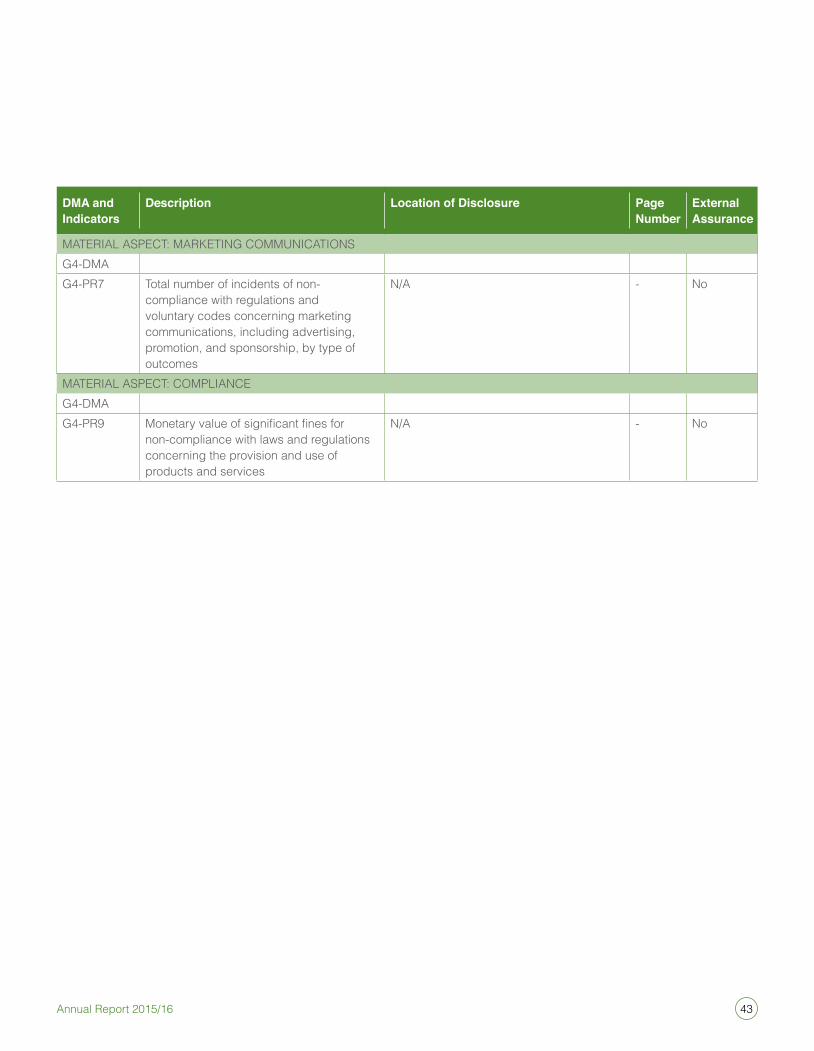
43Annual Report 2015/16
DMA and Indicators
Description Location of Disclosure Page Number
External Assurance
MaTeRiaL asPeCT: MaRKeTinG CoMMuniCaTionsG4-DMaG4-PR7 Total number of incidents of non-
compliance with regulations and voluntary codes concerning marketing communications, including advertising, promotion, and sponsorship, by type of outcomes
n/a - no
MaTeRiaL asPeCT: CoMPLianCeG4-DMaG4-PR9 Monetary value of significant fines for
non-compliance with laws and regulations concerning the provision and use of products and services
n/a - no
44 John Keells PlC
Corporate Governance
Key actions taken in financial year 2015/2016 to enhance John Keells PLC Corporate governance:
august Board audit committee (BaC) was presented with the iT governance framework on the new advance process system
october The advance process presented to the BaC went on live enhancing governance among John Keells PLC clients
november Business Continuity and disaster recovery testing was carried out for all critical business processes.
December Formally included sexual orientation and Gender identity to the company’s non-discrimination policy and code of conduct.
January John Keells PLC BaC introduced a check list for BaC meetings to ensure compliance with John Keells PLC compliance and governance framework
John Keells PLC introduced an online system to check real time pricing for the key clients
in the performance of their official duties. The behavior of the senior management group is monitored through an annual 360 degree feedback programme. as a subsidiary of John Keells Holdings PLC (JKH) - the ultimate parent company, the Company displays these values and policies in its day-to-day activities as a fundamental requirement at all times, following the best practices of the parent company.
it is against this backdrop that John Keells PLC is pleased to state that it is fully compliant with the mandatory provisions of the Companies act no. 07 of 2007, Listing rules of the Colombo stock exchange (“Cse”) and rules of the securities and exchange Commission of sri Lanka (“seC”) and our practices are in line with the Code of Best Practices on Corporate Governance (‘Code’) jointly issued by the seC and the institute of Chartered accountants of sri Lanka (“Ca sri Lanka”). The system is continuously reviewed to provide transparency and accountability.
The Group is committed to the highest standards of business integrity, ethical values and professionalism in all its activities towards rewarding all its stakeholders with greater creation of value, year-on-year. our governance framework which has been communicated to all levels of Management and staff in individual functional units is based on the following
• The Board is responsible to the shareholders to fulfil its stewardship obligations, in the best interest of the Group and its stakeholders.
“The Success of the Company relies on its proven track record in upholding high standards of corporate governance and the Board of John Keells PLC is committed to ensure that the governance, policies and processes are sufficiently robust and relevant in a fast changing operating environment.”
This report provides an insight how John Keells PLC discharges this key responsibility.
John Keells PLC (JKL), its subsidiary companies John Keells Warehousing (Pvt) Ltd (JKWL), John Keells stock Brokers (Pvt) Ltd (JKsB) & associate company Keells Realtors Limited (KRL) referred to as the “Group”, has a Corporate Governance philosophy founded to maintain the highest level of transparency when reporting on both
financial and non-financial compliances which has facilitated and enhanced the trust stakeholders have in the Group. The Group has been structured and controlled internally through a process of continuous review in facilitating the observance of the key principles of corporate governance to succeed in today’s competitive business environments.
Whilst the Group is governed by an internal process which ensures integrity and professionalism in all its activities and relationships, ethical values are also lived through every day in a constant effort to set high standards of social responsibility. This philosophy has been ingrained through the Group by means of a strong set of corporate values and a formal Code of Conduct and all employees, senior management and the Board of Directors are required to embrace this philosophy
G4-56
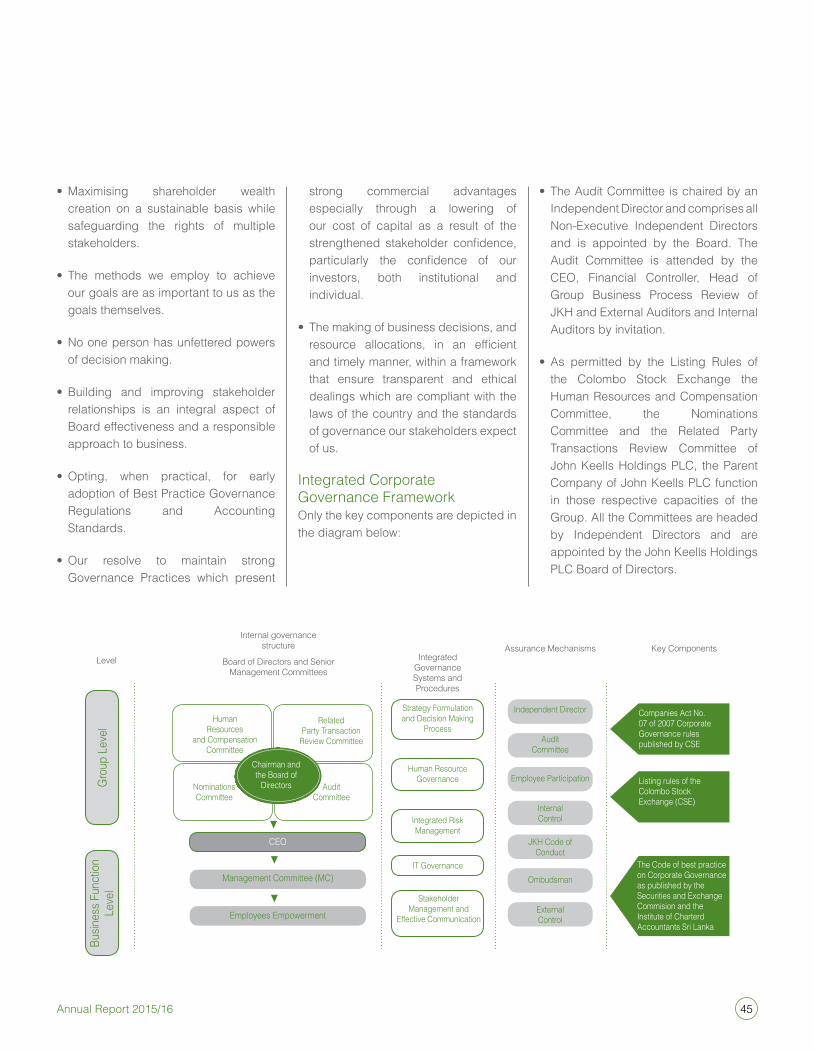
45Annual Report 2015/16
• Maximising shareholder wealth creation on a sustainable basis while safeguarding the rights of multiple stakeholders.
• The methods we employ to achieve our goals are as important to us as the goals themselves.
• No one person has unfettered powers of decision making.
• Building and improving stakeholder relationships is an integral aspect of Board effectiveness and a responsible approach to business.
• Opting, when practical, for early adoption of Best Practice Governance Regulations and accounting standards.
• Our resolve to maintain strong Governance Practices which present
strong commercial advantages especially through a lowering of our cost of capital as a result of the strengthened stakeholder confidence, particularly the confidence of our investors, both institutional and individual.
• The making of business decisions, and resource allocations, in an efficient and timely manner, within a framework that ensure transparent and ethical dealings which are compliant with the laws of the country and the standards of governance our stakeholders expect of us.
integrated Corporate Governance Frameworkonly the key components are depicted in the diagram below:
• The Audit Committee is chaired by an independent Director and comprises all non-executive independent Directors and is appointed by the Board. The audit Committee is attended by the Ceo, Financial Controller, Head of Group Business Process Review of JKH and external auditors and internal auditors by invitation.
• As permitted by the Listing Rules of the Colombo stock exchange the Human Resources and Compensation Committee, the nominations Committee and the Related Party Transactions Review Committee of John Keells Holdings PLC, the Parent Company of John Keells PLC function in those respective capacities of the Group. all the Committees are headed by independent Directors and are appointed by the John Keells Holdings PLC Board of Directors.
strategy Formulation and Decision Making
Process
Human Resource Governance
integrated Risk Management
stakeholder Management and
effective Communication
iT Governance
Ceo
Management Committee (MC)
employees empowerment
Grou
p Le
vel
Busin
ess F
unct
ion
Leve
l
HumanResources
and Compensation Committee
nominations Committee
auditCommittee
Related Party Transaction
Review Committee
Level
internal governance structure assurance Mechanisms
integrated Governance systems and Procedures
Key ComponentsBoard of Directors and senior
Management Committees
independent Director
audit Committee
employee Participation
internal Control
JKH Code of Conduct
ombudsman
external Control
Companies act no. 07 of 2007 Corporate Governance rules published by Cse
Listing rules of the Colombo stock exchange (Cse)
The Code of best practice on Corporate Governance as published by the securities and exchange Commision and the institute of Charterd accountants sri Lanka
Chairman and the Board of
Directors
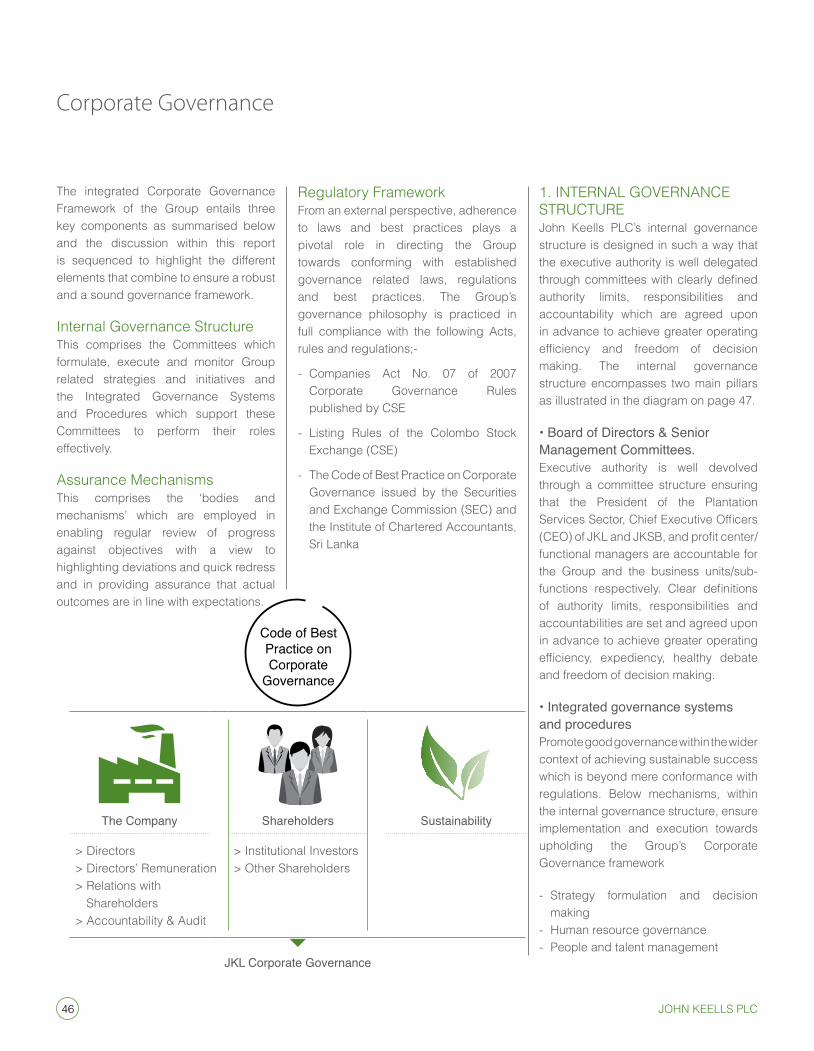
46 John Keells PlC
Corporate Governance
The integrated Corporate Governance Framework of the Group entails three key components as summarised below and the discussion within this report is sequenced to highlight the different elements that combine to ensure a robust and a sound governance framework.
internal Governance structureThis comprises the Committees which formulate, execute and monitor Group related strategies and initiatives and the integrated Governance systems and Procedures which support these Committees to perform their roles effectively.
assurance MechanismsThis comprises the ‘bodies and mechanisms’ which are employed in enabling regular review of progress against objectives with a view to highlighting deviations and quick redress and in providing assurance that actual outcomes are in line with expectations.
Regulatory FrameworkFrom an external perspective, adherence to laws and best practices plays a pivotal role in directing the Group towards conforming with established governance related laws, regulations and best practices. The Group’s governance philosophy is practiced in full compliance with the following acts, rules and regulations;-
- Companies act no. 07 of 2007 Corporate Governance Rules published by Cse
- Listing Rules of the Colombo stock exchange (Cse)
- The Code of Best Practice on Corporate Governance issued by the securities and exchange Commission (seC) and the institute of Chartered accountants, sri Lanka
1. inTeRnaL GoVeRnanCe sTRuCTuReJohn Keells PLC’s internal governance structure is designed in such a way that the executive authority is well delegated through committees with clearly defined authority limits, responsibilities and accountability which are agreed upon in advance to achieve greater operating efficiency and freedom of decision making. The internal governance structure encompasses two main pillars as illustrated in the diagram on page 47.
• Board of Directors & Senior Management Committees.executive authority is well devolved through a committee structure ensuring that the President of the Plantation Services Sector, Chief Executive Officers (CEO) of JKL and JKSB, and profit center/functional managers are accountable for the Group and the business units/sub-functions respectively. Clear definitions of authority limits, responsibilities and accountabilities are set and agreed upon in advance to achieve greater operating efficiency, expediency, healthy debate and freedom of decision making.
• Integrated governance systems and procedures Promote good governance within the wider context of achieving sustainable success which is beyond mere conformance with regulations. Below mechanisms, within the internal governance structure, ensure implementation and execution towards upholding the Group’s Corporate Governance framework
- strategy formulation and decision making
- Human resource governance- People and talent management
The Company Shareholders Sustainability
> Directors> Directors’ Remuneration> Relations with
shareholders> accountability & audit
> institutional investors> other shareholders
JKL Corporate Governance
Code of Best Practice on Corporate
Governance
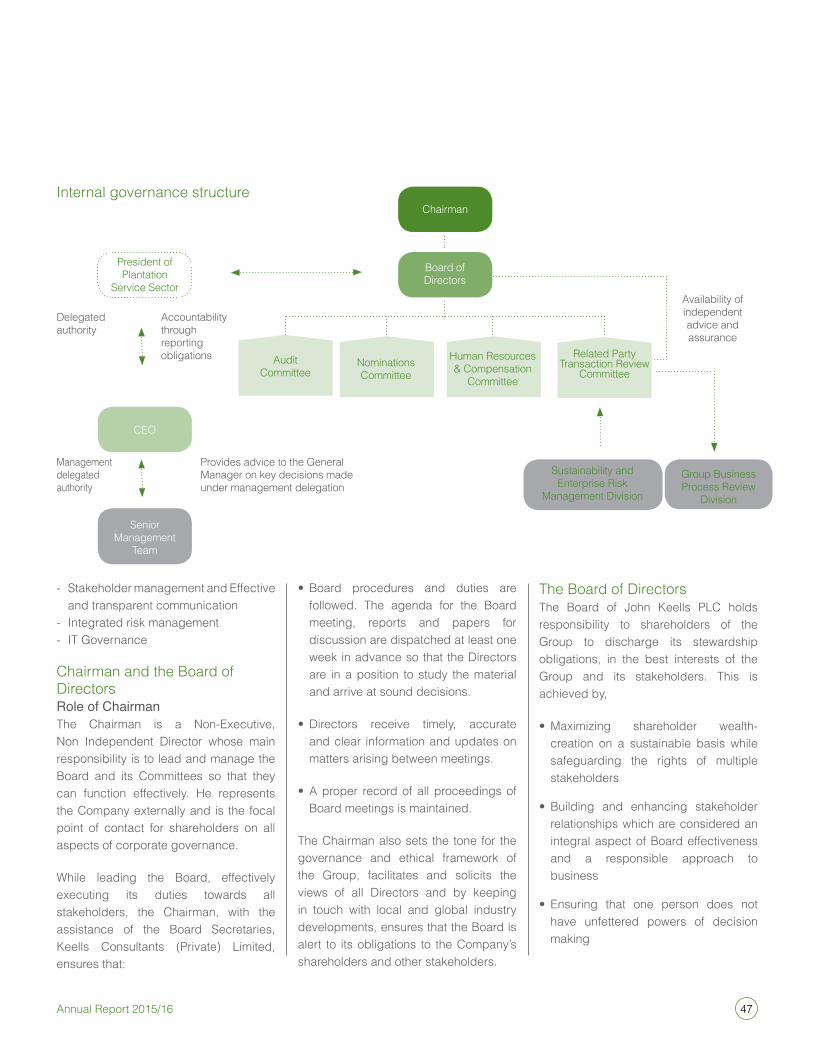
47Annual Report 2015/16
- stakeholder management and effective and transparent communication
- integrated risk management- iT Governance
Chairman and the Board of DirectorsRole of Chairman The Chairman is a non-executive, non independent Director whose main responsibility is to lead and manage the Board and its Committees so that they can function effectively. He represents the Company externally and is the focal point of contact for shareholders on all aspects of corporate governance.
While leading the Board, effectively executing its duties towards all stakeholders, the Chairman, with the assistance of the Board secretaries, Keells Consultants (Private) Limited, ensures that:
• Board procedures and duties are followed. The agenda for the Board meeting, reports and papers for discussion are dispatched at least one week in advance so that the Directors are in a position to study the material and arrive at sound decisions.
• Directors receive timely, accurate and clear information and updates on matters arising between meetings.
• A proper record of all proceedings of Board meetings is maintained.
The Chairman also sets the tone for the governance and ethical framework of the Group, facilitates and solicits the views of all Directors and by keeping in touch with local and global industry developments, ensures that the Board is alert to its obligations to the Company’s shareholders and other stakeholders.
The Board of DirectorsThe Board of John Keells PLC holds responsibility to shareholders of the Group to discharge its stewardship obligations, in the best interests of the Group and its stakeholders. This is achieved by,
• Maximizing shareholder wealth-creation on a sustainable basis while safeguarding the rights of multiple stakeholders
• Building and enhancing stakeholder relationships which are considered an integral aspect of Board effectiveness and a responsible approach to business
• Ensuring that one person does not have unfettered powers of decision making
Chairman
Ceo
Board of Directors
audit Committee
nominations Committee
Human Resources & Compensation
Committee
Related Party Transaction Review
Committee
President of Plantation
service sector
senior Management
Team
Group Business Process Review
Division
sustainability and enterprise Risk
Management Division
availability of independent advice and assurance
Provides advice to the General Manager on key decisions made under management delegation
accountability through reporting obligations
Delegated authority
Management delegated authority
internal governance structure
48 John Keells PlC
Corporate Governance
• Ensuring that the methods employed to achieve goals are as important as the goals themselves
• Making business decisions and resource allocations in an efficient and timely manner, within a framework that ensures transparent and ethical dealings which are compliant with the laws of the country
• Actively participating in discussions with the relevant regulatory bodies in the formation and implementation of governance regulations, accounting standards, and economic reforms.
• Opting for the early adoption of accounting standards and best practices in governance regulations, when practical.
• Resolving to maintain strong governance practices which result in strengthened stakeholder confidence, particularly that of both institutional and individual investors.
The Board of John Keells PLC has, subject to pre-defined limits, delegated its executive authority to the President of the Plantation services sector for the implementation of strategies approved by the Board and developing and recommending to the Board the business plans and budgets in keeping with group strategy.
Board responsibilities and decision rightsnotwithstanding the functioning of the Board Committees, the Board of Directors is collectively responsible for the decisions and actions taken. The John Keells Group Corporate Governance Framework expects the
Board of Directors to:
• Provide direction and guidance to the Company in the formulation of its high-level strategies, with emphasis on the medium and long term, in the pursuance of its sustainable development goals
• Reviewing and approving annual plans and longer term business plans
• Tracking actual progress against plans
• Reviewing HR processes with emphasis on top management succession planning
• Reviewing the performance of the executive Director
• Monitoring systems of governance and compliance
• Overseeing systems of internal control, risk management and establishing whistleblowing conduits
• Determining any changes to the discretions/authorities delegated from the Board to the executive levels
• Reviewing and approving major acquisitions, disposals and capital expenditure
• Approving any amendments to constitutional documents
• Adopting voluntarily, best practices where relevant and applicable.
Board composition and Director independenceat the last annual General Meeting (aGM) of John Keells PLC, held on 30th
June 2015, the Board consisted of seven Directors comprising of;
- Three non-executive, non-independent Directors, (neD/niD) including the Chairman
- Three non-executive, independent Directors (neD/iD)
- one executive, non-independent Director (eD/niD)
as at 31st March 2016 the Board comprised of,
- Four non-executive, non-independent Directors, (neD/niD) including the Chairman
- Three non-executive, independent Directors (neD/iD)
- one executive, non-independent Director (eD/niD)
in accordance with the criteria for “Independence” specified by section 7.10.4 of the listing rules of the Colombo Stock Exchange and as identified by the Code, the Board affirms that the aforesaid four non-executive independent Directors satisfy the criteria for independence and have satisfied the requirements under clause 7.10.2 (b).
The Board has determined that, although Mr. T de Zoysa and Ms. Y a Hansen have been members of the Board for a period exceeding 9 years and do not satisfy the “number of years on the Board” criteria, given all the circumstances, Mr. T de Zoysa and Ms. Y a Hansen are independent especially as they satisfy the other qualifying criteria in terms of independence.
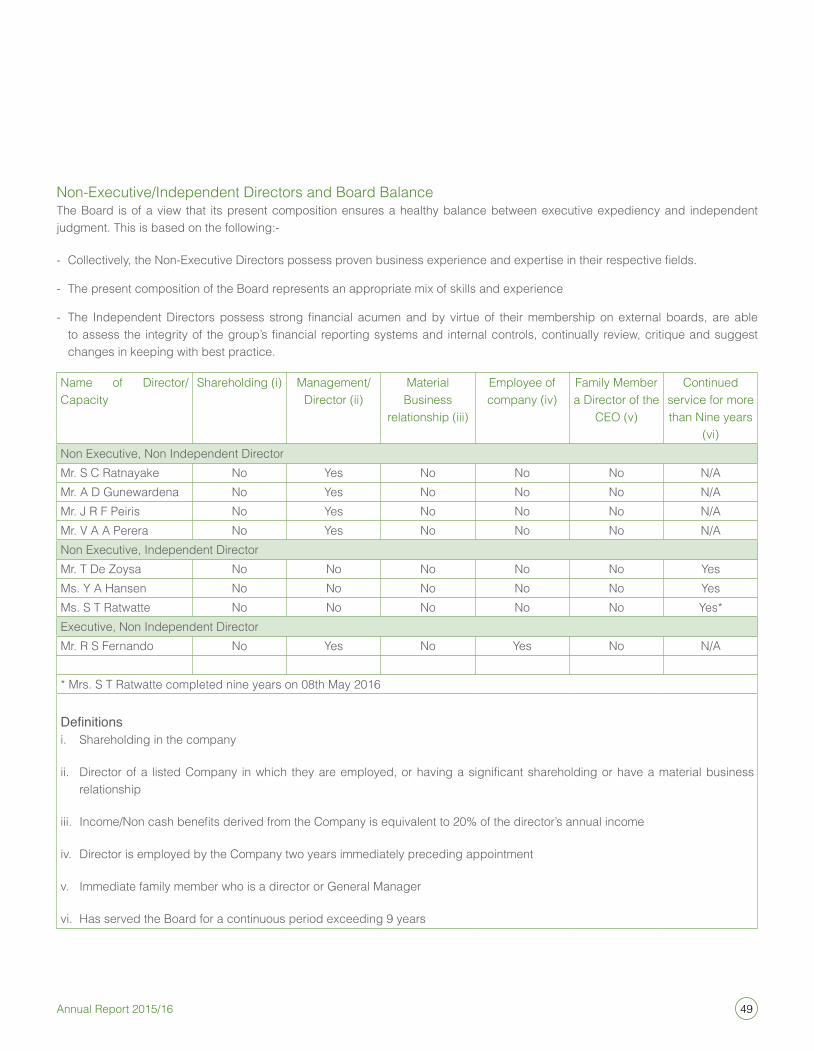
49Annual Report 2015/16
non-executive/independent Directors and Board BalanceThe Board is of a view that its present composition ensures a healthy balance between executive expediency and independent judgment. This is based on the following:-
- Collectively, the Non-Executive Directors possess proven business experience and expertise in their respective fields.
- The present composition of the Board represents an appropriate mix of skills and experience
- The Independent Directors possess strong financial acumen and by virtue of their membership on external boards, are able to assess the integrity of the group’s financial reporting systems and internal controls, continually review, critique and suggest changes in keeping with best practice.
name of Director/Capacity
shareholding (i) Management/ Director (ii)
Material Business
relationship (iii)
employee of company (iv)
Family Member a Director of the
Ceo (v)
Continued service for more than nine years
(vi)non executive, non independent DirectorMr. s C Ratnayake no Yes no no no n/aMr. a D Gunewardena no Yes no no no n/aMr. J R F Peiris no Yes no no no n/aMr. V a a Perera no Yes no no no n/anon executive, independent DirectorMr. T De Zoysa no no no no no YesMs. Y a Hansen no no no no no YesMs. s T Ratwatte no no no no no Yes*executive, non independent DirectorMr. R s Fernando no Yes no Yes no n/a
* Mrs. S T Ratwatte completed nine years on 08th May 2016
Definitionsi. shareholding in the company
ii. Director of a listed Company in which they are employed, or having a significant shareholding or have a material business relationship
iii. Income/Non cash benefits derived from the Company is equivalent to 20% of the director’s annual income
iv. Director is employed by the Company two years immediately preceding appointment
v. immediate family member who is a director or General Manager
vi. Has served the Board for a continuous period exceeding 9 years
50 John Keells PlC
Corporate Governance
Board tenure, retirement and re-election• The Executive Directors are appointed
and recommended for re-election subject to their prescribed Company retirement age whilst non-executive Directors are appointed and recommended for re-election subject to the age limit as per statutory provisions at the time of reappointment.
• The re-election of Directors ensures that shareholders have an opportunity to reassess the composition of the Board. The names of the Directors submitted for re-election are provided to the shareholders in advance to enable them to make an informed decision on their election.
access to independent professional advicein order to preserve the independence of the Board, and to strengthen the decision making, the Board seeks independent professional advice when deemed necessary.
accordingly, the Board obtains independent professional advice covering areas such as;
• Impacts on business operations of the current and emerging economic and geo-political shifts.
• Legal, tax and accounting aspects, particularly where independent external advice is deemed necessary in ensuring the integrity of the subject decision.
• Market surveys, architectural and engineering advisory services as necessary for business operations
• Actuarial valuation of retirement benefits and valuation of property including that of investment property.
• Information technology consultancy services pertaining to enterprise resource planning system, distributor management system or other major projects.
• Specific technical know-how and domain knowledge for identified project feasibilities and evaluations
additionally, individual Directors are encouraged to seek expert opinion and/or professional advice on matters where they may not have full knowledge or expertise.
Board meetingsRegularity of meetingThe Board meets at least, once every quarter. any absences are excused in advance and duly recorded in the minutes. The absent members are immediately briefed on the discussions and actions taken during the meeting.
Directors are provided with the necessary information well in advance (at least one week prior to the Board meeting) in order to facilitate more informed decision making. Board information packs supplied to the Directors include the Board Resolutions and other functional areas such as tax, human resources, treasury and corporate social responsibility. Dates and attendance of Board of Directors to the quarterly Board meetings is given on page 51.
Board skillsThe Directors at John Keells PLC who are profiled on page 14 and 15 of the annual report have a wide range of expertise as well as significant experience in commercial and financial activities enabling them to discharge their governance duties in an effective manner.
The Group is over conscious of the need to maintain an appropriate mix of skills and experience in the Board through a regular review of its composition in ensuring that the skills representation is in sync with current and future needs.
Conflicts of interest and independence each Director holds continuous responsibility to determine whether he or she has a potential or actual conflict of interest arising from external associations, interests or personal relationships in material matters which are considered by the Board from time to time.
Details of companies in which Board members hold board or board committee membership is available with the Company for inspection by shareholders on request. Refer Note 35 to the financial statements for details on related party transactions.
in order to mitigate any potential or actual conflict of interest or independence of directors throughout the term of their membership on the Board, the Company has adopted the following processes, which is given on page 51.
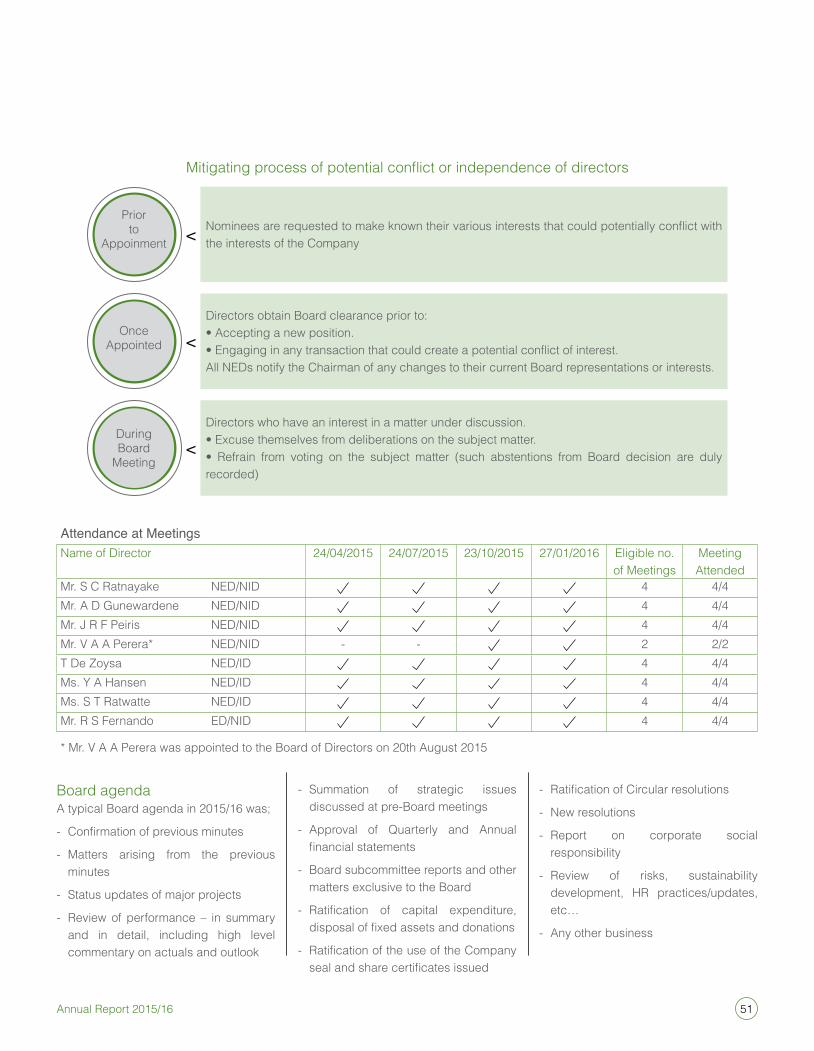
51Annual Report 2015/16
Attendance at Meetingsname of Director 24/04/2015 24/07/2015 23/10/2015 27/01/2016 eligible no.
of MeetingsMeeting attended
Mr. s C Ratnayake neD/niD 4 4/4Mr. a D Gunewardene neD/niD 4 4/4Mr. J R F Peiris neD/niD 4 4/4Mr. V A A Perera* neD/niD - - 2 2/2T De Zoysa neD/iD 4 4/4Ms. Y a Hansen neD/iD 4 4/4Ms. s T Ratwatte neD/iD 4 4/4Mr. R s Fernando eD/niD 4 4/4
* Mr. V A A Perera was appointed to the Board of Directors on 20th August 2015
Board agendaa typical Board agenda in 2015/16 was;
- Confirmation of previous minutes
- Matters arising from the previous minutes
- status updates of major projects
- Review of performance – in summary and in detail, including high level commentary on actuals and outlook
- summation of strategic issues discussed at pre-Board meetings
- approval of Quarterly and annual financial statements
- Board subcommittee reports and other matters exclusive to the Board
- Ratification of capital expenditure, disposal of fixed assets and donations
- Ratification of the use of the Company seal and share certificates issued
- Ratification of Circular resolutions
- new resolutions
- Report on corporate social responsibility
- Review of risks, sustainability development, HR practices/updates, etc…
- any other business
Prior to
appoinment < Nominees are requested to make known their various interests that could potentially conflict with the interests of the Company
once appointed <
Directors obtain Board clearance prior to:• Accepting a new position.• Engaging in any transaction that could create a potential conflict of interest.all neDs notify the Chairman of any changes to their current Board representations or interests.
During Board
Meeting<
Directors who have an interest in a matter under discussion.• Excuse themselves from deliberations on the subject matter.• Refrain from voting on the subject matter (such abstentions from Board decision are duly recorded)
Mitigating process of potential conflict or independence of directors
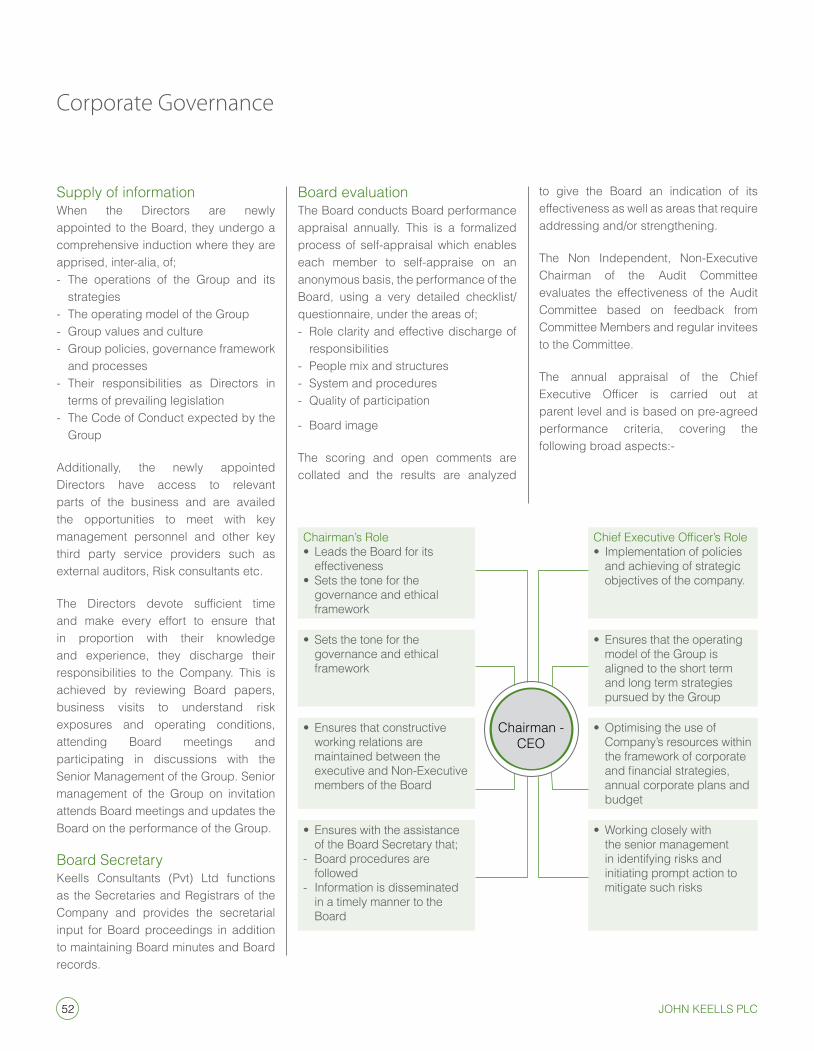
52 John Keells PlC
Corporate Governance
supply of informationWhen the Directors are newly appointed to the Board, they undergo a comprehensive induction where they are apprised, inter-alia, of;- The operations of the Group and its
strategies- The operating model of the Group- Group values and culture- Group policies, governance framework
and processes- Their responsibilities as Directors in
terms of prevailing legislation- The Code of Conduct expected by the
Group
additionally, the newly appointed Directors have access to relevant parts of the business and are availed the opportunities to meet with key management personnel and other key third party service providers such as external auditors, Risk consultants etc.
The Directors devote sufficient time and make every effort to ensure that in proportion with their knowledge and experience, they discharge their responsibilities to the Company. This is achieved by reviewing Board papers, business visits to understand risk exposures and operating conditions, attending Board meetings and participating in discussions with the senior Management of the Group. senior management of the Group on invitation attends Board meetings and updates the Board on the performance of the Group.
Board secretaryKeells Consultants (Pvt) Ltd functions as the secretaries and Registrars of the Company and provides the secretarial input for Board proceedings in addition to maintaining Board minutes and Board records.
Board evaluationThe Board conducts Board performance appraisal annually. This is a formalized process of self-appraisal which enables each member to self-appraise on an anonymous basis, the performance of the Board, using a very detailed checklist/ questionnaire, under the areas of;- Role clarity and effective discharge of
responsibilities- People mix and structures- system and procedures- Quality of participation
- Board image
The scoring and open comments are collated and the results are analyzed
to give the Board an indication of its effectiveness as well as areas that require addressing and/or strengthening.
The non independent, non-executive Chairman of the audit Committee evaluates the effectiveness of the audit Committee based on feedback from Committee Members and regular invitees to the Committee.
The annual appraisal of the Chief Executive Officer is carried out at parent level and is based on pre-agreed performance criteria, covering the following broad aspects:-
Chairman’s Role• Leads the Board for its
effectiveness• Sets the tone for the
governance and ethical framework
Chairman - Ceo
Chief Executive Officer’s Role• Implementation of policies
and achieving of strategic objectives of the company.
• Sets the tone for the governance and ethical framework
• Ensures that the operating model of the Group is aligned to the short term and long term strategies pursued by the Group
• Ensures that constructive working relations are maintained between the executive and non-executive members of the Board
• Optimising the use of Company’s resources within the framework of corporate and financial strategies, annual corporate plans and budget
• Ensures with the assistance of the Board secretary that;
- Board procedures are followed
- information is disseminated in a timely manner to the Board
• Working closely with the senior management in identifying risks and initiating prompt action to mitigate such risks
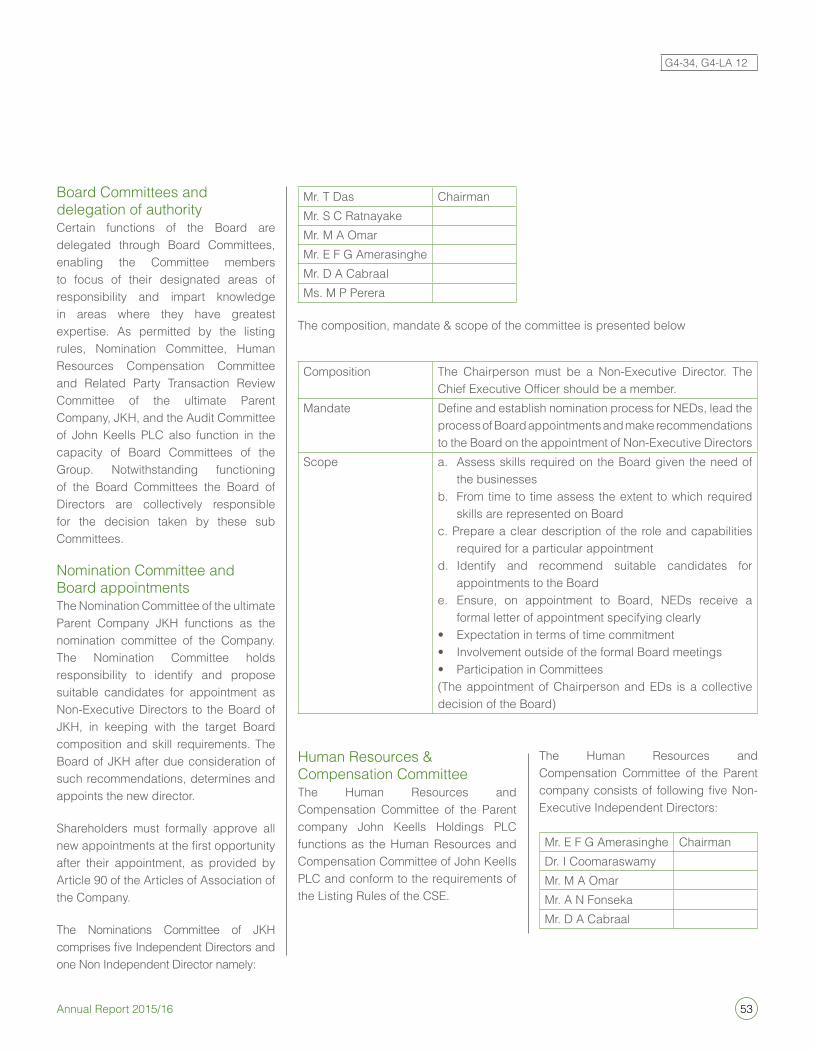
53Annual Report 2015/16
Board Committees and delegation of authority Certain functions of the Board are delegated through Board Committees, enabling the Committee members to focus of their designated areas of responsibility and impart knowledge in areas where they have greatest expertise. as permitted by the listing rules, nomination Committee, Human Resources Compensation Committee and Related Party Transaction Review Committee of the ultimate Parent Company, JKH, and the audit Committee of John Keells PLC also function in the capacity of Board Committees of the Group. notwithstanding functioning of the Board Committees the Board of Directors are collectively responsible for the decision taken by these sub Committees.
nomination Committee and Board appointmentsThe nomination Committee of the ultimate Parent Company JKH functions as the nomination committee of the Company. The nomination Committee holds responsibility to identify and propose suitable candidates for appointment as non-executive Directors to the Board of JKH, in keeping with the target Board composition and skill requirements. The Board of JKH after due consideration of such recommendations, determines and appoints the new director.
shareholders must formally approve all new appointments at the first opportunity after their appointment, as provided by article 90 of the articles of association of the Company.
The nominations Committee of JKH comprises five Independent Directors and one non independent Director namely:
Mr. T Das ChairmanMr. s C Ratnayake Mr. M a omar Mr. e F G amerasinghe Mr. D a Cabraal Ms. M P Perera
The composition, mandate & scope of the committee is presented below
Composition The Chairperson must be a non-executive Director. The Chief Executive Officer should be a member.
Mandate Define and establish nomination process for NEDs, lead the process of Board appointments and make recommendations to the Board on the appointment of non-executive Directors
scope a. assess skills required on the Board given the need of the businesses
b. From time to time assess the extent to which required skills are represented on Board
c. Prepare a clear description of the role and capabilities required for a particular appointment
d. identify and recommend suitable candidates for appointments to the Board
e. ensure, on appointment to Board, neDs receive a formal letter of appointment specifying clearly
• Expectation in terms of time commitment• Involvement outside of the formal Board meetings• Participation in Committees(The appointment of Chairperson and eDs is a collective decision of the Board)
Human Resources & Compensation CommitteeThe Human Resources and Compensation Committee of the Parent company John Keells Holdings PLC functions as the Human Resources and Compensation Committee of John Keells PLC and conform to the requirements of the Listing Rules of the Cse.
The Human Resources and Compensation Committee of the Parent company consists of following five Non-executive independent Directors:
Mr. e F G amerasinghe ChairmanDr. i Coomaraswamy Mr. M a omar Mr. a n FonsekaMr. D a Cabraal
G4-34, G4-La 12
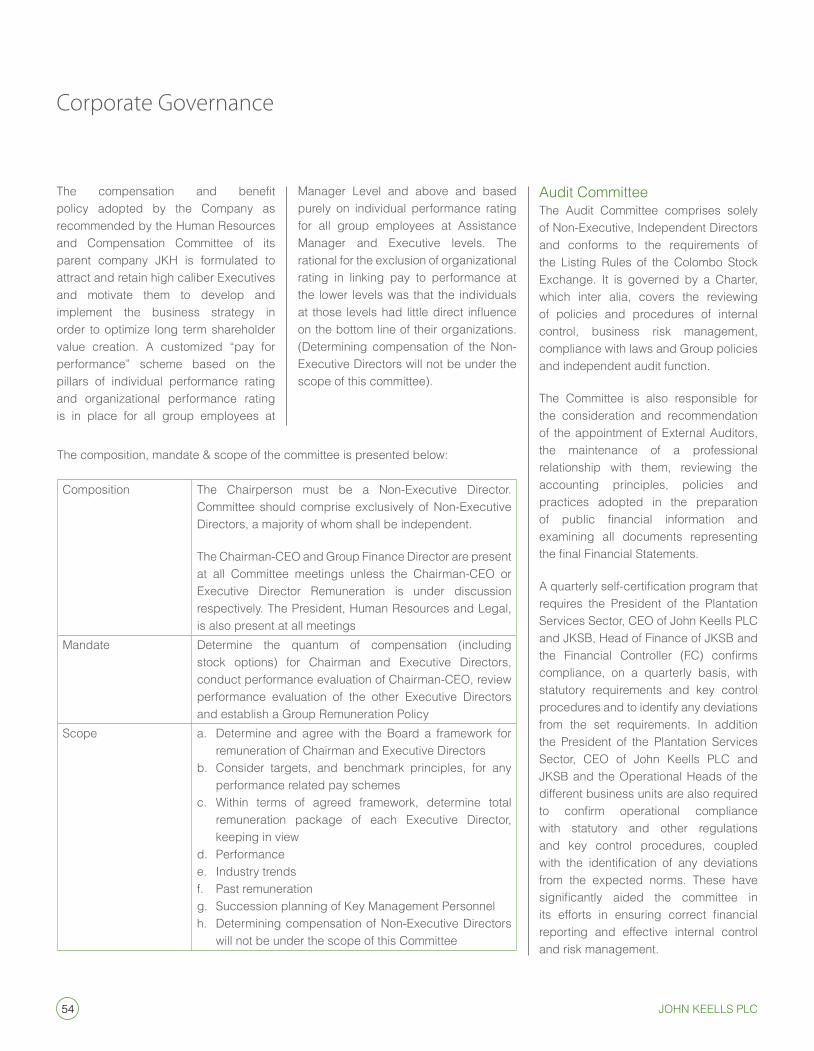
54 John Keells PlC
Corporate Governance
The compensation and benefit policy adopted by the Company as recommended by the Human Resources and Compensation Committee of its parent company JKH is formulated to attract and retain high caliber executives and motivate them to develop and implement the business strategy in order to optimize long term shareholder value creation. a customized “pay for performance” scheme based on the pillars of individual performance rating and organizational performance rating is in place for all group employees at
Manager Level and above and based purely on individual performance rating for all group employees at assistance Manager and executive levels. The rational for the exclusion of organizational rating in linking pay to performance at the lower levels was that the individuals at those levels had little direct influence on the bottom line of their organizations. (Determining compensation of the non-executive Directors will not be under the scope of this committee).
audit CommitteeThe audit Committee comprises solely of non-executive, independent Directors and conforms to the requirements of the Listing Rules of the Colombo stock exchange. it is governed by a Charter, which inter alia, covers the reviewing of policies and procedures of internal control, business risk management, compliance with laws and Group policies and independent audit function.
The Committee is also responsible for the consideration and recommendation of the appointment of external auditors, the maintenance of a professional relationship with them, reviewing the accounting principles, policies and practices adopted in the preparation of public financial information and examining all documents representing the final Financial Statements.
A quarterly self-certification program that requires the President of the Plantation services sector, Ceo of John Keells PLC and JKsB, Head of Finance of JKsB and the Financial Controller (FC) confirms compliance, on a quarterly basis, with statutory requirements and key control procedures and to identify any deviations from the set requirements. in addition the President of the Plantation services sector, Ceo of John Keells PLC and JKsB and the operational Heads of the different business units are also required to confirm operational compliance with statutory and other regulations and key control procedures, coupled with the identification of any deviations from the expected norms. These have significantly aided the committee in its efforts in ensuring correct financial reporting and effective internal control and risk management.
The composition, mandate & scope of the committee is presented below:
Composition The Chairperson must be a non-executive Director. Committee should comprise exclusively of non-executive Directors, a majority of whom shall be independent.
The Chairman-Ceo and Group Finance Director are present at all Committee meetings unless the Chairman-Ceo or executive Director Remuneration is under discussion respectively. The President, Human Resources and Legal, is also present at all meetings
Mandate Determine the quantum of compensation (including stock options) for Chairman and executive Directors, conduct performance evaluation of Chairman-Ceo, review performance evaluation of the other executive Directors and establish a Group Remuneration Policy
scope a. Determine and agree with the Board a framework for remuneration of Chairman and executive Directors
b. Consider targets, and benchmark principles, for any performance related pay schemes
c. Within terms of agreed framework, determine total remuneration package of each executive Director, keeping in view
d. Performancee. industry trendsf. Past remunerationg. succession planning of Key Management Personnelh. Determining compensation of non-executive Directors
will not be under the scope of this Committee
55Annual Report 2015/16
The audit Committee had four (4) meetings during the year and attendance of the audit Committee members are indicated in the audit Committee Report on page 82.
The President of the Plantation services sector, Ceo of John Keells PLC and JKsB, the FC, the Head of Finance and other operational heads are invited to the meetings of the audit Committee. The detailed audit committee report including areas reviewed during the financial year 2015/16 is given on pages 82 to 84 of the Annual Report.
Ms. s T Ratwatte ChairmanMr. T De Zoysa Ms. Y a Hansen
The composition, mandate & scope of the committee is presented below:
Composition all members to be exclusively non-executive, independent Directors with at least one member having significant, recent and relevant financial management and accounting experience and a professional accounting qualification.
The Ceo, Financial Controller are permanent invitees for all Committee meetings.
Mandate Monitor and supervise management’s financial reporting process in ensuring;- accurate and timely disclosure- Transparency, integrity and quality of financial reporting
scope a. Confirm and assure;- independence of external auditor- objectivity of internal auditorb. Review with independent auditors adequacy of internal
controls and quality of financial reportingc. Regular review meetings with management, internal
auditor and external auditors in seeking assurance on various matters
The Related Party Transaction Review Committee of JKH comprises four non executive independent Directors and one executive non independent Directors namely:
Mr. a n Fonseka ChairmanMr. e F G amerasinghe Mr. D a CabraalMr. s C RatnayakeMs. M P Perera
The Group Finance Director-JKH attends meetings by invitation and the Head of Group Business process Review serves as the secretary to the Committee.
The mandate of the Committee to ensure on behalf of the Board, that all related party transactions of JKH and its listed subsidiaries are consisted with the Code of Best Practices on Related Party Transactions issues by the securities exchange Commission of sri Lanka.
While the above requisitions is the minimum required by the Code, the Group has broadened the mandate to include senior decision makers in the list of key management personnel, whose transactions with the Group companies also reviewed by the committee.
The scope of this sub-committee in broad terms is:
• Develop and recommend for adoption by the Board of Directors of JKH and its listed subsidies, a Related Party Transaction Policy which is consistent with the operating model and the delegated decision rights of the JKH group.
Related Party Transaction Review CommitteeThe Board of the Parent Company JKH established a Related Party Transaction (RPT) Review Committee with effect 1st april 2014 to review all the related party transactions of the listed companies within the Group. This move also complies with the early adoption of the
Code of Best Practice on Related Party Transactions issued by the securities exchange Commission (seC).on the basis that the Parent company is also a listed company, the seC has permitted the Related Party Transaction Review Committee of the parent company, to represent the listed companies in the JKH group.
56 John Keells PlC
Corporate Governance
• Updating the Board of Directors on the related party transaction of each of the listed companies of the Group on a quarterly basis.
• Define and establish the threshold values for each of the subject listed companies in setting a benchmark for related party transactions, which have to be pre-approved by the Board, related party transactions which require to be reviewed annually and similar issues relating to listed companies.
The Group Finance Director-JKH attends meetings by invitation and the Head of Group Business process Review serves as the secretary to the Committee
The composition, mandate & scope of the committee is presented below
Composition The Chairperson must be a non-executive Director. Must include at least one executive Director.
Mandate To ensure on behalf of the Board, that all Related Party Transactions of John Keells Holdings PLC and its Listed subsidiaries are consistent with the Code of Best Practices on Related Party Transactions issued by the securities & exchange Commission of sri Lanka.
scope a. Develop and recommend for adoption by the Board of Directors of John Keells Holdings PL C and its Listed subsidiaries, a Related Party Transaction Policy which is consistent with the operating Model and the Delegated Decision Rights of the JKH Group.
b. update the Board of Directors the Related Party Transaction of each of the listed Companies of the JKH Group on a quarterly basis.
c. Define and establish the threshold values for each of the subject listed companies in the setting a benchmark for related party transactions, related party transactions which have to be pre-approved by the Board, related party transactions which require to be reviewed annually and similar issues relating to listed companies.
The Committee in discharging its functions introduced processes and periodic reporting by the relevant entities with a view to ensure that;
- There is compliance with the Code
- shareholders interest are protected and
- Fairness and transparency are maintained.
The Committee recommended and the Board adopted criteria for designing JKH Key Management Personnel (KMP). all Presidents, executive Vice Presidents, Chief Executive Officers, Chief Financial Officers and Sector Financial Controllers of their respective company’s in addition to the Directors were designated as KMPs in order to increase transparency and enhance governance. Further processes were introduced to obtain annual disclosures from all KMPs so designated.
The activities and views of the Committee have been communicated to the Board of Directors quarterly through verbal briefings, and by tabling the minutes of the Committee meetings.
Directors RemunerationExecutive Directors RemunerationThe remuneration of the executive Director is determined in line with the remuneration policies of the Group. The remuneration policy is formulated to attract and retain high calibre executives and motivate them to develop and implement the business strategy in order to optimise long term shareholder value creation. The Group has adopted a remuneration policy designed to provide
The Policies and Procedures adopted by the Committee for reviewing Related Party Transactions
The committee formulated and recommended a policy for adoption of RPT transactions for JKH and its subsidiaries which is consistent with operating model and the delegated decision rights of the JKH group. in doing so, transaction threshold values
which require discussion in detail, RPT’s which require pre – approval by the Board, RPT’s which require to be reviewed annually were established and reporting templates were designed and approved by the Committee. Further, the guidelines which senior management must follow in dealing with related parties, including pricing were applicable, were documented.
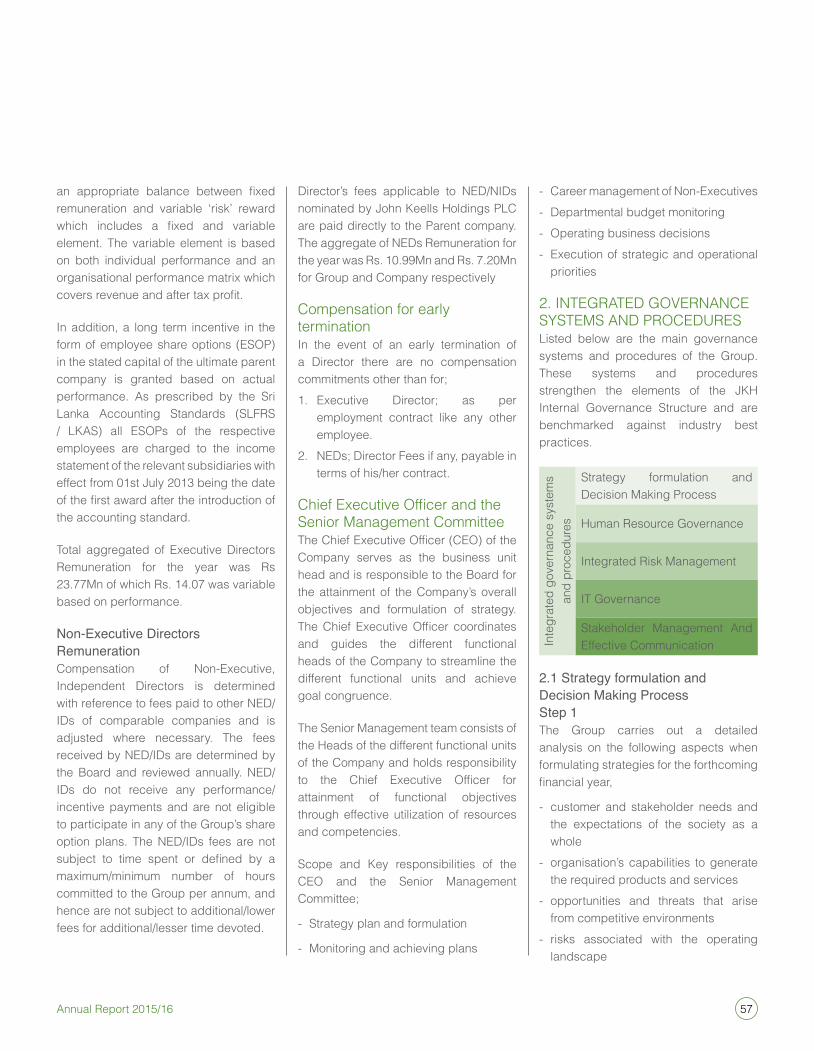
57Annual Report 2015/16
an appropriate balance between fixed remuneration and variable ‘risk’ reward which includes a fixed and variable element. The variable element is based on both individual performance and an organisational performance matrix which covers revenue and after tax profit.
in addition, a long term incentive in the form of employee share options (esoP) in the stated capital of the ultimate parent company is granted based on actual performance. as prescribed by the sri Lanka accounting standards (sLFRs / LKas) all esoPs of the respective employees are charged to the income statement of the relevant subsidiaries with effect from 01st July 2013 being the date of the first award after the introduction of the accounting standard.
Total aggregated of executive Directors Remuneration for the year was Rs 23.77Mn of which Rs. 14.07 was variable based on performance.
Non-Executive Directors RemunerationCompensation of non-executive, independent Directors is determined with reference to fees paid to other neD/iDs of comparable companies and is adjusted where necessary. The fees received by neD/iDs are determined by the Board and reviewed annually. neD/iDs do not receive any performance/incentive payments and are not eligible to participate in any of the Group’s share option plans. The neD/iDs fees are not subject to time spent or defined by a maximum/minimum number of hours committed to the Group per annum, and hence are not subject to additional/lower fees for additional/lesser time devoted.
Director’s fees applicable to neD/niDs nominated by John Keells Holdings PLC are paid directly to the Parent company. The aggregate of neDs Remuneration for the year was Rs. 10.99Mn and Rs. 7.20Mn for Group and Company respectively
Compensation for early terminationin the event of an early termination of a Director there are no compensation commitments other than for;1. executive Director; as per
employment contract like any other employee.
2. neDs; Director Fees if any, payable in terms of his/her contract.
Chief Executive Officer and the senior Management CommitteeThe Chief Executive Officer (CEO) of the Company serves as the business unit head and is responsible to the Board for the attainment of the Company’s overall objectives and formulation of strategy. The Chief Executive Officer coordinates and guides the different functional heads of the Company to streamline the different functional units and achieve goal congruence.
The senior Management team consists of the Heads of the different functional units of the Company and holds responsibility to the Chief Executive Officer for attainment of functional objectives through effective utilization of resources and competencies.
scope and Key responsibilities of the Ceo and the senior Management Committee;
- strategy plan and formulation
- Monitoring and achieving plans
- Career management of non-executives - Departmental budget monitoring- operating business decisions- execution of strategic and operational
priorities
2. inTeGRaTeD GoVeRnanCe sYsTeMs anD PRoCeDuResListed below are the main governance systems and procedures of the Group. These systems and procedures strengthen the elements of the JKH internal Governance structure and are benchmarked against industry best practices.
inte
grat
ed g
over
nanc
e sy
stem
s an
d pr
oced
ures
strategy formulation and Decision Making Process
Human Resource Governance
integrated Risk Management
iT Governance
stakeholder Management and effective Communication
2.1 Strategy formulation and Decision Making ProcessStep 1The Group carries out a detailed analysis on the following aspects when formulating strategies for the forthcoming financial year,
- customer and stakeholder needs and the expectations of the society as a whole
- organisation’s capabilities to generate the required products and services
- opportunities and threats that arise from competitive environments
- risks associated with the operating landscape
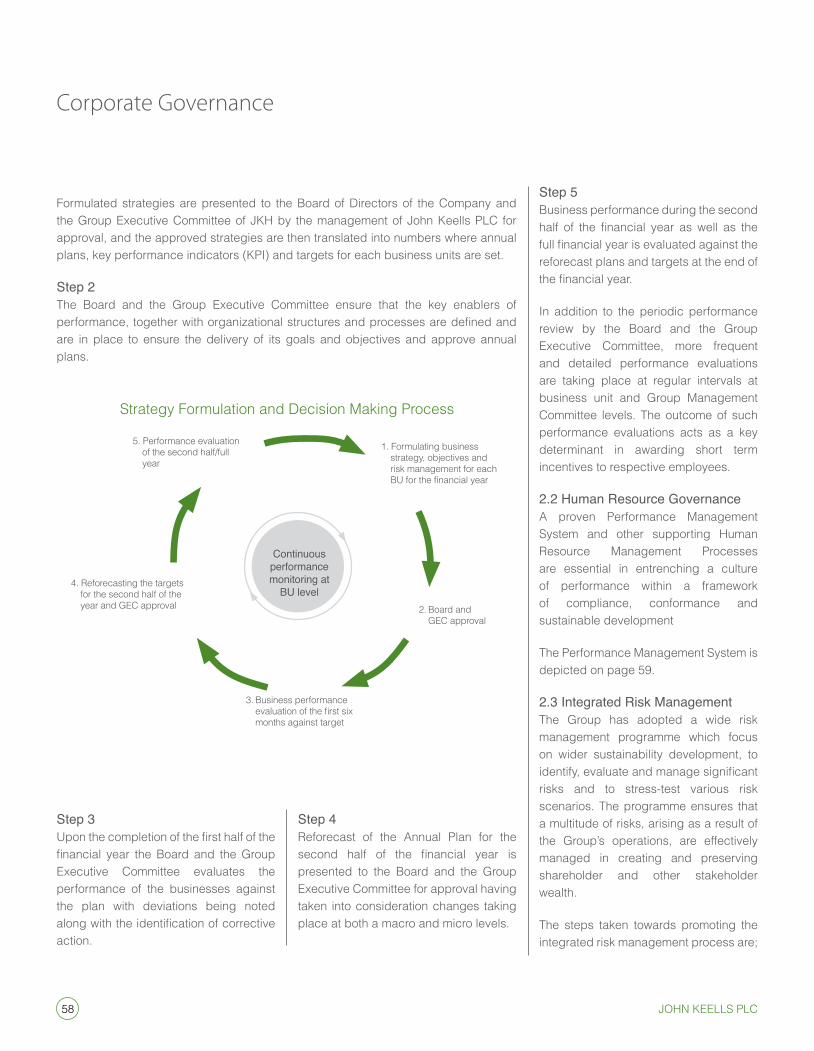
58 John Keells PlC
Corporate Governance
strategy Formulation and Decision Making Process
1. Formulating business strategy, objectives and risk management for each BU for the financial year
2. Board and GeC approval
3. Business performance evaluation of the first six months against target
4. Reforecasting the targets for the second half of the year and GeC approval
5. Performance evaluation of the second half/full year
Continuous performance monitoring at
Bu level
Formulated strategies are presented to the Board of Directors of the Company and the Group executive Committee of JKH by the management of John Keells PLC for approval, and the approved strategies are then translated into numbers where annual plans, key performance indicators (KPi) and targets for each business units are set.
Step 2The Board and the Group executive Committee ensure that the key enablers of performance, together with organizational structures and processes are defined and are in place to ensure the delivery of its goals and objectives and approve annual plans.
Step 5Business performance during the second half of the financial year as well as the full financial year is evaluated against the reforecast plans and targets at the end of the financial year.
in addition to the periodic performance review by the Board and the Group executive Committee, more frequent and detailed performance evaluations are taking place at regular intervals at business unit and Group Management Committee levels. The outcome of such performance evaluations acts as a key determinant in awarding short term incentives to respective employees.
2.2 Human Resource Governancea proven Performance Management system and other supporting Human Resource Management Processes are essential in entrenching a culture of performance within a framework of compliance, conformance and sustainable development
The Performance Management system is depicted on page 59.
2.3 Integrated Risk ManagementThe Group has adopted a wide risk management programme which focus on wider sustainability development, to identify, evaluate and manage significant risks and to stress-test various risk scenarios. The programme ensures that a multitude of risks, arising as a result of the Group’s operations, are effectively managed in creating and preserving shareholder and other stakeholder wealth.
The steps taken towards promoting the integrated risk management process are;
Step 3Upon the completion of the first half of the financial year the Board and the Group executive Committee evaluates the performance of the businesses against the plan with deviations being noted along with the identification of corrective action.
Step 4Reforecast of the annual Plan for the second half of the financial year is presented to the Board and the Group executive Committee for approval having taken into consideration changes taking place at both a macro and micro levels.
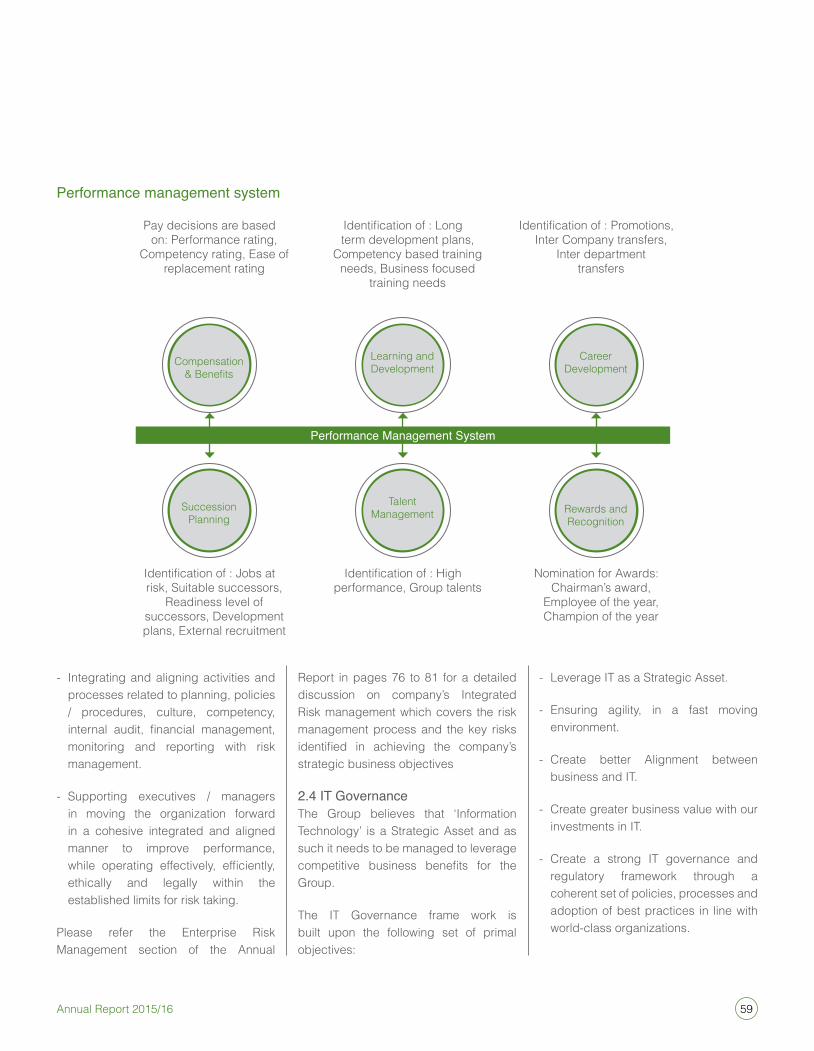
59Annual Report 2015/16
- integrating and aligning activities and processes related to planning, policies / procedures, culture, competency, internal audit, financial management, monitoring and reporting with risk management.
- supporting executives / managers in moving the organization forward in a cohesive integrated and aligned manner to improve performance, while operating effectively, efficiently, ethically and legally within the established limits for risk taking.
Please refer the enterprise Risk Management section of the annual
Report in pages 76 to 81 for a detailed discussion on company’s integrated Risk management which covers the risk management process and the key risks identified in achieving the company’s strategic business objectives
2.4 IT Governance The Group believes that ‘information Technology’ is a strategic asset and as such it needs to be managed to leverage competitive business benefits for the Group.
The iT Governance frame work is built upon the following set of primal objectives:
- Leverage iT as a strategic asset.
- ensuring agility, in a fast moving environment.
- Create better alignment between business and iT.
- Create greater business value with our investments in iT.
- Create a strong iT governance and regulatory framework through a coherent set of policies, processes and adoption of best practices in line with world-class organizations.
Pay decisions are based on: Performance rating,
Competency rating, ease of replacement rating
Identification of : Long term development plans,
Competency based training needs, Business focused
training needs
Identification of : Promotions, inter Company transfers,
inter department transfers
Compensation & Benefits
Learning and Development
Career Development
succession Planning
Talent Management Rewards and
Recognition
Identification of : Jobs at risk, suitable successors,
Readiness level of successors, Development plans, external recruitment
Identification of : High performance, Group talents
nomination for awards: Chairman’s award,
employee of the year, Champion of the year
Performance Management System
Performance management system
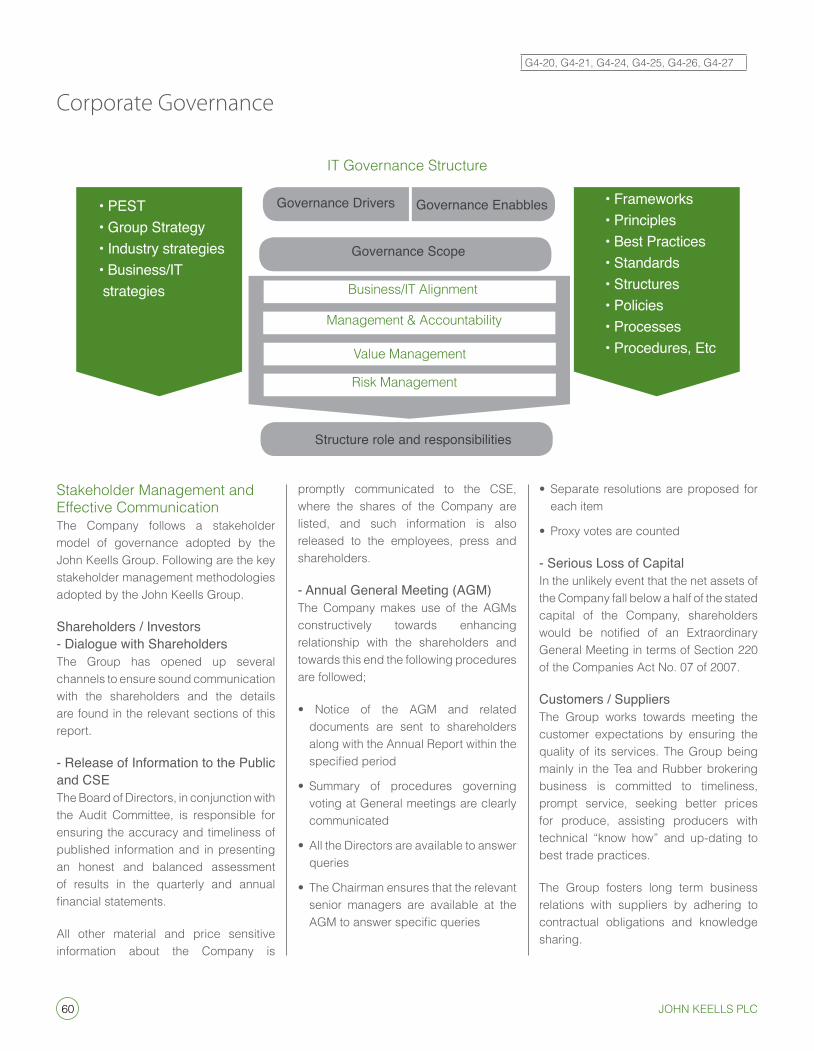
60 John Keells PlC
Corporate Governance
stakeholder Management and effective CommunicationThe Company follows a stakeholder model of governance adopted by the John Keells Group. Following are the key stakeholder management methodologies adopted by the John Keells Group.
Shareholders / Investors- Dialogue with Shareholders The Group has opened up several channels to ensure sound communication with the shareholders and the details are found in the relevant sections of this report.
- Release of Information to the Public and CSEThe Board of Directors, in conjunction with the audit Committee, is responsible for ensuring the accuracy and timeliness of published information and in presenting an honest and balanced assessment of results in the quarterly and annual financial statements.
all other material and price sensitive information about the Company is
promptly communicated to the Cse, where the shares of the Company are listed, and such information is also released to the employees, press and shareholders.
- Annual General Meeting (AGM)The Company makes use of the aGMs constructively towards enhancing relationship with the shareholders and towards this end the following procedures are followed;
• Notice of the AGM and related documents are sent to shareholders along with the annual Report within the specified period
• Summary of procedures governing voting at General meetings are clearly communicated
• All the Directors are available to answer queries
• The Chairman ensures that the relevant senior managers are available at the AGM to answer specific queries
• Separate resolutions are proposed for each item
• Proxy votes are counted
- Serious Loss of Capitalin the unlikely event that the net assets of the Company fall below a half of the stated capital of the Company, shareholders would be notified of an Extraordinary General Meeting in terms of section 220 of the Companies act no. 07 of 2007.
Customers / SuppliersThe Group works towards meeting the customer expectations by ensuring the quality of its services. The Group being mainly in the Tea and Rubber brokering business is committed to timeliness, prompt service, seeking better prices for produce, assisting producers with technical “know how” and up-dating to best trade practices.
The Group fosters long term business relations with suppliers by adhering to contractual obligations and knowledge sharing.
Governance Drivers Governance Enabbles
Governance Scope
Business/iT alignment
Management & accountability
Value Management
Risk Management
Structure role and responsibilities
• Frameworks• Principles • Best Practices• Standards• Structures • Policies• Processes• Procedures, Etc
• PEST• Group Strategy • Industry strategies• Business/IT strategies
G4-20, G4-21, G4-24, G4-25, G4-26, G4-27
iT Governance structure
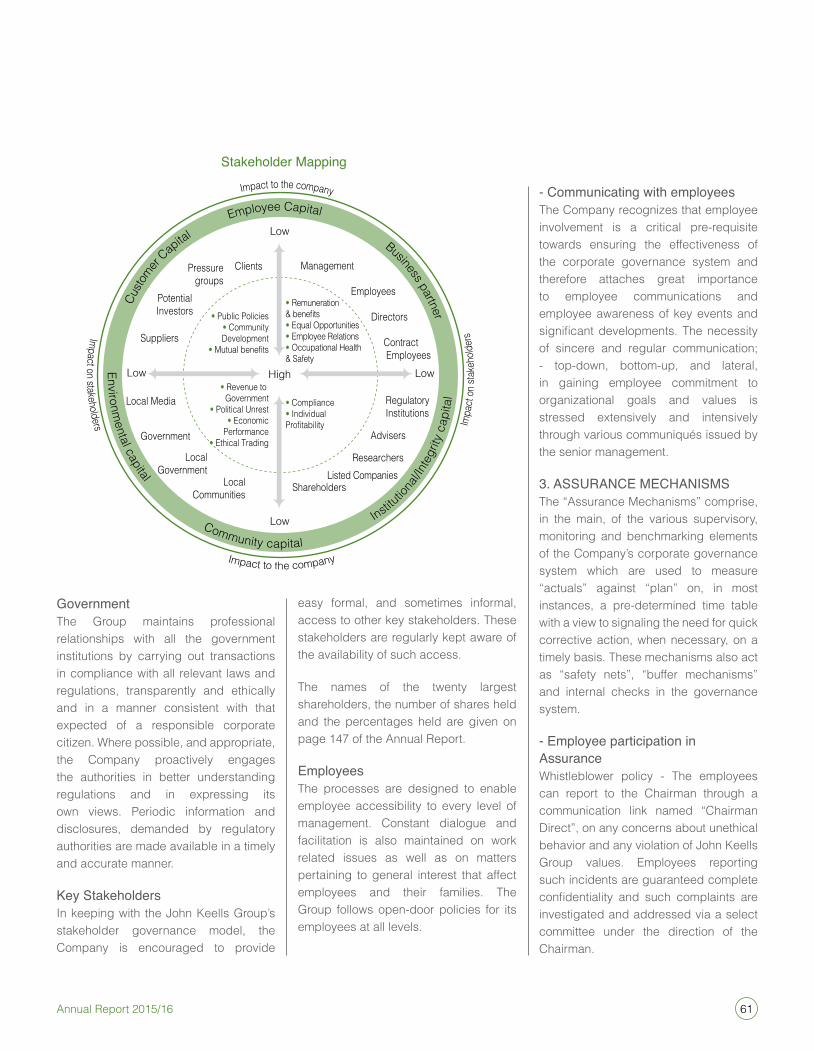
61Annual Report 2015/16
GovernmentThe Group maintains professional relationships with all the government institutions by carrying out transactions in compliance with all relevant laws and regulations, transparently and ethically and in a manner consistent with that expected of a responsible corporate citizen. Where possible, and appropriate, the Company proactively engages the authorities in better understanding regulations and in expressing its own views. Periodic information and disclosures, demanded by regulatory authorities are made available in a timely and accurate manner.
Key Stakeholdersin keeping with the John Keells Group’s stakeholder governance model, the Company is encouraged to provide
easy formal, and sometimes informal, access to other key stakeholders. These stakeholders are regularly kept aware of the availability of such access.
The names of the twenty largest shareholders, the number of shares held and the percentages held are given on page 147 of the annual Report.
EmployeesThe processes are designed to enable employee accessibility to every level of management. Constant dialogue and facilitation is also maintained on work related issues as well as on matters pertaining to general interest that affect employees and their families. The Group follows open-door policies for its employees at all levels.
- Communicating with employeesThe Company recognizes that employee involvement is a critical pre-requisite towards ensuring the effectiveness of the corporate governance system and therefore attaches great importance to employee communications and employee awareness of key events and significant developments. The necessity of sincere and regular communication; - top-down, bottom-up, and lateral, in gaining employee commitment to organizational goals and values is stressed extensively and intensively through various communiqués issued by the senior management.
3. ASSuRANCE MECHANISMSThe “assurance Mechanisms” comprise, in the main, of the various supervisory, monitoring and benchmarking elements of the Company’s corporate governance system which are used to measure “actuals” against “plan” on, in most instances, a pre-determined time table with a view to signaling the need for quick corrective action, when necessary, on a timely basis. These mechanisms also act as “safety nets”, “buffer mechanisms” and internal checks in the governance system.
- Employee participation in AssuranceWhistleblower policy - The employees can report to the Chairman through a communication link named “Chairman Direct”, on any concerns about unethical behavior and any violation of John Keells Group values. employees reporting such incidents are guaranteed complete confidentiality and such complaints are investigated and addressed via a select committee under the direction of the Chairman.
Stakeholder Mapping
62 John Keells PlC
Corporate Governance
skip level meetings- employees at assistant Manager and all levels above can discuss matters of concern with superiors who are at a level higher than their own immediate supervisor in an open but confidential environment
exit interviews - This is mandated for all executive and above level. all such reports are forwarded to the sector Head of the Plantation services sector of JKH.
securities trading policy - JKH, the parent company securities trading policy prohibits all employees and agents engaged by the company who are in possession of unpublished price sensitive information from trading in the company’s shares.
The John Keells Group adopts a zero tolerance policy against any employee who is found to be in violation of this policy.
360 degree evaluation - all employees at Manager and above levels, including the Chairman (direct report evaluation only) are subject to a 360 degree evaluation conducted by an independent 3rd party.
Great Place to Work survey – These anonymous surveys are aimed at knowing, at regular intervals, whether employees consider the companies under the John Keells Group as ‘great’. These surveys highlight visible areas of employee concerns. Following such surveys, the John Keells Group engages focussed Discussion Groups in reviewing the highlighted areas of concern and considers the Discussion Group’s suggestions where relevant and appropriate. Experience has confirmed that this has contributed to significant
improvements in the employee perceptions of the John Keells Group, particularly in respect of practices, policies and behaviors that build credibility, respect and fairness.
Voice of employee survey - These are dip stick surveys done at regular intervals to assess employee satisfaction.
- Internal controlThe Board has taken necessary steps to ensure the integrity of the Company’s accounting and financial reporting systems and internal control systems remain effective via the review and monitoring of such systems on a periodic basis.
• Internal complianceA quarterly self-certification programme requires the sector Head of the Plantation services sector of JKH and the Financial Controller of the Company to confirm compliance with financial standards and regulations. The sector Head of the Plantation services sector of JKH and the Ceo of the Company are required to confirm operational compliance with statutory and other regulations and key control procedures, and also identify any significant deviations from the expected norms.
• System of internal controlThe Board has through the involvement of the Group Business Process Review (Group BPR) division of JKH, taken steps to obtain assurance that systems designed to safeguard the Company’s assets, maintain proper accounting records and provide management information, are in place and are functioning according to expectations. The risk review programme covering
the internal audit of the Company is outsourced.
Reports arising out of such audits are in the first instance, considered and discussed at the company level and after review by the sector Head of the Plantation services sector/ President JKH and forwarded to the relevant audit Committee, through the Group Finance Director, on a quarterly basis. Further, the audit Committees also assess the effectiveness of the risk review process and systems of internal control periodically.
The internal audit function of the Company is not outsourced to the external auditor in a further attempt to ensure external auditor independence. The auditors’ report on the financial statements of the Company for the year under review is found in the Financial information section of the annual Report in page 93.
The role of the internal auditor has transformed into a value adding function instead of a mere ‘policing’ function, where audit findings form an integral input in modifying and improving internal processes. Thereby, the Group Business Process Review (Group BPR) division of JKH is a key contributor in achieving operational excellence and value addition of the Company.
- The Code of conductThe Company follows the JKH Code of Conduct and is summated as follows;
JKH Code of Conduct• Allegiance to the Company and the
Group
63Annual Report 2015/16
• Compliance with rules and regulations applying in the territories that the Group operate in
• Conduct of business in an ethical manner at all times an in keeping with acceptable business practices
• Exercise of professionalism and integrity in all business and “public” personal transactions.
The objectives of the Code of Conduct are further affirmed by a strong set of corporate values which are well institutionalized at all levels within the company through structured communication. The degree of employee conformance with corporate values and their degree of adherence to the JKH Code of Conduct are key elements of reward and recognition schemes.
- ombudsperson - in order to deal with a situation in which an employee or group of employees feel that an alleged violation has not been addressed satisfactorily using the available/existing procedures and processes, an ombudsperson has been appointed by JKH being the ultimate Parent Company to entertain such concerns.
The ombudsperson’s duty ceases upon the confidential written communication of the findings of the Ombudsperson and recommendations to the Chairman or the senior independent Director of JKH, as the case may be.
The Chairman or the senior independent Director, as the case may be, will place before the Board.
• The decision and the recommendations of the ombudsperson
• The action taken based on the recommendations
• The areas of disagreement and the reasons adduced in instances where the Chairman or the senior independent Director disagrees with any or all of the findings and/or recommendations. in such cases, the Board shall consider the areas of disagreement and determine the way forward.
The Chairman or the senior independent Director is expected to take such steps as are necessary to ensure that the complainant is not victimized for having invoked this process.
These open door policies facilitate constant dialogue, communication, transparency and ultimately employee confidence, which would help retain existing talent whilst attracting new.
- External ControlMessrs. ernst & Young, Chartered accountants are the external auditors of the Company and also the principal Group auditor of JKH.
in addition to the external auditor services, Messrs. ernst & Young, also provide certain non-audit services to the Company. However, the Principal / Consolidator auditor would not engage in any services which are in the restricted category as defined by the CSE for external auditors. all such services have been provided with the full knowledge of the audit Committee and are assessed to ensure that external auditor independence is not compromised.
The Board has agreed that, such non-audit services should not exceed a specified percentage of the value of the total audit fees charged by the subject auditor. The external auditors also provide a certificate of independence on an annual basis.
The audit and non-audit fees paid by the Company to its auditors are separately classified in the Notes to the Financial statements of the annual Report in page 115.
4. EXTERNAL GOVERNANCE STRuCTuRE Regulatory BenchmarksThe Board through the JKH Legal division, strives to ensure that the Company complies with the laws and regulations of the country.
The Board of Directors has also taken all reasonable steps in ensuring that all financial statements are prepared in accordance with the sri Lanka accounting standards (sLFRs / LKas) issued by the iCasL and the requirements of the Cse and other applicable authorities.
The Board is aware of the growing importance of the disclosure of critical accounting policies as a part of good governance and opines that there are no instances where the use of such concepts would have a material impact on the Company’s financial performance.
The Company is fully compliant with all the mandatory rules and regulations stipulated by the Corporate Governance Listing Rules published by the Cse and also by the Companies act no. 07 of 2007. The Company has also given due consideration to the Best Practice
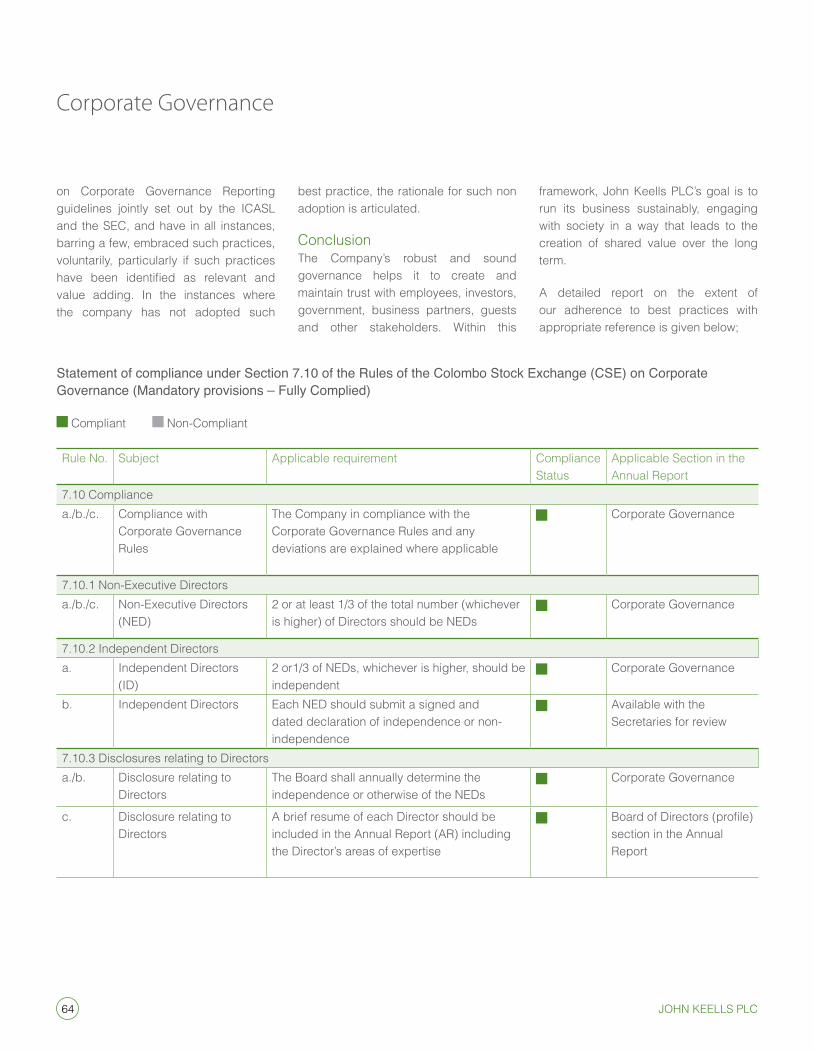
64 John Keells PlC
Corporate Governance
Statement of compliance under Section 7.10 of the Rules of the Colombo Stock Exchange (CSE) on Corporate Governance (Mandatory provisions – Fully Complied)
Compliant non-Compliant
Rule no. subject applicable requirement Compliance status
applicable section in the annual Report
7.10 Compliancea./b./c. Compliance with
Corporate Governance Rules
The Company in compliance with the Corporate Governance Rules and any deviations are explained where applicable
Corporate Governance
7.10.1 non-executive Directorsa./b./c. non-executive Directors
(neD)2 or at least 1/3 of the total number (whichever is higher) of Directors should be neDs
Corporate Governance
7.10.2 independent Directorsa. independent Directors
(iD)2 or1/3 of neDs, whichever is higher, should be independent
Corporate Governance
b. independent Directors each neD should submit a signed and dated declaration of independence or non-independence
available with the secretaries for review
7.10.3 Disclosures relating to Directorsa./b. Disclosure relating to
DirectorsThe Board shall annually determine the independence or otherwise of the neDs
Corporate Governance
c. Disclosure relating to Directors
a brief resume of each Director should be included in the annual Report (aR) including the Director’s areas of expertise
Board of Directors (profile) section in the annual Report
on Corporate Governance Reporting guidelines jointly set out by the iCasL and the seC, and have in all instances, barring a few, embraced such practices, voluntarily, particularly if such practices have been identified as relevant and value adding. in the instances where the company has not adopted such
best practice, the rationale for such non adoption is articulated.
ConclusionThe Company’s robust and sound governance helps it to create and maintain trust with employees, investors, government, business partners, guests and other stakeholders. Within this
framework, John Keells PLC’s goal is to run its business sustainably, engaging with society in a way that leads to the creation of shared value over the long term.
a detailed report on the extent of our adherence to best practices with appropriate reference is given below;
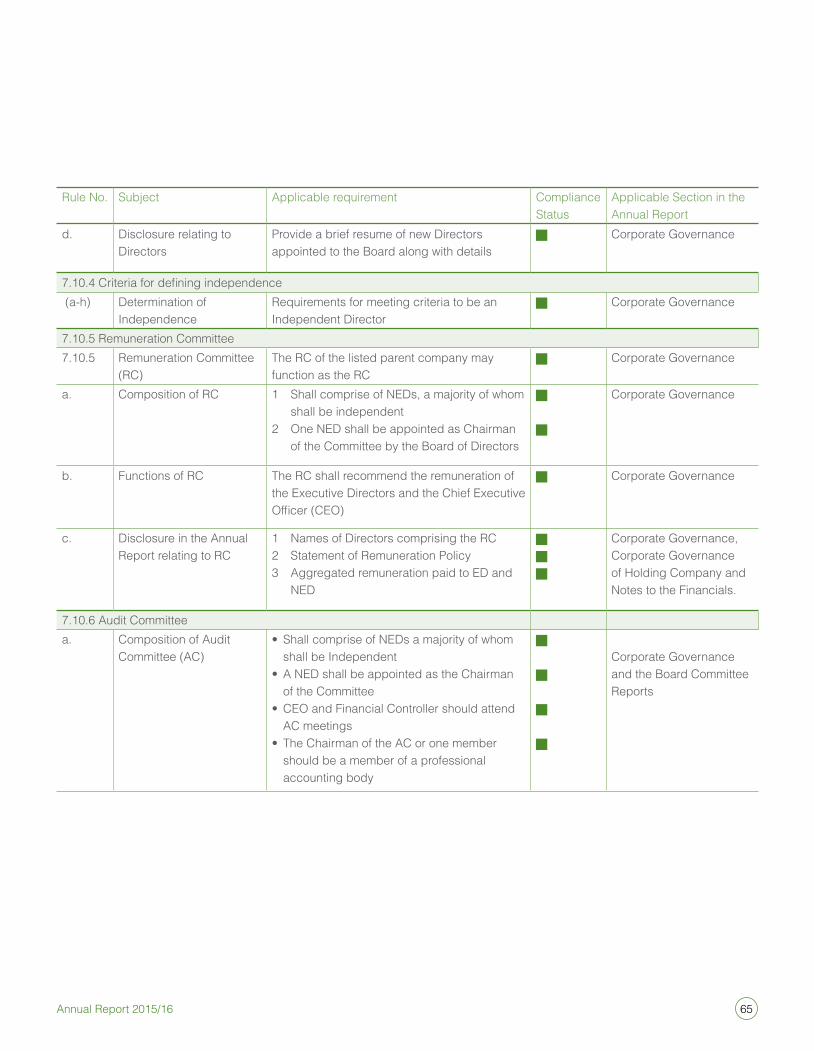
65Annual Report 2015/16
Rule no. subject applicable requirement Compliance status
applicable section in the annual Report
d. Disclosure relating to Directors
Provide a brief resume of new Directors appointed to the Board along with details
Corporate Governance
7.10.4 Criteria for defining independence (a-h) Determination of
independenceRequirements for meeting criteria to be an independent Director
Corporate Governance
7.10.5 Remuneration Committee7.10.5 Remuneration Committee
(RC)The RC of the listed parent company may function as the RC
Corporate Governance
a. Composition of RC 1 shall comprise of neDs, a majority of whom shall be independent
2 one neD shall be appointed as Chairman of the Committee by the Board of Directors
Corporate Governance
b. Functions of RC The RC shall recommend the remuneration of the executive Directors and the Chief executive Officer (CEO)
Corporate Governance
c. Disclosure in the annual Report relating to RC
1 names of Directors comprising the RC2 statement of Remuneration Policy3 aggregated remuneration paid to eD and
neD
Corporate Governance, Corporate Governance of Holding Company and notes to the Financials.
7.10.6 audit Committeea. Composition of audit
Committee (aC)• Shall comprise of NEDs a majority of whom
shall be independent• A NED shall be appointed as the Chairman
of the Committee• CEO and Financial Controller should attend
aC meetings• The Chairman of the AC or one member
should be a member of a professional accounting body
Corporate Governance and the Board Committee Reports
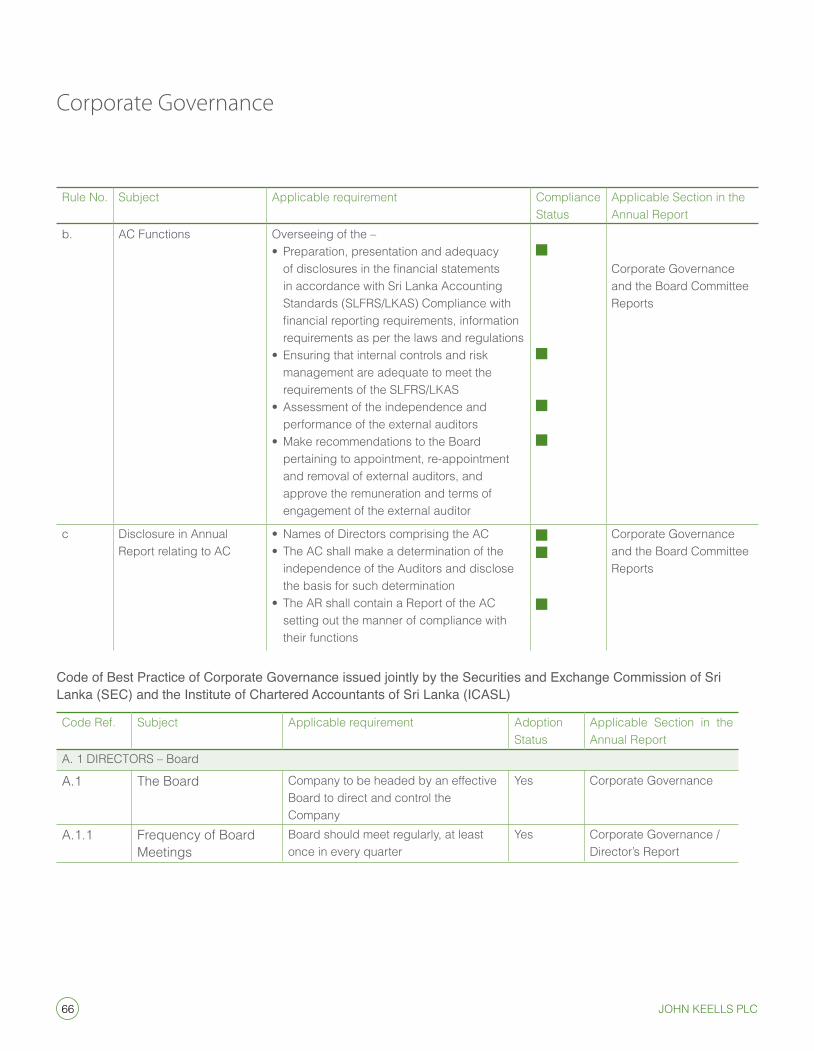
66 John Keells PlC
Corporate Governance
Rule no. subject applicable requirement Compliance status
applicable section in the annual Report
b. aC Functions overseeing of the –• Preparation, presentation and adequacy
of disclosures in the financial statements in accordance with sri Lanka accounting standards (sLFRs/LKas) Compliance with financial reporting requirements, information requirements as per the laws and regulations
• Ensuring that internal controls and risk management are adequate to meet the requirements of the sLFRs/LKas
• Assessment of the independence and performance of the external auditors
• Make recommendations to the Board pertaining to appointment, re-appointment and removal of external auditors, and approve the remuneration and terms of engagement of the external auditor
Corporate Governance and the Board Committee Reports
c Disclosure in annual Report relating to aC
• Names of Directors comprising the AC• The AC shall make a determination of the
independence of the auditors and disclose the basis for such determination
• The AR shall contain a Report of the AC setting out the manner of compliance with their functions
Corporate Governance and the Board Committee Reports
Code of Best Practice of Corporate Governance issued jointly by the Securities and Exchange Commission of Sri Lanka (SEC) and the Institute of Chartered Accountants of Sri Lanka (ICASL)
Code Ref. subject applicable requirement adoption status
applicable section in the annual Report
a. 1 DiReCToRs – Board
a.1 The Board Company to be headed by an effective Board to direct and control the Company
Yes Corporate Governance
a.1.1 Frequency of Board Meetings
Board should meet regularly, at least once in every quarter
Yes Corporate Governance / Director’s Report
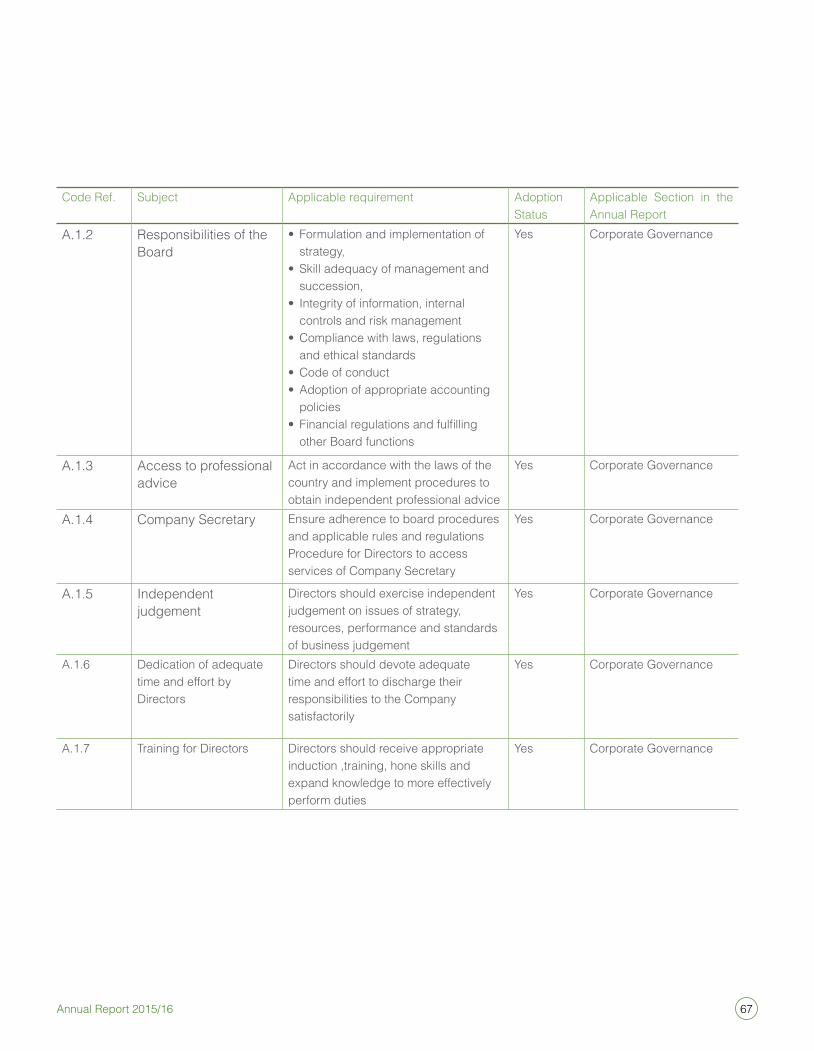
67Annual Report 2015/16
Code Ref. subject applicable requirement adoption status
applicable section in the annual Report
a.1.2 Responsibilities of the Board
• Formulation and implementation of strategy,
• Skill adequacy of management and succession,
• Integrity of information, internal controls and risk management
• Compliance with laws, regulations and ethical standards
• Code of conduct• Adoption of appropriate accounting
policies • Financial regulations and fulfilling
other Board functions
Yes Corporate Governance
a.1.3 access to professional advice
act in accordance with the laws of the country and implement procedures to obtain independent professional advice
Yes Corporate Governance
a.1.4 Company secretary ensure adherence to board procedures and applicable rules and regulationsProcedure for Directors to access services of Company secretary
Yes Corporate Governance
a.1.5 independent judgement
Directors should exercise independent judgement on issues of strategy, resources, performance and standards of business judgement
Yes Corporate Governance
a.1.6 Dedication of adequate time and effort by Directors
Directors should devote adequate time and effort to discharge their responsibilities to the Company satisfactorily
Yes Corporate Governance
a.1.7 Training for Directors Directors should receive appropriate induction ,training, hone skills and expand knowledge to more effectively perform duties
Yes Corporate Governance
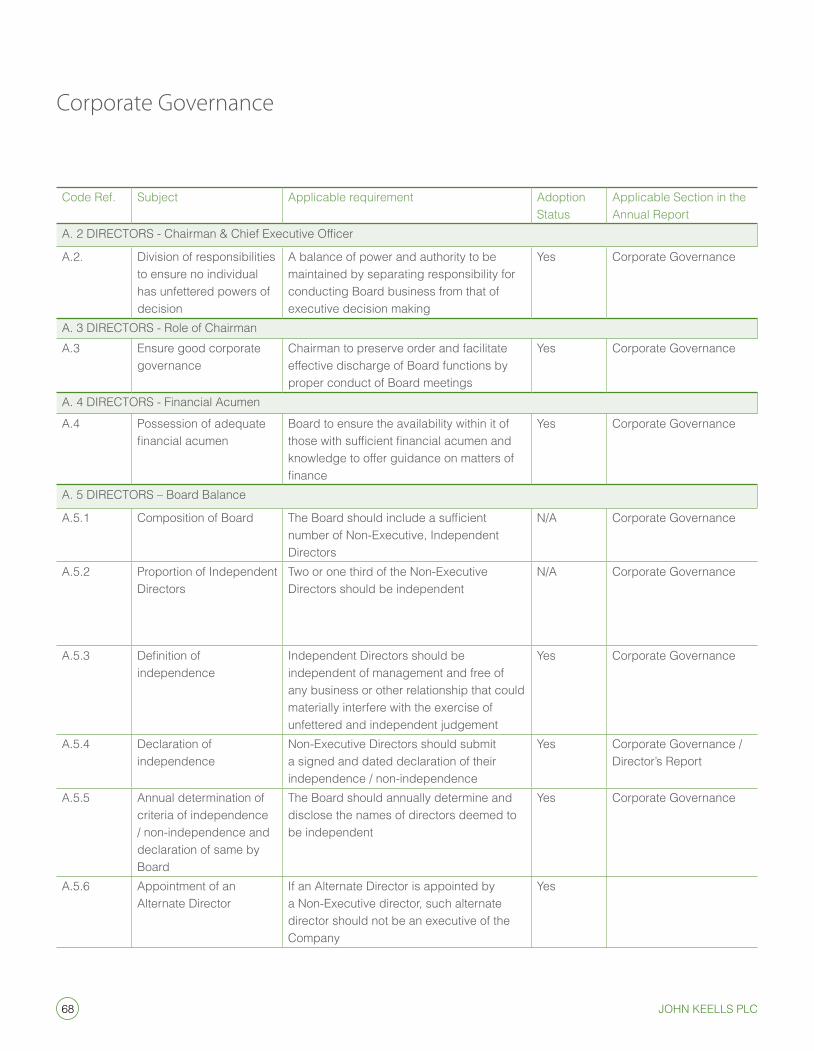
68 John Keells PlC
Corporate Governance
Code Ref. subject applicable requirement adoption status
applicable section in the annual Report
A. 2 DIRECTORS - Chairman & Chief Executive Officer
a.2. Division of responsibilities to ensure no individual has unfettered powers of decision
a balance of power and authority to be maintained by separating responsibility for conducting Board business from that of executive decision making
Yes Corporate Governance
a. 3 DiReCToRs - Role of Chairman a.3 ensure good corporate
governanceChairman to preserve order and facilitate effective discharge of Board functions by proper conduct of Board meetings
Yes Corporate Governance
a. 4 DiReCToRs - Financial acumen
a.4 Possession of adequate financial acumen
Board to ensure the availability within it of those with sufficient financial acumen and knowledge to offer guidance on matters of finance
Yes Corporate Governance
a. 5 DiReCToRs – Board Balance
a.5.1 Composition of Board The Board should include a sufficient number of non-executive, independent Directors
n/a Corporate Governance
a.5.2 Proportion of independent Directors
Two or one third of the non-executive Directors should be independent
n/a Corporate Governance
a.5.3 Definition of independence
independent Directors should be independent of management and free of any business or other relationship that could materially interfere with the exercise of unfettered and independent judgement
Yes Corporate Governance
a.5.4 Declaration of independence
non-executive Directors should submit a signed and dated declaration of their independence / non-independence
Yes Corporate Governance / Director’s Report
a.5.5 annual determination of criteria of independence / non-independence and declaration of same by Board
The Board should annually determine and disclose the names of directors deemed to be independent
Yes Corporate Governance
a.5.6 appointment of an alternate Director
if an alternate Director is appointed by a non-executive director, such alternate director should not be an executive of the Company
Yes
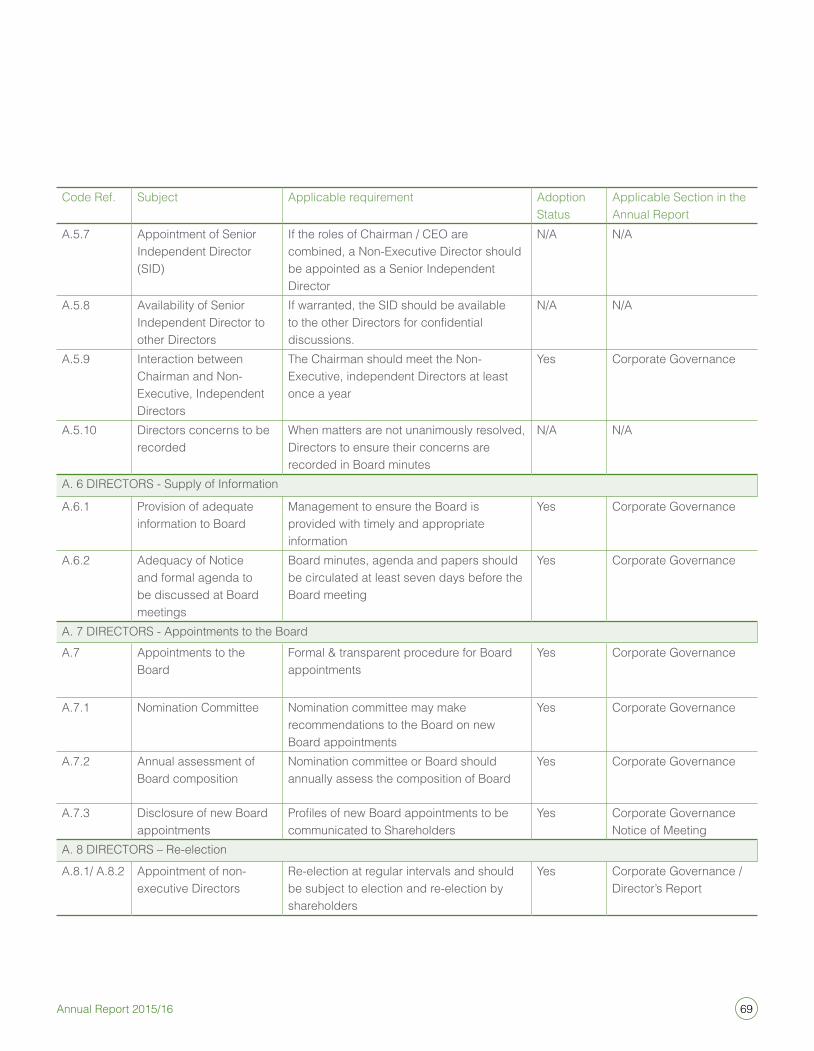
69Annual Report 2015/16
Code Ref. subject applicable requirement adoption status
applicable section in the annual Report
a.5.7 appointment of senior independent Director (siD)
if the roles of Chairman / Ceo are combined, a non-executive Director should be appointed as a senior independent Director
n/a n/a
a.5.8 availability of senior independent Director to other Directors
if warranted, the siD should be available to the other Directors for confidential discussions.
n/a n/a
a.5.9 interaction between Chairman and non-executive, independent Directors
The Chairman should meet the non-executive, independent Directors at least once a year
Yes Corporate Governance
a.5.10 Directors concerns to be recorded
When matters are not unanimously resolved, Directors to ensure their concerns are recorded in Board minutes
n/a n/a
a. 6 DiReCToRs - supply of information
a.6.1 Provision of adequate information to Board
Management to ensure the Board is provided with timely and appropriate information
Yes Corporate Governance
a.6.2 adequacy of notice and formal agenda to be discussed at Board meetings
Board minutes, agenda and papers should be circulated at least seven days before the Board meeting
Yes Corporate Governance
a. 7 DiReCToRs - appointments to the Board a.7 appointments to the
BoardFormal & transparent procedure for Board appointments
Yes Corporate Governance
a.7.1 nomination Committee nomination committee may make recommendations to the Board on new Board appointments
Yes Corporate Governance
a.7.2 annual assessment of Board composition
nomination committee or Board should annually assess the composition of Board
Yes Corporate Governance
a.7.3 Disclosure of new Board appointments
Profiles of new Board appointments to be communicated to shareholders
Yes Corporate Governance notice of Meeting
a. 8 DiReCToRs – Re-election
a.8.1/ a.8.2 appointment of non-executive Directors
Re-election at regular intervals and should be subject to election and re-election by shareholders
Yes Corporate Governance / Director’s Report
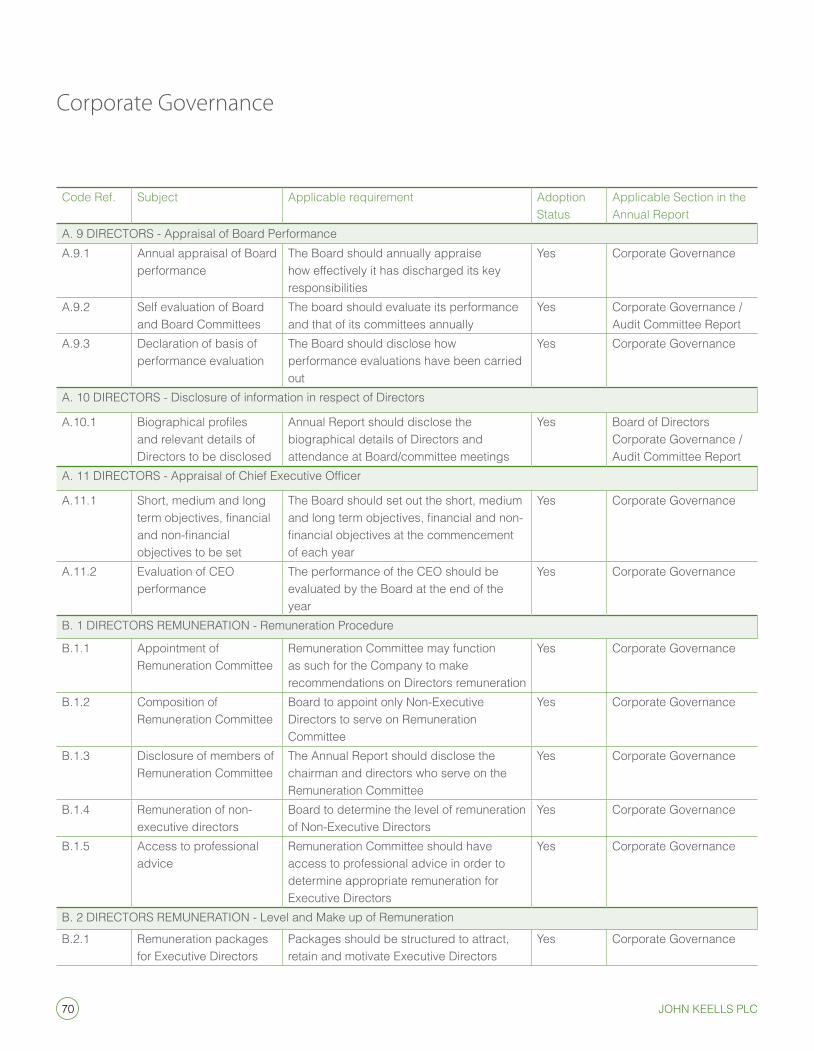
70 John Keells PlC
Corporate Governance
Code Ref. subject applicable requirement adoption status
applicable section in the annual Report
a. 9 DiReCToRs - appraisal of Board Performance a.9.1 annual appraisal of Board
performance The Board should annually appraise how effectively it has discharged its key responsibilities
Yes Corporate Governance
a.9.2 self evaluation of Board and Board Committees
The board should evaluate its performance and that of its committees annually
Yes Corporate Governance / audit Committee Report
a.9.3 Declaration of basis of performance evaluation
The Board should disclose how performance evaluations have been carried out
Yes Corporate Governance
a. 10 DiReCToRs - Disclosure of information in respect of Directors
a.10.1 Biographical profiles and relevant details of Directors to be disclosed
annual Report should disclose the biographical details of Directors and attendance at Board/committee meetings
Yes Board of Directors Corporate Governance / audit Committee Report
A. 11 DIRECTORS - Appraisal of Chief Executive Officer
a.11.1 short, medium and long term objectives, financial and non-financial objectives to be set
The Board should set out the short, medium and long term objectives, financial and non-financial objectives at the commencement of each year
Yes Corporate Governance
a.11.2 evaluation of Ceo performance
The performance of the Ceo should be evaluated by the Board at the end of the year
Yes Corporate Governance
B. 1 DiReCToRs ReMuneRaTion - Remuneration Procedure
B.1.1 appointment of Remuneration Committee
Remuneration Committee may function as such for the Company to make recommendations on Directors remuneration
Yes Corporate Governance
B.1.2 Composition of Remuneration Committee
Board to appoint only non-executive Directors to serve on Remuneration Committee
Yes Corporate Governance
B.1.3 Disclosure of members of Remuneration Committee
The annual Report should disclose the chairman and directors who serve on the Remuneration Committee
Yes Corporate Governance
B.1.4 Remuneration of non-executive directors
Board to determine the level of remuneration of non-executive Directors
Yes Corporate Governance
B.1.5 access to professional advice
Remuneration Committee should have access to professional advice in order to determine appropriate remuneration for executive Directors
Yes Corporate Governance
B. 2 DiReCToRs ReMuneRaTion - Level and Make up of Remuneration
B.2.1 Remuneration packages for executive Directors
Packages should be structured to attract, retain and motivate executive Directors
Yes Corporate Governance
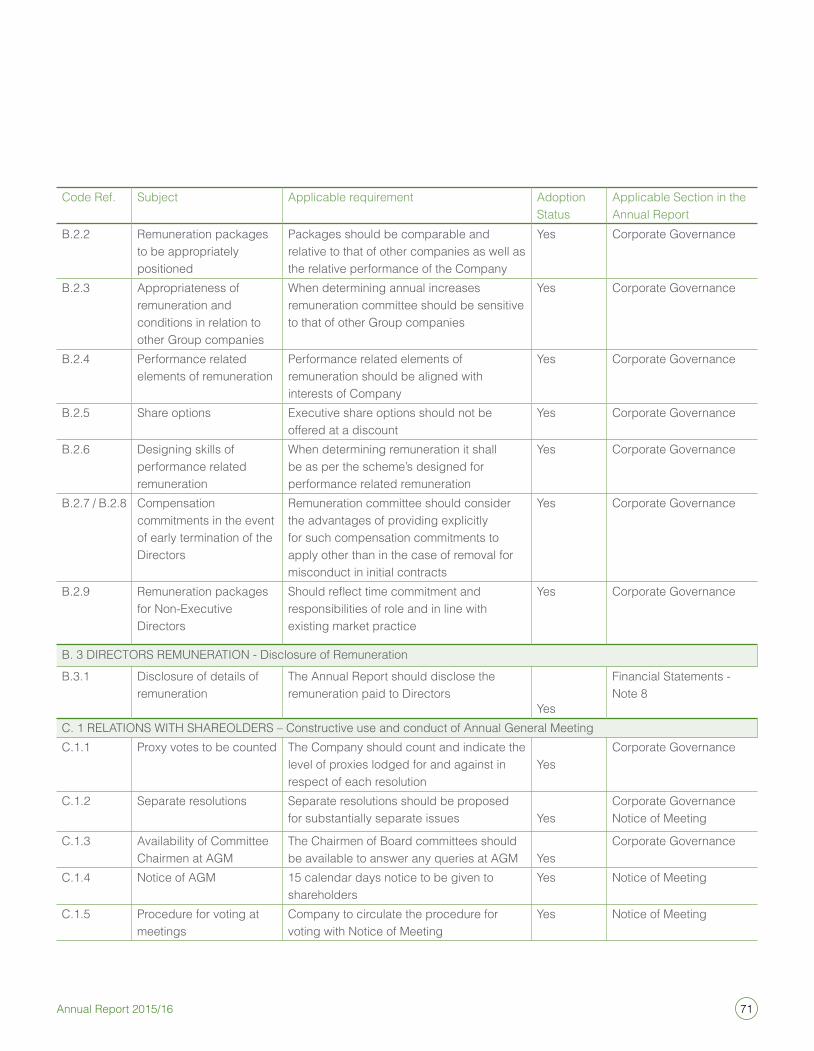
71Annual Report 2015/16
Code Ref. subject applicable requirement adoption status
applicable section in the annual Report
B.2.2 Remuneration packages to be appropriately positioned
Packages should be comparable and relative to that of other companies as well as the relative performance of the Company
Yes Corporate Governance
B.2.3 appropriateness of remuneration and conditions in relation to other Group companies
When determining annual increases remuneration committee should be sensitive to that of other Group companies
Yes Corporate Governance
B.2.4 Performance related elements of remuneration
Performance related elements of remuneration should be aligned with interests of Company
Yes Corporate Governance
B.2.5 share options executive share options should not be offered at a discount
Yes Corporate Governance
B.2.6 Designing skills of performance related remuneration
When determining remuneration it shall be as per the scheme’s designed for performance related remuneration
Yes Corporate Governance
B.2.7 / B.2.8 Compensation commitments in the event of early termination of the Directors
Remuneration committee should consider the advantages of providing explicitly for such compensation commitments to apply other than in the case of removal for misconduct in initial contracts
Yes Corporate Governance
B.2.9 Remuneration packages for non-executive Directors
Should reflect time commitment and responsibilities of role and in line with existing market practice
Yes Corporate Governance
B. 3 DiReCToRs ReMuneRaTion - Disclosure of Remuneration
B.3.1 Disclosure of details of remuneration
The annual Report should disclose the remuneration paid to Directors
Yes
Financial statements - note 8
C. 1 ReLaTions WiTH sHaReoLDeRs – Constructive use and conduct of annual General Meeting C.1.1 Proxy votes to be counted The Company should count and indicate the
level of proxies lodged for and against in respect of each resolution
YesCorporate Governance
C.1.2 separate resolutions separate resolutions should be proposed for substantially separate issues Yes
Corporate Governancenotice of Meeting
C.1.3 availability of Committee Chairmen at aGM
The Chairmen of Board committees should be available to answer any queries at aGM Yes
Corporate Governance
C.1.4 notice of aGM 15 calendar days notice to be given to shareholders
Yes notice of Meeting
C.1.5 Procedure for voting at meetings
Company to circulate the procedure for voting with notice of Meeting
Yes notice of Meeting
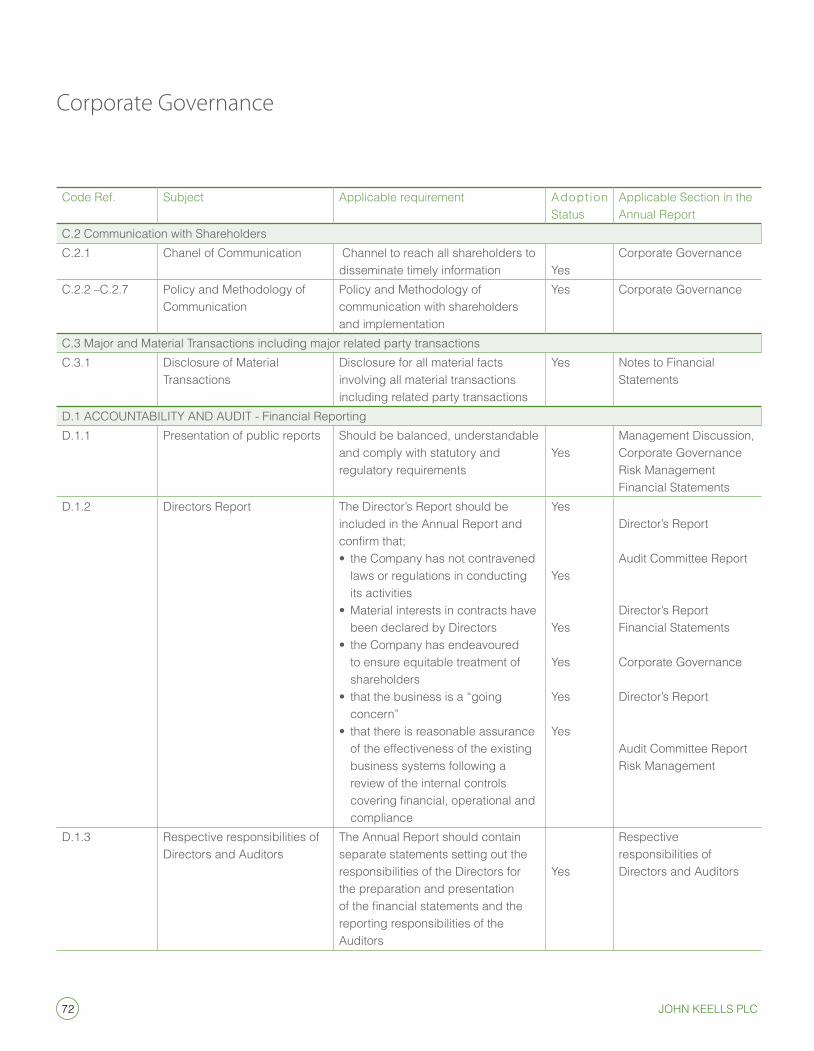
72 John Keells PlC
Corporate Governance
Code Ref. subject applicable requirement adoption status
applicable section in the annual Report
C.2 Communication with shareholdersC.2.1 Chanel of Communication Channel to reach all shareholders to
disseminate timely information YesCorporate Governance
C.2.2 –C.2.7 Policy and Methodology of Communication
Policy and Methodology of communication with shareholders and implementation
Yes Corporate Governance
C.3 Major and Material Transactions including major related party transactionsC.3.1 Disclosure of Material
TransactionsDisclosure for all material facts involving all material transactions including related party transactions
Yes notes to Financial statements
D.1 aCCounTaBiLiTY anD auDiT - Financial ReportingD.1.1 Presentation of public reports should be balanced, understandable
and comply with statutory and regulatory requirements
YesManagement Discussion, Corporate Governance Risk Management Financial statements
D.1.2 Directors Report The Director’s Report should be included in the annual Report and confirm that;• the Company has not contravened
laws or regulations in conducting its activities
• Material interests in contracts have been declared by Directors
• the Company has endeavoured to ensure equitable treatment of shareholders
• that the business is a “going concern”
• that there is reasonable assurance of the effectiveness of the existing business systems following a review of the internal controls covering financial, operational and compliance
Yes
Yes
Yes
Yes
Yes
Yes
Director’s Report
audit Committee Report
Director’s ReportFinancial statements
Corporate Governance
Director’s Report
audit Committee ReportRisk Management
D.1.3 Respective responsibilities of Directors and auditors
The annual Report should contain separate statements setting out the responsibilities of the Directors for the preparation and presentation of the financial statements and the reporting responsibilities of the auditors
Yes
Respective responsibilities of Directors and auditors
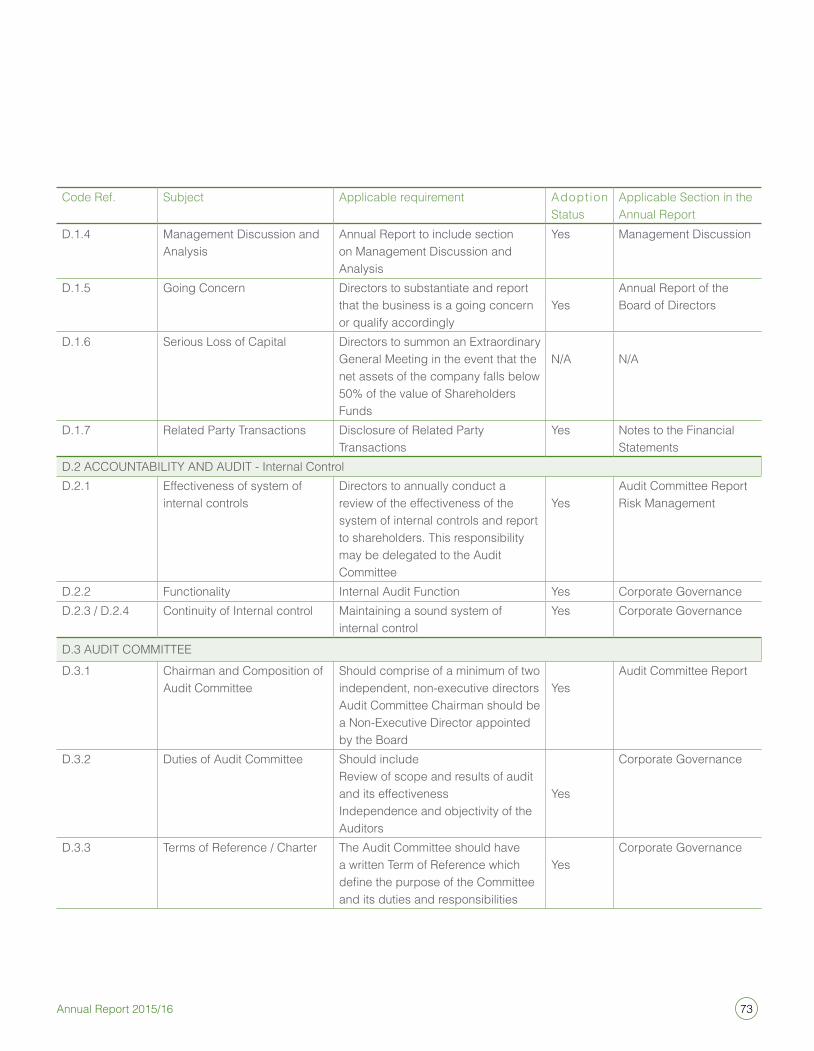
73Annual Report 2015/16
Code Ref. subject applicable requirement adoption status
applicable section in the annual Report
D.1.4 Management Discussion and analysis
annual Report to include section on Management Discussion and analysis
Yes Management Discussion
D.1.5 Going Concern Directors to substantiate and report that the business is a going concern or qualify accordingly
Yesannual Report of the Board of Directors
D.1.6 serious Loss of Capital Directors to summon an extraordinary General Meeting in the event that the net assets of the company falls below 50% of the value of shareholders Funds
n/a n/a
D.1.7 Related Party Transactions Disclosure of Related Party Transactions
Yes notes to the Financial statements
D.2 aCCounTaBiLiTY anD auDiT - internal Control D.2.1 effectiveness of system of
internal controlsDirectors to annually conduct a review of the effectiveness of the system of internal controls and report to shareholders. This responsibility may be delegated to the audit Committee
Yesaudit Committee ReportRisk Management
D.2.2 Functionality internal audit Function Yes Corporate GovernanceD.2.3 / D.2.4 Continuity of internal control Maintaining a sound system of
internal controlYes Corporate Governance
D.3 auDiT CoMMiTTee D.3.1 Chairman and Composition of
audit Committeeshould comprise of a minimum of two independent, non-executive directorsaudit Committee Chairman should be a non-executive Director appointed by the Board
Yesaudit Committee Report
D.3.2 Duties of audit Committee should includeReview of scope and results of audit and its effectivenessindependence and objectivity of the auditors
Yes
Corporate Governance
D.3.3 Terms of Reference / Charter The audit Committee should have a written Term of Reference which define the purpose of the Committee and its duties and responsibilities
YesCorporate Governance
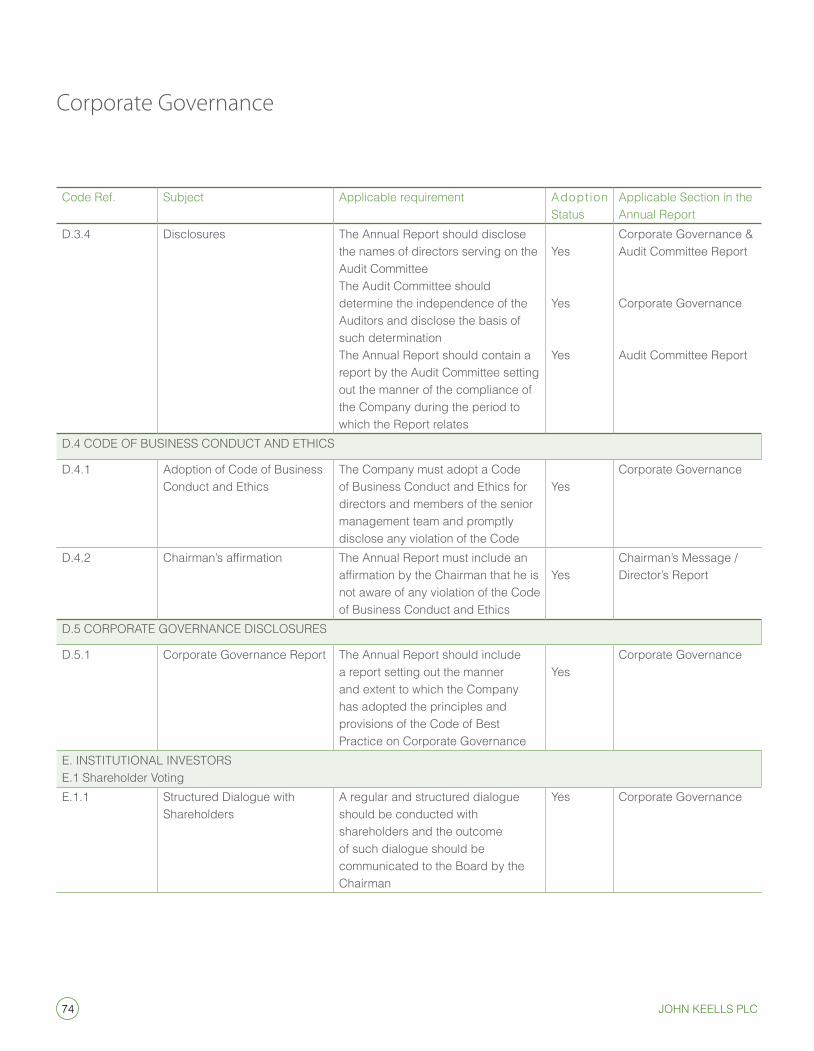
74 John Keells PlC
Corporate Governance
Code Ref. subject applicable requirement adoption status
applicable section in the annual Report
D.3.4 Disclosures The annual Report should disclose the names of directors serving on the audit Committee The audit Committee should determine the independence of the auditors and disclose the basis of such determinationThe annual Report should contain a report by the audit Committee setting out the manner of the compliance of the Company during the period to which the Report relates
Yes
Yes
Yes
Corporate Governance &audit Committee Report
Corporate Governance
audit Committee Report
D.4 CoDe oF Business ConDuCT anD eTHiCs
D.4.1 adoption of Code of Business Conduct and ethics
The Company must adopt a Code of Business Conduct and ethics for directors and members of the senior management team and promptly disclose any violation of the Code
YesCorporate Governance
D.4.2 Chairman’s affirmation The annual Report must include an affirmation by the Chairman that he is not aware of any violation of the Code of Business Conduct and ethics
YesChairman’s Message / Director’s Report
D.5 CoRPoRaTe GoVeRnanCe DisCLosuRes
D.5.1 Corporate Governance Report The annual Report should include a report setting out the manner and extent to which the Company has adopted the principles and provisions of the Code of Best Practice on Corporate Governance
YesCorporate Governance
e. insTiTuTionaL inVesToRs e.1 shareholder Votinge.1.1 structured Dialogue with
shareholdersa regular and structured dialogue should be conducted with shareholders and the outcome of such dialogue should be communicated to the Board by the Chairman
Yes Corporate Governance
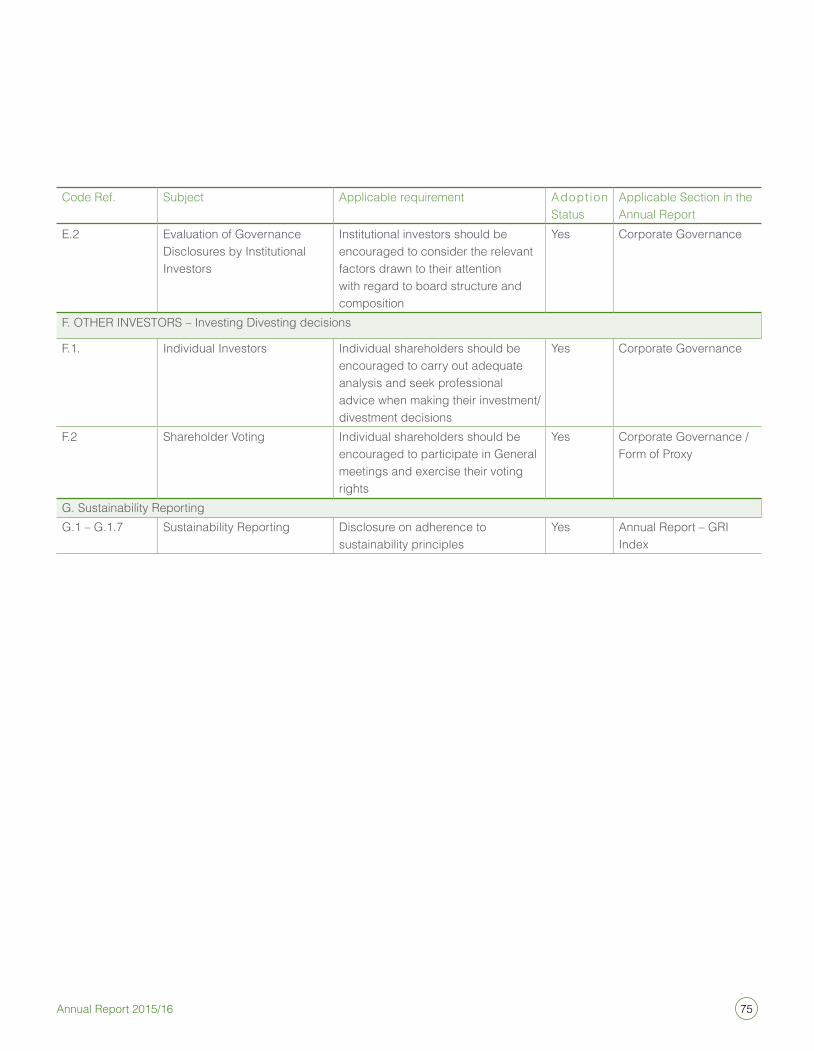
75Annual Report 2015/16
Code Ref. subject applicable requirement adoption status
applicable section in the annual Report
e.2 evaluation of Governance Disclosures by institutional investors
institutional investors should be encouraged to consider the relevant factors drawn to their attention with regard to board structure and composition
Yes Corporate Governance
F. oTHeR inVesToRs – investing Divesting decisions
F.1. individual investors individual shareholders should be encouraged to carry out adequate analysis and seek professional advice when making their investment/divestment decisions
Yes Corporate Governance
F.2 shareholder Voting individual shareholders should be encouraged to participate in General meetings and exercise their voting rights
Yes Corporate Governance / Form of Proxy
G. sustainability ReportingG.1 – G.1.7 sustainability Reporting Disclosure on adherence to
sustainability principlesYes annual Report – GRi
index
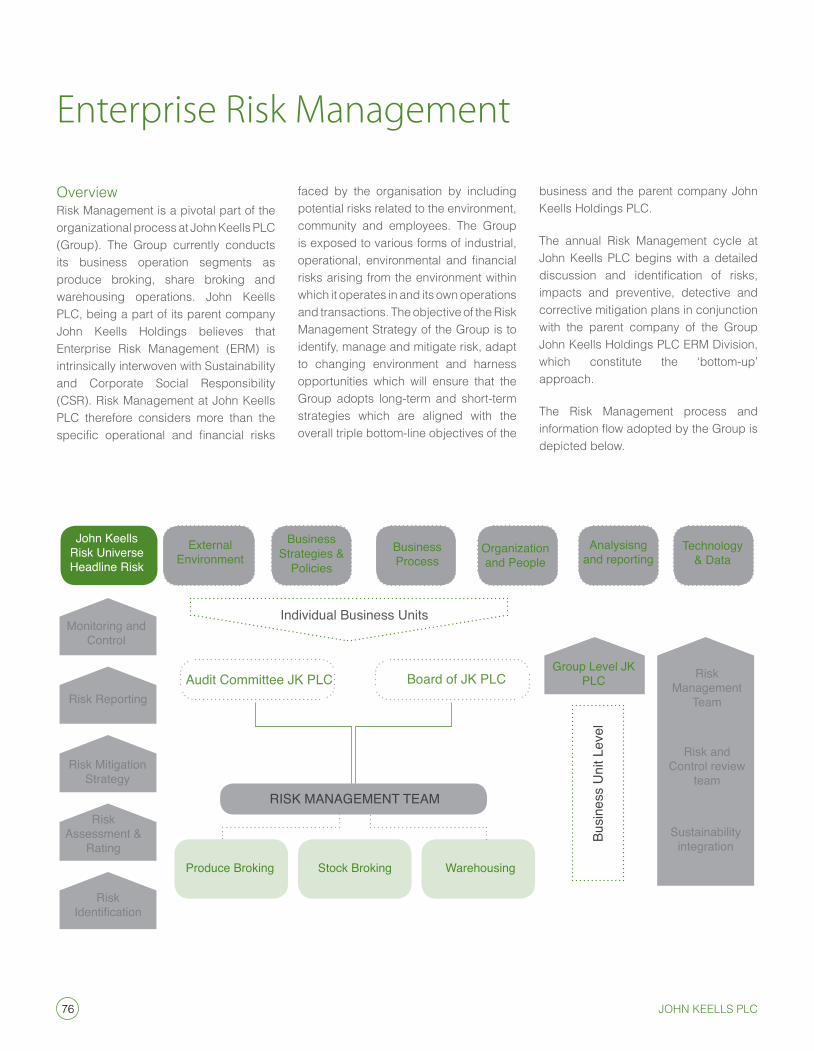
76 John Keells PlC
Enterprise Risk Management
overviewRisk Management is a pivotal part of the organizational process at John Keells PLC (Group). The Group currently conducts its business operation segments as produce broking, share broking and warehousing operations. John Keells PLC, being a part of its parent company John Keells Holdings believes that enterprise Risk Management (eRM) is intrinsically interwoven with sustainability and Corporate social Responsibility (CsR). Risk Management at John Keells PLC therefore considers more than the specific operational and financial risks
faced by the organisation by including potential risks related to the environment, community and employees. The Group is exposed to various forms of industrial, operational, environmental and financial risks arising from the environment within which it operates in and its own operations and transactions. The objective of the Risk Management strategy of the Group is to identify, manage and mitigate risk, adapt to changing environment and harness opportunities which will ensure that the Group adopts long-term and short-term strategies which are aligned with the overall triple bottom-line objectives of the
business and the parent company John Keells Holdings PLC.
The annual Risk Management cycle at John Keells PLC begins with a detailed discussion and identification of risks, impacts and preventive, detective and corrective mitigation plans in conjunction with the parent company of the Group John Keells Holdings PLC eRM Division, which constitute the ‘bottom-up’ approach.
The Risk Management process and information flow adopted by the Group is depicted below.
John Keells Risk universe Headline Risk
Monitoring and Control
Risk Reporting
Risk Mitigation Strategy
Risk Assessment &
Rating
Risk Identification
External Environment
Business Strategies &
Policies Business Process
Organization and People
Analysisng and reporting
Technology & Data
Individual Business units
RISK MANAGEMENT TEAM
Produce Broking Stock Broking Warehousing
Busi
ness
uni
t Lev
el
Group Level JK PLC Risk
Management Team
Risk and Control review
team
Sustainability integration
Board of JK PLCAudit Committee JK PLC
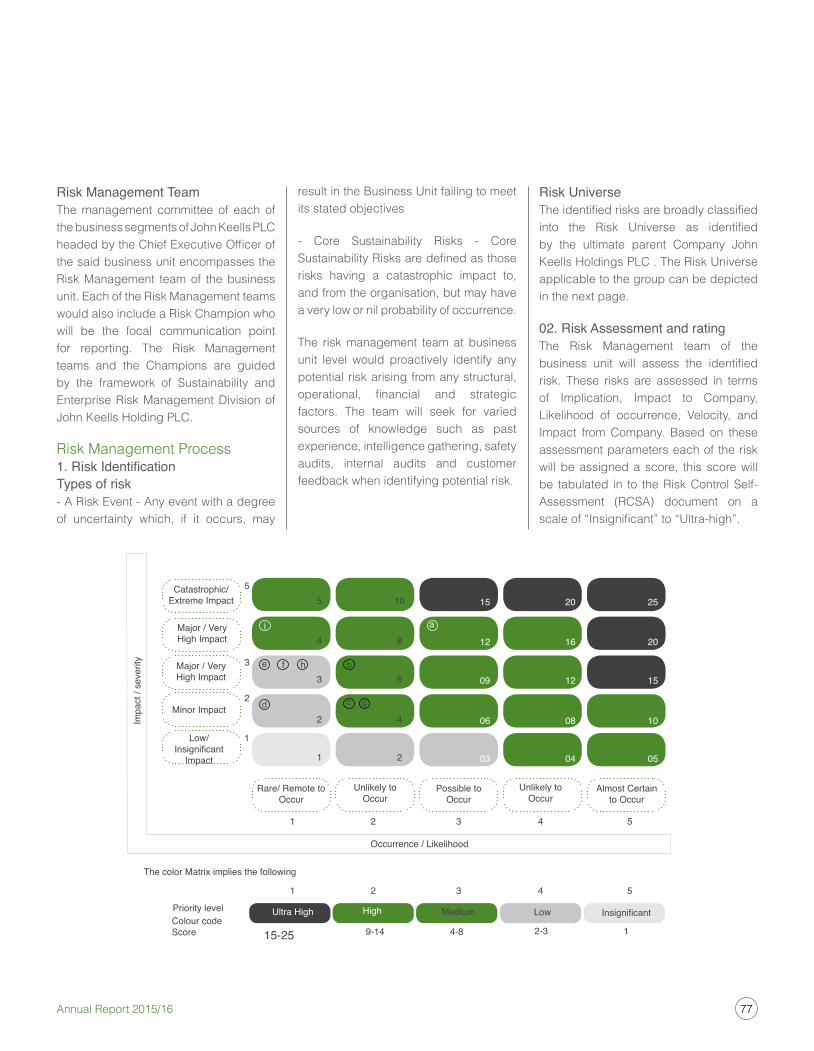
77Annual Report 2015/16
Risk Management Team The management committee of each of the business segments of John Keells PLC headed by the Chief Executive Officer of the said business unit encompasses the Risk Management team of the business unit. each of the Risk Management teams would also include a Risk Champion who will be the focal communication point for reporting. The Risk Management teams and the Champions are guided by the framework of sustainability and enterprise Risk Management Division of John Keells Holding PLC.
Risk Management Process1. Risk IdentificationTypes of risk- a Risk event - any event with a degree of uncertainty which, if it occurs, may
result in the Business unit failing to meet its stated objectives
- Core sustainability Risks - Core Sustainability Risks are defined as those risks having a catastrophic impact to, and from the organisation, but may have a very low or nil probability of occurrence.
The risk management team at business unit level would proactively identify any potential risk arising from any structural, operational, financial and strategic factors. The team will seek for varied sources of knowledge such as past experience, intelligence gathering, safety audits, internal audits and customer feedback when identifying potential risk.
Risk universe The identified risks are broadly classified into the Risk Universe as identified by the ultimate parent Company John Keells Holdings PLC . The Risk universe applicable to the group can be depicted in the next page.
02. Risk Assessment and ratingThe Risk Management team of the business unit will assess the identified risk. These risks are assessed in terms of implication, impact to Company, Likelihood of occurrence, Velocity, and impact from Company. Based on these assessment parameters each of the risk will be assigned a score, this score will be tabulated in to the Risk Control self-assessment (RCsa) document on a scale of “Insignificant” to “Ultra-high”.
Catastrophic/ Extreme Impact
Major / Very High Impact
Minor Impact
Low/ Insignificant
Impact
Rare/ Remote to Occur
unlikely to Occur
Possible to Occur
unlikely to Occur
Almost Certain to Occur
Major / Very High Impact
5
4
3
3
2
2
1
1
1
1
10
8
6
4
2
3
3
4
4
5
5
2
2
15
12
09
06
03
20
16
12
08
04
25
20
15
10
05
5
The color Matrix implies the following
Priority levelColour codeScore
ultra High High
15-25
Medium Low Insignificant
9-14 4-8 2-3 1
e f h
ai
d g
b
c
Occurrence / Likelihood
Impa
ct /
seve
rity
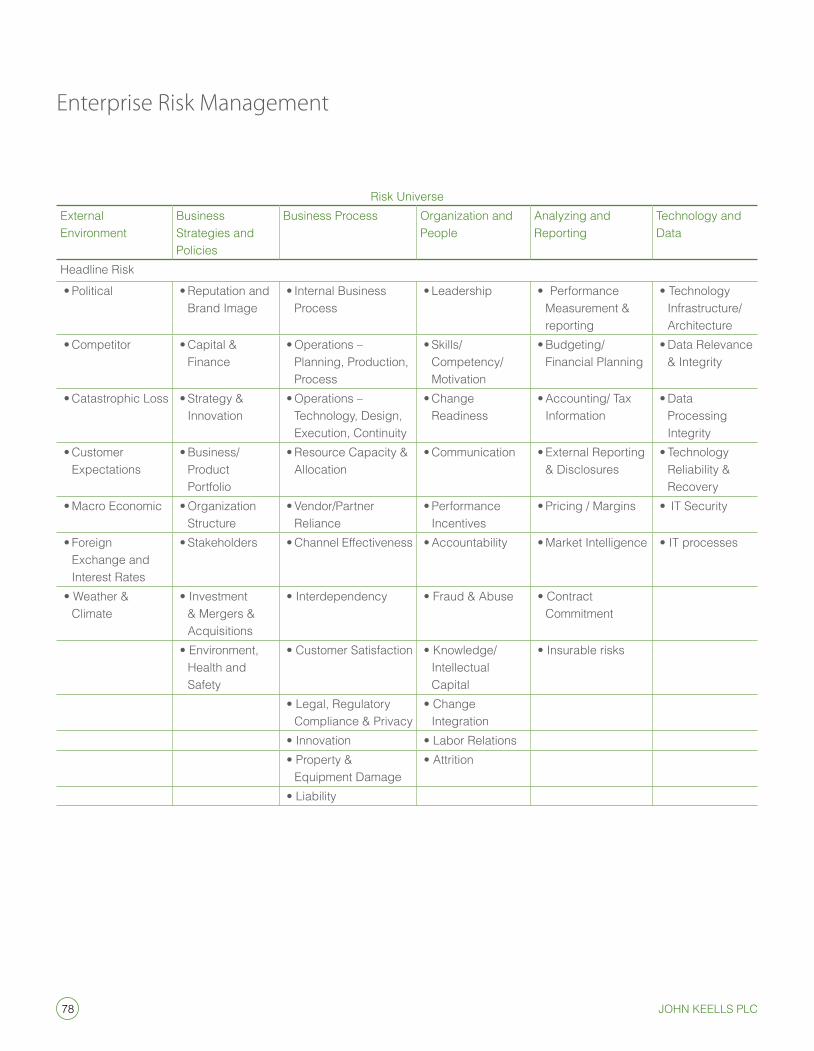
78 John Keells PlC
Enterprise Risk Management
Risk universeexternal environment
Business strategies and Policies
Business Process organization and People
analyzing and Reporting
Technology and Data
Headline Risk • Political • Reputation and
Brand image • Internal Business
Process • Leadership • Performance
Measurement & reporting
• Technology infrastructure/ architecture
• Competitor • Capital & Finance
• Operations – Planning, Production, Process
• Skills/ Competency/Motivation
• Budgeting/ Financial Planning
• Data Relevance & integrity
• Catastrophic Loss • Strategy & innovation
• Operations – Technology, Design, execution, Continuity
• Change Readiness
• Accounting/ Tax information
• Data Processing integrity
• Customer expectations
• Business/Product Portfolio
• Resource Capacity & allocation
• Communication • External Reporting & Disclosures
• Technology Reliability & Recovery
• Macro Economic • Organization structure
• Vendor/Partner Reliance
• Performance incentives
• Pricing / Margins • IT Security
• Foreign exchange and interest Rates
• Stakeholders • Channel Effectiveness • Accountability • Market Intelligence • IT processes
• Weather & Climate
• Investment & Mergers & acquisitions
• Interdependency • Fraud & Abuse • Contract Commitment
• Environment, Health and safety
• Customer Satisfaction • Knowledge/ intellectual Capital
• Insurable risks
• Legal, Regulatory Compliance & Privacy
• Change integration
• Innovation • Labor Relations • Property &
equipment Damage • Attrition
• Liability
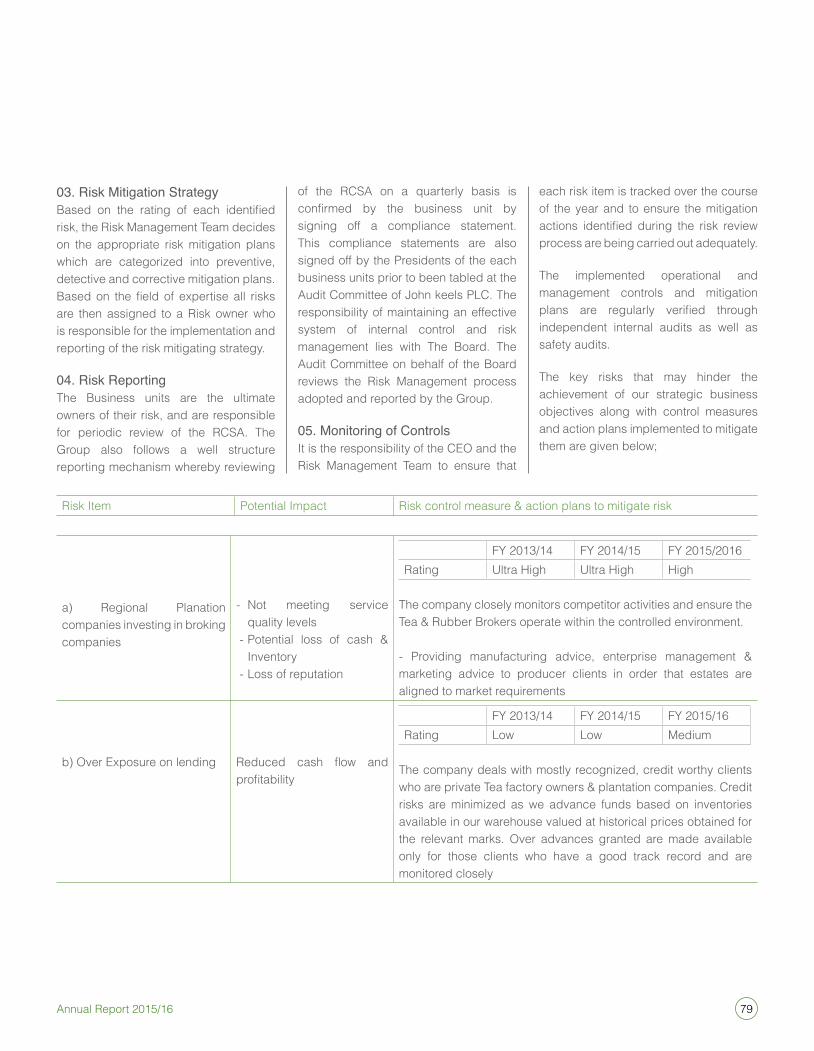
79Annual Report 2015/16
03. Risk Mitigation Strategy Based on the rating of each identified risk, the Risk Management Team decides on the appropriate risk mitigation plans which are categorized into preventive, detective and corrective mitigation plans. Based on the field of expertise all risks are then assigned to a Risk owner who is responsible for the implementation and reporting of the risk mitigating strategy.
04. Risk ReportingThe Business units are the ultimate owners of their risk, and are responsible for periodic review of the RCsa. The Group also follows a well structure reporting mechanism whereby reviewing
of the RCsa on a quarterly basis is confirmed by the business unit by signing off a compliance statement. This compliance statements are also signed off by the Presidents of the each business units prior to been tabled at the audit Committee of John keels PLC. The responsibility of maintaining an effective system of internal control and risk management lies with The Board. The audit Committee on behalf of the Board reviews the Risk Management process adopted and reported by the Group.
05. Monitoring of Controls it is the responsibility of the Ceo and the Risk Management Team to ensure that
each risk item is tracked over the course of the year and to ensure the mitigation actions identified during the risk review process are being carried out adequately.
The implemented operational and management controls and mitigation plans are regularly verified through independent internal audits as well as safety audits.
The key risks that may hinder the achievement of our strategic business objectives along with control measures and action plans implemented to mitigate them are given below;
Risk item Potential impact Risk control measure & action plans to mitigate risk
a) Regional Planation companies investing in broking companies
- not meeting service quality levels
- Potential loss of cash & inventory
- Loss of reputation
FY 2013/14 FY 2014/15 FY 2015/2016Rating ultra High ultra High High
The company closely monitors competitor activities and ensure the Tea & Rubber Brokers operate within the controlled environment.
- Providing manufacturing advice, enterprise management & marketing advice to producer clients in order that estates are aligned to market requirements
b) over exposure on lending Reduced cash flow and profitability
FY 2013/14 FY 2014/15 FY 2015/16Rating Low Low Medium
The company deals with mostly recognized, credit worthy clients who are private Tea factory owners & plantation companies. Credit risks are minimized as we advance funds based on inventories available in our warehouse valued at historical prices obtained for the relevant marks. over advances granted are made available only for those clients who have a good track record and are monitored closely
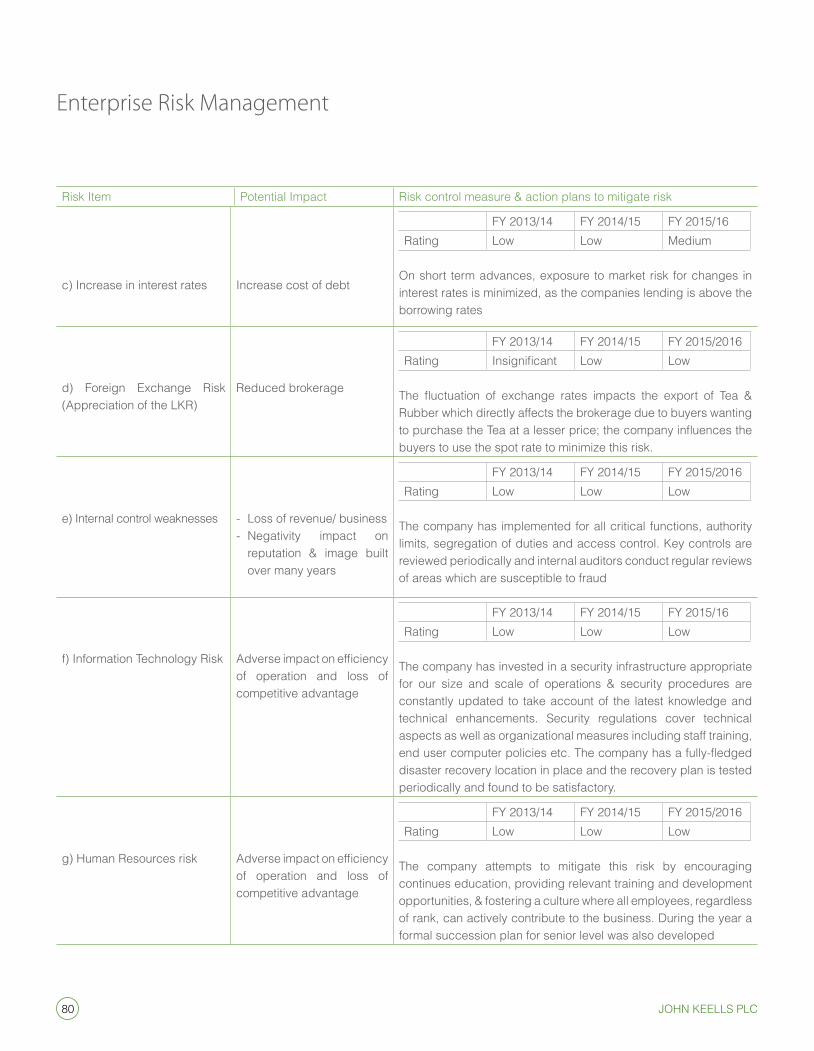
80 John Keells PlC
Enterprise Risk Management
Risk item Potential impact Risk control measure & action plans to mitigate risk
c) increase in interest rates increase cost of debt
FY 2013/14 FY 2014/15 FY 2015/16Rating Low Low Medium
on short term advances, exposure to market risk for changes in interest rates is minimized, as the companies lending is above the borrowing rates
d) Foreign exchange Risk (appreciation of the LKR)
Reduced brokerage
FY 2013/14 FY 2014/15 FY 2015/2016Rating Insignificant Low Low
The fluctuation of exchange rates impacts the export of Tea & Rubber which directly affects the brokerage due to buyers wanting to purchase the Tea at a lesser price; the company influences the buyers to use the spot rate to minimize this risk.
e) internal control weaknesses - Loss of revenue/ business- negativity impact on
reputation & image built over many years
FY 2013/14 FY 2014/15 FY 2015/2016Rating Low Low Low
The company has implemented for all critical functions, authority limits, segregation of duties and access control. Key controls are reviewed periodically and internal auditors conduct regular reviews of areas which are susceptible to fraud
f) information Technology Risk Adverse impact on efficiency of operation and loss of competitive advantage
FY 2013/14 FY 2014/15 FY 2015/16Rating Low Low Low
The company has invested in a security infrastructure appropriate for our size and scale of operations & security procedures are constantly updated to take account of the latest knowledge and technical enhancements. security regulations cover technical aspects as well as organizational measures including staff training, end user computer policies etc. The company has a fully-fledged disaster recovery location in place and the recovery plan is tested periodically and found to be satisfactory.
g) Human Resources risk Adverse impact on efficiency of operation and loss of competitive advantage
FY 2013/14 FY 2014/15 FY 2015/2016Rating Low Low Low
The company attempts to mitigate this risk by encouraging continues education, providing relevant training and development opportunities, & fostering a culture where all employees, regardless of rank, can actively contribute to the business. During the year a formal succession plan for senior level was also developed
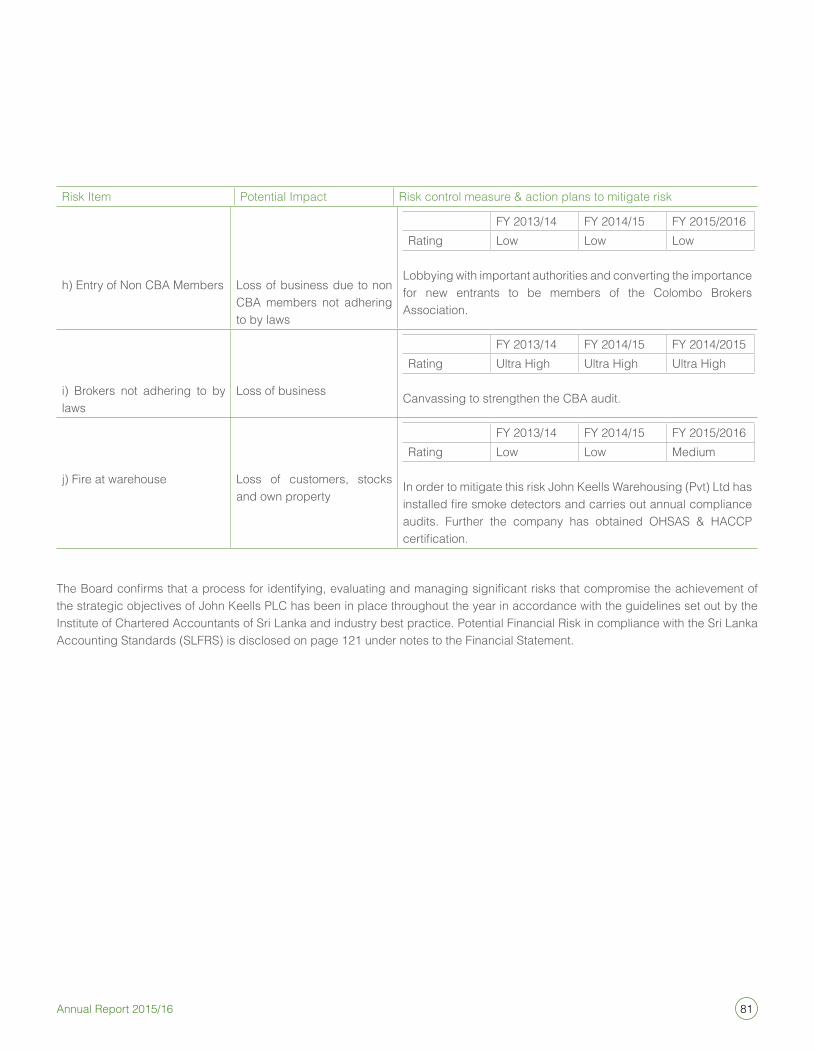
81Annual Report 2015/16
Risk item Potential impact Risk control measure & action plans to mitigate risk
h) entry of non CBa Members Loss of business due to non CBa members not adhering to by laws
FY 2013/14 FY 2014/15 FY 2015/2016Rating Low Low Low
Lobbying with important authorities and converting the importance for new entrants to be members of the Colombo Brokers association.
i) Brokers not adhering to by laws
Loss of business
FY 2013/14 FY 2014/15 FY 2014/2015Rating ultra High ultra High ultra High
Canvassing to strengthen the CBa audit.
j) Fire at warehouse Loss of customers, stocks and own property
FY 2013/14 FY 2014/15 FY 2015/2016Rating Low Low Medium
in order to mitigate this risk John Keells Warehousing (Pvt) Ltd has installed fire smoke detectors and carries out annual compliance audits. Further the company has obtained oHsas & HaCCP certification.
The Board confirms that a process for identifying, evaluating and managing significant risks that compromise the achievement of the strategic objectives of John Keells PLC has been in place throughout the year in accordance with the guidelines set out by the institute of Chartered accountants of sri Lanka and industry best practice. Potential Financial Risk in compliance with the sri Lanka accounting standards (sLFRs) is disclosed on page 121 under notes to the Financial statement.
82 John Keells PlC
Audit Committee Report
introductionThe Board audit Committee (BaC) of John Keells PLC is formally constituted as a sub Committee of the Main Board, to which it is accountable.
The Committee operates pursuant to the audit Committee Charter which is reviewed annually by the Committee.
This report focuses on the activities of the audit Committee for the year under review. a more general description of the Committee’s functions is also given under Corporate Governance Report on page 44 to 75.
Role of the Board audit CommitteeThe BaC in its role, assist the Board
in fulfilling their responsibilities with regard to;
- Ensuring the integrity of the financial statements of the company and that good financial reporting systems are in place and is managed in order to give accurate, appropriate and timely information to the management, regulatory authorities and shareholders in accordance to the financial reporting standards of The institute of Chartered accountant of sri Lanka,Companies act no. 7 of 2007, the sri Lanka accounting and auditing standards and the continuing Listing Rules of the Colombo stock exchange.
- ensure compliance with applicable laws, regulations and policies of the group and Company
- assessing the independence and monitoring the performance of external auditors and outsourced internal auditors.
- ensuring the Company’s internal control and risk management process efficient and effective.
- assess the Company’s ability to continue as a going concern in the foreseen future.
Composition of the Board audit Committee and Meetings:- The audit Committee comprised of three independent non-executive Directors for the financial year 2015/16. The Financial Controller for the Plantation services sector of John Keells group serves as the secretary to the audit Committee.
The President of the Plantation services sector of John Keells group, Chief Executive Officer of John Keells PLC (JK PLC), Finance Manager of JK PLC, Chief Executive Officer of John Keells stock Brokers (Pvt) Ltd (JKsB), Finance Manager of JKsB and Head of Group Business Process Review (Group BPR), John Keells Holdings PLC attend the meetings of the audit Committee by invitation. Other officials are invited to attend on a needs basis. The external auditors and the outsourced internal auditors also attend meetings on invitation when required.
The Board audit Committee (BaC) is composed of the following independent non-executive Directors who conduct Committee proceedings in accordance with the terms of reference set out in the audit Committee Charter.
• Ms S T Ratwatte – Chairperson• Mr T De Zoysa – Director• Ms Y A Hansen– Director
Whilst a detailed profile of the Board of Directors is given on Page no’s 14 to 15,
a brief description of each Member of the Board audit Committee is given below :-
Ms s T Ratwatte serves as the Chairpersion of the Board audit Committee since May 2013 and on the audit committee since May 2007. she is a Fellow Member of the Chartered institute of Management accountants in uK and also holds a Masters in Business administration from the university of Colombo. she also serves as a non-executive Director in Mas investments (Pvt) Ltd and is a Trustee of sunera Foundation and Trustee and Chairman of the Federation of environmental organisations.
Mr T De Zoysa, a well-known figure in the sri Lankan business community has been serving the Board and the audit committee since July 2005. He also holds many key positions in both commercial and non–profitmaking local and international organization.
Ms Y a Hansen was appointed to the Board and as a member of the audit Committee in July 2005. she is one of the pioneers in the Tourism industry with over 43 years of industry experience. she currently serves as the Chief executive Officer at Columbus Tours (Pvt) Ltd.
Meetings of the Board audit CommitteeThe audit Committee held four meetings during the financial year 2015/2016. The attendance of the Committee members at these meetings was as follows:name of Director
atten-dance
eligibility to attend
Ms s T Ratwatte 4 4Mr T De Zoysa 4 4Ms Y a Hansen 4 4
83Annual Report 2015/16
The activities and views of the Committee have been communicated to the Board of Directors when necessary.
Financial ReportingThe audit Committee has reviewed and discussed the Company’s quarterly and annual financial statements prior to publication with management and the external auditors, including the extent of compliance with sri Lanka accounting standards and the adequacy of disclosures required by other applicable laws, rules, and guidelines. The Committee has also regularly discussed the operations of the Company and its future prospects with management and is satisfied that all relevant matters have been taken into account in the preparation of the financial statements.
internal audit and control assessmentThe internal audit plans and scope of work were formulated in consultation with the internal audit function, which at John Keells is termed Group Business Process Review (Group BPR) Division and the outsourced internal auditors and approved by the Committee.
The main focus of the internal audit was to provide independent assurance on the overall system of internal controls, risk management and governance, by evaluating the adequacy and effectiveness of internal controls, and compliance with laws and regulations and established policies and procedures of the company.
During the year, reports were received by the Committee from the outsourced internal auditors, which were reviewed and discussed with management, the
outsourced internal auditors, BDo Partners and Group Business Process Review Division. The recommendations of the internal auditors have been followed up and implemented.
Risk assessmentThe audit Committee has also reviewed the processes for the identification, evaluation and management of all significant operational risks faced by the Company. The most significant operational risks and the remedial measures taken to mitigate them have been reviewed with management and the John Keells Group sustainability and enterprise Risk Management Division.
Formal confirmations and assurances have been received from senior management quarterly regarding the efficacy and status of the internal control systems and risk management systems, and compliance with applicable laws and regulations.
external auditThe external auditors’ letter of engagement, including the scope of the audit, was reviewed and discussed by the Committee with the external auditors and management prior to the commencement of the audit.
The external auditors kept the Committee advised on an on-going basis regarding any unresolved matters of significance. Before the conclusion of the audit, the Committee met with the external auditors to discuss all audit issues and agree on their treatment. The Committee also met the external auditors, without management present, prior to the finalization of the financial statements. The external auditors’ management
letter for the year 2014/15, together with management’s responses was discussed with management and the auditors.
The Audit Committee is satisfied that the independence of the external auditors has not been impaired by any event or service that gives rise to a conflict of interest. Due consideration has been given to the level of audit and non-audit fees received by the external auditors from the John Keells Group and confirmation has been received from the external auditors of their compliance with the independence criteria given in the Code of ethics of the institute of Chartered accountants of sri Lanka.
The performance of the external auditors has been evaluated and discussed with the senior Management of the Company, and the Committee has recommended to the Board that Messrs. ernst & Young be re-appointed as the external auditors of John Keells PLC for the financial year ending 31st March 2017, subject to approval by the shareholders at the annual General Meeting.
information Technology Risk assessmentThe company seeks the services of information Technology (iT) to provide value added services to its customers as well as to make the internal processes more efficient and effective. The committee draws conformity from the Head of iT plantation services sector as well as internal auditors Messer’s BDo Partners when disseminating this role.
Whistle Blowing assessmentThe company has an established mechanism for employees to report to the Chairman of John Keells Holdings
84 John Keells PlC
Audit Committee Report
through a communication link named “Chairman Direct” about any unethical behavior or any violation of group values. employees reporting such incidents are guaranteed complete confidentiality. The committee reviews this process on a periodic basis.
Compliance with Code of Best Practice on audit CommitteeThe BaC scope and functions are in compliance with the requirements of the Code of Best Practice on audit Committee.
Compliance with code of Best Practice on Corporate Governance
The BaC has conducted its affairs with the requirements of the code of best practice on Corporate Governance.
Compliance with Corporate Governance Rules as per section 7.10 of the listing Rules of the Colombo stock exchange
The BaC has conducted its affairs with the requirements with Corporate Governance Rules as per section 7.10 of the listing Rules of the Colombo stock exchange.
audit Committee CharterThe audit Committee Charter was reviewed in october 2015 with the concurrence of the Board of Directors.
evaluation of the Board audit Committeeevaluation of the BaC is done on a periodic basis. The committee seeks the assistance of the Group Business Process Review Team for this purpose. The members of the BaC along with other participants such as President
of the Plantation services sector, Chief Executive officer (JKPLC) ,Chief Executive officer (JKSB) and Financial controller Plantation service sector assess the comittee. The assessment is tabled at the audit committee meeting and communicated to the board of the Company.
ConclusionBased on the reports submitted by the external auditors and the outsourced internal auditors of the Company, the assurances and certifications provided by the senior management, and the discussions with management and the auditors both at formal meetings and informally, the Committee is of the view that the control environment within the Company is satisfactory and provides reasonable assurance that the financial position of the Company is adequately monitored and its assets are safeguarded.
S T RatwatteChairperson of the Audit Committee27th May 2016
85Annual Report 2015/16
Annual Report of the Board of Directors
annual Report of the Board of DirectorsThe Directors have pleasure in presenting the 69th annual Report of your Company together with the audited Financial statements of John Keells PLC., and the audited Consolidated Financial statements of the Group for the year ended 31st March, 2016.
GeneralThe Company was incorporated on 01st april 1960 as a Public Limited Liability Company and the issued shares of the Company are listed on the Colombo stock exchange. Pursuant to the requirements of the Companies act no. 7 of 2007, the Company obtained a new Company registration no. PQ11 on 15th June 2007.
Principal activitiesCompanyThe principal activity of the Company remain unchanged as produce broking.
SubsiditariesJohn Keells stock Brokers (Private) Limited continues to provide stock broking services.
John Keells Warehousing (Private) Limited continues to provide warehousing facilities.
Business Reviewa review of the Company and its subsidiaries (Group’s) performance during the financial year is given in the Chairman’s Message and in the Management Discussion and analysis. These reports form an integral part of the Directors Report and provide a fair review of the performance of the Group during the financial year ended 31st March 2016.
Financial statementsThe Financial statements of the Company and the Group are set out on page 94 to 145 of the annual Report.
auditor’s ReportThe auditor’s Report on the Financial statements are given on page 93 of the annual Report.
Significant Accounting PoliciesThe accounting Policies adopted in the preparation of the Financial statements are given on page 100 to 113 of the annual Report.
Going ConcernThe Board of Directors is satisfied that the Company, its subsidiaries and associate, have adequate resources to continue its operations in the foreseeable future. accordingly, the Financial statements are prepared based on the “Going Concern Concept”.
stated CapitalThe total stated capital of the Company as at 31st March 2016 was Rs.152 million (2015 - Rs.152 million).
RevenueRevenue generated by the Company amounted to Rs. 425 million (2015 - Rs. 559 million), whilst Group revenue amounted to Rs. 707 million (2015 - Rs. 960 million). Contribution to Group revenue, from the different business segments is provided in note 3.2 to the Financial statements on page 114.
Results and appropriationsThe profit after tax of the Company was Rs. 144 million (2015 - Rs.188 million) whilst the Group profit attributable to equity holders of the parent Company for
the year was Rs. 53 million (2015 - Rs. 217 million).
Results of the Company and of the Group are given in the income statement on page 94.
Dividendon 19th June 2015, a First and Final Dividend of Rs. 3.75 per share (2014 - Rs.3.40) was paid for the financial year ended 31st March 2015 amounting to Rs.228 million (2014 - Rs. 207 million).
Dividend per share has been computed based on the amount of dividends recognized as distribution to the equity holders during the period.
The Directors have recommended a First and Final Dividend of Rs.1.00 per share for the year ended 31st March 2016 from the profits available for appropriation. in accordance with the sri Lanka accounting standards, events after the Reporting Period, the proposed dividend has not been recognized as a liability as at 31st March 2016.
as required by section 56 (2) of the Companies act no. 7 of 2007, the Board of Directors have, certified that the Company satisfies the solvency test in accordance with section 57 of the Companies act no. 7 of 2007, and have obtained a certificate from the auditors, prior to approving the First and Final Dividend of Rs.1.00 per share for this year. The First and Final Dividend will be paid on 16th June 2016 to those shareholders on the register as at 6th June 2016.
G4-13, G4-14
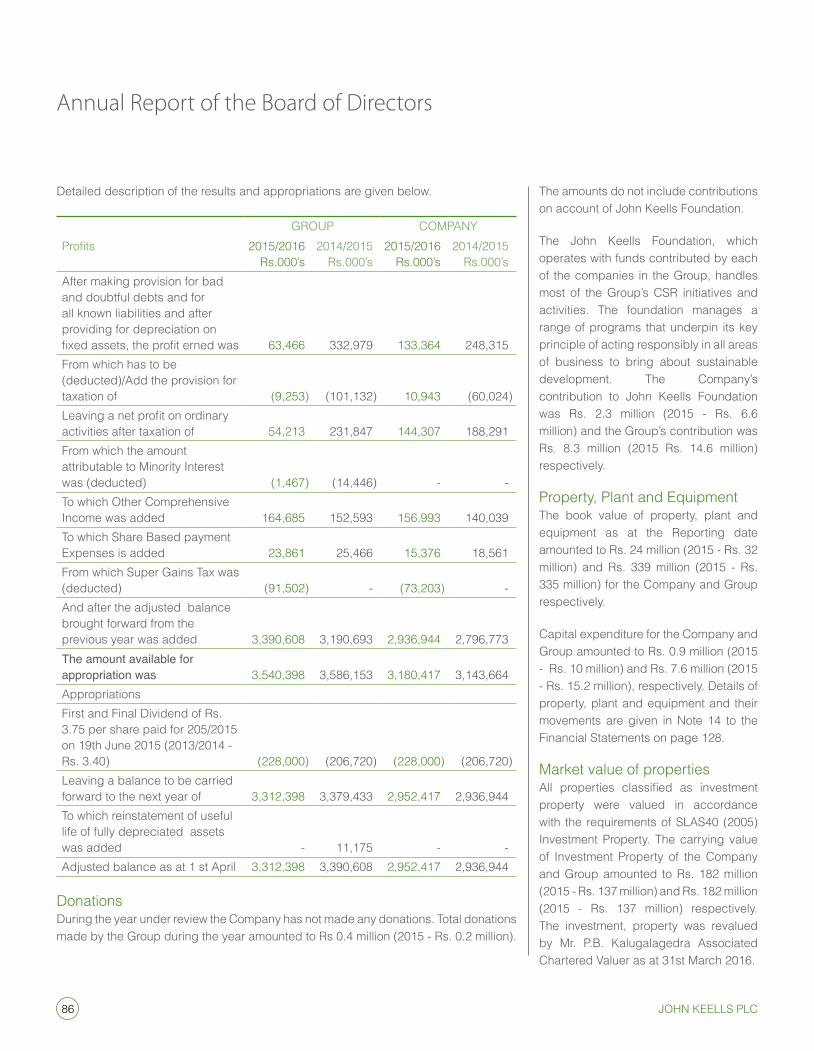
86 John Keells PlC
Annual Report of the Board of Directors
Detailed description of the results and appropriations are given below.
GRouP CoMPanYProfits 2015/2016
Rs.000’s2014/2015
Rs.000’s2015/2016
Rs.000’s2014/2015
Rs.000’safter making provision for bad and doubtful debts and for all known liabilities and after providing for depreciation on fixed assets, the profit erned was 63,466 332,979 133,364 248,315 From which has to be (deducted)/add the provision for taxation of (9,253) (101,132) 10,943 (60,024)Leaving a net profit on ordinary activities after taxation of 54,213 231,847 144,307 188,291 From which the amount attributable to Minority interest was (deducted) (1,467) (14,446) - - To which other Comprehensive income was added 164,685 152,593 156,993 140,039 To which share Based payment expenses is added 23,861 25,466 15,376 18,561 From which super Gains Tax was (deducted) (91,502) - (73,203) - and after the adjusted balance brought forward from the previous year was added 3,390,608 3,190,693 2,936,944 2,796,773 The amount available for appropriation was 3,540,398 3,586,153 3,180,417 3,143,664 appropriationsFirst and Final Dividend of Rs. 3.75 per share paid for 205/2015 on 19th June 2015 (2013/2014 - Rs. 3.40) (228,000) (206,720) (228,000) (206,720)Leaving a balance to be carried forward to the next year of 3,312,398 3,379,433 2,952,417 2,936,944 To which reinstatement of useful life of fully depreciated assets was added - 11,175 - - adjusted balance as at 1 st april 3,312,398 3,390,608 2,952,417 2,936,944
DonationsDuring the year under review the Company has not made any donations. Total donations made by the Group during the year amounted to Rs 0.4 million (2015 - Rs. 0.2 million).
The amounts do not include contributions on account of John Keells Foundation.
The John Keells Foundation, which operates with funds contributed by each of the companies in the Group, handles most of the Group’s CsR initiatives and activities. The foundation manages a range of programs that underpin its key principle of acting responsibly in all areas of business to bring about sustainable development. The Company’s contribution to John Keells Foundation was Rs. 2.3 million (2015 - Rs. 6.6 million) and the Group’s contribution was Rs. 8.3 million (2015 Rs. 14.6 million) respectively.
Property, Plant and equipmentThe book value of property, plant and equipment as at the Reporting date amounted to Rs. 24 million (2015 - Rs. 32 million) and Rs. 339 million (2015 - Rs. 335 million) for the Company and Group respectively.
Capital expenditure for the Company and Group amounted to Rs. 0.9 million (2015 - Rs. 10 million) and Rs. 7.6 million (2015 - Rs. 15.2 million), respectively. Details of property, plant and equipment and their movements are given in note 14 to the Financial statements on page 128.
Market value of propertiesAll properties classified as investment property were valued in accordance with the requirements of sLas40 (2005) investment Property. The carrying value of investment Property of the Company and Group amounted to Rs. 182 million (2015 - Rs. 137 million) and Rs. 182 million (2015 - Rs. 137 million) respectively. The investment, property was revalued by Mr. P.B. Kalugalagedra associated Chartered Valuer as at 31st March 2016.
87Annual Report 2015/16
Details of the valuation of investment property is provided in note 15 to the Financial statements on page 130.
The real estate portfolio of the Group as at 31st March 2016 is disclosed on page 130.
investmentsinvestments of the Company and the Group in subsidiaries, associate, and other external investments amounted to Rs. 2,498 million (2015 - Rs. 2,339 million) and Rs. 2,452 million (2015 - Rs. 2,288 million), respectively.
Detailed description of the long term investments held as 31st March 2016, are given in notes 16, 17 and 20 to the Financial statements on pages 132 and 135.
ReservesTotal reserves as at 31st March 2016 of the Company and Group amounted to Rs. 2,800 million (2015 - Rs. 2,785 million) and Rs. 3,160 million (2015 - Rs. 3,239 million), respectively.
The movement and composition of the Capital and Revenue reserves is disclosed in the statement of Changes in equity on page 97.
events occurring after the Reporting DateThere have been no events subsequent to the Reporting date, which would have any material effect on the Company or on the Group other than those disclosed in note 37 to the Financial statements on page 145.
Contingent liabilities and Capital CommitmentsThere have been no commitments or Contingent liabilities other than those stated in note 36 on page 145 of the annual Report.
Human ResourcesThe number of persons employed by the Company and Group as at 31st March 2016 was 64 (2015 - 66) and 96 (2015 - 95), respectively.
The Group is committed to pursuing various HR initiatives that ensure the individual development of all our teams as well as facilitating the creation of value for themselves, the Company and all other stakeholders.
There were no material issues pertaining to employees and industrial relations in the year under review.
Corporate GovernanceCorporate Governance practices and principles with respect to the Management and operations of the Company is set out on page 44 of this report. The Directors confirm that the Company is in compliance with the relevant rules on Corporate Governance contained in the listing rules of the Colombo stock exchange.
The Directors declare that:a) The Company has not engaged in
any activities, which contravene laws and regulations;
andb) The Directors have declared all
material interest in contracts involving the Company and refrained from voting on matters in which they were materially interested; and
c) The Company has made all endeavours to ensure the equitable treatment of shareholders; and
d) The business is a Going Concern with supporting assumptions or qualifications as necessary; and
e) The Directors have conducted a review of internal controls covering financial operational and compliance controls and risk management and have obtained a reasonable assurance of their effectiveness and successful adherence herewith.
Risk Management and internal ControlThe Board confirms that there is an ongoing process for identifying, evaluating and managing any significant risks faced by the Group. Risk assessment and evaluation for each business unit takes place as an integral part of the annual strategic planning cycle and the principle risks and mitigating actions in place are reviewed regularly by the Board and the audit Committee. The Board, through the involvement of the risk review and Control Division takes steps to gain assurance on the effectiveness of control systems in place. The audit Committee receives reports on the results of internal control reviews and the Head of the Group risk review and Control Department has direct access to the Chairman of the audit Committee.
audit CommitteeThe following independent non-executive, Directors of the Board served on the audit Committee of John Keells PLC
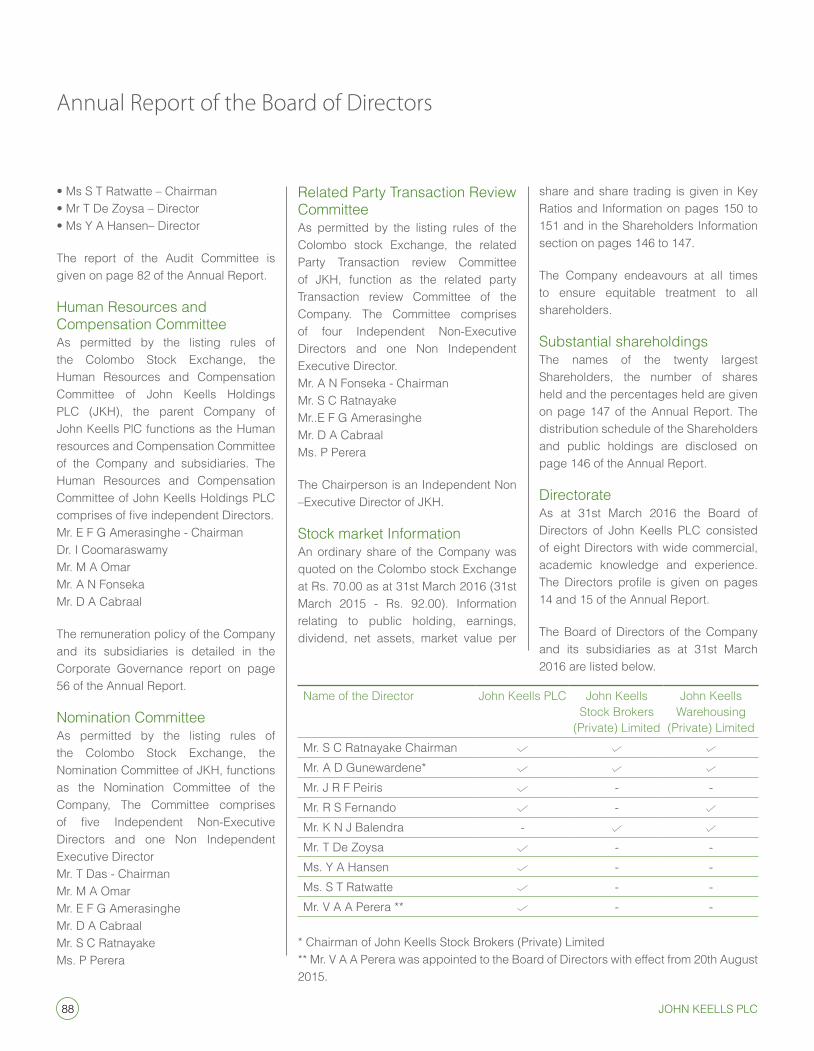
88 John Keells PlC
Annual Report of the Board of Directors
• Ms S T Ratwatte – Chairman• Mr T De Zoysa – Director• Ms Y A Hansen– Director
The report of the audit Committee is given on page 82 of the annual Report.
Human Resources and Compensation Committeeas permitted by the listing rules of the Colombo stock exchange, the Human Resources and Compensation Committee of John Keells Holdings PLC (JKH), the parent Company of John Keells PlC functions as the Human resources and Compensation Committee of the Company and subsidiaries. The Human Resources and Compensation Committee of John Keells Holdings PLC comprises of five independent Directors.Mr. e F G amerasinghe - ChairmanDr. i Coomaraswamy Mr. M a omarMr. a n Fonseka Mr. D a Cabraal
The remuneration policy of the Company and its subsidiaries is detailed in the Corporate Governance report on page 56 of the annual Report.
nomination Committeeas permitted by the listing rules of the Colombo stock exchange, the nomination Committee of JKH, functions as the nomination Committee of the Company, The Committee comprises of five Independent Non-Executive Directors and one non independent executive Director Mr. T Das - ChairmanMr. M a omarMr. e F G amerasingheMr. D a CabraalMr. s C RatnayakeMs. P Perera
Related Party Transaction Review Committeeas permitted by the listing rules of the Colombo stock exchange, the related Party Transaction review Committee of JKH, function as the related party Transaction review Committee of the Company. The Committee comprises of four independent non-executive Directors and one non independent executive Director.Mr. a n Fonseka - ChairmanMr. s C RatnayakeMr..e F G amerasingheMr. D a CabraalMs. P Perera
The Chairperson is an independent non –executive Director of JKH.
stock market informationan ordinary share of the Company was quoted on the Colombo stock exchange at Rs. 70.00 as at 31st March 2016 (31st March 2015 - Rs. 92.00). information relating to public holding, earnings, dividend, net assets, market value per
share and share trading is given in Key Ratios and information on pages 150 to 151 and in the shareholders information section on pages 146 to 147.
The Company endeavours at all times to ensure equitable treatment to all shareholders.
substantial shareholdingsThe names of the twenty largest shareholders, the number of shares held and the percentages held are given on page 147 of the annual Report. The distribution schedule of the shareholders and public holdings are disclosed on page 146 of the annual Report.
Directorateas at 31st March 2016 the Board of Directors of John Keells PLC consisted of eight Directors with wide commercial, academic knowledge and experience. The Directors profile is given on pages 14 and 15 of the annual Report.
The Board of Directors of the Company and its subsidiaries as at 31st March 2016 are listed below.
name of the Director John Keells PLC John Keells stock Brokers
(Private) Limited
John Keells Warehousing
(Private) LimitedMr. s C Ratnayake ChairmanMr. A D Gunewardene*Mr. J R F Peiris - -Mr. R s Fernando -Mr. K n J Balendra -Mr. T De Zoysa - -Ms. Y a Hansen - -Ms. s T Ratwatte - -Mr. V A A Perera ** - -
* Chairman of John Keells Stock Brokers (Private) Limited** Mr. V A A Perera was appointed to the Board of Directors with effect from 20th August 2015.
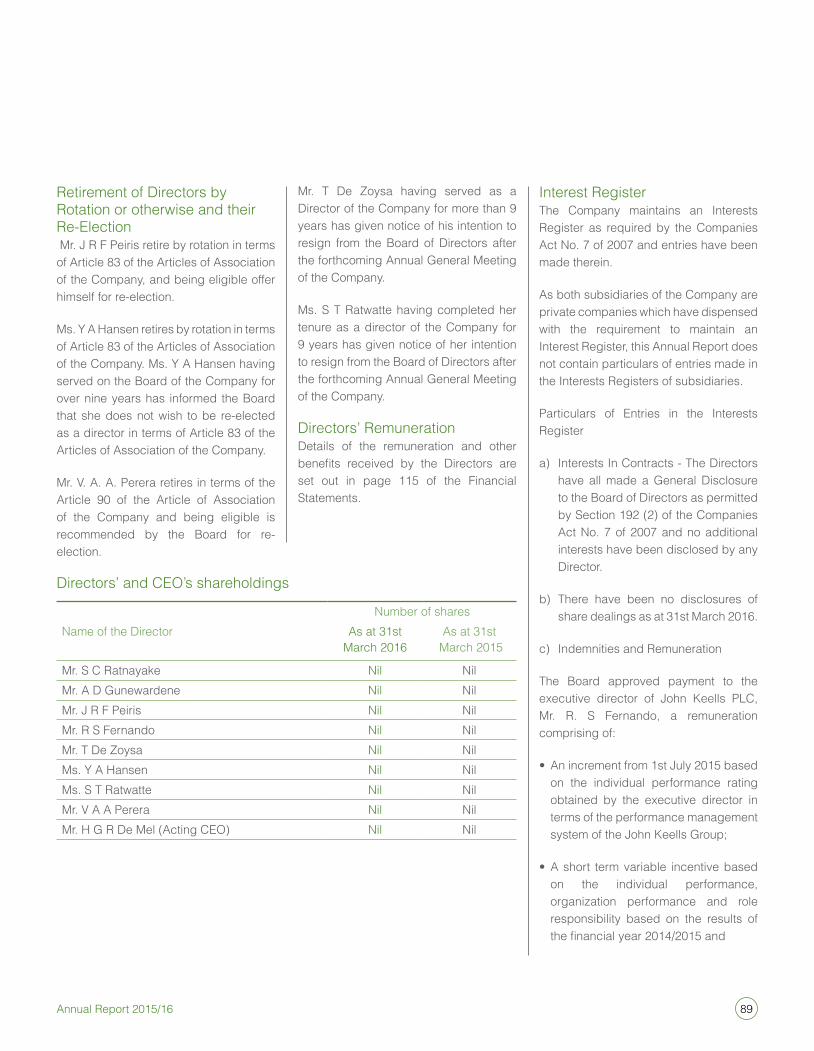
89Annual Report 2015/16
Retirement of Directors by Rotation or otherwise and their Re-election Mr. J R F Peiris retire by rotation in terms of article 83 of the articles of association of the Company, and being eligible offer himself for re-election.
Ms. Y a Hansen retires by rotation in terms of article 83 of the articles of association of the Company. Ms. Y a Hansen having served on the Board of the Company for over nine years has informed the Board that she does not wish to be re-elected as a director in terms of article 83 of the articles of association of the Company.
Mr. V. a. a. Perera retires in terms of the article 90 of the article of association of the Company and being eligible is recommended by the Board for re-election.
Mr. T De Zoysa having served as a Director of the Company for more than 9 years has given notice of his intention to resign from the Board of Directors after the forthcoming annual General Meeting of the Company.
Ms. s T Ratwatte having completed her tenure as a director of the Company for 9 years has given notice of her intention to resign from the Board of Directors after the forthcoming annual General Meeting of the Company.
Directors’ RemunerationDetails of the remuneration and other benefits received by the Directors are set out in page 115 of the Financial statements.
interest RegisterThe Company maintains an interests Register as required by the Companies act no. 7 of 2007 and entries have been made therein.
as both subsidiaries of the Company are private companies which have dispensed with the requirement to maintain an interest Register, this annual Report does not contain particulars of entries made in the interests Registers of subsidiaries.
Particulars of entries in the interests Register
a) interests in Contracts - The Directors have all made a General Disclosure to the Board of Directors as permitted by section 192 (2) of the Companies act no. 7 of 2007 and no additional interests have been disclosed by any Director.
b) There have been no disclosures of share dealings as at 31st March 2016.
c) indemnities and Remuneration
The Board approved payment to the executive director of John Keells PLC, Mr. R. s Fernando, a remuneration comprising of:
• An increment from 1st July 2015 based on the individual performance rating obtained by the executive director in terms of the performance management system of the John Keells Group;
• A short term variable incentive based on the individual performance, organization performance and role responsibility based on the results of the financial year 2014/2015 and
Directors’ and Ceo’s shareholdings
number of sharesname of the Director as at 31st
March 2016as at 31st
March 2015
Mr. s C Ratnayake nil nilMr. a D Gunewardene nil nilMr. J R F Peiris nil nilMr. R s Fernando nil nilMr. T De Zoysa nil nilMs. Y a Hansen nil nilMs. s T Ratwatte nil nilMr. V a a Perera nil nilMr. H G R De Mel (acting Ceo) nil nil
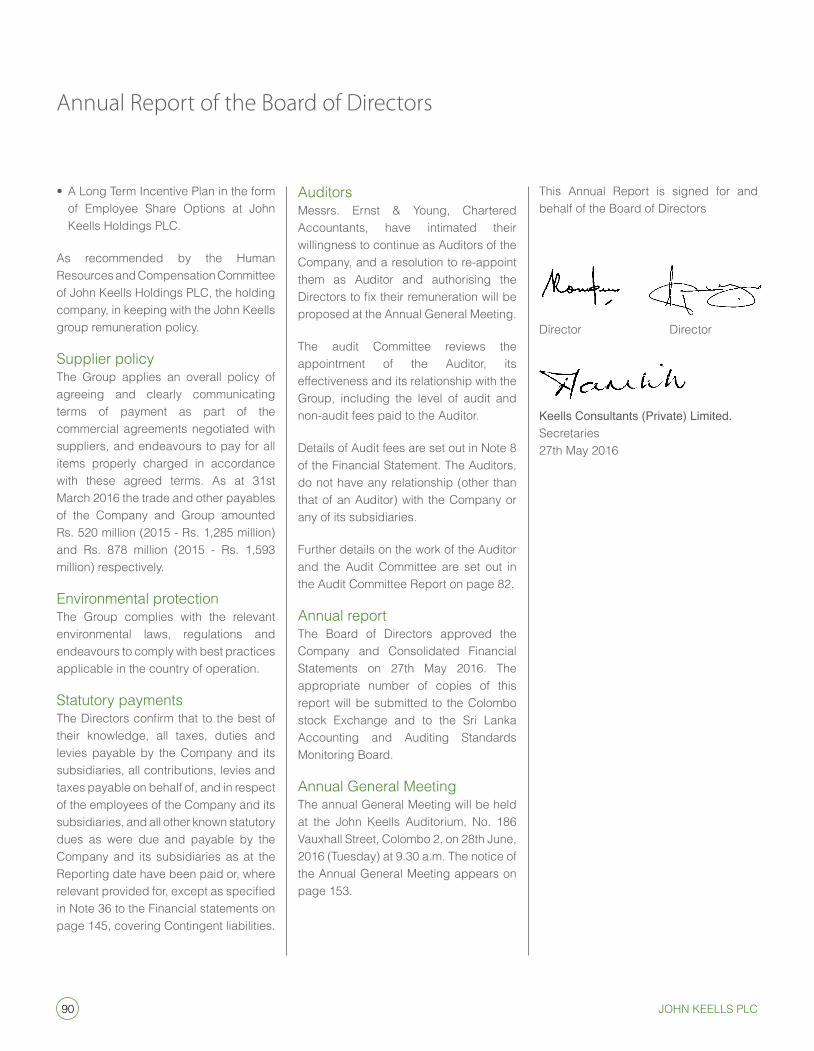
90 John Keells PlC
Annual Report of the Board of Directors
• A Long Term Incentive Plan in the form of employee share options at John Keells Holdings PLC.
as recommended by the Human Resources and Compensation Committee of John Keells Holdings PLC, the holding company, in keeping with the John Keells group remuneration policy.
supplier policyThe Group applies an overall policy of agreeing and clearly communicating terms of payment as part of the commercial agreements negotiated with suppliers, and endeavours to pay for all items properly charged in accordance with these agreed terms. as at 31st March 2016 the trade and other payables of the Company and Group amounted Rs. 520 million (2015 - Rs. 1,285 million) and Rs. 878 million (2015 - Rs. 1,593 million) respectively.
environmental protectionThe Group complies with the relevant environmental laws, regulations and endeavours to comply with best practices applicable in the country of operation.
statutory paymentsThe Directors confirm that to the best of their knowledge, all taxes, duties and levies payable by the Company and its subsidiaries, all contributions, levies and taxes payable on behalf of, and in respect of the employees of the Company and its subsidiaries, and all other known statutory dues as were due and payable by the Company and its subsidiaries as at the Reporting date have been paid or, where relevant provided for, except as specified in note 36 to the Financial statements on page 145, covering Contingent liabilities.
auditorsMessrs. ernst & Young, Chartered accountants, have intimated their willingness to continue as auditors of the Company, and a resolution to re-appoint them as auditor and authorising the Directors to fix their remuneration will be proposed at the annual General Meeting.
The audit Committee reviews the appointment of the auditor, its effectiveness and its relationship with the Group, including the level of audit and non-audit fees paid to the auditor.
Details of audit fees are set out in note 8 of the Financial statement. The auditors, do not have any relationship (other than that of an auditor) with the Company or any of its subsidiaries.
Further details on the work of the auditor and the audit Committee are set out in the audit Committee Report on page 82.
annual reportThe Board of Directors approved the Company and Consolidated Financial statements on 27th May 2016. The appropriate number of copies of this report will be submitted to the Colombo stock exchange and to the sri Lanka accounting and auditing standards Monitoring Board.
annual General MeetingThe annual General Meeting will be held at the John Keells auditorium, no. 186 Vauxhall street, Colombo 2, on 28th June, 2016 (Tuesday) at 9.30 a.m. The notice of the annual General Meeting appears on page 153.
This annual Report is signed for and behalf of the Board of Directors
Director Director
Keells Consultants (Private) Limited.secretaries27th May 2016
91Annual Report 2015/16
Statement of Directors’ Responsibility
The responsibility of the Directors, in relation to the financial statements, is set out in the following statement. The responsibility of the auditors, in relation to the financial statements prepared in accordance with the provision of the Companies act no. 7 of 2007, is set out in the Report of the auditors on page 93.
The Financial statements comprise of:
• Income statement and statement of comprehensive income of the Company and its subsidiaries, which present a true and fair view of the profit and loss of the Company and its subsidiaries for the financial year; and
• A Statement of Financial Position, which presents a true and fair view of the state of affairs of the Company and its subsidiaries as at the end of the financial year: and
• A statement of change in equity, statement of cash flows for the year ended and notes.
The Directors are required to confirm that the Financial statements have been prepared:
• Using the appropriate Accounting Policies which have been selected and applied in a consistent manner and material departures, if any, have been disclosed and explained; and
• Presented in accordance with the Sri Lanka accounting standards (sLFRs/LKas); and that reasonable and prudent Judgements and estimates have been made so that the form and substance of transactions are properly reflected and
• Provides the information required by and otherwise comply with the Companies act no. 7 of 2007 and the Listing Rules of the Colombo stock exchange.
The Directors are also required to ensure that the Company has adequate resources to continue in operation to justify applying the going concern basis in preparing these financial statements.
Further, the Directors have a responsibility to ensure that the Company maintains sufficient accounting records to disclose, with reasonable accuracy the financial position of the Company and its subsidiaries, and to ensure that the financial statements reflect the transparency of transactions and provides an accurate disclosure of its financial position and comply with the requirements of the Companies act no. 7 of 2007.
The Directors are also responsible for taking reasonable steps to safeguard the assets of the Company and its subsidiaries and in this regard to give proper consideration to the establishment of appropriate internal control systems with a view to preventing and detecting fraud and other irregularities.
The Directors are required to prepare the financial statements and to provide the auditors with every opportunity to take whatever steps and undertake whatever inspections they may consider to be appropriate to enable them to give their audit opinion.
Further, as required by section 56(2) of the Companies act no. 7 of 2007, the
Board of Directors have confirmed that the Company, based on the information available, satisfies the solvency test immediately after the distribution, in accordance with section 57 of the Companies act no. 7 of 2007, and has obtained a certificate from the auditors, prior to declaring a First and Final Dividend of Rs.1.00 per share for the year, which will be paid on 16th June 2016.
The Directors are of the view that they have discharged their responsibilities as set out in this statement.
Compliance ReportThe Directors confirm that to the best of their knowledge, all taxes, duties and levies payable by the Company and its subsidiaries, all contributions, levies and taxes payable on behalf of and in respect of the employees of the Company and its subsidiaries, and all other known statutory dues as were due and payable by the Company and its subsidiaries as at the reporting date have been paid, or where relevant provided for, except as specified in note 36 to the financial statements covering contingent liabilities.
By order of the Board
Keells Consultants (Pvt) Ltd.Secretaries27th May 2016
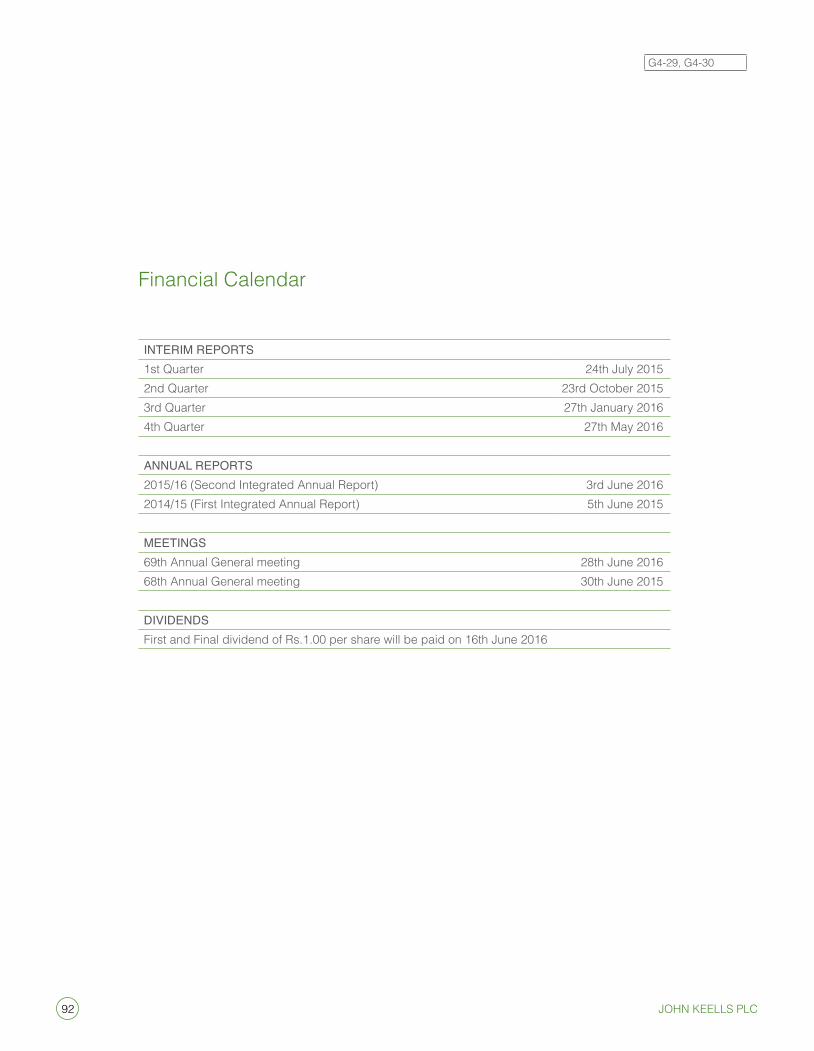
92 John Keells PlC
Financial Calendar
INTERIM REPORTS1st Quarter 24th July 20152nd Quarter 23rd october 20153rd Quarter 27th January 20164th Quarter 27th May 2016
ANNuAL REPORTS2015/16 (second integrated annual Report) 3rd June 20162014/15 (First integrated annual Report) 5th June 2015
MEETINGS69th annual General meeting 28th June 2016 68th annual General meeting 30th June 2015
DIVIDENDSFirst and Final dividend of Rs.1.00 per share will be paid on 16th June 2016
G4-29, G4-30
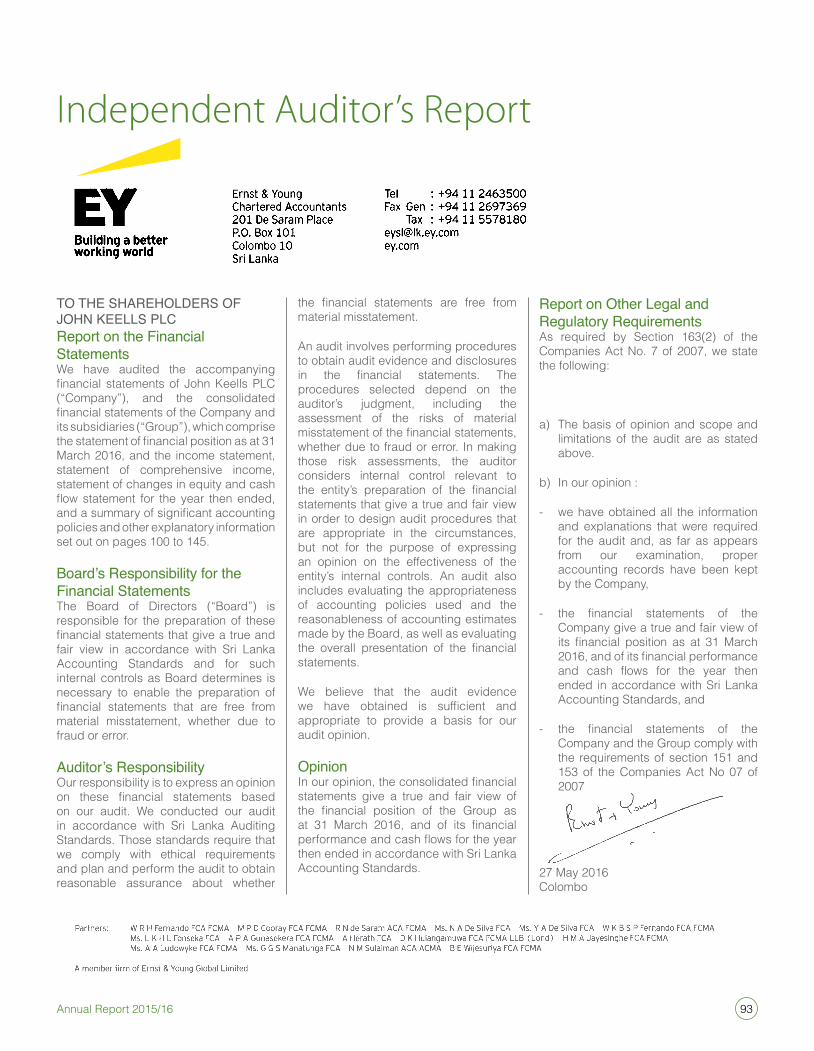
93Annual Report 2015/16
Independent Auditor’s Report
TO THE SHAREHOLDERS OF JOHN KEELLS PLCReport on the Financial StatementsWe have audited the accompanying financial statements of John Keells PLC (“Company”), and the consolidated financial statements of the Company and its subsidiaries (“Group”), which comprise the statement of financial position as at 31 March 2016, and the income statement, statement of comprehensive income, statement of changes in equity and cash flow statement for the year then ended, and a summary of significant accounting policies and other explanatory information set out on pages 100 to 145.
Board’s Responsibility for the Financial StatementsThe Board of Directors (“Board”) is responsible for the preparation of these financial statements that give a true and fair view in accordance with sri Lanka accounting standards and for such internal controls as Board determines is necessary to enable the preparation of financial statements that are free from material misstatement, whether due to fraud or error.
Auditor’s Responsibilityour responsibility is to express an opinion on these financial statements based on our audit. We conducted our audit in accordance with sri Lanka auditing standards. Those standards require that we comply with ethical requirements and plan and perform the audit to obtain reasonable assurance about whether
the financial statements are free from material misstatement.
an audit involves performing procedures to obtain audit evidence and disclosures in the financial statements. The procedures selected depend on the auditor’s judgment, including the assessment of the risks of material misstatement of the financial statements, whether due to fraud or error. in making those risk assessments, the auditor considers internal control relevant to the entity’s preparation of the financial statements that give a true and fair view in order to design audit procedures that are appropriate in the circumstances, but not for the purpose of expressing an opinion on the effectiveness of the entity’s internal controls. an audit also includes evaluating the appropriateness of accounting policies used and the reasonableness of accounting estimates made by the Board, as well as evaluating the overall presentation of the financial statements.
We believe that the audit evidence we have obtained is sufficient and appropriate to provide a basis for our audit opinion.
OpinionIn our opinion, the consolidated financial statements give a true and fair view of the financial position of the Group as at 31 March 2016, and of its financial performance and cash flows for the year then ended in accordance with sri Lanka accounting standards.
Report on Other Legal and Regulatory Requirementsas required by section 163(2) of the Companies act no. 7 of 2007, we state the following:
a) The basis of opinion and scope and limitations of the audit are as stated above.
b) in our opinion :
- we have obtained all the information and explanations that were required for the audit and, as far as appears from our examination, proper accounting records have been kept by the Company,
- the financial statements of the Company give a true and fair view of its financial position as at 31 March 2016, and of its financial performance and cash flows for the year then ended in accordance with sri Lanka accounting standards, and
- the financial statements of the Company and the Group comply with the requirements of section 151 and 153 of the Companies act no 07 of 2007
27 May 2016Colombo
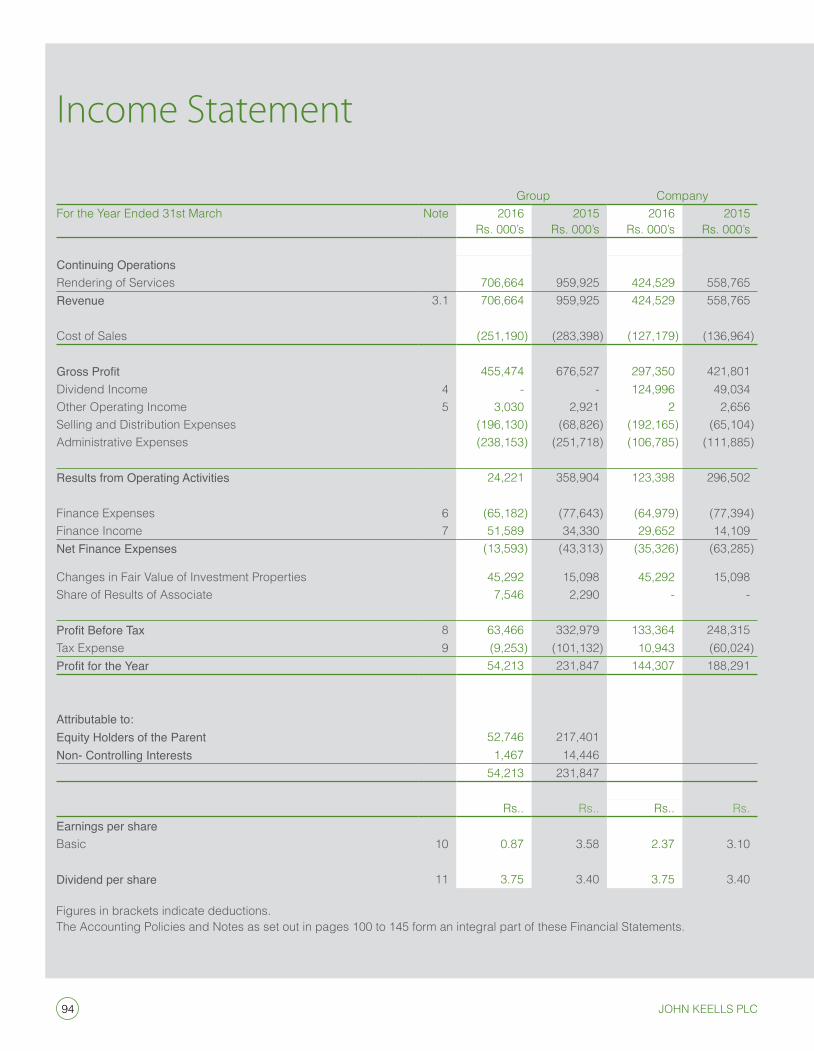
94 John Keells PlC
Income Statement
Group CompanyFor the Year ended 31st March note 2016
Rs. 000’s2015
Rs. 000’s2016
Rs. 000’s2015
Rs. 000’s
Continuing OperationsRendering of services 706,664 959,925 424,529 558,765 Revenue 3.1 706,664 959,925 424,529 558,765
Cost of sales (251,190) (283,398) (127,179) (136,964)
Gross Profit 455,474 676,527 297,350 421,801 Dividend income 4 - - 124,996 49,034 other operating income 5 3,030 2,921 2 2,656 selling and Distribution expenses (196,130) (68,826) (192,165) (65,104)administrative expenses (238,153) (251,718) (106,785) (111,885)
Results from Operating Activities 24,221 358,904 123,398 296,502
Finance expenses 6 (65,182) (77,643) (64,979) (77,394)Finance income 7 51,589 34,330 29,652 14,109 Net Finance Expenses (13,593) (43,313) (35,326) (63,285)
Changes in Fair Value of investment Properties 45,292 15,098 45,292 15,098 share of Results of associate 7,546 2,290 - -
Profit Before Tax 8 63,466 332,979 133,364 248,315 Tax expense 9 (9,253) (101,132) 10,943 (60,024)Profit for the Year 54,213 231,847 144,307 188,291
Attributable to:Equity Holders of the Parent 52,746 217,401 Non- Controlling Interests 1,467 14,446
54,213 231,847
Rs.. Rs.. Rs.. Rs. Earnings per shareBasic 10 0.87 3.58 2.37 3.10
Dividend per share 11 3.75 3.40 3.75 3.40
Figures in brackets indicate deductions.The accounting Policies and notes as set out in pages 100 to 145 form an integral part of these Financial statements.
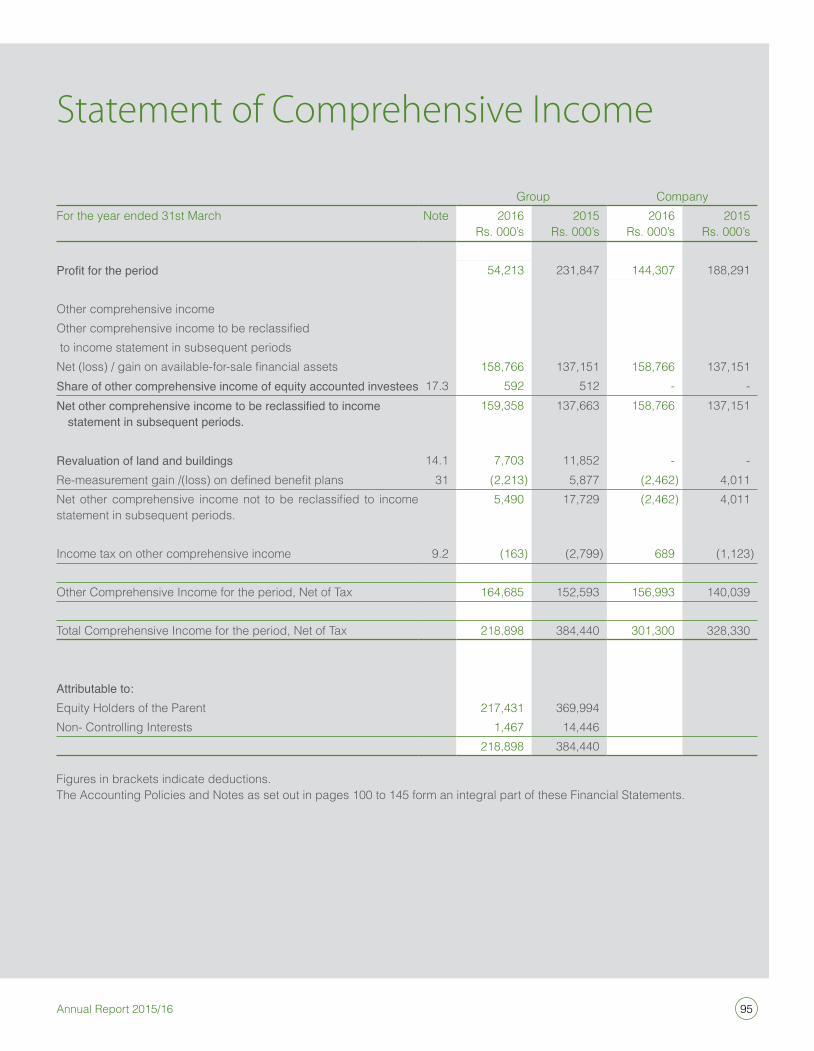
95Annual Report 2015/16
Statement of Comprehensive Income
Group CompanyFor the year ended 31st March note 2016
Rs. 000’s2015
Rs. 000’s2016
Rs. 000’s2015
Rs. 000’s
Profit for the period 54,213 231,847 144,307 188,291
other comprehensive incomeOther comprehensive income to be reclassified to income statement in subsequent periods Net (loss) / gain on available-for-sale financial assets 158,766 137,151 158,766 137,151 Share of other comprehensive income of equity accounted investees 17.3 592 512 - - Net other comprehensive income to be reclassified to income
statement in subsequent periods. 159,358 137,663 158,766 137,151
Revaluation of land and buildings 14.1 7,703 11,852 - - Re-measurement gain /(loss) on defined benefit plans 31 (2,213) 5,877 (2,462) 4,011 Net other comprehensive income not to be reclassified to income statement in subsequent periods.
5,490 17,729 (2,462) 4,011
income tax on other comprehensive income 9.2 (163) (2,799) 689 (1,123)
other Comprehensive income for the period, net of Tax 164,685 152,593 156,993 140,039
Total Comprehensive income for the period, net of Tax 218,898 384,440 301,300 328,330
Attributable to:equity Holders of the Parent 217,431 369,994 non- Controlling interests 1,467 14,446
218,898 384,440
Figures in brackets indicate deductions. The accounting Policies and notes as set out in pages 100 to 145 form an integral part of these Financial statements.
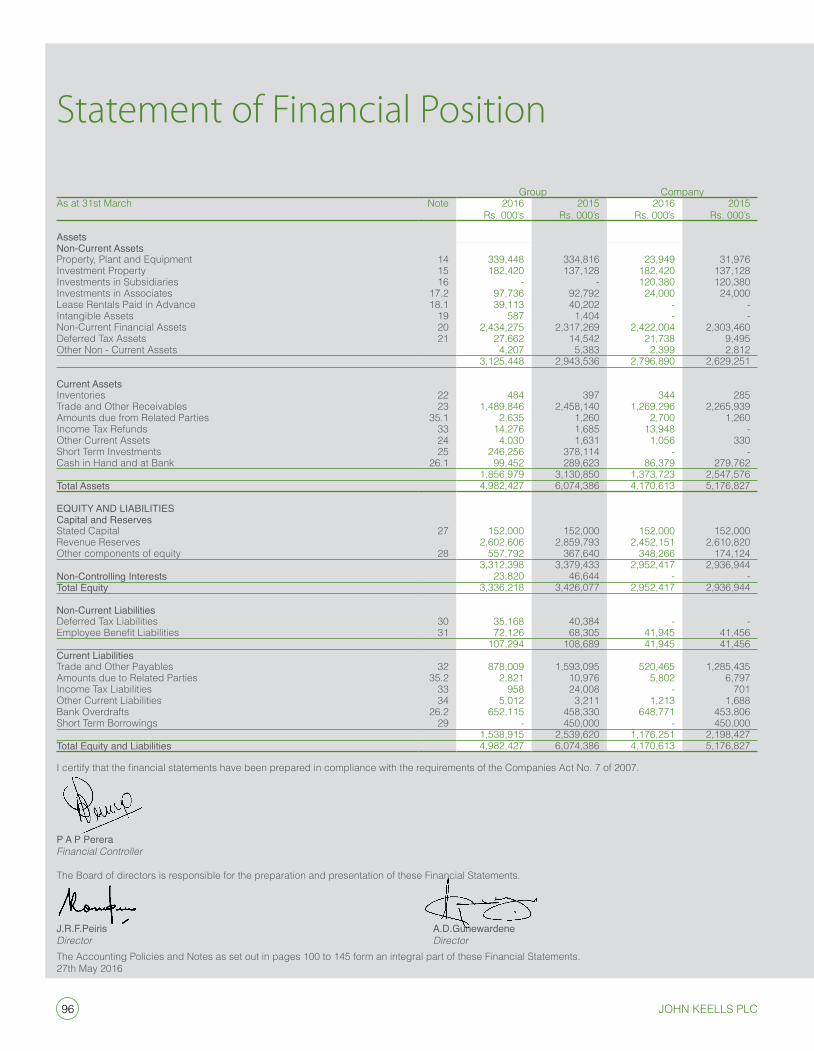
96 John Keells PlC
Statement of Financial Position
Group Companyas at 31st March note 2016
Rs. 000’s2015
Rs. 000’s2016
Rs. 000’s2015
Rs. 000’s
AssetsNon-Current AssetsProperty, Plant and equipment 14 339,448 334,816 23,949 31,976 investment Property 15 182,420 137,128 182,420 137,128 investments in subsidiaries 16 - - 120,380 120,380 investments in associates 17.2 97,736 92,792 24,000 24,000 Lease Rentals Paid in advance 18.1 39,113 40,202 - - intangible assets 19 587 1,404 - - non-Current Financial assets 20 2,434,275 2,317,269 2,422,004 2,303,460 Deferred Tax assets 21 27,662 14,542 21,738 9,495 other non - Current assets 4,207 5,383 2,399 2,812
3,125,448 2,943,536 2,796,890 2,629,251
Current Assets inventories 22 484 397 344 285 Trade and other Receivables 23 1,489,846 2,458,140 1,269,296 2,265,939 amounts due from Related Parties 35.1 2,635 1,260 2,700 1,260 income Tax Refunds 33 14,276 1,685 13,948 - other Current assets 24 4,030 1,631 1,056 330 short Term investments 25 246,256 378,114 - - Cash in Hand and at Bank 26.1 99,452 289,623 86,379 279,762
1,856,979 3,130,850 1,373,723 2,547,576 Total Assets 4,982,427 6,074,386 4,170,613 5,176,827
EQUITY AND LIABILITIES Capital and Reservesstated Capital 27 152,000 152,000 152,000 152,000 Revenue Reserves 2,602,606 2,859,793 2,452,151 2,610,820 other components of equity 28 557,792 367,640 348,266 174,124 3,312,398 3,379,433 2,952,417 2,936,944 Non-Controlling Interests 23,820 46,644 - - Total Equity 3,336,218 3,426,077 2,952,417 2,936,944
Non-Current LiabilitiesDeferred Tax Liabilities 30 35,168 40,384 - - Employee Benefit Liabilities 31 72,126 68,305 41,945 41,456
107,294 108,689 41,945 41,456 Current Liabilities Trade and other Payables 32 878,009 1,593,095 520,465 1,285,435 amounts due to Related Parties 35.2 2,821 10,976 5,802 6,797 income Tax Liabilities 33 958 24,008 - 701 other Current Liabilities 34 5,012 3,211 1,213 1,688 Bank overdrafts 26.2 652,115 458,330 648,771 453,806 short Term Borrowings 29 - 450,000 - 450,000
1,538,915 2,539,620 1,176,251 2,198,427 Total Equity and Liabilities 4,982,427 6,074,386 4,170,613 5,176,827
I certify that the financial statements have been prepared in compliance with the requirements of the Companies Act No. 7 of 2007.
P A P PereraFinancial Controller
The Board of directors is responsible for the preparation and presentation of these Financial statements.
J.R.F.Peiris A.D.GunewardeneDirector DirectorThe accounting Policies and notes as set out in pages 100 to 145 form an integral part of these Financial statements.27th May 2016
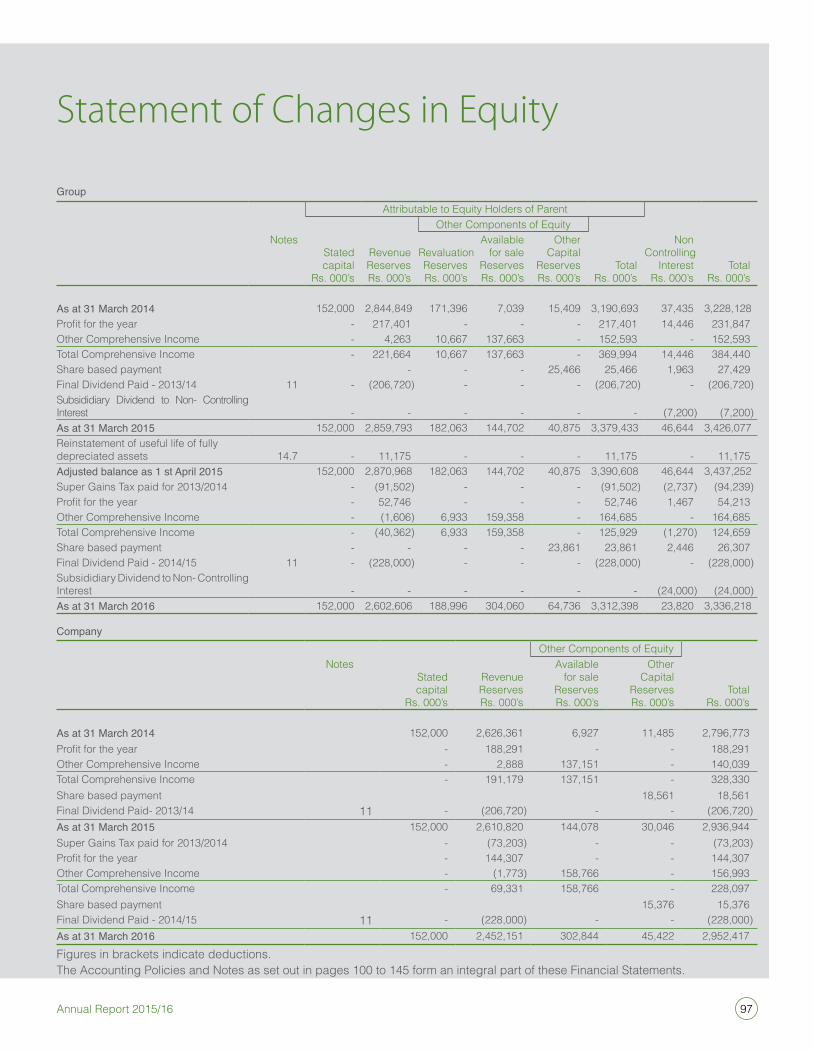
97Annual Report 2015/16
Statement of Changes in Equity
Groupattributable to equity Holders of Parent
other Components of equitynotes
statedcapital
Rs. 000’s
Revenue ReservesRs. 000’s
RevaluationReservesRs. 000’s
availablefor sale
ReservesRs. 000’s
other Capital
Reserves Rs. 000’s
TotalRs. 000’s
non Controlling
interestRs. 000’s
TotalRs. 000’s
As at 31 March 2014 152,000 2,844,849 171,396 7,039 15,409 3,190,693 37,435 3,228,128 Profit for the year - 217,401 - - - 217,401 14,446 231,847 other Comprehensive income - 4,263 10,667 137,663 - 152,593 - 152,593 Total Comprehensive income - 221,664 10,667 137,663 - 369,994 14,446 384,440 share based payment - - - 25,466 25,466 1,963 27,429 Final Dividend Paid - 2013/14 11 - (206,720) - - - (206,720) - (206,720)subsididiary Dividend to non- Controlling interest - - - - - - (7,200) (7,200)As at 31 March 2015 152,000 2,859,793 182,063 144,702 40,875 3,379,433 46,644 3,426,077 Reinstatement of useful life of fully depreciated assets 14.7 - 11,175 - - - 11,175 - 11,175Adjusted balance as 1 st April 2015 152,000 2,870,968 182,063 144,702 40,875 3,390,608 46,644 3,437,252 super Gains Tax paid for 2013/2014 - (91,502) - - - (91,502) (2,737) (94,239)Profit for the year - 52,746 - - - 52,746 1,467 54,213 other Comprehensive income - (1,606) 6,933 159,358 - 164,685 - 164,685 Total Comprehensive income - (40,362) 6,933 159,358 - 125,929 (1,270) 124,659 share based payment - - - - 23,861 23,861 2,446 26,307 Final Dividend Paid - 2014/15 11 - (228,000) - - - (228,000) - (228,000)subsididiary Dividend to non- Controlling interest - - - - - - (24,000) (24,000)As at 31 March 2016 152,000 2,602,606 188,996 304,060 64,736 3,312,398 23,820 3,336,218
Companyother Components of equity
notesstatedcapital
Rs. 000’s
Revenue ReservesRs. 000’s
availablefor sale
ReservesRs. 000’s
other Capital
Reserves Rs. 000’s
TotalRs. 000’s
As at 31 March 2014 152,000 2,626,361 6,927 11,485 2,796,773 Profit for the year - 188,291 - - 188,291 other Comprehensive income - 2,888 137,151 - 140,039 Total Comprehensive income - 191,179 137,151 - 328,330 share based payment 18,561 18,561 Final Dividend Paid- 2013/14 11 - (206,720) - - (206,720)As at 31 March 2015 152,000 2,610,820 144,078 30,046 2,936,944 super Gains Tax paid for 2013/2014 - (73,203) - - (73,203)Profit for the year - 144,307 - - 144,307 other Comprehensive income - (1,773) 158,766 - 156,993 Total Comprehensive income - 69,331 158,766 - 228,097share based payment 15,376 15,376 Final Dividend Paid - 2014/15 11 - (228,000) - - (228,000)As at 31 March 2016 152,000 2,452,151 302,844 45,422 2,952,417 Figures in brackets indicate deductions.The accounting Policies and notes as set out in pages 100 to 145 form an integral part of these Financial statements.
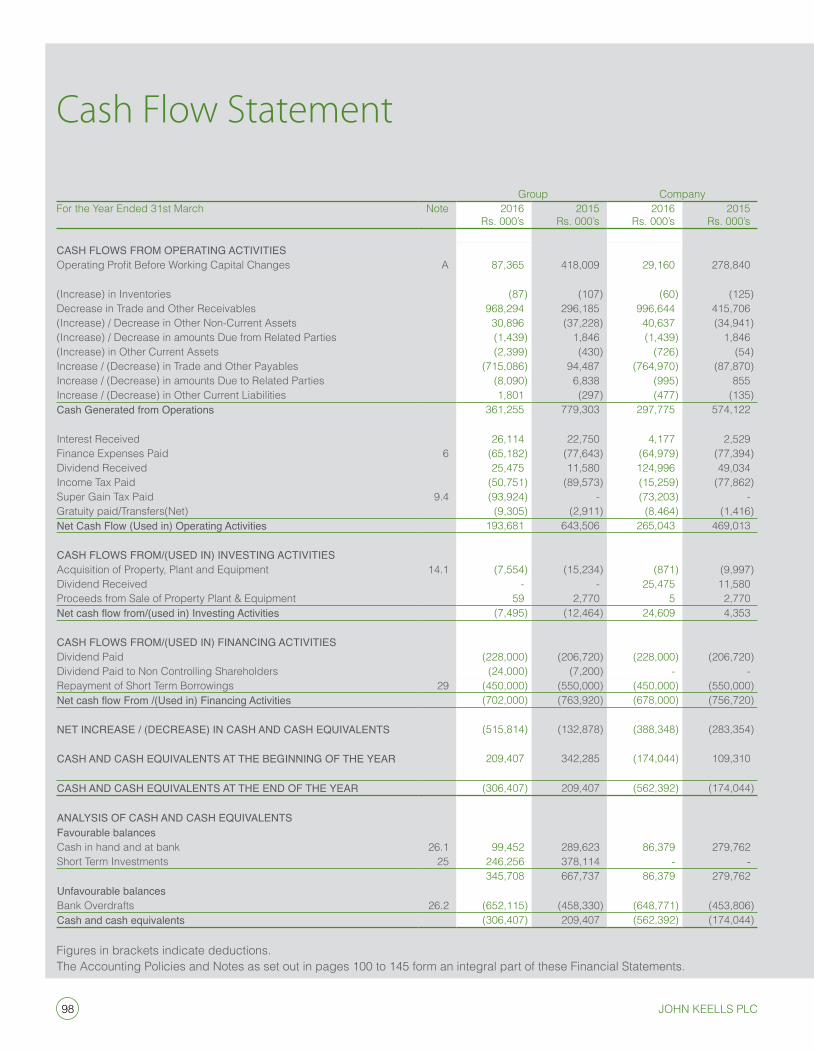
98 John Keells PlC
Cash Flow Statement
Group CompanyFor the Year ended 31st March note 2016
Rs. 000’s2015
Rs. 000’s2016
Rs. 000’s2015
Rs. 000’s
CASH FLOWS FROM OPERATING ACTIVITIESOperating Profit Before Working Capital Changes a 87,365 418,009 29,160 278,840
(increase) in inventories (87) (107) (60) (125)Decrease in Trade and other Receivables 968,294 296,185 996,644 415,706 (increase) / Decrease in other non-Current assets 30,896 (37,228) 40,637 (34,941)(increase) / Decrease in amounts Due from Related Parties (1,439) 1,846 (1,439) 1,846 (increase) in other Current assets (2,399) (430) (726) (54)increase / (Decrease) in Trade and other Payables (715,086) 94,487 (764,970) (87,870)increase / (Decrease) in amounts Due to Related Parties (8,090) 6,838 (995) 855 increase / (Decrease) in other Current Liabilities 1,801 (297) (477) (135)Cash Generated from Operations 361,255 779,303 297,775 574,122
interest Received 26,114 22,750 4,177 2,529 Finance expenses Paid 6 (65,182) (77,643) (64,979) (77,394)Dividend Received 25,475 11,580 124,996 49,034 income Tax Paid (50,751) (89,573) (15,259) (77,862)super Gain Tax Paid 9.4 (93,924) - (73,203) -Gratuity paid/Transfers(net) (9,305) (2,911) (8,464) (1,416)Net Cash Flow (used in) Operating Activities 193,681 643,506 265,043 469,013
CASH FLOWS FROM/(uSED IN) INVESTING ACTIVITIESacquisition of Property, Plant and equipment 14.1 (7,554) (15,234) (871) (9,997)Dividend Received - - 25,475 11,580 Proceeds from sale of Property Plant & equipment 59 2,770 5 2,770 Net cash flow from/(used in) Investing Activities (7,495) (12,464) 24,609 4,353
CASH FLOWS FROM/(uSED IN) FINANCING ACTIVITIESDividend Paid (228,000) (206,720) (228,000) (206,720)Dividend Paid to non Controlling shareholders (24,000) (7,200) - - Repayment of short Term Borrowings 29 (450,000) (550,000) (450,000) (550,000)Net cash flow From /(Used in) Financing Activities (702,000) (763,920) (678,000) (756,720)
NET INCREASE / (DECREASE) IN CASH AND CASH EQuIVALENTS (515,814) (132,878) (388,348) (283,354)
CASH AND CASH EQuIVALENTS AT THE BEGINNING oF ThE YEAR 209,407 342,285 (174,044) 109,310
CASh AND CASh EQUIVALENTS AT ThE END oF ThE YEAR (306,407) 209,407 (562,392) (174,044)
ANALYSIS oF CASh AND CASh EQUIVALENTSFavourable balancesCash in hand and at bank 26.1 99,452 289,623 86,379 279,762 short Term investments 25 246,256 378,114 - -
345,708 667,737 86,379 279,762 unfavourable balancesBank overdrafts 26.2 (652,115) (458,330) (648,771) (453,806)Cash and cash equivalents (306,407) 209,407 (562,392) (174,044)
Figures in brackets indicate deductions.The accounting Policies and notes as set out in pages 100 to 145 form an integral part of these Financial statements.
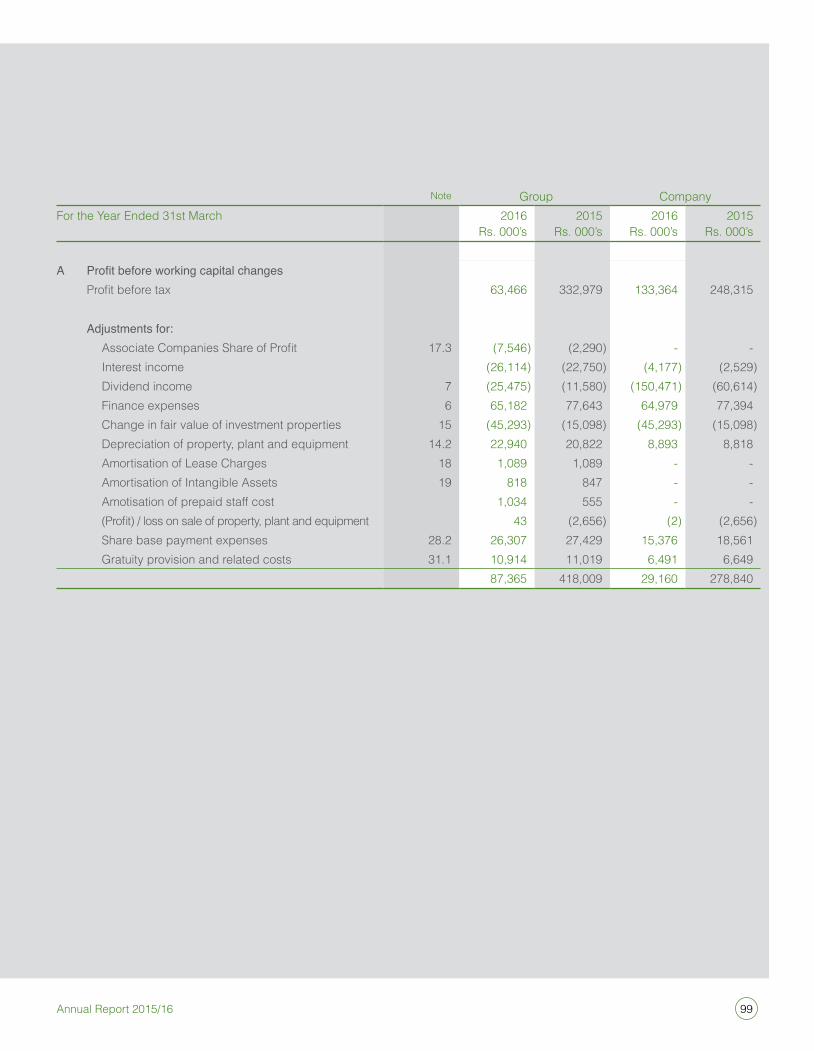
99Annual Report 2015/16
note Group CompanyFor the Year ended 31st March 2016
Rs. 000’s2015
Rs. 000’s2016
Rs. 000’s2015
Rs. 000’s
A Profit before working capital changes Profit before tax 63,466 332,979 133,364 248,315
Adjustments for: Associate Companies Share of Profit 17.3 (7,546) (2,290) - - interest income (26,114) (22,750) (4,177) (2,529) Dividend income 7 (25,475) (11,580) (150,471) (60,614) Finance expenses 6 65,182 77,643 64,979 77,394 Change in fair value of investment properties 15 (45,293) (15,098) (45,293) (15,098) Depreciation of property, plant and equipment 14.2 22,940 20,822 8,893 8,818 amortisation of Lease Charges 18 1,089 1,089 - - amortisation of intangible assets 19 818 847 - - amotisation of prepaid staff cost 1,034 555 - - (Profit) / loss on sale of property, plant and equipment 43 (2,656) (2) (2,656) share base payment expenses 28.2 26,307 27,429 15,376 18,561 Gratuity provision and related costs 31.1 10,914 11,019 6,491 6,649
87,365 418,009 29,160 278,840
100 John Keells PlC
Notes to the Financial Statements
1.1. CoRPoRaTe inFoRMaTionReporting EntityJohn Keells PLC is a public limited liability company incorporated and domiciled in sri Lanka and listed on the Colombo Stock Exchange. The registered office of the company is located at no. 117, sir Chittampalam a. Gardiner Mawatha, Colombo 2 and principal place of business of the company is located at no. 186, Vauxhall street, Colombo 2.
ordinary shares of the company are listed on the Colombo stock exchange.
Consolidated Financial StatementsThe financial statements for the year ended 31 March 2016, comprise “the Company” referring to John Keells PLC as the holding company and “the Group” referring to the companies whose accounts have been consolidated therein.
Approval of Financial StatementsThe Financial statements for the year ended 31 March 2016 were authorised for issue by the directors on 27th May 2016.
Principal Activities and Nature of OperationsHolding companyThe Principal activity of John Keells PLC is Produce Broking.
Subsidiaries and Associate The companies within the Group and its business activities are disclosed in the Group structure on page 4 of the annual Report.
There were no significant changes in the nature of the principal activities of the Company and the Group during the financial year under review.
Parent Entity and ultimate Parent EntityThe Company’s parent entity is John Keells Holdings PLC in the opinion of the directors, which is incorporated in sri Lanka.
Responsibility for Financial StatementsThe responsibility of the Directors in relation to the financial statements is set out in ‘The statement of director’s responsibility on Page 91 to in the annual report.
Statement of complianceThe financial statements which comprise the statement of financial position, the statement of income, statement of comprehensive income, statement of changes in equity and the statement of cash flows, together with the accounting policies and notes (the “financial statements”) have been prepared in accordance with sri Lanka accounting standards (sLFRs/LKas) as issued by the institute of Chartered accountants of sri Lanka (iCasL) and the requirement of the Companies act no. 7 of 2007.
1.2. Basis oF PRePaRaTionBasis of MeasurementThe consolidated financial statements have been prepared on an accrual basis and under the historical cost convention except for investment properties, land and buildings and available-for-sale financial assets that have been measured at fair value.
Presentation and Functional CurrencyThe consolidated financial statements are presented in sri Lankan Rupees, the Group’s functional and presentation
currency, which is the primary economic environment in which the Holding Company operates. each entity in the Group uses the currency of the primary economic environment in which they operate as their functional currency.
all values are rounded to the nearest rupees thousand (Rs. ’000) except when otherwise indicated.
The significant accounting policies are discussed in note 1.4 below.
Basis of consolidationThe consolidated financial statements comprise the financial statements of the Group and its subsidiaries as at 31 March 2016. Control is achieved when the Group is exposed, or has rights, to variable returns from its involvement with the investee and has the ability to affect those returns through its power over the investee. Specifically, the Group controls an investee if, and only if, the Group has:
• Power over the investee (i.e., existing rights that give it the current ability to direct the relevant activities of the investee)
• Exposure, or rights, to variable returns from its involvement with the investee
• The ability to use its power over the investee to affect its returns
Generally, there is a presumption that a majority of voting rights result in control. To support this presumption and when the Group has less than a majority of the voting or similar rights of an investee, the Group considers all relevant facts and circumstances in assessing whether it has power over an investee, including:
101Annual Report 2015/16
• The contractual arrangement with the other vote holders of the investee
• Rights arising from other contractual arrangements
• The Group’s voting rights and potential voting rights
The Group re-assesses whether or not it controls an investee if facts and circumstances indicate that there are changes to one or more of the three elements of control. Consolidation of a subsidiary begins when the Group obtains control over the subsidiary and ceases when the Group loses control of the subsidiary. assets, liabilities, income and expenses of a subsidiary acquired or disposed of during the year are included in the consolidated financial statements from the date the Group gains control until the date the Group ceases to control the subsidiary.
Profit or loss and each component of other comprehensive income (oCi) are attributed to the equity holders of the parent of the Group and to the non-controlling interests, even if this results in the non-controlling interests having a deficit balance. When necessary, adjustments are made to the financial statements of subsidiaries to bring their accounting policies into line with the Group’s accounting policies. all intra-group assets and liabilities, equity, income, expenses and cash flows relating to transactions between members of the Group are eliminated in full on consolidation.
a change in the ownership interest of a subsidiary, without a loss of control, is accounted for as an equity transaction.
if the Group loses control over a subsidiary, it derecognises the related assets (including goodwill), liabilities, non-controlling interest and other components of equity while any resultant gain or loss is recognised in profit or loss. any investment retained is recognised at fair value.
1.3. aCCounTinG PoLiCies The accounting policies adopted by the group are consistent with those used in the previous year.
Comparative informationThe presentation and classification of the financial statements of the previous years have been amended, where relevant for better presentation and to be comparable with those of the current year.
1.3.1 Significant accounting judgements, estimates and assumptionsThe preparation of the financial statements of the Group require the management to make judgments, estimates and assumptions, which may affect the amounts of income, expenditure, assets , liabilities and the disclosure of contingent liabilities, at the end of the reporting period. in the process of applying the Group’s accounting policies, the key assumptions made relating to the future and the sources of estimation at the reporting date together with the related judgments that have a significant risk of causing a material adjustment to the carrying amounts of assets and liabilities within the next financial year are discussed below.
Going ConcernThe management has made an assessment of its ability to continue as a
going concern and is satisfied that it has the resources to continue in business for the foreseeable future.
Furthermore, management is not aware of any material uncertainties that may cast significant doubt upon the Company’s ability to continue as a going concern. Therefore, the Financial statements continue to be prepared on a going concern basis.
Revaluation of property, plant and equipment and investment propertiesThe Group measures land and buildings at revalued amounts with changes in fair value being recognised in the statement of equity. in addition, it carries its investment properties at fair value, with changes in fair value being recognised in the income statement. The Group engaged independent valuation specialists to determine fair value of investment properties and certain identified land and buildings as at 31 March 2016.
The valuer has used valuation techniques such as market values and discounted cash flow methods where there was lack of comparable market data available based on the nature of the property. (note 14)
The determined fair values of investment properties, using investment method, are most sensitive to the estimated yield as well as the long term occupancy rate. The methods used to determine the fair value of the investment properties, are further explained in note 15.
Share-based payment transactionsThe Group measures the cost of equity-settled transactions with employees by
102 John Keells PlC
Notes to the Financial Statements
reference to the fair value of the equity instruments at the date at which they are granted. estimating fair value for share-based payment transactions requires determining the most appropriate valuation model, which is dependent on the terms and conditions of the grant. This estimate also requires the determination of the most appropriate inputs to the valuation model including the expected life of the share option, volatility and dividend yield and making assumptions about them.
Transfer Pricing RegulationThe Company is subject to income taxes and other taxes including transfer pricing regulations. Prevailing uncertainties with respect to the interpretation of respective transfer pricing regulations, necessitated using management judgment to determine the impact of transfer pricing regulations. accordingly critical judgments and estimates were used in applying the regulations in aspects including but not limited to identifying associated undertakings, estimation of the respective arm’s length prices and selection of appropriate pricing mechanism. The current tax charge is subject to such judgments. Differences between estimated income tax charge and actual payable may arise as a result of management’s interpretation and application of transfer pricing regulation.
Deferred Tax Assets/ LiabilitiesDeferred tax assets are recognised for all unused tax losses to the extent that it is probable that taxable profit will be available against which the losses can be utilised. Significant management judgment is required to determine the amount of deferred tax assets that can be recognized, based upon the likely
timing and the level of future taxable profits together with future tax planning strategies.
Further details on taxes are disclosed in note 9.
Contingent LiabilitiesContingent liabilities are possible obligations that arise from past events and whose existence will be confirmed only by the occurrence or non occurrence of one or more uncertain future events not wholly within the control of the entity. all contingent liabilities are disclosed in note 36 to the financial statement in page 145 unless the possibility of an outflow of resources embodying economic benefit is remote.
Employee Benefit LiabilityThe employee benefit liability of the Group is based on the actuarial valuation carried out by independent actuarial specialist. The actuarial valuations involve making assumptions about discount rates and future salary increases. The complexity of the valuation, the underlying assumptions and its long term nature, the defined benefit obligation is highly sensitive to changes in these assumptions. all assumptions are reviewed at each reporting date. Details of the key assumptions used in the estimates are contained in note 31.2.
Fair value of financial instrumentsWhere the fair value of financial assets and financial liabilities recorded in the statement of financial position cannot be derived from active markets, their fair value is determined using valuation techniques including the discounted cash flow model. The inputs to these models are taken from observable markets where possible.
Where this is not feasible, a degree of judgment is required in establishing fair values. The judgments include considerations of inputs such as liquidity risk, credit risk and volatility. Changes in assumptions about these factors could affect the reported fair value of financial instruments (see note 12).
1.4 suMMaRY oF siGniFiCanT aCCounTinG PoLiCies1.4.1 Business combinations & goodwillacquisitions of subsidiaries are accounted for using the acquisition method of accounting. The Group measures goodwill at the acquisition date as the fair value of the consideration transferred including the recognized amount of any non-controlling interests in the acquiree, less the net recognized amount (generally fair value) of the identifiable assets acquired and liabilities assumed, all measured as of the acquisition date. When the excess is negative, a bargain purchase gain is recognized immediately in the income statement.
The Group selects on a transaction-by-transaction basis whether to measure non-controlling interests at fair value, or at their proportionate share of the recognized amount of the identifiable net assets, at the acquisition date. Transaction costs, other than those associated with the issue of debt or equity securities, that the Group incurs in connection with a business combination are expensed as incurred.
When the Group acquires a business, it assesses the financial assets and liabilities assumed for appropriate classification and designation in
103Annual Report 2015/16
accordance with the contractual terms, economic circumstances and pertinent conditions as at the acquisition date.
This includes the separation of embedded derivatives in host contracts by the acquiree.
if the business combination is achieved in stages, the acquisition date fair value of the acquirer’s previously held equity interest in the acquiree is remeasured to fair value at the acquisition date through profit or loss.
any contingent consideration to be transferred by the acquirer will be recognized at fair value at the acquisition date. Contingent consideration which is deemed to be an asset or liability, which is a financial instrument and within the scope of LKas 39, is measured at fair value with changes in fair value either in profit or loss or as a change to other comprehensive income. if the contingent consideration is classified as equity, it will not be remeasured. subsequent settlement is accounted for within equity. in instances where the contingent consideration does not fall within the scope of LKas 39, it is measured in accordance with the appropriate sLFRs/LKas.
Goodwill is initially measured at cost being the excess of the consideration transferred over the Group’s net identifiable assets acquired and liabilities assumed. if this consideration is lower than the fair value of the net assets of the subsidiary acquired. The difference is recognized in the income statement.
after initial recognition, goodwill is measured at cost less any accumulated impairment losses. Goodwill is reviewed
for impairment, annually or more frequently if events or changes in circumstances indicate that the carrying value maybe impaired.
For the purpose of impairment testing, goodwill acquired in a business combination is, from the acquisition date, allocated to each of the Group’s cash generating units that are expected to benefit from the combination, irrespective of whether other assets or liabilities of the acquiree are assigned to those units.
impairment is determined by assessing the recoverable amount of the cash-generating unit to which the goodwill relates. Where the recoverable amount of the cash generating unit is less than the carrying amount, an impairment loss is recognized. The impairment loss is allocated first to reduce the carrying amount of any goodwill allocated to the unit and then to the other assets pro-rata to the carrying amount of each asset in the unit.
Goodwill and fair value adjustments arising on the acquisition of a foreign operation area treated as assets and liabilities of the foreign operation and translated at the closing rate.
Where goodwill forms part of a cash-generating unit and part of the operation within that unit is disposed of, the goodwill associated with the operation disposed of is included in the carrying amount of the operation when determining the gain or loss on disposal of the operation. Goodwill disposed in this circumstance is measured based on the relative values of the operation disposed of and the portion of the cash-generating unit retained.
1.4.2. Investment in Associatean associate is an entity over which the Group has significant influence. Significant influence is the power to participate in the financial and operating policy decisions of the investee, but is not control or joint control over those policies.
associate company of the Group which has been accounted for under the equity method of accounting is:
name Country of incorporation
Keells Realtors Ltd sri Lanka
The investments in associates are carried in the statement of financial position at cost plus post acquisition changes in the Group’s share of net assets of the associates. Goodwill relating to an associate is included in the carrying amount of the investment and is neither amortised nor individually tested for impairment. after application of the equity method, the Group determines whether it is necessary to recognise any additional impairment loss with respect to the Group’s net investment in the associate. The Group determines at each reporting date whether there is any objective evidence that the investment in the associate is impaired. if this is the case, the Group calculates the amount of impairment as the difference between the recoverable amount of the associate and its carrying value and recognises the amount in the ‘share of results of equity accounted investees’ in the income statement.
The income statement reflects the share of the results of operations of the associate. Changes, if any, recognised directly in the equity of the associate, the
104 John Keells PlC
Notes to the Financial Statements
Group recognises its share and discloses this, when applicable in the statement of changes in equity. unrealised gains and losses resulting from transactions between the Group and the associate are eliminated to the extent of the interest in the associate.
The share of profit of an associate is shown on the face of the income statement. This is the profit attributable to equity holders of the associate and therefore is profit after tax and non-controlling interests in the subsidiaries of the associate.
The Group ceases to recognise further losses when the Group’s share of losses in an associate equals or exceeds the interest in the undertaking, unless it has incurred obligations or made payments on behalf of the entity.
The accounting policies of associate companies conform to those used for similar transactions of the Group.
equity method of accounting has been applied for associate financial statements using their respective 12 month financial period.
Upon loss of significant influence over the associate, the Group measures and recognises any retaining investment at its fair value. any difference between the carrying amount of the associate upon loss of significant influence and the fair value of the retaining investment and proceeds from disposal is recognised in profit or loss
1.4.3 TaxCurrent taxCurrent tax assets and liabilities for the current and prior periods are measured
at the amount expected to be recovered from or paid to the taxation authorities. The tax rates and tax laws used to compute the amount are those that are enacted or substantively enacted, at the reporting date in the countries where the Group operates and generates taxable income.
Current income tax relating to items recognised directly in equity is recognised in equity and not in the income statement. Management periodically evaluates positions taken in the tax returns with respect to situations in which applicable tax regulations are subject to interpretation and establishes provisions where appropriate.
Deferred taxDeferred tax is provided using the liability method on temporary differences at the reporting date between the tax bases of assets and liabilities and their carrying amounts for financial reporting purposes.
Deferred tax liabilities are recognized for all taxable temporary differences, except:
• where the deferred tax liability arises from the initial recognition of goodwill or of an asset or liability in a transaction that is not a business combination and, at the time of the transaction, affects neither the accounting profit nor taxable profit or loss and
• in respect of taxable temporary differences associated with investments in subsidiaries, associates and interests in joint ventures, where the timing of the reversal of the temporary differences can be controlled and it is probable that the temporary differences will not reverse in the foreseeable future.
Deferred tax assets are recognised for all deductible temporary differences, and unused tax credits and tax losses carried forward, to the extent that it is probable that taxable profit will be available against which the deductible temporary differences and the unused tax credits and tax losses carried forward can be utilized except:
• Where the deferred income tax asset relating to the deductible temporary difference arises from the initial recognition of an asset or liability in a transaction that is not a business combination and, at the time of the transaction, affects neither the accounting profit nor taxable profit or loss; and·
• in respect of deductible temporary differences associated with investments in subsidiaries, associates and interests in joint ventures, deferred tax assets are recognized only to the extent that it is probable that the temporary differences will reverse in the foreseeable future and taxable profit will be available against which the temporary differences can be utilised.
The carrying amount of deferred tax assets is reviewed at each reporting date and reduced to the extent that it is no longer probable that sufficient taxable profit will be available to allow all or part of the deferred tax asset to be utilised. unrecognised deferred tax assets are reassessed at each reporting date and are recognised to the extent that it has become probable that future taxable profit will allow the deferred tax asset to be recovered.
105Annual Report 2015/16
Deferred tax assets and liabilities are measured at tax rates that are expected to apply to the year when the asset is realised or liability is settled, based on the tax rates and tax laws that have been enacted or substantively enacted as at the reporting date.
Deferred tax relating to items recognised outside profit or loss is recognised outside profit or loss. Deferred tax items are recognised in correlation to the underlying transaction either in other comprehensive income or directly in equity.
Deferred tax assets and deferred tax liabilities are offset, if a legally enforceable right exists to set off current tax assets against current tax liabilities and when the deferred taxes relate to the same taxable entity and the same taxation authority.
Sales taxRevenues, expenses and assets are recognised net of the amount of sales tax except:
• where the sales tax incurred on a purchase of a assets or services is not recoverable from the taxation authority, in which case the sales tax is recognised as part of the cost of acquisition of the asset or as part of the expense item as applicable; and
• Receivables and payables that are stated with the amount of sales tax included.
The net amount of sales tax recoverable from, or payable to, the taxation authority is included as part of receivables or payables in the statement of financial position.
1.4.4 Current versus non-current classification The Group presents assets and liabilities in statement of financial position based on current/non-current classification. An asset as current when it is:
• Expected to be realised or intended to sold or consumed in normal operating cycle
• Held primarily for the purpose of trading
• Expected to be realised within twelve months after the reporting period
or
• Cash or cash equivalent unless restricted from being exchanged or used to settle a liability for at least twelve months after the reporting period
All other assets are classified as non-current.
a liability is current when:
• It is expected to be settled in normal operating cycle
• It is held primarily for the purpose of trading
• It is due to be settled within twelve months after the reporting period
or
• There is no unconditional right to defer the settlement of the liability for at least twelve months after the reporting period
The Group classifies all other liabilities as non-current.
Deferred tax assets and liabilities are classified as non-current assets and liabilities.
1.4.5 Fair Value MeasurementThe Group measures financial instruments such as quoted investments, and non-financial assets such as investment properties, at fair value at each reporting date. Fair value related disclosures for financial instruments and non-financial assets that are measured at fair value or where fair values are disclosed are summarized in the following notes:
Disclosures for valuation methods, significant estimates and assumptions
note 15.2,14.9,12.3
Quantitative disclosures of fair value measurement hierarchy note
note 15.214.9
investment in unquoted equity shares note
note 12.3
Fair value is the price that would be received to sell an asset or paid to transfer a liability in an orderly transaction between market participants at the measurement date. The fair value measurement is based on the presumption that the transaction to sell the asset or transfer the liability takes place either: • In the principal market for the asset or
liability or in the absence of a principal market.
• In the most advantageous market for the asset or liability.
The principal or the most advantageous market must be accessible by the company.
The fair value of an asset or a liability is measured using the assumptions that market participants would use when pricing the asset or liability, assuming that market participants act in their economic best interest.
106 John Keells PlC
Notes to the Financial Statements
a fair value measurement of a non-financial asset takes into account a market participant’s ability to generate economic benefits by using the asset in its highest and best use or by selling it to another market participant that would use the asset in its highest and best use.
The Company uses valuation techniques that are appropriate in the circumstances and for which sufficient data are available to measure fair value, maximising the use of relevant observable inputs and minimising the use of unobservable inputs.
all assets and liabilities for which fair value is measured or disclosed in the financial statements are categorised within the fair value hierarchy described as follows, based on the lowest level input that is significant to the fair value measurement as a whole:
Level 1 — Quoted (unadjusted) market prices in active markets for identical assets or liabilities
Level 2 — Valuation techniques for which the lowest level input that is significant to the fair value measurement is directly or indirectly observable
Level 3 — Valuation techniques for which the lowest level input that is significant to the fair value measurement is unobservable
For assets and liabilities that are recognised in the financial statements on a recurring basis, the Group determines whether transfers have occurred between levels in the hierarchy by reassessing categorisation (based on the lowest level input that is significant to the fair value
measurement as a whole) at the end of each reporting period.
The Group determines the policies and procedures for both recurring fair value measurement, such as investment properties and unquoted aFs financial assets, and for non-recurring measurement, such as assets held for sale in discontinued operations.
external valuers are involved for valuation of significant assets, such as land and building and investment properties, and significant liabilities, such as insurance contracts. selection criteria for external valuers include market knowledge, reputation, independence and whether professional standards are maintained.
1.4.6 Property, plant and equipmentBasis of recognitionProperty, plant and equipment are recognized if it is probable that future economic benefits associated with the asset will flow to the company and the cost of the asset can be reliably measured.
Basis of measurementPlant and equipment are stated at cost less accumulated depreciation and any accumulated impairment loss. such cost includes the cost of replacing component parts of the plant and equipment and borrowing costs for long-term construction projects if the recognition criteria are met. When significant parts of plant and equipment are required to be replaced at intervals, the Group derecognises the replaced part, and recognises the new part with its own associated useful life and depreciation. Likewise, when a major inspection is performed, its cost is
recognised in the carrying amount of the plant and equipment as a replacement if the recognition criteria are satisfied. all other repair and maintenance costs are recognised in the income statement as incurred. The present value of the expected cost for the decommissioning of the asset after its use is included in the cost of the respective asset if the recognition criteria for a provision are met.
Buildings are measured at fair value less accumulated depreciation on buildings and impairment charged subsequent to the date of the revaluation.
The carrying values of property, plant and equipment are reviewed for impairment when events or changes in circumstances indicate that the carrying value may not be recoverable.
Where land and buildings are subsequently revalued, the entire class of such assets is revalued at fair value on the date of revaluation.
any revaluation surplus is recognised in other comprehensive income and accumulated in equity in the asset revaluation reserve, except to the extent that it reverses a revaluation decrease of the same asset previously recognised in the income statement, in which case the increase is recognised in the income statement. a revaluation deficit is recognised in the income statement, except to the extent that it offsets an existing surplus on the same asset recognised in the asset revaluation reserve.
accumulated depreciation as at the revaluation date is eliminated against the
107Annual Report 2015/16
gross carrying amount of the asset and the net amount is restated to the revalued amount of the asset. upon disposal, any revaluation reserve relating to the particular asset being sold is transferred to retained earnings.
Derecognitionan item of property, plant and equipment are derecognised upon replacement, disposal or when no future economic benefits are expected from its use. Any gain or loss arising on derecognition of the asset is included in the income statement in the year the asset is derecognised.
DepreciationDepreciation is calculated by using a straight-line method on the cost or valuation of all property, plant and equipment, other than freehold land, in order to write off such amounts over the estimated useful economic life of such assets.
The estimated useful life of assets is as follows:
assets YearsBuildings on leasehold land over the Lease period
36
Plant and machinery 2-10equipment 6-8Furniture and fittings 8Motor vehicles 5Computer equipment 5other 5
The asset’s residual values and useful lives are reviewed, and adjusted if appropriate, at each financial year end.
1.4.7 Lease rentals paid in advance Prepaid lease rentals paid to acquire land use rights are amortised over the lease term in accordance with the pattern of benefits provided.
Details of Leasehold Property are given in note 18 to the Financial statements.
1.4.8 Investment propertiesinvestment properties are measured initially at cost, including transaction costs. The carrying value of an investment property includes the cost of replacing part of an existing investment property, at the time that cost is incurred if the recognition criteria are met, and excludes the costs of day-to-day servicing of the investment property. subsequent to initial recognition, the investment properties are stated at fair values, which reflect market conditions at the reporting date.
Gains or losses arising from changes in fair value are included in the income statement in the year in which they arise. Fair values are evaluated at frequent intervals by an accredited external, independent valuer.
investment properties are derecognised when disposed, or permanently withdrawn from use because no future economic benefits are expected. Any gains or losses on retirement or disposal are recognised in the income statement in the year of retirement or disposal.
Transfers are made to or from investment property only when there is a change in use. For a transfer from investment property to owner occupied property or inventory (WiP), the deemed cost for subsequent accounting is the fair
value at the date of change in use. if owner occupied property becomes an investment property or inventory (WiP), the Group accounts for such property in accordance with the policy stated under property, plant and equipment up to the date of change in use.
Where Group companies occupy a significant portion of the investment property of a subsidiary, such investment properties are treated as property, plant and equipment in the consolidated financial statements, and accounted using Group accounting policy for property, plant and equipment.
1.4.9 Intangible assetsBasis of recognitionan intangible asset is recognised if it is probable that future economic benefits associated with the asset will flow to the company and the cost of the asset can be reliably measured.
Basis of measurementintangible assets acquired separately are measured on initial recognition at cost.
Following initial recognition, intangible assets are carried at cost less any accumulated amortisation and any accumulated impairment losses.
internally generated intangible assets, excluding capitalised development costs, are not capitalised, and expenditure is charged against income statement in the year in which the expenditure is incurred.
useful economic lives, amortization and impairmentThe useful lives of intangible assets are assessed as either finite or indefinite lives. Intangible assets with finite lives are
108 John Keells PlC
Notes to the Financial Statements
amortised over the useful economic life and assessed for impairment whenever there is an indication that the intangible asset may be impaired. The amortisation period and the amortisation method for an intangible asset with a finite useful life is reviewed at least at each financial year-end and such changes are treated as accounting estimates. The amortisation expense on intangible assets with finite lives is recognised in the income statement.
Intangible assets with indefinite useful lives are not amortized but tested for impairment annually, or more frequently when an indication of impairment exists either individually or at the cash-generating unit level. The useful life of an intangible asset with an indefinite life is reviewed annually to determine whether indefinite life assessment continues to be supportable. if not, the change in the useful life assessment from indefinite to finite is made on a prospective basis.
Software licensesoftware license costs are recognised as an intangible asset and amortised over the period of expected future usage of related eRP systems.
Gains or losses arising from de recognition of an intangible asset are measured as the difference between the net disposal proceeds and the carrying amount of the asset and are recognised in the income statement when the asset is derecognised.
1.4.10 Financial instruments — initial recognition and subsequent measurementi) Financial assetsInitial recognition and measurementFinancial assets within the scope of LKAS 39 are classified as financial assets at fair value through profit or loss, loans and receivables, held-to-maturity investments, available-for-sale financial assets, or as derivatives designated as hedging instruments in an effective hedge, as appropriate. The Group determines the classification of its financial assets at initial recognition.
All financial assets are recognised initially at fair value plus, in the case of assets not at fair value through profit or loss, directly attributable transaction costs. Purchases or sales of financial assets that require delivery of assets within a time frame established by regulation or convention in the marketplace (regular way trades) are recognised on the trade date, i.e., the date that the Group commits to purchase or sell the asset.
The Group’s financial assets include cash and short-term deposits, trade and other receivables, loans and other receivables, quoted and unquoted financial instruments and derivative financial instruments.
Subsequent measurementThe subsequent measurement of financial assets depends on their classification as follows:
Loans and receivablesLoans and receivables are non-derivative financial assets with fixed or determinable payments that are not quoted in an active market. after initial measurement,
such financial assets are subsequently measured at amortised cost using the effective interest rate method (eiR), less impairment. amortised cost is calculated by taking into account any discount or premium on acquisition and fees or costs that are an integral part of the eiR. The eiR amortisation is included in finance income in the income statement. The losses arising from impairment are recognised in the income statement in finance costs.
Available-for-sale financial investmentsAvailable-for-sale financial investments include equity and debt securities. equity investments classified as available-for-sale are those, which are neither classified as held for trading nor designated at fair value through profit or loss.
after initial measurement, available-for-sale financial investments are subsequently measured at fair value with unrealised gains or losses recognised as other comprehensive income in the available-for-sale reserve until the investment is derecognised, at which time the cumulative gain or loss is recognised in other operating income, or determined to be impaired, at which time the cumulative loss is reclassified to the income statement in finance costs and removed from the available-for-sale reserve. interest income on available-for-sale debt securities is calculated using the effective interest method and is recognised in the income statement.
The Group evaluates its available-for-sale financial assets to determine whether the ability and intention to sell them in the near term is still appropriate. When the Group is unable to trade these financial assets due
109Annual Report 2015/16
to inactive markets and management’s intention to do so significantly changes in the foreseeable future, the Group may elect to reclassify these financial assets in rare circumstances. Reclassification to loans and receivables is permitted when the financial assets meet the definition of loans and receivables and the Group has the intent and ability to hold these assets for the foreseeable future or until maturity. Reclassification to the held-to-maturity category is permitted only when the entity has the ability and intention to hold the financial asset accordingly.
For a financial asset reclassified out of the available-for-sale category, any previous gain or loss on that asset that has been recognised in equity is amortised to profit or loss over the remaining life of the investment using the eiR. any difference between the new amortised cost and the expected cash flows is also amortised over the remaining life of the asset using the eiR. if the asset is subsequently determined to be impaired, then the amount recorded in equity is reclassified to the income statement.
i) DerecognitionA financial asset (or, where applicable a part of a financial asset or part of a Group of similar financial assets) is derecognised when:
• The rights to receive cash flows from the asset have expired
• The Group has transferred its rights to receive cash flows from the asset or has assumed an obligation to pay the received cash flows in full without material delay to a third party under a ‘pass-through’ arrangement; and either (a) the Group has transferred
substantially all the risks and rewards of the asset, or (b) the Group has neither transferred nor retained substantially all the risks and rewards of the asset, but has transferred control of the asset.
When the Group has transferred its rights to receive cash flows from an asset or has entered into a pass-through arrangement, and has neither transferred nor retained substantially all of the risks and rewards of the asset nor transferred control of it, the asset is recognised to the extent of the Group’s continuing involvement in it.
in that case, the Group also recognises an associated liability. The transferred asset and the associated liability are measured on a basis that reflects the rights and obligations that the Group has retained.
Continuing involvement that takes the form of a guarantee over the transferred asset is measured at the lower of the original carrying amount of the asset and the maximum amount of consideration that the Group could be required to repay.
ii) Impairment of financial assetsThe Group assesses at each reporting date whether there is any objective evidence that a financial asset or a Group of financial assets is impaired. A financial asset or a Group of financial assets is deemed to be impaired if, and only if, there is objective evidence of impairment as a result of one or more events that has occurred after the initial recognition of the asset (an incurred ‘loss event’) and that loss event has an impact on the estimated future cash flows of the financial asset or the Group of financial assets that can be reliably estimated.
evidence of impairment may include indications that the debtors or a Group of debtors is experiencing significant financial difficulty, default or delinquency in interest or principal payments, the probability that they will enter bankruptcy or other financial reorganisation and where observable data indicate that there is a measurable decrease in the estimated future cash flows, such as changes in arrears or economic conditions that correlate with Financial assets carried at amortised cost.
For financial assets carried at amortised cost, the Group first assesses whether objective evidence of impairment exists individually for financial assets that are individually significant, or collectively for financial assets that are not individually significant. If the Group determines that no objective evidence of impairment exists for an individually assessed financial asset, whether significant or not, it includes the asset in a Group of financial assets with similar credit risk characteristics and collectively assesses them for impairment. assets that are individually assessed for impairment and for which an impairment loss is, or continues to be, recognised are not included in a collective assessment of impairment.
if there is objective evidence that an impairment loss has been incurred, the amount of the loss is measured as the difference between the assets carrying amount and the present value of estimated future cash flows (excluding future expected credit losses that have not yet been incurred). The present value of the estimated future cash flows is discounted at the financial asset’s original effective interest rate. if a loan
110 John Keells PlC
Notes to the Financial Statements
has a variable interest rate, the discount rate for measuring any impairment loss is the current effective interest rate.
The carrying amount of the asset is reduced through the use of an allowance account and the amount of the loss is recognised in the income statement. interest income continues to be accrued on the reduced carrying amount and is accrued using the rate of interest used to discount the future cash flows for the purpose of measuring the impairment loss. The interest income is recorded as part of finance income in the income statement. Loans together with the associated allowance are written off when there is no realistic prospect of future recovery and all collateral has been realised or has been transferred to the Group. if, in a subsequent year, the amount of the estimated impairment loss increases or decreases because of an event occurring after the impairment was recognised, the previously recognised impairment loss is increased or reduced by adjusting the allowance account. if a future write-off is later recovered, the recovery is credited to finance costs in the income statement
Available-for-sale financial investmentsFor available-for-sale financial investments, the Group assesses at each reporting date whether there is objective evidence that an investment or a Group of investments is impaired.
in the case of equity investments classified as available-for-sale, objective evidence would include a significant or prolonged decline in the fair value of the investment below its cost. ‘Significant’ is evaluated against the original cost of the
investment and ‘prolonged’ against the period in which the fair value has been below its original cost. Where there is evidence of impairment, the cumulative loss measured as the difference between the acquisition cost and the current fair value, less any impairment loss on that investment previously recognised in the income statement is removed from other comprehensive income and recognised in the income statement. impairment losses on equity investments are not reversed through the income statement; increases in their fair value after impairments are recognised directly in other comprehensive income.
iii) Financial liabilitiesInitial recognition and measurementFinancial liabilities within the scope of LKAS 39 are classified as financial liabilities at fair value through profit or loss, loans and borrowings, or as derivatives designated as hedging instruments in an effective hedge, as appropriate. The Group determines the classification of its financial liabilities at initial recognition.
All financial liabilities are recognised initially at fair value and, in the case of loans and borrowings, carried at amortised cost. This includes directly attributable transaction costs.
The Group’s financial liabilities include trade and other payables, bank overdrafts, loans and borrowings.
Subsequent measurementThe measurement of financial liabilities depends on their classification as follows:
Loans and borrowingsafter initial recognition, interest bearing loans and borrowings are subsequently
measured at amortised cost using the effective interest rate method. Gains and losses are recognised in the income statement when the liabilities are derecognised as well as through the effective interest rate method (eiR) amortisation process.
amortised cost is calculated by taking into account any discount or premium on acquisition and fees or costs that are an integral part of the eiR. The eiR amortisation is included in finance costs in the income statement.
DerecognitionA financial liability is derecognised when the obligation under the liability is discharged or cancelled or expires.
When an existing financial liability is replaced by another from the same lender on substantially different terms, or the terms of an existing liability are substantially modified, such an exchange or modification is treated as a derecognition of the original liability and the recognition of a new liability, and the difference in the respective carrying amounts is recognised in the income statement.
iv) offsetting of financial instrumentsFinancial assets and financial liabilities are offset and the net amount reported in the consolidated statement of financial position if, and only if, there is a currently enforceable legal right to offset the recognised amounts and there is an intention to settle on a net basis, or to realise the assets and settle the liabilities simultaneously.
111Annual Report 2015/16
v) Fair value of financial instrumentsThe fair value of financial instruments that are traded in active markets at each reporting date is determined by reference to quoted market prices or dealer price quotations (bid price for long positions and ask price for short positions), without any deduction for transaction costs.
For financial instruments not traded in an active market, the fair value is determined using appropriate valuation techniques. such techniques may include using recent arm’s length market transactions; reference to the current fair value of another instrument that is substantially the same; a discounted cash flow analysis or other valuation models.
An analysis of fair values of financial instruments and further details as to how they are measured are provided in note 12.
1.4.11 Inventoriesinventories are valued at the lower of cost and net realisable value. net realisable value is the estimated selling price less estimated costs of completion and the estimated costs necessary to make the sale.
The costs incurred in bringing inventories to its present location and condition, are accounted for as follows:
other inventories at actual cost
1.4.12 Cash and cash equivalentsCash and short-term deposits in the statement of financial position comprise cash at banks and on hand and short-term deposits with a maturity of three months or less.
For the purpose of the cash flow statement, cash and cash equivalents consist of cash and short-term deposits as defined above, net of outstanding bank overdrafts.
1.4.13 Defined benefit plan - gratuityThe liability recognised in the statement of financial position is the present value of the defined benefit obligation at the reporting date using the projected unit credit method. any actuarial gains or losses arising are recognised immediately in other comprehensive income. such actuarial gains and losses are also immediately recognized in retained earnings and are not reclassified to profit or loss subsequent periods.
1.4.14 Defined contribution plan - Employees’ Provident Fund and Employees’ Trust Fundemployees are eligible for employees’ Provident Fund contributions and employees’ Trust Fund contributions in line with respective statutes and regulations. The companies contribute the defined percentages of gross emoluments of employees to an approved employees’ Provident Fund and to the employees’ Trust Fund respectively, which are externally funded.
1.4.15 Employee share option planemployees of the Group receive remuneration in the form of share based payment transaction, whereby employees render services as consideration for equity instruments (equity-settled transactions) The company, applied sLFRs 02 share Based Payments in accounting for employee remuneration in
the form of shares from 2014/15 financial year onwards.
Equity-settled transactionThe cost of equity-settled transactions is recognized, together with a corresponding increase in other capital reserves in equity, over the period in which the performance and service conditions are fulfilled. The cumulative expense recognized for equity-settled transactions at each reporting date until the vesting date reflects the extent to which the vesting period had expired and the Group’s best estimate of the number of equity instruments that will ultimately vest. The income statement expense or credit for a period represents the movement in cumulative expense recognized as at the beginning and end of that period and is recognized in the share based payment plan note.
no expense is recognized for awards that do not ultimately vest, except for equity-settled transactions where vesting is conditional upon a market or non-vesting Condition, which are treated as vesting irrespective of whether or not the market or non-vesting condition is satisfied, provided that all other performance and service conditions are satisfied.
Where the terms of an equity-settled transaction award are modified, the minimum expense recognized is the expense as if the terms had not been modified, if the original terms of the award are met. an additional expense is recognized for any modification that increases the total fair value of the share-based payment transaction, or is otherwise beneficial to the employee as measured at the date of modification.
112 John Keells PlC
Notes to the Financial Statements
Where an equity-settled award is cancelled, it is treated as if it vested on the date of cancellation, and any expense not yet recognized for the award is recognized immediately. This includes any award where non-vesting conditions within the control of either the entity or the employee are not met. However, if a new award is substituted of the cancelled award, and designated as a replacement award on the date that it is granted, the cancelled award and the new award are treated as if they were a modification of the original award, as described in the previous paragraph, (further details given in note 28.2).
1.4.16 Provisions, contingent assets and contingent liabilitiesProvisions are recognised when the Group has a present obligation (legal or constructive) as a result of a past event, it is probable that an outflow of resources embodying economic benefits will be required to settle the obligation and a reliable estimate can be made of the amount of the obligation. Where the Group expects some or all of a provision to be reimbursed, for example under an insurance contract, the reimbursement is recognised as a separate asset but only when the reimbursement is virtually certain. The expense relating to any provision is presented in the income statement net of any reimbursement.
if the effect of the time value of money is material, provisions are discounted using a current pre-tax rate that reflects, where appropriate, the risks specific to the liability. Where discounting is used, the increase in the provision due to the passage of time is recognised as a finance cost.
all contingent liabilities are disclosed as a note to the financial statements unless the outflow of resources is remote. a contingent liability recognised in a business combination is initially measured at its fair value. subsequently, it is measured at the higher of:
• The amount that would be recognised in accordance with the general guidance for provisions above (LKas 37) or
• Contingent assets are disclosed, where inflow of economic benefit is probable.
1.4.17 Revenue recognitionRevenue is recognised to the extent that it is probable that the economic benefits will flow to the Group, and the revenue and associated costs incurred or to be incurred can be reliably measured. Revenue is measured at the fair value of the consideration received or receivable, net of trade discounts and value added taxes, after eliminating sales within the Group.
The following specific criteria are used for recognition of revenue:
Brokerage IncomeRevenue from the sale of goods is recognised when the significant risk and rewards of ownership of the goods have passed to the buyer with the Group retaining neither a continuing managerial involvement to the degree usually associated with ownership, nor an effective control over the goods sold.
Rendering of servicesRevenue from rendering of services is recognised by reference to the stage of completion. Where the contract outcome
cannot be measured reliably, revenue is recognised only to the extent that the expenses incurred are eligible to be recovered.
Turnover based taxesTurnover based taxes include value added tax, economic service charge, nation building tax and turnover tax. Companies in the Group pay such taxes in accordance with the respective statutes.
DividendDividend income is recognised when the Group’s right to receive the payment is established.
Interest incomeFor all financial instruments measured at amortised cost and interest bearing financial assets classified as available for sale, interest income or expense is recorded using the effective interest rate (eiR), which is the rate that exactly discounts the estimated future cash payments or receipts through the expected life of the financial instrument or a shorter period, where appropriate, to the net carrying amount of the financial asset or liability. interest income is included in finance income in the income statement.
Gains and lossesnet gains and losses of a revenue nature arising from the disposal of property, plant and equipment and other non-current assets, including investments, are accounted for in the income statement, after deducting from the proceeds on disposal, the carrying amount of such assets and the related selling expenses.
113Annual Report 2015/16
Gains and losses arising from activities incidental to the main revenue generating activities and those arising from a group of similar transactions, which are not material are aggregated, reported and presented on a net basis.
any losses arising from guaranteed rentals are accounted for in the year of incurring the same. a provision is recognised if the projection indicates a loss.
Other incomeother income is recognised on an accrual basis.
1.4.18 Expenditure recognitionexpenses are recognised in the income statement on the basis of a direct association between the cost incurred and the earning of specific items of income. all expenditure incurred in the running of the business and in maintaining the property, plant and equipment in a state of efficiency has been charged to the income statement.
For the purpose of presentation of the income statement, the “function of expenses” method has been adopted, on the basis that it presents fairly the elements of the Company and Group’s performance.
Borrowing costsBorrowing costs directly attributable to the acquisition, construction or production of an asset that necessarily takes a substantial period of time to get ready for its intended use or sale are capitalised as part of the cost of the respective assets. all other borrowing costs are expensed in the period they occur. Borrowing costs consist of interest and other costs that the Group incurs in connection with the borrowing of funds.
1.5 seGMenT inFoRMaTion1.5.1 Reporting segmentsThe group’s internal organisation and management is structured based on individual products and services which are similar in nature and process and where the risk and return are similar. The primary segments represent this business structure.
since the individual segments are located close to each other and operate in the same industry environment, catering to clientele from the same geographical location, the need for geographical segmentation does not arise
1.5.2 Segment informationsegment information has been prepared in conformity with the accounting policies adopted for preparing and presenting the consolidated financial statements of the group.
no operating segments have been aggregated to form the above reportable operating segments. an individual segment manger is determined for each operating segment and the results are regularly reviewed by the Board of Directors. The Board of Directors monitors the operating results of its business units separately for the purpose of making decisions about resource allocation and performance assessment. segment performance is evaluated based on operating profit or loss which in certain respects, as explained in the operating segments information, is measured differently from operating profit or loss in the consolidated financial statements. However, except for Financial services segment other segments’ financing activities are managed on a Group basis and are not allocated to operating
segment. The income taxes are managed on Group basis and are not allocated to operating segments.
2. sRi LanKa aCCounTinG sTanDaRDs (sLFRs/LKas) issueD BuT noT YeT eFFeCTiVe
Certain new accounting standards and amendments / improvements to existing standards have been published, that are not mandatory for 31 March 2016 reporting period. none of these have been early adopted by the group. SLFRS 9 -Financial InstrumentssLFRs 9 replaces the existing guidance in LKas 39 Financial instruments: Recognition and Measurement. sLFRs 9 includes revised guidance on the classification and measurement of the financial instruments, a new expected credit loss model for calculating impairment on financial assets, and new general hedge accounting requirements. it also carries forward the guidance on recognition and derecognition of financial instruments from LKas 39. sLFRs 9 is effective for annual reporting periods beginning on or after 01 January 2018, with early adoption permitted. SLFRS 15 Revenue from Contracts with CustomerssLFRs 15 establishes a comprehensive framework for determining whether, how much and when revenue is recognized. it replaces existing revenue recognition guidance, including LKas 18 Revenue, LKas 11 Construction Contracts and iFRiC 13 Customer Loyalty Programmes. sLFRs 15 is effective for annual reporting periods beginning on or after 01 January 2018, with early adoption permitted.
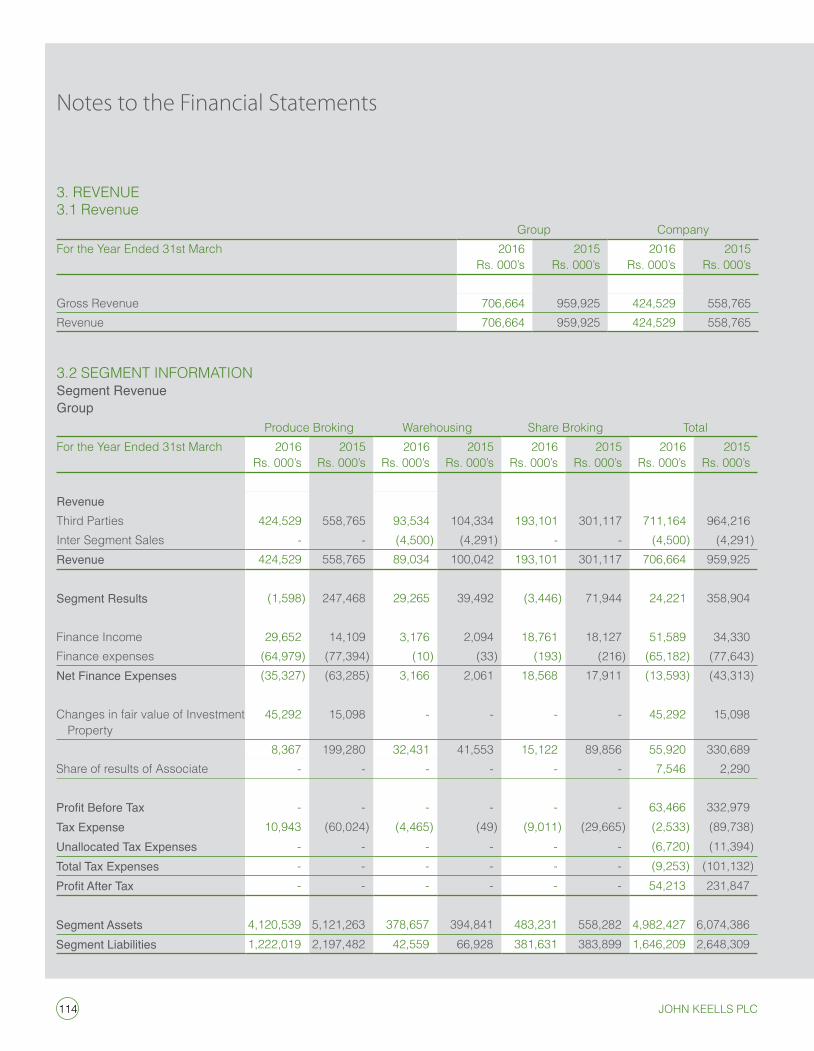
114 John Keells PlC
Notes to the Financial Statements
3. ReVenue3.1 Revenue
Group CompanyFor the Year ended 31st March 2016
Rs. 000’s2015
Rs. 000’s2016
Rs. 000’s2015
Rs. 000’s
Gross Revenue 706,664 959,925 424,529 558,765 Revenue 706,664 959,925 424,529 558,765
3.2 seGMenT inFoRMaTion Segment RevenueGroup
Produce Broking Warehousing share Broking TotalFor the Year ended 31st March 2016
Rs. 000’s2015
Rs. 000’s2016
Rs. 000’s2015
Rs. 000’s2016
Rs. 000’s2015
Rs. 000’s2016
Rs. 000’s2015
Rs. 000’s
RevenueThird Parties 424,529 558,765 93,534 104,334 193,101 301,117 711,164 964,216 inter segment sales - - (4,500) (4,291) - - (4,500) (4,291)Revenue 424,529 558,765 89,034 100,042 193,101 301,117 706,664 959,925
Segment Results (1,598) 247,468 29,265 39,492 (3,446) 71,944 24,221 358,904
Finance income 29,652 14,109 3,176 2,094 18,761 18,127 51,589 34,330 Finance expenses (64,979) (77,394) (10) (33) (193) (216) (65,182) (77,643)Net Finance Expenses (35,327) (63,285) 3,166 2,061 18,568 17,911 (13,593) (43,313)
Changes in fair value of investment Property
45,292 15,098 - - - - 45,292 15,098
8,367 199,280 32,431 41,553 15,122 89,856 55,920 330,689share of results of associate - - - - - - 7,546 2,290
Profit Before Tax - - - - - - 63,466 332,979 Tax Expense 10,943 (60,024) (4,465) (49) (9,011) (29,665) (2,533) (89,738)unallocated Tax Expenses - - - - - - (6,720) (11,394)Total Tax Expenses - - - - - - (9,253) (101,132)Profit After Tax - - - - - - 54,213 231,847
Segment Assets 4,120,539 5,121,263 378,657 394,841 483,231 558,282 4,982,427 6,074,386 Segment Liabilities 1,222,019 2,197,482 42,559 66,928 381,631 383,899 1,646,209 2,648,309
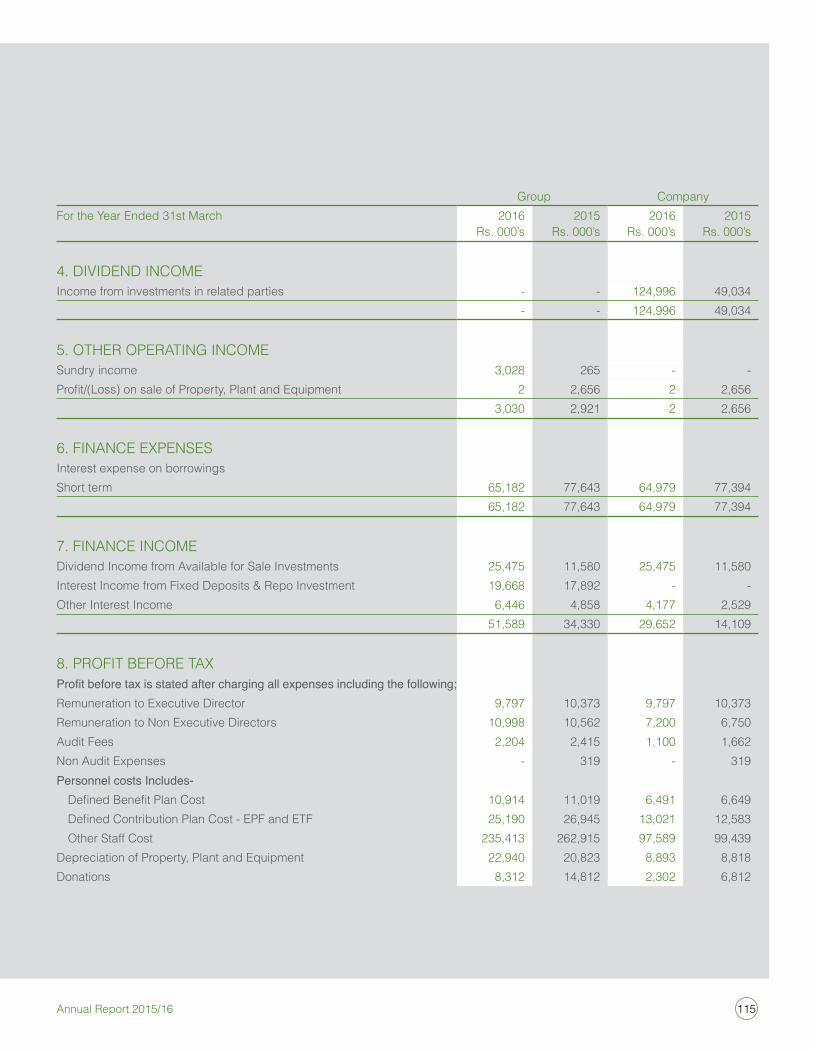
115Annual Report 2015/16
Group CompanyFor the Year ended 31st March 2016
Rs. 000’s2015
Rs. 000’s2016
Rs. 000’s2015
Rs. 000’s
4. DiViDenD inCoMeincome from investments in related parties - - 124,996 49,034
- - 124,996 49,034
5. oTHeR oPeRaTinG inCoMesundry income 3,028 265 - - Profit/(Loss) on sale of Property, Plant and Equipment 2 2,656 2 2,656
3,030 2,921 2 2,656
6. FinanCe exPensesinterest expense on borrowingsshort term 65,182 77,643 64,979 77,394
65,182 77,643 64,979 77,394
7. FinanCe inCoMeDividend income from available for sale investments 25,475 11,580 25,475 11,580 interest income from Fixed Deposits & Repo investment 19,668 17,892 - - other interest income 6,446 4,858 4,177 2,529
51,589 34,330 29,652 14,109
8. PRoFiT BeFoRe TaxProfit before tax is stated after charging all expenses including the following;Remuneration to executive Director 9,797 10,373 9,797 10,373 Remuneration to non executive Directors 10,998 10,562 7,200 6,750 audit Fees 2,204 2,415 1,100 1,662 non audit expenses - 319 - 319 Personnel costs Includes- Defined Benefit Plan Cost 10,914 11,019 6,491 6,649 Defined Contribution Plan Cost - EPF and ETF 25,190 26,945 13,021 12,583 other staff Cost 235,413 262,915 97,589 99,439 Depreciation of Property, Plant and equipment 22,940 20,823 8,893 8,818 Donations 8,312 14,812 2,302 6,812
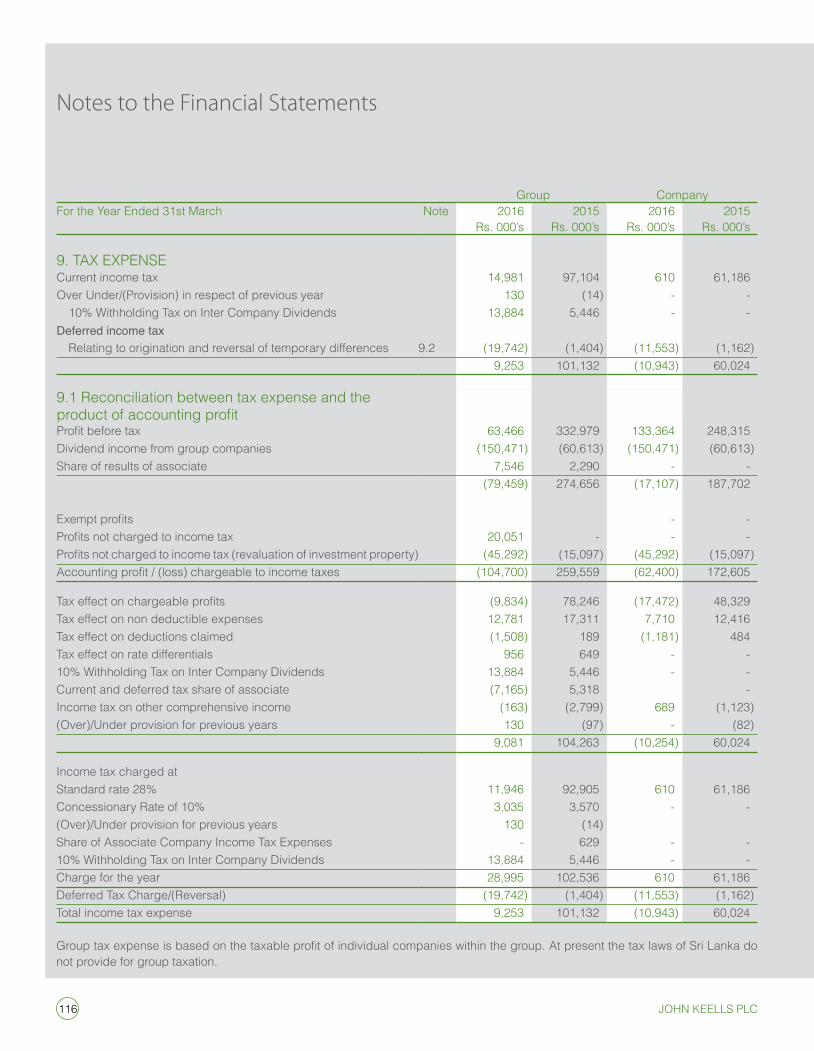
116 John Keells PlC
Notes to the Financial Statements
Group CompanyFor the Year ended 31st March note 2016
Rs. 000’s2015
Rs. 000’s2016
Rs. 000’s2015
Rs. 000’s
9. Tax exPenseCurrent income tax 14,981 97,104 610 61,186 over under/(Provision) in respect of previous year 130 (14) - - 10% Withholding Tax on inter Company Dividends 13,884 5,446 - - Deferred income tax Relating to origination and reversal of temporary differences 9.2 (19,742) (1,404) (11,553) (1,162) 9,253 101,132 (10,943) 60,024
9.1 Reconciliation between tax expense and the product of accounting profitProfit before tax 63,466 332,979 133,364 248,315 Dividend income from group companies (150,471) (60,613) (150,471) (60,613)share of results of associate 7,546 2,290 - -
(79,459) 274,656 (17,107) 187,702
Exempt profits - - Profits not charged to income tax 20,051 - - - Profits not charged to income tax (revaluation of investment property) (45,292) (15,097) (45,292) (15,097)Accounting profit / (loss) chargeable to income taxes (104,700) 259,559 (62,400) 172,605
Tax effect on chargeable profits (9,834) 78,246 (17,472) 48,329 Tax effect on non deductible expenses 12,781 17,311 7,710 12,416 Tax effect on deductions claimed (1,508) 189 (1,181) 484 Tax effect on rate differentials 956 649 - - 10% Withholding Tax on inter Company Dividends 13,884 5,446 - - Current and deferred tax share of associate (7,165) 5,318 - income tax on other comprehensive income (163) (2,799) 689 (1,123)(over)/under provision for previous years 130 (97) - (82)
9,081 104,263 (10,254) 60,024
income tax charged atstandard rate 28% 11,946 92,905 610 61,186 Concessionary Rate of 10% 3,035 3,570 - - (over)/under provision for previous years 130 (14)share of associate Company income Tax expenses - 629 - - 10% Withholding Tax on inter Company Dividends 13,884 5,446 - - Charge for the year 28,995 102,536 610 61,186 Deferred Tax Charge/(Reversal) (19,742) (1,404) (11,553) (1,162)Total income tax expense 9,253 101,132 (10,943) 60,024
Group tax expense is based on the taxable profit of individual companies within the group. At present the tax laws of Sri Lanka do not provide for group taxation.
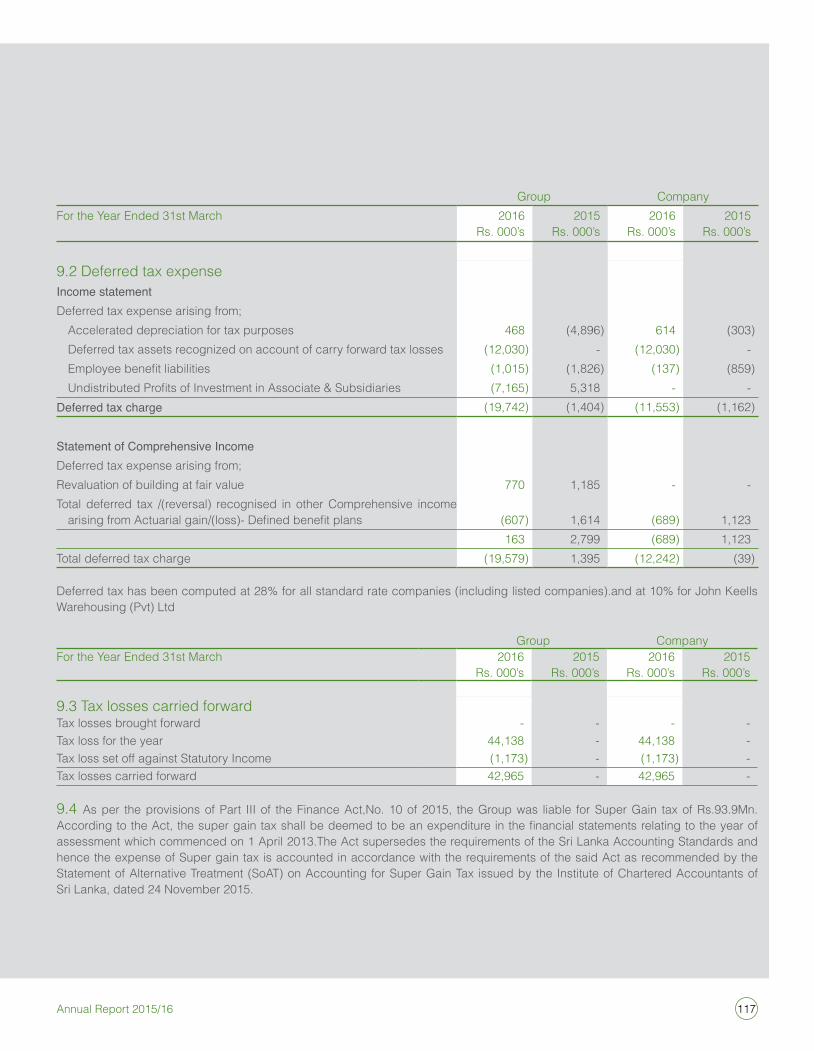
117Annual Report 2015/16
Group CompanyFor the Year ended 31st March 2016
Rs. 000’s2015
Rs. 000’s2016
Rs. 000’s2015
Rs. 000’s
9.2 Deferred tax expenseIncome statementDeferred tax expense arising from; accelerated depreciation for tax purposes 468 (4,896) 614 (303) Deferred tax assets recognized on account of carry forward tax losses (12,030) - (12,030) - Employee benefit liabilities (1,015) (1,826) (137) (859) Undistributed Profits of Investment in Associate & Subsidiaries (7,165) 5,318 - - Deferred tax charge (19,742) (1,404) (11,553) (1,162)
Statement of Comprehensive IncomeDeferred tax expense arising from; Revaluation of building at fair value 770 1,185 - - Total deferred tax /(reversal) recognised in other Comprehensive income
arising from Actuarial gain/(loss)- Defined benefit plans (607) 1,614 (689) 1,123 163 2,799 (689) 1,123
Total deferred tax charge (19,579) 1,395 (12,242) (39)
Deferred tax has been computed at 28% for all standard rate companies (including listed companies).and at 10% for John Keells Warehousing (Pvt) Ltd
Group CompanyFor the Year ended 31st March 2016
Rs. 000’s2015
Rs. 000’s2016
Rs. 000’s2015
Rs. 000’s
9.3 Tax losses carried forwardTax losses brought forward - - - -Tax loss for the year 44,138 - 44,138 -Tax loss set off against statutory income (1,173) - (1,173) -Tax losses carried forward 42,965 - 42,965 -
9.4 as per the provisions of Part iii of the Finance act,no. 10 of 2015, the Group was liable for super Gain tax of Rs.93.9Mn. According to the Act, the super gain tax shall be deemed to be an expenditure in the financial statements relating to the year of assessment which commenced on 1 april 2013.The act supersedes the requirements of the sri Lanka accounting standards and hence the expense of super gain tax is accounted in accordance with the requirements of the said act as recommended by the statement of alternative Treatment (soaT) on accounting for super Gain Tax issued by the institute of Chartered accountants of sri Lanka, dated 24 november 2015.
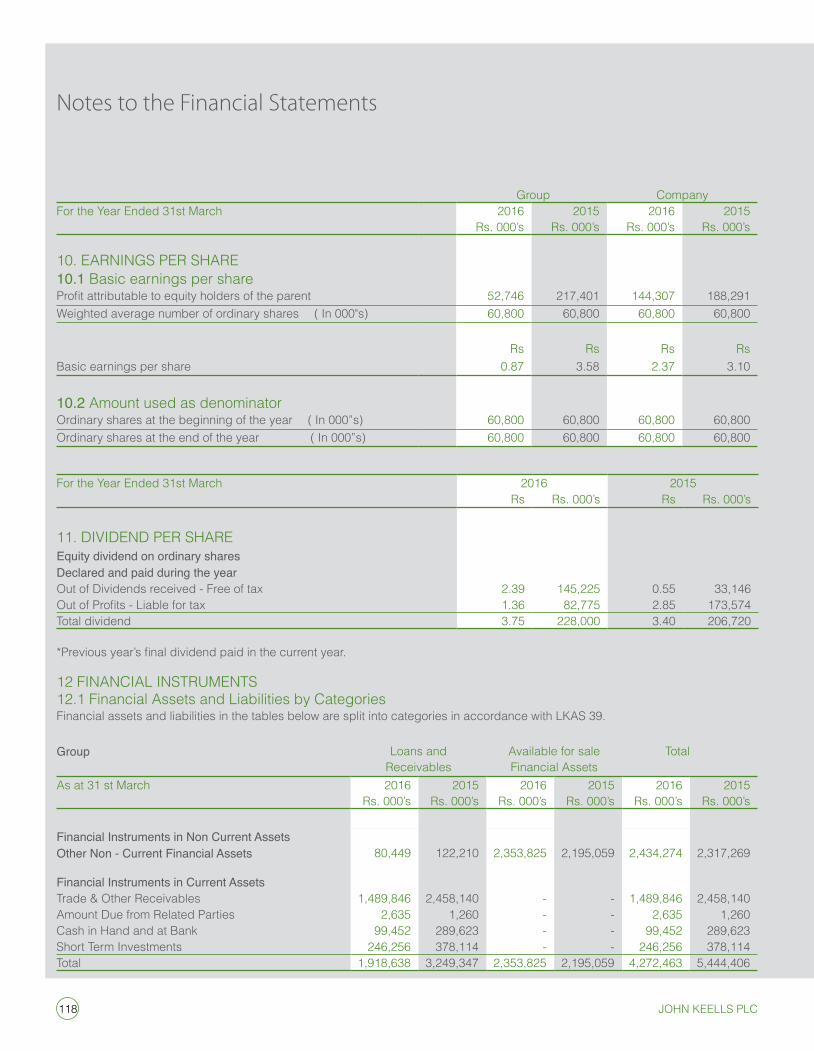
118 John Keells PlC
Notes to the Financial Statements
Group CompanyFor the Year ended 31st March 2016
Rs. 000’s2015
Rs. 000’s2016
Rs. 000’s2015
Rs. 000’s
10. eaRninGs PeR sHaRe10.1 Basic earnings per shareProfit attributable to equity holders of the parent 52,746 217,401 144,307 188,291 Weighted average number of ordinary shares ( in 000"s) 60,800 60,800 60,800 60,800
Rs Rs Rs RsBasic earnings per share 0.87 3.58 2.37 3.10
10.2 amount used as denominatorordinary shares at the beginning of the year ( in 000”s) 60,800 60,800 60,800 60,800 ordinary shares at the end of the year ( in 000”s) 60,800 60,800 60,800 60,800
For the Year ended 31st March 2016 2015Rs Rs. 000’s Rs Rs. 000’s
11. DiViDenD PeR sHaReEquity dividend on ordinary sharesDeclared and paid during the yearout of Dividends received - Free of tax 2.39 145,225 0.55 33,146 Out of Profits - Liable for tax 1.36 82,775 2.85 173,574 Total dividend 3.75 228,000 3.40 206,720
*Previous year’s final dividend paid in the current year.
12 FinanCiaL insTRuMenTs12.1 Financial assets and Liabilities by CategoriesFinancial assets and liabilities in the tables below are split into categories in accordance with LKas 39.
Group Loans and Receivables
available for sale Financial assets
Total
as at 31 st March 2016Rs. 000’s
2015Rs. 000’s
2016Rs. 000’s
2015Rs. 000’s
2016Rs. 000’s
2015Rs. 000’s
Financial Instruments in Non Current AssetsOther Non - Current Financial Assets 80,449 122,210 2,353,825 2,195,059 2,434,274 2,317,269
Financial Instruments in Current AssetsTrade & other Receivables 1,489,846 2,458,140 - - 1,489,846 2,458,140 amount Due from Related Parties 2,635 1,260 - - 2,635 1,260 Cash in Hand and at Bank 99,452 289,623 - - 99,452 289,623 short Term investments 246,256 378,114 - - 246,256 378,114 Total 1,918,638 3,249,347 2,353,825 2,195,059 4,272,463 5,444,406
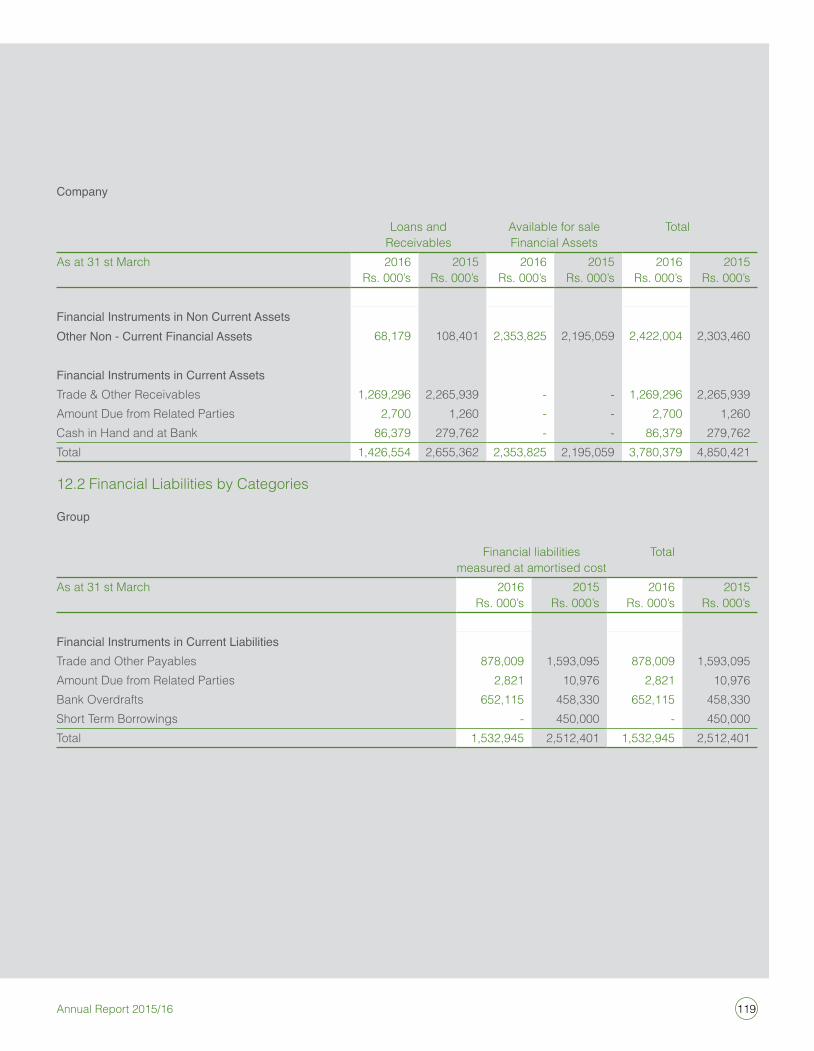
119Annual Report 2015/16
Company
Loans and Receivables
available for saleFinancial assets
Total
as at 31 st March 2016Rs. 000’s
2015Rs. 000’s
2016Rs. 000’s
2015Rs. 000’s
2016Rs. 000’s
2015Rs. 000’s
Financial Instruments in Non Current AssetsOther Non - Current Financial Assets 68,179 108,401 2,353,825 2,195,059 2,422,004 2,303,460
Financial Instruments in Current AssetsTrade & other Receivables 1,269,296 2,265,939 - - 1,269,296 2,265,939 amount Due from Related Parties 2,700 1,260 - - 2,700 1,260 Cash in Hand and at Bank 86,379 279,762 - - 86,379 279,762 Total 1,426,554 2,655,362 2,353,825 2,195,059 3,780,379 4,850,421
12.2 Financial Liabilities by Categories
Group
Financial liabilities measured at amortised cost
Total
as at 31 st March 2016Rs. 000’s
2015Rs. 000’s
2016Rs. 000’s
2015Rs. 000’s
Financial Instruments in Current LiabilitiesTrade and other Payables 878,009 1,593,095 878,009 1,593,095 amount Due from Related Parties 2,821 10,976 2,821 10,976 Bank overdrafts 652,115 458,330 652,115 458,330 short Term Borrowings - 450,000 - 450,000 Total 1,532,945 2,512,401 1,532,945 2,512,401
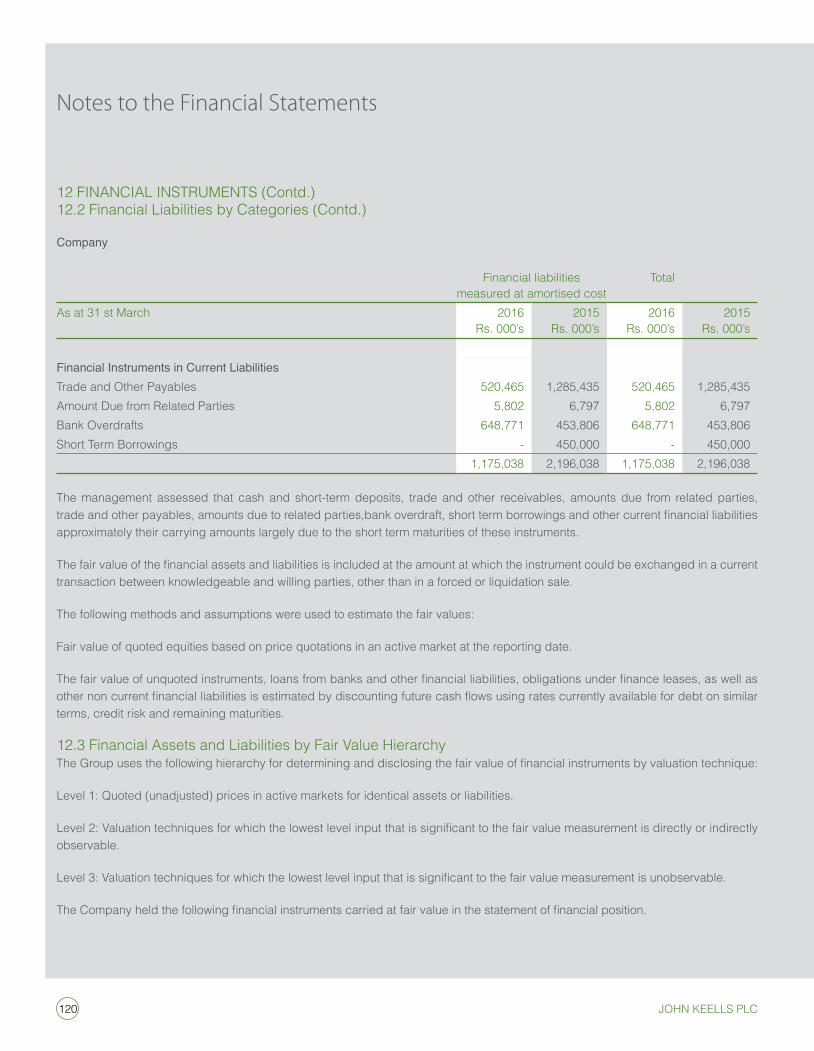
120 John Keells PlC
12 FinanCiaL insTRuMenTs (Contd.)12.2 Financial Liabilities by Categories (Contd.)
Company
Financial liabilities measured at amortised cost
Total
as at 31 st March 2016Rs. 000’s
2015Rs. 000’s
2016Rs. 000’s
2015Rs. 000’s
Financial Instruments in Current LiabilitiesTrade and other Payables 520,465 1,285,435 520,465 1,285,435 amount Due from Related Parties 5,802 6,797 5,802 6,797 Bank overdrafts 648,771 453,806 648,771 453,806 short Term Borrowings - 450,000 - 450,000
1,175,038 2,196,038 1,175,038 2,196,038
The management assessed that cash and short-term deposits, trade and other receivables, amounts due from related parties, trade and other payables, amounts due to related parties,bank overdraft, short term borrowings and other current financial liabilities approximately their carrying amounts largely due to the short term maturities of these instruments.
The fair value of the financial assets and liabilities is included at the amount at which the instrument could be exchanged in a current transaction between knowledgeable and willing parties, other than in a forced or liquidation sale.
The following methods and assumptions were used to estimate the fair values:
Fair value of quoted equities based on price quotations in an active market at the reporting date.
The fair value of unquoted instruments, loans from banks and other financial liabilities, obligations under finance leases, as well as other non current financial liabilities is estimated by discounting future cash flows using rates currently available for debt on similar terms, credit risk and remaining maturities.
12.3 Financial assets and Liabilities by Fair Value HierarchyThe Group uses the following hierarchy for determining and disclosing the fair value of financial instruments by valuation technique:
Level 1: Quoted (unadjusted) prices in active markets for identical assets or liabilities.
Level 2: Valuation techniques for which the lowest level input that is significant to the fair value measurement is directly or indirectly observable.
Level 3: Valuation techniques for which the lowest level input that is significant to the fair value measurement is unobservable.
The Company held the following financial instruments carried at fair value in the statement of financial position.
Notes to the Financial Statements
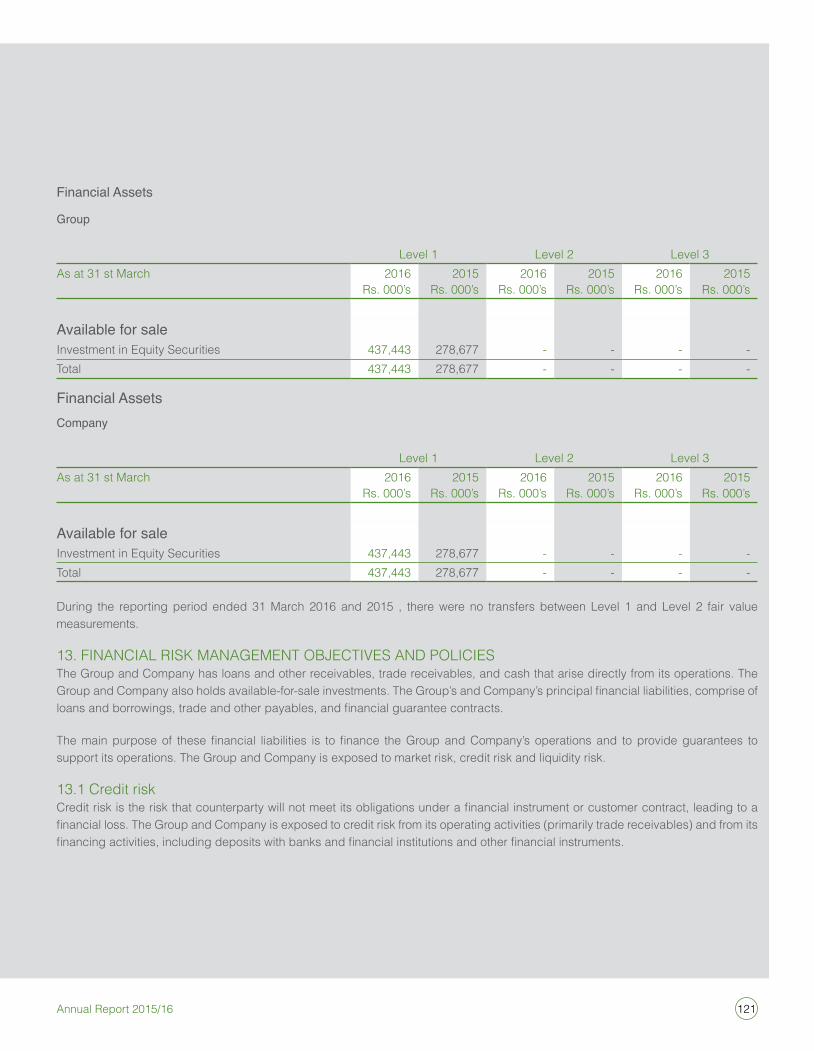
121Annual Report 2015/16
Financial Assets
Group
Level 1 Level 2 Level 3as at 31 st March 2016
Rs. 000’s2015
Rs. 000’s2016
Rs. 000’s2015
Rs. 000’s2016
Rs. 000’s2015
Rs. 000’s
Available for saleinvestment in equity securities 437,443 278,677 - - - -Total 437,443 278,677 - - - -
Financial AssetsCompany
Level 1 Level 2 Level 3as at 31 st March 2016
Rs. 000’s2015
Rs. 000’s2016
Rs. 000’s2015
Rs. 000’s2016
Rs. 000’s2015
Rs. 000’s
Available for saleinvestment in equity securities 437,443 278,677 - - - -Total 437,443 278,677 - - - -
During the reporting period ended 31 March 2016 and 2015 , there were no transfers between Level 1 and Level 2 fair value measurements.
13. FinanCiaL RisK ManaGeMenT oBJeCTiVes anD PoLiCiesThe Group and Company has loans and other receivables, trade receivables, and cash that arise directly from its operations. The Group and Company also holds available-for-sale investments. The Group’s and Company’s principal financial liabilities, comprise of loans and borrowings, trade and other payables, and financial guarantee contracts.
The main purpose of these financial liabilities is to finance the Group and Company’s operations and to provide guarantees to support its operations. The Group and Company is exposed to market risk, credit risk and liquidity risk.
13.1 Credit riskCredit risk is the risk that counterparty will not meet its obligations under a financial instrument or customer contract, leading to a financial loss. The Group and Company is exposed to credit risk from its operating activities (primarily trade receivables) and from its financing activities, including deposits with banks and financial institutions and other financial instruments.
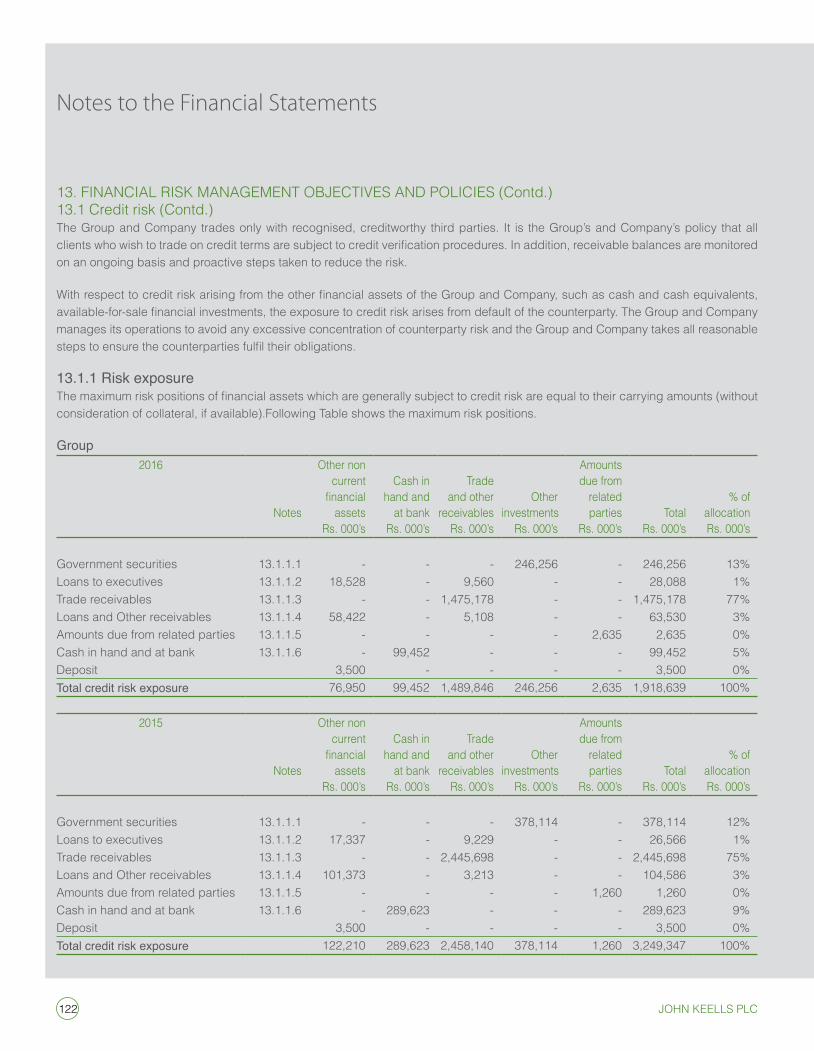
122 John Keells PlC
13. FinanCiaL RisK ManaGeMenT oBJeCTiVes anD PoLiCies (Contd.)13.1 Credit risk (Contd.)The Group and Company trades only with recognised, creditworthy third parties. it is the Group’s and Company’s policy that all clients who wish to trade on credit terms are subject to credit verification procedures. In addition, receivable balances are monitored on an ongoing basis and proactive steps taken to reduce the risk.
With respect to credit risk arising from the other financial assets of the Group and Company, such as cash and cash equivalents, available-for-sale financial investments, the exposure to credit risk arises from default of the counterparty. The Group and Company manages its operations to avoid any excessive concentration of counterparty risk and the Group and Company takes all reasonable steps to ensure the counterparties fulfil their obligations.
13.1.1 Risk exposureThe maximum risk positions of financial assets which are generally subject to credit risk are equal to their carrying amounts (without consideration of collateral, if available).Following Table shows the maximum risk positions.
Group2016
notes
other noncurrent
financialassets
Rs. 000’s
Cash inhand and
at bankRs. 000’s
Tradeand other
receivablesRs. 000’s
otherinvestments
Rs. 000’s
amountsdue from
relatedparties
Rs. 000’sTotal
Rs. 000’s
% ofallocationRs. 000’s
Government securities 13.1.1.1 - - - 246,256 - 246,256 13%Loans to executives 13.1.1.2 18,528 - 9,560 - - 28,088 1%Trade receivables 13.1.1.3 - - 1,475,178 - - 1,475,178 77%Loans and other receivables 13.1.1.4 58,422 - 5,108 - - 63,530 3%amounts due from related parties 13.1.1.5 - - - - 2,635 2,635 0%Cash in hand and at bank 13.1.1.6 - 99,452 - - - 99,452 5%Deposit 3,500 - - - - 3,500 0%Total credit risk exposure 76,950 99,452 1,489,846 246,256 2,635 1,918,639 100%
2015
notes
other noncurrent
financialassets
Rs. 000’s
Cash inhand and
at bankRs. 000’s
Tradeand other
receivablesRs. 000’s
otherinvestments
Rs. 000’s
amountsdue from
relatedparties
Rs. 000’sTotal
Rs. 000’s
% ofallocationRs. 000’s
Government securities 13.1.1.1 - - - 378,114 - 378,114 12%Loans to executives 13.1.1.2 17,337 - 9,229 - - 26,566 1%Trade receivables 13.1.1.3 - - 2,445,698 - - 2,445,698 75%Loans and other receivables 13.1.1.4 101,373 - 3,213 - - 104,586 3%amounts due from related parties 13.1.1.5 - - - - 1,260 1,260 0%Cash in hand and at bank 13.1.1.6 - 289,623 - - - 289,623 9%Deposit 3,500 - - - - 3,500 0%Total credit risk exposure 122,210 289,623 2,458,140 378,114 1,260 3,249,347 100%
Notes to the Financial Statements
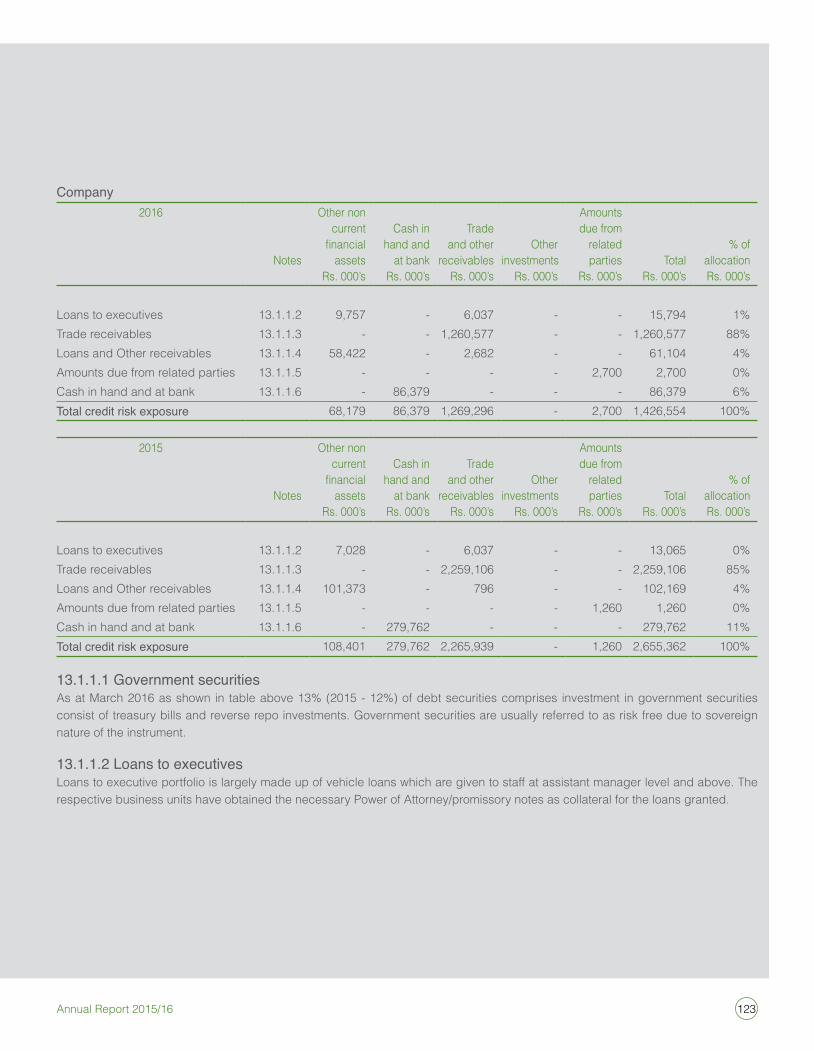
123Annual Report 2015/16
Company2016
notes
other noncurrent
financialassets
Rs. 000’s
Cash inhand and
at bankRs. 000’s
Tradeand other
receivablesRs. 000’s
otherinvestments
Rs. 000’s
amountsdue from
relatedparties
Rs. 000’sTotal
Rs. 000’s
% ofallocationRs. 000’s
Loans to executives 13.1.1.2 9,757 - 6,037 - - 15,794 1%Trade receivables 13.1.1.3 - - 1,260,577 - - 1,260,577 88%Loans and other receivables 13.1.1.4 58,422 - 2,682 - - 61,104 4%amounts due from related parties 13.1.1.5 - - - - 2,700 2,700 0%Cash in hand and at bank 13.1.1.6 - 86,379 - - - 86,379 6%Total credit risk exposure 68,179 86,379 1,269,296 - 2,700 1,426,554 100%
2015
notes
other noncurrent
financialassets
Rs. 000’s
Cash inhand and
at bankRs. 000’s
Tradeand other
receivablesRs. 000’s
otherinvestments
Rs. 000’s
amountsdue from
relatedparties
Rs. 000’sTotal
Rs. 000’s
% ofallocationRs. 000’s
Loans to executives 13.1.1.2 7,028 - 6,037 - - 13,065 0%Trade receivables 13.1.1.3 - - 2,259,106 - - 2,259,106 85%Loans and other receivables 13.1.1.4 101,373 - 796 - - 102,169 4%amounts due from related parties 13.1.1.5 - - - - 1,260 1,260 0%Cash in hand and at bank 13.1.1.6 - 279,762 - - - 279,762 11%Total credit risk exposure 108,401 279,762 2,265,939 - 1,260 2,655,362 100%
13.1.1.1 Government securitiesas at March 2016 as shown in table above 13% (2015 - 12%) of debt securities comprises investment in government securities consist of treasury bills and reverse repo investments. Government securities are usually referred to as risk free due to sovereign nature of the instrument.
13.1.1.2 Loans to executivesLoans to executive portfolio is largely made up of vehicle loans which are given to staff at assistant manager level and above. The respective business units have obtained the necessary Power of attorney/promissory notes as collateral for the loans granted.
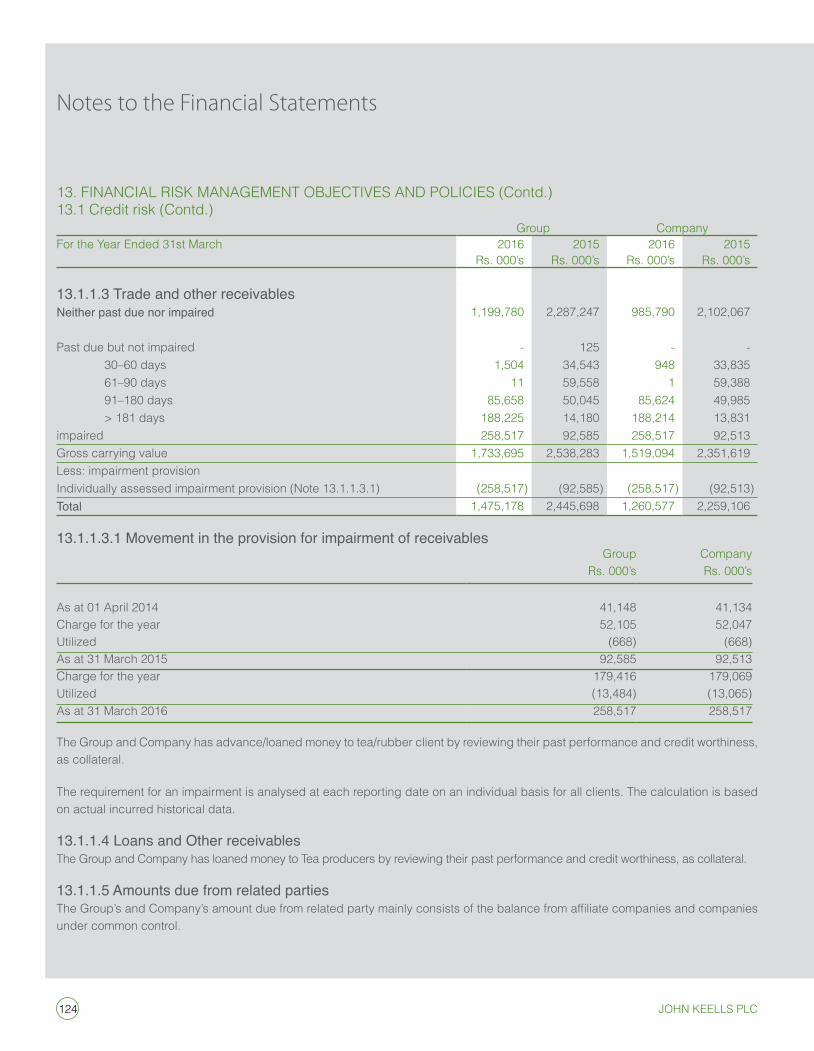
124 John Keells PlC
13. FinanCiaL RisK ManaGeMenT oBJeCTiVes anD PoLiCies (Contd.)13.1 Credit risk (Contd.)
Group CompanyFor the Year ended 31st March 2016
Rs. 000’s2015
Rs. 000’s2016
Rs. 000’s2015
Rs. 000’s
13.1.1.3 Trade and other receivablesNeither past due nor impaired 1,199,780 2,287,247 985,790 2,102,067
Past due but not impaired - 125 - - 30–60 days 1,504 34,543 948 33,835 61–90 days 11 59,558 1 59,388 91–180 days 85,658 50,045 85,624 49,985 > 181 days 188,225 14,180 188,214 13,831 impaired 258,517 92,585 258,517 92,513 Gross carrying value 1,733,695 2,538,283 1,519,094 2,351,619 Less: impairment provision individually assessed impairment provision (note 13.1.1.3.1) (258,517) (92,585) (258,517) (92,513)Total 1,475,178 2,445,698 1,260,577 2,259,106
13.1.1.3.1 Movement in the provision for impairment of receivables Group Company
Rs. 000’s Rs. 000’s
as at 01 april 2014 41,148 41,134 Charge for the year 52,105 52,047 utilized (668) (668)as at 31 March 2015 92,585 92,513 Charge for the year 179,416 179,069 utilized (13,484) (13,065)as at 31 March 2016 258,517 258,517
The Group and Company has advance/loaned money to tea/rubber client by reviewing their past performance and credit worthiness, as collateral.
The requirement for an impairment is analysed at each reporting date on an individual basis for all clients. The calculation is based on actual incurred historical data.
13.1.1.4 Loans and Other receivablesThe Group and Company has loaned money to Tea producers by reviewing their past performance and credit worthiness, as collateral.
13.1.1.5 Amounts due from related partiesThe Group’s and Company’s amount due from related party mainly consists of the balance from affiliate companies and companies under common control.
Notes to the Financial Statements
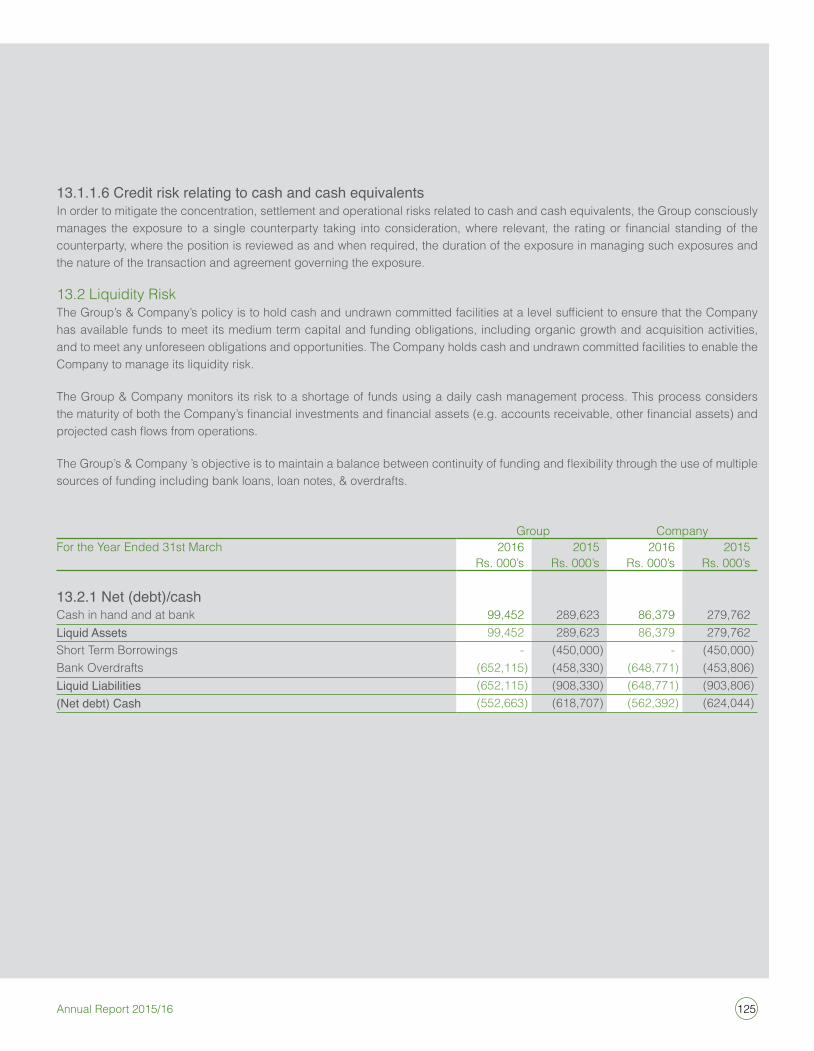
125Annual Report 2015/16
13.1.1.6 Credit risk relating to cash and cash equivalentsin order to mitigate the concentration, settlement and operational risks related to cash and cash equivalents, the Group consciously manages the exposure to a single counterparty taking into consideration, where relevant, the rating or financial standing of the counterparty, where the position is reviewed as and when required, the duration of the exposure in managing such exposures and the nature of the transaction and agreement governing the exposure.
13.2 Liquidity RiskThe Group’s & Company’s policy is to hold cash and undrawn committed facilities at a level sufficient to ensure that the Company has available funds to meet its medium term capital and funding obligations, including organic growth and acquisition activities, and to meet any unforeseen obligations and opportunities. The Company holds cash and undrawn committed facilities to enable the Company to manage its liquidity risk.
The Group & Company monitors its risk to a shortage of funds using a daily cash management process. This process considers the maturity of both the Company’s financial investments and financial assets (e.g. accounts receivable, other financial assets) and projected cash flows from operations.
The Group’s & Company ’s objective is to maintain a balance between continuity of funding and flexibility through the use of multiple sources of funding including bank loans, loan notes, & overdrafts.
Group CompanyFor the Year ended 31st March 2016
Rs. 000’s2015
Rs. 000’s2016
Rs. 000’s2015
Rs. 000’s
13.2.1 Net (debt)/cashCash in hand and at bank 99,452 289,623 86,379 279,762 Liquid Assets 99,452 289,623 86,379 279,762 short Term Borrowings - (450,000) - (450,000)Bank overdrafts (652,115) (458,330) (648,771) (453,806)Liquid Liabilities (652,115) (908,330) (648,771) (903,806)(Net debt) Cash (552,663) (618,707) (562,392) (624,044)
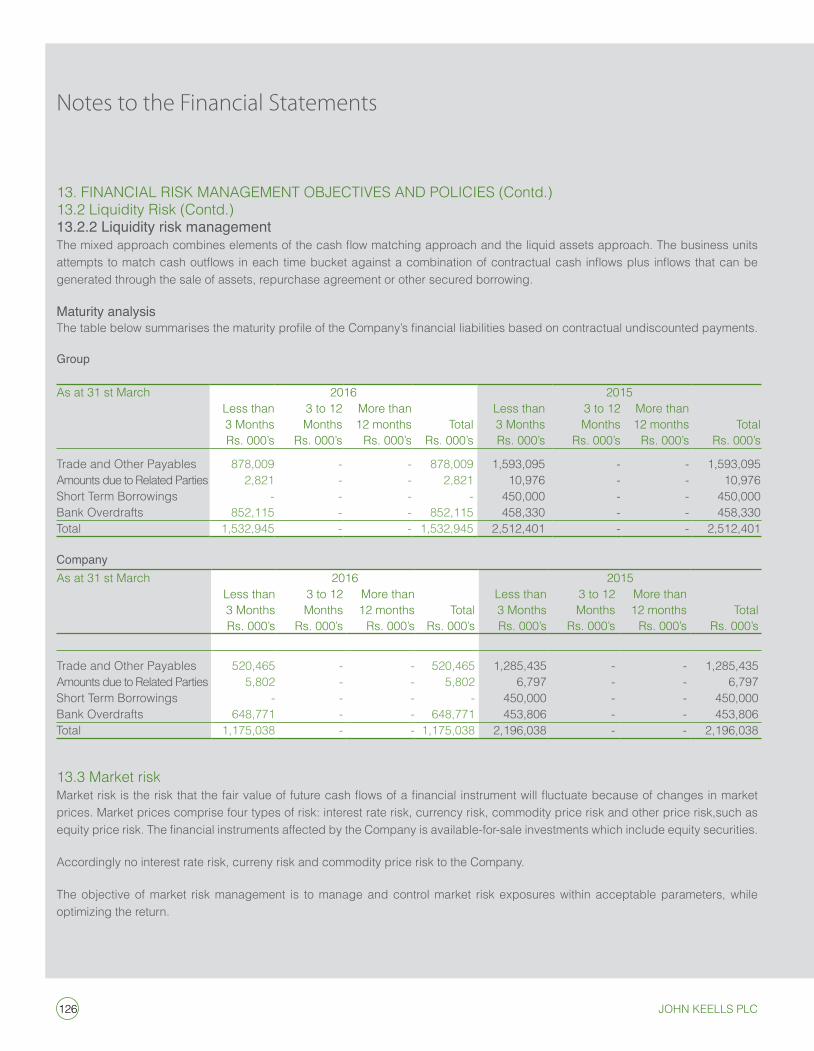
126 John Keells PlC
13. FinanCiaL RisK ManaGeMenT oBJeCTiVes anD PoLiCies (Contd.)13.2 Liquidity Risk (Contd.)13.2.2 Liquidity risk managementThe mixed approach combines elements of the cash flow matching approach and the liquid assets approach. The business units attempts to match cash outflows in each time bucket against a combination of contractual cash inflows plus inflows that can be generated through the sale of assets, repurchase agreement or other secured borrowing.
Maturity analysisThe table below summarises the maturity profile of the Company’s financial liabilities based on contractual undiscounted payments.
Group
as at 31 st March 2016 2015Less than3 MonthsRs. 000’s
3 to 12 Months
Rs. 000’s
More than12 months
Rs. 000’sTotal
Rs. 000’s
Less than3 MonthsRs. 000’s
3 to 12 Months
Rs. 000’s
More than12 months
Rs. 000’sTotal
Rs. 000’s
Trade and other Payables 878,009 - - 878,009 1,593,095 - - 1,593,095 amounts due to Related Parties 2,821 - - 2,821 10,976 - - 10,976 short Term Borrowings - - - - 450,000 - - 450,000 Bank overdrafts 852,115 - - 852,115 458,330 - - 458,330 Total 1,532,945 - - 1,532,945 2,512,401 - - 2,512,401
Companyas at 31 st March 2016 2015
Less than3 MonthsRs. 000’s
3 to 12 Months
Rs. 000’s
More than12 months
Rs. 000’sTotal
Rs. 000’s
Less than3 MonthsRs. 000’s
3 to 12 Months
Rs. 000’s
More than12 months
Rs. 000’sTotal
Rs. 000’s
Trade and other Payables 520,465 - - 520,465 1,285,435 - - 1,285,435 amounts due to Related Parties 5,802 - - 5,802 6,797 - - 6,797 short Term Borrowings - - - - 450,000 - - 450,000 Bank overdrafts 648,771 - - 648,771 453,806 - - 453,806 Total 1,175,038 - - 1,175,038 2,196,038 - - 2,196,038
13.3 Market riskMarket risk is the risk that the fair value of future cash flows of a financial instrument will fluctuate because of changes in market prices. Market prices comprise four types of risk: interest rate risk, currency risk, commodity price risk and other price risk,such as equity price risk. The financial instruments affected by the Company is available-for-sale investments which include equity securities.
accordingly no interest rate risk, curreny risk and commodity price risk to the Company.
The objective of market risk management is to manage and control market risk exposures within acceptable parameters, while optimizing the return.
Notes to the Financial Statements
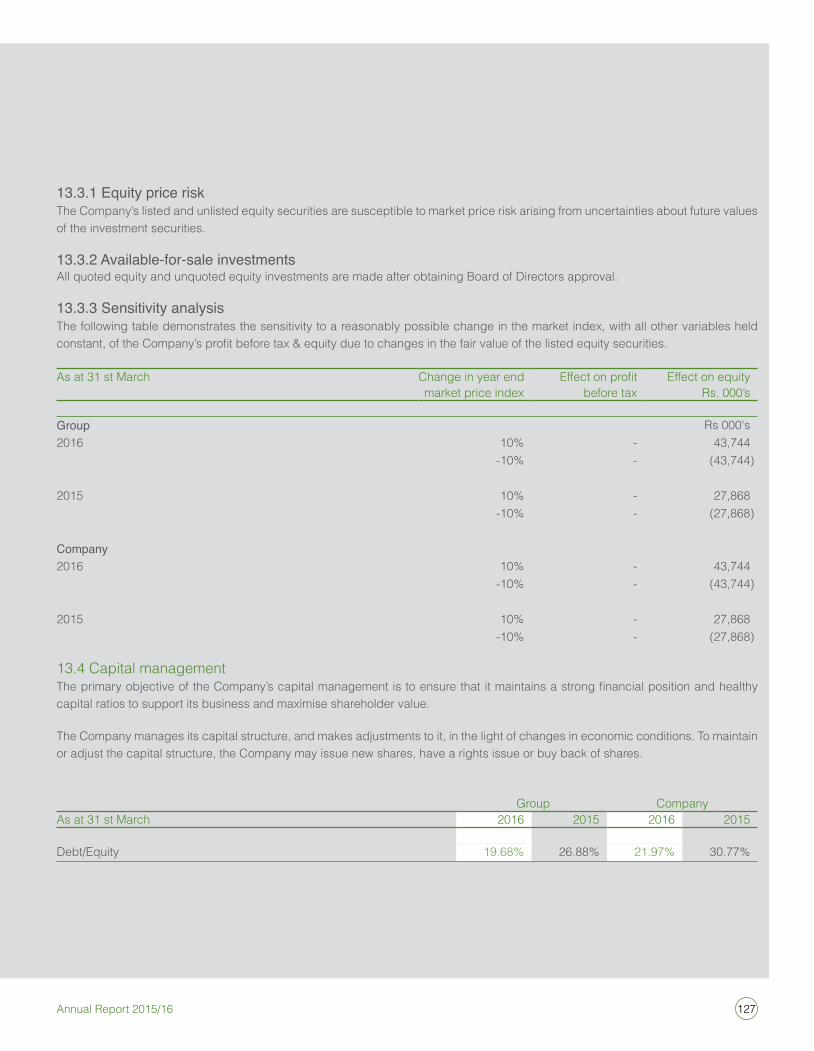
127Annual Report 2015/16
13.3.1 Equity price riskThe Company’s listed and unlisted equity securities are susceptible to market price risk arising from uncertainties about future values of the investment securities.
13.3.2 Available-for-sale investmentsall quoted equity and unquoted equity investments are made after obtaining Board of Directors approval.
13.3.3 Sensitivity analysisThe following table demonstrates the sensitivity to a reasonably possible change in the market index, with all other variables held constant, of the Company’s profit before tax & equity due to changes in the fair value of the listed equity securities.
as at 31 st March Change in year endmarket price index
Effect on profitbefore tax
effect on equityRs. 000’s
Group Rs 000's 2016 10% - 43,744
-10% - (43,744)
2015 10% - 27,868 -10% - (27,868)
Company2016 10% - 43,744
-10% - (43,744)
2015 10% - 27,868 -10% - (27,868)
13.4 Capital managementThe primary objective of the Company’s capital management is to ensure that it maintains a strong financial position and healthy capital ratios to support its business and maximise shareholder value.
The Company manages its capital structure, and makes adjustments to it, in the light of changes in economic conditions. To maintain or adjust the capital structure, the Company may issue new shares, have a rights issue or buy back of shares.
Group Companyas at 31 st March 2016 2015 2016 2015
Debt/equity 19.68% 26.88% 21.97% 30.77%
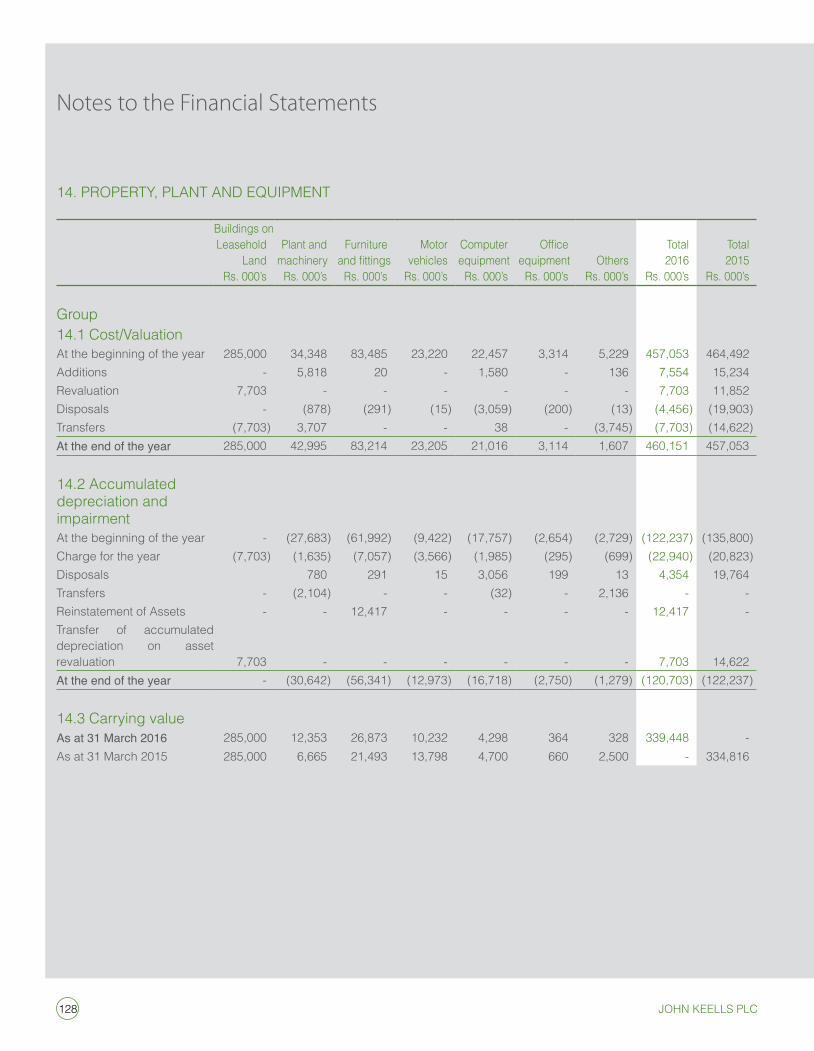
128 John Keells PlC
14. PRoPeRTY, PLanT anD eQuiPMenT
Buildings onLeasehold
LandRs. 000’s
Plant and machinery
Rs. 000’s
Furniture and fittings
Rs. 000’s
Motor vehicles Rs. 000’s
Computer equipment
Rs. 000’s
Office equipment
Rs. 000’s others
Rs. 000’s
Total 2016
Rs. 000’s
Total 2015
Rs. 000’s
Group14.1 Cost/Valuationat the beginning of the year 285,000 34,348 83,485 23,220 22,457 3,314 5,229 457,053 464,492 additions - 5,818 20 - 1,580 - 136 7,554 15,234 Revaluation 7,703 - - - - - - 7,703 11,852 Disposals - (878) (291) (15) (3,059) (200) (13) (4,456) (19,903)Transfers (7,703) 3,707 - - 38 - (3,745) (7,703) (14,622)At the end of the year 285,000 42,995 83,214 23,205 21,016 3,114 1,607 460,151 457,053
14.2 accumulated depreciation and impairment
at the beginning of the year - (27,683) (61,992) (9,422) (17,757) (2,654) (2,729) (122,237) (135,800)Charge for the year (7,703) (1,635) (7,057) (3,566) (1,985) (295) (699) (22,940) (20,823)Disposals 780 291 15 3,056 199 13 4,354 19,764 Transfers - (2,104) - - (32) - 2,136 - - Reinstatement of assets - - 12,417 - - - - 12,417 - Transfer of accumulated depreciation on asset revaluation 7,703 - - - - - - 7,703 14,622 At the end of the year - (30,642) (56,341) (12,973) (16,718) (2,750) (1,279) (120,703) (122,237)
14.3 Carrying valueAs at 31 March 2016 285,000 12,353 26,873 10,232 4,298 364 328 339,448 - as at 31 March 2015 285,000 6,665 21,493 13,798 4,700 660 2,500 - 334,816
Notes to the Financial Statements
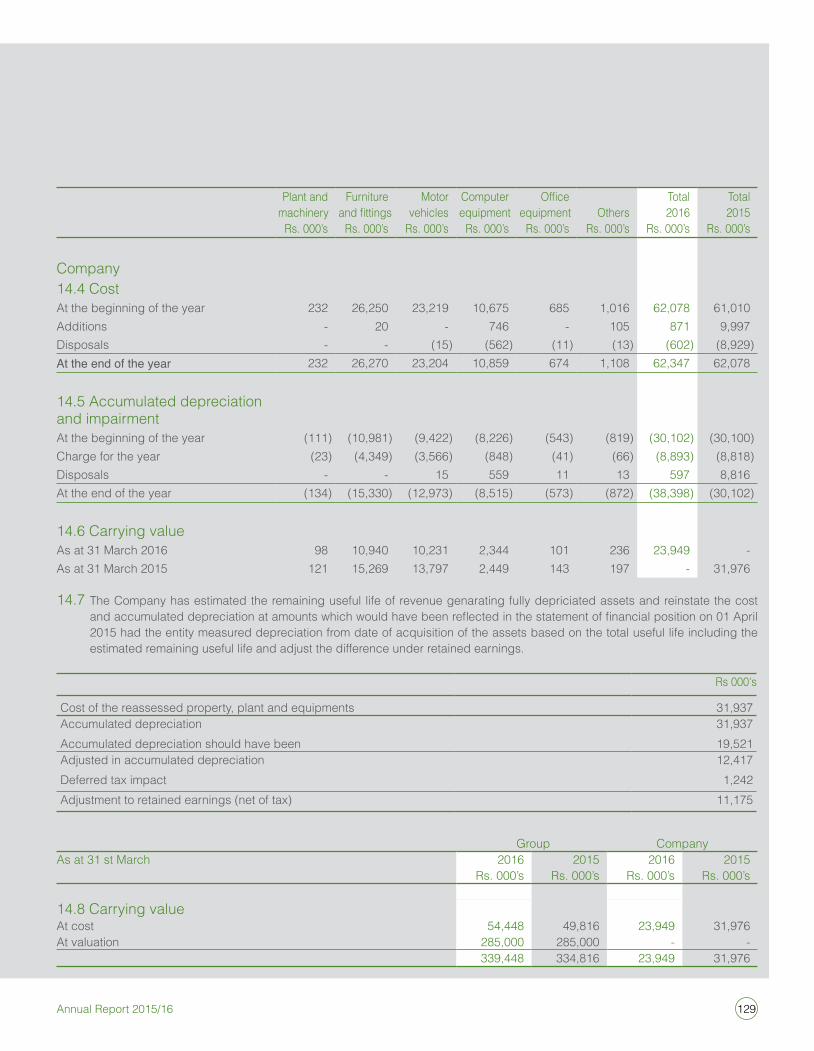
129Annual Report 2015/16
Plant and machinery
Rs. 000’s
Furniture and fittings
Rs. 000’s
Motor vehicles Rs. 000’s
Computer equipment
Rs. 000’s
Office equipment
Rs. 000’s others
Rs. 000’s
Total 2016
Rs. 000’s
Total 2015
Rs. 000’s
Company14.4 Costat the beginning of the year 232 26,250 23,219 10,675 685 1,016 62,078 61,010 additions - 20 - 746 - 105 871 9,997 Disposals - - (15) (562) (11) (13) (602) (8,929)At the end of the year 232 26,270 23,204 10,859 674 1,108 62,347 62,078
14.5 accumulated depreciation and impairmentat the beginning of the year (111) (10,981) (9,422) (8,226) (543) (819) (30,102) (30,100)Charge for the year (23) (4,349) (3,566) (848) (41) (66) (8,893) (8,818)Disposals - - 15 559 11 13 597 8,816 at the end of the year (134) (15,330) (12,973) (8,515) (573) (872) (38,398) (30,102)
14.6 Carrying valueas at 31 March 2016 98 10,940 10,231 2,344 101 236 23,949 - as at 31 March 2015 121 15,269 13,797 2,449 143 197 - 31,976
14.7 The Company has estimated the remaining useful life of revenue genarating fully depriciated assets and reinstate the cost and accumulated depreciation at amounts which would have been reflected in the statement of financial position on 01 April 2015 had the entity measured depreciation from date of acquisition of the assets based on the total useful life including the estimated remaining useful life and adjust the difference under retained earnings.
Rs 000's
Cost of the reassessed property, plant and equipments 31,937 accumulated depreciation 31,937 accumulated depreciation should have been 19,521 adjusted in accumulated depreciation 12,417 Deferred tax impact 1,242 adjustment to retained earnings (net of tax) 11,175
Group Companyas at 31 st March 2016
Rs. 000’s2015
Rs. 000’s2016
Rs. 000’s2015
Rs. 000’s
14.8 Carrying valueat cost 54,448 49,816 23,949 31,976 at valuation 285,000 285,000 - -
339,448 334,816 23,949 31,976
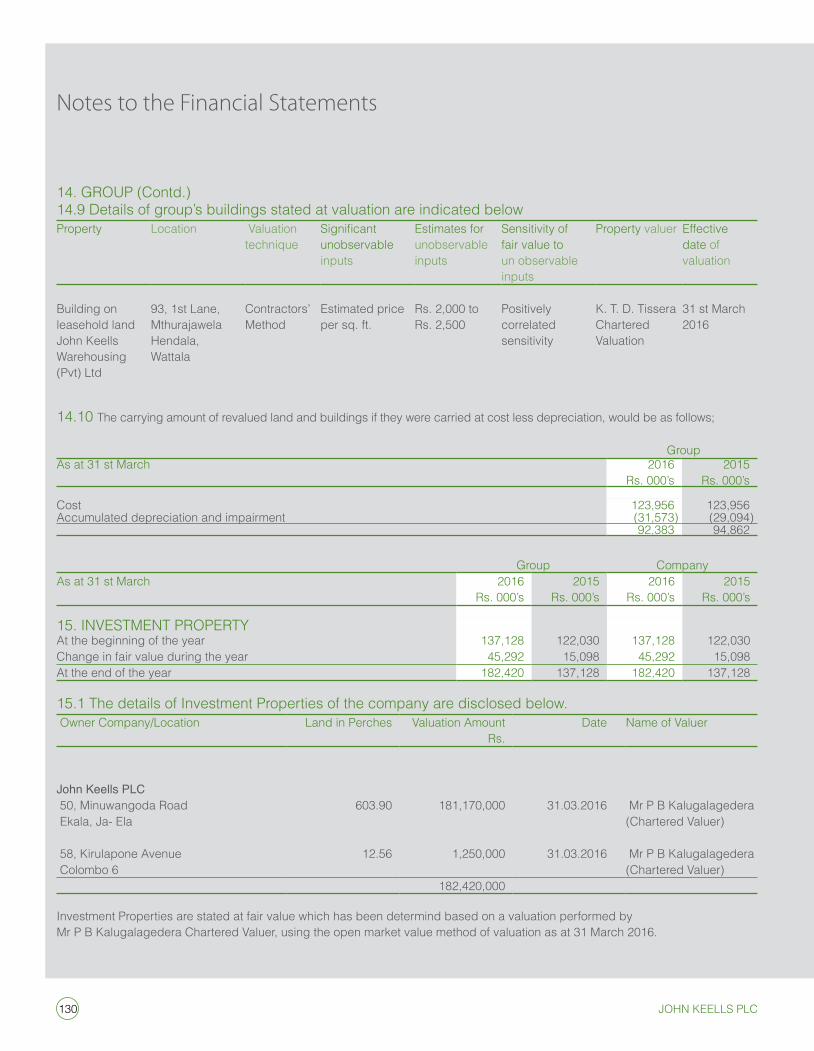
130 John Keells PlC
14.10 The carrying amount of revalued land and buildings if they were carried at cost less depreciation, would be as follows;
Group as at 31 st March 2016
Rs. 000’s2015
Rs. 000’s
Cost 123,956 123,956 accumulated depreciation and impairment (31,573) (29,094)
92,383 94,862
Group Companyas at 31 st March 2016
Rs. 000’s2015
Rs. 000’s2016
Rs. 000’s2015
Rs. 000’s
15. inVesTMenT PRoPeRTYat the beginning of the year 137,128 122,030 137,128 122,030 Change in fair value during the year 45,292 15,098 45,292 15,098 at the end of the year 182,420 137,128 182,420 137,128
15.1 The details of investment Properties of the company are disclosed below. owner Company/Location Land in Perches Valuation amount
Rs.Date name of Valuer
John Keells PLC 50, Minuwangoda Road 603.90 181,170,000 31.03.2016 Mr P B Kalugalagedera ekala, Ja- ela (Chartered Valuer)
58, Kirulapone avenue 12.56 1,250,000 31.03.2016 Mr P B Kalugalagedera Colombo 6 (Chartered Valuer)
182,420,000
investment Properties are stated at fair value which has been determind based on a valuation performed by Mr P B Kalugalagedera Chartered Valuer, using the open market value method of valuation as at 31 March 2016.
14. GRouP (Contd.)14.9 Details of group’s buildings stated at valuation are indicated below Property Location Valuation
techniqueSignificant unobservable inputs
estimates for unobservable inputs
sensitivity of fair value to un observable inputs
Property valuer effective date of valuation
Building on leasehold landJohn Keells Warehousing (Pvt) Ltd
93, 1st Lane, MthurajawelaHendala, Wattala
Contractors’Method
estimated priceper sq. ft.
Rs. 2,000 to Rs. 2,500
Positively correlated sensitivity
K. T. D. TisseraChartered Valuation
31 st March 2016
Notes to the Financial Statements
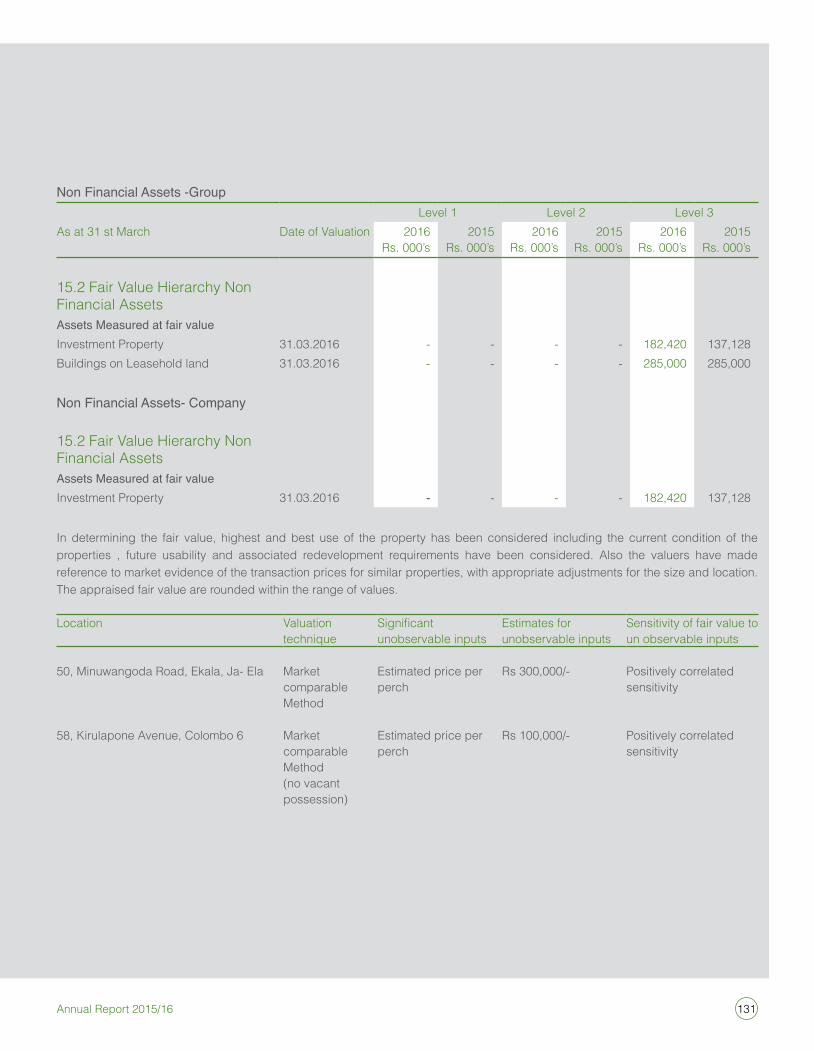
131Annual Report 2015/16
Non Financial Assets -GroupLevel 1 Level 2 Level 3
as at 31 st March Date of Valuation 2016Rs. 000’s
2015Rs. 000’s
2016Rs. 000’s
2015Rs. 000’s
2016Rs. 000’s
2015Rs. 000’s
15.2 Fair Value Hierarchy non Financial assetsAssets Measured at fair valueinvestment Property 31.03.2016 - - - - 182,420 137,128 Buildings on Leasehold land 31.03.2016 - - - - 285,000 285,000
Non Financial Assets- Company
15.2 Fair Value Hierarchy non Financial assetsAssets Measured at fair valueinvestment Property 31.03.2016 - - - - 182,420 137,128
in determining the fair value, highest and best use of the property has been considered including the current condition of the properties , future usability and associated redevelopment requirements have been considered. also the valuers have made reference to market evidence of the transaction prices for similar properties, with appropriate adjustments for the size and location. The appraised fair value are rounded within the range of values.
Location Valuation technique
Significant unobservable inputs
estimates for unobservable inputs
sensitivity of fair value to un observable inputs
50, Minuwangoda Road, ekala, Ja- ela Market
comparable Method
estimated price per perch
Rs 300,000/- Positively correlated sensitivity
58, Kirulapone avenue, Colombo 6 Market comparable Method (no vacant possession)
estimated price per perch
Rs 100,000/- Positively correlated sensitivity
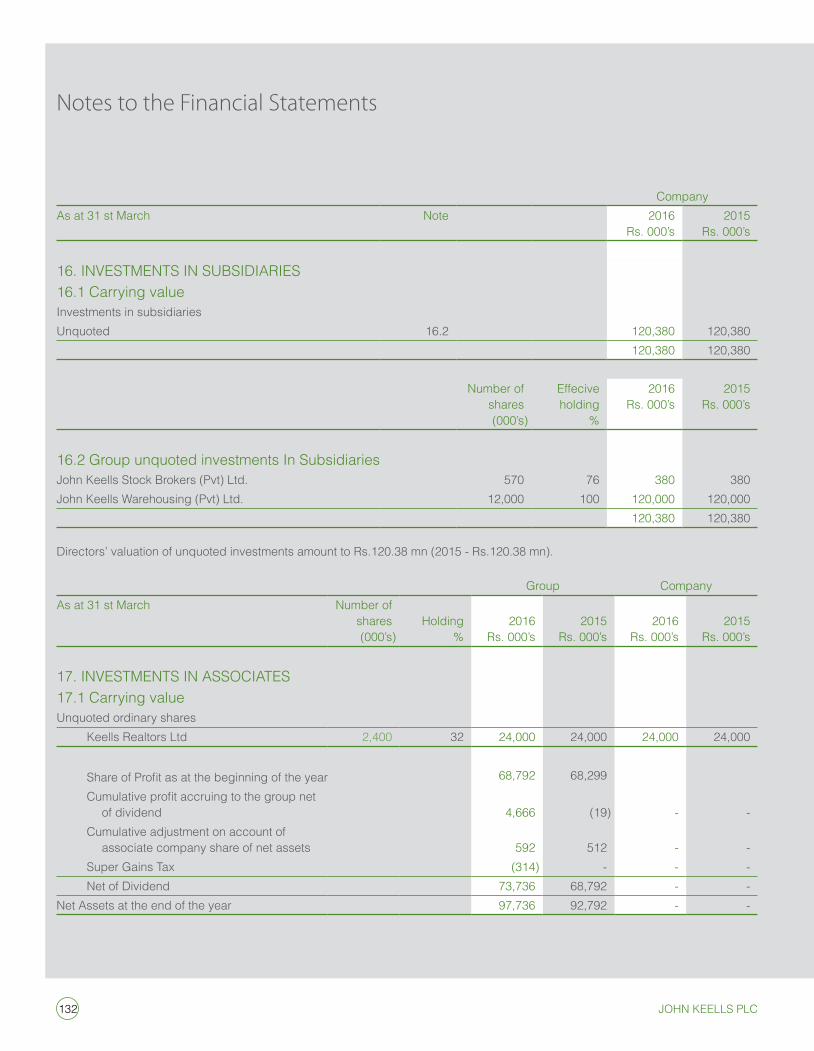
132 John Keells PlC
Companyas at 31 st March note 2016
Rs. 000’s2015
Rs. 000’s
16. inVesTMenTs in suBsiDiaRies 16.1 Carrying valueinvestments in subsidiariesunquoted 16.2 120,380 120,380
120,380 120,380
number ofshares(000’s)
effeciveholding
%
2016Rs. 000’s
2015Rs. 000’s
16.2 Group unquoted investments in subsidiariesJohn Keells stock Brokers (Pvt) Ltd. 570 76 380 380 John Keells Warehousing (Pvt) Ltd. 12,000 100 120,000 120,000
120,380 120,380
Directors’ valuation of unquoted investments amount to Rs.120.38 mn (2015 - Rs.120.38 mn).
Group Companyas at 31 st March number of
shares(000’s)
Holding%
2016Rs. 000’s
2015Rs. 000’s
2016Rs. 000’s
2015Rs. 000’s
17. inVesTMenTs in assoCiaTes17.1 Carrying valueunquoted ordinary shares Keells Realtors Ltd 2,400 32 24,000 24,000 24,000 24,000
Share of Profit as at the beginning of the year 68,792 68,299 Cumulative profit accruing to the group net
of dividend 4,666 (19) - - Cumulative adjustment on account of
associate company share of net assets 592 512 - - super Gains Tax (314) - - - net of Dividend 73,736 68,792 - - net assets at the end of the year 97,736 92,792 - -
Notes to the Financial Statements
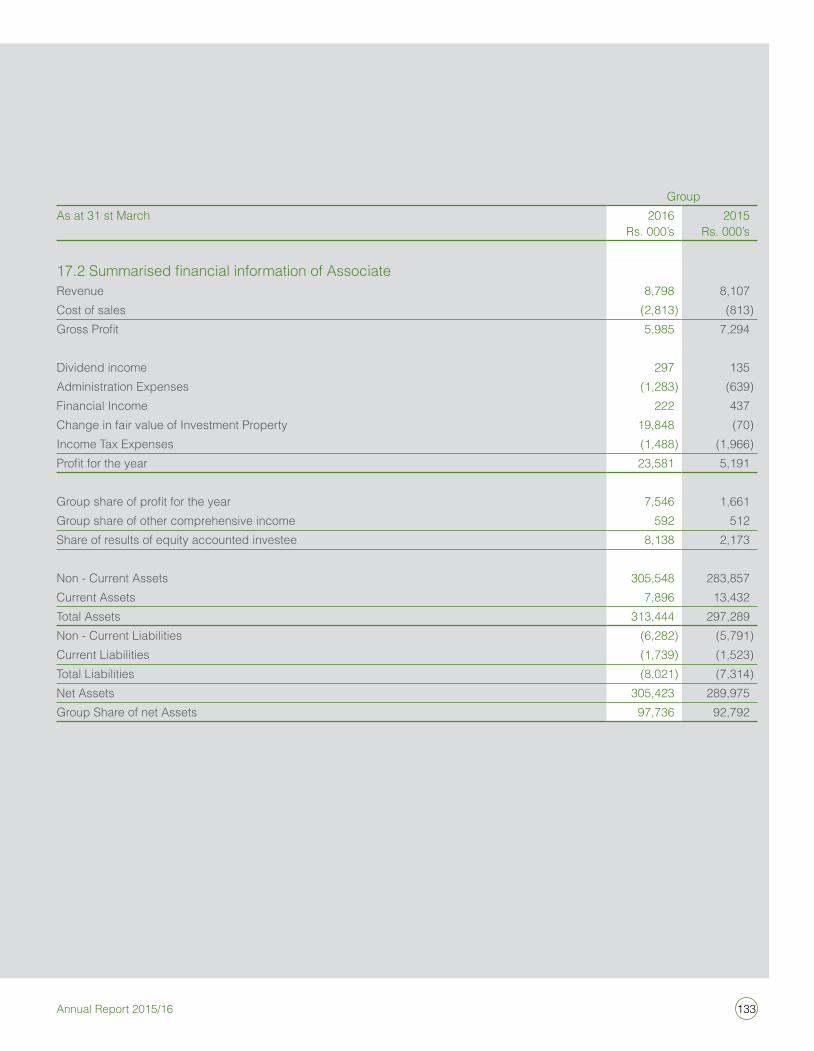
133Annual Report 2015/16
Group as at 31 st March 2016
Rs. 000’s2015
Rs. 000’s
17.2 Summarised financial information of AssociateRevenue 8,798 8,107 Cost of sales (2,813) (813)Gross Profit 5,985 7,294
Dividend income 297 135 administration expenses (1,283) (639)Financial income 222 437 Change in fair value of investment Property 19,848 (70)income Tax expenses (1,488) (1,966)Profit for the year 23,581 5,191
Group share of profit for the year 7,546 1,661 Group share of other comprehensive income 592 512 share of results of equity accounted investee 8,138 2,173
non - Current assets 305,548 283,857 Current assets 7,896 13,432 Total assets 313,444 297,289 non - Current Liabilities (6,282) (5,791)Current Liabilities (1,739) (1,523)Total Liabilities (8,021) (7,314)net assets 305,423 289,975 Group share of net assets 97,736 92,792
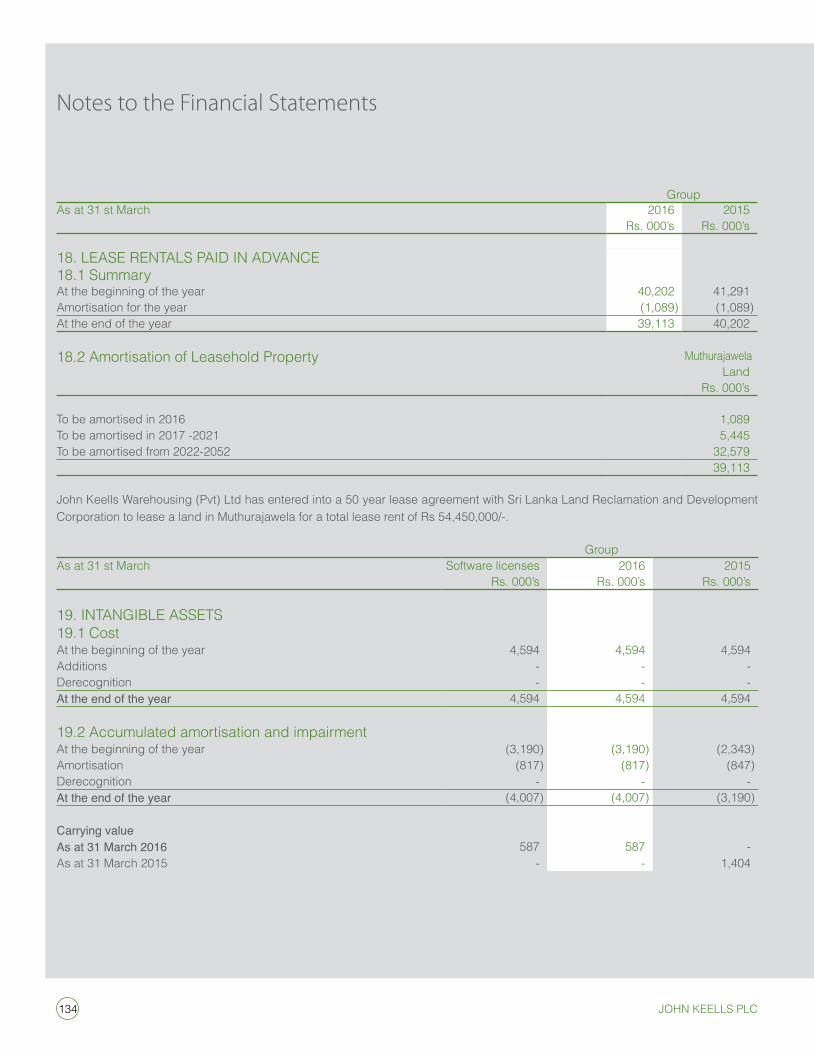
134 John Keells PlC
Group as at 31 st March 2016
Rs. 000’s2015
Rs. 000’s
18. Lease RenTaLs PaiD in aDVanCe18.1 summaryat the beginning of the year 40,202 41,291 amortisation for the year (1,089) (1,089)at the end of the year 39,113 40,202
18.2 amortisation of Leasehold Property MuthurajawelaLand
Rs. 000’s
To be amortised in 2016 1,089 To be amortised in 2017 -2021 5,445 To be amortised from 2022-2052 32,579
39,113
John Keells Warehousing (Pvt) Ltd has entered into a 50 year lease agreement with sri Lanka Land Reclamation and Development Corporation to lease a land in Muthurajawela for a total lease rent of Rs 54,450,000/-.
Group as at 31 st March software licenses
Rs. 000’s2016
Rs. 000’s2015
Rs. 000’s
19. inTanGiBLe asseTs19.1 Costat the beginning of the year 4,594 4,594 4,594 additions - - - Derecognition - - - At the end of the year 4,594 4,594 4,594
19.2 accumulated amortisation and impairmentat the beginning of the year (3,190) (3,190) (2,343)amortisation (817) (817) (847)Derecognition - - - At the end of the year (4,007) (4,007) (3,190)
Carrying valueAs at 31 March 2016 587 587 - as at 31 March 2015 - - 1,404
Notes to the Financial Statements
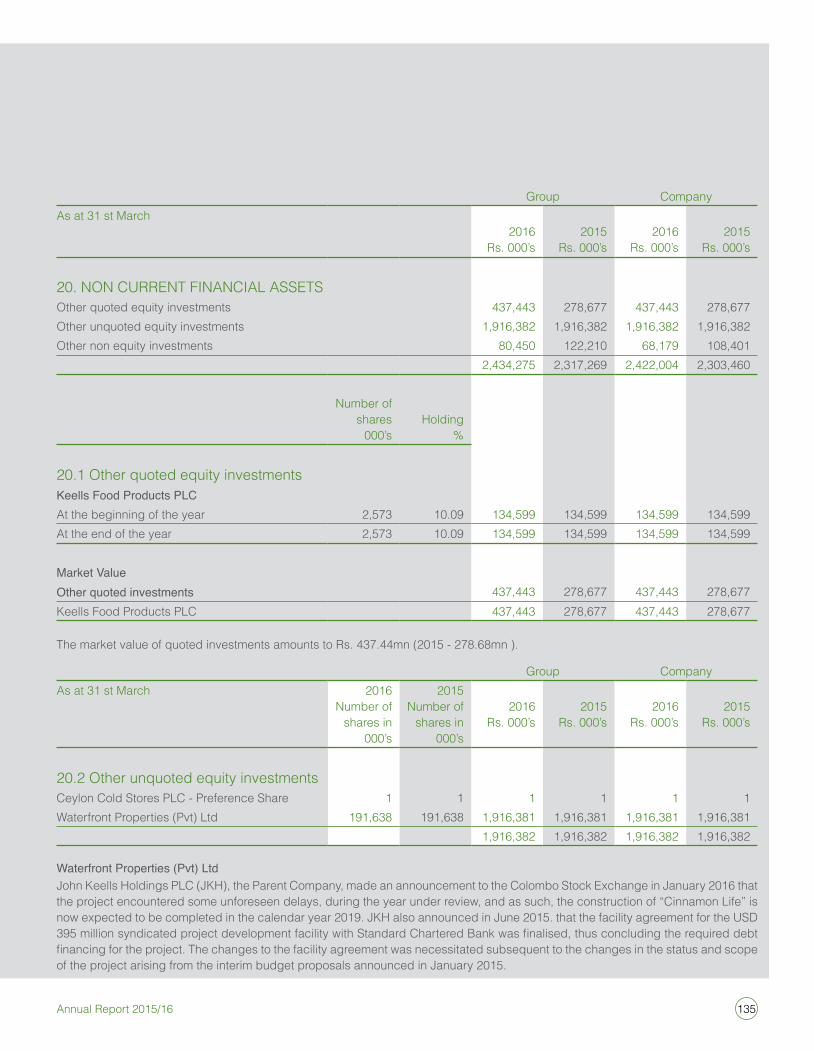
135Annual Report 2015/16
Group Companyas at 31 st March
2016Rs. 000’s
2015Rs. 000’s
2016Rs. 000’s
2015Rs. 000’s
20. non CuRRenT FinanCiaL asseTsother quoted equity investments 437,443 278,677 437,443 278,677 other unquoted equity investments 1,916,382 1,916,382 1,916,382 1,916,382 other non equity investments 80,450 122,210 68,179 108,401
2,434,275 2,317,269 2,422,004 2,303,460
number of shares
000’sHolding
%
20.1 other quoted equity investmentsKeells Food Products PLCat the beginning of the year 2,573 10.09 134,599 134,599 134,599 134,599 at the end of the year 2,573 10.09 134,599 134,599 134,599 134,599
Market ValueOther quoted investments 437,443 278,677 437,443 278,677 Keells Food Products PLC 437,443 278,677 437,443 278,677
The market value of quoted investments amounts to Rs. 437.44mn (2015 - 278.68mn ).
Group Companyas at 31 st March 2016
number ofshares in
000’s
2015number of
shares in 000’s
2016Rs. 000’s
2015Rs. 000’s
2016Rs. 000’s
2015Rs. 000’s
20.2 other unquoted equity investmentsCeylon Cold stores PLC - Preference share 1 1 1 1 1 1 Waterfront Properties (Pvt) Ltd 191,638 191,638 1,916,381 1,916,381 1,916,381 1,916,381
1,916,382 1,916,382 1,916,382 1,916,382
Waterfront Properties (Pvt) LtdJohn Keells Holdings PLC (JKH), the Parent Company, made an announcement to the Colombo stock exchange in January 2016 that the project encountered some unforeseen delays, during the year under review, and as such, the construction of “Cinnamon Life” is now expected to be completed in the calendar year 2019. JKH also announced in June 2015. that the facility agreement for the usD 395 million syndicated project development facility with Standard Chartered Bank was finalised, thus concluding the required debt financing for the project. The changes to the facility agreement was necessitated subsequent to the changes in the status and scope of the project arising from the interim budget proposals announced in January 2015.
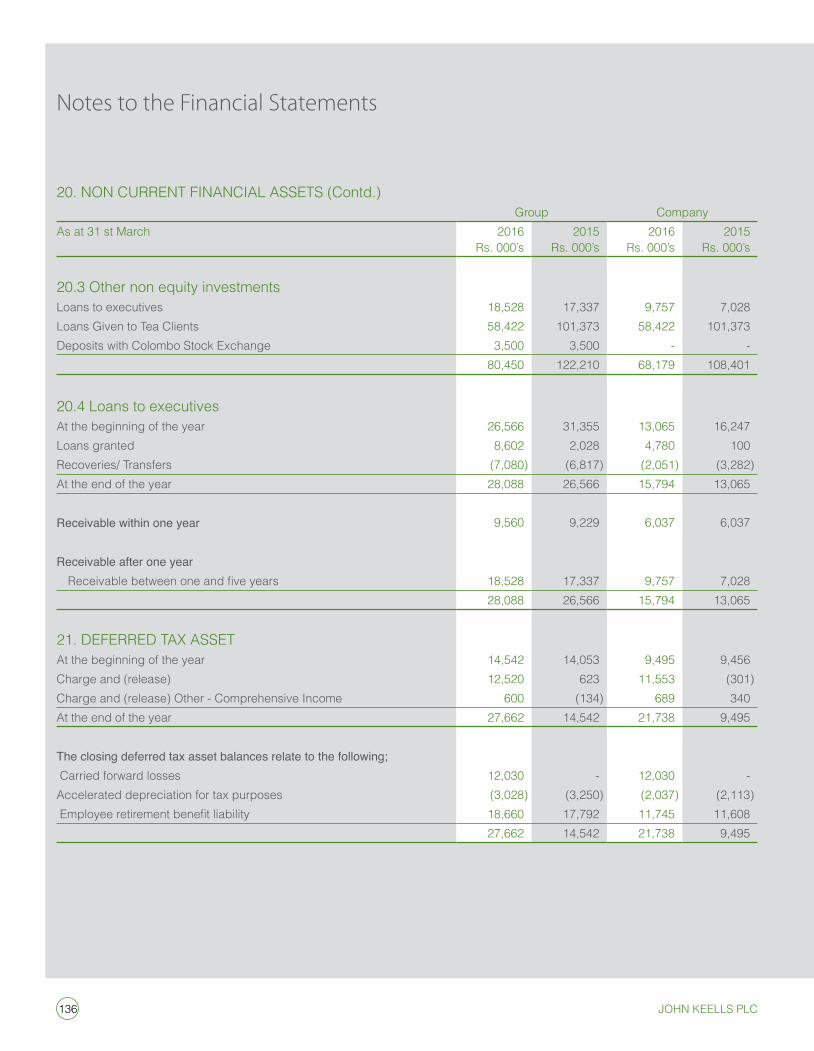
136 John Keells PlC
20. non CuRRenT FinanCiaL asseTs (Contd.)Group Company
as at 31 st March 2016Rs. 000’s
2015Rs. 000’s
2016Rs. 000’s
2015Rs. 000’s
20.3 other non equity investmentsLoans to executives 18,528 17,337 9,757 7,028 Loans Given to Tea Clients 58,422 101,373 58,422 101,373 Deposits with Colombo stock exchange 3,500 3,500 - -
80,450 122,210 68,179 108,401
20.4 Loans to executivesat the beginning of the year 26,566 31,355 13,065 16,247 Loans granted 8,602 2,028 4,780 100 Recoveries/ Transfers (7,080) (6,817) (2,051) (3,282)at the end of the year 28,088 26,566 15,794 13,065
Receivable within one year 9,560 9,229 6,037 6,037
Receivable after one year Receivable between one and five years 18,528 17,337 9,757 7,028
28,088 26,566 15,794 13,065
21. DeFeRReD Tax asseTat the beginning of the year 14,542 14,053 9,495 9,456 Charge and (release) 12,520 623 11,553 (301)Charge and (release) other - Comprehensive income 600 (134) 689 340 at the end of the year 27,662 14,542 21,738 9,495
The closing deferred tax asset balances relate to the following; Carried forward losses 12,030 - 12,030 -accelerated depreciation for tax purposes (3,028) (3,250) (2,037) (2,113) Employee retirement benefit liability 18,660 17,792 11,745 11,608
27,662 14,542 21,738 9,495
Notes to the Financial Statements
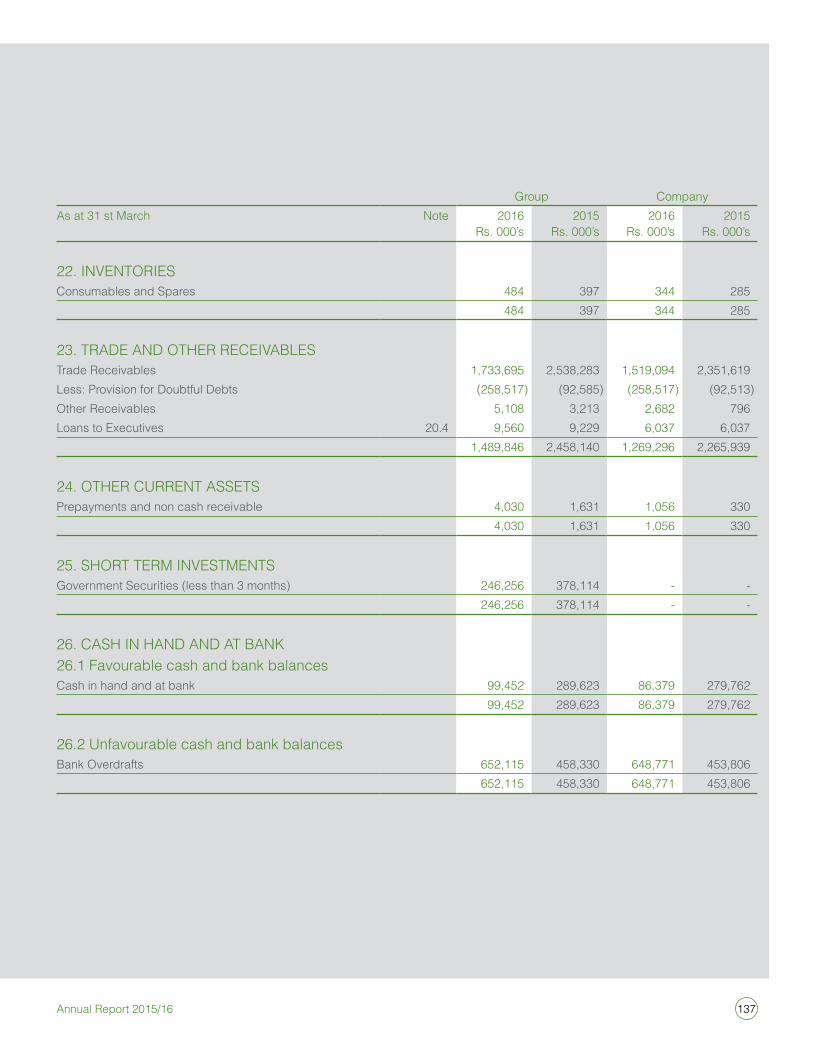
137Annual Report 2015/16
Group Companyas at 31 st March note 2016
Rs. 000’s2015
Rs. 000’s2016
Rs. 000’s2015
Rs. 000’s
22. inVenToRiesConsumables and spares 484 397 344 285
484 397 344 285
23. TRaDe anD oTHeR ReCeiVaBLesTrade Receivables 1,733,695 2,538,283 1,519,094 2,351,619 Less: Provision for Doubtful Debts (258,517) (92,585) (258,517) (92,513)other Receivables 5,108 3,213 2,682 796 Loans to executives 20.4 9,560 9,229 6,037 6,037
1,489,846 2,458,140 1,269,296 2,265,939
24. oTHeR CuRRenT asseTsPrepayments and non cash receivable 4,030 1,631 1,056 330
4,030 1,631 1,056 330
25. sHoRT TeRM inVesTMenTsGovernment securities (less than 3 months) 246,256 378,114 - -
246,256 378,114 - -
26. CasH in HanD anD aT BanK26.1 Favourable cash and bank balancesCash in hand and at bank 99,452 289,623 86,379 279,762
99,452 289,623 86,379 279,762
26.2 unfavourable cash and bank balancesBank overdrafts 652,115 458,330 648,771 453,806
652,115 458,330 648,771 453,806
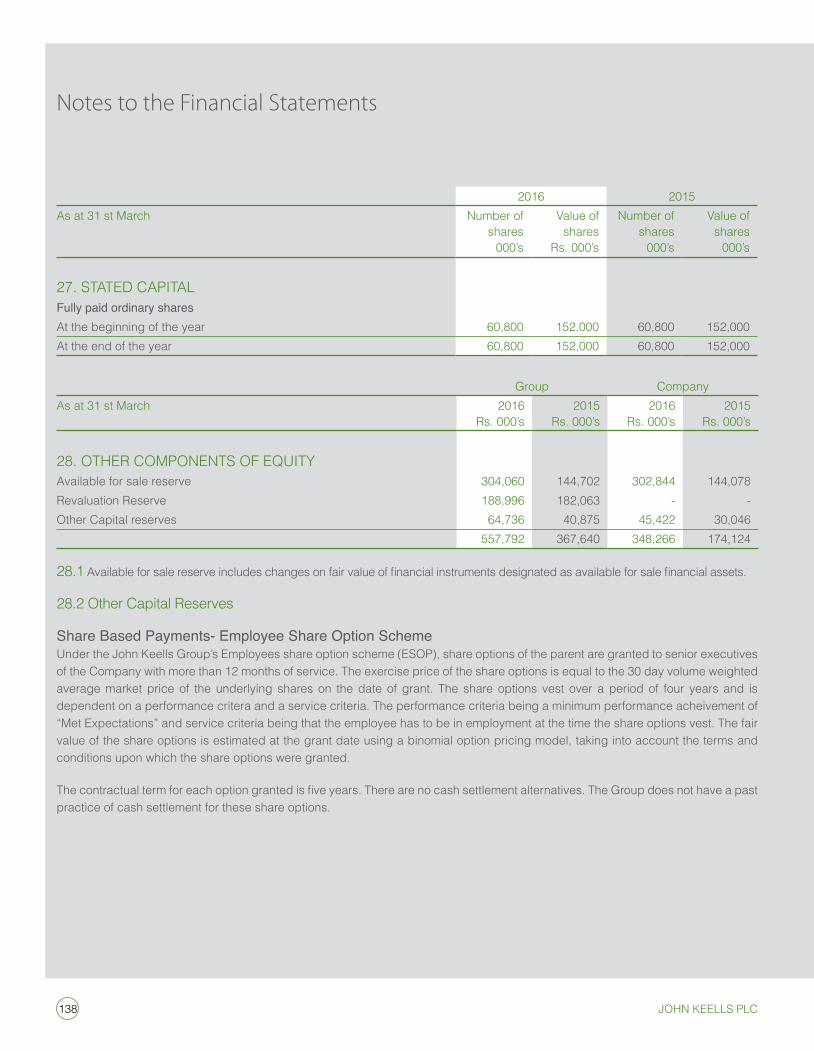
138 John Keells PlC
2016 2015as at 31 st March number of
shares000’s
Value ofshares
Rs. 000’s
number ofshares
000’s
Value ofshares
000’s
27. sTaTeD CaPiTaLFully paid ordinary sharesat the beginning of the year 60,800 152,000 60,800 152,000 at the end of the year 60,800 152,000 60,800 152,000
Group Companyas at 31 st March 2016
Rs. 000’s2015
Rs. 000’s2016
Rs. 000’s2015
Rs. 000’s
28. oTHeR CoMPonenTs oF eQuiTYavailable for sale reserve 304,060 144,702 302,844 144,078 Revaluation Reserve 188,996 182,063 - - other Capital reserves 64,736 40,875 45,422 30,046
557,792 367,640 348,266 174,124
28.1 Available for sale reserve includes changes on fair value of financial instruments designated as available for sale financial assets.
28.2 other Capital Reserves
Share Based Payments- Employee Share Option Scheme under the John Keells Group’s employees share option scheme (esoP), share options of the parent are granted to senior executives of the Company with more than 12 months of service. The exercise price of the share options is equal to the 30 day volume weighted average market price of the underlying shares on the date of grant. The share options vest over a period of four years and is dependent on a performance critera and a service criteria. The performance criteria being a minimum performance acheivement of “Met expectations” and service criteria being that the employee has to be in employment at the time the share options vest. The fair value of the share options is estimated at the grant date using a binomial option pricing model, taking into account the terms and conditions upon which the share options were granted.
The contractual term for each option granted is five years. There are no cash settlement alternatives. The Group does not have a past practice of cash settlement for these share options.
Notes to the Financial Statements
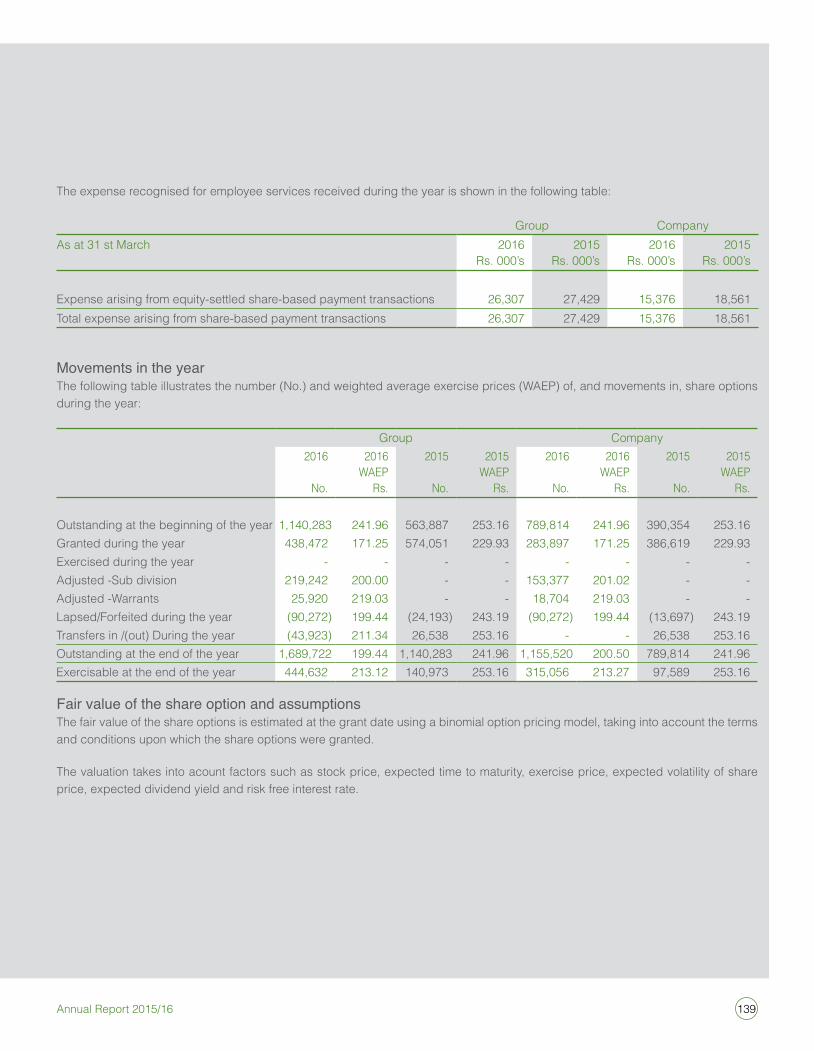
139Annual Report 2015/16
The expense recognised for employee services received during the year is shown in the following table:
Group Companyas at 31 st March 2016
Rs. 000’s2015
Rs. 000’s2016
Rs. 000’s2015
Rs. 000’s
expense arising from equity-settled share-based payment transactions 26,307 27,429 15,376 18,561 Total expense arising from share-based payment transactions 26,307 27,429 15,376 18,561
Movements in the year The following table illustrates the number (no.) and weighted average exercise prices (WaeP) of, and movements in, share options during the year:
Group Company2016
no.
2016WaeP
Rs.
2015
no.
2015WaeP
Rs.
2016
no.
2016WaeP
Rs.
2015
no.
2015WaeP
Rs.
outstanding at the beginning of the year 1,140,283 241.96 563,887 253.16 789,814 241.96 390,354 253.16Granted during the year 438,472 171.25 574,051 229.93 283,897 171.25 386,619 229.93 exercised during the year - - - - - - - - adjusted -sub division 219,242 200.00 - - 153,377 201.02 - - adjusted -Warrants 25,920 219.03 - - 18,704 219.03 - - Lapsed/Forfeited during the year (90,272) 199.44 (24,193) 243.19 (90,272) 199.44 (13,697) 243.19 Transfers in /(out) During the year (43,923) 211.34 26,538 253.16 - - 26,538 253.16 outstanding at the end of the year 1,689,722 199.44 1,140,283 241.96 1,155,520 200.50 789,814 241.96exercisable at the end of the year 444,632 213.12 140,973 253.16 315,056 213.27 97,589 253.16
Fair value of the share option and assumptionsThe fair value of the share options is estimated at the grant date using a binomial option pricing model, taking into account the terms and conditions upon which the share options were granted.
The valuation takes into acount factors such as stock price, expected time to maturity, exercise price, expected volatility of share price, expected dividend yield and risk free interest rate.
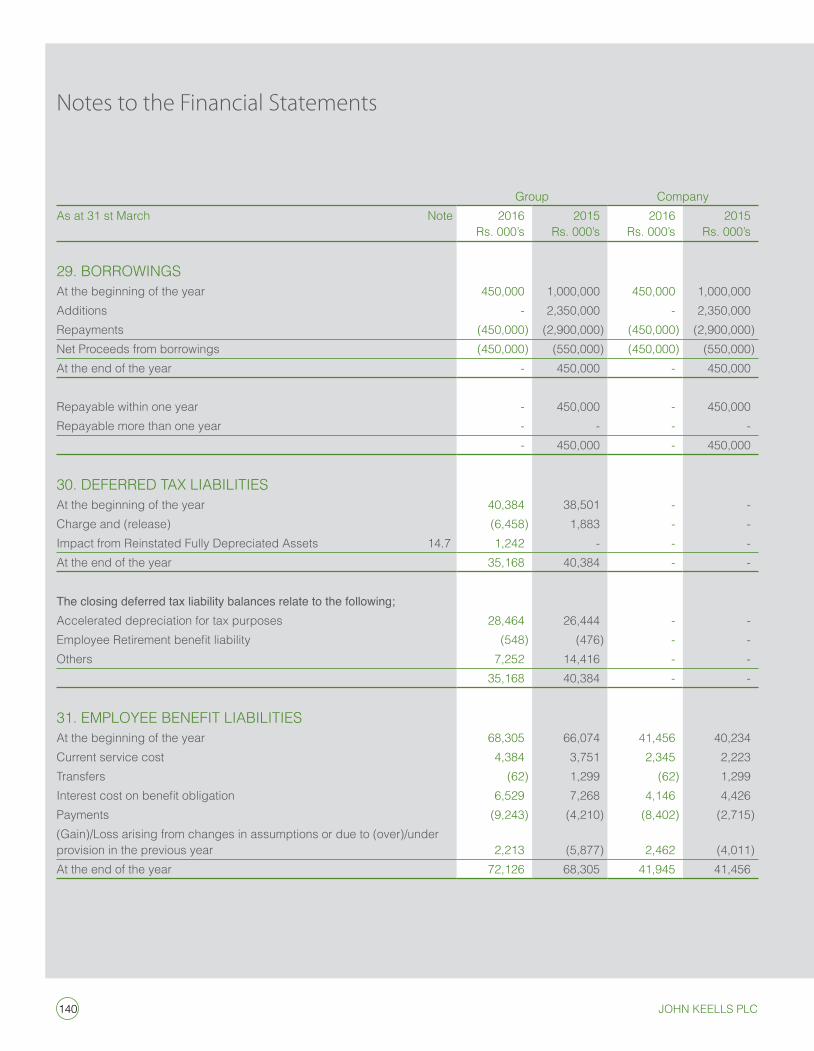
140 John Keells PlC
Notes to the Financial Statements
Group Companyas at 31 st March note 2016
Rs. 000’s2015
Rs. 000’s2016
Rs. 000’s2015
Rs. 000’s
29. BoRRoWinGs at the beginning of the year 450,000 1,000,000 450,000 1,000,000 additions - 2,350,000 - 2,350,000 Repayments (450,000) (2,900,000) (450,000) (2,900,000)net Proceeds from borrowings (450,000) (550,000) (450,000) (550,000)at the end of the year - 450,000 - 450,000
Repayable within one year - 450,000 - 450,000 Repayable more than one year - - - -
- 450,000 - 450,000
30. DeFeRReD Tax LiaBiLiTiesat the beginning of the year 40,384 38,501 - - Charge and (release) (6,458) 1,883 - - impact from Reinstated Fully Depreciated assets 14.7 1,242 - - -at the end of the year 35,168 40,384 - -
The closing deferred tax liability balances relate to the following; accelerated depreciation for tax purposes 28,464 26,444 - - Employee Retirement benefit liability (548) (476) - - others 7,252 14,416 - -
35,168 40,384 - -
31. eMPLoYee BeneFiT LiaBiLiTiesat the beginning of the year 68,305 66,074 41,456 40,234 Current service cost 4,384 3,751 2,345 2,223 Transfers (62) 1,299 (62) 1,299 Interest cost on benefit obligation 6,529 7,268 4,146 4,426 Payments (9,243) (4,210) (8,402) (2,715)(Gain)/Loss arising from changes in assumptions or due to (over)/under provision in the previous year 2,213 (5,877) 2,462 (4,011)at the end of the year 72,126 68,305 41,945 41,456
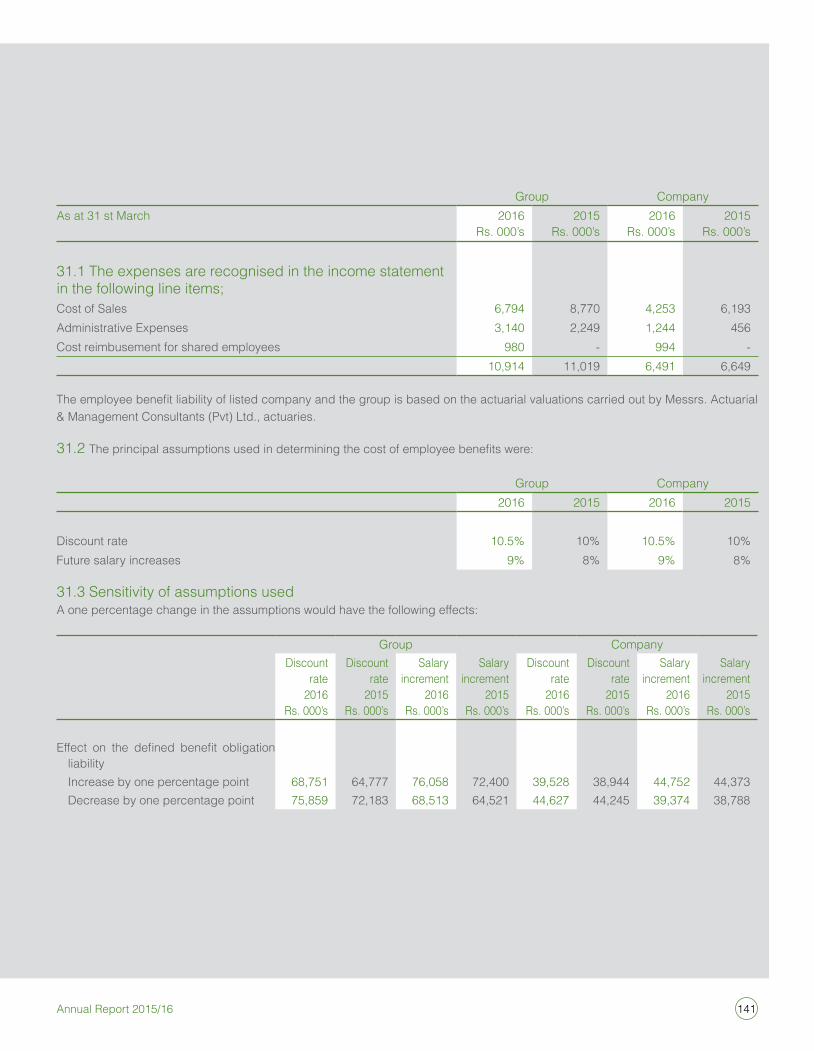
141Annual Report 2015/16
Group Companyas at 31 st March 2016
Rs. 000’s2015
Rs. 000’s2016
Rs. 000’s2015
Rs. 000’s
31.1 The expenses are recognised in the income statement in the following line items;Cost of sales 6,794 8,770 4,253 6,193 administrative expenses 3,140 2,249 1,244 456 Cost reimbusement for shared employees 980 - 994 -
10,914 11,019 6,491 6,649
The employee benefit liability of listed company and the group is based on the actuarial valuations carried out by Messrs. Actuarial & Management Consultants (Pvt) Ltd., actuaries.
31.2 The principal assumptions used in determining the cost of employee benefits were:
Group Company2016 2015 2016 2015
Discount rate 10.5% 10% 10.5% 10%Future salary increases 9% 8% 9% 8%
31.3 sensitivity of assumptions useda one percentage change in the assumptions would have the following effects:
Group CompanyDiscount
rate2016
Rs. 000’s
Discountrate
2015 Rs. 000’s
salaryincrement
2016 Rs. 000’s
salaryincrement
2015 Rs. 000’s
Discountrate
2016Rs. 000’s
Discountrate
2015Rs. 000’s
salaryincrement
2016 Rs. 000’s
salaryincrement
2015 Rs. 000’s
Effect on the defined benefit obligation liability
increase by one percentage point 68,751 64,777 76,058 72,400 39,528 38,944 44,752 44,373 Decrease by one percentage point 75,859 72,183 68,513 64,521 44,627 44,245 39,374 38,788
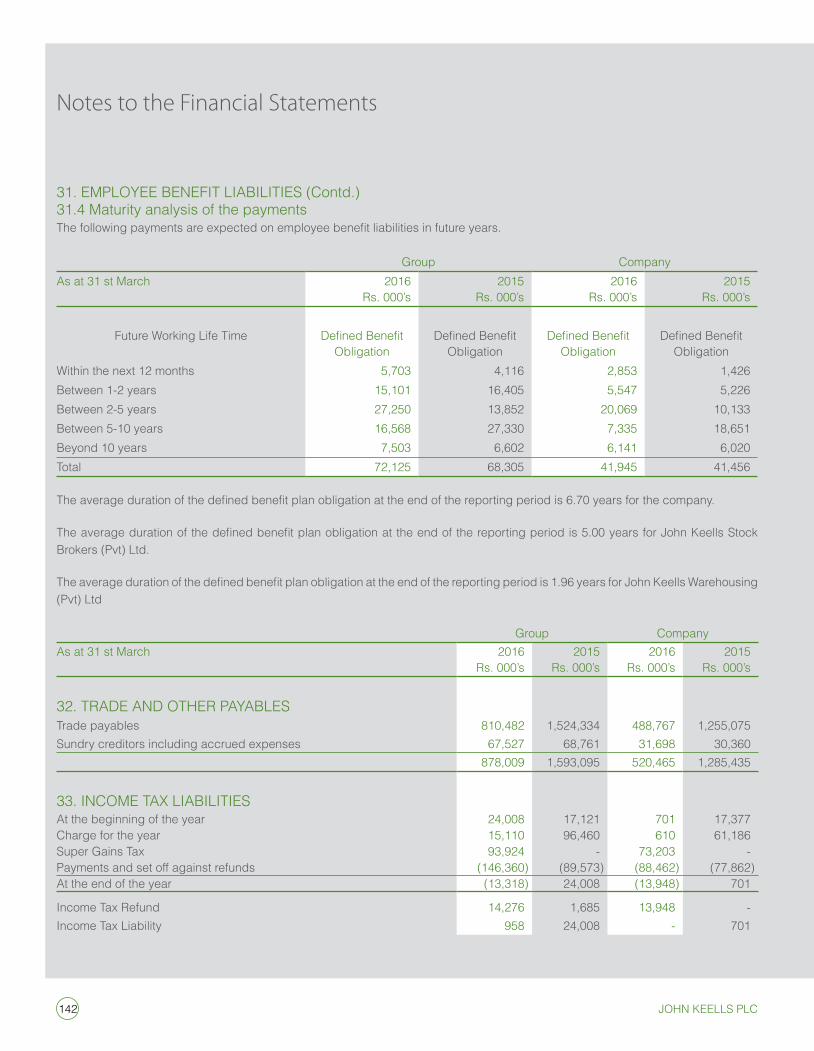
142 John Keells PlC
Notes to the Financial Statements
31. eMPLoYee BeneFiT LiaBiLiTies (Contd.)31.4 Maturity analysis of the paymentsThe following payments are expected on employee benefit liabilities in future years.
Group Companyas at 31 st March 2016
Rs. 000’s2015
Rs. 000’s2016
Rs. 000’s2015
Rs. 000’s
Future Working Life Time Defined Benefit obligation
Defined Benefit obligation
Defined Benefit obligation
Defined Benefit obligation
Within the next 12 months 5,703 4,116 2,853 1,426Between 1-2 years 15,101 16,405 5,547 5,226Between 2-5 years 27,250 13,852 20,069 10,133Between 5-10 years 16,568 27,330 7,335 18,651Beyond 10 years 7,503 6,602 6,141 6,020Total 72,125 68,305 41,945 41,456
The average duration of the defined benefit plan obligation at the end of the reporting period is 6.70 years for the company.
The average duration of the defined benefit plan obligation at the end of the reporting period is 5.00 years for John Keells Stock Brokers (Pvt) Ltd.
The average duration of the defined benefit plan obligation at the end of the reporting period is 1.96 years for John Keells Warehousing (Pvt) Ltd
Group Companyas at 31 st March 2016
Rs. 000’s2015
Rs. 000’s2016
Rs. 000’s2015
Rs. 000’s
32. TRaDe anD oTHeR PaYaBLesTrade payables 810,482 1,524,334 488,767 1,255,075 sundry creditors including accrued expenses 67,527 68,761 31,698 30,360
878,009 1,593,095 520,465 1,285,435
33. inCoMe Tax LiaBiLiTiesat the beginning of the year 24,008 17,121 701 17,377 Charge for the year 15,110 96,460 610 61,186 super Gains Tax 93,924 - 73,203 - Payments and set off against refunds (146,360) (89,573) (88,462) (77,862)at the end of the year (13,318) 24,008 (13,948) 701
income Tax Refund 14,276 1,685 13,948 -income Tax Liability 958 24,008 - 701
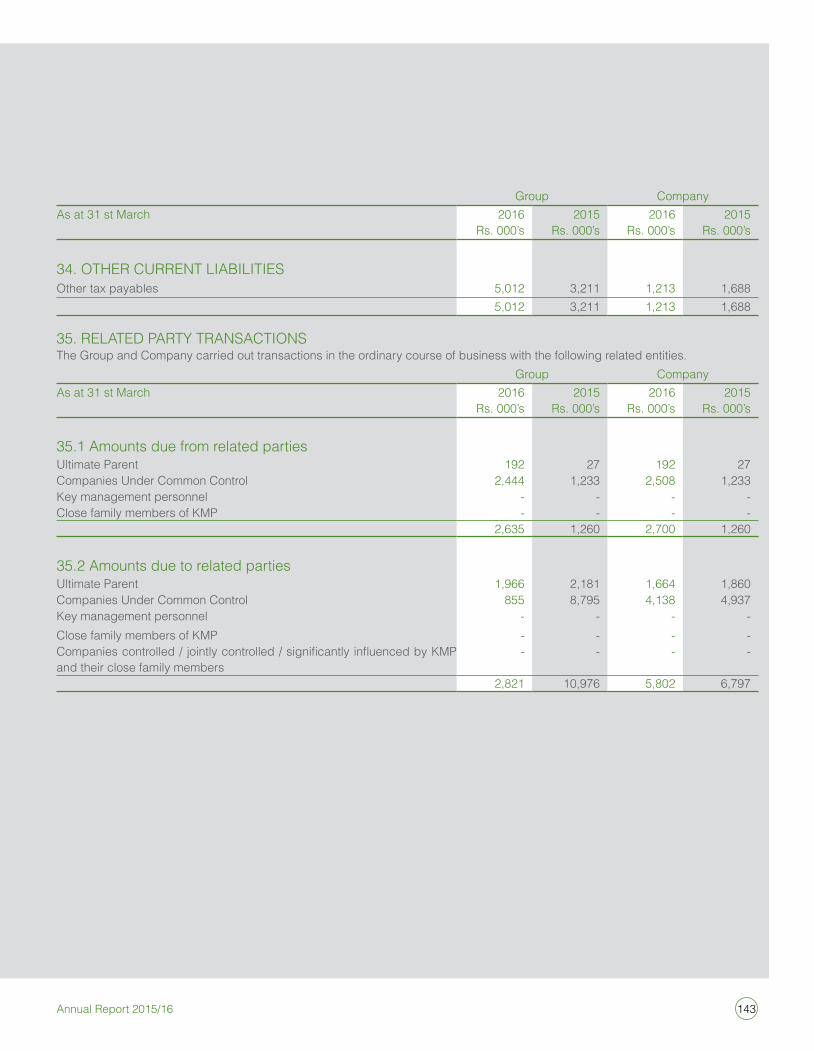
143Annual Report 2015/16
Group Companyas at 31 st March 2016
Rs. 000’s2015
Rs. 000’s2016
Rs. 000’s2015
Rs. 000’s
34. oTHeR CuRRenT LiaBiLiTiesother tax payables 5,012 3,211 1,213 1,688
5,012 3,211 1,213 1,688
35. ReLaTeD PaRTY TRansaCTionsThe Group and Company carried out transactions in the ordinary course of business with the following related entities.
Group Companyas at 31 st March 2016
Rs. 000’s2015
Rs. 000’s2016
Rs. 000’s2015
Rs. 000’s
35.1 amounts due from related partiesultimate Parent 192 27 192 27 Companies under Common Control 2,444 1,233 2,508 1,233 Key management personnel - - - - Close family members of KMP - - - -
2,635 1,260 2,700 1,260
35.2 amounts due to related partiesultimate Parent 1,966 2,181 1,664 1,860 Companies under Common Control 855 8,795 4,138 4,937 Key management personnel - - - - Close family members of KMP - - - - Companies controlled / jointly controlled / significantly influenced by KMP and their close family members
- - - -
2,821 10,976 5,802 6,797
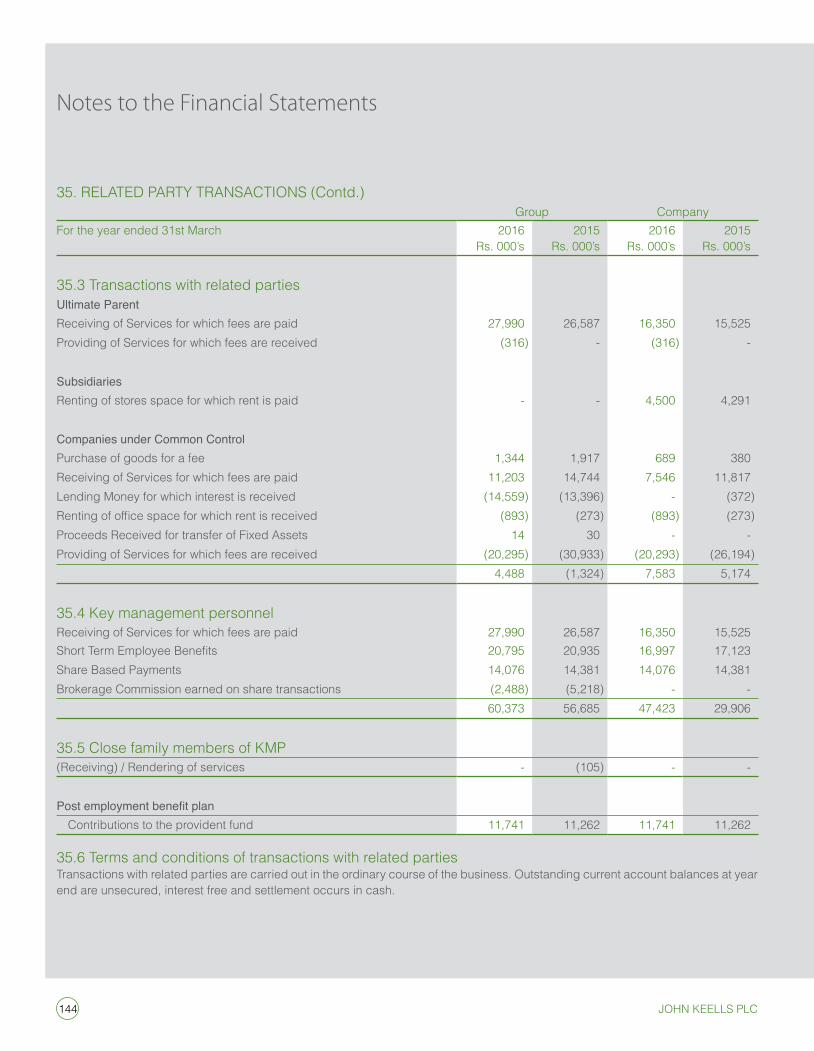
144 John Keells PlC
Notes to the Financial Statements
35. ReLaTeD PaRTY TRansaCTions (Contd.) Group Company
For the year ended 31st March 2016Rs. 000’s
2015Rs. 000’s
2016Rs. 000’s
2015Rs. 000’s
35.3 Transactions with related partiesultimate ParentReceiving of services for which fees are paid 27,990 26,587 16,350 15,525 Providing of services for which fees are received (316) - (316) -
SubsidiariesRenting of stores space for which rent is paid - - 4,500 4,291
Companies under Common ControlPurchase of goods for a fee 1,344 1,917 689 380 Receiving of services for which fees are paid 11,203 14,744 7,546 11,817 Lending Money for which interest is received (14,559) (13,396) - (372)Renting of office space for which rent is received (893) (273) (893) (273)Proceeds Received for transfer of Fixed assets 14 30 - - Providing of services for which fees are received (20,295) (30,933) (20,293) (26,194)
4,488 (1,324) 7,583 5,174
35.4 Key management personnelReceiving of services for which fees are paid 27,990 26,587 16,350 15,525Short Term Employee Benefits 20,795 20,935 16,997 17,123share Based Payments 14,076 14,381 14,076 14,381 Brokerage Commission earned on share transactions (2,488) (5,218) - -
60,373 56,685 47,423 29,906
35.5 Close family members of KMP(Receiving) / Rendering of services - (105) - -
Post employment benefit plan Contributions to the provident fund 11,741 11,262 11,741 11,262
35.6 Terms and conditions of transactions with related partiesTransactions with related parties are carried out in the ordinary course of the business. outstanding current account balances at year end are unsecured, interest free and settlement occurs in cash.
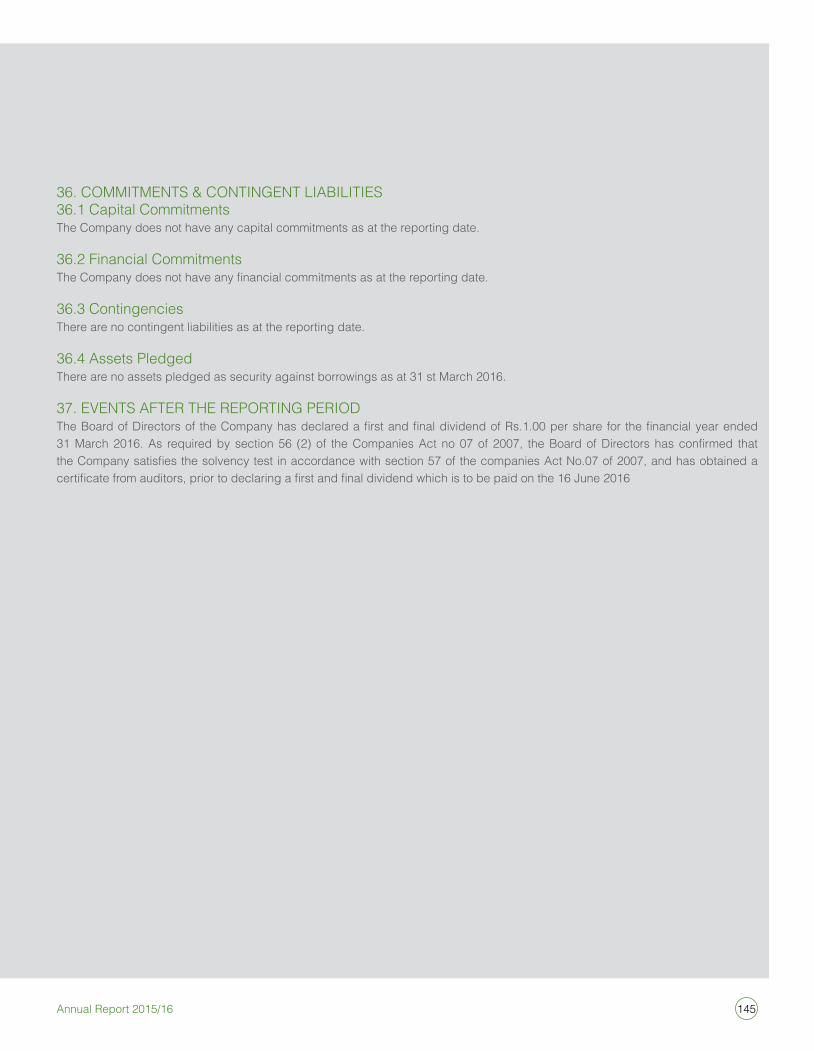
145Annual Report 2015/16
36 . CoMMiTMenTs & ConTinGenT LiaBiLiTies36.1 Capital Commitments The Company does not have any capital commitments as at the reporting date.
36.2 Financial CommitmentsThe Company does not have any financial commitments as at the reporting date.
36.3 ContingenciesThere are no contingent liabilities as at the reporting date.
36.4 assets PledgedThere are no assets pledged as security against borrowings as at 31 st March 2016.
37. eVenTs aFTeR THe RePoRTinG PeRioDThe Board of Directors of the Company has declared a first and final dividend of Rs.1.00 per share for the financial year ended 31 March 2016. As required by section 56 (2) of the Companies Act no 07 of 2007, the Board of Directors has confirmed that the Company satisfies the solvency test in accordance with section 57 of the companies Act No.07 of 2007, and has obtained a certificate from auditors, prior to declaring a first and final dividend which is to be paid on the 16 June 2016
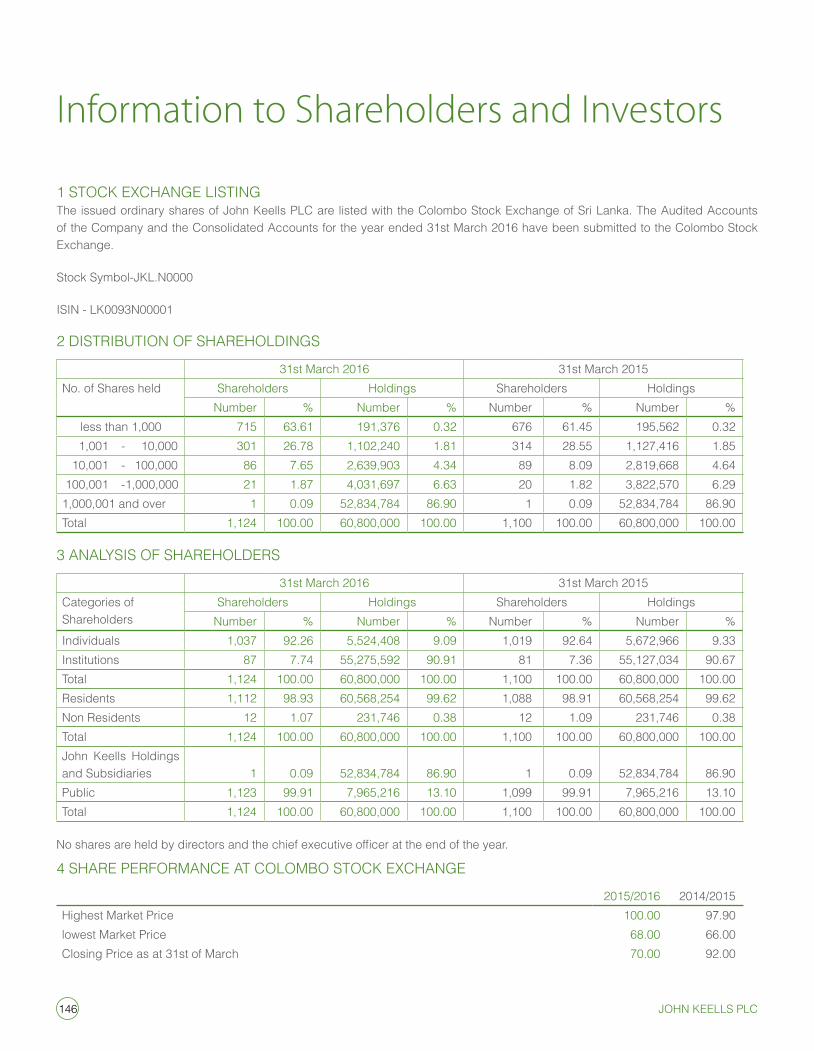
146 John Keells PlC
Information to Shareholders and Investors
1 sToCK exCHanGe LisTinGThe issued ordinary shares of John Keells PLC are listed with the Colombo stock exchange of sri Lanka. The audited accounts of the Company and the Consolidated accounts for the year ended 31st March 2016 have been submitted to the Colombo stock exchange.
stock symbol-JKL.n0000
isin - LK0093n00001
2 DisTRiBuTion oF sHaReHoLDinGs
31st March 2016 31st March 2015no. of shares held shareholders Holdings shareholders Holdings
number % number % number % number %less than 1,000 715 63.61 191,376 0.32 676 61.45 195,562 0.32
1,001 - 10,000 301 26.78 1,102,240 1.81 314 28.55 1,127,416 1.85 10,001 - 100,000 86 7.65 2,639,903 4.34 89 8.09 2,819,668 4.64 100,001 - 1,000,000 21 1.87 4,031,697 6.63 20 1.82 3,822,570 6.291,000,001 and over 1 0.09 52,834,784 86.90 1 0.09 52,834,784 86.90Total 1,124 100.00 60,800,000 100.00 1,100 100.00 60,800,000 100.00
3 anaLYsis oF sHaReHoLDeRs
31st March 2016 31st March 2015Categories of shareholders
shareholders Holdings shareholders Holdingsnumber % number % number % number %
individuals 1,037 92.26 5,524,408 9.09 1,019 92.64 5,672,966 9.33institutions 87 7.74 55,275,592 90.91 81 7.36 55,127,034 90.67Total 1,124 100.00 60,800,000 100.00 1,100 100.00 60,800,000 100.00Residents 1,112 98.93 60,568,254 99.62 1,088 98.91 60,568,254 99.62non Residents 12 1.07 231,746 0.38 12 1.09 231,746 0.38Total 1,124 100.00 60,800,000 100.00 1,100 100.00 60,800,000 100.00John Keells Holdings and subsidiaries 1 0.09 52,834,784 86.90 1 0.09 52,834,784 86.90Public 1,123 99.91 7,965,216 13.10 1,099 99.91 7,965,216 13.10Total 1,124 100.00 60,800,000 100.00 1,100 100.00 60,800,000 100.00
No shares are held by directors and the chief executive officer at the end of the year.
4 sHaRe PeRFoRManCe aT CoLoMBo sToCK exCHanGe
2015/2016 2014/2015Highest Market Price 100.00 97.90lowest Market Price 68.00 66.00Closing Price as at 31st of March 70.00 92.00
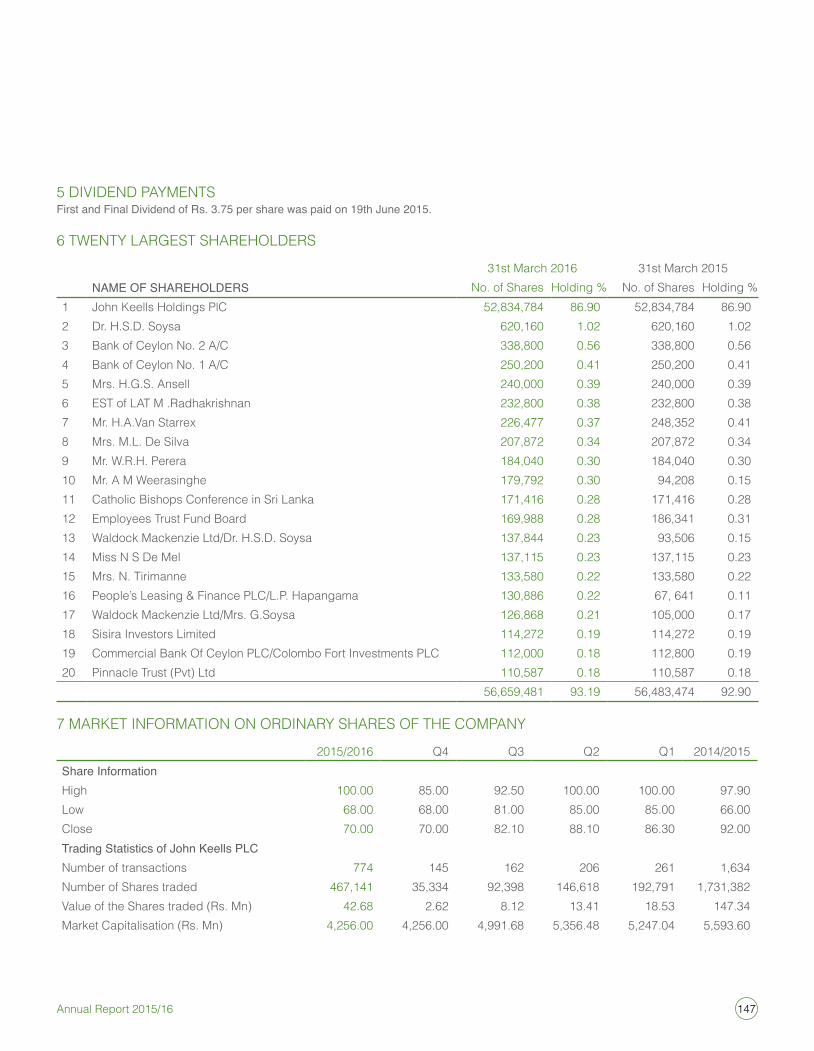
147Annual Report 2015/16
5 DiViDenD PaYMenTsFirst and Final Dividend of Rs. 3.75 per share was paid on 19th June 2015.
6 TWenTY LaRGesT sHaReHoLDeRs
31st March 2016 31st March 2015NAME OF SHAREHOLDERS no. of shares Holding % no. of shares Holding %
1 John Keells Holdings PlC 52,834,784 86.90 52,834,784 86.902 Dr. H.s.D. soysa 620,160 1.02 620,160 1.023 Bank of Ceylon no. 2 a/C 338,800 0.56 338,800 0.564 Bank of Ceylon no. 1 a/C 250,200 0.41 250,200 0.415 Mrs. H.G.s. ansell 240,000 0.39 240,000 0.396 esT of LaT M .Radhakrishnan 232,800 0.38 232,800 0.387 Mr. H.a.Van starrex 226,477 0.37 248,352 0.418 Mrs. M.L. De silva 207,872 0.34 207,872 0.349 Mr. W.R.H. Perera 184,040 0.30 184,040 0.3010 Mr. a M Weerasinghe 179,792 0.30 94,208 0.1511 Catholic Bishops Conference in sri Lanka 171,416 0.28 171,416 0.2812 employees Trust Fund Board 169,988 0.28 186,341 0.3113 Waldock Mackenzie Ltd/Dr. H.s.D. soysa 137,844 0.23 93,506 0.1514 Miss n s De Mel 137,115 0.23 137,115 0.2315 Mrs. n. Tirimanne 133,580 0.22 133,580 0.2216 People’s Leasing & Finance PLC/L.P. Hapangama 130,886 0.22 67, 641 0.1117 Waldock Mackenzie Ltd/Mrs. G.soysa 126,868 0.21 105,000 0.1718 sisira investors Limited 114,272 0.19 114,272 0.1919 Commercial Bank of Ceylon PLC/Colombo Fort investments PLC 112,000 0.18 112,800 0.1920 Pinnacle Trust (Pvt) Ltd 110,587 0.18 110,587 0.18
56,659,481 93.19 56,483,474 92.90
7 MaRKeT inFoRMaTion on oRDinaRY sHaRes oF THe CoMPanY
2015/2016 Q4 Q3 Q2 Q1 2014/2015Share InformationHigh 100.00 85.00 92.50 100.00 100.00 97.90Low 68.00 68.00 81.00 85.00 85.00 66.00Close 70.00 70.00 82.10 88.10 86.30 92.00Trading Statistics of John Keells PLCnumber of transactions 774 145 162 206 261 1,634number of shares traded 467,141 35,334 92,398 146,618 192,791 1,731,382Value of the shares traded (Rs. Mn) 42.68 2.62 8.12 13.41 18.53 147.34Market Capitalisation (Rs. Mn) 4,256.00 4,256.00 4,991.68 5,356.48 5,247.04 5,593.60
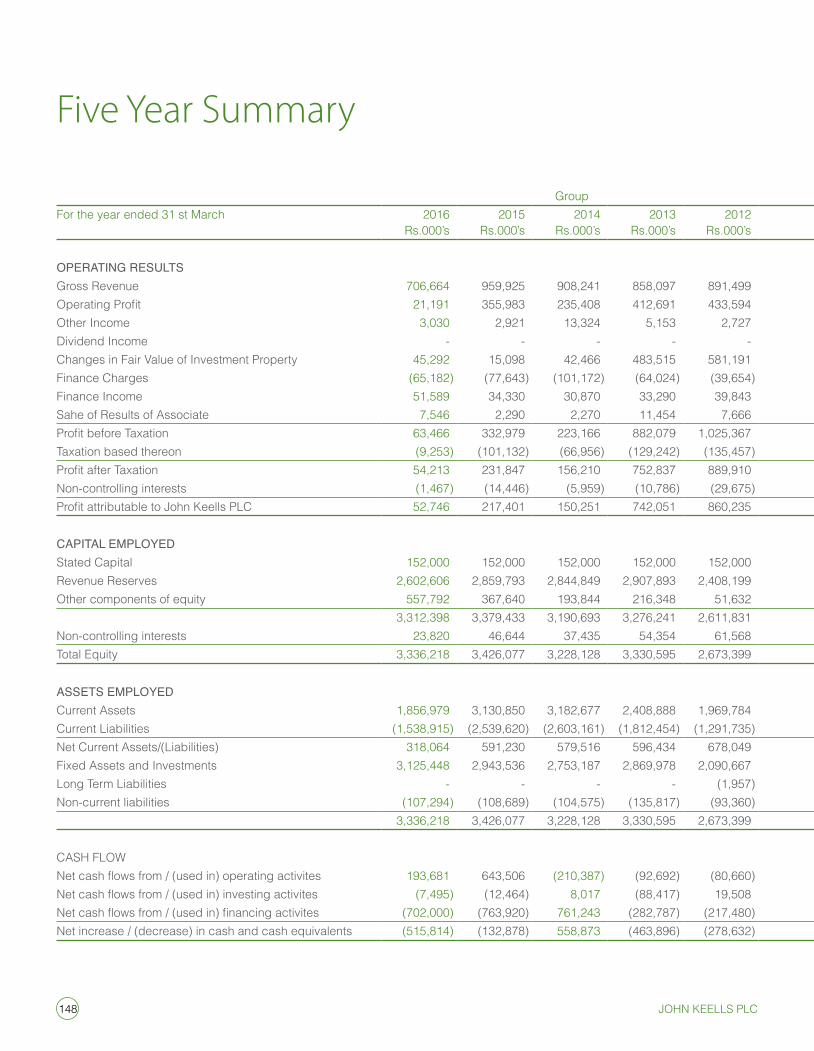
148 John Keells PlC
Five Year Summary
Group CompanyFor the year ended 31 st March 2016
Rs.000’s2015
Rs.000’s2014
Rs.000’s2013
Rs.000’s2012
Rs.000’s2016
Rs.000’s2015
Rs.000’s2014
Rs.000’s2013
Rs.000’s2012
Rs.000’s
OPERATING RESuLTSGross Revenue 706,664 959,925 908,241 858,097 891,499 424,529 558,765 611,310 572,940 492,077 Operating Profit 21,191 355,983 235,408 412,691 433,594 (1,599) 244,812 181,673 348,258 243,336 other income 3,030 2,921 13,324 5,153 2,727 2 2,656 12,673 998 1,415 Dividend income - - - - - 124,996 49,034 96,914 73,442 163,800 Changes in Fair Value of investment Property 45,292 15,098 42,466 483,515 581,191 45,292 15,098 42,466 483,515 581,191 Finance Charges (65,182) (77,643) (101,172) (64,024) (39,654) (64,979) (77,394) (98,925) (61,375) (28,708)Finance income 51,589 34,330 30,870 33,290 39,843 29,652 14,109 7,850 3,847 3,161 sahe of Results of associate 7,546 2,290 2,270 11,454 7,666 - - - - - Profit before Taxation 63,466 332,979 223,166 882,079 1,025,367 133,364 248,315 242,651 848,685 968,195 Taxation based thereon (9,253) (101,132) (66,956) (129,242) (135,457) 10,943 (60,024) (39,050) (83,593) (64,711)Profit after Taxation 54,213 231,847 156,210 752,837 889,910 144,307 188,291 203,601 765,092 903,484 non-controlling interests (1,467) (14,446) (5,959) (10,786) (29,675) - - - - - Profit attributable to John Keells PLC 52,746 217,401 150,251 742,051 860,235 144,307 188,291 203,601 765,092 903,484
CAPITAL EMPLoYEDstated Capital 152,000 152,000 152,000 152,000 152,000 152,000 152,000 152,000 152,000 152,000 Revenue Reserves 2,602,606 2,859,793 2,844,849 2,907,893 2,408,199 2,452,151 2,610,820 2,626,361 2,635,191 2,114,270 other components of equity 557,792 367,640 193,844 216,348 51,632 348,266 174,124 18,412 45,525 51,344
3,312,398 3,379,433 3,190,693 3,276,241 2,611,831 2,952,417 2,936,944 2,796,773 2,832,716 2,317,614 non-controlling interests 23,820 46,644 37,435 54,354 61,568 - - - - - Total equity 3,336,218 3,426,077 3,228,128 3,330,595 2,673,399 2,952,417 2,936,944 2,796,773 2,832,716 2,317,614
ASSETS EMPLoYEDCurrent assets 1,856,979 3,130,850 3,182,677 2,408,888 1,969,784 1,373,723 2,547,576 2,867,632 1,587,623 1,232,187 Current Liabilities (1,538,915) (2,539,620) (2,603,161) (1,812,454) (1,291,735) (1,176,251) (2,198,427) (2,471,584) (1,233,082) (813,993)net Current assets/(Liabilities) 318,064 591,230 579,516 596,434 678,049 197,472 349,149 396,048 354,541 418,194 Fixed assets and investments 3,125,448 2,943,536 2,753,187 2,869,978 2,090,667 2,796,890 2,629,251 2,440,958 2,553,147 1,967,552 Long Term Liabilities - - - - (1,957) - - - - - non-current liabilities (107,294) (108,689) (104,575) (135,817) (93,360) (41,945) (41,456) (40,233) (74,972) (68,132)
3,336,218 3,426,077 3,228,128 3,330,595 2,673,399 2,952,417 2,936,944 2,796,773 2,832,716 2,317,614
CasH FLoWNet cash flows from / (used in) operating activites 193,681 643,506 (210,387) (92,692) (80,660) 265,043 469,013 (180,726) (22,896) 105,181 Net cash flows from / (used in) investing activites (7,495) (12,464) 8,017 (88,417) 19,508 24,609 4,353 20,075 (113,317) (1,150)Net cash flows from / (used in) financing activites (702,000) (763,920) 761,243 (282,787) (217,480) (678,000) (756,720) 787,200 (243,200) (152,000)net increase / (decrease) in cash and cash equivalents (515,814) (132,878) 558,873 (463,896) (278,632) (388,348) (283,354) 626,549 (379,413) (47,969)
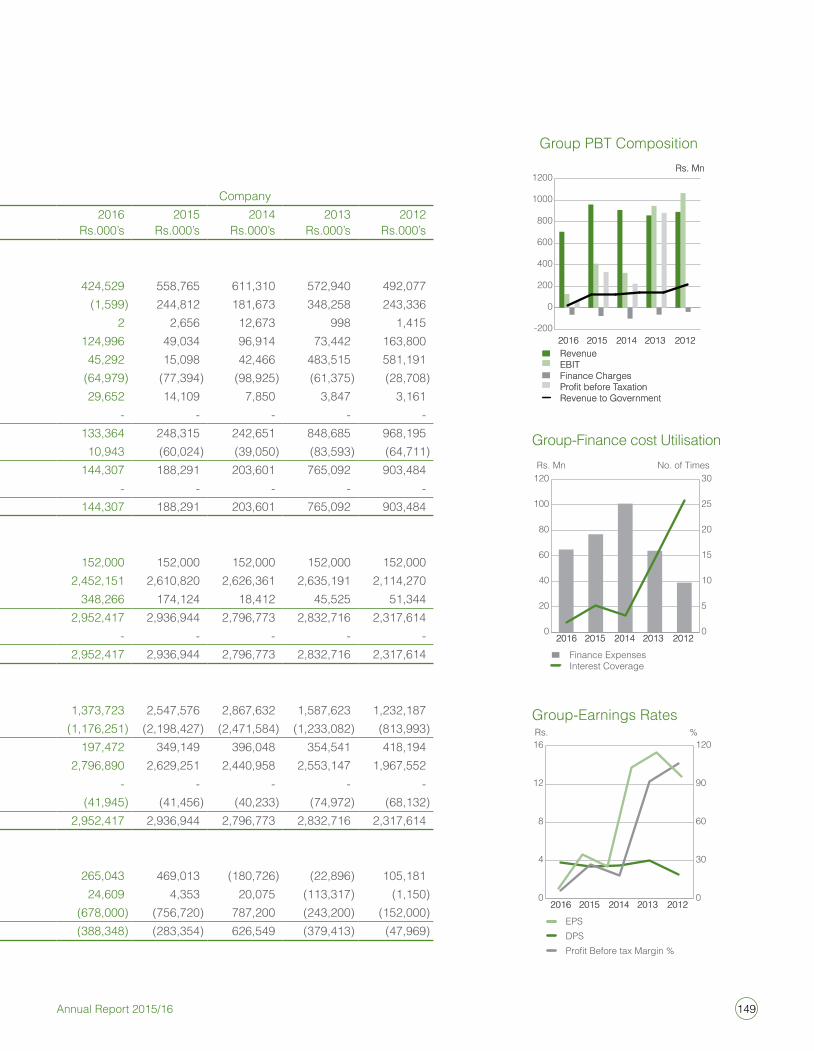
149Annual Report 2015/16
Group CompanyFor the year ended 31 st March 2016
Rs.000’s2015
Rs.000’s2014
Rs.000’s2013
Rs.000’s2012
Rs.000’s2016
Rs.000’s2015
Rs.000’s2014
Rs.000’s2013
Rs.000’s2012
Rs.000’s
OPERATING RESuLTSGross Revenue 706,664 959,925 908,241 858,097 891,499 424,529 558,765 611,310 572,940 492,077 Operating Profit 21,191 355,983 235,408 412,691 433,594 (1,599) 244,812 181,673 348,258 243,336 other income 3,030 2,921 13,324 5,153 2,727 2 2,656 12,673 998 1,415 Dividend income - - - - - 124,996 49,034 96,914 73,442 163,800 Changes in Fair Value of investment Property 45,292 15,098 42,466 483,515 581,191 45,292 15,098 42,466 483,515 581,191 Finance Charges (65,182) (77,643) (101,172) (64,024) (39,654) (64,979) (77,394) (98,925) (61,375) (28,708)Finance income 51,589 34,330 30,870 33,290 39,843 29,652 14,109 7,850 3,847 3,161 sahe of Results of associate 7,546 2,290 2,270 11,454 7,666 - - - - - Profit before Taxation 63,466 332,979 223,166 882,079 1,025,367 133,364 248,315 242,651 848,685 968,195 Taxation based thereon (9,253) (101,132) (66,956) (129,242) (135,457) 10,943 (60,024) (39,050) (83,593) (64,711)Profit after Taxation 54,213 231,847 156,210 752,837 889,910 144,307 188,291 203,601 765,092 903,484 non-controlling interests (1,467) (14,446) (5,959) (10,786) (29,675) - - - - - Profit attributable to John Keells PLC 52,746 217,401 150,251 742,051 860,235 144,307 188,291 203,601 765,092 903,484
CAPITAL EMPLoYEDstated Capital 152,000 152,000 152,000 152,000 152,000 152,000 152,000 152,000 152,000 152,000 Revenue Reserves 2,602,606 2,859,793 2,844,849 2,907,893 2,408,199 2,452,151 2,610,820 2,626,361 2,635,191 2,114,270 other components of equity 557,792 367,640 193,844 216,348 51,632 348,266 174,124 18,412 45,525 51,344
3,312,398 3,379,433 3,190,693 3,276,241 2,611,831 2,952,417 2,936,944 2,796,773 2,832,716 2,317,614 non-controlling interests 23,820 46,644 37,435 54,354 61,568 - - - - - Total equity 3,336,218 3,426,077 3,228,128 3,330,595 2,673,399 2,952,417 2,936,944 2,796,773 2,832,716 2,317,614
ASSETS EMPLoYEDCurrent assets 1,856,979 3,130,850 3,182,677 2,408,888 1,969,784 1,373,723 2,547,576 2,867,632 1,587,623 1,232,187 Current Liabilities (1,538,915) (2,539,620) (2,603,161) (1,812,454) (1,291,735) (1,176,251) (2,198,427) (2,471,584) (1,233,082) (813,993)net Current assets/(Liabilities) 318,064 591,230 579,516 596,434 678,049 197,472 349,149 396,048 354,541 418,194 Fixed assets and investments 3,125,448 2,943,536 2,753,187 2,869,978 2,090,667 2,796,890 2,629,251 2,440,958 2,553,147 1,967,552 Long Term Liabilities - - - - (1,957) - - - - - non-current liabilities (107,294) (108,689) (104,575) (135,817) (93,360) (41,945) (41,456) (40,233) (74,972) (68,132)
3,336,218 3,426,077 3,228,128 3,330,595 2,673,399 2,952,417 2,936,944 2,796,773 2,832,716 2,317,614
CasH FLoWNet cash flows from / (used in) operating activites 193,681 643,506 (210,387) (92,692) (80,660) 265,043 469,013 (180,726) (22,896) 105,181 Net cash flows from / (used in) investing activites (7,495) (12,464) 8,017 (88,417) 19,508 24,609 4,353 20,075 (113,317) (1,150)Net cash flows from / (used in) financing activites (702,000) (763,920) 761,243 (282,787) (217,480) (678,000) (756,720) 787,200 (243,200) (152,000)net increase / (decrease) in cash and cash equivalents (515,814) (132,878) 558,873 (463,896) (278,632) (388,348) (283,354) 626,549 (379,413) (47,969)
-200
0
200
400
600
800
1000
1200
RevenueEBITFinance Charges Profit before Taxation Revenue to Government
2016 2015 2014 2013 2012
Rs. Mn
Group PBT Composition
RevenueEBITFinance Charges Profit before Taxation Revenue to Government
2016 2015 2014 2013 2012
Rs. Mn
0
20
40
60
80
100
120
2016 2015 2014 2013 2012
Group-Finance cost Utilisation
Finance ExpensesInterest Coverage
0
5
10
15
20
25
30
2016 2015 2014 2013 2012
Rs. Mn No. of Times
0
4
8
12
16
2016 2015 2014 2013 2012
Rs. %Group-Earnings Rates
EPSDPSProfit Before tax Margin %
0
30
60
90
120
2016 2015 2014 2013 2012
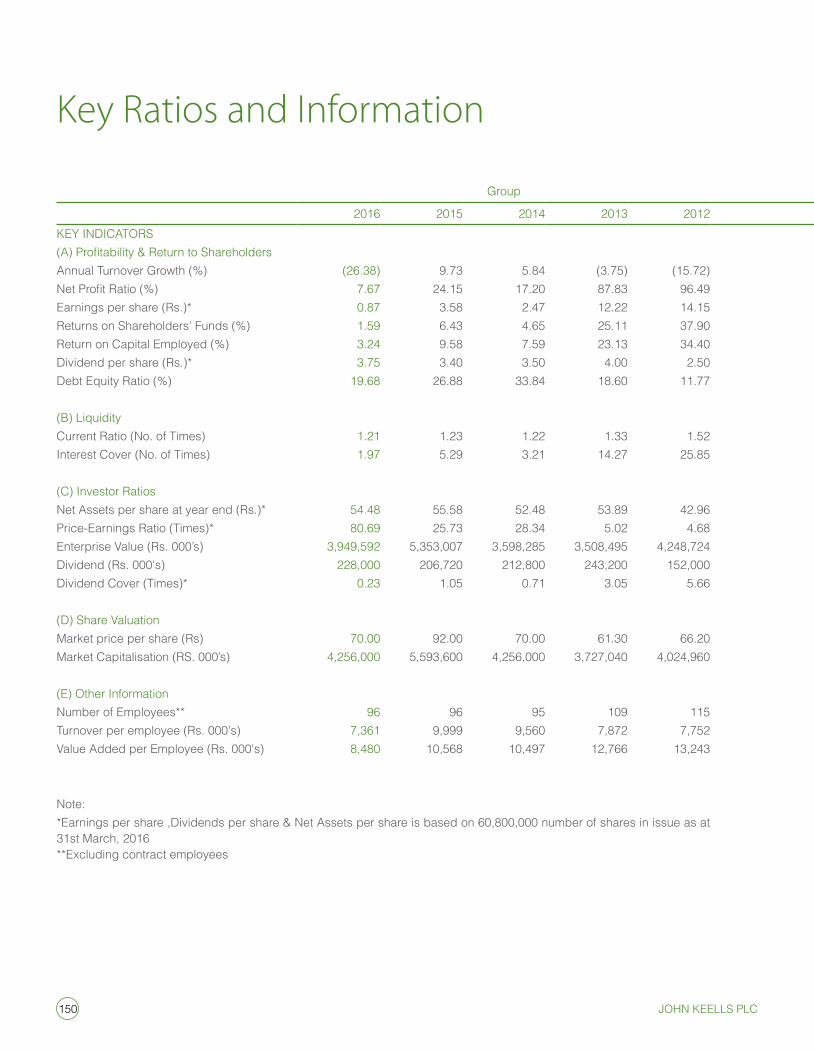
150 John Keells PlC
Group Company
2016 2015 2014 2013 2012 2016 2015 2014 2013 2012KeY inDiCaToRs(A) Profitability & Return to Shareholdersannual Turnover Growth (%) (26.38) 9.73 5.84 (3.75) (15.72) (24.02) (2.90) 6.70 16.43 0.50 Net Profit Ratio (%) 7.67 24.15 17.20 87.83 96.49 33.99 33.70 33.31 133.37 183.61 Earnings per share (Rs.)* 0.87 3.58 2.47 12.22 14.15 2.37 3.10 3.35 12.57 14.86 Returns on shareholders' Funds (%) 1.59 6.43 4.65 25.11 37.90 4.89 6.41 7.23 27.42 39.87 Return on Capital employed (%) 3.24 9.58 7.59 23.13 34.40 5.51 8.45 8.83 26.50 38.71 Dividend per share (Rs.)* 3.75 3.40 3.50 4.00 2.50 3.75 3.40 3.50 4.00 2.50 Debt equity Ratio (%) 19.68 26.88 33.84 18.60 11.77 21.97 30.77 38.37 20.58 11.01
(B) LiquidityCurrent Ratio (no. of Times) 1.21 1.23 1.22 1.33 1.52 1.17 1.16 1.16 1.29 1.51 interest Cover (no. of Times) 1.97 5.29 3.21 14.27 25.85 3.05 4.21 4.38 14.75 34.62
(C) investor RatiosNet Assets per share at year end (Rs.)* 54.48 55.58 52.48 53.89 42.96 48.56 48.31 46.00 46.59 38.12 Price-Earnings Ratio (Times)* 80.69 25.73 28.34 5.02 4.68 29.49 29.71 20.90 4.88 4.45 enterprise Value (Rs. 000’s) 3,949,592 5,353,007 3,598,285 3,508,495 4,248,724 3,693,608 4,969,556 3,365,310 3,209,802 3,887,135 Dividend (Rs. 000's) 228,000 206,720 212,800 243,200 152,000 228,000 206,720 212,800 243,200 152,000 Dividend Cover (Times)* 0.23 1.05 0.71 3.05 5.66 0.63 0.91 0.96 3.14 5.94
(D) share ValuationMarket price per share (Rs) 70.00 92.00 70.00 61.30 66.20 70.00 92.00 70.00 61.30 66.20 Market Capitalisation (Rs. 000’s) 4,256,000 5,593,600 4,256,000 3,727,040 4,024,960 4,256,000 5,593,600 4,256,000 3,727,040 4,024,960
(e) other informationNumber of Employees** 96 96 95 109 115 64 66 65 79 80 Turnover per employee (Rs. 000's) 7,361 9,999 9,560 7,872 7,752 6,633 8,466 9,405 7,252 6,151 Value added per employee (Rs. 000's) 8,480 10,568 10,497 12,766 13,243 7,804 8,949 10,374 13,434 13,473
note:*Earnings per share ,Dividends per share & Net Assets per share is based on 60,800,000 number of shares in issue as at 31st March, 2016**Excluding contract employees
Key Ratios and Information
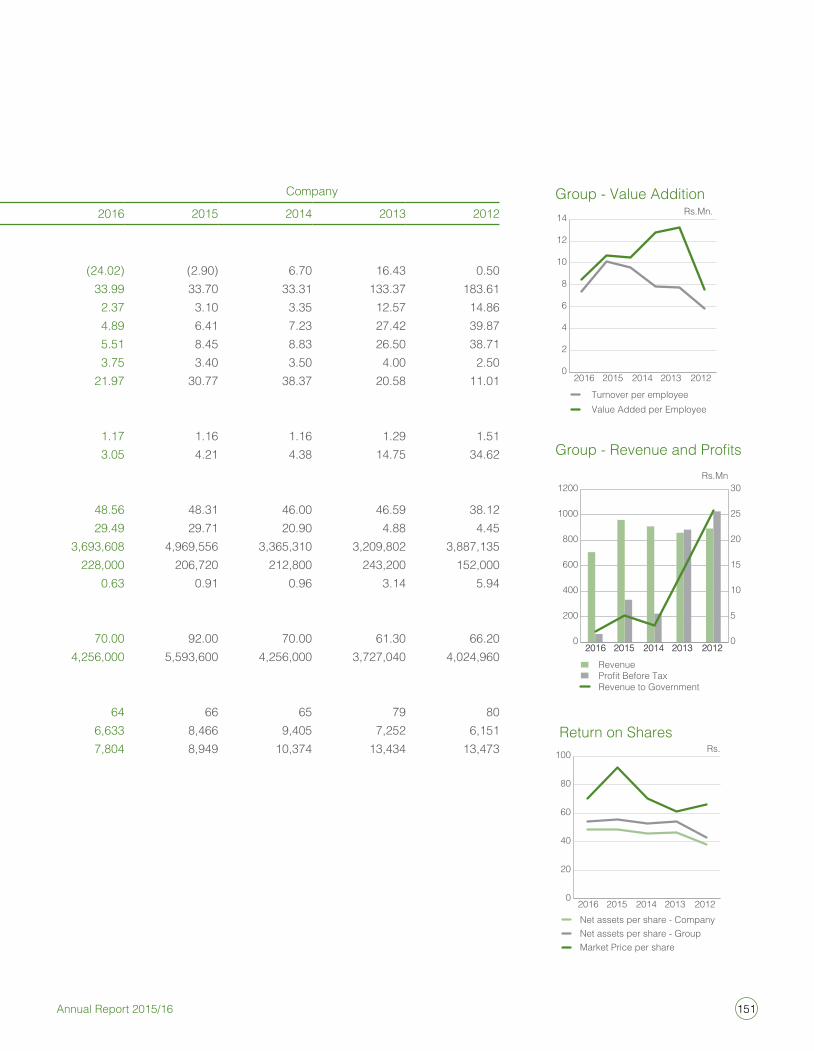
151Annual Report 2015/16
Group Company
2016 2015 2014 2013 2012 2016 2015 2014 2013 2012KeY inDiCaToRs(A) Profitability & Return to Shareholdersannual Turnover Growth (%) (26.38) 9.73 5.84 (3.75) (15.72) (24.02) (2.90) 6.70 16.43 0.50 Net Profit Ratio (%) 7.67 24.15 17.20 87.83 96.49 33.99 33.70 33.31 133.37 183.61 Earnings per share (Rs.)* 0.87 3.58 2.47 12.22 14.15 2.37 3.10 3.35 12.57 14.86 Returns on shareholders' Funds (%) 1.59 6.43 4.65 25.11 37.90 4.89 6.41 7.23 27.42 39.87 Return on Capital employed (%) 3.24 9.58 7.59 23.13 34.40 5.51 8.45 8.83 26.50 38.71 Dividend per share (Rs.)* 3.75 3.40 3.50 4.00 2.50 3.75 3.40 3.50 4.00 2.50 Debt equity Ratio (%) 19.68 26.88 33.84 18.60 11.77 21.97 30.77 38.37 20.58 11.01
(B) LiquidityCurrent Ratio (no. of Times) 1.21 1.23 1.22 1.33 1.52 1.17 1.16 1.16 1.29 1.51 interest Cover (no. of Times) 1.97 5.29 3.21 14.27 25.85 3.05 4.21 4.38 14.75 34.62
(C) investor RatiosNet Assets per share at year end (Rs.)* 54.48 55.58 52.48 53.89 42.96 48.56 48.31 46.00 46.59 38.12 Price-Earnings Ratio (Times)* 80.69 25.73 28.34 5.02 4.68 29.49 29.71 20.90 4.88 4.45 enterprise Value (Rs. 000’s) 3,949,592 5,353,007 3,598,285 3,508,495 4,248,724 3,693,608 4,969,556 3,365,310 3,209,802 3,887,135 Dividend (Rs. 000's) 228,000 206,720 212,800 243,200 152,000 228,000 206,720 212,800 243,200 152,000 Dividend Cover (Times)* 0.23 1.05 0.71 3.05 5.66 0.63 0.91 0.96 3.14 5.94
(D) share ValuationMarket price per share (Rs) 70.00 92.00 70.00 61.30 66.20 70.00 92.00 70.00 61.30 66.20 Market Capitalisation (Rs. 000’s) 4,256,000 5,593,600 4,256,000 3,727,040 4,024,960 4,256,000 5,593,600 4,256,000 3,727,040 4,024,960
(e) other informationNumber of Employees** 96 96 95 109 115 64 66 65 79 80 Turnover per employee (Rs. 000's) 7,361 9,999 9,560 7,872 7,752 6,633 8,466 9,405 7,252 6,151 Value added per employee (Rs. 000's) 8,480 10,568 10,497 12,766 13,243 7,804 8,949 10,374 13,434 13,473
note:*Earnings per share ,Dividends per share & Net Assets per share is based on 60,800,000 number of shares in issue as at 31st March, 2016**Excluding contract employees
Return on Shares
Net assets per share - CompanyNet assets per share - GroupMarket Price per share
0
20
40
60
80
100
2016 2015 2014 2013 2012
Rs.
0
200
400
600
800
1000
1200
2016 2015 2014 2013 2012
Group - Revenue and Profits
RevenueProfit Before TaxRevenue to Government
0
5
10
15
20
25
30
2016 2015 2014 2013 2012
Rs.Mn
Group - Value Addition
Turnover per employee Value Added per Employee
0
2
4
6
8
10
12
14
2016 2015 2014 2013 2012
Rs.Mn.
152 John Keells PlC
Glossary of Financial Terms
aCCRuaL BasisRecording Revenues and expenses in the period in which they are earned or incurred regardless of whether cash is received or disbursed in that period.
CaPiTaL eMPLoYeDshareholders’ Funds plus Debt
ConTinGenT LiaBiLiTiesa condition or situation existing at the Balance sheet date due to past events, where the financial effect is not recognised because:
1. The obligation is crystallised by the occurrence or non occurrence of one or more future events or,
2. A probable outflow of economic resources is not expected or,
3. it is unable to be measured with sufficient reliability
CuRRenT RaTioCurrent assets over Current Liabilities
DeBT/eQuiTY RaTioDebt as a percentage of shareholders Funds
DiViDenD CoVeRearnings per share over Dividends per share
DiViDenD PaYouT RaTioTotal Dividend interest and Tax as percentage of Capital employed
eaRninGs PeR sHaRe (ePs)Profit after tax attributable to ordinary shareholding over weighted average numbers of shares in issue during the period
eaRninGs YieLDearnings per share as a percentage of Market price per share end of the period.
eFFeCTiVe RaTe oF TaxaTionincome Tax, including deferred tax over Profit before Tax
enTeRPRise VaLue Market Capitalization plus net debt/(net cash)
inTeResT CoVeRProfit before Interest and Tax over Finance expenses
MaRKeT CaPiTaLisaTionnumber of shares in issue at the end of the period multiplied by the Market price at end of period
neT asseTsTotal assets minus Current Liabilities minus Long Term Liabilities minus Minority interest
neT asseT PeR sHaRenet assets, over number of ordinary shares in issue
neT DeBTnet Debt minus (Cash plus short Term Deposits)
neT TuRnoVeR PeR eMPLoYeenet Turnover over average number of employees
PRiCe eaRninGs RaTioMarket Price per share over earnings per share
QuiCK asseT RaTioCash plus short Term investments plus Receivables, Dividend by Current Liabilities
QuiCK RaTioCash plus short Term investments plus Receivables over Current Liabilities
ReTuRn on asseTsProfit after Tax over Average Total Assets
ReTuRn on eQuiTYProfit after Tax as a percentage of average shareholder’s Funds
ReTuRn on CaPiTaL eMPLoYeDearning before interest and tax as percentage of Capital employed
sHaReHoLDeRs FunDsstated Capital plus other components of equity Plus Revenue Reserves
ToTaL asseTsFixed assets plus investments plus non Current assets plus Current assets
ToTaL DeBTLong Term Loans plus short Term Loans and overdrafts
ToTaL eQuiTYshareholders’ funds plus non-controlling interest
ToTaL VaLue aDDeDThe difference between revenue (including other income) and expenses, cost of materials and services purchased from external sources
WoRKinG CaPiTaLCapital required finance the day-to-day operations Current assets minus Current Liabilities
153Annual Report 2015/16
Notice of Meeting
notice is hereby given that the sixty ninth annual General Meeting of John Keells PLC will be held on Tuesday 28th June 2016 at 9.30 a.m. at the John Keells auditorium, 186 Vauxhall street, Colombo 02.
The business to be brought before the meeting will be:
• To read the Notice Convening the Meeting.
• To receive and consider the Annual Report and Financial statements of the company for the financial year ended 31 March 2016 with the Report of the auditors thereon.
• To re-elect as Director, Mr. J R F Peiris who retires in terms of article 83 of the articles of association of the Company. A brief profile of Mr. J R F Peiris is contained in the Board of Directors section on page 14 of the annual Report.
• To re-elect as Director, Mr. V. A. A. Perera who retires in terms of article 90 of the articles of association of the Company. A brief profile of Mr. V. a. a. Perera is contained in the Board of Directors section on page 14 of the annual Report.
• To re-appoint Auditors and to authorize the Directors to determine their remuneration.
• To consider any other business of which due notice has been given in terms of the relevant laws and regulations.
By order of the Board John Keells PLC
Keells Consultants (Private) LimitedSecretariesColombo
03rd June 2016
notes:i. a member unable to attend is entitled
to appoint a Proxy to attend and vote in his/her place.
ii. a Proxy need not be a member of the Company.
iii. a member wishing to vote by Proxy at the Meeting may use the Proxy Form enclosed.
iv. in order to be valid, the completed Proxy Form must be lodged at the Registered Office of the Company not less than 48 hours before the meeting.
v. if a poll is demanded, a vote can be taken on a show of hands or by a poll. each share is entitled to one vote. Votes can be cast in person, by proxy or corporate representatives. in the event an individual shareholder and his proxy holder are both present at the meeting, only the shareholder’s vote is counted. if the proxy holder’s appointor has indicated the manner of voting, only the appointor’s indication of the manner to vote will be used.

154 John Keells PlC
Notes
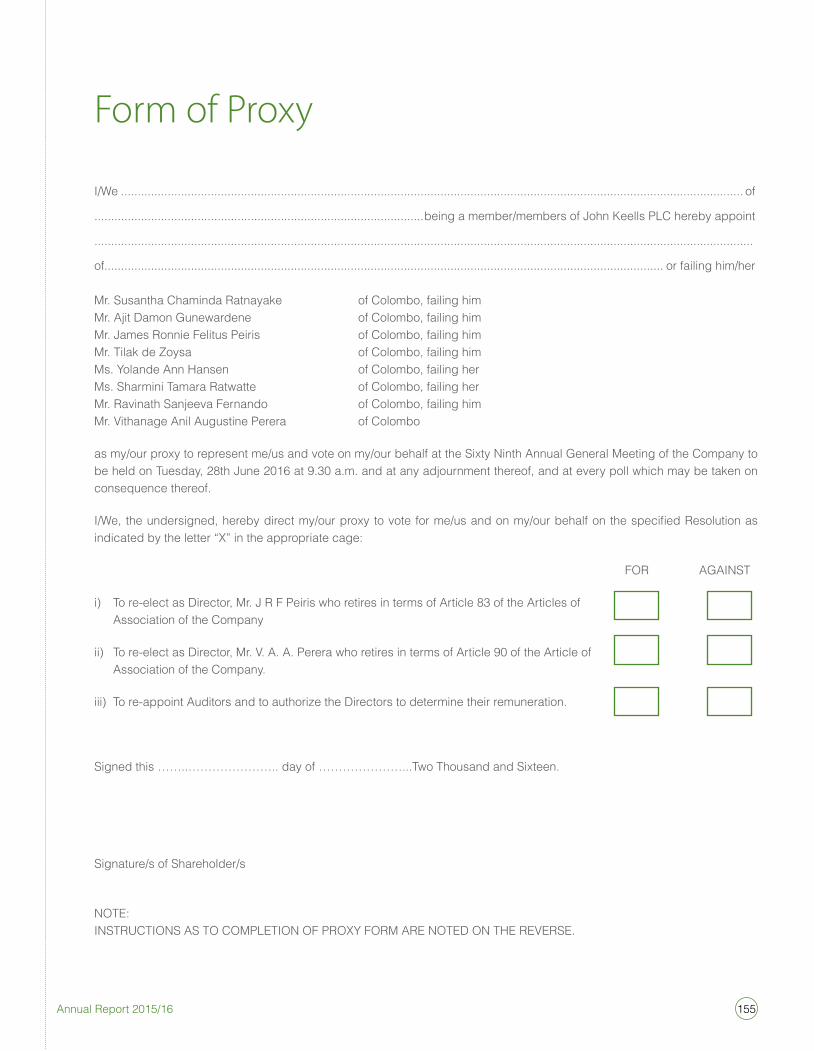
155Annual Report 2015/16
Form of Proxy
i/We ........................................................................................................................................................................................... of
...................................................................................................being a member/members of John Keells PLC hereby appoint
......................................................................................................................................................................................................
of........................................................................................................................................................................ or failing him/her
Mr. susantha Chaminda Ratnayake of Colombo, failing himMr. ajit Damon Gunewardene of Colombo, failing himMr. James Ronnie Felitus Peiris of Colombo, failing himMr. Tilak de Zoysa of Colombo, failing himMs. Yolande ann Hansen of Colombo, failing herMs. sharmini Tamara Ratwatte of Colombo, failing herMr. Ravinath sanjeeva Fernando of Colombo, failing himMr. Vithanage anil augustine Perera of Colombo
as my/our proxy to represent me/us and vote on my/our behalf at the sixty ninth annual General Meeting of the Company to be held on Tuesday, 28th June 2016 at 9.30 a.m. and at any adjournment thereof, and at every poll which may be taken on consequence thereof.
I/We, the undersigned, hereby direct my/our proxy to vote for me/us and on my/our behalf on the specified Resolution as indicated by the letter “x” in the appropriate cage:
FoR aGainsT
i) To re-elect as Director, Mr. J R F Peiris who retires in terms of article 83 of the articles of association of the Company
ii) To re-elect as Director, Mr. V. a. a. Perera who retires in terms of article 90 of the article of association of the Company.
iii) To re-appoint auditors and to authorize the Directors to determine their remuneration.
signed this ……..………………….. day of …………………...Two Thousand and sixteen.
signature/s of shareholder/s
noTe: insTRuCTions as To CoMPLeTion oF PRoxY FoRM aRe noTeD on THe ReVeRse.
156 John Keells PlC
insTRuCTions as To CoMPLeTion oF PRoxY
1. Please perfect the Form of Proxy by filling in legibly your full name and address, signing in the space provided and filling in the date of signature.
2. The completed Form of Proxy should be deposited at the Company’s registered address at no. 117, sir Chittampalam a. Gardiner Mawatha Colombo 2, not later than 48 hours before the time appointed for the holding of the Meeting.
3. if the Form of Proxy is signed by an attorney, the relevant Power of attorney should accompany the completed Form of Proxy for registration, if such Power of attorney has not already been registered with the Company.
4. if the appointer is a company or Corporation, the Form of Proxy should be executed under its Common Seal or by a duly authorised officer of the company or Corporation in accordance with its articles of association or Constitution.
5. if this Form of Proxy is returned without any indication of how the person appointed as Proxy shall vote, then the Proxy shall exercise his/her discretion as to how he/she votes or, whether or not he/she abstains from voting.
Please fill in the following details:
name : ...........................................................................................................
address : ........................................................................................................
........................................................................................................................
........................................................................................................................
........................................................................................................................
Jointly with : ....................................................................................................
share Folio no : ..............................................................................................