antimicrobial use in european long-term care...
TRANSCRIPT

SURVEILLANCE REPORT
www.ecdc.europa.eu
Point prevalence survey of healthcare-associated infections and
antimicrobial use in European long-term care facilities
Xxxxxxx 2000SURVEILLANCE
REPORT
April–May 2013

ECDC SURVEILLANCE REPORT
Point prevalence survey of healthcare-associated infections and antimicrobial use in European long-term care facilities
April–May 2013

ii
This report was commissioned by the European Centre for Disease Prevention and Control (ECDC) and coordinated by Carl Suetens.
The HALT-2 project (ECDC framework service contract ECDC/2011/023) was awarded to a consortium led by the Scientific Institute of Public Health, Brussels, Belgium, in collaboration with the Agenzia Sanitaria e Sociale Regionale, Bologna, Italy, and the Health Protection Surveillance Centre, Dublin, Ireland.
Authors
Katrien Latour, Pete Kinross, Maria Luisa Moro, Fidelma Fitzpatrick, Enrico Ricchizzi, Tracey Dillane, Jolanta Griškevičienė, Béatrice Jans
Acknowledgements
HALT-2 would like to thank all participating long-term care facilities (LTCFs) and their staff. Without their contribution, it would not have been possible to obtain this insight into the burden of HAI and antimicrobial use in European LTCFs. We are particularly grateful to all national representatives and their colleagues in participating countries for their continuous efforts and enthusiasm and for believing in the importance of this project.
Belgium: Béatrice Jans (Scientific Institute of Public Health); Croatia: Zrinka Bošnjak (University Hospital Centre, Zagreb); Czech Republic: Dana Hedlová (Central Military Hospital, Prague); Denmark: Christian Stab Jensen (Statens Serum Institut, Copenhagen); Finland: Outi Lyytikäinen, Tommi Kärki, Dinah Arifulla (National Institute for Health and Welfare, Helsinki); Germany: Claudia Ruscher, Martina Kraus-Haas (Robert Koch Institute, Berlin); Greece: Helena Maltezou (Hellenic Center for Disease Control and Prevention, Athens); Hungary: Rita Szabó (National Center for Epidemiology, Budapest); Ireland: Karen Burns, Sheila Donlon, Fionamary Roche (Health Protection Surveillance Centre, Dublin); Italy: Maria Luisa Moro, Enrico Ricchizzi (Agenzia Sanitaria e Sociale Regionale Emilia – Romagna, Bologna); Malta: Mark Bonanno (St Vincent De Paul Residence, Luqa); The Netherlands: Marie-José Veldman-Ariesen, Anja Haenen (National Institute for Public Health and the Environment, Bilthoven); Norway: Horst Bentele (Norwegian Institute of Public Health, Oslo); Portugal: Elaine Pina, Paulo Jorge Nogueira (General Directorate of Health/Direcção Geral da Saúde, Lisbon); Slovenia: Božena Kotnik Kevorkijan (University Medical Centre Maribor); Sweden: Tomas Söderblom, Inga Zetterqvist (Public Health Agency of Sweden, Stockholm); United Kingdom – England: Susan Hopkins, Lesley Morley (Public Health England, London); United Kingdom – Northern Ireland: Lourda Geoghegan, Gerard McIlvenny, Mark McConaghy (Public Health Agency, Health and Social Care Northern Ireland, Belfast); United Kingdom – Wales: Dafydd Williams (Public Health Wales,
Welsh Healthcare Associated Infection Programme, Cardiff)
Finally, we would like to thank our advisory board members (Barry Cookson, Hanne Merete Eriksen, Rolanda Valinteliene, Gaëtan Gavazzi and Carmel Hughes) for their support and expert advice.
Suggested citation: European Centre for Disease Prevention and Control. Point prevalence survey of healthcare-associated infections and antimicrobial use in European long-term care facilities. April–May 2013. Stockholm: ECDC; 2014.
Stockholm, May 2014
ISBN 978-92-9193-571-0
doi 10.2900/24172
Catalogue number TQ-04-14-458-EN-N
© European Centre for Disease Prevention and Control, 2014
Reproduction is authorised, provided the source is acknowledged

SURVEILLANCE REPORT Healthcare-associated infections and antimicrobial use in long-term care facilities, April–May 2013
iii
Contents
Abbreviations ............................................................................................................................................... vi Executive summary ........................................................................................................................................ 1 Background and objectives ............................................................................................................................. 3 Methodology ................................................................................................................................................. 4
National participation ................................................................................................................................ 4 LTCF participation ..................................................................................................................................... 4 Representativeness of national samples of LTCFs ........................................................................................ 4 Data collection at LTCFs ............................................................................................................................ 5
Survey date ......................................................................................................................................... 5 Eligibility of residents ............................................................................................................................ 5 Protocol, data collectors and tools .......................................................................................................... 5 Local performance indicators ................................................................................................................. 5 Antimicrobial consumption data ............................................................................................................. 6 Antimicrobial resistance data ................................................................................................................. 6 Healthcare-associated infections ............................................................................................................ 6
National denominators .............................................................................................................................. 6 Training ................................................................................................................................................... 7 Data collectors.......................................................................................................................................... 7 Validation study ........................................................................................................................................ 8 Data analysis ............................................................................................................................................ 8
Definitions ........................................................................................................................................... 8 UTI module .......................................................................................................................................... 9
Results ........................................................................................................................................................ 10
Participation ........................................................................................................................................... 10 Characteristics of the general nursing homes, residential homes and mixed LTCFs ........................................ 10 Characteristics of the eligible LTCF population ........................................................................................... 13
Age and gender .................................................................................................................................. 13 Care load indicators ............................................................................................................................ 14 Risk factors ........................................................................................................................................ 16
LTCF medical care and coordination ......................................................................................................... 18 LTCF infection prevention and control practices and resources .................................................................... 20 Hand hygiene in the LTCFs ...................................................................................................................... 23 Antimicrobial stewardship resources ......................................................................................................... 25 Healthcare-associated infections and antimicrobial use ............................................................................... 28
Overview ........................................................................................................................................... 28 Characteristics of residents receiving antimicrobial(s) and/or presenting with HAI(s) ................................. 28
Healthcare-associated infections .............................................................................................................. 31 Prevalence of HAIs ............................................................................................................................. 31 Types of HAI ...................................................................................................................................... 32
Antimicrobial use .................................................................................................................................... 34 Prevalence of antimicrobial use ............................................................................................................ 34 Characteristics and indications for antimicrobial prescribing .................................................................... 36 Antimicrobial agents prescribed in the LTCFs ......................................................................................... 40
Isolated microorganisms and antimicrobial resistance................................................................................. 46 Validation study ...................................................................................................................................... 50 National denominators and burden estimates ............................................................................................ 51
Discussion and conclusions ........................................................................................................................... 53
National and local engagement and training .............................................................................................. 53 Healthcare-associated infections .............................................................................................................. 54 Antimicrobial use .................................................................................................................................... 54 Isolated microorganisms .......................................................................................................................... 55 Structure and process indicators .............................................................................................................. 55 Burden estimates .................................................................................................................................... 56 Future steps and recommendations .......................................................................................................... 56
References .................................................................................................................................................. 57

Healthcare-associated infections and antimicrobial use in long-term care facilities, April–May 2013 SURVEILLANCE REPORT
iv
Figures
Figure 1. How data were collected in respondent countries during HALT-2 PPS, 2013 .......................................... 8 Figure 2. National representativeness of LTCF sample, HALT-2, 2013 ............................................................... 12 Figure 3. Median percentage of beds in the included LTCFs that were in single rooms, HALT-2, 2013 .................. 13 Figure 4. Prevalence of incontinence (faecal and/or urine) in the eligible LTCF population by country, HALT-2, 2013 .................................................................................................................................................................. 15 Figure 5. Prevalence of disorientation (in time and/or space) in the eligible LTCF population by country, HALT-2, 2013 ........................................................................................................................................................... 15 Figure 6. Prevalence of impaired mobility (wheelchair bound or bedridden) in the eligible LTCF population by country, HALT-2, 2013 ................................................................................................................................. 16 Figure 7. Prevalence of urinary catheter use in the eligible LTCF population by country, HALT-2, 2013 ................ 16 Figure 8. Prevalence of vascular catheter use in the eligible LTCF population by country, HALT-2, 2013............... 17 Figure 9. Prevalence of recent surgery among the eligible LTCF population by country, HALT-2, 2013 ................. 17 Figure 10. Prevalence of pressure sores in the eligible LTCF population by country, HALT-2, 2013 ...................... 18 Figure 11. Prevalence of ‘other wounds’ in the eligible LTCF population by country, HALT-2, 2013 ...................... 18 Figure 12. Tasks performed by the coordinating physician: overall frequencies, HALT-2, 2013 ............................ 20 Figure 13. Percentage of included LTCFs with an infection prevention and control committee, HALT-2, 2013 ....... 21 Figure 14. Percentage of included LTCFs with written protocols for all five selected infection prevention and control protocols, HALT-2, 2013 ............................................................................................................................... 22 Figure 15. Percentage of LTCFs with written protocols for MRSA and/or other multidrug-resistant microorganisms, HALT-2, 2013 .............................................................................................................................................. 22 Figure 16. Infection prevention and control (IPC) practices present in the included LTCFs, HALT-2, 2013 ............ 23 Figure 17. Alcohol-based hand rub use (litres per 1 000 resident-days) in the previous year in the included LTCFs, HALT-2, 2013 .............................................................................................................................................. 24 Figure 18. Percentage of the included LTCFs reporting having ‘none’ of 10 selected antimicrobial stewardship elements in place, HALT-2, 2013 ................................................................................................................... 26 Figure 19. Percentage of the included LTCFs with written therapeutic guidelines for UTIs, RTIs and wound and soft tissue infections, HALT-2, 2013 ..................................................................................................................... 27 Figure 20. Percentage of the included LTCFs with surveillance programmes for HAIs, HALT-2, 2013 .................... 27 Figure 21. Proportionate Euler diagram of the number of residents receiving an antimicrobial and/or afflicted with healthcare-associated infection(s) within the eligible LTCF population ............................................................... 28 Figure 21. Prevalence of care load indicators and risk factors among LTCF residents receiving an antimicrobial, among LTCF residents with an HAI and in the total eligible LTCF population, HALT-2, 2013 ................................ 30 Figure 22. Prevalence of eligible LTCF residents with at least one HAI, by country, HALT-2, 2013 ....................... 32 Figure 23. Distribution of types of HAI in the included LTCFs, HALT-2, 2013 ..................................................... 33 Figure 24. Prevalence of eligible LTCF residents receiving at least one antimicrobial agent on the day of the PPS, HALT-2, 2013 .............................................................................................................................................. 35 Figure 25. Prevalence of eligible LTCF residents receiving at least one antimicrobial agent, by country, HALT-2, 2013 ........................................................................................................................................................... 35 Figure 26. Indication for antimicrobial use, by country, HALT-2, 2013 ............................................................... 37 Figure 27. Site of diagnosis for antimicrobial use, by country, HALT-2, 2013 ..................................................... 38 Figure 28. Percentage of antimicrobials prescribed for uroprophylaxis, HALT-2, 2013 ......................................... 40 Figure 29. Distribution of use of antibacterials for systemic use (ATC J01), HALT-2, 2013 ................................... 40 Figure 30. Distribution of use of antibacterials for systemic use (ATC J01), by country, HALT-2, 2013 ................. 41 Figure 31. Distribution of use of penicillins (ATC J01C), by country, HALT-2, 2013 ............................................. 43 Figure 32. Distribution of use of other antibacterials (ATC J01X), by country, HALT-2, 2013 ............................... 44 Figure 33. Quinolone antibacterials (ATC J01M) as a percentage of all used antimicrobials (J01) on the day of the PPS HALT-2, 2013 ........................................................................................................................................ 45 Figure 34. Distribution of use of other beta-lactams (ATC J01D), by country, HALT-2, 2013 ................................ 46 Figure 35. Percentage of microbiological samples from residents who received at least one antimicrobial and had a non-negative test for microorganisms, HALT-2, 2013 ...................................................................................... 47 Figure 36. Antimicrobial resistance of the selected bug–drug combinations, by country, HALT-2, 2013 ................ 49

SURVEILLANCE REPORT Healthcare-associated infections and antimicrobial use in long-term care facilities, April–May 2013
v
Tables
Table 1. Persons performing data collection at the included LTCFs during the HALT-2 PPS, 2013 .......................... 8 Table 2. Amendments to HALT-2 UTI data using optional ‘UTI module’ data, in countries that used the module ..... 9 Table 3. Types and numbers of LTCFs that performed the PPS, by country, HALT-2, 2013 ................................. 10 Table 4. Number of LTCFs and beds, nationally and in LTCF categories selected for analysis, by country, HALT-2, 2013 ........................................................................................................................................................... 11 Table 5. Ownership, size and percentage of singles rooms in the included LTCFs, and the median percentage of hospitalised residents, by country, HALT-2, 2013 ............................................................................................ 12 Table 6. Total number of eligible LTCF residents and percentage of male residents and residents older than 85 years in the included LTCFs, by country, HALT-2, 2013 ................................................................................... 13 Table 7. Distribution of care load indicators and risk factors of residents in the included LTCFs, HALT-2, 2013 ..... 14 Table 8. Medical care and coordination in the included LTCFs, by country, HALT-2, 2013 ................................... 19 Table 9. Overview of infection prevention and control (IPC) resources and protocols available in the included LTCFs, by country, HALT-2, 2013 .................................................................................................................. 20 Table 10. Hand hygiene methods, products and training in the included LTCFs, by country, HALT-2, 2013 ........... 23 Table 11. Antimicrobial stewardship elements present in the included LTCFs, by country, HALT-2, 2013 .............. 25 Table 12. Available written therapeutic antimicrobial guidelines and surveillance programmes in the included LTCFs, by country, HALT-2, 2013 ............................................................................................................................. 26 Table 13. Age and gender of the LTCF residents presenting an HAI and of the LTCF residents receiving an antimicrobial, by country, HALT-2, 2013......................................................................................................... 28 Table 14. Length of stay, recent hospitalisation, care load indicators and risk factors among LTCF residents with an HAI and among LTCF residents receiving an antimicrobial, by country, HALT-2, 2013 ........................................ 30 Table 15. Number and prevalence of LTCF residents with at least one HAI on the day of survey, by country, HALT-2, 2013 ....................................................................................................................................................... 31 Table 16. Distribution of types of HAI (number and relative frequency) in the included LTCFs, by country, HALT-2, 2013 ........................................................................................................................................................... 33 Table 17. Number and prevalence of eligible LTCF residents receiving at least one antimicrobial agent on the day of the PPS, by country, HALT-2, 2013 ................................................................................................................ 36 Table 18. Indications for antimicrobial prescribing in the included LTCFs, by country, HALT-2, 2013 .................... 38 Table 18. Indications for antimicrobial prescribing in the included LTCFs, by country, HALT-2, 2013 (continued) .. 39 Table 19. Distribution of use of antibacterials for systemic use (ATC J01) in the included LTCFs, by country, HALT-2, 2013 .............................................................................................................................................. 41 Table 20. Number of courses of antimicrobials for treatment or prophylaxis, with a microbiological sample taken and with culture results in the included LTCFs, by country, HALT-2, 2013 ......................................................... 46 Table 21. Antimicrobial resistance markers in selected microorganisms, HALT-2, 2013 ....................................... 48 Table 22. Sensitivity and sensitivity of data on HAIs, antimicrobial use and institutional performance indicators in countries participating in the validation study, HALT-2, 2013 ........................................................................... 51 Table 23. Number of LTCFs and LTCF beds in general nursing homes, residential homes and mixed LTCFs, by country, HALT-2, 2013 ................................................................................................................................. 51

Healthcare-associated infections and antimicrobial use in long-term care facilities, April–May 2013 SURVEILLANCE REPORT
vi
Abbreviations
AU Antimicrobial use
CP Coordinating physician
EEA European Economic Area
ECDC European Centre for Disease Prevention and Control
ESAC-NH European Surveillance of Antimicrobial Consumption – Nursing Home subproject
EU European Union
GP General practitioner
GI Gastrointestinal infection
HAI Healthcare-associated infection
HAI-Net Healthcare-Associated Infections Surveillance Network
HALT Healthcare-Associated Infections in European Long-Term Care Facilities Project
HALT-2 Healthcare-Associated Infections and Antimicrobial Use in European Long-Term Care Facilities Project
IPC Infection prevention and control
IPSE Improving Patient Safety in Europe Project
LoS Length of stay
LTC Long-term care
LTCF Long-term care facility
MDRO Multidrug-resistant organism
MRSA Meticillin-resistant Staphylococcus aureus
NC National centre
NH Nursing home
NR National representative
PI Performance indicator
PPS Point prevalence survey
R Resistant
RH Residential home
RTI Respiratory tract infection
S Susceptible
SSI Surgical site infection
UK United Kingdom
UTI Urinary tract infection

SURVEILLANCE REPORT Healthcare-associated infections and antimicrobial use in long-term care facilities, April–May 2013
1
Executive summary
Between April and May 2013, 1 181 long-term care facilities (LTCFs) in 19 European countries (including three UK administrations) participated in the HALT-2 point prevalence survey (PPS) of healthcare-associated infections (HAIs) and antimicrobial use in European LTCFs. This was the second time a Europe-wide PPS in LTCFs was organised. In 2010, a first survey (HALT) was conducted in 722 LTCFs across 28 European countries (including four UK administrations).
A two-day train-the-trainers course was organised to familiarise the national representatives from participating countries with HALT-2’s curriculum and training materials so that they could deliver a national one-day training course for their countries’ data collectors.
Data were collected from each LTCF on a single day, either by a local or by an external data collector, i.e. a person from the LTCF or recruited by the national centre. Two types of questionnaires had to be completed: an institutional questionnaire and a resident questionnaire. One institutional questionnaire was completed per LTCF, and one resident questionnaire was completed for each resident on a course of systemic antimicrobial(s) and/or
presenting signs or symptoms of an active HAI on the day of the PPS. These data were entered into dedicated stand-alone HALT-2 software.
Countries were encouraged to draw a representative sample of LTCFs but, given the large variety in LTCFs within one country, the high number of eligible LTCFs and the limited resources both at the national and institutional level, none of the countries were able to obtain such a representative sample. National representativeness of the LTCF sample was evaluated and categorised into three levels (good, poor and very poor), based on the number of included LTCFs. National representativeness of the LTCF sample was considered as good for 10 of the 19 countries, poor for five countries, and very poor for the remaining four countries.
All types of LTCFs were given the opportunity to participate in the survey. The majority of participating LTCFs were general nursing homes (64.5%), mixed LTCFs (19.1%), rehabilitation centres (5.8%), and residential homes (5.3%). The results presented in this report are based on a subset of LTCFs: the general nursing homes, residential homes and mixed LTCFs (in total, 1 056 ‘selected LTCFs’) to increase, as much as possible, homogeneity and therefore comparability, of data.
In total, 77 264 residents met the eligibility criteria, i.e. living fulltime in the LTCF since at least 24 hours and present at 8:00 a.m. on the day of the PPS. The majority of the residents were female (median: 71.0%) and older than 85 years (median: 49.1%). The distribution of care load indicators and risk factors for acquiring an HAI or for use of antimicrobials amongst the eligible population were investigated. The median prevalence of faecal and/or urinary incontinence in the selected LTCF residents was 66.7%, disorientation in time and/or space was 54.9%, and impaired mobility (wheelchair bound or bedridden) was 50.8%. The median prevalences of urinary catheter use, vascular catheter use and recent surgery (within 30 days prior to the PPS) were low (6.3%, 0% and 0%, respectively). Pressure sores and ‘other’ types of wounds were reported for a median of 4.2% and 7.7% eligible residents, respectively.
Medical residential care was mainly provided by general practitioners visiting the LTCF (58.5%) or by employed medical staff (25.6%). The median percentage of LTCFs with a medical doctor in charge of the coordination of the medical activities was 60.7%.
Three infection prevention and control (IPC) structures were explored: presence of a person with training in IPC, access to IPC advice, and presence of an IPC committee. About one third (31.3%) of the LTCFs had all three structures, while 10% had none of these structures in place. Overall, 66.5% of the LTCFs had a person with training in IPC at their disposal, and 79.1% had access to IPC advice. While these percentages could be considered high, the institutional questionnaires did not gather information on the relative activity of these persons/committees in terms of time allocation (e.g. FTE of IPC staff per resident or LTCF, or the regularity of IPC committee meetings).
Almost all (95.9%) LTCFs reported having a written protocol for hand hygiene. Hand disinfection with an alcohol-based solution was the most frequently reported hand hygiene method (56.2% LTCFs). Other LTCFs most frequently used hand washing with an antiseptic soap (25.3%) or a non-antiseptic soap (18.5%). Liquid soap (antiseptic or otherwise) and alcohol-based rub solution were available in 98.2% and 90.7% of the LTCFs, respectively.
The three antimicrobial stewardship elements most commonly present in the LTCFs were ‘therapeutic formulary, comprising a list of antibiotics’ (median: 33.6%), ‘advice from a pharmacist for antimicrobials not included in the formulary’ (20.7%) and ‘written guidelines for appropriate antimicrobial use (good practice) in the facility’ (20.0%).
The crude prevalence of residents with at least one HAI was 3.4% (n=2 626 of 77 264), and ranged from 0.4% in
Croatia to 7.1% in Portugal. There were 2 753 HAIs reported, of which the most frequently reported types of HAI were respiratory tract infection (RTI; 31.2%), urinary tract infection (UTI; 31.2%) and skin infection (22.8%). With

Healthcare-associated infections and antimicrobial use in long-term care facilities, April–May 2013 SURVEILLANCE REPORT
2
a total number of 3.6 million LTCF beds (general nursing homes, residential homes and mixed LTCFs) in EU/EEA
countries, the total number of residents with at least one HAI on any given day was estimated at 116 416 residents. The total number of HAIs occurring every year in European LTCFs was estimated at 4.2 million HAIs.
The crude prevalence of residents receiving at least one antimicrobial agent was 4.4% (n=3 367 of 77 264). This ranged from 1.0% in Hungary to 12.1% in Greece. A total of 3 561 antimicrobial agents were used on the day of the PPS, the majority administered orally (87.3%). Antimicrobials were most frequently prescribed for the treatment of an infection (72.8%), with RTIs (39.0%), UTIs (35.1%) and skin or wound infections (16.0%) being the most treated infections. The remaining agents were prescribed prophylactically (27.2%) and served mainly to prevent the occurrence of UTIs (80.9%). The total number of residents receiving at least one antimicrobial on any given day in LTCFs in EU/EEA countries was estimated at 150 657 residents.
Antibacterials for systemic use (ATC group J01) represented 97.0% of all reported antimicrobials. Within this group, beta-lactams and penicillins (29.3%), other antibacterials (19.8%) and quinolones (16.0%) were the most commonly used classes.
The results contained in this report are subject to limitations and restrained by certain biases. From the EU register of LTCFs and LTCF beds, it is evident that various types of facilities exist across the EU countries and that one definition cannot capture the whole concept of long-term care. In addition, national representativeness of the data was poor in 47% of the countries. Furthermore, the countries with larger numbers of participating LTCFs did not use a representative sampling methodology. Most LTCFs participated on a voluntary basis, which is likely to have resulted in a selection of LTCFs with higher awareness about prevention and control of HAIs and antimicrobial resistance.
The PPS served as a tool to increase awareness and prevention of HAIs in LTCFs at the local, national and European level, even in light of the limitations listed above. The training offered to LTCF staff provided an important step forward in the improvement of LTCF surveillance skills and awareness raising about prevention and control of HAIs and prudent antimicrobial use.
The collected PPS data provide a valuable insight into the HAI, antimicrobial use and IPC situation in participating countries and LTCFs in 2013. Reports were fed back to each participating LTCF and contained a detailed comparison of the LTCF’s results with those at the national and European level. This also allowed national representatives to compare their national results with European data. These reports were designed to increase awareness of the local situation, thus empowering LTCF staff to take targeted IPC actions.
In addition to these local benefits, evaluation by the European Commission of the progress of EU Member States towards implementation of the Council Recommendation (2009/C 151/01) on patient safety, including the prevention and control of HAIs [8], identified the following priority areas for those working at the national and EU level:
Extend patient safety strategies and programmes from hospital care to non-hospital care (Member State level).
Ensure adequate numbers of specialised IPC staff with time set aside for this task in hospitals and other healthcare institutions (Member State level).
Reinforce tailored basic IPC structures and practices in nursing homes and other LTCFs (Member State level).
Repeat national point prevalence surveys of HAIs as a means to monitor the burden of HAI in all types of healthcare institutions, to identify priorities and targets for intervention, to evaluate the impact of interventions and to raise awareness (Member State level).
Continue the development of guidance on the prevention and control of HAIs, including tailored guidance
for nursing homes and other LTCFs (EU level).
The following recommendations can be made for future PPSs in European LTCFs:
Continue monitoring of HAI and antimicrobial use using a standardised methodology across different countries.
Explore measures to increase the representativeness of the sampled LTCFs before the next survey(s) and to increase the number of participating countries and LTCFs.
Promote, with national authorities, the importance of having a good national/regional register of LTCFs and LTCF beds to enable calculation of burden estimates of HAIs and antimicrobial use in LTCFs.
Continue to provide training to LTCF staff to harmonise the interpretation of case definitions and to improve the IPC skills.
Perform further validation studies at national level giving special attention to HAI case definitions.

SURVEILLANCE REPORT Healthcare-associated infections and antimicrobial use in long-term care facilities, April–May 2013
3
Background and objectives
In Europe, different types of long-term care facilities (LTCFs) exist and a denomination, such as ‘nursing home’, can cover different realities. The population type, admission criteria, available resources, policies and aims of these LTCFs largely depend on each country’s available upstream (acute care, intermediate care) and downstream (e.g. home care, day centres) healthcare resources. Most countries have separate LTCFs for elderly (e.g. residential homes, nursing homes), physically disabled (sometimes younger population), mentally disabled and psychiatric care. In other countries, mixed LTCFs are the standard. Previous projects such as the Improving Patient Safety in Europe (IPSE) project, the ESAC nursing home study (2008) and the Healthcare-Associated Infections in Long-Term Care Facilities project (HALT) (2010), studied the number of LTCFs and LTCF beds by category in participating Member States, and found that LTCFs for elderly were the largest group in terms of beds1.
In 2008, the coordination of surveillance of HAIs in Europe was transferred to the European Centre for Disease Prevention and Control (ECDC), which created the Healthcare-Associated Infections Surveillance Network (HAI-Net). ECDC continued the surveillance of surgical site infections (SSIs) and HAIs in intensive care units (ICUs) and also created a protocol for Europe-wide point prevalence surveys (PPSs) of HAI and antimicrobial use in acute care
hospitals [1]. In December 2008, ECDC outsourced the HALT project to continue the efforts of IPSE’s Work Package 7 (a feasibility study of HAI surveillance in European nursing homes). The HALT project integrated variables from the European Surveillance of Antimicrobial Consumption in Nursing Homes (ESAC-NH) subproject into a protocol for repeated PPS in LTCFs, thus providing an integrated method for continued assessment of the prevalence of antimicrobial use and HAIs in log-term care settings [2].
In May–September 2010 as part of HALT, an Europe-wide PPS of 722 LTCFs (75% were nursing homes) in 28 European countries (including three UK administrations) was performed following a pilot survey in November 2009. The crude prevalence of systemic antimicrobial use was 4.9%; antimicrobial agents were mainly prescribed for the treatment of an infection (72% vs. 28% prophylaxis). Signs and symptoms of an infection were reported for 4.0% of the eligible infections, but these signs and symptoms only allowed confirmation using standard case definitions in a small portion of these residents (crude prevalence: 2.6%) [3]. Based on these numbers, ECDC estimated that at least 2.6 million HAIs occur each year in LTCFs in EU/European Economic Area (EEA) countries [4].
In 2011, ECDC outsourced the HALT-2 project to further implement this PPS methodology in LTCFs.
The overall aim of HALT-2 was to develop a standardised tool that enables to follow trends – at local (LTCF), national and European levels – of the prevalence of HAIs and antimicrobial use. For this purpose, HALT-2 promoted a European protocol, based on a repeated PPS design, to measure the prevalence of HAIs and antimicrobial use and related IPC performance indicators in European LTCFs. As a secondary objective, HALT-2 helped identify priorities for national and local intervention and enable monitoring of their implementation, thereby improving resident safety and the quality of care in European LTCFs [2].
1 Estimation from HALT (2010): >60 000 LTCFs and >3 million LTC beds for the elderly in Europe.

Healthcare-associated infections and antimicrobial use in long-term care facilities, April–May 2013 SURVEILLANCE REPORT
4
Methodology
National participation
In July 2012, ECDC sent an invitation to the HAI-Net contact points for the designation of one person per country as HALT-2 national representatives. On the request of the surveillance coordinator of the United Kingdom (UK), one representative per UK administration was appointed as well as a UK coordinator. As a consequence, data were collected independently for the UK administrations and reported separately. For simplicity, UK administrations are considered as countries in this report.
Nineteen national representatives performed the PPS in their country. The survey was held between April and May 2013 to be comparable with the HALT PPS (2010), i.e. both studies would be outside the winter period, with its higher infection and antimicrobial use rates.
LTCF participation
All types of LTCFs were given the opportunity to participate in the survey. The definition of a LTCF used in HALT-2 (and previously used in 2010 in HALT) was adapted from the definition of a ‘high-skilled nursing home’ originating in the IPSE project and used in the ESAC-NH PPS. Specifically, LTCFs were defined as facilities in which residents:
need constant supervision (24 hours); need ‘high-skilled nursing care’ (i.e. more than ‘basic’ nursing care and assistance for daily living); are medically stable and do not need constant ‘specialised medical care’ (i.e. administered by specialised
physicians); and do not need invasive medical procedures (e.g. ventilation).
The following types of facility were excluded:
hospital long-term care wards residential care (hotel; without any kind of nursing care), sheltered care houses, day centres, home-based
centres, resident flat and protected living.
After the survey, national representatives were requested to classify participating LTCFs according to (a) the type of LTCF, (b) the average length of stay in the LTCF and (c) the type of resident population. Minimal definitions were given; classification depended on the judgement of the national representative, not on the LTCF itself.
Ten categories of LTCF type were provided: general nursing home (NH), residential home (RH), psychiatric LTCF,
LTCF for mentally disabled persons, LTCF for physically disabled persons, rehabilitation centre, palliative care facility, sanatorium, mixed LTCF (all or some of the above) and ‘other’ type of LTCF.
For each participating LTCF, the average length of stay of residents was classified into five groups: temporary short (<3 months), temporary medium (3–12 months), temporary long (>12 months, not definitive), definitive stay (i.e. until the end of life) and ‘other’.
Each LTCF was assigned into one of the following eight types of resident population: mentally disabled persons only, physically disabled persons only, psychiatric residents only, rehabilitation only, convalescent only, intensive care only, all or some of the above, and ‘other’ resident population.
Representativeness of national samples of LTCFs
Countries were encouraged to draw a representative sample of national LTCFs, but none of the countries were able to draw such a sample. PPS results should ideally use data that are representative for all LTCFs of one
country/region. However, given the large variety in LTCFs within countries, the high number of eligible institutions,
The results presented in this report must be interpreted with caution. To increase homogeneity, and therefore also comparability of data, results are presented for only a
subset of LTCFs (‘selected LTCFs’), i.e. general nursing homes, residential homes and mixed LTCFs. Large differences in participation were observed between countries (range: 2 to 236 LTCFs per country).
Moreover, most countries included LTCFs based on a convenience sample, e.g. proximity to the national coordinating centre, public institutions, and voluntary participation.
For these reasons, the data presented in this report cannot be considered representative of the participating countries or the whole of Europe.

SURVEILLANCE REPORT Healthcare-associated infections and antimicrobial use in long-term care facilities, April–May 2013
5
the limited resources both at the national and institutional level, and the voluntary nature of the survey, this was
not feasible for many countries.
Sample representativeness was evaluated and categorised into four levels (very poor, poor, good and optimal).
Optimal • Representative systematic random sample of national LTCFs (none of the participating countries achieved this criterion).
Good • More than 25 LTCFs, thus including a sufficient number of residents. Poor
• Between five and 25 included LTCFs in countries with more than 25 LTCFs. • Less than five included LTCFs in countries with more than five LTCFs, but inclusion of 50–75% of all LTCFs or
occupied LTCF beds in the country. Very poor • Inclusion of less than five LTCFs, and less than 50% of all LTCFs and less than 50% of all occupied LTCF beds.
Data collection at LTCFs
Survey date
Data had to be collected on one single day between 1 April and 31 May 2013. In LTCFs with a large number of beds, data collection could be done on two or more consecutive days on the condition that all beds in one ward were surveyed on the same day.
Eligibility of residents
A resident was considered eligible for the study if they lived fulltime (i.e. 24/7) in the LTCF, had resided there for at least 24 hours and were present at 8:00 a.m. on the day of the PPS. Residents receiving chronic ambulatory care on a regular basis in the acute care hospital (e.g. haemodialysis, chemotherapy) were included in the PPS study, as long as they were not hospitalised (i.e. inpatient in an acute care hospital with hospital stay for at least 24 hours) on the day of the PPS.
Protocol, data collectors and tools
Revision of the HALT (2010) PPS protocol was discussed at the 2011 and 2012 annual meetings of ECDC’s Antimicrobial Resistance and Healthcare-Associated Infections (ARHAI) networks. The HALT-2 protocol was
finalised after the train-the-trainers course in February 2013 and distributed to national representatives by e-mail and published on the project’s public website (http://halt.wiv-isp.be).
Data were collected by either a local data collector (e.g. designated physician, IPC doctor/nurse, head nurse, etc.) or an external data collector recruited by the national representative (e.g. IPC doctor/nurse). Data collectors used two types of paper questionnaire to collect data:
An institutional questionnaire for each LTCF: structural and functional characteristics, denominator data and information about antimicrobial policies and IPC resources [15]. A ward list was offered to aid in the collection of denominator data for the entire LTCF eligible population.
A resident questionnaire for each eligible resident using antimicrobials and/or presenting signs/symptoms of active HAI on the day of the PPS [15]. A mandatory microorganism code list was provided for the section on microorganisms and antimicrobial resistance.
Data had to be entered into the ‘HALT-2 software tool’. This stand-alone software consists of two applications, one for national centres (NCs) and one for LTCFs. The NC application allows national survey coordinators to import, enter, review and, if necessary, complete or correct data from LTCFs. It also included a tool allowing NCs to generate the LTCF application. The LTCF application could be used by local data collectors to enter their HALT-2 PPS data, generate a summary report and export the data to their national centres.
Local performance indicators
One aim of HALT (2010) was to develop national and local structure and process indicators, or performance indicators (PIs) in infection prevention and control (IPC) and antimicrobial stewardship in participating countries and LTCFs. The process and results of this part of HALT (2010) have been published recently [16].
Indicators to measure current IPC practices in LTCFs, available IPC resources and infrastructure were collected by an institutional questionnaire. In HALT (2010), some PI questions were often left unanswered, possibly because the wording of these questions was difficult to understand. Equally, in some ‘check box’ questions, unanswered questions were difficult to distinguish from a ‘no’ answer.
For HALT-2, the PI questions were re-worded, while maintaining the same seven categories of PI questions as in
HALT: clinical governance (n=6 PIs), IPC parameters (n=7), hand hygiene (n=6), other protocols for IPC (n=6), antimicrobial stewardship (n=12), infection diagnosis/ laboratory support (n=3) and surveillance (n=4). The

Healthcare-associated infections and antimicrobial use in long-term care facilities, April–May 2013 SURVEILLANCE REPORT
6
protocol specified that the person completing the institutional questionnaire must be in charge of the LTCF and
that if they could not answer any question(s), they should forward the questionnaire to those that could to do so, e.g. for the antimicrobial stewardship questions.
Antimicrobial consumption data
The Anatomical Therapeutic Chemical (ATC) classification system of the World Health Organization Collaborating Centre for Drug Statistics Methodology was used to classify substances [5]. All oral, rectal, intramuscular (IM) and intravenous (IV) treatments with antibacterials and antimycotics for systemic use, antibiotic treatments by inhalation, and drugs for systemic treatment of tuberculosis were included. Antivirals for systemic use, antimicrobials for topical use, and antiseptics were excluded.
Antimicrobial resistance data
Antimicrobial resistance data collection in LTCFs was hampered by the low frequency of laboratory testing, limited accessibility of the test results and by differences in antimicrobial susceptibility testing across Europe. Nevertheless, the resident questionnaire was designed to collect the available information. If a microbiological culture was
performed to guide antimicrobial prescription, the three ‘most important’ isolated microorganisms were recorded and the antimicrobial susceptibility results corresponding to selected bug–drug combinations could be reported (see [15] for more information).
Healthcare-associated infections
In HALT (2010), instead of using case definitions from the start, data collectors were asked to collect data on any sign and/or symptom of infection on the resident questionnaire. During data analysis, case definitions were applied to confirm the infections, based on adapted McGeer criteria for the surveillance of infections in nursing homes [3,6].
However, a large proportion (40.4%) of the infections reported in HALT could not be confirmed by this method2. It
was impossible to determine whether this was due to a true absence of the signs and symptoms, or failure to report all present signs and symptoms during data collection or data entry.
For HALT-2, an alternative strategy was sought, and the decision was made to include decision algorithms in HALT-2’s questionnaires to simplify the identification of HAIs. These algorithms were based on case definitions of the US Centers for Disease Control and Prevention (CDC) and the Society for Healthcare Epidemiology of America
(SHEA) Long-Term Care Special Interest Group (LTCSIG) [7]. Minor adaptations were made because it was assumed that European LTCFs have more limited access to microbiological and laboratory tests than US long-term care institutions. Decision algorithms were integrated into the resident questionnaire [15].
To align with the protocol of the ECDC PPS for acute hospitals, the term ‘active HAI’ was used and defined as follows:
‘An infection is active when signs and symptoms of the infection are present on the survey date or if the signs and symptoms were present in the past and the resident is (still) receiving treatment for that infection on the survey date.’
Symptoms had to be new, or acutely worse, in an attempt to exclude chronic symptoms unrelated to acute infections, such as coughs or urinary urgency. Data collectors had to verify the presence of symptoms during the 14 days preceding the day of the PPS to determine whether treated infections matched HAI case definitions, and non-infectious causes had to be considered before a diagnosis of an HAI was made [15].
The onset of the symptoms had to occur >48 hours after the resident was admitted or re-admitted to the LTCF
(excluding infections already present or incubating at the time of (re-)admission). Surgical site infections (SSIs) were an exception. SSIs were excluded from this PPS if the onset of symptoms occurred within 30 days of an operation, or within one year of surgery involving an implant, as they were then considered as being hospital-acquired.
National denominators
A ‘European LTCF register survey’ was undertaken in parallel with the PPS as part of the HALT-2 project. Its aims and scope were to update the number of LTCFs and LTCF beds by category for each Member State as reported during HALT (2010) in order to measure differences between EU LTCFs and calculate the burden of HAI and antimicrobial use in European LTCFs.
2 In HALT (2010), 2 495 residents had signs or symptoms of an infection, 1 488 (59.6%) of which were confirmed through
application of adapted McGeer criteria during data analysis.

SURVEILLANCE REPORT Healthcare-associated infections and antimicrobial use in long-term care facilities, April–May 2013
7
A questionnaire was sent to national HALT coordinators in EU/EEA countries on 14 April 2013, to provide national
data by 30 June 2013. LTCFs were defined as ‘residential institutions that provide health/nursing care and related services to residents who are unable to function independently in the community. It classified LTCFs into five categories: (1) general nursing homes, (2) residential homes, (3) mixed LTCFs, (4) specialised LTCFs and (5) other LTCFs. Definitions for these categories were proposed by the HALT management team in consultation with national representatives. It is recognised that the characteristics of residents in each type of LTCF are neither strictly homogeneous, nor entirely consistent with the definitions, but this was deemed the most reliable way to gain a global overview of European LTCFs.
General nursing
home (type A)
A general nursing home is an institution where elderly stay temporarily (long or short) or permanently.
The residents in these NHs need medical and/or skilled nursing care and supervision 24 hours a day.
These LTCFs provide principally care to elderly with severe illnesses or injuries.
Specialised LTCFs
(type B)
Specialised LTCFs are specialised in one specific type of care, for example physical impairment, chronic
diseases such as multiple sclerosis, dementia, psychiatric illnesses, rehabilitation care, palliative care,
intensive care, etc.
Residential homes
(type C)
In residential homes, residents are unable to live independently. They require supervision and assistance
for the activities of daily living. These LTCFs usually include personal care, housekeeping and three meals
a day.
Mixed LTCFs
(type D)
These LTCFs provide different types of care in the same LTCFs (a mix of type A, B and C).
Other LTCFs
(type E)
Other facilities, not classifiable among the above-mentioned types of LTCF.
Training
Since in the HALT-2 protocol case definitions needed to be applied by the LTCF staff rather than collecting signs and symptoms of infections, increased attention needed to be given to training. It was recommended that national/regional coordinators organise at least one 1-day information and training session for local LTCF staff. In February 2013, a 2-day train-the-trainers course was delivered to national representatives (NR) who had expressed an interest in participating in the HALT-2 PPS to familiarise them with the HALT-2 documentation and training material.
The course curriculum included surveillance, how to run a training day, how to complete PPS questionnaires and apply case definitions, how to provide feedback, the validation study and the UTI module. The course format included presentations, small group work, frequently asked questions and discussion forums. During small group sessions, participants used sample case scenarios to complete resident questionnaires and work with the HALT-2 software tool. Feedback from participants was used to refine the training material for the training of both local and external data collectors.
Training material was made available to NRs through the project’s website, including the presentations and case scenarios. Following the HALT-2 PPS itself, a brief questionnaire collecting NRs’ experience of data collection and training was sent to the participating countries.
Staff from an estimated 1 072 facilities were trained in at least 60 training sessions using HALT-2 PPS training material. Some facilities’ training consisted only of an update (e.g. using HALT-2’s training case studies, available online) as their staff had participated in HALT (2010). In one other country, where all data collection was carried out by a member of the national/regional coordination team, no training was provided to staff of participating LTCFs.
Data collectors
Following the completion of the HALT-2 PPS, a brief questionnaire was sent to the NRs of the 19 participating countries to obtain information on training and data collection; 15 (79%) responded.
Twelve of the 15 responding countries had local LTCF staff participate in data collection, and three countries had only national teams collect data (Table 1 and Figure 1). In five countries, ‘other’ data collectors were involved in data collection. These were described as IPC nurses with responsibilities for multiple facilities, doctoral students, and external IPC nurses. In some cases countries stated that these ‘other’ data collectors worked with local staff in collecting the PPS data. Table 1 outlines the estimated percentage of facilities where local LTCF staff, national coordinators or ‘other’ staff collected data.

Healthcare-associated infections and antimicrobial use in long-term care facilities, April–May 2013 SURVEILLANCE REPORT
8
Table 1. Persons performing data collection at the included LTCFs during the HALT-2 PPS, 2013
(n=15 countries)
Estimated proportion of participating LTCFs visited by persons who collected data
Role of persons who collected data at the LTCFs during the PPS (n=number of countries)
Local LTCF staff National representative ‘Other’ data collectors
75–100% 6 3 1
50–74% 5 2 1
25–49% 1 0 2
1–24% 0 1 1
Total 12 6 5
Figure 1. How data were collected in respondent countries during HALT-2 PPS, 2013 (n=15)
Validation study
A data validation study was performed in 10 countries where a trained external data collector visited at least one LTCF on the same day as the PPS and conducted parallel, blinded data collection [11].
The protocol for the validation study was finalised in March 2013 following the train-the-trainers course. The main objectives of this validation study were to assess the validity of selected reported PIs, the accuracy of selected denominator data collected by European LTCFs, and the validity of the HAI and antimicrobial use data. The outcome measures were sensitivity, specificity, positive predictive value and negative predicted value.
Data analysis
Data were processed and analysed using Stata/SE 10.1 (StataCorp, 2009). Boxes in horizontal box plots present the median and interquartile range. Their adjacent lines indicate the boundary 1.5 times the interquartile range above/below the upper/lower quartiles. Values outside of these boundaries (i.e. outliers), when included, are plotted as individual values.
Definitions
The criteria defining ‘eligible residents’ are listed above (see Eligibility of residents). Selected LTCFs were defined as all LTCFs from general nursing homes, residential homes, or mixed LTCFs (see Results for full discussion, Table 3). For the purposes of this report, a ‘country’ is defined as a EU or EEA Member State, or one of the four UK administrations.
The crude prevalence of HAIs was defined as the total number of residents with at least one HAI detected on the day of the PPS in eligible residents in included LTCFs in HALT-2 per 100 eligible residents. Similarly, for antimicrobial use, crude prevalence is defined as the total number of eligible residents receiving at least one antimicrobial agent per 100 eligible residents on the day of the PPS. The ‘median’ of an indicator is the 50th percentile for that indicator in all included LTCFs in the entire HALT-2 dataset, e.g. the median HAI prevalence is the median of the HAI prevalences detected in all included LTCFs.
Antimicrobial resistance data were only collected for selected bug–drug combinations and were reported as the percentage of non-susceptible (intermediate or resistant) bacteria over the total number of isolates for which antimicrobial susceptibility testing results were available at the time of survey [15]. A cautious approach to
interpreting these figures is advisable. The access to microbiological tests in European LTCFs is limited and their results can differ greatly between countries.
National data collector only (A)
Local LTCF staff only (B)
National data collector and local LTCF staff (A+B)
Local LTCF and 'other' data collectors (B+C)

SURVEILLANCE REPORT Healthcare-associated infections and antimicrobial use in long-term care facilities, April–May 2013
9
Calculations of HAI burden, antimicrobial use burden, and ‘resident-days’ denominators assumed 95% bed
occupancy rates in included LTCFs.
UTI module
HALT (2010) identified that urinary tract infections (UTIs) were the second most common infection in European LTCFs (22.3% of all infections), and that almost half of all systemic antimicrobials were prescribed for an indication related to the urinary tract (48.9%). In response to these data, a ‘UTI module’ was developed for HALT-2 to explore the rationale for antimicrobial prescribing for UTI prevention/therapy at the individual resident level, and to investigate available resources for UTI infection prevention at national/institutional level.
The module consisted of a separate protocol including three additional questionnaires (gathering national, institutional, and resident level information), to be used in LTCFs in parallel to the main HALT-2 PPS, on the same survey day [15].
The module was used by nine of the 19 participating countries. Data from the UTI module and from the main PPS were compared at the local and/or national level, and mismatches and identified errors were corrected in the datasets. Data cleaning processes varied between countries: before data entry in some and after data entry (i.e. during data analysis) for others.
Corrections to the UTI module data added 24 UTI cases to the 531 originally reported by these nine countries (Table 2), i.e. 2.8% of the 856 cases reported by all participating countries, Table 16). This increased the crude prevalence of HAIs in these nine countries by 0.03%, but affects each participating country’s crude prevalence by 0.0–1.0% (Table 2). This bias is discussed further in the section ‘Discussion and conclusions’.
Table 2. Amendments to HALT-2 UTI data using optional ‘UTI module’ data, in countries that used the module (n=9 countries)
Country
Number of confirmed
UTIs
Number of probable UTIs
Crude prevalence of HAIs (%)
Overall changes
Wit
ho
ut
am
en
dm
en
t
Am
en
ded
usin
g
‘UT
I m
od
ule
’ d
ata
Wit
ho
ut
am
en
dm
en
t
Am
en
ded
usin
g
‘UT
I m
od
ule
’ d
ata
Wit
ho
ut
am
en
dm
en
t
Am
en
ded
usin
g
‘UT
I m
od
ule
’ d
ata
Belgium 57 57 54 54 - - No change**
Finland* 2 2 1 1 - - No change
Germany 10 11 111 116 2.4 2.5 +1 confirmed; +5 probable
Italy 89 89 101 104 3.3 3.3 +3 probable
Netherlands* 4 4 4 9 4.8 5.8 +5 probable
Portugal 23 28 34 35 9.3 9.5 +5 probable; +1 confirmed
Sweden 8 6 3 5 - - -2 confirmed; +2 probable
Slovenia* 0 0 0 0 - - No change
UK – Northern Ireland 8 8 22 26 5.5 5.8 +4 probable
Total 201 205 330 350 3.4 3.4 +4 confirmed; +20 probable
* Poor or very poor national representativeness of LTCF sample ** The ‘UTI module’ questionnaires were fully incorporated into Belgium’s HALT-2 PPS institution-level and resident-level questionnaires.

Healthcare-associated infections and antimicrobial use in long-term care facilities, April–May 2013 SURVEILLANCE REPORT
10
Results
Participation
Between April and May 2013, 1 181 LTCFs in 19 European countries (including three of the four UK administrations, considered as separate countries for the purposes of this report) conducted the PPS. The majority of these were general nursing homes (64.5%), mixed LTCFs (19.1%), rehabilitation centres (5.8%) and residential homes (5.3%) (Table 3). No sanatoria participated. Most participating LTCFs were for definitive stay (until end of life; 65.3%), or ‘temporary long stay’ (>12 months, not definitive; 19.1%).
Table 3. Types and numbers of LTCFs that performed the PPS, by country, HALT-2, 2013 (n=1 181 LTCFs)
Country
Type of LTCF
Gen
era
l n
urs
ing
ho
me
Resid
en
tial h
om
e
Mix
ed
LT
CF
Psych
iatr
ic L
TC
F
LT
CF f
or
the
men
tally d
isab
led
LT
CF f
or
the
ph
ysic
ally d
isab
led
Reh
ab
ilit
ati
on
cen
tre
Pallia
tive c
are
cen
tre
Oth
er
LT
CF
To
tal
n n n n n n n n n n
Belgium 87 1 88
Croatia 2 2
Czech Republic 8 1 1 10
Denmark 32 32
Finland 6 6
Germany 126 41 48 2 3 220
Greece 2 2
Hungary 78 12 1 91
Ireland 111 31 9 23 3 3 4 6 190
Italy 189 45 1 235
Malta 3 2 5
Netherlands 4 4
Norway 21 21
Portugal 73 65 5 143
Slovenia 1 1 2
Sweden 29 11 3 43
UK – England 16 16
UK – Northern Ireland 31 31
UK – Wales 40 40
Total 762 63 226 13 26 4 69 9 9 1 181
64.5% 5.3% 19.1% 1.1% 2.2% 0.3% 5.8% 0.8% 0.8% 100%
LTCF categories that were amalgamated for further analysis are highlighted green; those that were not included in further analyses are greyed out.
Characteristics of the general nursing homes, residential homes and mixed LTCFs To increase homogeneity and thus also comparability between countries, we selected the results from all general nursing homes (n=762), residential homes (n=63) and mixed LTCFs (n=226), and combined them for all analysis presented in this report (Table 3). In other words, n=1 051 of the 1 181 participating LTCFs were selected for analysis (89.0%).
Table 4 presents the number of the LTCFs and LTCF beds per country as well as those selected for analysis. In some countries, denominator data were estimates rather than exact figures (see section ‘National denominator and burden estimates’. None of the countries recruited a systematic random sample of national or regional LTCFs. The

SURVEILLANCE REPORT Healthcare-associated infections and antimicrobial use in long-term care facilities, April–May 2013
11
representativeness of data was good in 10 of 19 participating countries (53%), poor in 5 (26%), and very poor in
four (21%) (Table 4 and Figure 2).
Table 4. Number of LTCFs and beds, nationally and in LTCF categories selected for analysis, by country, HALT-2, 2013
Country
LT
CFs
in t
he c
ou
ntr
y*
LT
CFs s
ele
cte
d
for
inclu
sio
n in
HA
LT
-2**
LT
CF b
ed
s
in t
he c
ou
ntr
y*
Bed
s in
LT
CFs
sele
cte
d f
or
inclu
sio
n in
HA
LT
-2**
National representativeness of LTCF sample N n % N n %
Belgium 1 540 87 5.6 136 272 9 262 6.8 Good
Croatia 361 2 0.6 34 540 450 1.3 Very poor
Czech Republic 73 10 13.7 17 204 668 3.9 Poor
Denmark 2 600 32 1.2 90 181 1 301 1.4 Good
Finland 448 6 1.3 19 016 471 2.5 Poor
Germany 12 354 215 1.7 875 549 17 643 2.0 Good
Greece ND 2 - ND 319 - Very poor
Hungary 1 177 90 7.6 57 929 11 898 20.5 Good
Ireland 570 142 24.9 34 851 7 695 22.1 Good
Italy ND 234 - 285 007 18 624 6.5 Good
Malta 45 5 11.1 4 622 1 568 33.9 Poor
Netherlands 1 700 4 0.2 165 000 613 0.4 Very poor
Norway 991 21 2.1 41 415 1 387 3.3 Poor
Portugal 178 73 41.0 4 075 1 734 42.6 Good
Slovenia 90 1 1.1 20 777 202 1.0 Very poor
Sweden 2 766 40 1.4 101 000 1 459 1.4 Good
UK – England 17 473 16 0.1 468 658 413 0.1 Poor
UK – Northern Ireland 249 31 12.4 11 708 1 255 10.7 Good
UK – Wales 680 40 5.9 22 985 2 323 10.1 Good
Total 43 295 1 051 2.4 2 390 789 79 285 3.3
* Denominator data from the European LTCF register (see subsection ‘National denominators and burden estimates’ below) ** Aggregated data from general nursing homes, residential homes and mixed LTCFs ND: no data

Healthcare-associated infections and antimicrobial use in long-term care facilities, April–May 2013 SURVEILLANCE REPORT
12
Figure 2. National representativeness of LTCF sample, HALT-2, 2013
The mean size of the LTCFs included in this report was 80 beds. The majority of the LTCFs were private institutions (25.6% for profit, 32.2% non-profit), while 42.2% were public (Table 5).
The median size of the included LTCFs was 64 beds and varied from 23 beds in Portugal to 1 140 beds in Malta. The stay in these facilities was mostly defined as ‘definitive stay’ (until the end of life; 69.7%) or ‘temporary long’ (>12 months, not definitive; 20.4%). The resident population was almost entirely ‘mixed’ (98.8%).
The median percentage of single rooms (as a percentage of the total number of rooms) was 57.1%. This median percentage was low (less than 10%) in the Czech Republic, Greece, and Hungary, and reached 100% in Denmark, the Netherlands, Norway, Sweden, England and UK – Wales (Table 5). The median percentage of single room beds
(as a percentage of the total number of beds) was 38.6%, with a distribution that was similar to the median percentage of single rooms (Figure 3).
The overall median percentage of residents hospitalised at the time of the survey for all included LTCFs was low (0.6%); it was highest (>1.5%) in Croatia, Germany, Greece, Hungary, Slovenia and UK – Northern Ireland.
Table 5. Ownership, size and percentage of singles rooms in the included LTCFs, and the median percentage of hospitalised residents, by country, HALT-2, 2013
Country
Inclu
ded
LT
CFs
Pu
blic L
TC
Fs
Bed
s in
in
clu
ded
LT
CFs
Size of included LTCFs (n of beds) M
ed
ian
perc
en
tag
e o
f
sin
gle
ro
om
s
Med
ian
perc
en
tag
e o
f
ho
sp
italised
resid
en
ts
n % n Min Mean Median Max % %
Belgium 87 43.7 9 262 42 108.2 100 263 95.5 1.0
Croatia* 2 100 450 170 229.5 230 289 48.2 1.8
Czech Republic* 10 70.0 668 40 72.5 69 115 9.8 0.0
Denmark 32 100 1 301 25 55.4 53 111 100.0 0.0
Finland * 6 100 471 44 79.7 61 181 44.0 0.0
Germany 215 10.8 17 643 19 88.7 81 316 79.1 2.2
Greece* 2 0.0 319 125 187.5 188 250 6.0 3.3
Hungary 90 68.9 11 898 26 137.3 103 690 5.5 1.7
Ireland 142 66.2 7 695 13 58.5 50 203 54.2 0.0
Italy 234 48.9 18 624 13 84.0 74 589 10.7 0.0
Malta* 5 80.0 1 568 46 315.4 123 1 140 26.6 0.0
Netherlands* 4 100 613 136 166.3 167 195 100.0 0.6
Norway* 21 85.7 1 387 16 69.0 59 144 100.0 0.0
Portugal 73 5.5 1 734 9 24.2 23 58 22.2 0.0

SURVEILLANCE REPORT Healthcare-associated infections and antimicrobial use in long-term care facilities, April–May 2013
13
Country
Inclu
ded
LT
CFs
Pu
blic L
TC
Fs
Bed
s in
in
clu
ded
LT
CFs
Size of included LTCFs (n of beds) M
ed
ian
perc
en
tag
e o
f
sin
gle
ro
om
s
Med
ian
perc
en
tag
e o
f
ho
sp
italised
resid
en
ts
n % n Min Mean Median Max % %
Slovenia* 1 100 202 205 205.0 205 205 32.3 1.5
Sweden 40 80.0 1 459 5 38.2 36 128 100.0 0.0
UK – England* 16 0.0 413 8 28.8 30 49 100.0 0.0
UK – Northern Ireland 31 0.0 1 255 12 46.5 44 87 100.0 2.0
UK – Wales 40 2.5 2 323 20 63.9 58 129 94.0 0.0
Total 1 051 42.2 79 285 5 80.1 64 1 140 57.1 0.6
* Poor or very poor national representativeness of the LTCF sample
Figure 3. Median percentage of beds in the included LTCFs that were in single rooms, HALT-2, 2013
* Poor or very poor national representativeness of LTCF sample
Characteristics of the eligible LTCF population
Age and gender
There were 77 264 residents that met the eligibility criteria, i.e. present at 8:00 a.m. on the PPS day and living fulltime in the LTCF for >24 hours. The country total varied greatly between countries, from 202 residents in Slovenia to 18 371 in Italy (Table 6).
The majority of the eligible resident population were female (crude mean: 69.3%). Half of the eligible residents were older than 85 years (crude median percentage: 49.1%). Belgium and Norway had the highest median percentage of residents older than 85 years (62.2% and 61.9%, respectively); it was lowest in Greece (8.5%), Hungary (24.8%) and Portugal (26.7%) (Table 6).
Table 6. Total number of eligible LTCF residents and percentage of male residents and residents older than 85 years in the included LTCFs, by country, HALT-2, 2013
Country
No. eligible LTCF
residents
% male residents % residents older than 85 years
Min Mean Median Max Min Mean Median Max
Belgium 8 756 8.1 24.8 23.9 51.7 29.0 60.2 62.2 79.0
Croatia* 447 26.4 26.9 26.9 27.5 40.8 43.1 43.1 45.4
Czech Republic* 662 26.3 40.6 41.4 65.0 23.4 40.4 37.3 82.5
Denmark 1 265 18.8 34.3 33.9 50.0 27.3 51.0 52.1 75.0
Healthcare-associated infections and antimicrobial use in long-term care facilities, April–May 2013 SURVEILLANCE REPORT
14
Country
No. eligible LTCF
residents
% male residents % residents older than 85 years
Min Mean Median Max Min Mean Median Max
Finland * 467 17.5 26.8 27.2 34.1 42.1 48.8 46.0 67.2
Germany 16 768 2.7 26.5 24.7 96.4 0.0 49.0 51.5 87.8
Greece* 309 40.7 52.4 52.4 64.2 2.1 8.5 8.5 15.0
Hungary 11 824 0.0 33.9 31.6 88.0 0.0 25.7 24.8 76.3
Ireland 7 535 0.0 35.4 34.8 79.3 0.0 45.2 45.8 91.7
Italy 18 371 0.0 27.6 26.5 100.0 4.2 50.4 51.2 100.0
Malta* 1 558 14.1 20.9 23.0 26.9 42.6 49.8 48.4 57.8
Netherlands* 623 29.9 37.0 37.3 43.4 23.8 40.6 44.6 49.6
Norway* 1 374 17.5 33.0 32.4 50.0 31.3 58.7 61.9 81.7
Portugal 1 717 16.7 39.9 40.0 78.6 0.0 26.8 26.7 68.8
Slovenia* 202 22.8 22.8 22.8 22.8 48.5 48.5 48.5 48.5
Sweden 1 432 0.0 31.2 32.7 53.3 0.0 52.4 57.5 81.8
UK – England* 409 7.7 36.2 25.2 91.4 0.0 45.6 54.7 80.8
UK – Northern Ireland 1 243 6.1 32.6 30.8 63.6 0.0 46.4 50.0 75.0
UK – Wales 2 302 10.5 32.4 28.6 59.4 0.0 55.5 57.4 92.6
Total 77 264 0.0 30.7 29.0 100 0.0 46.5 49.1 100
* Poor or very poor national representativeness of LTCF sample
Care load indicators
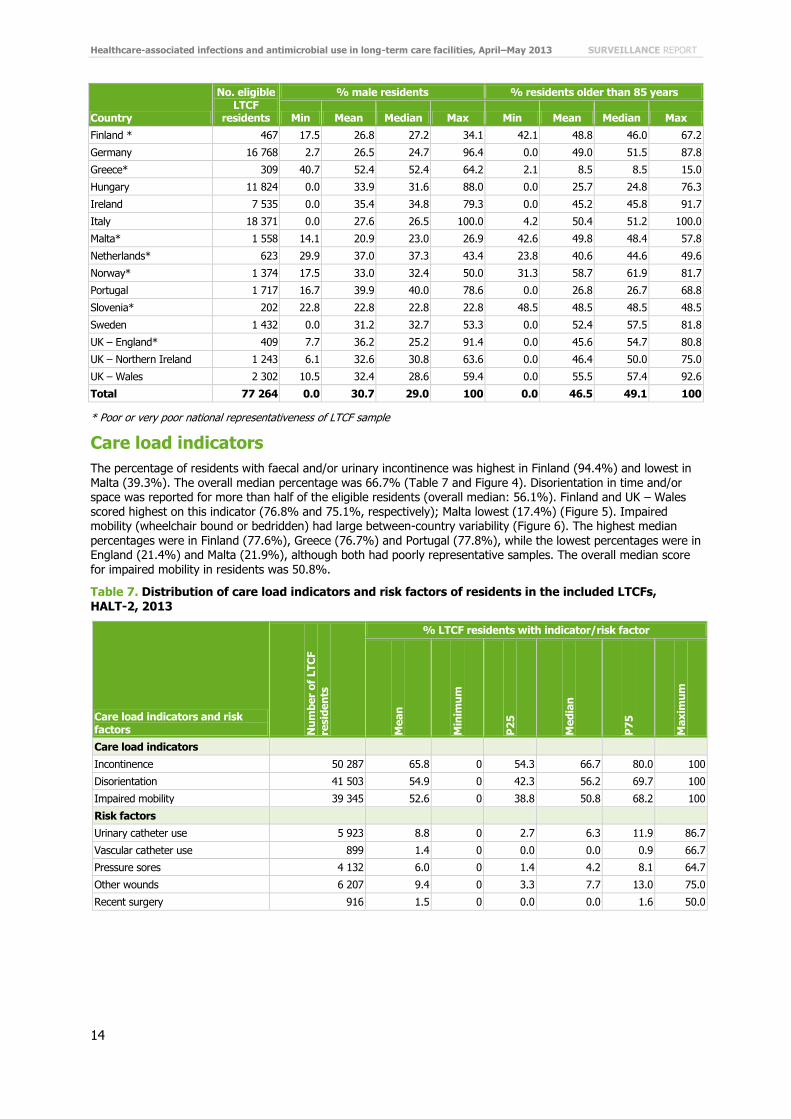
The percentage of residents with faecal and/or urinary incontinence was highest in Finland (94.4%) and lowest in Malta (39.3%). The overall median percentage was 66.7% (Table 7 and Figure 4). Disorientation in time and/or space was reported for more than half of the eligible residents (overall median: 56.1%). Finland and UK – Wales scored highest on this indicator (76.8% and 75.1%, respectively); Malta lowest (17.4%) (Figure 5). Impaired mobility (wheelchair bound or bedridden) had large between-country variability (Figure 6). The highest median
percentages were in Finland (77.6%), Greece (76.7%) and Portugal (77.8%), while the lowest percentages were in England (21.4%) and Malta (21.9%), although both had poorly representative samples. The overall median score for impaired mobility in residents was 50.8%.
Table 7. Distribution of care load indicators and risk factors of residents in the included LTCFs, HALT-2, 2013
Care load indicators and risk factors N
um
ber
of
LT
CF
resid
en
ts
% LTCF residents with indicator/risk factor
Mean
Min
imu
m
P2
5
Med
ian
P7
5
Max
imu
m
Care load indicators
Incontinence 50 287 65.8 0 54.3 66.7 80.0 100
Disorientation 41 503 54.9 0 42.3 56.2 69.7 100
Impaired mobility 39 345 52.6 0 38.8 50.8 68.2 100
Risk factors
Urinary catheter use 5 923 8.8 0 2.7 6.3 11.9 86.7
Vascular catheter use 899 1.4 0 0.0 0.0 0.9 66.7
Pressure sores 4 132 6.0 0 1.4 4.2 8.1 64.7
Other wounds 6 207 9.4 0 3.3 7.7 13.0 75.0
Recent surgery 916 1.5 0 0.0 0.0 1.6 50.0

SURVEILLANCE REPORT Healthcare-associated infections and antimicrobial use in long-term care facilities, April–May 2013
15
Figure 4. Prevalence of incontinence (faecal and/or urine) in the eligible LTCF population by country,
HALT-2, 2013
* Poor or very poor national representativeness of LTCF sample; red vertical line: crude median (66.7%), no outliers. Box plots indicate the 25th, 50th (median) and 75th percentiles; adjacent lines indicate the boundary 1.5x the interquartile range.
Figure 5. Prevalence of disorientation (in time and/or space) in the eligible LTCF population by country, HALT-2, 2013
* Poor or very poor national representativeness of LTCF sample; red vertical line: crude median (56.1%), no outliers. Box plots indicate the 25th, 50th (median) and 75th percentiles; adjacent lines indicate the boundary 1.5x the interquartile range.

Healthcare-associated infections and antimicrobial use in long-term care facilities, April–May 2013 SURVEILLANCE REPORT
16
Figure 6. Prevalence of impaired mobility (wheelchair bound or bedridden) in the eligible LTCF
population by country, HALT-2, 2013
* Poor or very poor national representativeness of LTCF sample; red vertical line: crude median (50.8%), no outliers. Box plots indicate the 25th, 50th (median) and 75th percentiles; adjacent lines indicate the boundary 1.5x the interquartile range.
Risk factors
During the HALT-2 PPS five risk factors for the acquisition of HAIs and antimicrobial use were explored: urinary and vascular catheter use, pressure sores, ‘other wounds’ and surgery <30 days prior to the PPS (Table 7).
The overall median percentage of urinary catheter use was low (6.3%), whilst it was reported by 33.3% and 17.9%
of participating LTCFs in the Czech Republic and Greece, respectively (Figure 7).
Figure 7. Prevalence of urinary catheter use in the eligible LTCF population by country, HALT-2, 2013
* Poor or very poor national representativeness of LTCF sample; red vertical line: crude median (6.3%), no outliers. Box plots indicate the 25th, 50th (median) and 75th percentiles; adjacent lines indicate the boundary 1.5x the interquartile range.
The overall median percentage of vascular catheter use and recent surgery was 0% (crude mean: 1.4% and 1.5%, respectively) (Table 7). However, higher median percentages of vascular catheter use were reported by LTCFs in the Czech Republic (5.9%), Greece (8.7%) and Italy (1.8%) (Figure 8). LTCFs in the Czech Republic, the Netherlands and Greece reported the highest median rates for recent surgery (8.2%, 6.9% and 5.7%, respectively) (Figure 9).

SURVEILLANCE REPORT Healthcare-associated infections and antimicrobial use in long-term care facilities, April–May 2013
17
Figure 8. Prevalence of vascular catheter use in the eligible LTCF population by country, HALT-2,
2013
* Poor or very poor national representativeness of LTCF sample; red vertical line: crude median (0.0%), no outliers. Box plots indicate the 25th, 50th (median) and 75th percentiles; adjacent lines indicate the boundary 1.5x the interquartile range.
Figure 9. Prevalence of recent surgery among the eligible LTCF population by country, HALT-2, 2013
* Poor or very poor national representativeness of LTCF sample; red vertical line: crude median (0.0%), no outliers. Box plots indicate the 25th, 50th (median) and 75th percentiles; adjacent lines indicate the boundary 1.5x the interquartile range.
The overall median prevalence was 4.2% for pressure sores and 7.7% for other wounds (i.e. wounds other than pressure sores e.g. leg ulcers, traumatic or surgical wounds, insertion sites for gastrostomy, tracheostomy) (Table 7, Figure 10 and Figure 11). The highest median prevalence of pressure sores were observed in the Czech Republic (16.5%) and Portugal (11.1%). Hungary reported a low median prevalence for both wound groups: 1.3% for pressure sores and 1.9% for other wounds (Figure 10 and Figure 11).

Healthcare-associated infections and antimicrobial use in long-term care facilities, April–May 2013 SURVEILLANCE REPORT
18
Figure 10. Prevalence of pressure sores in the eligible LTCF population by country, HALT-2, 2013
* Poor or very poor national representativeness of LTCF sample; red vertical line: crude median (4.2%), no outliers. Box plots indicate the 25th, 50th (median) and 75th percentiles; adjacent lines indicate the boundary 1.5x the interquartile range.
Figure 11. Prevalence of ‘other wounds’ in the eligible LTCF population by country, HALT-2, 2013
* Poor or very poor national representativeness of LTCF sample; red vertical line: crude median (7.7%), no outliers. ‘Other wounds’ are wounds other than pressure sores e.g. leg ulcers, traumatic or surgical wounds, insertion sites for gastrostomy, tracheostomy. Box plots indicate the 25th, 50th (median) and 75th percentiles; adjacent lines indicate the boundary 1.5x the interquartile range.
LTCF medical care and coordination
Medical care for residents was mainly provided by general practitioners (GPs) visiting the LTCF (58.4%), or by employed medical staff (25.6%); 16.0% facilities reported that visiting GPs and employed medical staff provided care. In six countries (Croatia, Denmark, Slovenia, Sweden, UK – Northern Ireland, and UK – Wales) medical resident care was provided by GPs only, while in Greece and the Netherlands employed medical staff took on this task (Table 8).
In 39.3% of institutions, there was no medical doctor in charge of coordinating medical activities. All participating LTCFs in Croatia, the Czech Republic, Finland, Greece, the Netherlands, Slovenia and Sweden did have a coordinating physician appointed at the time of the survey, while none in UK – Wales reported having such a
coordinator (Table 8). In the 60.7% LTCF that reported having a medical doctor in charge of such activities, the

SURVEILLANCE REPORT Healthcare-associated infections and antimicrobial use in long-term care facilities, April–May 2013
19
physician was either from the LTCF itself (48.3%), from outside the facility (42.5%) or worked both inside and
outside the facility (9.2%).
Table 8. Medical care and coordination in the included LTCFs, by country, HALT-2, 2013
Country
Medical care providers
Co
ord
inati
ng
ph
ysic
ian
(C
P)
Tasks of the coordinating physician
GP
s o
nly
Em
plo
yed
med
ical sta
ff
Bo
th G
Ps a
nd
em
plo
yed
med
ical sta
ff
Nu
mb
er
of
tim
es t
asks
were
rep
ort
ed
Develo
pm
en
t o
f
an
AM
po
licy
***
Develo
pm
en
t o
f
care
str
ate
gie
s
Develo
pm
en
t o
f
IPC
po
licy
Co
ord
inati
on
of
vaccin
ati
on
po
licy
% LTCFs with this medical care/coordination** % % % %
Belgium 86.2 1.2 12.6 98.9 85 62.4 49.4 72.9 87.1
Croatia* 100 0.0 0.0 100 2 0.0 50.0 50.0 100
Czech Republic* 0.0 90.0 10.0 100 10 50.0 40.0 60.0 40.0
Denmark 100 0.0 0.0 6.3 2 0.0 0.0 0.0 50.0
Finland * 0.0 66.7 33.3 100 6 100 66.7 83.3 66.7
Germany 92.6 0.5 7.0 37.7 81 0.0 2.5 3.7 55.6
Greece* 0.0 100 0.0 100 2 50.0 100 50.0 50.0
Hungary 37.8 35.6 26.7 78.9 71 18.3 8.5 11.3 59.2
Ireland 46.5 34.5 19.0 41.6 58 13.8 27.6 12.1 50.0
Italy 32.9 39.3 27.8 70.9 161 39.1 70.2 49.1 70.2
Malta* 20.0 0.0 80.0 40.0 2 0.0 50.0 0.0 0.0
Netherlands* 0.0 100 0.0 100 4 75.0 50.0 100 100
Norway* 0.0 38.1 61.9 76.2 16 31.3 25.0 56.3 68.8
Portugal 1.4 91.8 6.9 94.5 69 47.8 84.1 63.8 69.6
Slovenia* 100 0.0 0.0 100 1 0.0 0.0 0.0 100
Sweden 100 0.0 0.0 100 40 10.0 32.5 67.5 62.5
UK – England* 93.8 0.0 6.3 68.8 10 10.0 10.0 10.0 10.0
UK – Northern Ireland 100 0.0 0.0 32.3 10 0.0 10.0 10.0 0.0
UK – Wales 100 0.0 0.0 0.0 0 NA NA NA NA
Total 58.4 25.6 16.0 60.7 630 31.0 42.9 41.0 64.3
* Poor or very poor national representativeness of LTCF sample ** Missing values excluded from calculation *** Note that in some countries the responsibility for prescription policies does not reside with the coordinating physician, e.g. in Sweden the policies are set at county level. AM: antimicrobial; ICP: infection prevention and control; GP: general practitioner; NA: not applicable.
The most frequently reported tasks performed by the coordinating physician (n=630; 9 missing) were ‘medical resident care’ (80.5%), ‘coordination of the resident vaccination policy’ (64.3%) and ‘supervision of the medical records of all residents’ (56.8%). ‘Organisation of meetings to harmonise medical care practices/policies’ and ‘clinical training of medical doctors’ were less common (27.5% and 21.0% respectively) (Figure 12).
Overall, ‘development of an antimicrobial policy’ (31.0%), ‘development of care strategies’ (42.9%) and ‘development of an infection prevention and control policy’ (41.0%) scored moderately, but varied largely between countries (Table 8 and Figure 12).

Healthcare-associated infections and antimicrobial use in long-term care facilities, April–May 2013 SURVEILLANCE REPORT
20
Figure 12. Tasks performed by the coordinating physician: overall frequencies, HALT-2, 2013 (n=630
LTCFs reporting on these tasks)
LTCF infection prevention and control practices and resources
LTCFs were asked whether there was a person with training in IPC available to the staff, an IPC committee, and/or formal access to help and advice from an external IPC team. Data from 12 LTCFs were excluded because at least one answer was missing for these three questions.
There were 691 facilities (66.5%) with a person with IPC training at their disposal (Table 9). The majority of institutions had a nurse with training in IPC (n=490/687; 71.3%), while 160 (23.3%) had both a nurse and doctor, and 37 facilities (5.4%) had only a doctor. The majority worked at the LTCF (60.0%), while in 21.7% of the LTCFs the person(s) worked externally. In the remaining facilities the person(s) worked both inside and outside the facility (18.2%).
An IPC committee (internal or external) was in place in 443 LTCFs (42.6%, Table 9) and 822 institutions (79.1%) could acquire help and advice from an external IPC team (Figure 13). Ten per cent (n=104) of the LTCFs had none of these three IPC structures in place, while 325 facilities (31.3%) had all three. Thirty-nine LTCFs (3.8%) only had a person with training in IPC, 181 LTCFs (17.4%) only counted on expert advice and 19 institutions (1.8%) only had an IPC committee.
Table 9. Overview of infection prevention and control (IPC) resources and protocols available in the included LTCFs, by country, HALT-2, 2013
Country
IPC structures IPC protocols
Nu
mb
er
of
inclu
ded
LT
CFs
IPC
pra
cti
tio
ner
IPC
co
mm
itte
e
Ex
pert
IP
C
ad
vic
e
Nu
mb
er
of
inclu
ded
LT
CFs
MR
SA
an
d/o
r
MD
RO
Han
d h
yg
ien
e
Man
ag
em
en
t
of
uri
nary
cath
ete
rs
Man
ag
em
en
t
of
ven
ou
s
cath
ete
rs
Man
ag
em
en
t
of
en
tera
l
feed
ing
% % % % % % % %
Belgium 85 65.9 43.5 77.7 81 100 97.5 63.0 32.1 54.3
Croatia* 2 50.0 100 100 2 100 100 0.0 0.0 0.0
Czech Republic* 10 50.0 50.0 90.0 9 100 100 88.9 88.9 77.8
Denmark 32 46.9 28.1 81.3 32 90.6 100 56.3 21.9 31.3
Finland * 6 100 0.0 0.0 6 100 100 100 66.7 66.7
Germany 211 85.8 64.0 85.3 206 100 100 98.1 44.7 97.6
Greece* 2 50.0 50.0 100 2 100 100 50.0 50.0 50.0
Hungary 90 8.9 2.2 72.2 90 33.3 86.7 55.6 12.2 37.8
Ireland 140 68.6 67.9 64.3 138 98.6 97.1 89.9 46.4 90.6
0%
20%
40%
60%
80%
100%
Medical resident care
Organisation of a medical on-call service (continuity of
medical care)
Supervision of the medicalrecords of all residents
Clinical training of medicaldoctors
Clinical training of nursing staff
Development of an antimicrobialpolicy
Development of care strategies
Development of infectionprevention and control policy
Coordination of a residentvaccination policy
Organisation of meetings toharmonise medical care
practices/policies
Peer review of medical activities

SURVEILLANCE REPORT Healthcare-associated infections and antimicrobial use in long-term care facilities, April–May 2013
21
Country
IPC structures IPC protocols
Nu
mb
er
of
inclu
ded
LT
CFs
IPC
pra
cti
tio
ner
IPC
co
mm
itte
e
Ex
pert
IP
C
ad
vic
e
Nu
mb
er
of
inclu
ded
LT
CFs
MR
SA
an
d/o
r
MD
RO
Han
d h
yg
ien
e
Man
ag
em
en
t
of
uri
nary
cath
ete
rs
Man
ag
em
en
t
of
ven
ou
s
cath
ete
rs
Man
ag
em
en
t
of
en
tera
l
feed
ing
% % % % % % % %
Italy 231 50.2 24.2 81.0 229 49.3 92.6 93.5 85.2 84.3
Malta* 5 80.0 80.0 100 3 100 100 100 66.7 33.3
Netherlands* 4 75.0 100 75.0 4 100 100 100 50.0 75.0
Norway* 21 85.7 38.1 90.5 21 95.2 100 100 95.2 90.5
Portugal 73 76.7 67.1 65.8 59 22.0 93.2 74.6 61.0 45.8
Slovenia* 1 100 100 100 1 100 100 100 100 100
Sweden 40 97.5 25.0 70.0 40 97.5 97.5 57.5 52.5 85.0
UK – England* 16 93.8 68.8 100 13 76.9 92.3 53.9 7.7 15.4
UK – Northern Ireland 30 100 36.7 100 30 100 100 100 23.3 96.7
UK – Wales 40 100 7.5 97.5 39 100 100 94.9 10.3 94.9
Total 1 039 66.5 42.6 79.1 1 005 76.9 95.9 84.0 50.0 76.8
* Poor or very poor national representativeness of LTCF sample. IPC: infection prevention and control; MRSA: meticillin-resistant Staphylococcus aureus; MDRO: multidrug-resistant microorganisms
Figure 13. Percentage of included LTCFs with an infection prevention and control committee, HALT-2, 2013
* Poor or very poor national representativeness of LTCF sample
The availability of five IPC protocols was also explored in the institutional questionnaire (Table 9). Data from 46 LTCFs were excluded because at least one answer was missing for the five items. Almost all LTCFs (95.9%) had a written protocol for hand hygiene. There was also a high availability of a protocol for the management of MRSA and/or other multidrug-resistant microorganisms (76.9%, Figure 15), urinary catheters (84.0%) and enteral feeding (76.8%). Only half of the institutions had a protocol for the management of venous catheters/lines (50.0%). Eighteen facilities (1.8%) had none of the five written protocols in place, and 358 LTCFs (35.6%) reported having all five protocols (Figure 14).

Healthcare-associated infections and antimicrobial use in long-term care facilities, April–May 2013 SURVEILLANCE REPORT
22
Figure 14. Percentage of included LTCFs with written protocols for all five selected infection
prevention and control protocols**, HALT-2, 2013
* Poor or very poor national representativeness of LTCF sample ** Protocols for management of MRSA and/or other multidrug-resistant microorganisms, urinary catheters, enteral feeding, venous catheters/lines, and hand hygiene.
Figure 15. Percentage of LTCFs with written protocols for MRSA and/or other multidrug-resistant microorganisms, HALT-2, 2013
* Poor or very poor national representativeness of LTCF sample
Figure 16 shows systems of IPC practices present in the LTCFs. Five LTCFs did not respond to the question and were thus excluded. Commonly performed practices included ‘offer of annual immunisation for flu to all residents’ (88.5%), ‘decisions on isolation and additional precautions for residents colonised with resistant microorganisms’ (80.8%) and ‘development of care protocols’ (79.6%). ‘Appropriate training of GPs and medical staff in infection prevention and control’ was uncommon (13.3%).
Complete data was obtained from 1 009 LTCFs on the availability of personal protection equipment. All facilities had gloves at their disposal, and the vast majority had access to masks (95.0%), gowns (long sleeves; 93.1%) and aprons (short sleeves; 81.5%). Goggles were available in 65.1% LTCFs.

SURVEILLANCE REPORT Healthcare-associated infections and antimicrobial use in long-term care facilities, April–May 2013
23
Figure 16. Infection prevention and control (IPC) practices present in the included LTCFs, HALT-2,
2013 (n=1 046 LTCFs)
IPC: Infection prevention and control; MDRO: multidrug-resistant microorganisms
Hand hygiene in the LTCFs
Almost all LTCFs reported having a written hand hygiene protocol (95.9%, Table 9). Institutions were asked which of three methods they used most frequently. Over half of the LTCFs used hand disinfection with an alcohol-based solution most frequently (56.2%). Hand washing with water and an antiseptic soap or non-antiseptic soap was most frequently used by 25.3% and 18.5%, respectively (Table 10).
Table 10. Hand hygiene methods, products and training in the included LTCFs, by country, HALT-2, 2013
Country
Hand hygiene method Hand hygiene products Hand hygiene training
Nu
mb
er
of
LT
CFs
Dis
infe
cti
on
wit
h
alc
oh
ol-
ba
se
d s
olu
tio
n
Wa
sh
ing
wit
h w
ate
r
an
d n
on
-an
tise
pti
c
so
ap
Wa
sh
ing
wit
h w
ate
r
an
d a
nti
se
pti
c s
oa
p
Nu
mb
er
of
LT
CFs
Alc
oh
ol-
ba
se
d r
ub
so
luti
on
Wip
es (
alc
oh
oli
c)
Liq
uid
so
ap
(an
tise
pti
c/o
the
r)
Ba
r so
ap
in
cli
nic
al
are
as
Nu
mb
er
of
LT
CFs
Tra
inin
g i
n t
he
pre
vio
us y
ea
r
% % % % % % % %
Belgium 85 80.0 5.9 14.1 80 100 48.8 97.5 7.5 86 70.9
Croatia* 2 0.0 100 0.0 2 100 50.0 100 50.0 2 50.0
Czech Republic* 10 100 0.0 0.0 10 100 50.0 100 10.0 10 100
Denmark 32 87.5 12.5 0.0 32 100 28.1 96.9 6.3 32 31.3
Finland * 6 83.3 16.7 0.0 6 100 0.0 100 16.7 6 66.7
Germany 210 99.5 0.0 0.5 189 100 19.6 95.8 0.0 213 98.1
Greece* 2 50.0 0.0 50.0 2 100 0.0 100 50.0 2 50.0
Hungary 90 21.1 2.2 76.7 90 67.8 17.8 98.9 21.1 90 42.2
Ireland 140 53.6 35.0 11.4 133 100 41.4 100 0.8 140 92.9
Italy 233 26.6 31.8 41.6 218 73.4 8.3 97.7 2.8 232 46.1
Malta* 5 100 0.0 0.0 5 100 100 100 0.0 5 40.0
Netherlands* 4 50.0 25.0 25.0 3 100 33.3 100 0.0 4 100
Norway* 20 95.0 5.0 0.0 21 100 42.9 95.2 0.0 21 85.7
Portugal 72 51.4 26.4 22.2 70 97.1 5.7 100 4.3 71 78.9
Slovenia* 1 100 0.0 0.0 1 100 0.0 100 0.0 1 100
Sweden 40 92.5 7.5 0.0 40 100 17.5 100 2.5 40 72.5
0%
20%
40%
60%
80%
100%
IPC training of nursing and paramedical staff
Appropriate training of GPs and medical staff inIPC
Development of care protocols
Registration of residents colonised/infected withMDRO(s)
Designation of a person responsible for
outbreaks
Feedback on surveillance results to thenursing/medical staff
Supervision of disinfection/sterilisation ofmedical and care material
Decisions on isolation and additional precautions
when colonisation with resistant microorganisms
Offer of annual immunisation for flu to allresidents
Organisation, control, feedback on hand hygieneon a regular basis
Organisation, control, feedback of a process
surveillance/audit of infectionpolicies/procedures

Healthcare-associated infections and antimicrobial use in long-term care facilities, April–May 2013 SURVEILLANCE REPORT
24
Country
Hand hygiene method Hand hygiene products Hand hygiene training
Nu
mb
er
of
LT
CFs
Dis
infe
cti
on
wit
h
alc
oh
ol-
ba
se
d s
olu
tio
n
Wa
sh
ing
wit
h w
ate
r
an
d n
on
-an
tise
pti
c
so
ap
Wa
sh
ing
wit
h w
ate
r
an
d a
nti
se
pti
c s
oa
p
Nu
mb
er
of
LT
CFs
Alc
oh
ol-
ba
se
d r
ub
so
luti
on
Wip
es (
alc
oh
oli
c)
Liq
uid
so
ap
(an
tise
pti
c/o
the
r)
Ba
r so
ap
in
cli
nic
al
are
as
Nu
mb
er
of
LT
CFs
Tra
inin
g i
n t
he
pre
vio
us y
ea
r
% % % % % % % %
UK – England* 16 12.5 62.5 25.0 16 100 25.0 100 0.0 16 100
UK – Northern Ireland 30 3.3 26.7 70.0 29 100 51.7 100 10.3 29 93.1
UK – Wales 40 5.0 32.5 62.5 39 92.3 12.8 100 0.0 40 97.5
Total 1 038 56.2 18.5 25.3 986 90.7 23.3 98.2 4.6 1 040 73.4
* Poor or very poor national representativeness of LTCF sample. Only LTCFs with complete hand hygiene method, products and training data were included.
Complete data on hand hygiene products were obtained from 986 institutions. While liquid soap (antiseptic or other; 98.2%) and an alcohol-based rub solution (90.7%) were highly available in the LTCFs; bar soap in clinical areas (4.6%) and (alcohol) wipes (23.3%) were less common (Table 10).
In total, 836 LTCFs (79.5%) reported the number of litres of hand alcohol that were used in 2012, i.e. the previous year. The median usage reported by these 836 facilities was 4.2 litres per 1 000 resident days, assuming 95% occupancy (mean: 8.0). The median consumption rates reported by the LTCFs from any one country ranged from 0.3 to 16.1 (Figure 17).
Figure 17. Median alcohol-based hand rub use (litres per 1 000 resident-days) in the previous year in the included LTCFs, HALT-2, 2013
* Poor or very poor national representativeness of LTCF sample
Hand hygiene training for care professionals was organised during the previous year in 73.4% LTCFs. Nurses and nurse aides (98.9%) and cleaning staff (71.3%) were most frequently invited. Medical staff and the category ‘physiotherapists/occupational therapists/speech therapists/etc.’ were invited by 27.5% and 34.5% LTCFs, respectively.

SURVEILLANCE REPORT Healthcare-associated infections and antimicrobial use in long-term care facilities, April–May 2013
25
Antimicrobial stewardship resources
The majority of LTCFs did not have a restrictive list of antimicrobials for prescription (n=797/1043; 76.4%). Responses from 233 LTCFs indicated their restricted antimicrobials, the most common of which were vancomycin (60.5%), carbapenems (59.7%), intravenously administered antibiotics (51.1%), third generation cephalosporins (48.1%), glycopeptides (46.4%), fluoroquinolones (42.9%), broad-spectrum antibiotics (38.6%) and mupirocin (36.9%).
Table 11 presents information on the presence of 10 antimicrobial stewardship elements in the participating LTCFs. Overall, 46.0% had none of these elements present (Table 11 and Figure 18).
The most commonly present elements were a ‘therapeutic formulary, comprising a list of antibiotics’ (33.6%), ‘advice from a pharmacist for antimicrobials not included in the formulary’ (20.7%) and ‘written guidelines for appropriate antimicrobial use (good practice) in the facility’ (20.0%). The presence of ‘data on annual antimicrobial consumption by antimicrobial class’ (16.0%) and ‘local antimicrobial resistance profile summaries’ (11.0%) were reported infrequently (Table 11).
Table 11. Antimicrobial stewardship elements present in the included LTCFs, by country, HALT-2, 2013
Country
Nu
mb
er
of
LT
CFs
An
tim
icro
bia
l co
mm
itte
e
Tra
inin
g o
n a
pp
rop
ria
te
pre
scri
bin
g
Wri
tten
gu
ide
lin
es f
or
an
tim
icro
bia
l u
se
Da
ta o
n a
nn
ua
l
an
tim
icro
bia
l co
nsu
mp
tio
n
Re
min
de
r o
f im
po
rta
nce
sa
mp
les
Lo
ca
l a
nti
mic
rob
ial
resis
tan
ce
pro
file
s
Pe
rmis
sio
n f
or
pre
scri
bin
g
restr
icte
d a
nti
mic
rob
ials
Ad
vic
e f
rom
a p
ha
rma
cis
t
Th
era
pe
uti
c f
orm
ula
ry
Fe
ed
ba
ck
to
GP
s o
n
an
tim
icro
bia
l co
nsu
mp
tio
n
No
ne o
f th
ese
ele
me
nts
% % % % % % % % % % %
Belgium 84 6.0 9.5 39.3 25.0 8.3 4.8 3.6 20.2 70.2 10.7 15.5
Croatia* 2 0.0 0.0 0.0 50.0 50.0 50.0 0.0 0.0 0.0 0.0 50.0
Czech Republic* 10 50.0 0.0 20.0 40.0 10.0 30.0 60.0 30.0 30.0 10.0 20.0
Denmark 32 0.0 0.0 3.1 0.0 6.3 0.0 0.0 9.4 3.1 6.3 84.4
Finland * 6 0.0 50.0 66.7 100 100 50.0 66.7 50.0 100 50.0 0.0
Germany 208 0.0 4.8 0.0 5.3 1.0 2.9 1.9 5.3 0.0 4.8 82.2
Greece* 2 0.0 0.0 0.0 50.0 0.0 0.0 0.0 0.0 0.0 0.0 50.0
Hungary 90 1.1 3.3 7.8 1.1 1.1 0.0 0.0 1.1 1.1 4.4 84.4
Ireland 138 5.1 4.3 34.8 13.8 21.0 8.0 5.1 37.0 34.8 11.6 31.2
Italy 225 4.9 10.2 25.8 26.2 23.6 12.4 42.7 31.6 62.7 24.4 20.4
Malta* 5 0.0 0.0 60.0 0.0 0.0 0.0 80.0 40.0 20.0 0.0 20.0
Netherlands* 4 0.0 75.0 75.0 50.0 50.0 50.0 25.0 50.0 100 25.0 0.0
Norway* 21 0.0 23.8 71.4 42.9 42.9 33.3 28.6 33.3 52.4 19.0 19.0
Portugal 71 15.5 11.3 21.1 36.6 33.8 19.7 16.9 36.6 60.6 31.0 19.7
Slovenia* 1 0.0 0.0 0.0 0.0 0.0 0.0 0.0 0.0 0.0 0.0 100
Sweden 40 15.0 40.0 25.0 2.5 2.5 70.0 2.5 22.5 55.0 42.5 12.5
UK – England* 15 0.0 0.0 0.0 0.0 0.0 6.7 0.0 6.7 6.7 0.0 86.7
UK – Northern Ireland 31 0.0 3.2 19.4 9.7 22.6 16.1 0.0 16.1 9.7 0.0 45.2
UK – Wales 40 0.0 0.0 0.0 0.0 0.0 0.0 0.0 0.0 0.0 0.0 100
Total 1 025 4.5 8.4 20.0 16.0 14.1 11.0 14.0 20.7 33.6 14.0 46.0
* Poor or very poor national representativeness of LTCF sample GP: general practitioner Note that in some countries, some antimicrobial stewardship responsibilities are held by professional bodies outside of the LTCFs, e.g. in Sweden; a therapeutic formulary is available to the GPs in all counties.

Healthcare-associated infections and antimicrobial use in long-term care facilities, April–May 2013 SURVEILLANCE REPORT
26
Figure 18. Percentage of the included LTCFs reporting having ‘none’ of 10 selected antimicrobial
stewardship elements in place, HALT-2, 2013
* Poor or very poor national representativeness of LTCF sample The 10 elements are: antimicrobial committee; training on appropriate prescribing; written guidelines for antimicrobial use; data on annual AM consumption; reminder of importance samples; local AM resistance profiles; permission for prescribing restricted AM; advice from a pharmacist; therapeutic formulary; feedback to GPs on AM consumption.
Of the 917 responding LTCFs, 34.8% reported having a written therapeutic guideline for UTIs, 28.9% for RTIs and 35.3% for wound and soft tissue infections (35.3%) (Table 12). Figure 19 presents the percentage of LTCFs that had all three of these protocols, by country (country mean: 20.1%).
Surveillance programmes were uncommon in LTCFs, e.g. only one participating LTCF in Malta had a programme.
The most frequently reported programme was surveillance of resistant microorganisms (38.5%), followed by surveillance of HAIs (29.7%) and antimicrobial consumption (16.1%) (Table 12 and Figure 20).
Table 12. Available written therapeutic antimicrobial guidelines and surveillance programmes in the included LTCFs, by country, HALT-2, 2013
Country
Written therapeutic guidelines Surveillance programmes
Nu
mb
er
of
inclu
ded
LT
CFs**
Resp
irato
ry t
ract
infe
cti
on
s
Uri
nary
tra
ct
infe
cti
on
s
Wo
un
d a
nd
so
ft
tissu
e in
fecti
on
s
Nu
mb
er
of
inclu
ded
LT
CFs**
Healt
hcare
- asso
cia
ted
in
fecti
on
s
An
tim
icro
bia
l co
nsu
mp
tio
n
Resis
tan
t m
icro
- o
rgan
ism
s
% % % % % %
Belgium 56 55.4 58.9 67.9 75 38.7 24.0 73.3
Croatia* 2 0.0 0.0 0.0 2 50.0 50.0 50.0
Czech Republic* 10 80.0 80.0 30.0 10 40.0 30.0 90.0
Denmark 32 6.3 15.6 43.8 30 6.7 0.0 10.0
Finland * 6 33.3 100 33.3 6 33.3 66.7 83.3
Germany 156 9.0 9.0 9.0 208 13.5 3.4 40.4
Greece* 2 50.0 50.0 0.0 2 50.0 50.0 50.0
Hungary 90 18.9 21.1 35.6 89 3.4 2.3 2.3
Ireland 131 34.4 43.5 43.5 135 37.0 21.5 48.2
Italy 218 33.9 45.0 42.2 228 30.7 26.3 30.3
Malta* 5 0.0 0.0 0.0 5 0.0 0.0 20.0
Netherlands* 4 100 100 75.0 4 50.0 0.0 0.0
Norway* 18 55.6 72.2 50.0 20 95.0 25.0 65.0
Portugal 64 35.9 43.8 37.5 67 49.3 31.3 20.9
Slovenia* 1 0.0 0.0 0.0 1 100 0.0 100
Sweden 39 53.9 53.9 53.9 40 37.5 2.5 57.5
UK – England* 15 6.7 6.7 6.7 15 6.7 6.7 6.7

SURVEILLANCE REPORT Healthcare-associated infections and antimicrobial use in long-term care facilities, April–May 2013
27
Country
Written therapeutic guidelines Surveillance programmes
Nu
mb
er
of
inclu
ded
LT
CFs**
Resp
irato
ry t
ract
infe
cti
on
s
Uri
nary
tra
ct
infe
cti
on
s
Wo
un
d a
nd
so
ft
tissu
e in
fecti
on
s
Nu
mb
er
of
inclu
ded
LT
CFs**
Healt
hcare
- asso
cia
ted
in
fecti
on
s
An
tim
icro
bia
l co
nsu
mp
tio
n
Resis
tan
t m
icro
- o
rgan
ism
s
% % % % % %
UK – Northern Ireland 28 42.9 39.3 50.0 28 35.7 32.1 39.3
UK – Wales 40 0.0 0.0 0.0 39 69.2 0.0 71.8
Total 917 28.9 34.8 35.3 1 004 29.7 16.1 38.5
* Poor or very poor national representativeness of LTCF sample ** Excludes LTCFs with missing responses to all questions on therapeutic guidelines/surveillance programmes
Figure 19. Percentage of the included LTCFs with written therapeutic guidelines for UTIs, RTIs and wound and soft tissue infections, HALT-2, 2013
* Poor or very poor national representativeness of LTCF sample
Figure 20. Percentage of the included LTCFs with surveillance programmes for HAIs, HALT-2, 2013
* Poor or very poor national representativeness of LTCF sample

Healthcare-associated infections and antimicrobial use in long-term care facilities, April–May 2013 SURVEILLANCE REPORT
28
Healthcare-associated infections and antimicrobial use
Overview
On the day of the PPS, 2 626 (3.4%) of the 77 264 eligible residents had at least one healthcare-associated infection (HAI) and 3 367 residents (4.4%) received at least one antimicrobial agent. There were 1 791 residents (2.3%) with both an HAI and antimicrobial use, 1 576 residents (2.0%) with antimicrobial use but no HAI reported, and 835 (1.1%) with an HAI, but no antimicrobial use. In total, 4 202 residents (5.4%) were either receiving an antimicrobial or presenting with an HAI on the day of the PPS (Figure 21 and Table 13).
Figure 21. Proportionate Euler diagram of the number of residents receiving an antimicrobial and/or afflicted with healthcare-associated infection(s) within the eligible LTCF population (n=77 264 residents)
Note: Each box size is proportionate to the number of residents HAI: healthcare-associated infection; AU: antimicrobial use.
Characteristics of residents receiving antimicrobial(s) and/or presenting with HAI(s)
Age and gender While institution-level information was gathered on the percentage of residents older than 85 years (crude median: 49.1%), more detailed information (birth year) was only gathered for residents receiving antimicrobials and/or presenting with an HAI on the day of the PPS.
The overall median age of the residents with an HAI was comparable to the age of the residents receiving an antimicrobial (84 and 85 years, respectively). The overall age of residents was also similar between countries, although residents in Greece and Hungary were somewhat younger than the overall median (Table 13).
While the crude proportion of male residents in the total eligible population was 30.0% (n=23 221/77 390), the proportion with an HAI that were male was 33.7%, and the proportion of those receiving an antimicrobial that were male was 32.4% (Table 13).
Table 13. Age and gender of the LTCF residents presenting an HAI and of the LTCF residents receiving an antimicrobial, by country, HALT-2, 2013
Country
Residents with an HAI Residents receiving an antimicrobial
Nu
mb
er
of
resid
en
ts
% m
ale
Age
Nu
mb
er
of
resid
en
ts
% m
ale
Age
Min Mean Median Max Min Mean Median Max
Belgium 314 22.6 57.0 86.2 87.0 109.0 443 21.2 53 85.7 87 104
Croatia* 2 0.0 80.0 83.5 83.5 87.0 8 12.5 71 80.6 80 87
Czech Republic* 37 35.1 42.0 78.7 82.0 94.0 75 41.3 36 78.8 84 98
Denmark 43 30.2 58.0 83.2 84.0 99.0 143 26.6 48 84.1 86 100
HAI (n=2 626)
AU (n=3 367)
HAI + AU (n=1 791)
LTCF residents (n=77 264)

SURVEILLANCE REPORT Healthcare-associated infections and antimicrobial use in long-term care facilities, April–May 2013
29
Country
Residents with an HAI Residents receiving an antimicrobial
Nu
mb
er
of
resid
en
ts
% m
ale
Age
Nu
mb
er
of
resid
en
ts
% m
ale
Age
Min Mean Median Max Min Mean Median Max
Finland * 17 23.5 64.0 83.5 84.0 95.0 31 29 64 85.5 85 102
Germany 411 31.6 2.0 80.7 84.0 101.0 312 32.1 2 80.6 85 101
Greece* 10 60.0 35.0 66.9 67.5 82.0 23 47.8 19 64.9 71 93
Hungary 238 34.9 11.0 73.7 78.0 95.0 155 40 11 71.8 77 94
Ireland 400 35.3 4.0 81.8 83.0 101.0 734 35.4 4 80.8 83 103
Italy 613 35.9 20.0 83.4 85.0 102.0 725 35.4 20 83.3 85 101
Malta* 48 25.0 38.0 79.0 82.5 95.0 50 24 38 80.0 82 95
Netherlands* 36 38.9 59.0 83.1 85.0 97.0 38 31.6 39 81.2 85 97
Norway* 65 29.2 49.0 83.0 85.0 96.0 114 25.4 53 85.4 87 103
Portugal 163 47.9 36.0 75.8 80.0 99.0 133 44.4 29 74.5 80 98
Slovenia* 2 0.0 78.0 83.5 83.5 89.0 3 0 78 85.3 89 89
Sweden 40 42.5 28.0 83.5 87.0 100.0 39 30.8 50 84.0 88 94
UK – England* 28 42.9 20.0 84.1 85.0 103.0 37 40.5 20 85.1 87 103
UK – Northern Ireland 72 29.2 35.0 82.5 86.0 104.0 132 26.7 33 82.4 86 104
UK – Wales 87 36.8 43.0 85.3 88.0 102.0 172 30.8 26 83.9 86 104
Total 2 626 33.7 2.0 81.5 84.0 109.0 3 367 32.4 2 81.8 85 104
* Poor or very poor national representativeness of LTCF sample
Care load indicators, risk factors, length of stay and recent hospitalisation All studied care load indicators and risk factors were more frequently present in residents with an HAI and/or receiving antimicrobial(s) than in the population of eligible LTCF residents, while the percentages were similar
between residents with HAI(s) and those receiving antimicrobial(s) (Figure 21 and Table 14).
Residents with an HAI and residents receiving an antimicrobial had similar lengths of stay: 39.6 % and 38.1%, respectively, had been in the facility for less than a year. The recent hospitalisation rate (i.e. in the three months preceding the PPS) was also similar (26.8% of all residents with HAI and 25.9% of all residents receiving antimicrobials) (Table 14).

Healthcare-associated infections and antimicrobial use in long-term care facilities, April–May 2013 SURVEILLANCE REPORT
30
Figure 21. Prevalence of care load indicators and risk factors among LTCF residents receiving an
antimicrobial, among LTCF residents with an HAI and in the total eligible LTCF population, HALT-2, 2013
Table 14. Length of stay, recent hospitalisation, care load indicators and risk factors among LTCF residents with an HAI and among LTCF residents receiving an antimicrobial, by country, HALT-2, 2013
Country
Residents with an HAI Residents receiving an antimicrobial
Len
gth
of
sta
y (
<1
yea
r)
Recen
t h
osp
italisati
on
(th
ree m
on
ths p
rio
r to
PP
S)
Care load Risk factors
Len
gth
of
Sta
y (
<1
yea
r)
Recen
t h
osp
italisati
on
(th
ree m
on
ths p
rio
r to
PP
S)
Care load Risk factors
Inco
nti
nen
ce
(uri
ne a
nd
/o
r fa
ecal)
Dis
ori
en
tati
on
(ti
me a
nd
/o
r sp
ace)
Imp
air
ed
mo
bilit
y
(wh
eelc
hair
or
bed
rid
den
)
Uri
na
ry c
ath
ete
r
Vascu
lar
cath
ete
r
Pre
ssu
re s
ore
s
Oth
er
wo
un
ds
Recen
t su
rgery
(<3
0 d
ays p
rio
r to
PP
S)
Inco
nti
nen
ce
(uri
ne a
nd
/o
r fa
ecal)
Dis
ori
en
tati
on
(tim
e a
nd
/o
r sp
ace)
Imp
air
ed
mo
bilit
y
(wh
eelc
hair
or
bed
rid
den
)
Uri
na
ry c
ath
ete
r
Vascu
lar
cath
ete
r
Pre
ssu
re s
ore
s
Oth
er
wo
un
ds
Recen
t su
rgery
(<3
0 d
ays p
rio
r to
PP
S)
% % % % % % % % % % % % % % % % % % % %
Belgium 27.8 17.8 67.5 58.3 59.5 6.7 0.0 7.6 16.2 3.5 25.3 16.6 68.0 58.2 59.6 9.0 0.0 7.2 16.5 3.2
Croatia* 0.0 0.0 100 50.0 100 50.0 0.0 0.0 0.0 0.0 37.5 25.0 75.0 37.5 62.5 12.5 0.0 0.0 0.0 0.0
Czech Republic* 94.6 83.8 83.8 54.1 89.2 67.6 35.1 37.8 37.8 13.5 94.7 88.0 81.3 60.0 90.7 68.0 21.3 37.3 29.3 9.3
Denmark 27.9 7.1 67.4 30.2 39.5 11.6 0.0 0.0 25.6 2.3 31.5 17.6 73.4 49.0 51.1 23.1 0.0 2.8 16.8 1.4
Finland * 41.2 8.3 100 82.4 76.5 17.7 0.0 29.4 35.3 0.0 35.5 8.0 96.8 83.9 80.7 19.4 0.0 12.9 12.9 0.0
Germany 28.8 29.4 72.8 55.9 64.3 23.7 1.5 12.0 29.8 4.6 31.3 30.9 74.7 53.9 63.5 27.7 1.0 7.2 24.4 3.9
Greece* 90.0 50.0 80.0 70.0 90.0 70.0 60.0 30.0 60.0 20.0 95.7 39.1 78.3 56.5 87.0 43.5 47.8 17.4 39.1 17.4
Hungary 33.2 26.5 63.9 42.4 68.5 8.4 2.1 18.1 24.0 4.2 30.3 28.4 61.3 37.4 63.2 13.6 3.9 11.6 14.2 5.8
Ireland 34.5 25.2 64.8 64.8 55.3 10.0 2.5 7.3 25.3 2.0 30.9 20.4 67.4 62.0 58.5 13.2 1.8 6.0 21.6 1.8
Italy 45.7 26.6 84.3 71.6 82.3 36.5 26.0 26.9 20.7 3.6 46.3 29.4 83.3 68.7 82.7 37.3 24.9 27.6 20.2 4.7
Malta* 22.9 18.8 77.1 52.1 64.6 20.8 10.4 14.6 14.6 6.3 28.0 22.0 76.0 50.0 62.0 26.0 14.0 14.0 18.0 10.0
Netherlands* 58.3 27.8 61.1 42.9 63.9 22.2 0.0 11.1 22.2 8.3 54.1 39.5 57.9 50.0 63.2 23.7 0.0 10.5 29.0 13.2
Norway* 58.5 32.8 52.3 48.4 46.9 28.1 7.8 14.5 37.5 6.3 48.7 28.2 69.3 68.8 45.5 19.5 7.3 7.1 17.7 4.5
Portugal 72.4 32.1 86.5 66.3 87.7 36.8 4.9 30.1 24.7 3.1 72.9 34.4 82.7 65.4 91.7 34.6 8.3 26.3 21.2 2.3
Slovenia* 50.0 50.0 100 50.0 100 0.0 0.0 0.0 0.0 0.0 33.3 33.3 0.0 33.3 66.7 0.0 0.0 0.0 0.0 0.0
Sweden 40.0 30.0 65.0 67.5 45.0 12.5 0.0 10 22.5 2.5 41.0 30.8 64.1 52.6 61.5 12.8 0.0 10.3 23.1 5.1
UK – England* 28.6 32.1 67.9 46.4 25.0 17.9 0.0 10.7 10.7 0.0 24.3 36.1 67.6 48.7 29.7 18.9 0.0 10.8 16.2 0.0
UK – Northern
Ireland
31.0 31.0 73.6 72.1 65.7 13.9 1.4 18.8 23.5 4.2 26.0 17.6 78.0 69.3 68.5 12.2 0.8 10.1 14.1 3.8
UK – Wales 44.8 23.0 77.0 78.2 59.8 11.5 0.0 3.5 12.6 0.0 36.6 20.4 80.2 78.5 67.4 16.9 0.0 5.2 9.9 1.2
Total 39.6 26.8 73.4 61.2 68.0 21.7 8.3 16.2 23.4 3.7 38.1 25.9 74.0 61.5 66.9 22.7 7.6 13.1 19.4 3.6
* Poor or very poor national representativeness of LTCF sample
0
20
40
60
80
100
Pre
vale
nce
(%
)
Antimicrobial users
Residents with a HAI
Total eligible population
Risk factorsCare load indicators

SURVEILLANCE REPORT Healthcare-associated infections and antimicrobial use in long-term care facilities, April–May 2013
31
Healthcare-associated infections
Prevalence of HAIs
On the day of the PPS, 2 626 residents among the 77 264 eligible residents were reported to have at least one HAI, i.e. the crude prevalence of eligible residents with at least one HAI on the day of the PPS was 3.4%. Of those, 2 517 residents (95.9%) had one HAI, 96 (3.7%) had two HAIs, and 13 residents (0.5%) suffered from three or more. In total 2 753 infections were reported. Of all residents with an HAI, 68.2% received at least one antimicrobial on the PPS day.
At country level, the crude prevalence of patients with at least one HAI in LTCFs ranged from 0.4% in Croatia to 9.5% in Portugal (Table 15). The median prevalence in LTCFs ranged from 0.4% in Croatia to 7.1% in Portugal (Figure 22). The largest reported prevalence (75.0%) was reported for a very small Italian LTCF with only four eligible residents. Overall, 273 institutions reported no residents with a confirmed HAI (0% HAI prevalence). All countries with good representativeness of their LTCF sample had at least one LTCF reporting no HAIs (Table 15).
Table 15. Number and prevalence of LTCF residents with at least one HAI on the day of survey, by
country, HALT-2, 2013
Country Nu
mb
er
of
elig
ible
resid
en
ts
Nu
mb
er
of
inclu
ded
LT
CFs
Nu
mb
er
of
resid
en
ts w
ith
HA
I Prevalence (%) of residents with at least one HAI
HAI% Min P25 Median P75 Max
Belgium 8 756 87 314 3.6 0.0 1.4 3.2 5.7 12.3
Croatia* 447 2 2 0.4 0.0 0.0 0.4 0.7 0.7
Czech Republic* 662 10 37 5.6 1.9 2.5 4.9 8.3 12.5
Denmark 1 265 32 43 3.4 0.0 0.0 2.3 6.0 18.8
Finland * 467 6 17 3.6 0.0 0.0 3.2 4.7 8.8
Germany 16 768 215 411 2.5 0.0 0.0 1.7 4.3 16.0
Greece* 309 2 10 3.2 0.0 0.0 5.3 10.5 10.5
Hungary 11 824 90 238 2.0 0.0 0.0 1.5 3.3 10.1
Ireland 7 535 142 400 5.3 0.0 2.1 4.2 8.3 25.0
Italy 18 371 234 613 3.3 0.0 0.8 2.8 5.4 75.0
Malta* 1 558 5 48 3.1 0.0 0.0 3.3 3.3 3.6
Netherlands* 623 4 36 5.8 3.7 3.9 5.8 7.9 8.5
Norway* 1 374 21 65 4.7 0.0 1.9 3.8 5.6 12.8
Portugal 1 717 73 163 9.5 0.0 0.0 7.1 14.3 60.0
Slovenia* 202 1 2 1.0 1.0 1.0 1.0 1.0 1.0
Sweden 1 432 40 40 2.8 0.0 0.0 1.4 4.4 20.0
UK – England* 409 16 28 6.8 0.0 0.0 5.4 9.1 22.7
UK – Northern Ireland 1 243 31 72 5.8 0.0 2.0 6.9 10.0 25.0
UK – Wales 2 302 40 87 3.8 0.0 2.0 3.0 5.1 11.9
Total 77 264 1 051 2 626 3.4 0.0 0.0 2.8 40.0 75.0
* Poor or very poor national representativeness of LTCF sample HAI%: crude HAI prevalence, i.e. ((eligible residents with at least one HAI on the day of the PPS)/(eligible residents)) x 100

Healthcare-associated infections and antimicrobial use in long-term care facilities, April–May 2013 SURVEILLANCE REPORT
32
Figure 22. Prevalence of eligible LTCF residents with at least one HAI, by country, HALT-2, 2013
* Poor or very poor national representativeness of LTCF sample Red vertical line: crude median (2.8%) Box plots indicate the 25th, 50th (median) and 75th percentiles; adjacent lines indicate the boundary 1.5x the interquartile range.
Types of HAI
The infection types most frequently present on the day of the PPS were RTIs (n=857; 31.2%), UTIs (n=856; 31.2%) and skin infections (n=629; 22.8%) (Figure 23 and Table 16).
RTIs were mainly lower RTIs other than pneumonia (n=505), common colds/pharyngitis (n=247), pneumonia (n=71) and flu (n=34).
Most UTIs were classified as ‘probable infections’ (n=580; 67.8%) as although sufficient signs/symptoms of a UTI were present there was no corresponding microbiological confirmation (i.e. negative culture, unknown results, or no culture taken). In 32.2% of all UTI cases, the infections were confirmed as per case definition.
Skin infections were primarily ‘cellulitis, soft tissue or wound infections’ (n=550; 87.4%). The other skin infections were fungal infections (8.3%), herpes simplex or herpes zoster infections (n=15; 2.4%) and scabies (n=12; 1.9%).
‘Eye, ear, nose and mouth infections’ were the fourth largest infection group. These included eye infections (n=126; 78.3% of this group), ear infections (n=17; 10.6%), oral candidiasis (n=13; 8.1%) and sinusitis (n=5; 3.1%).
Gastrointestinal infections (GIs) represented 5.1% of all HAIs. Most cases were gastroenteritis (n=116; 82.3% of all GIs), or caused by Clostridium difficile (n=25, 17.7%). In the six countries reporting 10 GIs or more, the percentage of C. difficile infections among all GIs ranged from 0% in Portugal and 12.1% in Italy to 18.2% in Ireland and 20.6% in Germany.
The remaining infection groups were bloodstream infections (0.2% of all HAIs), unexplained cases of fever (n=59, 2.1%) and other infections (n=44; 1.6%). This latter group consisted mainly of genital infections, ‘dental infections not classified under mouth infections’ and bone infections.

SURVEILLANCE REPORT Healthcare-associated infections and antimicrobial use in long-term care facilities, April–May 2013
33
Figure 23. Distribution of types of HAI in the included LTCFs, HALT-2, 2013
Overall, the three most commonly reported infections were UTIs (31.1% (probable: 21.1%, confirmed: 10.0%)), followed by ‘cellulitis, soft tissue or wound infections’ (20.0%) and ‘lower RTIs other than pneumonia’ (18.3%). These infections were closely followed by common colds/pharyngitis (9.0%), eye infections (4.6%) and gastroenteritis (4.2%). Detailed information of the distribution of these HAI types by country is presented in Table 16.
Table 16. Distribution of types of HAI (number and relative frequency) in the included LTCFs, by country, HALT-2, 2013
Types of HAI
All countries
Belgium Croatia** Czech Republic**
Denmark Finland** Germany Greece** Hungary Ireland
n % n % n % n % n % n % n % n % n % n %
All types of HAI 2 753 100 325 100 2 100 40 100 46 100 17 100 425 100 12 100 252 100 410 100
Urinary tract infections
(UTIs)
856 111 2 12 16 3 127 3 55 132
Confirmed UTIs 276 10.0 57 17.5 0 0.0 3 7.5 5 10.9 2 11.8 11 2.6 1 8.3 3 1.2 42 10.2
Probable UTIs 580 21.1 54 16.6 2 100 9 22.5 11 23.9 1 5.9 116 27.3 2 16.7 52 20.6 90 22.0
Respiratory tract
infections (RTIs)
857 119 0 13 4 2 95 4 72 139
Common cold/pharyngitis
247 9.0 35 10.8 0 0.0 1 2.5 3 6.5 0 0.0 58 13.6 0 0.0 37 14.7 27 6.6
‘Flu’* 34 1.2 5 1.5 0 0.0 0 0.0 0 0.0 0 0.0 5 1.2 0 0.0 4 1.6 3 0.7
Pneumonia 71 2.6 10 3.1 0 0.0 4 10.0 1 2.2 0 0.0 5 1.2 2 16.7 8 3.2 10 2.4
Other lower RTIs 505 18.3 69 21.2 0 0.0 8 20.0 0 0.0 2 11.8 27 6.4 2 16.7 23 9.1 99 24.1
Skin infections 629 45 0 10 21 8 122 4 92 93
Cellulitis/soft tissue/ wound infection
550 20.0 43 13.2 0 0.0 8 20.0 14 30.4 8 47.1 105 24.7 4 33.3 74 29.4 87 21.2
Herpes simplex or zoster infections
15 0.5 1 0.3 0 0.0 0 0.0 0 0.0 0 0.0 5 1.2 0 0.0 1 0.4 3 0.7
Fungal infections 52 1.9 1 0.3 0 0.0 2 5.0 7 15.2 0 0.0 12 2.8 0 0.0 5 2.0 3 0.7
Scabies 12 0.4 0 0.0 0 0.0 0 0.0 0 0.0 0 0.0 0 0.0 0 0.0 12 4.8 0 0.0
Gastrointestinal infections 141 20 0 2 1 0 34 0 18 11
Gastroenteritis 116 4.2 17 5.2 0 0.0 0 0.0 0 0.0 0 0.0 27 6.4 0 0.0 15 6.0 9 2.2
Clostridium difficile infection
25 0.9 3 0.9 0 0.0 2 5.0 1 2.2 0 0.0 7 1.6 0 0.0 3 1.2 2 0.5
Eye, ear, nose and mouth
infections
161 15 0 0 3 3 38 0 11 22
Conjunctivitis 126 4.6 10 3.1 0 0.0 0 0.0 3 6.5 1 5.9 33 7.8 0 0.0 10 4.0 17 4.1
Ear infections 17 0.6 3 0.9 0 0.0 0 0.0 0 0.0 2 11.8 3 0.7 0 0.0 1 0.4 2 0.5
Sinusitis 5 0.2 1 0.3 0 0.0 0 0.0 0 0.0 0 0.0 1 0.2 0 0.0 0 0.0 1 0.2
Oral candidiasis 13 0.5 1 0.3 0 0.0 0 0.0 0 0.0 0 0.0 1 0.2 0 0.0 0 0.0 2 0.5
Urinary tract infections
Respiratory tract infections
Skin infections
Gastrointestinal infections
Eye, ear, nose and mouth
Bloodstream infections
Unexplained fever
Other infections

Healthcare-associated infections and antimicrobial use in long-term care facilities, April–May 2013 SURVEILLANCE REPORT
34
Types of HAI
All
countries
Belgium Croatia** Czech
Republic**
Denmark Finland** Germany Greece** Hungary Ireland
n % n % n % n % n % n % n % n % n % n %
Bloodstream infections 6 0.2 1 0.3 0 0.0 1 2.5 0 0.0 0 0.0 0 0.0 1 8.3 0 0.0 0 0.0
Unexplained fever 59 2.1 9 2.8 0 0.0 0 0.0 1 2.2 1 5.9 7 1.6 0 0.0 2 0.8 3 0.7
Other infections 44 1.6 5 1.5 0 0.0 2 5.0 0 0.0 0 0.0 2 0.5 0 0.0 2 0.8 10 2.4
* In HALT-2, ‘flu’ was defined as fever – a) single >37.8 °C oral/tympanic membrane OR b) repeated >37.2 °C oral OR >37.5 °C rectal OR c) >1.1 °C above baseline from any site – and at least three of the following symptoms: chills, new headache or eye pain, myalgia or body aches, malaise or loss of appetite, sore throat, or new/increased dry cough. ** Poor or very poor national representativeness of LTCF sample
Table 16. Distribution of types of HAI (number and relative frequency) in the included LTCFs, by country, HALT-2,
2013 (continued)
Types of HAI
Italy Malta** Netherlands** Norway** Portugal Slovenia** Sweden UK – England**
UK – Northern
Ireland
UK – Wales
n % n % n % n % n % n % n % n % n % n %
All types of HAI 652 100 48 100 37 100 71 100 180 100 2 100 41 100 28 100 78 100 87 100
Urinary tract infections
(UTIs)
193 10 13 27 63 0 11 10 34 34
Confirmed UTIs 89 13.7 4 8.3 4 10.8 10 14.1 28 15.6 0 0.0 6 14.6 0 0.0 8 10.3 3 3.4
Probable UTIs 104 16.0 6 12.5 9 24.3 17 23.9 35 19.4 0 0.0 5 12.2 10 35.7 26 33.3 31 35.6
Respiratory tract infections (RTIs)
242 19 13 15 34 2 15 11 20 38
Common cold/pharyngitis
50 7.7 5 10.4 0 0.0 1 1.4 6 3.3 0 0.0 10 24.4 3 10.7 5 6.4 6 6.9
‘Flu’ * 13 2.0 0 0.0 0 0.0 0 0.0 1 0.6 0 0.0 2 4.9 0 0.0 1 1.3 0 0.0
Pneumonia 24 3.7 0 0.0 0 0.0 6 8.5 1 0.6 0 0.0 0 0.0 0 0.0 0 0.0 0 0.0
Other lower RTIs 155 23.8 14 29.2 13 35.1 8 11.3 26 14.4 2 100 3 7.3 8 28.6 14 17.9 32 36.8
Skin infections 106 13 10 18 52 0 5 3 19 8
Cellulitis/soft tissue/wound infection
92 14.1 12 25.0 6 16.2 18 25.4 48 26.7 0 0.0 5 12.2 1 3.6 17 21.8 8 9.2
Herpes simplex or zoster
infections
4 0.6 0 0.0 0 0.0 0 0.0 0 0.0 0 0.0 0 0.0 0 0.0 1 1.3 0 0.0
Fungal infections 10 1.5 1 2.1 4 10.8 0 0.0 4 2.2 0 0.0 0 0.0 2 7.1 1 1.3 0 0.0
Scabies 0 0.0 0 0.0 0 0.0 0 0.0 0 0.0 0 0.0 0 0.0 0 0.0 0 0.0 0 0.0
Gastrointestinal infections 33 1 0 0 4 10 0 5 0 1 1
Gastroenteritis 29 4.4 1 2.1 0 0.0 2 2.8 10 5.6 0 0.0 5 12.2 0 0.0 1 1.3 0 0.0
Clostridium difficile infection
4 0.6 0 0.0 0 0.0 2 2.8 0 0.0 0 0.0 0 0.0 0 0.0 0 0.0 1 1.1
Eye, ear, nose and mouth
infections
31 4 1 6 16 0 4 1 2 4
Conjunctivitis 24 3.7 3 6.3 1 2.7 4 5.6 12 6.7 0 0.0 2 4.9 0 0.0 2 2.6 4 4.6
Ear infections 4 0.6 0 0.0 0 0.0 1 1.4 1 0.6 0 0.0 0 0.0 0 0.0 0 0.0 0 0.0
Sinusitis 1 0.2 0 0.0 0 0.0 0 0.0 1 0.6 0 0.0 0 0.0 0 0.0 0 0.0 0 0.0
Oral candidiasis 2 0.3 1 2.1 0 0.0 1 1.4 2 1.1 0 0.0 2 4.9 1 3.6 0 0.0 0 0.0
Bloodstream infections 3 0.5 0 0.0 0 0.0 0 0.0 0 0.0 0 0.0 0 0.0 0 0.0 0 0.0 0 0.0
Unexplained fever 30 4.6 0 0.0 0 0.0 0 0.0 5 2.8 0 0.0 1 2.4 0 0.0 0 0.0 0 0.0
Other infections 14 2.1 1 2.1 0 0.0 1 1.4 0 0.0 0 0.0 0 0.0 3 10.7 2 2.6 2 2.3
* In HALT-2, ‘flu’ was defined as fever – a) single >37.8 °C oral/tympanic membrane OR b) repeated >37.2 °C oral OR >37.5 °C rectal OR c) >1.1 °C above baseline from any site – and at least three of the following symptoms: chills, new headache or eye pain, myalgia or body aches, malaise or loss of appetite, sore throat, or new/increased dry cough. ** Poor or very poor national representativeness of LTCF sample
Antimicrobial use
Prevalence of antimicrobial use
On the day of the PPS, 3 367 out of 77 264 eligible LTCF residents received at least one antimicrobial agent (crude prevalence: 4.4%). Of these 3 367 residents, 94.5% received one antimicrobial and 5.2% received two agents. Eight residents received three antimicrobials; one resident received four. In total, 3 561 antimicrobials were
administered on the survey day.

SURVEILLANCE REPORT Healthcare-associated infections and antimicrobial use in long-term care facilities, April–May 2013
35
The crude prevalence of antimicrobial use varied between less than 2% in Croatia, Germany, Hungary and Croatia
to more than 10% in the Czech Republic, Denmark and UK – Northern Ireland (Figure 24 and Table 17). The overall median prevalence in LTCFs for residents receiving at least one antimicrobial was 3.6%, varying between 1.0% in Hungary to 12.1% in Greece (Figure 25 and Table 17). There were 212 LTCFs (20.2%) that reported that no residents received an antimicrobial on the survey day (0% prevalence).
Figure 24. Prevalence of eligible LTCF residents receiving at least one antimicrobial agent on the day of the PPS, HALT-2, 2013
* Poor or very poor national representativeness of LTCF sample
Figure 25. Prevalence of eligible LTCF residents receiving at least one antimicrobial agent, by country, HALT-2, 2013
* Poor or very poor national representativeness of LTCF sample Red vertical line: crude median (3.6%) Box plots indicate the 25th, 50th (median) and 75th percentiles; adjacent lines indicate the boundary 1.5x the interquartile range.

Healthcare-associated infections and antimicrobial use in long-term care facilities, April–May 2013 SURVEILLANCE REPORT
36
Table 17. Number and prevalence of eligible LTCF residents receiving at least one antimicrobial agent
on the day of the PPS, by country, HALT-2, 2013
Country Nu
mb
er
of
elig
ible
resid
en
ts
Nu
mb
er
of
inclu
ded
LT
CFs
Nu
mb
er
of
resid
en
ts
wit
h a
nti
-
mic
rob
ial
use
Nu
mb
er
of
an
ti-
mic
rob
ials
Prevalence (%) of residents receiving at least one antimicrobial agent
Prev AU%
Min P25 Median P75 Max
Belgium 8 756 87 443 455 5.1 0.0 2.1 4.7 8.2 19.0
Croatia* 447 2 8 8 1.8 0.6 0.6 1.5 2.5 2.5
Czech Republic* 662 10 75 79 11.3 2.5 7.2 11.1 15.1 19.3
Denmark 1 265 32 143 150 11.3 0.0 8.2 11.8 14.3 26.7
Finland* 467 6 31 31 6.6 4.7 4.9 5.6 8.5 12.3
Germany 16 768 215 312 322 1.9 0.0 0.0 1.1 3.3 11.5
Greece* 309 2 23 32 7.4 0.0 0.0 12.1 24.2 24.2
Hungary 11 824 90 155 159 1.3 0.0 0.0 1.0 2.1 7.6
Ireland 7 535 142 734 777 9.7 0.0 6.0 9.5 14.3 30.0
Italy 18 371 234 725 772 3.9 0.0 1.7 3.4 5.8 50.0
Malta* 1 558 5 50 64 3.2 0.0 0.0 3.3 3.5 3.6
Netherlands* 623 4 38 41 6.1 4.8 5.5 6.4 6.8 7.0
Norway* 1 374 21 114 123 8.3 0.0 5.1 8.0 11.4 18.4
Portugal 1 717 73 133 149 7.7 0.0 0.0 5.9 11.1 44.4
Slovenia* 202 1 3 3 1.5 1.5 1.5 1.5 1.5 1.5
Sweden 1 432 40 39 41 2.7 0.0 0.0 2.3 4.7 20.0
UK – England* 409 16 37 38 9.0 0.0 3.0 5.4 14.2 23.1
UK – Northern Ireland 1 243 31 132 135 10.6 0.0 7.1 9.5 15.8 29.5
UK – Wales 2 302 40 172 182 7.5 0.0 3.1 6.7 10.1 25.0
Total 77 264 1 051 3 367 3 561 4.4 0.0 0.0 3.6 40.0 50.0
* Poor or very poor national representativeness of LTCF sample Prev AU%: crude antimicrobial use prevalence, i.e. ((eligible residents with at least one antimicrobial on the day of the PPS)/(eligible residents)) x 100
Characteristics and indications for antimicrobial prescribing
On the survey day, 3 561 antimicrobial agents were prescribed. These were mainly administered orally (87.3%); a parenteral route (intramuscular or intravenous) was used in 11.6% prescriptions, and ‘other administration route’ (e.g. inhalation, rectal) was reported for 1.1% (n=39), but misclassifications or erroneous reporting of local antimicrobial use cannot be ruled out for this group.
Antimicrobials were mainly prescribed in the LTCF itself (84.6% of 3 529), 11.0% were prescribed in the hospital, and 4.1% elsewhere. They were primarily prescribed by general practitioners (54.0% of 3 517) and medical doctors (32.2%) employed by the LTCF, and otherwise by a specialist (12.0%), or another person such as a pharmacist or nurse (1.9%).
Antimicrobials were most frequently prescribed for the treatment of an infection (72.8%); the remaining
antimicrobials were prescribed for prophylactic use (27.2%) (Figure 26). The percentage of antimicrobials prescribed for prophylaxis was highest in UK – Northern Ireland (53.3%), Norway (52.0%) and Denmark (50.7%). Croatia and Slovenia only reported therapeutic, and not prophylactic, prescriptions (Figure 26).
The end date for antimicrobial use was documented in the residents’ records for the majority of prescriptions (67.1%), more so for therapeutic prescriptions (84.6%), but only for 20.5% of prophylactic prescriptions.
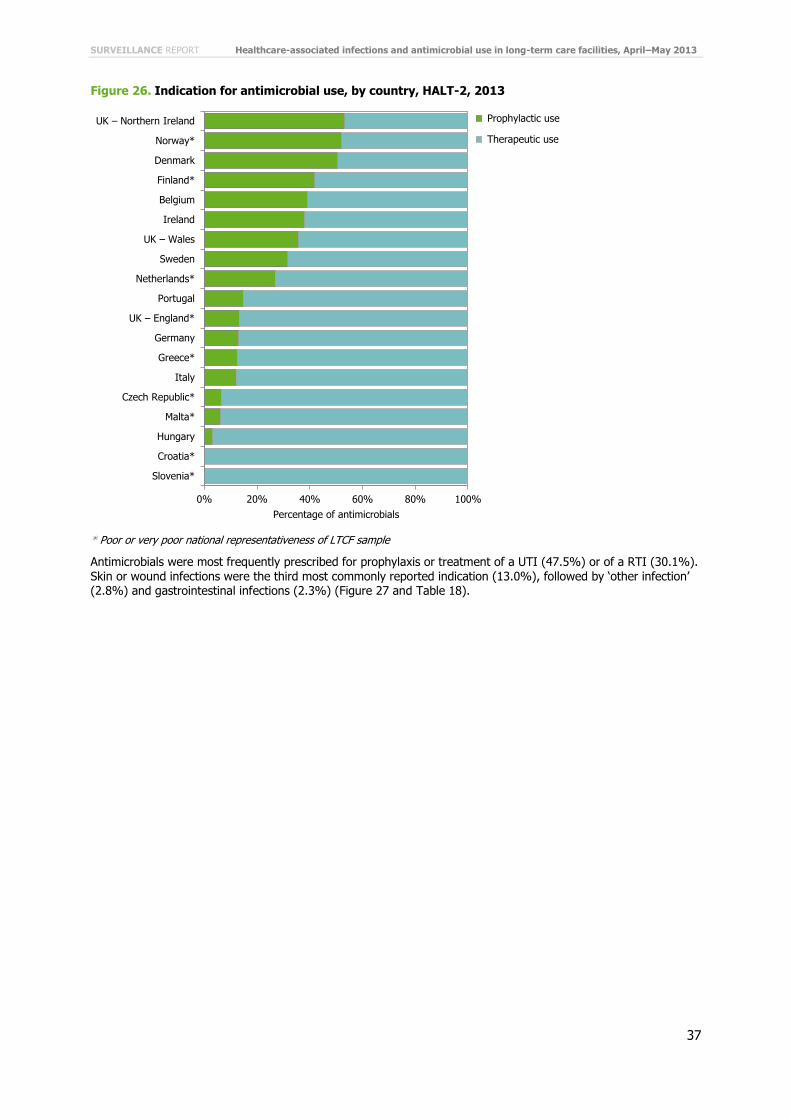
SURVEILLANCE REPORT Healthcare-associated infections and antimicrobial use in long-term care facilities, April–May 2013
37
Figure 26. Indication for antimicrobial use, by country, HALT-2, 2013
* Poor or very poor national representativeness of LTCF sample
Antimicrobials were most frequently prescribed for prophylaxis or treatment of a UTI (47.5%) or of a RTI (30.1%). Skin or wound infections were the third most commonly reported indication (13.0%), followed by ‘other infection’ (2.8%) and gastrointestinal infections (2.3%) (Figure 27 and Table 18).
0% 20% 40% 60% 80% 100%
UK – Northern Ireland
Norway*
Denmark
Finland*
Belgium
Ireland
UK – Wales
Sweden
Netherlands*
Portugal
UK – England*
Germany
Greece*
Italy
Czech Republic*
Malta*
Hungary
Croatia*
Slovenia*
Percentage of antimicrobials
Prophylactic use
Therapeutic use
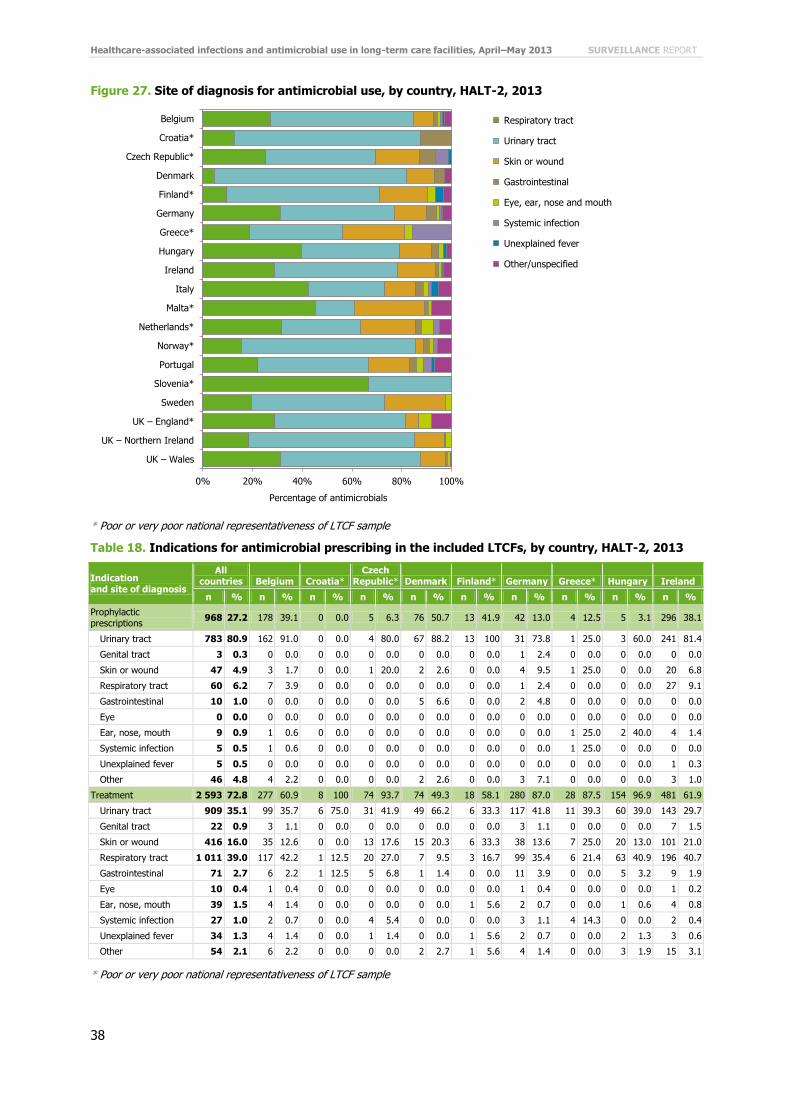
Healthcare-associated infections and antimicrobial use in long-term care facilities, April–May 2013 SURVEILLANCE REPORT
38
Figure 27. Site of diagnosis for antimicrobial use, by country, HALT-2, 2013
* Poor or very poor national representativeness of LTCF sample
Table 18. Indications for antimicrobial prescribing in the included LTCFs, by country, HALT-2, 2013
Indication and site of diagnosis
All countries Belgium Croatia*
Czech Republic* Denmark Finland* Germany Greece* Hungary Ireland
n % n % n % n % n % n % n % n % n % n %
Prophylactic prescriptions
968 27.2 178 39.1 0 0.0 5 6.3 76 50.7 13 41.9 42 13.0 4 12.5 5 3.1 296 38.1
Urinary tract 783 80.9 162 91.0 0 0.0 4 80.0 67 88.2 13 100 31 73.8 1 25.0 3 60.0 241 81.4
Genital tract 3 0.3 0 0.0 0 0.0 0 0.0 0 0.0 0 0.0 1 2.4 0 0.0 0 0.0 0 0.0
Skin or wound 47 4.9 3 1.7 0 0.0 1 20.0 2 2.6 0 0.0 4 9.5 1 25.0 0 0.0 20 6.8
Respiratory tract 60 6.2 7 3.9 0 0.0 0 0.0 0 0.0 0 0.0 1 2.4 0 0.0 0 0.0 27 9.1
Gastrointestinal 10 1.0 0 0.0 0 0.0 0 0.0 5 6.6 0 0.0 2 4.8 0 0.0 0 0.0 0 0.0
Eye 0 0.0 0 0.0 0 0.0 0 0.0 0 0.0 0 0.0 0 0.0 0 0.0 0 0.0 0 0.0
Ear, nose, mouth 9 0.9 1 0.6 0 0.0 0 0.0 0 0.0 0 0.0 0 0.0 1 25.0 2 40.0 4 1.4
Systemic infection 5 0.5 1 0.6 0 0.0 0 0.0 0 0.0 0 0.0 0 0.0 1 25.0 0 0.0 0 0.0
Unexplained fever 5 0.5 0 0.0 0 0.0 0 0.0 0 0.0 0 0.0 0 0.0 0 0.0 0 0.0 1 0.3
Other 46 4.8 4 2.2 0 0.0 0 0.0 2 2.6 0 0.0 3 7.1 0 0.0 0 0.0 3 1.0
Treatment 2 593 72.8 277 60.9 8 100 74 93.7 74 49.3 18 58.1 280 87.0 28 87.5 154 96.9 481 61.9
Urinary tract 909 35.1 99 35.7 6 75.0 31 41.9 49 66.2 6 33.3 117 41.8 11 39.3 60 39.0 143 29.7
Genital tract 22 0.9 3 1.1 0 0.0 0 0.0 0 0.0 0 0.0 3 1.1 0 0.0 0 0.0 7 1.5
Skin or wound 416 16.0 35 12.6 0 0.0 13 17.6 15 20.3 6 33.3 38 13.6 7 25.0 20 13.0 101 21.0
Respiratory tract 1 011 39.0 117 42.2 1 12.5 20 27.0 7 9.5 3 16.7 99 35.4 6 21.4 63 40.9 196 40.7
Gastrointestinal 71 2.7 6 2.2 1 12.5 5 6.8 1 1.4 0 0.0 11 3.9 0 0.0 5 3.2 9 1.9
Eye 10 0.4 1 0.4 0 0.0 0 0.0 0 0.0 0 0.0 1 0.4 0 0.0 0 0.0 1 0.2
Ear, nose, mouth 39 1.5 4 1.4 0 0.0 0 0.0 0 0.0 1 5.6 2 0.7 0 0.0 1 0.6 4 0.8
Systemic infection 27 1.0 2 0.7 0 0.0 4 5.4 0 0.0 0 0.0 3 1.1 4 14.3 0 0.0 2 0.4
Unexplained fever 34 1.3 4 1.4 0 0.0 1 1.4 0 0.0 1 5.6 2 0.7 0 0.0 2 1.3 3 0.6
Other 54 2.1 6 2.2 0 0.0 0 0.0 2 2.7 1 5.6 4 1.4 0 0.0 3 1.9 15 3.1
* Poor or very poor national representativeness of LTCF sample
0% 20% 40% 60% 80% 100%
Belgium
Croatia*
Czech Republic*
Denmark
Finland*
Germany
Greece*
Hungary
Ireland
Italy
Malta*
Netherlands*
Norway*
Portugal
Slovenia*
Sweden
UK – England*
UK – Northern Ireland
UK – Wales
Percentage of antimicrobials
Respiratory tract
Urinary tract
Skin or wound
Gastrointestinal
Eye, ear, nose and mouth
Systemic infection
Unexplained fever
Other/unspecified

SURVEILLANCE REPORT Healthcare-associated infections and antimicrobial use in long-term care facilities, April–May 2013
39
Table 18. Indications for antimicrobial prescribing in the included LTCFs, by country, HALT-2, 2013
(continued)
Indication and site of diagnosis
Italy Malta* Netherlands* Norway* Portugal Slovenia* Sweden UK –
England*
UK –
Northern Ireland
UK – Wales
n % n % n % n % n % n % n % n % n % n %
Prophylactic prescriptions
93 12.0 4 6.3 11 26.8 64 52.0 22 14.8 0 0.0 13 31.7 5 13.2 72 53.3 65 35.7
Urinary tract 47 50.5 0 0.0 5 45.5 61 95.3 6 27.3 0 0.0 11 84.6 5 100 67 93.1 59 90.8
Genital tract 2 2.2 0 0.0 0 0.0 0 0.0 0 0.0 0 0.0 0 0.0 0 0.0 0 0.0 0 0.0
Skin or wound 10 10.8 0 0.0 1 9.1 0 0.0 0 0.0 0 0.0 1 7.7 0 0.0 1 1.4 3 4.6
Respiratory tract 8 8.6 0 0.0 3 27.3 1 1.6 5 22.7 0 0.0 1 7.7 0 0.0 4 5.6 3 4.6
Gastrointestinal 1 1.1 0 0.0 1 9.1 0 0.0 1 4.5 0 0.0 0 0.0 0 0.0 0 0.0 0 0.0
Eye 0 0.0 0 0.0 0 0.0 0 0.0 0 0.0 0 0.0 0 0.0 0 0.0 0 0.0 0 0.0
Ear, nose, mouth 1 1.1 0 0.0 0 0.0 0 0.0 0 0.0 0 0.0 0 0.0 0 0.0 0 0.0 0 0.0
Systemic infection 1 1.1 0 0.0 0 0.0 0 0.0 2 9.1 0 0.0 0 0.0 0 0.0 0 0.0 0 0.0
Unexplained fever 4 4.3 0 0.0 0 0.0 0 0.0 0 0.0 0 0.0 0 0.0 0 0.0 0 0.0 0 0.0
Other 19 20.4 4 100 1 9.1 2 3.1 8 36.4 0 0.0 0 0.0 0 0.0 0 0.0 0 0.0
Treatment 679 88.0 60 93.8 30 73.2 59 48.0 127 85.2 3 100 28 68.3 33 86.8 63 46.7 117 64.3
Urinary tract 191 28.1 10 16.7 8 26.7 25 42.4 60 47.2 1 33.3 11 39.3 15 45.5 23 36.5 43 36.8
Genital tract 5 0.7 1 1.7 0 0.0 0 0.0 0 0.0 0 0.0 0 0.0 3 9.1 0 0.0 0 0.0
Skin or wound 84 12.4 18 30.0 8 26.7 4 6.8 25 19.7 0 0.0 9 32.1 2 6.1 15 23.8 16 13.7
Respiratory tract 319 47.0 29 48.3 10 33.3 18 30.5 28 22.0 2 66.7 7 25.0 11 33.3 21 33.3 54 46.2
Gastrointestinal 24 3.5 1 1.7 0 0.0 3 5.1 3 2.4 0 0.0 0 0.0 0 0.0 1 1.6 1 0.9
Eye 2 0.3 0 0.0 1 3.3 0 0.0 2 1.6 0 0.0 0 0.0 0 0.0 1 1.6 1 0.9
Ear, nose, mouth 15 2.2 1 1.7 1 3.3 2 3.4 2 1.6 0 0.0 1 3.6 2 6.1 2 3.2 1 0.9
Systemic infection 6 0.9 0 0.0 1 3.3 2 3.4 3 2.4 0 0.0 0 0.0 0 0.0 0 0.0 0 0.0
Unexplained fever 19 2.8 0 0.0 0 0.0 0 0.0 2 1.6 0 0.0 0 0.0 0 0.0 0 0.0 0 0.0
Other 14 2.1 0 0.0 1 3.3 5 8.5 2 1.6 0 0.0 0 0.0 0 0.0 0 0.0 1 0.9
* Poor or very poor national representativeness of LTCF sample
UTIs were the main indication for antimicrobial use in 14 countries. UTIs and RTIs were both the main indications for antimicrobial use in Hungary (n=63 of 159 for both) and in the Netherlands (n=13 of 41 for both). In Italia and Slovenia, RTIs were the most frequently reported indication (n=327 of 772 and n=2 of 3, respectively). In Malta, the main indications were RTIs (n=29 of 64) and skin or wound infections (n=18 of 64) (Figure 27 and Table 18).
The majority of the prophylactic prescriptions were for the prevention of UTIs (n=2 593 of 3 561, 80.9%, Figure 28). Uroprophylaxis accounted for 22.0% of all antimicrobial use, but this percentage varied greatly between countries. No uroprophylaxis was reported by Croatia, Malta and Slovenia, while the percentage of prescriptions for uroprophylaxis was above 30% in Belgium, Denmark, Finland, Ireland, Norway, Sweden, UK – Northern Ireland and UK – Wales (Table 18 and Figure 28).
The three dominant indications for therapeutic prescription of antimicrobials were RTIs (39.0%), UTIs (35.1%) and skin or wound infections (16.0%). These were dominant in all countries except for Croatia, where no treatment of skin or wound infections was reported, and England, where treatment of genital infections was more common than treatment of skin or wound infections (Table 18).

Healthcare-associated infections and antimicrobial use in long-term care facilities, April–May 2013 SURVEILLANCE REPORT
40
Figure 28. Percentage of antimicrobials prescribed for uroprophylaxis, HALT-2, 2013
* Poor or very poor national representativeness of LTCF sample
Antimicrobial agents prescribed in the LTCFs
Antibacterials for systemic use (ATC J01) represented 97.0% of all reported antimicrobials. Other groups were less common: intestinal anti-infectives (ATC A07, 0.3%), antiprotozoals (ATC P01, 0.7%), tuberculostatics (ATC J04, 0.6%), antimycotics for systemic use (ATC J02, 0.5%) and antifungals for systemic use (ATC D01B, 0.2%). The name, and therefore also the ATC code, was missing for seven antimicrobial agents.
Antibacterials for systemic use (ATC J01) There were 3 455 antibacterials for systemic use (J01) recorded. The most frequently used classes within this group were beta-lactams/penicillins (J01C; 29.3%), other antibacterials (J01X; 19.8%), quinolones (J01M, 16.0%, Figure 33), other beta-lactams (J01D; 12.5%) and sulfonamides and trimethoprim (J01E; 11.9%) (Figure 29).
Figure 29. Distribution of use of antibacterials for systemic use (ATC J01), HALT-2, 2013
The percentage of beta-lactams/penicillins (J01C) within antibacterials for systemic use varied from 0.0% in Greece to more than 50% in Croatia and Slovenia (two countries with a very low number of antimicrobials prescribed) (Figure 30). A high percentage of ‘other antibacterials’ (J01X) was reported by Belgium (48.2% of all J01 drugs) and Norway (52.5%). In Germany and Hungary, the J01M quinolones group was most frequently used (29.2% and
33.8%, respectively). The percentage of quinolone use was also relatively high in Croatia (50.0%; n=4 of 8), Greece (30%), Italy (26.2%) and Portugal (21.7%) (Table 19, Figure 30 and Figure 33).
Beta-lactams, penicillins (J01C)
Other antibacterials (J01X)
Quinolones (J01M)
Other beta-lactams (J01D)
Sulfonamides and trimethoprim (J01E)
Macrolides, lincosamides and streptogramins (J01F)
Tetracyclines (J01A)
Other J01 classes

SURVEILLANCE REPORT Healthcare-associated infections and antimicrobial use in long-term care facilities, April–May 2013
41
Figure 30. Distribution of use of antibacterials for systemic use (ATC J01), by country, HALT-2, 2013
* Poor or very poor national representativeness of LTCF sample
Table 19. Distribution of use of antibacterials for systemic use (ATC J01) in the included LTCFs, by country, HALT-2, 2013
Antimicrobial class
(ATC code)
All
countries Belgium Croatia*
Czech
Republic* Denmark Finland* Germany Greece* Hungary Ireland
n % n % n % n % n % n % n % n % n % n %
Tetracyclines (J01A) 101 2.9 6 1.3 0 0.0 2 2.6 2 1.4 1 3.2 15 4.9 1 3.3 8 5.2 36 4.8
Amphenicols (J01B) 2 0.1 0 0.0 0 0.0 0 0.0 0 0.0 0 0.0 0 0.0 0 0.0 0 0.0 1 0.1
Beta-lactams, penicillins
(J01C)
1 011 29.3 108 24.0 4 50.0 33 42.9 54 37.5 10 32.3 57 18.5 4 13.3 40 26.0 287 37.9
Other beta-lactams (J01D)
432 12.5 11 2.4 0 0.0 3 3.9 0 0.0 6 19.4 51 16.6 10 33.3 18 11.7 51 6.7
Sulfonamides and trimethoprim (J01E)
412 11.9 11 2.4 0 0.0 8 10.4 48 33.3 3 9.7 26 8.4 2 6.7 12 7.8 138 18.2
Macrolides, lincosamides
and streptogramins (J01F)
221 6.4 28 6.2 0 0.0 5 6.5 0 0.0 0 0.0 25 8.1 1 3.3 18 11.7 58 7.7
Aminoglycosides (J01G) 40 1.2 0 0.0 0 0.0 2 2.6 0 0.0 0 0.0 1 0.3 1 3.3 3 2.0 0 0.0
Quinolones (J01M) 552 16.0 69 15.3 4 50.0 9 11.7 7 4.9 2 6.5 90 29.2 9 30.0 52 33.8 53 7.0
Combinations of antibacterials (J01R)
1 0.0 0 0.0 0 0.0 0 0.0 0 0.0 0 0.0 0 0.0 0 0.0 0 0.0 0 0.0
Other antibacterials
(J01X)
683 19.8 217 48.2 0 0.0 15 19.5 33 22.9 9 29.0 43 14.0 2 6.7 3 2.0 134 17.7
Antibacterials for
systemic use (J01) – Total
3 455 450 8 77 144 31 308 30 154 758
0% 20% 40% 60% 80% 100%
Belgium
Croatia*
Czech Republic*
Denmark
Finland *
Germany
Greece*
Hungary
Ireland
Italy
Malta*
The Netherlands*
Norway*
Portugal
Slovenia*
Sweden
UK – England*
UK – Northern Ireland
UK – Wales
Total
Percentage of antimicrobials
Beta-lactams, penicillins (J01C)
Other antibacterials (J01X)
Quinolones (J01M)
Other beta-lactams (J01D)
Sulfonamides and trimethoprim (J01E)
Macrolides, lincosamides and streptogramins (J01F)
Tetracyclines (J01A)
Other J01 classes

Healthcare-associated infections and antimicrobial use in long-term care facilities, April–May 2013 SURVEILLANCE REPORT
42
Antimicrobial class (ATC code)
Italy Malta* Netherlands* Norway* Portugal Slovenia* Sweden UK –
England*
UK-Northern Ireland
UK-Wales
n % n % n % n % n % n % n % n % n % n %
Tetracyclines (J01A) 6 0.8 1 1.6 3 7.5 2 1.7 2 1.5 0 0.0 5 12.5 2 5.6 2 1.5 7 3.9
Amphenicols (J01B) 0 0.0 0 0.0 0 0.0 0 0.0 0 0.0 0 0.0 0 0.0 0 0.0 0 0.0 1 0.6
Beta-lactams, penicillins (J01C)
180 24.3 23 36.5 18 45.0 27 22.5 38 27.5 2 66.7 17 42.5 13 36.1 32 24.1 64 35.4
Other beta-lactams
(J01D)
222 30.0 8 12.7 2 5.0 7 5.8 13 9.4 1 33.3 0 0.0 1 2.8 14 10.5 14 7.7
Sulfonamides and
trimethoprim (J01E)
28 3.8 4 6.4 3 7.5 9 7.5 17 12.3 0 0.0 1 2.5 11 30.6 42 31.6 49 27.1
Macrolides, lincosamides and streptogramins
(J01F)
33 4.5 11 17.5 4 10.0 3 2.5 7 5.1 0 0.0 1 2.5 5 13.9 10 7.5 12 6.6
Aminoglycosides (J01G) 27 3.6 0 0.0 0 0.0 0 0.0 5 3.6 0 0.0 0 0.0 0 0.0 0 0.0 1 0.6
Quinolones (J01M) 194 26.2 9 14.3 2 5.0 9 7.5 30 21.7 0 0.0 4 10.0 0 0.0 2 1.5 7 3.9
Combinations of
antibacterials (J01R)
0 0.0 0 0.0 1 2.5 0 0.0 0 0.0 0 0.0 0 0.0 0 0.0 0 0.0 0 0.0
Other antibacterials (J01X)
51 6.9 7 11.1 7 17.5 63 52.5 26 18.8 0 0.0 12 30.0 4 11.1 31 23.3 26 14.4
Antibacterials for systemic use (J01) –
Total
741 63 40 120 138 3 40 36 133 181
* Poor or very poor national representativeness of LTCF sample
Beta-lactams, penicillins (ATC J01C) Within the J01C class, combinations of penicillins, including beta-lactamase inhibitors (J01CR), penicillins with extended spectrum (J01CA) and beta-lactamase resistant penicillins (J01CF) were the most frequently prescribed subgroups (57.8%, 27.1% and 10.8%, respectively). Beta-lactamase sensitive penicillins (J01CE) and beta-lactamase inhibitors (J01CG) were less common (4.3% and 0.1%, respectively). The distribution of these J01C subgroups by country is presented in Figure 31.
Penicillins (J01C) were mainly prescribed for therapeutic treatment of infections (93.3%). Specifically, these were for RTIs (47.6%), skin or wound infections (23.9%) and UTIs (20.9%).
Prophylactic prescriptions (6.7%) were mainly for prevention of UTIs (36.8%), skin or wound infections (23.5%) and RTIs (19.1%).
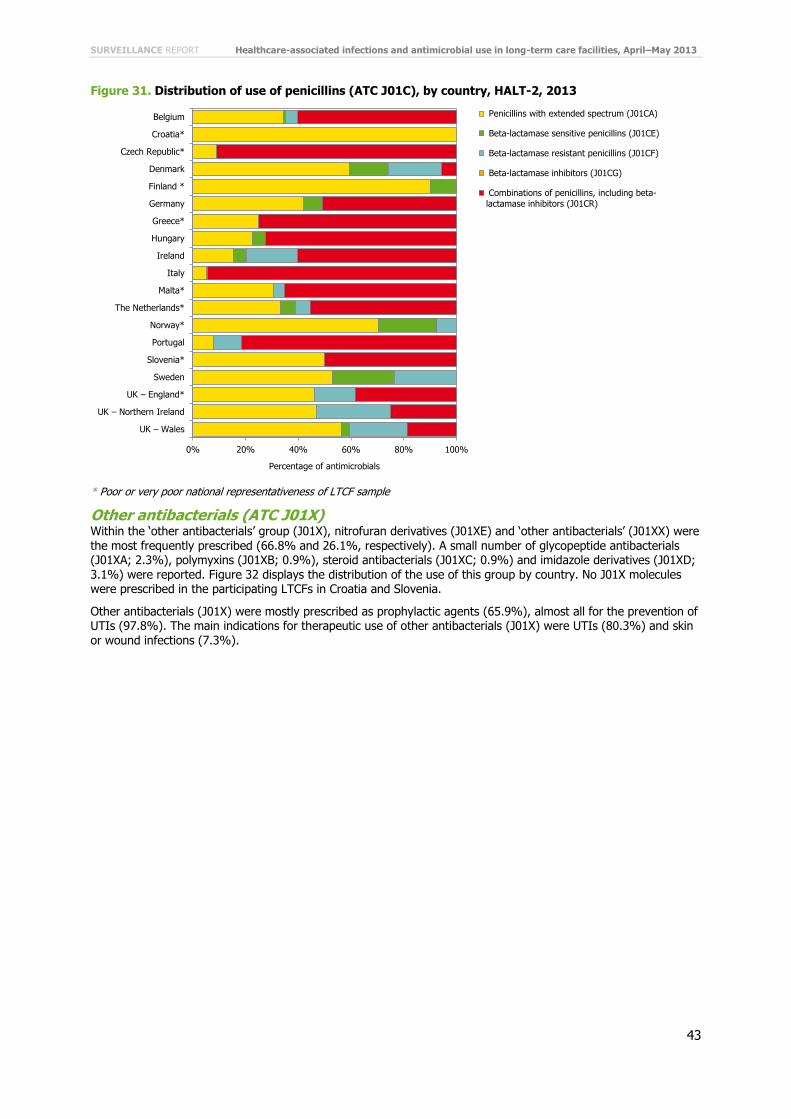
SURVEILLANCE REPORT Healthcare-associated infections and antimicrobial use in long-term care facilities, April–May 2013
43
Figure 31. Distribution of use of penicillins (ATC J01C), by country, HALT-2, 2013
* Poor or very poor national representativeness of LTCF sample
Other antibacterials (ATC J01X) Within the ‘other antibacterials’ group (J01X), nitrofuran derivatives (J01XE) and ‘other antibacterials’ (J01XX) were
the most frequently prescribed (66.8% and 26.1%, respectively). A small number of glycopeptide antibacterials (J01XA; 2.3%), polymyxins (J01XB; 0.9%), steroid antibacterials (J01XC; 0.9%) and imidazole derivatives (J01XD; 3.1%) were reported. Figure 32 displays the distribution of the use of this group by country. No J01X molecules were prescribed in the participating LTCFs in Croatia and Slovenia.
Other antibacterials (J01X) were mostly prescribed as prophylactic agents (65.9%), almost all for the prevention of UTIs (97.8%). The main indications for therapeutic use of other antibacterials (J01X) were UTIs (80.3%) and skin or wound infections (7.3%).
0% 20% 40% 60% 80% 100%
Belgium
Croatia*
Czech Republic*
Denmark
Finland *
Germany
Greece*
Hungary
Ireland
Italy
Malta*
The Netherlands*
Norway*
Portugal
Slovenia*
Sweden
UK – England*
UK – Northern Ireland
UK – Wales
Percentage of antimicrobials
Penicillins with extended spectrum (J01CA)
Beta-lactamase sensitive penicillins (J01CE)
Beta-lactamase resistant penicillins (J01CF)
Beta-lactamase inhibitors (J01CG)
Combinations of penicillins, including beta-
lactamase inhibitors (J01CR)

Healthcare-associated infections and antimicrobial use in long-term care facilities, April–May 2013 SURVEILLANCE REPORT
44
Figure 32. Distribution of use of other antibacterials (ATC J01X), by country, HALT-2, 2013
* Poor or very poor national representativeness of LTCF sample
Quinolone antibacterials (ATC J01M) All but one prescribed quinolone (prescribed in Hungary) were fluoroquinolones (J01MA). Ciprofloxacin (J01MA02) and levofloxacin (J01MA12) were the most commonly prescribed fluoroquinolones (61.9% and 23.6%, respectively).
The majority of quinolones (J01M) were prescribed therapeutically, mainly for the treatment of UTIs (53.3%), RTIs (29.5%), and skin or wound infections (10.0%). Prophylactic use (11%) was mainly for the prevention of UTIs (68.8%) and of other infections (14.1%).
0% 20% 40% 60% 80% 100%
Belgium
Croatia*
Czech Republic*
Denmark
Finland *
Germany
Greece*
Hungary
Ireland
Italy
Malta*
The Netherlands*
Norway*
Portugal
Slovenia*
Sweden
UK – England*
UK – Northern Ireland
UK – Wales
Percentage of antimicrobials
Glycopeptide antibacterials (J01XA)
Polymyxins (J01XB)
Steroid antibacterials (J01XC)
Imidazole derivatives (J01XD)
Nitrofuran derivatives (J01XE)
Other antibacterials (J01XX)

SURVEILLANCE REPORT Healthcare-associated infections and antimicrobial use in long-term care facilities, April–May 2013
45
Figure 33. Quinolone antibacterials (ATC J01M) as a percentage of all used antimicrobials (J01) on
the day of the PPS, HALT-2, 2013
* Poor or very poor national representativeness of LTCF sample
Other beta-lactams (ATC J01D) A large majority of ‘other beta-lactams’ used in the LTCFs were third-generation (J01DD; 53.5%) and second-generation cephalosporins (J01DC; 25.5%). First-generation cephalosporins (J01DB; 14.4%), carbapenems (J01DH; 6.0%) and fourth-generation cephalosporins were less frequently used. The distribution of the use of these J01D subclasses is presented in Figure 34.
Overall, 86.8% of the J01D antibacterials (other beta-lactams) were prescribed therapeutically while 13.2% were used in prophylaxis. RTIs (59.2%), UTIs (23.5%) and skin or wound infections (10.4%) were the main indications for therapeutic use of the J01D agents. The main reasons for prophylactic use of this J01D class were UTIs (64.9%) and RTIs (14.0%).

Healthcare-associated infections and antimicrobial use in long-term care facilities, April–May 2013 SURVEILLANCE REPORT
46
Figure 34. Distribution of use of other beta-lactams (ATC J01D), by country, HALT-2, 2013
* Poor or very poor national representativeness of LTCF sample
Isolated microorganisms and antimicrobial resistance
There were 891 antimicrobial treatments (25.0%) for which it was reported that a sample had been taken for microbiological culture. (Therefore, equally and by the same token, no sample was taken to guide treatment for 75.0% of the antimicrobial prescriptions). Microbiological results were not available on the day of the PPS for a third of these treatments’ samples (n=283, 34.8%), including 21 samples which awaited the microbiological test (2.4%). Microorganisms could not correctly be classified for 5.2% of the culture samples; 16 (1.8%) had a negative result, i.e. sterile examination.
In the three UK administrations and in Croatia, microbiological results were available for less than 1% of all prescriptions (Figure 35). The availability of microbiological results was highest (≥25% of all prescriptions in Greece, Portugal and Slovenia (Table 20, Figure 35).
Table 20. Number of courses of antimicrobials for treatment or prophylaxis, with a microbiological sample taken and with culture results in the included LTCFs, by country, HALT-2, 2013
Country
Antimicrobial treatment Antimicrobial prophylaxis All antimicrobials (treatment and prophylaxis)
N
With microbiological sample
N
With microbiological sample
N
With micro-biological sample
Samples with ≥1 microorganism
identified
Identified micro-
organisms
n % n % n % n % n
Belgium 277 91 32.9 178 42 23.6 455 133 29.2 96 72.2 107
Croatia* 8 0 0.0 0 0 0.0 8 0 0.0 - - -
Czech Republic*
74 23 31.1 5 1 20.0 79 24 30.4 13 54.2 15
Denmark 74 30 40.5 76 20 26.3 150 50 33.3 4 8.0 4
Finland* 18 7 38.9 13 3 23.1 31 10 32.3 6 60.0 9
Germany 280 47 16.8 42 4 9.5 322 51 15.8 29 56.9 33
Greece* 28 18 64.3 4 1 25.0 32 19 59.4 18 94.7 20
Hungary 154 10 6.5 5 0 0.0 159 10 6.3 8 80.0 8
Ireland 481 139 28.9 296 79 26.7 777 218 28.1 123 56.4 143
Italy 679 174 25.6 93 5 5.4 772 179 23.2 143 79.9 177
Malta* 60 9 15.0 4 0 0.0 64 9 14.1 7 77.8 8
Netherlands* 30 8 26.7 11 0 0.0 41 8 19.5 1 12.5 1
Norway* 59 24 40.7 64 7 10.9 123 31 25.2 21 67.7 21
Portugal 127 55 43.3 22 1 4.6 149 56 37.6 47 83.9 48
Slovenia* 3 1 33.3 0 0 0.0 3 1 33.3 1 100.0 1
0% 20% 40% 60% 80% 100%
Belgium
Croatia*
Czech Republic*
Denmark
Finland *
Germany
Greece*
Hungary
Ireland
Italy
Malta*
The Netherlands*
Norway*
Portugal
Slovenia*
Sweden
UK – England*
UK – Northern Ireland
UK – Wales
Percentage of antimicrobials
First-generation cephalosporins (J01DB)
Second-generation cephalosporins (J01DC)
Third-generation cephalosporins (J01DD)
Fourth-generation cephalosporins (J01DE)
Carbapenems (J01DH)

SURVEILLANCE REPORT Healthcare-associated infections and antimicrobial use in long-term care facilities, April–May 2013
47
Country
Antimicrobial treatment Antimicrobial prophylaxis All antimicrobials (treatment and prophylaxis)
N
With microbiological
sample
N
With microbiological
sample
N
With micro-
biological sample
Samples with ≥1 microorganism
identified
Identified micro-
organisms
n % n % n % n % n
Sweden 28 7 25.0 13 5 38.5 41 12 29.3 6 50.0 7
UK –
England*
33 7 21.2 5 0 0.0 38 7 18.4 0 0.0 0
UK – Northern Ireland
63 14 22.2 72 29 40.3 135 43 31.9 1 2.3 1
UK – Wales 117 27 23.1 65 3 4.6 182 30 16.5 1 3.3 1
Total 2 593 691 26.7 968 200 20.7 3561 891 25.0 525 58.9 604
* Poor or very poor national representativeness of LTCF sample
In total, 604 microorganisms were reported. The ten most frequently isolated bacteria were:
Escherichia coli (34.4%) Staphylococcus aureus (10.2%) Proteus mirabilis (8.1%) Pseudomonas aeruginosa (6.8%) Klebsiella pneumoniae (6.7%) Clostridium difficile (5.0%) Enterococcus faecalis (3.1%) Providencia species (2.5%) Morganella species (1.5%) Acinetobacter baumannii (1.3%)
Figure 35. Percentage of prescriptions for which microbiological results were available, HALT-2, 2013
* Poor or very poor national representativeness of LTCF sample
Antimicrobial susceptibility results for selected bug–drug combinations are presented in Table 21. Overall, meticillin-resistant Staphylococcus aureus (MRSA) was reported for more than half (54.8%) of Staphylococcus aureus isolates. An equal number of glycopeptide-susceptible and -non-susceptible Enterococcus species isolates was reported, but the percentage of isolates with unknown susceptibility was high (53.3%). The observed percentage of Enterobacteriaceae non-susceptible to third-generation cephalosporins and susceptible to carbapenems varied from 0% in Enterobacter species and Citrobacter species to 100% in Serratia species. For Pseudomonas aeruginosa, the percentage of carbapenem non-susceptibility was 23.8%.

Healthcare-associated infections and antimicrobial use in long-term care facilities, April–May 2013 SURVEILLANCE REPORT
48
Table 21. Antimicrobial resistance markers in selected microorganisms, HALT-2, 2013
Microorganism Nu
mb
er
of
mic
ro-
org
an
ism
s
Su
sce
pti
ble
Sp
ecif
ic n
on
-
su
sce
pti
bil
ity 1
Sp
ecif
ic n
on
-
su
sce
pti
bil
ity 2
Un
kn
ow
n
su
sce
pti
bil
ity r
esu
lts
% % % %
Staphylococcus aureus Oxacillin-S Oxacillin-R NA
62 33.9 54.8 11.3
Enterococcus species Glycopeptide-S Glycopeptide-NS NA
30 23.3 23.3 53.3
Enterobacteriaceae, including:
Third-generation cephalosporin-S AND carbapenem-S
Third-generation cephalosporin-NS AND carbapenem-S
Third-generation cephalosporin-NS AND carbapenem-NS
Escherichia coli 208 42.8 21.2 1.9 34.1
Klebsiella species 55 45.5 16.4 10.9 27.3
Enterobacter species 10 60.0 0.0 0.0 40.0
Proteus species 55 36.4 29.0 7.3 27.3
Citrobacter species 5 – – – –
Serratia species 2 – – – –
Morganella species 9 – – – –
Pseudomonas aeruginosa Carbapenem-S Carbapenem-NS NA
42 40.5 23.8 35.7
Acinetobacter baumannii Carbapenem-S Carbapenem-NS NA
8 – – – –
NA: not applicable; –: fewer than 10 isolates, percentage not calculated. S: susceptible; R: resistant; NS: non-susceptible (resistant and intermediate)
Antimicrobial susceptibility of the selected bug–drug combinations presented in Figure 36 should be interpreted with additional caution as relatively few reported isolates had antimicrobial susceptibility information. About a quarter of all reported microorganisms (n=143, 23.6%) were not susceptible to selected antimicrobials, including 20.9% microorganisms for which antimicrobial susceptibility reporting was required [15].
Most reports of antimicrobial-resistant bacteria were reported by the countries that reported microorganisms the most, i.e. Italy (68 resistant isolates out of a total 142 isolates), Ireland (34/123), Belgium (5/96), Portugal (13/47) and Germany (10/29) (Table 20 and Figure 36).

SURVEILLANCE REPORT Healthcare-associated infections and antimicrobial use in long-term care facilities, April–May 2013
49
Figure 36. Antimicrobial resistance of the selected bug–drug combinations, by country, HALT-2, 2013
(n=484)
Percentage of reported microorganisms

Healthcare-associated infections and antimicrobial use in long-term care facilities, April–May 2013 SURVEILLANCE REPORT
50
Figure 36, continued. Antimicrobial resistance of the selected bug–drug combinations, by country,
HALT-2, 2013 (n=484)
Percentage of reported microorganisms
Note: These results should be interpreted with caution as antimicrobial susceptibility was reported for relatively few reports. No data available for seven countries. None of the microorganisms in this figure were reported in Croatia, Denmark, UK – England, UK – Northern Ireland and UK – Wales. Only one Enterobacteriaceae was reported in Slovenia (no resistance) and in the Netherlands (unknown resistance). Enterobacteriaceae include Escherichia coli, Klebsiella spp., Enterobacter spp., Proteus spp.,
Citrobacter spp., Serratia spp. and Morganella spp. * Poor or very poor national representativeness of LTCF sample ** The antimicrobial resistance marker specified by ‘specific resistance 1’ is dependent on the species: oxacillin-R (S. aureus), glycopeptide-NS (Enterococcus spp.), carbapenem-NS (P. aeruginosa and A. baumannii), third-generation cephalosporin-NS AND carbapenem-S (Enterobacteriaceae) (see Table 21) *** ‘Specific resistance 2’ refers to Enterobacteriaceae only: third-generation cephalosporin-NS AND carbapenem-NS.
S: susceptible; R: resistant; NS: non-susceptible (resistant and intermediate)
Validation study
Twenty LTCFs from 10 countries took part in the validation study and information was evaluated for 1167 residents (Table 22) [11]. The specificity for all indicators was high, particularly so for HAIs and antimicrobial use (both >99%), which is common for such surveillance in healthcare settings [3]. It was lower for the institutional indicators, i.e. those collected through the institutional questionnaire, e.g. use of vascular/urinary catheters, incontinence and presence of wounds. The sensitivity of most indicators was also relatively high, lowest for HAIs (76%) and highest for antibicrobial use (90%).
These results suggest that the HALT-2 data are reliable, although participation in this validation study was low.

SURVEILLANCE REPORT Healthcare-associated infections and antimicrobial use in long-term care facilities, April–May 2013
51
Table 22. Sensitivity and specificity of data on HAIs, antimicrobial use and institutional indicators in
countries participating in the validation study, HALT-2, 2013 (n=10 countries)
Sensitivity % (95% CI)
Specificity % (95% CI)
HAIs 76 (58–89) 99 (98–100)
Antimicrobial use 90 (89–100) 99 (99–100)
Institutional performance indicators 83 (78–87) 85% (80–89)
95% CI: 95% confidence interval
National denominators and burden estimates
Twenty-eight EU countries and all four UK administrations supplied information for an EU register of LTCFs and LTCF beds. Table 23 presents this denominator data for the LTCF categories analysed in this report, i.e. general nursing homes, residential homes and mixed LTCFs (EU countries).
Updated data were provided by 21 EU countries and three UK administrations (Belgium, Croatia, Cyprus, the Czech Republic, Denmark, Estonia, France, Germany, Hungary, Ireland, Italy, Latvia, Lithuania, Luxemburg, Malta, the Netherlands, Norway, Portugal, Slovenia, Sweden, UK – England, UK – Northern Ireland and UK – Wales), seven countries could not provide recently updated numbers (Austria, Bulgaria, Finland, Poland, Slovakia, Spain and UK – Scotland), and data were unavailable two countries (Romania and Greece). Not all countries were able to provide data on the available number of LTCFs and LTCF beds for the requested categories. If updated data were unavailable for a country, data delivered for HALT (2010) were used whenever possible.
Estimates of the burden of HAI and antimicrobial use in LTCFs in the EU These newly collected denominator data indicate that there were at least 63 224 LTCFs for older adults in the EU Member States in 2013 with a capacity of approximately 3 604 224 beds.
The reported total number of residents living in these facilities increased with 13.4% (+484 224 resident) since the previous HALT PPS (2010). This increase can probably be explained by an increasing capability for EU Member States to deliver national denominator data on these LTCFs, but is perhaps also partially a response to the ageing populations in EU.
This HALT-2 PPS reported has identified that an HAI was present in 2 626 (3.4%) of the 77 264 eligible residents and that 3 367 (4.4%) residents used an antimicrobial on the PPS day.
Based on point prevalence outcomes of this HALT-2 PPS and an estimated bed occupancy of 95%, we calculate that on any given day 116 416 residents living in the EU’s general nursing homes, residential homes and mixed LTCFs have an HAI, and 150 657 residents are receiving at least one antimicrobial. With an average duration of an infection episode of 10 days, the total number of HAIs in LTCFs for elderly in EU Member States is estimated at 4 249 200 each year. As the duration of a resident’s stay in LTCFs is generally long (two to 60 months on average [18]), the number of individual residents acquiring HAIs is likely to be substantially lower than the total number of HAIs.
Table 23. Number of LTCFs and LTCF beds in general nursing homes, residential homes and mixed LTCFs, by country, HALT-2, 2013
Country
General nursing homes Residential homes Mixed LTCFs Total
% c
ou
ntr
y
po
pu
lati
on
≥ 8
0 y
ea
rs**
Sta
tus
Nu
mb
er
of
LT
CFs
Nu
mb
er
of
bed
s
Sta
tus
Nu
mb
er
of
LT
CFs
Nu
mb
er
of
bed
s
Sta
tus
Nu
mb
er
of
LT
CFs
Nu
mb
er
of
bed
s
Nu
mb
er
of
LT
CFs
Nu
mb
er
of
bed
s
Austria NA - - NA - - HALT (2010)
817 72 602 817 72 602 4.9
Belgium HALT-2 (2013)
1 211 122 273 HALT-2 (2013)
329 13 999 NA - - 1 540 136 272 5.2
Bulgaria NA - - NA - - HALT (2010)
33 486 33 486 4.1
Croatia HALT-2 (2013)
165 15 283 HALT-2 (2013)
196 19 257 NA - - 361 34 540 3.9
Cyprus HALT-2 (2013)
2 54 HALT-2 (2013)
62 1 592 HALT-2 (2013)
28 1 013 92 2 659 2.9
Czech Republic
HALT-2 (2013)
73 7 204 - - - - - - 73 17 204 3.8
Denmark HALT-2 1 300 44 434 HALT-2 - 1 313 HALT-2 1 300 44 434 2 600 90 181 4.1

Healthcare-associated infections and antimicrobial use in long-term care facilities, April–May 2013 SURVEILLANCE REPORT
52
Country
General nursing homes Residential homes Mixed LTCFs Total
% c
ou
ntr
y
po
pu
lati
on
≥ 8
0 y
ea
rs**
Sta
tus
Nu
mb
er
of
LT
CFs
Nu
mb
er
of
bed
s
Sta
tus
Nu
mb
er
of
LT
CFs
Nu
mb
er
of
bed
s
Sta
tus
Nu
mb
er
of
LT
CFs
Nu
mb
er
of
bed
s
Nu
mb
er
of
LT
CFs
Nu
mb
er
of
bed
s
(2013) (2013) (2013)
Estonia HALT-2 (2013)
26 1 769 HALT-2 (2013)
138 6 680 HALT-2 (2013)
39 - 203 8 449 4.5
Finland NA - - NA - - HALT (2010)
448 19 016 448 19 016 4.9
France HALT-2 (2013)
608 34 187 HALT-2 (2013)
7 225 555 773 NA - - 7 833 589 960 5.5
Germany* HALT-2 (2013)
* * HALT-2 (2013)
* * - * * 12 354 875 549 5.4
Greece - - - - - - - - - - - 5.2
Hungary HALT-2 (2013)
1 067 55 918 HALT (2010)
110 2 011 - - - 1 177 57 929 4.2
Ireland HALT-2 (2013)
442 27 807 NA - - HALT-2 (2013)
128 7 044 570 34 851 2.9
Italy HALT-2 (2013)
- 285 007 - - - - - - - 285 007 6.1
Latvia NA - - NA - - HALT-2 (2013)
82 5 798 82 5 798 4.5
Lithuania HALT-2 (2013)
103 5 484 NA - - NA - - 103 5 484 4.6
Luxemburg HALT-2 (2013)
16 1 695 HALT-2 (2013)
12 585 HALT-2 (2013)
32 3 691 60 5 971 3.9
Malta HALT-2 (2013)
2 294 HALT-2 (2013)
37 2 370 HALT-2 (2013)
6 1 958 45 4 622 3.6
Netherlands HALT-2 (2013)
400 65 000 HALT-2 (2013)
1 300 100 000 - - - 1 700 165 000 4.1
Norway - - - - - - HALT-2 (2013)
991 41 415 991 41 415 4.4
Poland HALT (2010)
285 16 625 HALT (2010)
1 440 101 101 HALT (2010)
181 5 820 1 906 123 546 3.6
Portugal HALT-2 (2013)
178 4 075 NA - - NA - - 178 4 075 5.3
Romania - - - - - - - - - - - 3.3
Slovakia HALT (2010)
12 246 HALT (2010)
466 27 980 HALT (2010)
10 826 488 29 052 2.9
Slovenia NA - - NA - - HALT-2 (2013)
90 20 777 90 20 777 4.3
Spain HALT (2010)
5 490 331 200 NA - - NA - - 5 490 331 200 5.2
Sweden* HALT-2 (2013)
* * HALT-2 (2013)
* * HALT-2 (2013)
- - 2 766 101 000 5.3
UK – England HALT-2 (2013)
4 684 220 048 HALT-2 (2013)
12 789 248 610 - - - 17 473 468 658 4.8
UK – N. Ireland
HALT-2 (2013)
248 11 708 NA - - NA - - 249 11 708
UK – Scotland HALT (2010)
929 38 228 HALT (2010)
1 893 - NA - - 2 822 38 228
UK – Wales HALT-2 (2013)
254 11 437 HALT-2 (2013)
426 11 548 - - - 680 22 985
Total beds 1 299 976 1 092 819 229 880 63 224 3 604 224
NA: not applicable, i.e. this type of LTCF is not present in the country -: no data * Country unable to make a distinction between types of LTCFs ** Source: Eurostat, 2012

SURVEILLANCE REPORT Healthcare-associated infections and antimicrobial use in long-term care facilities, April–May 2013
53
Discussion and conclusions
This second Europe-wide PPS in European LTCFs successfully collected data on HAIs, antimicrobial use and performance indicators on infection prevention and control and antimicrobial stewardship. In each LTCF, data were collected on a single day by a local data collector (i.e. a staff member of the participating LTCF) and/or by an external data collector (e.g. a national representative). Denominator data for each EU Member State were also collected, making calculation of burden estimates possible.
Fewer countries participated in HALT-2 in 2013 compared with HALT in 2010 (n=19 and n=28, respectively, UK administrations counted separately). However, a larger number of LTCFs participated in 2013 (n=1 181) than in 2010 (n=722) [3]. The representativeness of national samples of LTCFs for the 2013 PPS was ‘optimal’ (i.e. a systematic random nationally/regionally representative sample) in none of countries, ‘good’ in 10 of 19 participating countries, and ‘poor’ or ‘very poor’ in the remaining nine countries. To increase the homogeneity, and therefore the comparability of the data, responses from general nursing homes, residential homes and mixed LTCFs (n=1 051 LTCFs, 89% of all participating LTCFs) were amalgamated at country level for analyses.
One of the aims of HALT-2 was to develop a standardised tool to follow trends in the prevalence of HAIs and antimicrobial use, at local (LTCF), national and European levels. The fact that a smaller number of countries participated in HALT-2 than in HALT (2010), and that none of the countries was able to perform an optimal sampling of LTCFs demonstrates the need to improve the feasibility of sampling for future PPSs in LTCFs. Nonetheless, HALT-2 collected important information on HAIs, antimicrobial use and on the status of performance indicators in European LTCFs in 2013.
Adaptations to the HALT protocol were implemented by the HALT-2 project group and consulted experts, and finalised following the train-the-trainer meeting with NRs. These improvements, described throughout this report, included the incorporation of decision algorithms into questionnaires to simplify local identification of infections; simplification of microbiological reporting by only requesting data on selected drug–bug combinations; reformulating the wording and type of questions, particularly for performance indicators; updates and online provision of training material; and inclusion of a national register of LTCFs to provide more accurate and up-to-date denominator information. It is foreseen that the HALT protocol will improve with each repeated European PPS.
National and local engagement and training
The engagement of national staff in participating countries was excellent. NRs participated in train-the-trainer events, coordinated local training, and commonly performed or assisted in the data collection at each LTCF.
Staff from an estimated 1 072 LTCFs were trained in at least 60 training sessions using HALT-2 PPS training material. In some LTCFs, training only consisted of an update (e.g. using the HALT-2 training case studies, available online) as the staff had already participated in HALT (2010).
Training remains an essential element of the PPS process. Training sessions for LTCF staff serves not only to improve the manner in which PPSs are performed but also increases the surveillance skills and the awareness amongst Europe’s LTCF staff of the importance of HAI surveillance and antimicrobial resistance in the long-term care setting.
Train-the-trainer sessions for NRs were a useful forum to troubleshoot the HALT-2 protocol, questionnaires, data entry software and training material. Future sessions, well in advance of future PPSs in LTCFs, should utilise the valuable input from NRs with experience of HALT-2 to share best practice and guidance to achieve LTCFs samples that are representative of LTCFs in these countries. These should include discussion of the challenges experienced by NRs at the local and national level.
Therefore, even in consideration of the limitations listed above, participation in training and/or the HALT-2 PPS served as a tool to increase awareness and prevention at the local, national and European level. Even if the benefits of this PPS were limited to a short-lived modification of IPC behaviour of LTCF staff due to observer bias (so-called ‘Hawthorne effect’), the more rigorous application of IPC will have benefited LTCF residents [12-14]. HALT-2’s design also potentiated more direct and immediate outcomes than this. For example, automated reports were sent to each participating LTCF after the PPS. These reports included a detailed comparison of the LTCF’s results with those of other LTCFs at the national and European level. These reports also allowed NRs to compare their national results with European data. The reports were designed to increase the awareness of LTCF staff and promote critical evaluation of the local situation, thus empowering staff to take targeted IPC actions.

Healthcare-associated infections and antimicrobial use in long-term care facilities, April–May 2013 SURVEILLANCE REPORT
54
Healthcare-associated infections
The crude prevalence of LTCF residents with at least one HAI was 3.4%. The main HAI groups were RTIs (31.1%), UTIs (31.1%) and skin infections (22.8%). Overall, probable UTIs (21.1%), cellulitis, soft tissue or wound infections (20.0%), and lower RTIs other than pneumonia (18.3%) were the most common types of HAI.
The crude prevalence of HAIs in HALT-2 was higher than in the 2010 HALT PPS (2.4%), but both studies used a different approach to collect data on HAI. In HALT (2010), the McGeer criteria for surveillance of infections in LTCFs were modified (e.g. addition of the criterion ‘diagnosis by the attending physician’); data collectors reported signs/symptoms of an infection, and definitions were applied during analysis [3,6]. The infection could be confirmed in only 59.6% of residents for whom at least one sign/symptom was reported. It is therefore possible that fewer cases were detected in HALT (2010) due to underreporting of signs/symptoms by local staff members. For HALT-2, data collectors were therefore asked to apply decision algorithms to identify infections, which forced them to look at all possible signs/symptoms. The algorithms were based on the CDC/SHEA case definitions, which are in turn based on the McGeer criteria [7]. In order to familiarise LTCF staff with the application of these algorithms, more emphasis on training was given in HALT-2 (see above).
Minor adjustments to the case definitions were made to correct for the more limited access to microbiological and laboratory tests in European LTCFs in comparison with institutions in the US and Canada. This mainly affected the definition of a UTI. In the US version, confirmation of a UTI is only possible when there are sufficient signs/symptoms and microbiological evidence. Urine cultures are not routinely performed in some European countries’ LTCFs. Therefore, an additional infection level, i.e. ‘probable’ UTI was applied when sufficient signs/symptoms were present but there was no microbiological confirmation (i.e. a negative or unknown urine culture result, or test not done).
There was unequal use of the optional ‘UTI module’ that collected enhanced data on UTI cases compared with the main HALT-2 protocol and questionnaire; this added some imprecision to the UTI data. Specifically, the optional UTI module identified an additional 2.8% UTI cases (n=24 of 856). The causes of the discrepancy include the optional nature of the UTI module (only used by nine of 19 countries) and the fact that pre-submission data analysis steps were not pre-specified, or precluded. Even with the additional 24 UTI cases, the number of UTIs was still the near equal to the most commonly reported type of infection (i.e. RTIs, n=857) and more frequent than the third most common type (i.e. skin infections, n=629).
The overall magnitude and impact of this bias to the UTI data may be comparable to that applied to the data for other infection types and indicators, during the HALT-2 PPS data collection and analysis. Even though the HALT-2 protocol and questionnaire aimed to be unambiguous, bias during data collection is possible. The validation study for the HALT-2 PPS recruited two LTCFs in each of 10 participating countries and identified an overall sensitivity of 76% (95% CI: 55–89%) and an overall specificity of 99% (95%CI: 98–100%) for HAIs. As a comparison, validation studies performed in four countries during the ECDC PPS in acute hospitals showed an overall sensitivity of 71.9% (country range: 57.8–94.0%, four countries) and an average specificity of 99.4% (country range: 99.0–99.9%) for HAIs [10]. The results of these validation studies for the detection and reporting of HAIs in acute care hospitals and in LTCFs are therefore similar, although the accuracy of the HALT-2 validation study may be biased by having relatively few participating LTCFs.
Manual data entry is commonly associated with errors, and data correction is not unusual during data processing. This is a common feature of the standard operation of a surveillance system. Indeed, in the HALT-2 PPS we had the opportunity to document the magnitude of the data correction and scrutinise its overall impact. The magnitude of biases due to the PPS design, and the national representativeness of the LTCF samples, are likely to surpass those detected here in the UTI data, the most important of which being sampling bias. Although perfect data are in
themselves desirable, the standard processes imbedded in the design and execution of the HALT-2 PPS should mean that, despite the imprecision, the identified themes remain valid.
Antimicrobial use The crude prevalence of residents receiving at least one antimicrobial agent was 4.4%. Antibacterials for systemic use (ATC group J01) represented 97.0% of all reported antimicrobials, and beta-lactams/penicillins (29.3%), other antibacterials (19.8%) and quinolones (16.0%) were the most commonly used classes of antimicrobials.
These results are almost identical to that of the HALT PPS in 2010, which identified a crude prevalence rate of 4.3%, and 96.2% of all antimicrobials were antibacterials for systemic use. In 2010, beta-lactams/penicillins, other antibacterials and quinolones were also the most frequently used antimicrobials (28.7%, 19.4% and 15.5%, respectively).
Antimicrobials were most frequently prescribed for treatment of an infection (72.8%) with remaining prescriptions
concerning prophylactic courses (27.2%). These percentages were also similar to that of the HALT PPS in 2010 (72.4% vs. 27.7%, respectively).

SURVEILLANCE REPORT Healthcare-associated infections and antimicrobial use in long-term care facilities, April–May 2013
55
Isolated microorganisms
For HALT-2, the data collection method was adapted to be in line with the ECDC PPS of HAIs and antimicrobial use in European acute care hospitals 2011–2012, i.e. antimicrobial resistance data were only collected for selected bug–drug combinations [10,17]. The main difference between HALT-2 and the ECDC PPS in European acute care hospitals is that for acute care hospitals resistance data were collected for microorganisms isolated from HAIs, while resistance data for LTCFs in HALT-2 were collected from residents receiving antimicrobial agents. This is due to historical reasons in place since the ESAC nursing homes studies; this practice was maintained in HALT-2 to facilitate data collection in participating LTCFs.
The results on isolated microorganisms and antimicrobial resistance should be interpreted with caution as there were several potential causes of bias. Firstly, there were relatively few data as culture samples to guide treatment were only taken for 25.0% of antimicrobial prescriptions. In addition to this, the results of the microbiological tests were not yet available, or could not be found or consulted for 31.8% of these samples. Both of these factors were especially notable in Denmark and in the UK administrations. Also, PPSs inherently underestimate such results because PPSs are performed on one single day with no follow-up thereafter. These factors, combined with the great variation in national representativeness of the data, may be the reason for the large differences in the
numbers of reported microorganisms.
The top seven most frequently reported microorganisms were the same as in HALT (2010), with the three most frequent being Escherichia coli (34.4%), Staphylococcus aureus (10.2%) and Proteus mirabilis (8.1%).
In addition to the apparently low accessibility of culture sample results for LTCFs, there appears to have been poor access to, or poor reporting of, antimicrobial susceptibility results. The rate of unknown resistance results varied from 0% in Serratia species to 53.3% for Enterococcus species (susceptibility to glycopeptides). Most of the reported antimicrobial-resistant bacteria were reported by countries that reported large numbers of microorganisms (e.g. Italy, Ireland, Belgium, Portugal and Germany). In other words, there may be a reporting bias in which participating countries with more comprehensive reporting of microbiological results from their participating LTCFs are overrepresented.
Structure and process indicators
The development of the HALT performance indicators for IPC and antimicrobial stewardship were published recently [16]. Three IPC structures were explored in HALT-2: presence of a person with training in IPC, access to IPC advice, and presence of an IPC committee. In 2013, about one third (31.3%) of LTCFs had all three IPC structures, while only 10% had none of these structures in place. In HALT (2010), 21.1% of the participating LTCFs had all three structures in place, while 9.0% had none of these three structures. The percentage of LTCFs without access to any IPC structure was remarkably low, though it should be emphasised that the indicator does not provide any information on the work time (number of person-days) dedicated to IPC in the LTCFs.
In HALT-2, a new question was added on the most frequently used hand hygiene method. Most LTCFs reported that they mainly disinfect their hands with an alcohol-based solution, but the percentage (56.2%) was lower than expected. Liquid soap for hand washing was available in a higher percentage (98.2%) of LTCFs than alcohol-based rub solution (90.7%). Alcohol-based hand rub consumption was reported by 80% of all LTCFs, which was a surprisingly high percentage and suggests that the feasibility of collecting this indicator in LTCFs is better than anticipated. The mean alcohol-based hand rub consumption was 8.0 (median 4.2) litres per 1 000 resident-days, which is much lower than the mean consumption of 23.9 (median 18.7) litres per 1 000 patient-days reported in European acute care hospitals in 2011–2012 [10]. The lower number of contacts between LTCF staff and residents
(hand hygiene opportunities), as compared with the number of contacts between healthcare workers and patients in hospitals, probably accounts for an important fraction of this difference. Nevertheless, the large variability of alcohol-based hand rub consumption between LTCFs in HALT-2 also shows there is still much room for improvement in this area.
In addition, there is still a lot of room for improvement with regard to antimicrobial stewardship in LTCFs as 46.0% of all participating LTCFs declared that they have none of the explored antimicrobial stewardship elements in place.
The most frequently reported antimicrobial stewardship elements in HALT-2 were different from those reported in HALT (2010). In HALT-2, the most frequently reported structures were ‘therapeutic formulary, comprising a list of antibiotics’ (33.6% of LTCFs), ‘advice from a pharmacist for antimicrobials not included in the formulary’ (20.7%), ‘written guidelines for appropriate antimicrobial use (good practice) in the facility’ (20.0%), and ‘data on antimicrobial consumption’ (16.0%). The importance of taking microbiological samples to guide antimicrobial choice dropped from being in the first place in HALT in 2010 to the fifth place (14.1%) in HALT-2 in 2013.

Healthcare-associated infections and antimicrobial use in long-term care facilities, April–May 2013 SURVEILLANCE REPORT
56
Burden estimates
The survey of LTCF denominators in EU/EEA Member States collected and collated recent information on the number, type and size of LTCFs in each country. This information will make it possible to monitor how Member States cope with the increasing number of LTCFs which provide care for Europe’s aging population. These national denominator data also permit the estimation of the burden of HAIs and antimicrobial use for the LTCF population, using the prevalence results from the HALT-2 PPS.
As described above, interpretation of the number of received antimicrobial agents – and particularly the number of HAIs detected in this survey – should be interpreted with caution due to the likely biases. Still, the burden for residents of general nursing homes, residential homes and mixed LTCFs in 2013, as estimated by HALT-2, indicates the scale of the HAI hazard faced by residents in European LTCFs and the resulting challenge for European health professionals.
We estimated that, in 2013, 4.2 million HAIs occurred in general nursing homes, residential homes and mixed LTCFs. Since the length of stay in these LTCFs is long, and given that the most vulnerable residents acquire more than one HAI per year, the number of residents acquiring these 4.2 million HAIs is expected to be substantially lower and could not be estimated. The number of LTCF residents with an HAI on any given day was estimated at 116 416 and the number of LTCF residents receiving at least one antimicrobial on any given day at 150 657.
Future steps and recommendations
In 2009, EU Member States committed to a set of actions in light of the Council Recommendations on patient safety, including the prevention and control of HAIs (2009/C 151/01) [8]. A first evaluation of the steps taken by Member States and at EU level was conducted by the European Commission in 2011 [9]. This evaluation acknowledged that a variety of actions had already been taken, while pointing out that there still was considerable room for improvement. The following priority areas for LTCFs were identified for those working at the national and EU level:
Extend patient safety strategies and programmes from hospital care to non-hospital care (Member State level).
Ensure adequate numbers of specialised IPC staff with time set aside for this task in hospitals and other
healthcare institutions (Member State level). Reinforce tailored basic IPC structures and practices in nursing homes and other LTCFs (Member State
level). Repeat national point prevalence surveys of HAIs as a means to monitor the burden of HAI in all types of
healthcare institutions, to identify priorities and targets for intervention, to evaluate the impact of interventions and to raise awareness (Member State level).
Continue the development of guidance on the prevention and control of HAIs, including tailored guidance for nursing homes and other LTCFs (EU level).
The following recommendations can be made for future PPSs in European LTCFs:
Continue monitoring HAIs and antimicrobial use, using a standardised methodology across different countries.
Explore measures to increase the representativeness of the sampled LTCFs before the next survey(s) and to increase the number of participating countries and LTCFs.
Promote, with national authorities, the importance of having a good national/regional register of LTCFs and
LTCF beds to calculate burden estimates of HAIs and antimicrobial use in LTCFs. Continue to provide training to LTCF staff to harmonise the interpretation of case definitions and to improve
IPC skills. Perform further validation studies at the national level, giving special attention to HAI case definitions.
The HALT-2 project collected valuable information on HAIs and antimicrobial use in LTCFs using a standardised and feasible methodology, and through this process helped improve surveillance skills in chronic care facilities. This skill will be highly beneficial for LTCF staff tackling the threat of antimicrobial resistance. The automated reports for participating LTCF provided LTCF staff with awareness of their local situation in comparison with national and European data, empowering them to take targeted actions against HAIs.
Infection prevention and control resources in LTCFs should be strengthened, although implementation will be challenging as workload levels can be extremely high in LTCFs due to the high care load and the lack of sufficient personnel. Moreover, IPC expertise and diagnostic support (e.g. microbiological and laboratory confirmation) should still be improved. Also, medical care is often poorly coordinated. This survey should help raise awareness for HAIs and antimicrobial resistance at the national and European level.

SURVEILLANCE REPORT Healthcare-associated infections and antimicrobial use in long-term care facilities, April–May 2013
57
References
1. European Centre for Disease Prevention and Control (ECDC). Healthcare-associated Infections Surveillance Network (HAI-Net). [internet] Stockholm: ECDC; 2013. Available from: http://www.ecdc.europa.eu/en/activities/surveillance/HAI/Pages/default.aspx
2. Belgian Scientific Institute of Public Health (WIV-ISP). Healthcare-associated infections and antimicrobial use in European long-term care facilities: the HALT-2 project. Brussels: WIV-ISP; 2013. Available from: http://halt.wiv-isp.be/default.aspx
3. European Centre for Disease Prevention and Control. Point prevalence survey of healthcare-associated infections and antimicrobial use in European long-term care facilities, May–September 2010. Stockholm: ECDC; 2014.
4. Suetens C. Healthcare-associated infections in European long-term care facilities: how big is the challenge? Euro Surveill 2012;17(35):pii=20259. Available from: http://www.eurosurveillance.org/ViewArticle.aspx?ArticleId=20259
5. World Health Organization Collaborating Centre for Drug Statistics Methodology. The ATC/DDD system: International language for drug utilization research. Oslo: WHO Collaborating Centre for Drug Statistics Methodology Norwegian Institute of Public Health; 2012. Available from: http://www.whocc.no/atc_ddd_index/
6. McGeer A, Campbell B, Emori TG, et al. Definitions of infection for surveillance in long-term care facilities. Am J Infect Control 1991;19(1):1-7.
7. Stone ND, Ashraf MS, Calder J, et al. Surveillance definitions of infections in long-term care facilities: Revisiting the McGeer criteria. Infect Control Hosp Epidemiol 2012;33(10):965-977.
8. Council of the European Union. Council Recommendation of 9 June 2009 on patient safety, including the prevention and control of healthcare associated infections (2009/C 151/01). Available from: http://eur-lex.europa.eu/LexUriServ/LexUriServ.do?uri=OJ:C:2009:151:0001:0006:EN:PDF
9. Report from the Commission to the Council on the basis of the Member States' reports on the implementation of the Council Recommendation (2009/C 151/01) on patient safety, including the prevention and control of healthcare associated infections. Com(2012) 658. Available from http://ec.europa.eu/health/patient_safety/policy/index_en.htm
10. European Centre for Disease Prevention and Control. Point prevalence survey of healthcare-associated infections and antimicrobial use in European acute care hospitals. Stockholm: ECDC; 2013. Available from: http://www.ecdc.europa.eu/en/publications/publications/healthcare-associated-infections-antimicrobial-use-pps.pdf
11. Ricchizzi E, Latour K, Fitzpatrick F, Dillane T, Suetens C, Jans B, et al. How to validate a point prevalence survey of healthcare-acquired infections and antimicrobial use in long-term care: the validation study in the HALT2 project [2014, in preparation].
12. Spano R. Observer behavior as a potential source of reactivity: describing and quantifying observer effects in a large-scale observational study of police. Sociol Methods Res 2006;34(4):521-553.
13. Gale EAM. The Hawthorne studies – a fable for our times? Q J Med 2004;97(7):439-449.
14. Pan SC, Tien KL, Hung IC, et al. Compliance of health care workers with hand hygiene practices: independent advantages of overt and covert observers. PLoS One 2013;8(1):e53746.
15. European Centre for Disease Prevention and Control. Point prevalence survey of healthcare-associated infections and antimicrobial use in European long-term care facilities (HALT-2). Protocol. Stockholm: ECDC: 2012.
16. Cookson B, MacKenzie D, Kafatos G, et al. Development and assessment of national performance indicators for infection prevention and control and antimicrobial stewardship in European long-term care facilities. J Hosp Infect 2013;85(1):45-53.
17. European Centre for Disease Prevention and Control. Point prevalence survey of healthcare-associated infections and antimicrobial use in European acute care hospitals. Protocol version 4.3. Full scale survey and codebook. Stockholm: ECDC: 2012. Available from: http://www.ecdc.europa.eu/en/activities/surveillance/HAI/about_HAI-Net/Pages/PPS.aspx
18. Jans B, Muller A, Broex E, Stroobants R, Vankerckhoven V. European Surveillance of Antimicrobial Consumption (ESAC): Results from the national survey of characteristics of nursing homes. Antwerp: University of Antwerp; 2010. Available from: http://www.esac.ua.ac.be/download.aspxc=*ESAC2&n=50297&ct=50294&e=50482