ants, altitude and change in the northern cape floristic...
TRANSCRIPT
ORIGINALARTICLE
Ants, altitude and change in the northernCape Floristic Region
A. Botes1*, M. A. McGeoch2, H. G. Robertson3, A. van Niekerk4,
H. P. Davids1 and S. L. Chown5
1Spatial, Physiological and Conservation
Ecology Group, Department of Botany and
Zoology, Stellenbosch University, Matieland,
South Africa, 2Spatial, Physiological and
Conservation Ecology Group, Department of
Conservation Ecology, Stellenbosch University,
Matieland, South Africa, 3Iziko Museums of
Cape Town, Cape Town, South Africa,4Department of Geography, Stellenbosch
University, Matieland, South Africa and5Centre for Invasion Biology, Department of
Botany and Zoology, Stellenbosch University,
Matieland, South Africa
*Correspondence: A. Botes, Spatial,
Physiological and Conservation Ecology Group,
Department of Botany and Zoology,
Stellenbosch University, Private Bag X1,
Matieland 7602, South Africa.
E-mail: [email protected]
ABSTRACT
Aim Climate-modelling exercises have demonstrated that the Cape Floristic
Region is highly sensitive to climate change and will apparently lose much of its
northern limits over the next few decades. Because there is little monitoring of
diversity in this area, ant assemblage structure was investigated within the main
vegetation types in the Greater Cederberg Biodiversity Corridor. In particular, we
sought to determine how ant assemblage structure differs between the main
vegetation types, how restricted ants – and in particular the major
myrmecochores – are to the major vegetation types, and which environmental
variables might underlie differences in the ant assemblages and in the specificity
of species to particular areas.
Location Northern Cape Floristic Region, Western Cape, South Africa.
Methods Sampling was undertaken during October 2002 and March 2003
across an altitudinal gradient ranging from sea level (Lambert’s Bay) to c. 2000 m
a.s.l. (Sneeukop, Cederberg) and down again to 500 m a.s.l. (Wupperthal) in the
Western Cape, South Africa. Pitfall traps were used to sample ants at 17
altitudinal bands, stretching over three vegetation types (Strandveld, Mountain
Fynbos and Succulent Karoo). Biotic and abiotic environmental variables were
collected at each sampling site. Generalized linear models were used to determine
the relationships between species richness, density, abundance and the abundance
of the major myrmecochores, and the environmental variables. Redundancy
analysis was used to determine the relationship between ant assemblage structure
and the environmental variables. The Indicator Value Method was used to
identify characteristic ant species for each vegetation type and altitudinal site.
Results Temperature explained significant proportions of the variation in
species density and abundance, and, together with area and several vegetation
variables, contributed significantly to the separation of the assemblages in the
major vegetation types and biomes. Four major myrmecochores were identified
[Anoplolepis sp. (cf. custodiens), Anoplolepis sp. (cf. steinergroeveri), Camponotus
niveosetosus, Tetramorium quadrispinosum]. The abundances of the two
Anoplolepis species were related to vegetation variables, while the abundance of
the other two species showed opposite relationships with temperature variables.
Fourteen ant species were characteristic of certain vegetation types and altitudes.
Several of these species contributed to the differences between the assemblages.
Main conclusions There are likely to be substantial and complex changes to
ant assemblages as climates change in the northern Cape Floristic Region.
Moreover, the importance of ants for ecosystem functioning suggests that these
responses are not only likely to be a response solely to vegetation changes, but
might also precipitate vegetation changes. The changes that are predicted to take
place in the next 50 years in the Cape Floristic Region could be substantially
exacerbated by such synergistic effects, which have major implications for
Journal of Biogeography (J. Biogeogr.) (2006) 33, 71–90
ª 2005 Blackwell Publishing Ltd www.blackwellpublishing.com/jbi doi:10.1111/j.1365-2699.2005.01336.x 71
INTRODUCTION
The Cape Floristic Region (CFR) is a major biodiversity
hotspot of global significance (Myers, 1990; Cowling &
Richardson, 1995; Mittermeier et al., 1998). It is both the
smallest and richest floral kingdom with c. 8700 plant species
(Low & Rebelo, 1996), of which 68% are endemic (Bond &
Goldblatt, 1984). The region has a high concentration of Red
Data Book plant species (i.e. 1406 species: Cowling & Hilton-
Taylor, 1994), and is listed as a Centre of Plant Diversity
(WWF and IUCN 1994) and a Global 200 Ecoregion (Olson &
Dinerstein, 1998). It is also home to several endemic vertebrate
species and is an Endemic Bird Area (Stattersfield et al., 1998).
The CFR includes five biomes (Nama- and Succulent Karoo,
Thicket, Forest and Fynbos) of which the dominant and most
characteristic biome is the Fynbos (Low & Rebelo, 1996).
However, the Succulent Karoo is also a biome of considerable
significance. It has the richest succulent flora (c. 1000 sp.)
globally, like Fynbos is extremely species rich at both regional
and local scales, and is the only semi-arid region that qualifies
as a biodiversity hotspot of global significance (Cowling &
Hilton-Taylor, 1994; Cowling et al., 1999).
The considerable biodiversity of the CFR is threatened by
land transformation for agriculture and urban development,
and by alien plant invasions (Todd & Hoffman, 1999; Rouget
et al., 2003b). At present, c. 30% of the area is transformed by
agriculture (25.9%), urbanization (1.6%) and alien vegetation
(1.6%) (Rouget et al., 2003b). Some of the lowland habitats
have been reduced by as much as 90% (Rouget et al., 2003a),
and it is predicted that at least 30% of the remaining natural
vegetation will be transformed within the next 20 years
(Rouget et al., 2003b). Moreover, climate-modelling exercises
have demonstrated that the Fynbos in the Cape Floristic
Region (CFR) is likely to be highly sensitive to climate change
(Midgley et al., 2003; Hannah et al., 2005). It is thought that
within 50 years Fynbos will be largely replaced with a different,
unknown vegetation type. Climate change models predict that,
over this period, the CFR will experience a 1.8 �C increase in
mean annual regional temperature and that this area will be
faced with significantly more arid conditions (Midgley et al.,
2003). The Fynbos biome will apparently lose large areas near
its northern limits (retaining less than 10%, Midgley et al.,
2002), especially those along the west coast and in the
Cederberg mountains (Midgley et al., 2002, 2003). Biome loss
will occur at all altitudes, and will only be less than 50% at
altitudes between 1800 and 2100 m. Slopes at lower altitudes
along the northern borders of the Cape Fold Belt will also
become unsuitable for this biome and it is predicted that the
range of Fynbos will contract southwards into this mountain
range (see Midgley et al., 2003). In addition, the Nama- and
Succulent Karoo are also under threat and it is predicted that
between 0.3% and 42.4% of species will become extinct within
protected areas in these biomes (Rutherford et al., 1999).
Given the predictions of significant loss of biodiversity in
the CFR, conservation planning strategies for a future of
change in the area are in place [including Cape Action for
People and the Environment (CAPE) and the Succulent Karoo
Ecosystem Plan (SKEP): see Cowling & Pressey (2003); Younge
& Fowkes (2003) and Driver et al. (2003) for extensive
overviews of aims and progress]. These ecoregional conserva-
tion planning strategies not only incorporate current richness
assessments, but also processes such as migration, major areas
of evolution such as ecotones and expected local-scale range
shifts in response to climate change (Pressey et al., 2003).
Furthermore, the plans include consideration of ecosystem
functioning aspects such as specialist pollination relationships,
plant–herbivore interactions and fire regimes (Pressey et al.,
2003). The strategic plans have largely been based on
information on plants (especially the Proteaceae), as well as
expert knowledge regarding medium- and large-sized mam-
mal, freshwater fish, amphibian and reptile distributions
(Cowling & Pressey, 2003; Cowling et al., 2003; Kerley et al.,
2003). However, other groups will also be affected by
landscape transformations and climate change (e.g. Erasmus
et al., 2000), and the processes included in the strategies are a
subset of those that need to be taken into consideration if
conservation is to be successful over the longer term (see e.g.
Rodrigues et al., 2000). Nevertheless, their absence in these
plans and the planning processes that gave rise to them is not a
consequence of lack of concern, but rather the absence of
adequate information (Cowling et al., 2003). A prime example
is ant diversity, and one of the most significant processes in
which ants are involved, myrmecochory.
Myrmecochory (seed dispersal by ants) is an important
ecological process in the Fynbos biome (Le Maitre & Midgley,
1992). Indeed, c. 20% of the 6500 strictly Fynbos plant species
(i.e. 1300 species) are dependent on myrmecochory for their
survival (Johnson, 1992). The only other comparable area is
Australia with 1500 ant-dispersed plants, with the rest of the
world containing a mere 300 species (Berg, 1975). In South
Africa, myrmecochorous plants are mainly restricted to the
Fynbos biome. A total of 29 families and 78 genera of Fynbos
plants has been identified as containing species that are
ant-dispersed (see Table 1 in Bond & Slingsby, 1983).
long-term conservation plans. Ongoing monitoring of this transect will reveal the
nature and pace of the change as it unfolds.
Keywords
Ants, climate change, conservation, myrmecochores, spatial autocorrelation,
species–environment relationships, South Africa, species richness.
A. Botes et al.
72 Journal of Biogeography 33, 71–90, ª 2005 Blackwell Publishing Ltd

Myrmecochory occurs only in two plant families outside
Fynbos, the Euphorbiaceae and Zygophyllaceae (Bond &
Slingsby, 1983).
Myrmecochorous ants belong to four subfamilies: Dolicho-
derinae, Formicinae, Myrmicinae and Ponerinae (Gomez &
Espadaler, 1998). In the CFR the dominant myrmecochorous
ants are Pheidole capensis, Anoplolepis sp. (cf. custodiens),
Anoplolepis sp. (cf. steinergroeveri), Tetramorium quadrispino-
sum and Camponotus niveosetosus (Bond & Slingsby, 1983,
1984). However, information on the extent of the habitat
specificity of myrmecochorous ants is not widely available,
especially for the areas in the CFR predicted to change rapidly
in the next few years. Slingsby & Bond (1985) concluded that
Anoplolepis sp. (cf. custodiens), Anoplolepis sp. (cf. steinergroe-
veri) and P. capensis are ubiquitous in both mesic and arid areas
of Fynbos, and the presence of Anoplolepis sp. (cf. custodiens)
has been reported throughout Africa (Prins, 1963; Breytenbach,
1988). Moreover, no myrmecochorous ant species have been
studied in terms of their likely direct and indirect (via
vegetation change) responses to climate change. If they were
to be substantially influenced by such change, thus also
affecting the plant species with which they interact, then
conservation plans that are based partially on plant data might
prove to be inadequate for capturing likely change. To date only
the influences of invasive ant species such as the Argentine ant,
Linepithema humile (e.g. Bond & Slingsby, 1984; Midgley &
Bond, 1995; Gomez & Oliveras, 2003), and exotic plant species,
such as Australian Acacia (French & Major, 2001), on seed
dispersal by ants have been investigated. Indeed, no monitoring
systems exist for insect assemblages in the CFR.
Here we address these issues by investigating ant assemblage
structure within the main vegetation types in a northern CFR
area, the Cederberg. In particular, we determine if and how ant
assemblage structure differs between the main vegetation types
in the Greater Cederberg Biodiversity Corridor (GCBC), how
restricted ants, and in particular the major myrmecochores, are
to specific vegetation types, and which environmental variables
might underlie differences in the ant assemblages and in the
specificity of species to particular areas.
MATERIAL AND METHODS
Study site
This study took place in the Greater Cederberg Biodiversity
Corridor. This mega-reserve spans a west–east gradient from
coastal lowlands, Mountain Fynbos to Succulent Karoo, and
includes the northern most extremity of the CFR with the
Cederberg Wilderness Area forming the core (Anonymous,
2004). Specifically, this study was conducted across an
altitudinal transect covering the major vegetation types on
both aspects of the Cederberg, encompassing the full range of
vegetation. The transect ranged from sea level at Lambert’s Bay
to Sneeukop (1926 m a.s.l.) then down the eastern slopes to
Wupperthal (c. 500 m a.s.l.) (Fig. 1). A total of seventeen
altitudinal bands was sampled at 200-m altitudinal intervals
across the transect (see Appendix S1 in Supplementary
Material) representing Strandveld Succulent Karoo (one site),
Mountain Fynbos (15 sites) and Lowland Succulent Karoo
(one site).
Strandveld Succulent Karoo is characterized by low, scat-
tered succulent shrubs such as Zygophyllum morgsana (Tor-
toisebush), Euphorbia mauritanica (Fragmenting Milkbush)
and E. burmannii (Poison Milkbush) and stretches from the
Berg River Mouth in the south to Alexander Bay in the north
(Hoffman, 1996). Rainfall is generally low (50–300 mm:
Hoffman, 1996) and the geology of this biome is characterized
by dune sand with highly calcareous areas.
Table 1 Species density and abundance of
ants collected in the different vegetation typesVegetation n S N Species density (mean ± SE) Abundance (mean ± SE)
Strandveld 8 14 6490 6.63 ± 0.26 811.25 ± 199.93
Restioid Fynbos 24 47 13,155 12.08 ± 0.38 548.13 ± 106.12
Proteoid Fynbos 24 48 32,203 14.38 ± 0.47 1341.80 ± 137.45
Ericaceous Fynbos 64 58 16,824 10.13 ± 0.32 262.88 ± 57.32
Alpine Fynbos 8 23 707 5.88 ± 1.22 88.38 ± 39.84
Succulent Karoo 8 14 3000 7.50 ± 0.33 375.00 ± 55.940
n, number of sampling grids; S, total species density; N, total abundance.
Sampling grid (10 pitfall traps)
Each altitude(4 groups of 10 pitfall traps)
10 m
Lamberts bay(sea level)
Sneeukop(1926 m)
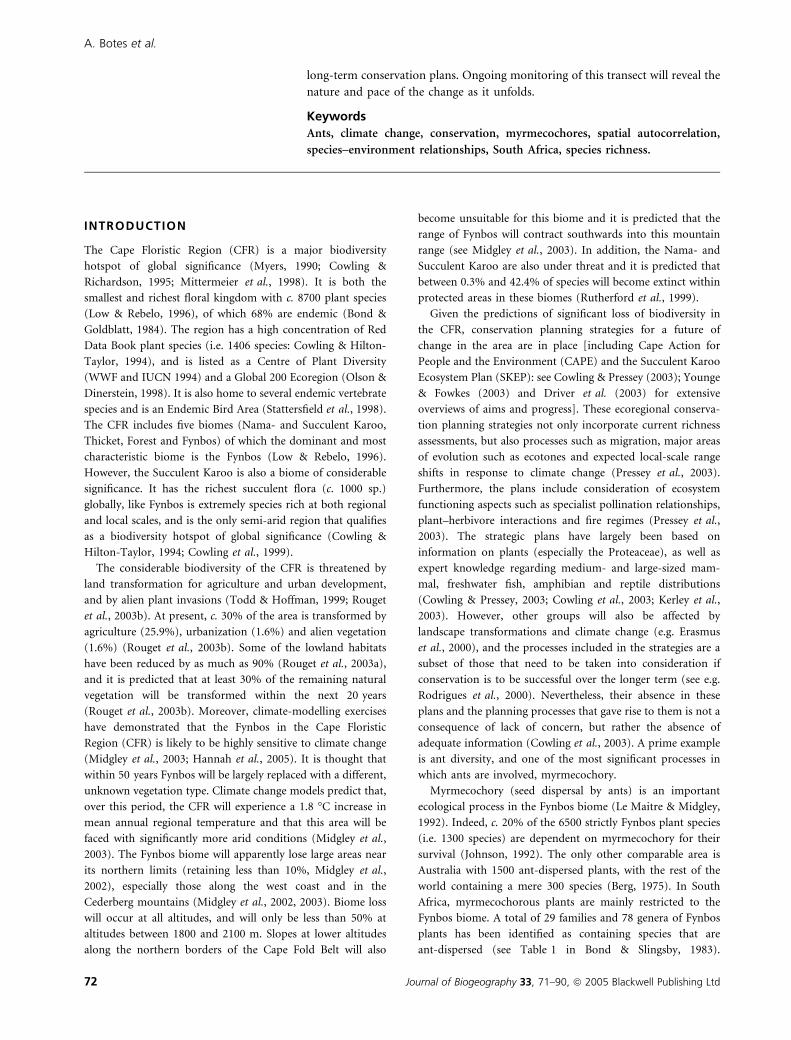
Figure 1 Sampling layout of the transect ranging from Lambert’s
Bay, over the Cederberg and down to Wupperthal. Sampling was
conducted in October 2002 and again during March 2003 in the
same areas.
Ant assemblages in the Cederberg
Journal of Biogeography 33, 71–90, ª 2005 Blackwell Publishing Ltd 73
Three main plant families characterize Mountain Fynbos:
Restionaceae (restios), Ericaceae (heaths) and Proteaceae
(proteas) (Rebelo, 1996). In the Cederberg district the
Proteaceae constitutes the dominant overstorey in Fynbos
(63 species of which seven are endemic to the area) and the
majority of species are confined to the Fynbos biome
(Rebelo, 1996). The geology of these areas is mostly
quartzitic sandstone with shale and conglomerate lenses.
Rainfall varies from 200 to over 2000 mm year)1 (Low &
Rebelo, 1996).
The Mountain Fynbos can be further classified into
structural units (or types) based on the dominant plant
families at each of the sites (following Campbell, 1985; see
also Cowling & Holmes, 1992). These structural units are
Restioid, Proteoid and Ericaceous Fynbos. Three sampling
sites were located in Restioid Fynbos along the transect, at
200 and 900 m a.s.l. in the western slope and at 900 m a.s.l.
on the eastern slope (see Appendix S1). At these sites the
vegetation is dominated by a high cover (> 60%) of
Restionaceae, or restios and sedges (900-m site on the
western slope). Protea nitida and Leucadendron salignum
occur at the 200-m site but constitute less than 10% of the
cover. This site could thus still be classified as Restioid
Fynbos (see Campbell, 1985). All three sites have gentle
slopes (see Appendix S1).
Proteoid Fynbos only occurs on the western slope of the
transect at the 300-, 500- and 700-m sites (see Appendix S1).
At the 300-m site (Sawadee), the vegetation type is ecotonal,
with both Fynbos and Succulent Shrubland elements, such as
non-ericaceous, ericoid-leaved shrubs (e.g. Passerina and
Phylica) (L. Agenbag, pers. comm.). However, the dominant
vegetation is proteoid and this site was thus included in the
Proteoid Fynbos structural unit (Campbell, 1985). The 500-
and 700-m sites are dominated by dense protea-dominated
vegetation with restioids in the mid- to understorey. The sites
in this vegetation type have steeper slopes than those sites in
Restioid Fynbos (see Appendix S1).
The vegetation turns to Ericaceous Mountain Fynbos above
900 m along the transect on both western and eastern slopes
(see Appendix S1) (Campbell, 1985). Eight sites were located
in this structural unit, four on the western slope and four on
the eastern slope (Table 1). The western and eastern slope
Ericaceous Fynbos are very similar, both with a high restioid
component. The two sites at 1700 m just below Sneeukop were
placed on very steep slopes compared with the other sampling
sites (see Appendix S1).
In drier areas (e.g. between the Cederberg mountain range
and Wupperthal) Mountain Fynbos is replaced by Lowland
Succulent Karoo (Low & Rebelo, 1996), which is dominated by
small, scattered shrubs such as Mesembryanthemaceae
(vygies), Crassulaceae (stonecrops) and Asteraceae (daisies).
This biome is extremely arid and one sampling area was
located in this habitat type on top of Singkop in Wupperthal
(see Appendix S1). The geology of this area is dominated by
siltstone and shale. Rainfall ranges between 50 and
200 mm year)1 (Low & Rebelo, 1996).
Vegetation sampling
Vegetation structure was recorded at each sampling grid in
October 2002 and March 2003 to determine the horizontal and
vertical distribution of the vegetation. The horizontal distribu-
tion of vegetation was determined by estimating the coverage
of the soil surface by vegetation, leaf litter, exposed rock and
bare ground following the methods outlined by Rotenberry &
Wiens (1980), Bestelmeyer & Wiens (1996) and Parr et al.
(2004). A 1-m2 grid was placed over each pitfall trap (see Ant
sampling below) and the percentage of ground covered by the
four categories within the grid was estimated. Mean ground
cover was calculated for each sampling grid (i.e. each group of
10 pitfall traps).
The vertical distribution (relative vertical complexity) of the
vegetation was measured by determining foliage height profiles
using techniques similar to those of Rotenberry & Wiens
(1980) and Bestelmeyer & Wiens (1996). Vegetation height was
measured at four points located at 90� angles on a 1.5-m radius
centred on each pitfall trap. At each of these sampling points a
1.5-m rod was placed vertically through the vegetation and the
number of contacts with vegetation (hits) was recorded at 25-
cm height increments (0–25, 26–50, 51–75, 76–100, 101–125,
125–150, 150+ cm). The average total number of hits per
sample point was calculated as a measure of the changing
vertical distribution of vegetation (Rotenberry & Wiens, 1980).
The maximum height at each sampling point was taken as the
highest 25-cm height interval where vegetation contacts were
recorded (Rotenberry & Wiens, 1980).
One soil sample of 20 cm3 (see Tan, 1996) was taken during
October 2002 at each sampling grid to ascertain soil characteristics.
At each sampling grid 20 subsamples were taken randomly and
then mixed to make up one sample from which the 20 cm3 was
taken. The soil samples were air-dried in the laboratory for at least
10 days. The soil samples were analysed for composition (sand,
silt, clay and rock), pH (McLean, 1982), K, Na, Ca and Mg
(Chapman, 1965), P (Bray & Kurtz, 1945), C (Nelson & Sommers,
1982), NO3, H and conductivity (United States Salinity Laboratory
Staff, 1954) by BemLab (Pty Ltd.), Somerset West, South Africa.
Two Thermocron iButtons (Semiconductor Corporation,
Dallas/Maxim, TX, USA) were buried 10 mm beneath the soil
surface at each sampling site (in an area where vegetation cover
was low to ensure minimum shade cover) to measure soil
temperature. This was done in June 2002 and data recordings are
currently ongoing. The iButtons were set to record temperature
at 1-h intervals. The data collected from June 2002 to October
2003 were used to calculate the following temperature param-
eters for each altitudinal band across the 16-month period: mean
monthly temperature; mean monthly maximum and minimum
temperatures; mean monthly temperature range; and absolute
maximum and minimum temperature.
Ant sampling
Epigaeic ants were sampled along the altitudinal gradient
during October 2002 and March 2003 by pitfall trapping. A
A. Botes et al.
74 Journal of Biogeography 33, 71–90, ª 2005 Blackwell Publishing Ltd
total of forty pitfall traps, divided into four groups of 10
pitfalls each was placed at each site during each sampling event
(Fig. 1). The four groups of pitfall traps were placed in such a
way that they were at least 300 m apart. GPS readings were
taken of the location of each group of 10 pitfalls for spatial
analyses. The 10 traps were laid out in a grid (2 · 5) with traps
spaced at 10-m intervals (Fig. 1). The disturbance caused by
placing the pitfall traps was minimized and the vegetation
around the traps was not cleared. The ‘digging-in’ effect
(Greenslade, 1973) was thus considered negligible and the
traps were set immediately. The traps contained 50 mL of a
50% propylene glycol solution as preservative, which does not
significantly attract or repel ants (Adis, 1979). All pitfall traps
were left open for a period of 5 days per sampling event. The
samples were washed and placed in 70% ethanol in the
laboratory and then sorted for ants. Ants were identified to
species where possible or assigned to morphospecies. Voucher
specimens of each species collected are held at the University of
Stellenbosch and will be placed in the Iziko Museums of Cape
Town.
Data analysis
Sample-based rarefaction curves for the ants were compiled
separately for the sites to determine the degree of sampling
representivity (EstimateS V5, Colwell, 2000, http://vice-
roy.eeb.uconn.edu/estimates; see also Gotelli & Colwell,
2001). The nonparametric Incidence Coverage Estimator
(ICE) and Michaelis–Menten richness estimate provided by
EstimateS were used to evaluate sample-size adequacy (Colwell
& Coddington, 1994). Sampling may be considered adequate
when the sample-based rarefaction curves and the two
estimators converge closely at the highest observed values
(Longino et al., 2002). The ICE is a robust measure indicating
sampling completeness because it stabilizes well and is
independent of sample size (Longino et al., 2002).
When sample-based rarefaction curves are used to compare
different data sets, the comparison made is one of species
density (the number of species per unit area) and not
species richness (Gotelli & Colwell, 2001). To compare the
species richness values of sites, individual-based rarefaction
must be used (Gotelli & Colwell, 2001). These curves
standardize different data sets on the basis of number of
individuals and not on number of samples. Individual-based
rarefaction curves were computed in EstimateS using the
Coleman method (Coleman, 1981). Thereafter, the curves were
rarefied to the lowest number of individuals recorded at a site
to ensure valid comparisons of species richness between
different sites (Gotelli & Colwell, 2001).
Because of the influence that available area has on species
richness patterns (Rosenzweig, 1995), the species–area rela-
tionship was determined for both species richness and density
across the altitudinal gradient using Generalized Linear Models
assuming a Poisson error distribution (log link function, Type
III model: Dobson, 2002). The available area was calculated
across the Cederberg region (18�15¢–19�45¢ E; 32�00¢–
32�45¢ S). The range of altitudes was divided into 200-m
bands (each site was situated in an altitudinal band) and the
total area in each altitudinal band within the Cederberg region
was calculated using ArcView GIS 3.3 (see Appendix S1). This
was done separately for the eastern and the western slopes.
Collinearity in the abiotic variables (six temperature and 15
soil parameters, available area, altitude) and biotic variables
(six vegetation parameters and post-fire vegetation age in
Mountain Fynbos) was determined using Pearson’s product–
moment correlations. This was done separately for the abiotic
and biotic variables. When variables were significantly corre-
lated (and with r > 0.50) one of them was excluded from
further analyses, based on a consideration of its likely
biological relevance. The structure of the correlograms (see
below) of the independent variables was also compared to
assist in decisions about which variables to exclude. This
approach did not alter the final choice of variables and
therefore the full set of correlograms is not shown. The
relationships between the abiotic and biotic variables chosen
for analyses were then determined, again using Pearson’s
product–moment correlations, to refine the selection of
variables by excluding collinear variables. When abiotic and
biotic variables were significantly correlated (and with
r > 0.50), one of the variables was excluded using the above
protocol. These and the following analyses were performed for
both the full transect and for a subset thereof in Mountain
Fynbos. Mountain Fynbos constituted over 85% of the
transect, and the climate change predictions for the region
are for this biome (Midgley et al., 2002, 2003). Differences in
ant assemblage structure between the within (the dominant
biome only) and across biome predictors were also examined.
The proportion of the variation explained in ant species
density and abundance by spatial position and the environ-
mental variables (abiotic and biotic) was determined using
trend surface analysis and partial regression approaches
(Legendre & Legendre, 1998). This was done for total species
density and total abundance per site across the whole transect,
then for total species density and total abundance in each site
in Mountain Fynbos, and finally for the total abundance of the
dominant myrmecochorous species separately collected at each
site across the whole transect. Generalized Linear Models
assuming a Poisson error distribution with a log link function
(Type III model corrected for overdispersion) were used.
Following Legendre & Legendre (1998), trend surface
analysis was first applied to determine the best-fit combination
of spatial variables that contributed significantly to explaining
the variation in the dependent variables. The spatial component
of the variation in species density and abundance was modelled
using a third-order polynomial that extracts linear and more
complex spatial features (e.g. patches and gaps) from the data:
f ðx; yÞ ¼ b0 þ b1x þ b2y þ b3x2 þ b4xy þ b5y2 þ b6x3
þ b7x2y þ b8xy2 þ b9y3;
where x and y are longitude and latitude respectively (Borcard
et al., 1992; Legendre, 1993). Generalized linear models were
Ant assemblages in the Cederberg
Journal of Biogeography 33, 71–90, ª 2005 Blackwell Publishing Ltd 75

then performed for the environmental variables on species
density and abundance, and the best-fit model including only
significant terms obtained [Legendre & Legendre, 1998; the
only difference to the method was that we used generalized,
rather than general, linear regression to accommodate the
distribution of the dependent variables (see also McGeoch &
Price, 2004)].
Thereafter, partial linear regression analyses were conducted
in which the terms from the best-fit trend surface (spatial
component) and environmental models were combined. Thus,
the final model included both spatial and environmental terms,
and was used to partition the explained variance (deviance) in
species density and abundance into four components: (1) non-
environmental spatial (the proportion of the variance
explained by purely spatial components); (2) spatially struc-
tured environmental (the proportion of the variance explained
by both spatial and environmental components); (3) non-
spatial environmental (the proportion of the variance
explained by environmental variables independent of any
spatial structure); and (4) unexplained or residual variation
(Legendre & Legendre, 1998). This procedure identifies the
relative contribution of the environmental variables and spatial
components to the explained variation in ant density and
abundance, but it does not quantify the importance of
individual variables (Legendre & Legendre, 1998; see also
Lobo et al., 2002; van Rensburg et al., 2002).
To further understand the spatial structure in the selected
environmental variables, spatial autocorrelation analysis
(Moran’s I: see Legendre & Fortin, 1989; Legendre & Legendre,
1998) and specifically saap V4.3 (Wartenberg, 1989) was used.
Spatial correlograms based on 12 equal-frequency classes (i.e.
same number of point pairs ¼ 764) were used to graphically
present the changes in the Moran’s I coefficients (Legendre &
Legendre, 1998). Overall significance of each correlogram was
assessed with progressive Bonferroni correction and used to
correct individual distance class I values for multiple
comparisons (Wartenberg, 1989).
Canonical Community Ordination was used to relate the
species composition of the assemblages to the environmental
variables (canoco V4.5: ter Braak & Smilauer, 2002). The
relationship between ant assemblage structure within the
different vegetation types and environmental variables was
examined using redundancy analysis (RDA: ter Braak, 1994).
The analysis was first conducted for assemblages in all six
vegetation types together and then separately for those
occurring in Mountain Fynbos. The species data were log10-
transformed prior to analysis (Leps & Smilauer, 2003). A
forward selection procedure of environmental variables was
used to initially determine which of the variables significantly
explained ant assemblage structure. The significance of each
variable was judged using a Monte-Carlo permutation test (ter
Braak, 1994). The model was then rerun with only significant
explanatory variables to determine the percentage of assem-
blage variation accounted for by these variables. The results
were displayed as biplots in which environmental variables are
depicted as arrows and samples as symbols (Leps & Smilauer,
2003). Based on sample scaling, the length of the arrows
indicates the relative importance of the environmental varia-
bles in explaining species composition of the samples and the
arrows point in the expected direction of the steepest increase
thereof (Leps & Smilauer, 2003). Species–sample relationships
were also displayed as biplots to determine which species
contribute to the differences between assemblages. Only those
species with more than 30% of their variability explained by
the ordination subspace were included in the biplots (Leps &
Smilauer, 2003). Species are depicted as arrows with arrows
pointing in the direction of steepest increase in abundance
(Leps & Smilauer, 2003).
Dufrene & Legendre’s (1997) Indicator Value Method was
used to identify characteristic ant species for each vegetation
type (based on hierarchical clustering) and altitudinal site
(non-hierarchical clustering) (see McGeoch & Chown, 1998,
for discussion). Using this method, measures of specificity
(uniqueness to a site) and fidelity (frequency within that site)
are combined for each ant species independently. An Indicator
Value (IndVal) is then provided, as a percentage, for each
species. A high indicator value indicates that a species has high
fidelity and specificity to the site(s) within which it occurs and
that it can be regarded as characteristic of that particular area.
The significance of the IndVal measures for each species was
tested using a random reallocation procedure of sites among
site groups (Dufrene & Legendre, 1997). Species with
significant IndVals greater than 70% (subjective benchmark,
see van Rensburg et al., 1999; McGeoch et al., 2002) were then
regarded as indicators of a particular site.
RESULTS
Species density, richness and abundance
In total, 85 ant species, representing 24 genera (72,379
individuals), were collected during the two sampling periods
(see Appendix S2). Thirteen ant species were collected only in
October 2002 while seven species were collected only during
March 2003. Most species and genera belonged to the
subfamily Myrmicinae (48 and 12 respectively), followed by
the Formicinae (28 and 4 respectively) (see Appendix S1). The
most speciose genera were Camponotus (20 species), Tetramo-
rium (13 species) and Monomorium (12 species). Four
myrmecochore species were sampled (see Appendix S2),
although the ecological roles of species that could not be
identified to the species level are not known.
Ericaceous Fynbos had the highest total species density,
while the highest total abundance was found in Proteoid
Fynbos (Table 1). Proteoid Fynbos also had the highest mean
species density and abundance (Table 1). Strandveld and
Alpine Fynbos had the lowest mean species density, and Alpine
Fynbos had the lowest mean abundance (Table 1).
Sample-based species rarefaction curves approximated
asymptotes for the two sampling periods indicating that most
of the species at the different sites were collected (see
Appendix S3). In most cases the rarefaction curves and
A. Botes et al.
76 Journal of Biogeography 33, 71–90, ª 2005 Blackwell Publishing Ltd
estimators converged closely at the highest observed species
density for each site. Species density estimates for each of the
sites are thus considered representative (Table 2). However,
this was not the case for the 300-m site on the western slope
and the 1500-m site on the eastern slope. The reason for the
substantial difference between the observed and ICE values was
the relatively high number of singletons and doubletons.
Although we have no explanation for these exceptions, they
should be kept in mind throughout.
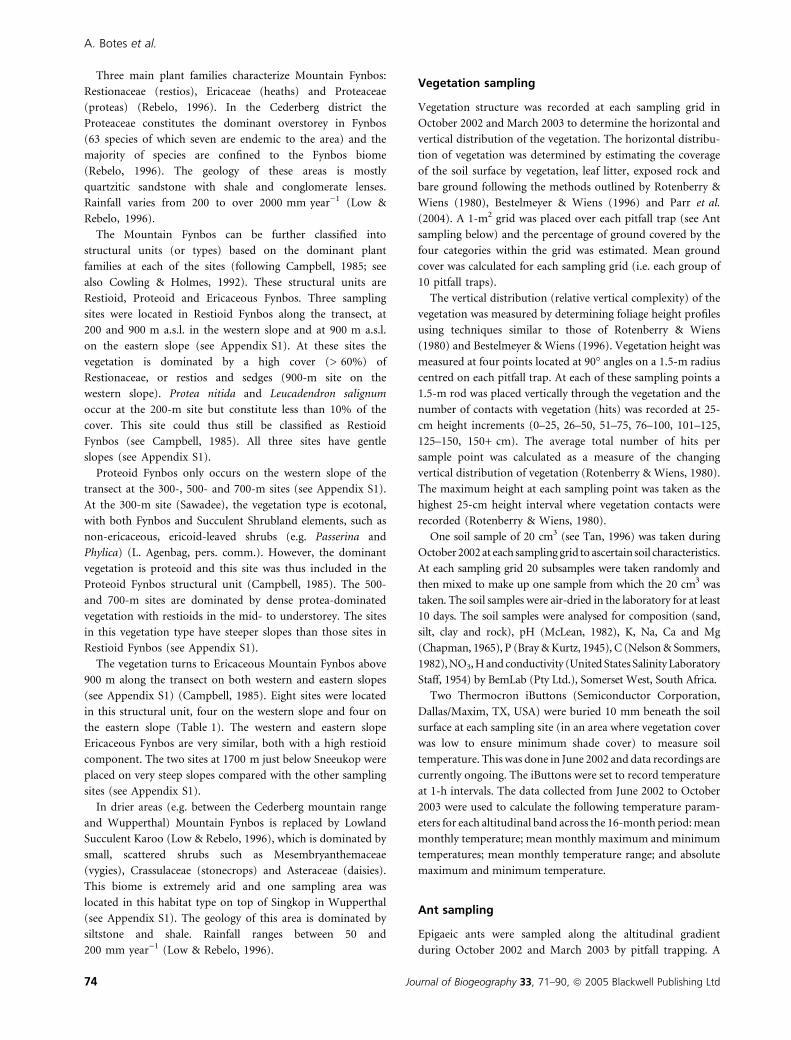
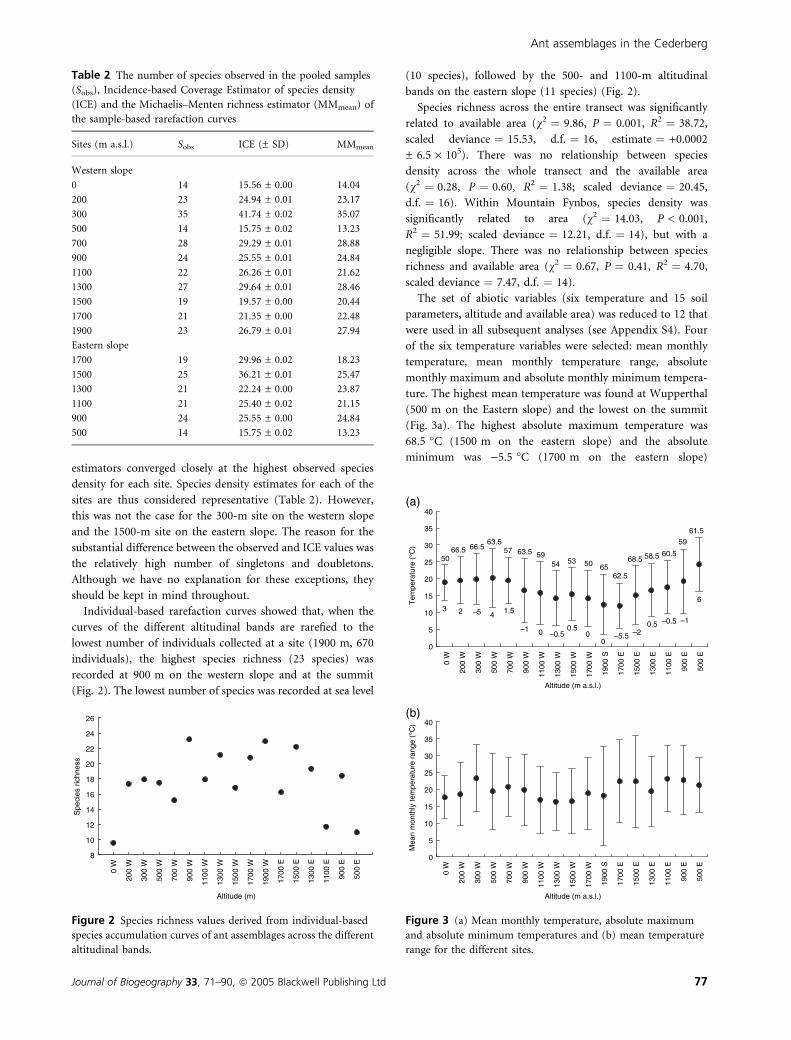
Individual-based rarefaction curves showed that, when the
curves of the different altitudinal bands are rarefied to the
lowest number of individuals collected at a site (1900 m, 670
individuals), the highest species richness (23 species) was
recorded at 900 m on the western slope and at the summit
(Fig. 2). The lowest number of species was recorded at sea level
(10 species), followed by the 500- and 1100-m altitudinal
bands on the eastern slope (11 species) (Fig. 2).
Species richness across the entire transect was significantly
related to available area (v2 ¼ 9.86, P ¼ 0.001, R2 ¼ 38.72,
scaled deviance ¼ 15.53, d.f. ¼ 16, estimate ¼ +0.0002
± 6.5 · 105). There was no relationship between species
density across the whole transect and the available area
(v2 ¼ 0.28, P ¼ 0.60, R2 ¼ 1.38; scaled deviance ¼ 20.45,
d.f. ¼ 16). Within Mountain Fynbos, species density was
significantly related to area (v2 ¼ 14.03, P < 0.001,
R2 ¼ 51.99; scaled deviance ¼ 12.21, d.f. ¼ 14), but with a
negligible slope. There was no relationship between species
richness and available area (v2 ¼ 0.67, P ¼ 0.41, R2 ¼ 4.70,
scaled deviance ¼ 7.47, d.f. ¼ 14).
The set of abiotic variables (six temperature and 15 soil
parameters, altitude and available area) was reduced to 12 that
were used in all subsequent analyses (see Appendix S4). Four
of the six temperature variables were selected: mean monthly
temperature, mean monthly temperature range, absolute
monthly maximum and absolute monthly minimum tempera-
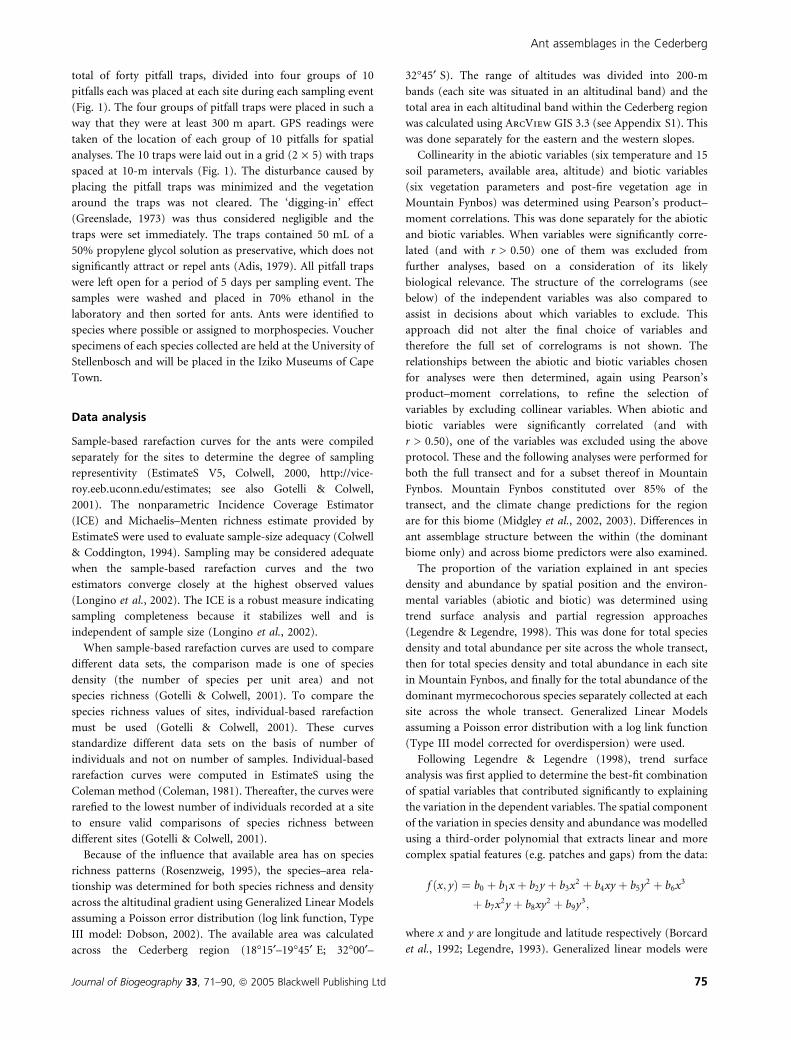
ture. The highest mean temperature was found at Wupperthal
(500 m on the Eastern slope) and the lowest on the summit
(Fig. 3a). The highest absolute maximum temperature was
68.5 �C (1500 m on the eastern slope) and the absolute
minimum was )5.5 �C (1700 m on the eastern slope)
Table 2 The number of species observed in the pooled samples
(Sobs), Incidence-based Coverage Estimator of species density
(ICE) and the Michaelis–Menten richness estimator (MMmean) of
the sample-based rarefaction curves
Sites (m a.s.l.) Sobs ICE (± SD) MMmean
Western slope
0 14 15.56 ± 0.00 14.04
200 23 24.94 ± 0.01 23.17
300 35 41.74 ± 0.02 35.07
500 14 15.75 ± 0.02 13.23
700 28 29.29 ± 0.01 28.88
900 24 25.55 ± 0.01 24.84
1100 22 26.26 ± 0.01 21.62
1300 27 29.64 ± 0.01 28.46
1500 19 19.57 ± 0.00 20.44
1700 21 21.35 ± 0.00 22.48
1900 23 26.79 ± 0.01 27.94
Eastern slope
1700 19 29.96 ± 0.02 18.23
1500 25 36.21 ± 0.01 25.47
1300 21 22.24 ± 0.00 23.87
1100 21 25.40 ± 0.02 21.15
900 24 25.55 ± 0.00 24.84
500 14 15.75 ± 0.02 13.23
Altitude (m)
Spe
cies
ric
hnes
s
8
10
12
14
16
18
20
22
24
26
0 W
200
W
300
W
500
W
700
W
900
W
1100
W
1300
W
1500
W
1700
W
1900
W
1700
E
1500
E
1300
E
1100
E
900
E
500
E
Figure 2 Species richness values derived from individual-based
species accumulation curves of ant assemblages across the different
altitudinal bands.
Altitude (m a.s.l.)
Tem
pera
ture
(°C
)
0
5
10
15
20
25
30
35
40(a)
5066.5 66.5
63.557 63.5 59
54 53 50 6562.5
68.5 58.5 60.5
59
61.5
3 2 –5 4 1.5
–1 0 –0.50.5
00
–5.5 –20.5 –0.5 –1
6
Altitude (m a.s.l.)
Mea
n m
onth
ly te
mpe
ratu
re r
ange
(°C
)
0
5
10
15
20
25
30
35
40(b)
0 W
200
W
300
W
500
W
700
W
900
W
1100
W
1300
W
1500
W
1700
W
1900
S
1700
E
1500
E
1300
E
1100
E
900
E
500
E
0 W
200
W
300
W
500
W
700
W
900
W
1100
W
1300
W
1500
W
1700
W
1900
S
1700
E
1500
E
1300
E
1100
E
900
E
500
E
Figure 3 (a) Mean monthly temperature, absolute maximum
and absolute minimum temperatures and (b) mean temperature
range for the different sites.
Ant assemblages in the Cederberg
Journal of Biogeography 33, 71–90, ª 2005 Blackwell Publishing Ltd 77
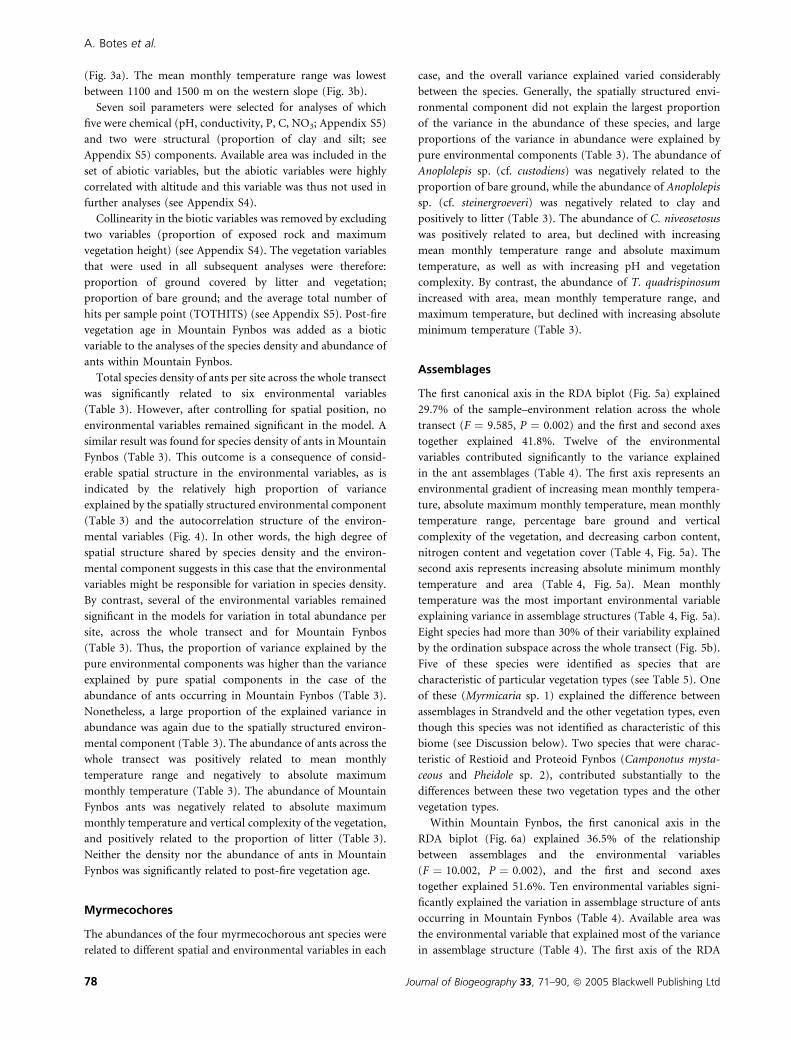
(Fig. 3a). The mean monthly temperature range was lowest
between 1100 and 1500 m on the western slope (Fig. 3b).
Seven soil parameters were selected for analyses of which
five were chemical (pH, conductivity, P, C, NO3; Appendix S5)
and two were structural (proportion of clay and silt; see
Appendix S5) components. Available area was included in the
set of abiotic variables, but the abiotic variables were highly
correlated with altitude and this variable was thus not used in
further analyses (see Appendix S4).
Collinearity in the biotic variables was removed by excluding
two variables (proportion of exposed rock and maximum
vegetation height) (see Appendix S4). The vegetation variables
that were used in all subsequent analyses were therefore:
proportion of ground covered by litter and vegetation;
proportion of bare ground; and the average total number of
hits per sample point (TOTHITS) (see Appendix S5). Post-fire
vegetation age in Mountain Fynbos was added as a biotic
variable to the analyses of the species density and abundance of
ants within Mountain Fynbos.
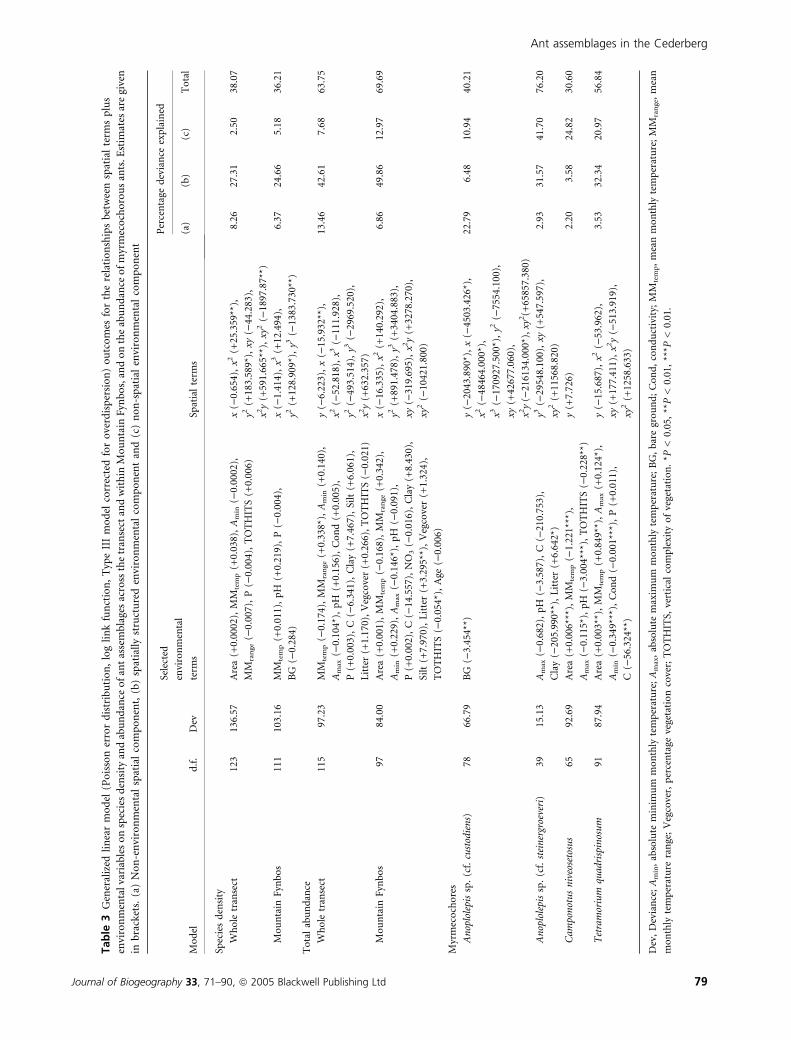
Total species density of ants per site across the whole transect
was significantly related to six environmental variables
(Table 3). However, after controlling for spatial position, no
environmental variables remained significant in the model. A
similar result was found for species density of ants in Mountain
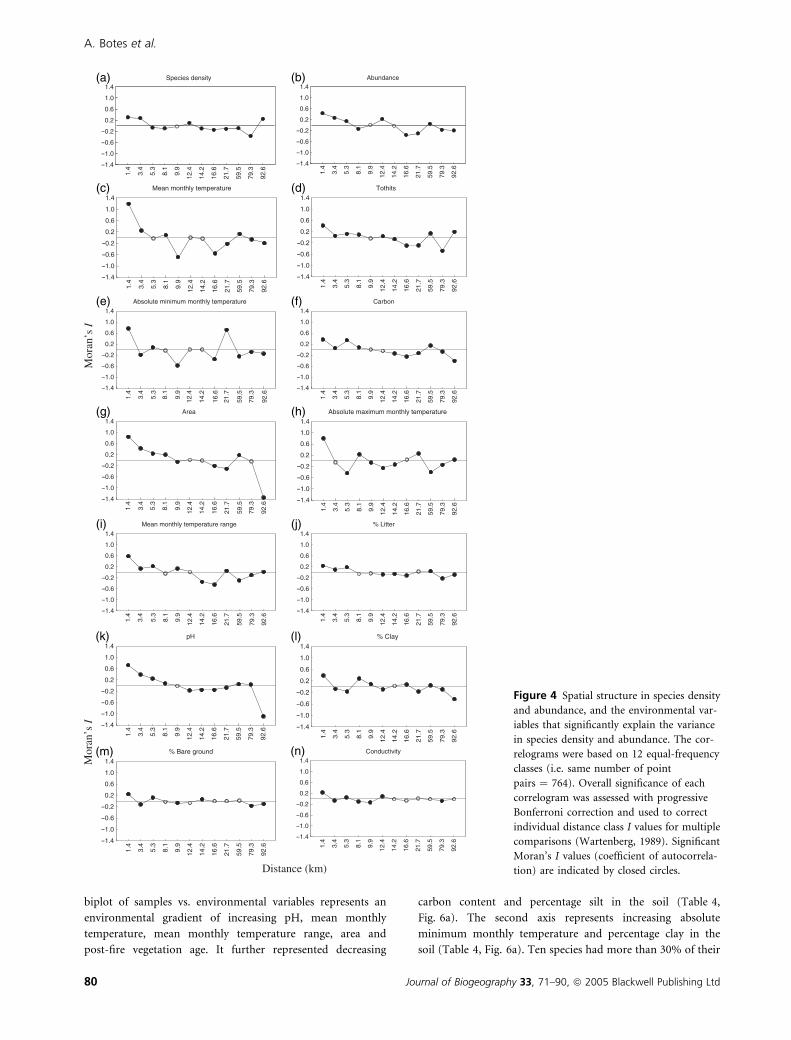
Fynbos (Table 3). This outcome is a consequence of consid-
erable spatial structure in the environmental variables, as is
indicated by the relatively high proportion of variance
explained by the spatially structured environmental component
(Table 3) and the autocorrelation structure of the environ-
mental variables (Fig. 4). In other words, the high degree of
spatial structure shared by species density and the environ-
mental component suggests in this case that the environmental
variables might be responsible for variation in species density.
By contrast, several of the environmental variables remained
significant in the models for variation in total abundance per
site, across the whole transect and for Mountain Fynbos
(Table 3). Thus, the proportion of variance explained by the
pure environmental components was higher than the variance
explained by pure spatial components in the case of the
abundance of ants occurring in Mountain Fynbos (Table 3).
Nonetheless, a large proportion of the explained variance in
abundance was again due to the spatially structured environ-
mental component (Table 3). The abundance of ants across the
whole transect was positively related to mean monthly
temperature range and negatively to absolute maximum
monthly temperature (Table 3). The abundance of Mountain
Fynbos ants was negatively related to absolute maximum
monthly temperature and vertical complexity of the vegetation,
and positively related to the proportion of litter (Table 3).
Neither the density nor the abundance of ants in Mountain
Fynbos was significantly related to post-fire vegetation age.
Myrmecochores
The abundances of the four myrmecochorous ant species were
related to different spatial and environmental variables in each
case, and the overall variance explained varied considerably
between the species. Generally, the spatially structured envi-
ronmental component did not explain the largest proportion
of the variance in the abundance of these species, and large
proportions of the variance in abundance were explained by
pure environmental components (Table 3). The abundance of
Anoplolepis sp. (cf. custodiens) was negatively related to the
proportion of bare ground, while the abundance of Anoplolepis
sp. (cf. steinergroeveri) was negatively related to clay and
positively to litter (Table 3). The abundance of C. niveosetosus
was positively related to area, but declined with increasing
mean monthly temperature range and absolute maximum
temperature, as well as with increasing pH and vegetation
complexity. By contrast, the abundance of T. quadrispinosum
increased with area, mean monthly temperature range, and
maximum temperature, but declined with increasing absolute
minimum temperature (Table 3).
Assemblages
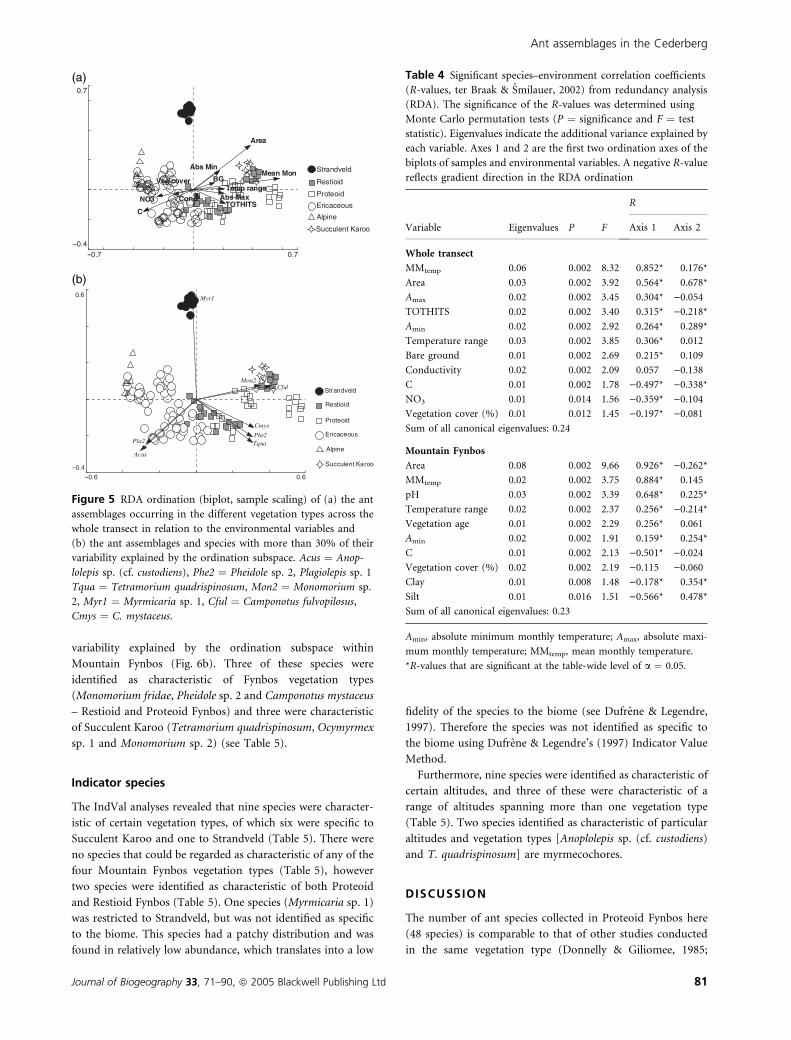
The first canonical axis in the RDA biplot (Fig. 5a) explained
29.7% of the sample–environment relation across the whole
transect (F ¼ 9.585, P ¼ 0.002) and the first and second axes
together explained 41.8%. Twelve of the environmental
variables contributed significantly to the variance explained
in the ant assemblages (Table 4). The first axis represents an
environmental gradient of increasing mean monthly tempera-
ture, absolute maximum monthly temperature, mean monthly
temperature range, percentage bare ground and vertical
complexity of the vegetation, and decreasing carbon content,
nitrogen content and vegetation cover (Table 4, Fig. 5a). The
second axis represents increasing absolute minimum monthly
temperature and area (Table 4, Fig. 5a). Mean monthly
temperature was the most important environmental variable
explaining variance in assemblage structures (Table 4, Fig. 5a).
Eight species had more than 30% of their variability explained
by the ordination subspace across the whole transect (Fig. 5b).
Five of these species were identified as species that are
characteristic of particular vegetation types (see Table 5). One
of these (Myrmicaria sp. 1) explained the difference between
assemblages in Strandveld and the other vegetation types, even
though this species was not identified as characteristic of this
biome (see Discussion below). Two species that were charac-
teristic of Restioid and Proteoid Fynbos (Camponotus mysta-
ceous and Pheidole sp. 2), contributed substantially to the
differences between these two vegetation types and the other
vegetation types.
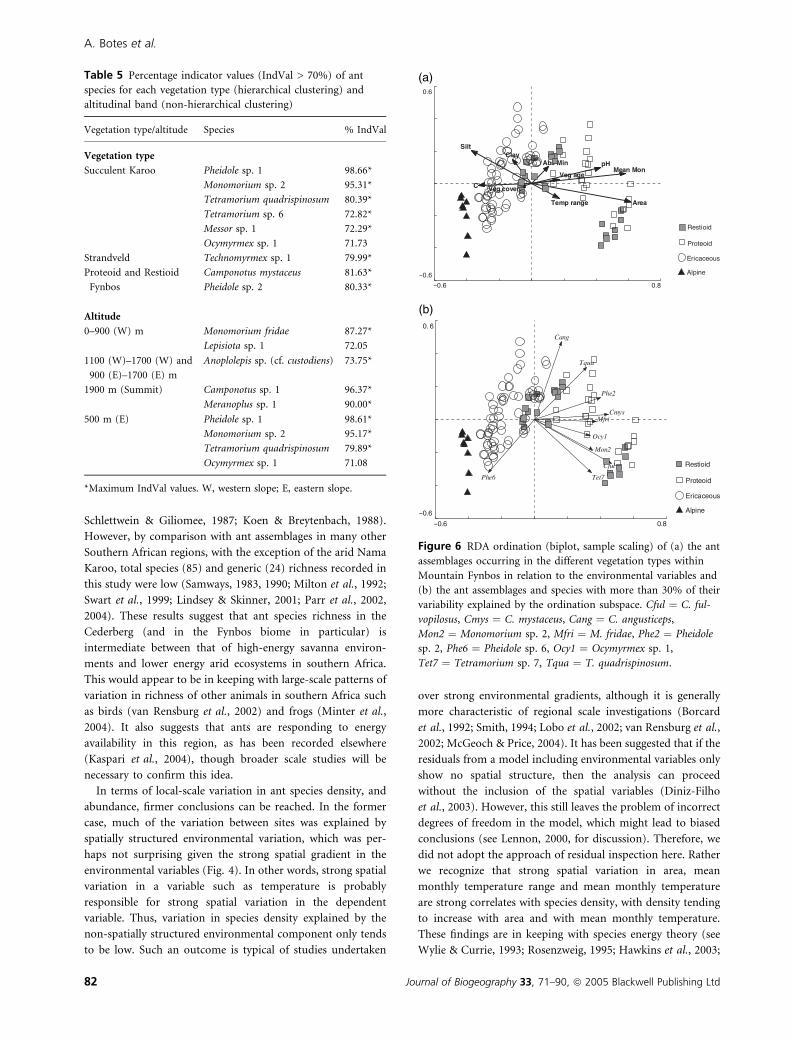
Within Mountain Fynbos, the first canonical axis in the
RDA biplot (Fig. 6a) explained 36.5% of the relationship
between assemblages and the environmental variables
(F ¼ 10.002, P ¼ 0.002), and the first and second axes
together explained 51.6%. Ten environmental variables signi-
ficantly explained the variation in assemblage structure of ants
occurring in Mountain Fynbos (Table 4). Available area was
the environmental variable that explained most of the variance
in assemblage structure (Table 4). The first axis of the RDA
A. Botes et al.
78 Journal of Biogeography 33, 71–90, ª 2005 Blackwell Publishing Ltd
Table
3G
ener
aliz
edli
nea
rm
od
el(P
ois
son
erro
rd
istr
ibu
tio
n,
log
lin
kfu
nct
ion
,T
ype
III
mo
del
corr
ecte
dfo
ro
verd
isp
ersi
on
)o
utc
om
esfo
rth
ere
lati
on
ship
sb
etw
een
spat
ial
term
sp
lus
envi
ron
men
tal
vari
able
so
nsp
ecie
sd
ensi
tyan
dab
un
dan
ceo
fan
tas
sem
bla
ges
acro
ssth
etr
anse
ctan
dw
ith
inM
ou
nta
inF
ynb
os,
and
on
the
abu
nd
ance
of
myr
mec
och
oro
us
ants
.Est
imat
esar
egi
ven
inb
rack
ets.
(a)
No
n-e
nvi
ron
men
tal
spat
ial
com
po
nen
t,(b
)sp
atia
lly
stru
ctu
red
envi
ron
men
tal
com
po
nen
tan
d(c
)n
on
-sp
atia
len
viro
nm
enta
lco
mp
on
ent
Mo
del
d.f
.D
ev
Sele
cted
envi
ron
men
tal
term
sSp
atia
lte
rms
Per
cen
tage
dev
ian
ceex
pla
ined
(a)
(b)
(c)
To
tal
Spec
ies
den
sity
Wh
ole
tran
sect
123
136.
57A
rea
(+0.
0002
),M
Mte
mp
(+0.
038)
,A
min
()0.
0002
),
MM
ran
ge
()0.
007)
,P
()0.
004)
,T
OT
HIT
S(+
0.00
6)
x()
0.65
4),
x2(+
25.3
59**
),
y2(+
183.
589*
),xy
()44
.283
),
x2y
(+59
1.66
5**)
,xy
2()
1897
.87*
*)
8.26
27.3
12.
5038
.07
Mo
un
tain
Fyn
bo
s11
110
3.16
MM
tem
p(+
0.01
1),
pH
(+0.
219)
,P
()0.
004)
,
BG
()0.
284)
x()
1.41
4),
x3(+
12.4
94),
y2(+
128.
909*
),y3
()13
83.7
30**
)
6.37
24.6
65.
1836
.21
To
tal
abu
nd
ance
Wh
ole
tran
sect
115
97.2
3M
Mte
mp
()0.
174)
,M
Mra
nge
(+0.
338*
),A
min
(+0.
140)
,
Am
ax()
0.10
4*),
pH
(+0.
156)
,C
on
d(+
0.00
5),
P(+
0.00
3),
C()
6.34
1),
Cla
y(+
7.46
7),
Silt
(+6.
061)
,
Lit
ter
(+1.
170)
,V
egco
ver
(+0.
266)
,T
OT
HIT
S()
0.02
1)
y()
6.22
3),
x()
15.9
32**
),
x2()
52.8
18),
x3()
111.
928)
,
y2()
493.
514)
,y3
()29
69.5
20),
x2y
(+63
2.35
7)
13.4
642
.61
7.68
63.7
5
Mo
un
tain
Fyn
bo
s97
84.0
0A
rea
(+0.
001)
,M
Mte
mp
()0.
168)
,M
Mra
nge
(+0.
342)
,
Am
in(+
0.22
9),
Am
ax()
0.14
6*),
pH
()0.
091)
,
P(+
0.00
2),
C()
14.5
57),
NO
3()
0.01
6),
Cla
y(+
8.43
0),
Silt
(+7.
970)
,L
itte
r(+
3.29
5**)
,V
egco
ver
(+1.
324)
,
TO
TH
ITS
()0.
054*
),A
ge()
0.00
6)
x()
16.3
35),
x2(+
140.
292)
,
y2(+
891.
478)
,y3
(+34
04.8
83),
xy()
319.
695)
,x2
y(+
3278
.270
),
xy2
()10
421.
800)
6.86
49.8
612
.97
69.6
9
Myr
mec
och
ore
s
An
oplo
lepi
ssp
.(c
f.cu
stod
ien
s)78
66.7
9B
G()
3.45
4**)
y()
2043
.890
*),
x()
4503
.426
*),
x2()
4846
4.00
0*),
x3()
1709
27.5
00*)
,y2
()75
54.1
00),
xy(+
4267
7.06
0),
x2y
()21
6134
.000
*),x
y2(+
6585
7.38
0)
22.7
96.
4810
.94
40.2
1
An
oplo
lepi
ssp
.(c
f.st
ein
ergr
oeve
ri)
3915
.13
Am
ax()
0.68
2),
pH
()3.
587)
,C
()21
0.75
3),
Cla
y()
205.
990*
*),
Lit
ter
(+6.
642*
)
y3()
2954
8.10
0),
xy(+
547.
597)
,
xy2
(+11
568.
820)
2.93
31.5
741
.70
76.2
0
Cam
pon
otu
sn
iveo
seto
sus
6592
.69
Are
a(+
0.00
6***
),M
Mte
mp
()1.
221*
**),
Am
ax()
0.11
5*),
pH
()3.
004*
**),
TO
TH
ITS
()0.
228*
*)
y(+
7.72
6)2.
203.
5824
.82
30.6
0
Tet
ram
oriu
mqu
adri
spin
osu
m91
87.9
4A
rea
(+0.
003*
*),
MM
tem
p(+
0.84
9**)
,A
max
(+0.
124*
),
Am
in()
0.34
9***
),C
on
d()
0.00
1***
),P
(+0.
011)
,
C()
56.3
24**
)
y()
15.6
87),
x2()
53.9
62),
xy(+
177.
411)
,x2
y()
513.
919)
,
xy2
(+12
58.6
33)
3.53
32.3
420
.97
56.8
4
Dev
,D
evia
nce
;A
min
,ab
solu
tem
inim
um
mo
nth
lyte
mp
erat
ure
;A
max
,ab
solu
tem
axim
um
mo
nth
lyte
mp
erat
ure
;B
G,
bar
egr
ou
nd
;C
on
d,
con
du
ctiv
ity;
MM
tem
p,
mea
nm
on
thly
tem
per
atu
re;
MM
ran
ge,
mea
n
mo
nth
lyte
mp
erat
ure
ran
ge;
Veg
cove
r,p
erce
nta
geve
geta
tio
nco
ver;
TO
TH
ITS,
vert
ical
com
ple
xity
of
vege
tati
on
.*P
<0.
05,
**P
<0.
01,
***P
<0.
01.
Ant assemblages in the Cederberg
Journal of Biogeography 33, 71–90, ª 2005 Blackwell Publishing Ltd 79
biplot of samples vs. environmental variables represents an
environmental gradient of increasing pH, mean monthly
temperature, mean monthly temperature range, area and
post-fire vegetation age. It further represented decreasing
carbon content and percentage silt in the soil (Table 4,
Fig. 6a). The second axis represents increasing absolute
minimum monthly temperature and percentage clay in the
soil (Table 4, Fig. 6a). Ten species had more than 30% of their
(a) (b)
(c) (d)
(e) (f)
(g) (h)
(i) (j)
(k) (l)
(m) (n)
Figure 4 Spatial structure in species density
and abundance, and the environmental var-
iables that significantly explain the variance
in species density and abundance. The cor-
relograms were based on 12 equal-frequency
classes (i.e. same number of point
pairs ¼ 764). Overall significance of each
correlogram was assessed with progressive
Bonferroni correction and used to correct
individual distance class I values for multiple
comparisons (Wartenberg, 1989). Significant
Moran’s I values (coefficient of autocorrela-
tion) are indicated by closed circles.
A. Botes et al.
80 Journal of Biogeography 33, 71–90, ª 2005 Blackwell Publishing Ltd
variability explained by the ordination subspace within
Mountain Fynbos (Fig. 6b). Three of these species were
identified as characteristic of Fynbos vegetation types
(Monomorium fridae, Pheidole sp. 2 and Camponotus mystaceus
– Restioid and Proteoid Fynbos) and three were characteristic
of Succulent Karoo (Tetramorium quadrispinosum, Ocymyrmex
sp. 1 and Monomorium sp. 2) (see Table 5).
Indicator species
The IndVal analyses revealed that nine species were character-
istic of certain vegetation types, of which six were specific to
Succulent Karoo and one to Strandveld (Table 5). There were
no species that could be regarded as characteristic of any of the
four Mountain Fynbos vegetation types (Table 5), however
two species were identified as characteristic of both Proteoid
and Restioid Fynbos (Table 5). One species (Myrmicaria sp. 1)
was restricted to Strandveld, but was not identified as specific
to the biome. This species had a patchy distribution and was
found in relatively low abundance, which translates into a low
fidelity of the species to the biome (see Dufrene & Legendre,
1997). Therefore the species was not identified as specific to
the biome using Dufrene & Legendre’s (1997) Indicator Value
Method.
Furthermore, nine species were identified as characteristic of
certain altitudes, and three of these were characteristic of a
range of altitudes spanning more than one vegetation type
(Table 5). Two species identified as characteristic of particular
altitudes and vegetation types [Anoplolepis sp. (cf. custodiens)
and T. quadrispinosum] are myrmecochores.
DISCUSSION
The number of ant species collected in Proteoid Fynbos here
(48 species) is comparable to that of other studies conducted
in the same vegetation type (Donnelly & Giliomee, 1985;
(a)
(b)
Figure 5 RDA ordination (biplot, sample scaling) of (a) the ant
assemblages occurring in the different vegetation types across the
whole transect in relation to the environmental variables and
(b) the ant assemblages and species with more than 30% of their
variability explained by the ordination subspace. Acus ¼ Anop-
lolepis sp. (cf. custodiens), Phe2 ¼ Pheidole sp. 2, Plagiolepis sp. 1
Tqua ¼ Tetramorium quadrispinosum, Mon2 ¼ Monomorium sp.
2, Myr1 ¼ Myrmicaria sp. 1, Cful ¼ Camponotus fulvopilosus,
Cmys ¼ C. mystaceus.
Table 4 Significant species–environment correlation coefficients
(R-values, ter Braak & Smilauer, 2002) from redundancy analysis
(RDA). The significance of the R-values was determined using
Monte Carlo permutation tests (P ¼ significance and F ¼ test
statistic). Eigenvalues indicate the additional variance explained by
each variable. Axes 1 and 2 are the first two ordination axes of the
biplots of samples and environmental variables. A negative R-value
reflects gradient direction in the RDA ordination
Variable Eigenvalues P F
R
Axis 1 Axis 2
Whole transect
MMtemp 0.06 0.002 8.32 0.852* 0.176*
Area 0.03 0.002 3.92 0.564* 0.678*
Amax 0.02 0.002 3.45 0.304* )0.054
TOTHITS 0.02 0.002 3.40 0.315* )0.218*
Amin 0.02 0.002 2.92 0.264* 0.289*
Temperature range 0.03 0.002 3.85 0.306* 0.012
Bare ground 0.01 0.002 2.69 0.215* 0.109
Conductivity 0.02 0.002 2.09 0.057 )0.138
C 0.01 0.002 1.78 )0.497* )0.338*
NO3 0.01 0.014 1.56 )0.359* )0.104
Vegetation cover (%) 0.01 0.012 1.45 )0.197* )0.081
Sum of all canonical eigenvalues: 0.24
Mountain Fynbos
Area 0.08 0.002 9.66 0.926* )0.262*
MMtemp 0.02 0.002 3.75 0.884* 0.145
pH 0.03 0.002 3.39 0.648* 0.225*
Temperature range 0.02 0.002 2.37 0.256* )0.214*
Vegetation age 0.01 0.002 2.29 0.256* 0.061
Amin 0.02 0.002 1.91 0.159* 0.254*
C 0.01 0.002 2.13 )0.501* )0.024
Vegetation cover (%) 0.02 0.002 2.19 )0.115 )0.060
Clay 0.01 0.008 1.48 )0.178* 0.354*
Silt 0.01 0.016 1.51 )0.566* 0.478*
Sum of all canonical eigenvalues: 0.23
Amin, absolute minimum monthly temperature; Amax, absolute maxi-
mum monthly temperature; MMtemp, mean monthly temperature.
*R-values that are significant at the table-wide level of a ¼ 0.05.
Ant assemblages in the Cederberg
Journal of Biogeography 33, 71–90, ª 2005 Blackwell Publishing Ltd 81
Schlettwein & Giliomee, 1987; Koen & Breytenbach, 1988).
However, by comparison with ant assemblages in many other
Southern African regions, with the exception of the arid Nama
Karoo, total species (85) and generic (24) richness recorded in
this study were low (Samways, 1983, 1990; Milton et al., 1992;
Swart et al., 1999; Lindsey & Skinner, 2001; Parr et al., 2002,
2004). These results suggest that ant species richness in the
Cederberg (and in the Fynbos biome in particular) is
intermediate between that of high-energy savanna environ-
ments and lower energy arid ecosystems in southern Africa.
This would appear to be in keeping with large-scale patterns of
variation in richness of other animals in southern Africa such
as birds (van Rensburg et al., 2002) and frogs (Minter et al.,
2004). It also suggests that ants are responding to energy
availability in this region, as has been recorded elsewhere
(Kaspari et al., 2004), though broader scale studies will be
necessary to confirm this idea.
In terms of local-scale variation in ant species density, and
abundance, firmer conclusions can be reached. In the former
case, much of the variation between sites was explained by
spatially structured environmental variation, which was per-
haps not surprising given the strong spatial gradient in the
environmental variables (Fig. 4). In other words, strong spatial
variation in a variable such as temperature is probably
responsible for strong spatial variation in the dependent
variable. Thus, variation in species density explained by the
non-spatially structured environmental component only tends
to be low. Such an outcome is typical of studies undertaken
over strong environmental gradients, although it is generally
more characteristic of regional scale investigations (Borcard
et al., 1992; Smith, 1994; Lobo et al., 2002; van Rensburg et al.,
2002; McGeoch & Price, 2004). It has been suggested that if the
residuals from a model including environmental variables only
show no spatial structure, then the analysis can proceed
without the inclusion of the spatial variables (Diniz-Filho
et al., 2003). However, this still leaves the problem of incorrect
degrees of freedom in the model, which might lead to biased
conclusions (see Lennon, 2000, for discussion). Therefore, we
did not adopt the approach of residual inspection here. Rather
we recognize that strong spatial variation in area, mean
monthly temperature range and mean monthly temperature
are strong correlates with species density, with density tending
to increase with area and with mean monthly temperature.
These findings are in keeping with species energy theory (see
Wylie & Currie, 1993; Rosenzweig, 1995; Hawkins et al., 2003;
Table 5 Percentage indicator values (IndVal > 70%) of ant
species for each vegetation type (hierarchical clustering) and
altitudinal band (non-hierarchical clustering)
Vegetation type/altitude Species % IndVal
Vegetation type
Succulent Karoo Pheidole sp. 1 98.66*
Monomorium sp. 2 95.31*
Tetramorium quadrispinosum 80.39*
Tetramorium sp. 6 72.82*
Messor sp. 1 72.29*
Ocymyrmex sp. 1 71.73
Strandveld Technomyrmex sp. 1 79.99*
Proteoid and Restioid
Fynbos
Camponotus mystaceus 81.63*
Pheidole sp. 2 80.33*
Altitude
0–900 (W) m Monomorium fridae 87.27*
Lepisiota sp. 1 72.05
1100 (W)–1700 (W) and
900 (E)–1700 (E) m
Anoplolepis sp. (cf. custodiens) 73.75*
1900 m (Summit) Camponotus sp. 1 96.37*
Meranoplus sp. 1 90.00*
500 m (E) Pheidole sp. 1 98.61*
Monomorium sp. 2 95.17*
Tetramorium quadrispinosum 79.89*
Ocymyrmex sp. 1 71.08
*Maximum IndVal values. W, western slope; E, eastern slope.
(a)
(b)
Figure 6 RDA ordination (biplot, sample scaling) of (a) the ant
assemblages occurring in the different vegetation types within
Mountain Fynbos in relation to the environmental variables and
(b) the ant assemblages and species with more than 30% of their
variability explained by the ordination subspace. Cful ¼ C. ful-
vopilosus, Cmys ¼ C. mystaceus, Cang ¼ C. angusticeps,
Mon2 ¼ Monomorium sp. 2, Mfri ¼ M. fridae, Phe2 ¼ Pheidole
sp. 2, Phe6 ¼ Pheidole sp. 6, Ocy1 ¼ Ocymyrmex sp. 1,
Tet7 ¼ Tetramorium sp. 7, Tqua ¼ T. quadrispinosum.
A. Botes et al.
82 Journal of Biogeography 33, 71–90, ª 2005 Blackwell Publishing Ltd
Evans et al., 2004), and with results from investigations of ants,
other insects and ectotherms more generally (Turner et al.,
1987; Kerr & Packer, 1999; Allen et al., 2002; Kaspari et al.,
2004). However, variation in precipitation, which is apparently
considerable across the transect (Cowling & Holmes, 1992
provide a qualitative estimate of rainfall variation for a nearby
transect, but no quantitative data are available), may also have
a substantial influence on variation in species density, thus
accounting for the generally low total variance explained in our
models. Indeed, Hawkins & Porter (2003) found that actual
evapotranspiration was the primary explanatory variable for
variation in butterfly species richness. Moreover, in water-
limited systems such as those of the southwestern Cape
(Deacon et al., 1992), water availability is much more likely to
be a strong correlate of richness than is absolute energy
availability (O’Brien et al., 2000; Hawkins et al., 2003). Linder
(1991) found this to be the case for plant species richness in
the southwestern Cape, for which rainfall was the best
predictor of species richness of several plant taxa typical of
the Cape flora.
Variation in total abundance also had a pronounced
spatially structured environmental component, for the same
reasons as those discussed above. Increases in total abundance
were strongly related to an increase in mean monthly
temperature range and a decline in absolute maximum
temperature, and in the Fynbos only were also positively
related to increasing litter and declining vegetation complexity.
Ant abundance and richness have been shown to vary
considerably with temperature in several other studies (see
Andersen, 1995; Parr et al., 2005). In general, abundance and
richness increase with an improvement in habitat quality,
which is often associated with increasing temperature (e.g.
Andersen, 1995; Cerda et al., 1998; Bestelmeyer, 2000) and
then decline as habitats become more stressful (but see also
Parr et al., 2005). Several other studies have also found
relationships between ant abundance and litter availability and
vegetation complexity. For example, Bestelmeyer & Wiens
(1996) found that species richness was dramatically greater in
areas with higher litter load, but only in the dry season. They
argued that the increased leaf litter development might buffer
the ant assemblages against a decline in the habitat suitability
(e.g. dryer conditions). Furthermore, Robertson (1999) found
that reduced litter cover (as a result of fire) might result in a
loss of cryptic species (but see also Lassau & Hochuli, 2004).
An important difference between the models for species
density and those for abundance was the considerably greater
proportion of the variation in the latter explained by the full
model (64–70%) in comparison with the former (36–38%).
Why this should be the case is not entirely clear. However, the
relationship between ant abundance (and especially the
dominant ants) and species richness is typically unimodal
(Andersen, 1992; Parr et al., 2005). Thus, species richness (or
density) can be low at both low and high abundances. If the
pattern is driven even partly by a combination of environ-
mental stress and competition, which might well be the case
(Parr et al., 2005), then the environment will appear to have a
larger linear influence on abundance than on richness, so
resulting in a greater proportion of the variance being
explained in linear models of the former, than of the latter.
This is precisely what we find.
Time since the most recent fire was never included as a
significant variable in the models for variation in species
density and abundance. It was likewise unimportant in
explaining differences between ant assemblages across the
sites. Although these results are in keeping with a well-
replicated experimental investigation of ant assemblage
responses to fire in a southern African savanna system (Parr
et al., 2004), they contrast strongly with several other studies
(Andersen & Yen, 1985; Andersen, 1991; Parr et al., 2002;
Hoffman & Andersen, 2003), including one on Fynbos ant
assemblages (Donnelly & Giliomee, 1985). These differences
may well be a consequence of the methods used, and certainly
this study did not attempt to investigate post-fire age in a well-
replicated explicit fashion (see Parr & Chown, 2003, for
discussion). Rather, time since fire was included as a variable
in the initial models and was never found to be significant. An
explicit focus on time since fire, whilst holding other variables
more constant in an appropriate experimental design, might
well reveal the effects of post-fire vegetation age on ant
assemblages. Alternatively, it may turn out that like the ant
assemblages in the fire-prone system studied by Parr et al.
(2004), those studied here may also be responsive only to
whether the vegetation has burnt or not, rather than the
subtleties of the burning regime, owing to considerable
resilience and resistance born of a long-term exposure to a
fire climax system (see Cowling, 1992, for a discussion of fire in
Fynbos systems). Carefully replicated work will be required to
distinguish these alternatives.
By contrast, temperature, area and several vegetation
variables contributed significantly to the separation of the
assemblages in the major vegetation types and biomes. These
results are not surprising given that temperature and veget-
ation structure (including proportion of bare ground) have
been found to be strong correlates of variation in ant
assemblages in a variety of other studies. For example,
Andersen (1986) found that ant assemblages were more
diverse in Australian woodland, which represents greater
structural complexity in terms of vegetation and litter (i.e.
less bare ground), compared with the less structurally diverse
heath. Furthermore, Perfecto & Vandermeer (1996) indicated
that there is significant diversity loss in ground-foraging ant
assemblages when the vegetation is altered in such a way as to
reduce shade and litter. However, they argued that this loss in
diversity is rather a consequence of indirect (alterations in
species interactions) than direct effects of habitat modifica-
tions (Perfecto & Vandermeer, 1996). Gotelli & Ellison (2002)
showed that ant density in New England bogs and forests was
related to vegetation complexity (and light availability), with
higher density (and subsequently higher species richness) in
the more complex forests, while Parr et al. (2004) showed that
bare ground and litter cover best explained overall patterns in
ant diversity in an Acacia savanna in the Kruger National Park.
Ant assemblages in the Cederberg
Journal of Biogeography 33, 71–90, ª 2005 Blackwell Publishing Ltd 83

In addition, Lassau & Hochuli (2004) found that ant
assemblages in open habitats (which are generally hotter and
drier) support a larger suite of opportunists, generalists and
hot climate specialists than those in more complex habitats.
Perhaps of most significance is the fact that these strong
relationships between temperature and vegetation variables,
and ant assemblage structure, suggest that climate change in
this region will affect ant assemblages in two ways. First,
alterations in climate such as the increase in temperature and
increase in variability of temperature predicted for the region
(Tyson, 1999; Giorgi et al., 2001; Midgley et al., 2002, 2003)
will almost certainly push assemblages from left to right on
Fig. 5 if these correlates have a causal basis: that is, higher
altitude assemblages such as those typical of Alpine and
Ericaceous Fynbos will slowly give way to those more
characteristics of Proteoid and Restioid Fynbos, and ultimately
Succulent Karoo. In other words, high-altitude assemblages are
likely to disappear, and along with them their characteristic
species (Camponotus sp. 1, Meranoplus sp. 1: see Table 6).
Secondly, changes in vegetation associated with alterations in
temperature and water availability, an important driver of
vegetation characteristics in the region (see Linder, 1991;
Cowling & Holmes, 1992), are likely to exacerbate these
changes owing to direct responses of ants to changes in
vegetation cover and soil carbon. It has been shown that
organic soil carbon and nitrogen decrease rapidly with an
increase in temperature and decreasing precipitation in semi-
arid soils (see Smith et al., 2002; Link et al., 2003). Such a
reduction in organic matter can affect chemical, physical and
biological properties of soil, which in turn contribute to
ecosystem function and stability (Link et al., 2003). Moreover,
such changes, especially in organic carbon, will ultimately
affect plant distributions, which in turn will affect the ant
assemblages.
The predicted changes are very much in keeping with those
for other insect assemblages in montane regions, where the
higher elevation assemblages are at most risk (Haslett, 1997;
Fleishman et al., 1998, 2000; Hill et al., 2002). They are also in
keeping with predictions of vegetation change for the region,
which suggest that only the higher elevations will support
Fynbos, whilst the others will become more karroid, as was
perhaps the case for other areas in the region that have altered
from Fynbos to karroid vegetation as the region has dried out
(Deacon et al., 1992). Of course, the changes are likely to be
influenced by sharp discontinuities in geology and soil type, as
is clearly the case on the eastern edge of the study site where a
sharp boundary exists between Fynbos and Succulent Karoo
associated with a transition from Table Mountain Sandstone
changing to shale (see Cowling & Holmes, 1992; Cowling
et al., 1997; Milton et al., 1997; Lechmere-Oertel & Cowling,
2001) and on the western edge where dune sand and Table
Mountain Sandstone abut, but the vegetation (Strandveld and
Fynbos) and ant assemblages differ considerably.
Because of the functional importance of ants in Fynbos
ecosystems as myrmecochores (Westoby et al., 1982; Bond &
Slingsby, 1983; Slingsby & Bond, 1985; Breytenbach, 1988;
Hanzawa et al., 1988; Handel & Beattie, 1990; Johnson, 1992;
Le Maitre & Midgley, 1992; Midgley & Bond, 1995), there is
unlikely to be a unidirectional influence of changing climate
on vegetation and then on ants. Rather, the changing climate
will directly affect ant assemblages, and will indirectly affect
them via plant responses to climate. In turn, changes in the ant
assemblages are also likely to affect the ways in which seeds are
dispersed owing to differential responses of myrmechocorous
species. For example, the abundance of Camponotus niveose-
tosus was negatively related to mean monthly temperature,
absolute maximum temperature and vegetation structural
complexity, reflecting its numerical dominance at sites from
1300 to 1700 m. By contrast, the abundance of Tetramorium
quadrispinosum covaried positively with mean monthly tem-
perature and absolute maximum temperature reflecting is
predominance at lower altitude (200–1300 m) sites. Increases
in temperature in the region are thus likely to mean
replacement of the former with the latter species.
Likewise, Anoplolepis sp. (cf. steinergroeveri), which was
collected only at low-altitude sites (200–900 m), was posi-
tively related to litter and negatively to clay, reflected by its
absence from Succulent Karoo. By contrast, Anoplolepis sp.
(cf. custodiens) was collected at higher altitudes (900–1700 m)
and had a negative relationship with bare ground. The
altitudinal distribution of the two species only overlapped at
900 m on the western slopes. Both of these Anoplolepis
species have previously been collected in the same areas, with
Anoplolepis sp. (cf. steinergroeveri) being numerically much
less dominant (Linsey & Skinner, 2001), as is the case here.
However, Anoplolepis sp. (cf. custodiens) is present through-
out Africa (Prins, 1963) even though it has been hailed as one
of the most dominant myrmecochores in the southwestern
Cape (e.g. Midgley & Bond, 1995), and it is thus unlikely that
this generalist species will be severely affected by climate
change.
What these predicted changes are likely to mean for
myremcochory is difficult to determine in the absence of
more thorough experimental work. Several studies have
indicated that although myrmecochorous plants are clearly
adapted to ant dispersal, ants have not evolved any particular
trait (either morphological or behavioural) in response
(Johnson, 1992; Midgley & Bond, 1995). Furthermore, seeds
of myrmecochorous plants have very few physical structures
that restrict their dispersal to specific ant species (Johnson,
1992; Midgley & Bond, 1995; see also Wheelright & Orians,
1982). Perhaps it is therefore unlikely that the displacement of
one myrmecochorous species by another would affect seed
dispersal. However, it has also been postulated that seed size
plays a role in restricting the dispersal of large seeds by small
ant species (Pudlo et al., 1980; Drake, 1981; Bond & Slingsby,
1983; Auld, 1986; Johnson, 1992; Witt & Giliomee, 2004). In
addition, germination of seeds may be a function of burial
depth (Brits, 1987; Bond et al., 1990). If different ant species
have different seed gallery depths then the success of germi-
nation might be related to the ant species involved in
dispersal of the seeds. Therefore, despite an apparent lack of
A. Botes et al.
84 Journal of Biogeography 33, 71–90, ª 2005 Blackwell Publishing Ltd
specialization amongst myremcochores for some seed traits,
their changing relative abundances and differences in beha-
viour and seed-size preference could influence ecosystem
functioning. Such a transformation in functioning would
mean that conservation plans that seek to incorporate long-
term change in the region (e.g. Cowling & Pressey, 2003;
Driver et al., 2003; Younge & Fowkes, 2003) might have
underestimated the extent and nature of this change, and
therefore may fail to capture the biodiversity they seek to
maintain over the longer term.
In conclusion, this study has demonstrated that there are
likely to be substantial and complex changes to ant
assemblages as climates change in the northern Cape Floristic
Region. The importance of ants for ecosystem functioning in
both Fynbos and Succulent Karoo systems (e.g. Johnson,
1992; Le Maitre & Midgley, 1992; Milton et al., 1992) suggests
that these responses are likely not to be a consequence solely
of vegetation changes, but are likely also to precipitate such
transformation. The dynamic aspects of the response of
southern African ecosystems to climate change have enjoyed
little attention (contrast the investigations of Rutherford et al.,
1999; Erasmus et al., 2002, and Midgley et al., 2002, 2003,
with those of the Aspen FACE project – Karnosky et al.,
2003), although clearly such consideration is required. The
changes that are predicted to take place in the next 50 years in
Fynbos and Succulent Karoo ecosystems (Rutherford et al.,
1999; Midgley et al., 2002, 2003) could be substantially
exacerbated by synergistic effects of the kind outlined here,
and only experimental work will determine whether this is
likely to be the case. In the meantime, ongoing monitoring of
this transect will reveal the nature and pace of the change as it
unfolds.
ACKNOWLEDGEMENTS
We thank the Western Cape Nature Conservation Board for
logistical support, and especially Donnie Malherbe, Rika du
Plessis and the field rangers of the Cederberg Wilderness
Area; R. Theron, H. Schoombie and G. Burger for allowing
us to collect specimens on their properties; Elrike Marais and
various field assistants for help with data collection;
R. K. Colwell for making his software accessible online;
and three anonymous referees for helpful comments on the
manuscript. The specimens were collected under Western
Cape Nature Conservation Board Permit 234/2002. This
study was supported by the National Research Foundation
(GUN 2053618) and the DST-NRF Centre of Excellence for
Invasion Biology.
REFERENCES
Adis, J. (1979) Problems with interpreting arthropod sampling
with pitfall traps. Zoologischer Anzeiger, 202, 117–184.
Allen, A.P., Brown, J.H. & Gillooly, J.F. (2002) Global biodi-
versity, biochemical kinetics, and the energetic-equivalence
rule. Science, 297, 1545–1548.
Andersen, A.N. (1986) Diversity, seasonality and community
organization of ants at adjacent heath and woodland sites in
south-eastern Australia. Australian Journal of Zoology, 34,
53–64.
Andersen, A.N. (1991) Sampling communities of ground-
foraging ants: pitfall catches compared with quadrate counts
in an Australian tropical savanna. Australian Journal of
Ecology, 16, 273–279.
Andersen, A.N. (1992) Regulation of ‘momentary’ diversity by
dominant species in exceptionally rich ant communities of
the Australian seasonal tropics. American Naturalist, 140,
401–420.
Andersen, A.N. (1995) A classification of Australian ant
communities, based on functional groups which parallel
plant life-forms in relation to stress and disturbance. Journal
of Biogeography, 22, 15–29.
Andersen, A.N. & Yen, A.L. (1985) Immediate effects of fire on
ants in the semi-arid mallee region of north-western Vic-
toria. Australian Journal of Ecology, 10, 25–30.
Anonymous (2004) Greater Cederberg biodiversity corridor.
Western Cape Nature Conservation, Cape Town, South
Africa.
Auld, T.D. (1986) Population dynamics of the shrub Acacia
sauveolens (Sm.) Wild.: dispersal and the dynamics of
the soil seed-bank. Australian Journal of Ecology, 11,
235–254.
Berg, R.Y. (1975) Myrmecochorous plants in Australia and their
dispersal by ants. Australian Journal of Ecology, 23, 475–508.
Bestelmeyer, B.T. (2000) The trade-off between thermal tol-
erance and behavioural dominance in a subtropical South
American ant community. Journal of Animal Ecology, 69,
998–1009.
Bestelmeyer, B.T. & Wiens, J.A. (1996) The effects of land use
on the structure of ground-foraging ant communities in the
Argentine Chaco. Ecological Applications, 6, 1225–1240.
Bond, W.J. & Goldblatt, P. (1984) Plants of the Cape Flora: a
descriptive catalogue. Journal of South African Botany, 13,
1–455.
Bond, W.J. & Slingsby, P. (1983) Seed dispersal by ants in
shrublands of the Cape Province and its evolutionary
implications. South African Journal of Science, 79, 231–233.
Bond, W.J. & Slingsby, P. (1984) Collapse of an ant–plant
mutualism: the Argentine ant (Iridomyrmex humilis) and
myrmecochorous Proteaceae. Ecology, 65, 1031–1037.
Bond, W.J., Le Roux, D. & Erntzen, R. (1990) Fire intensity
and regeneration of myrmecochorous Proteaceae. South
African Journal of Botany, 56, 326–330.
Borcard, D., Legendre, P. & Drapeau, P. (1992) Partialling out
the spatial component of ecological variation. Ecology, 73,
1045–1055.
ter Braak, C.J.F. (1994) Canonical community ordination. Part
1: Basic theory and linear methods. Ecoscience, 1, 127–140.
ter Braak, C.J.F. & Smilauer, P. (2002) CANOCO reference
manual and CanoDraw for Windows user’s guide: software for
canonical community ordination (version 4.5). Microcom-
puter Power, Ithaca, NY.
Ant assemblages in the Cederberg
Journal of Biogeography 33, 71–90, ª 2005 Blackwell Publishing Ltd 85
Bray, R.H. & Kurtz, L.T. (1945) Determination of total,
organic and available forms of phosphorus in soils. Soil
Science, 59, 39–45.
Breytenbach, G.J. (1988) Why are myrmecochorous plants
limited to Fynbos (Macchia) vegetation types? South African
Journal of Forestry, 144, 3–5.
Brits, G.J. (1987) Germination depth vs. temperature
requirements in naturally dispersed seeds of Leucospermun
cordifolium and L. cuneiforme (Proteaceae). South African
Journal of Botany, 53, 119–124.
Campbell, B.M. (1985) A classification of the mountain
vegetation of the fynbos biome. Memoirs of the Botanical
Survey of South Africa, 50, 1–115.
Cerda, X., Retana, J. & Manzaneda, A. (1998) The role of
competition by dominants and temperature in the foraging
of subordinate species in Mediterranean ant communities.
Oecologia, 117, 404–412.
Chapman, H.D. (1965) Total exchangeable bases. Methods of
soil analysis. Part 2 (ed. by C.A. Black), pp. 902–904.
American Society of Agronomy, Madison, WI.
Coleman, B.D. (1981) On random placement and species–area
relations. Mathematical Biosciences, 54, 191–215.
Colwell, R.K. (2000) RangeModel: a Monte Carlo simulation
tool for assessing geometric constraints on species richness. V3.
A users guide and application. Published at: http://vice-
roy.eeb.uconn.edu/rangemodel.
Colwell, R.K. & Coddington, J.A. (1994) Estimating terrestrial
biodiversity through extrapolation. Philosophical Transac-
tions of the Royal Society of London B, 345, 101–118.
Cowling, R.M. (1992) The ecology of Fynbos: nutrients, fire and
diversity. Oxford University Press, Cape Town, South Africa.
Cowling, R.M. & Hilton-Taylor, C. (1994) Patterns of plant
diversity and endemism in South Africa: an overview. Biotic
diversity in South Africa (ed. by B.J. Huntley), pp. 31–52.
National Botanical Institute, Pretoria, South Africa.
Cowling, R.M. & Holmes, P.M. (1992) Flora and vegetation.
The ecology of Fynbos: nutrients, fire and diversity (ed. by
R.M. Cowling), pp. 223–261. Oxford University Press, Cape
Town, South Africa.
Cowling, R.M. & Pressey, R.L. (2003) Introduction to sys-
tematic conservation planning in the Cape Floristic Region.
Biological Conservation, 112, 1–13.
Cowling, R.M. & Richardson, D.M. (1995) Fynbos: South
Africa’s unique floral kingdom. Fernwood Press, Cape Town,
South Africa.
Cowling, R.M., Richardson, D.M. & Muster, P.J. (1997) Fyn-
bos. The vegetation of southern Africa (ed. by R.M. Cowling,
D.M. Richardson and S.M. Pierce), pp. 99–130. Cambridge
University Press, Cambridge.
Cowling, R.M., Esler, K.J. & Rundel, P.W. (1999) Namaqua-
land, South Africa – an overview of a unique winter-rainfall
desert ecosystem. Plant Ecology, 142, 3–21.
Cowling, R.M., Pressey, R.L., Rouget, M. & Lombard, A.T.
(2003) A conservation plan for a global diversity hotspot –
the Cape Floristic Region, South Africa. Biological Conser-
vation, 112, 191–216.
Deacon, H.J., Jury, M.R. & Ellis, F. (1992) Selective regime and
time. The ecology of Fynbos: nutrients, fire and diversity (ed.
by R.M. Cowling), pp. 6–22. Oxford University Press, Cape
Town, South Africa.
Diniz-Filho, J.A.F., Bini, L.M. & Hawkins, B.A. (2003) Spatial
autocorrelation and red herrings in geographical ecology.
Global Ecology and Biogeography, 12, 53–64.
Dobson, A.J. (2002) An introduction to generalized linear
models, 2nd edn. Chapman & Hall/CRC Texts in Statistical
Science, Boca Raton, FL.
Donnelly, D. & Giliomee, J.H. (1985) Community structure of
epigaeic ants (Hymenoptera: Formicidae) in fynbos vege-
tation in the Jonkershoek valley. Journal of the Entomological
Society of Southern Africa, 48, 247–257.
Drake, W.E. (1981) Ant–seed interaction in dry sclerophyll
forest on North Stadbroke Island, Queensland. Australian
Journal of Botany, 29, 293–309.
Driver, A., Desmet, P., Rouget, M., Cowling, R.M. & Maze, K.
(2003) Succulent Karoo Ecosystem Plan: biodiversity compo-
nent technical report. Report No. CCU 1/03. Cape Con-
servation Unit, Botanical Society of South Africa, Cape Town.
Dufrene, M. & Legendre, P. (1997) Species assemblages and
indicator species: the need for a flexible asymmetrical
approach. Ecological Monographs, 67, 345–366.
Erasmus, B.F.N., Kshatriya, M., Mansell, M.W., Chown, S.L. &
van Jaarsveld, A.S. (2000) A modeling approach to antlion
(Neuroptera: Myrmeleontidae) distribution patterns. Afri-
can Entomology, 8, 157–168.
Erasmus, B.F.N., van Jaarsveld, A.S., Chown, S.L., Kshatriya,
M. & Wessels, K.J. (2002) Vulnerability of South African
animal taxa to climate change. Global Change Biology, 8,
679–693.
Evans, K.L., Warren, P.H. & Gaston, K.J. (2004) Species–en-
ergy relationships at the macroecological scale: a review of
the mechanisms. Biological Reviews, 79, 1–25.
Fleishman, E., Austin, G.T. & Weiss, A.D. (1998) An empirical
test of Rapoport’s rule: elevational gradients in montane
butterfly communities. Ecology, 79, 2482–2493.
Fleishman, E., Fay, J.P. & Murphy, D.D. (2000) Upsides and
downsides: contrasting topographic gradients in species
richness and associated scenarios for climate change. Journal
of Biogeography, 27, 1209–1219.
French, K. & Major, R.E. (2001) Effect of an exotic Acacia
(Fabaceae) on ant assemblages in South African fynbos.
Austral Ecology, 26, 303–310.
Giorgi, F., Whetton, P.H., Jones, R.G., Christensen, J.H.,
Mearns, L.O., Hewitson, B., Vonstorch, H., Francisco, R. &
Jack, C. (2001) Emerging patterns of simulated regional
climatic changes for the 21st century due to anthropogenic
forcing. Geophysical Research Letters, 28, 3317–3320.
Gomez, C. & Espadaler, X. (1998) Myrmecochorous dispersal
distances: a world survey. Journal of Biogeography, 25,
573–580.
Gomez, C. & Oliveras, J. (2003) Can the Argentine ant
(Linepithema humile Mayr) replace native ants in myrme-
cochory? Acta Oecologica, 24, 47–53.
A. Botes et al.
86 Journal of Biogeography 33, 71–90, ª 2005 Blackwell Publishing Ltd
Gotelli, N.J. & Colwell, R.K. (2001) Quantifying biodiversity:
procedures and pitfalls in the measurement and comparison
of species richness. Ecology Letters, 4, 379–391.
Gotelli, N.J. & Ellison, A.M. (2002) Biogeography at a regional
scale: determinants of ant species density in New England
bogs and forests. Ecology, 83, 1604–1609.
Greenslade, P.J.M. (1973) Sampling ants with pitfall traps:
digging in effects. Insectes Sociaux, 20, 343–353.
Handel, S.N. & Beattie, A.J. (1990) Seed dispersal by ants.
Scientific American, August, 58–64.
Hannah, L., Midgley, G., Hughes, G. & Bomhard, B. (2005)
The view from the Cape: extinction risk, protected areas,
and climate change. BioScience, 55, 231–242.
Hanzawa, F.M., Beattie, A.J. & Culver, D.C. (1988) Directed
dispersal: demographic analysis of an ant–seed mutualism.
American Naturalist, 131, 1–13.
Haslett, J.R. (1997) Insect communities and the spatial com-
plexity of mountain habitats. Global Ecology and Biogeog-
raphy, 6, 49–56.
Hawkins, B.A. & Porter, E.E. (2003) Does herbivore diversity
depend on plant diversity? The case of California butterflies.
American Naturalist, 162, 40–49.
Hawkins, B.A., Field, R., Cornell, H.V., Currie, D.J., Guegan,
J.-F., Kaufman, D.M., Kerr, J.T., Mittelbach, G.G., Obe-
rdorff, T., O’Brien, E.M., Porter, E.E. & Turner, J.R.G.
(2003) Energy, water, and broad-scale geographic patterns
of species richness. Ecology, 84, 3105–3117.
Hill, J.K., Thomas, C.D., Fox, R., Telfer, M.G., Willis, S.G.,
Asher, J. & Huntley, B. (2002) Responses of butterflies to
twentieth century climate warming: implications for future
ranges. Proceedings of the Royal Society of London B, 269,
2163–2171.
Hoffman, T. (1996) Strandveld Succulent Karoo. Vegetation of
South Africa, Lesotho and Swaziland (ed. by B.A. Low and
A.G. Rebelo), 59 pp. Department of Environmental Affairs
& Tourism, Pretoria, South Africa.
Hoffman, B.T. & Andersen, A.N. (2003) Responses of ant
communities to experimental fire regimes on rangelands in
the Victoria River District of the Northern Territory. Austral
Ecology, 28, 182–195.
Johnson, S.D. (1992) Plant–animal relationships. The ecology of
Fynbos: nutrients, fire and diversity (ed. by R.M. Cowling),
pp. 175–205. Oxford University Press, Cape Town, South
Africa.
Karnosky, D.F., Zak, D.R., Pregitzer, K.S., Awmack, C.S.,
Bockheim, J.G., Dickson, R.E., Hendrey, G.R., Host, G.E.,
King, J.S., Kopper, B.J., Kruger, E.L., Kubiske, M.E., Lin-
droth, R.L., Mattson, W.J., Mcdonald, E.P., Noormets, A.,
Oksanen, E., Parsons, W.F.J., Percy, K.E., Podila, G.K.,
Riemenschneider, D.E., Sharma, P., Thakur, R., Sober, A.,
Sober, J., Jones, W.S., Anttonen, S., Vapaavuori, E., Man-
kovska, B., Heilman, W. & Isebrands, J.G. (2003) Tropo-
spheric O3 moderates responses of temperate hardwood
forests to alleviate CO2: a synthesis of molecular to ecosys-
tem results from the ASPEN FACE project. Functional
Ecology, 17, 289–304.
Kaspari, M., Ward, P.S. & Yuan, M. (2004) Energy gradients
and the geographic distribution of local ant diversity.
Oecologia, 140, 407–413.
Kerley, G.I.H., Pressey, R.L., Cowling, R.M., Boshoff, A.F. &
Sims-Castley, R. (2003) Options for the conservation of
large and medium-sized mammals in the Cape Floristic
Region hotspot, South Africa. Biological Conservation, 112,
169–190.
Kerr, J.T. & Packer, L. (1999) The environmental basis of
North American species richness patterns among Epicauta
(Coleoptera: Meloidae). Biodiversity and Conservation, 8,
617–628.
Koen, J.H. & Breytenbach, W. (1988) Ant species richness of
fynbos and forest ecosystems in the southern Cape. South
African Journal of Zoology, 23, 184–188.
Lassau, S.A. & Hochuli, D.F. (2004) Effects of habi-
tat complexity on ant assemblages. Ecography, 27, 157–
164.
Le Maitre, D.C. & Midgley, J.J. (1992) Plant reproductive
ecology. Fynbos ecology: nutrients, fire and diversity (ed. by
R.M. Cowling), pp. 135–174. Oxford University Press, Cape
Town, South Africa.
Lechmere-Oertel, R.G. & Cowling, R.M. (2001) Abiotic
determinants of the fynbos/succulent karoo boundary,
South Africa. Journal of Vegetation Science, 12, 75–80.
Legendre, P. (1993) Spatial autocorrelation: trouble or new
paradigm? Ecology, 74, 1659–1673.
Legendre, P. & Fortin, M.J. (1989) Spatial pattern and ecolo-
gical analysis. Vegetatio, 80, 107–138.
Legendre, P. & Legendre, L. (1998) Numerical ecology. Elsevier
Science B.V., Amsterdam, The Netherlands.
Lennon, J.J. (2000) Red-shifts and red herrings in geographical
ecology. Ecography, 23, 101–113.
Leps, J. & Smilauer, P. (2003) Multivariate analysis of ecological
data using CANOCO. Cambridge University Press, Cam-
bridge.
Linder, H.P. (1991) Environmental correlates of patterns of
species richness in the south-western Cape Province of
South Africa. Journal of Biogeography, 18, 509–518.
Link, S.O., Smith, J.L., Halvorson, J.J. & Bolton, H. (2003) A
reciprocal transplant experiment within a climatic gradient
in a semiarid shrub–steppe ecosystem: effects on bunchgrass
growth and reproduction, soil carbon, and soil nitrogen.
Global Change Biology, 9, 1097–1105.
Lindsey, P.A. & Skinner, J.D. (2001) Ant composition and
activity patterns as determined by pitfall trapping and other
methods in three habitats in the semi-arid Karoo. Journal of
Arid Environments, 48, 551–568.
Lobo, J.M., Lumaret, J.P. & Jay-Robert, P. (2002) Modelling
the species richness distribution of French dung beetles
(Coleoptera, Scarabaeidae) and delimiting the predictive
capacity of different groups of explanatory variables. Global
Ecology and Biogeography, 11, 265–277.
Longino, J.T., Coddington, J. & Colwell, R.K. (2002) The ant
fauna of a tropical rain forest: estimating species richness
three different ways. Ecology, 83, 689–702.
Ant assemblages in the Cederberg
Journal of Biogeography 33, 71–90, ª 2005 Blackwell Publishing Ltd 87

Low, A.B. & Rebelo, A.G. (1996) Vegetation of South Africa,
Lesotho and Swaziland. Department of Environmental
Affairs & Tourism, Pretoria, South Africa.
McGeoch, M.A. & Chown, S.L. (1998) Scaling up the value of
bioindicators. Trends in Ecology and Evolution, 13, 46–47.
McGeoch, M.A. & Price, P.W. (2004) Spatial abundance
structures in an assemblage of gall-forming sawflies. Journal
of Animal Ecology, 73, 506–516.
McGeoch, M.A., van Rensburg, B.J. & Botes, A. (2002) The
verification and application of bioindicators: a case study of
dung beetles in a savanna ecosystem. Journal of Applied
Ecology, 39, 661–672.
McLean, E.O. (1982) Soil pH and lime requirement. Methods
of soil analysis. Part 2 (ed. by A.L. Page), 199 pp. American
Society of Agronomy, Wisconsin.
Midgley, J.J. & Bond, W.J. (1995) Relative attractiveness of
seeds of myrmecochorous Australian and South African
plants to ants, and the chemical basis of this attraction.
South African Journal of Science, 61, 230–232.
Midgley, G.F., Hannah, L., Millar, D., Rutherford, M.C. &
Powrie, L.W. (2002) Assessing the vulnerability of
species richness to anthropogenic climate change in a bio-
diversity hotspot. Global Ecology and Biogeography, 11, 445–
451.
Midgley, G.F., Hannah, L., Millar, D., Thuiller, W. & Booth, A.
(2003) Developing regional and species-level assessments of
climate change impacts on biodiversity in the Cape Floristic
Region. Biological Conservation, 112, 87–97.
Milton, S.J., Dean, W.R.J. & Kerley, G.I.H. (1992) Tierberg
Karoo Research Centre: history, physical environment, flora
and fauna. Transactions of the Royal Society of Southern
Africa, 48, 15–46.
Milton, S.J., Yeaton, R.I., Dean, W.R.J. & Vlok, J.H.J. (1997)
Succulent Karoo. The vegetation of southern Africa (ed. by
R.M. Cowling, D.M. Richardson and S.M. Pierce), pp. 131–
166. Cambridge University Press, Cambridge.
Minter, L.R., Burger, M., Harrison, J.A., Braack, H.H., Bishop,
P.J. & Kloepfer, D. (2004) Atlas and red data book of the frogs
of South Africa. SI/MAB Series #9, Smithsonian Institute,
Washington, DC.
Mittermeier, R.A., Mayers, N., Thomsen, J.B., Da Fonseca,
G.A.B. & Olivieri, S. (1998) Biodiversity hotspots and major
tropical wilderness areas: approaches to setting conservation
priorities. Conservation Biology, 12, 516–520.
Myers, N. (1990) The biodiversity challenge: expected hot-
spots analysis. The Environmentalist, 10, 243–255.
Nelson, D.W. & Sommers, L.E. (1982) Total carbon, organic
carbon and organic matter. Methods of soil analysis, Part 2
(ed. by C.A. Black), pp. 570–571. American Society of
Agronomy, Madison, WI.
O’Brien, E.M., Field, R. & Whittaker, R.J. (2000) Climatic
gradients in woody plant (tree and shrub) diversity: water–
energy dynamics, residual variation, and topography. Oikos,
89, 588–600.
Olson, D.M. & Dinerstein, E. (1998) The Global 200: a
representation approach to conserving the Earth’s most
biologically valuable ecoregions. Conservation Biology, 12,
52–515.
Parr, C.L. & Chown, S.L. (2003) Burning issues for conserva-
tion: a critique of faunal fire research in South Africa.
Austral Ecology, 28, 384–395.
Parr, C.L., Bond, W.J. & Robertson, H.G. (2002) A preliminary
study of the effect of fire on ants (Formicidae) in a South
African savanna. African Entomology, 10, 101–111.
Parr, C.L., Robertson, H.G., Biggs, H.C. & Chown, S.L. (2004)
Response of African savanna ants to long-term fire regimes.
Journal of Applied Ecology, 41, 630–642.
Parr, C.L., Sinclair, B.J., Andersen, A.N., Gaston, K.J. &
Chown, S.L. (2005) Constraint and competition in assem-
blages: a cross-continental and modelling approach for ants.
American Naturalist, 165, 481–494.
Perfecto, I. & Vandermeer, J. (1996) Microclimatic changes
and the direct loss of ant diversity in a tropical agroeco-
system. Oecologia, 108, 577–582.
Pressey, R.L., Cowling, R.M. & Rouget, M. (2003) Formulating
conservation targets for biodiversity pattern and process in
the Cape Floristic Region, South Africa. Biological Con-
servation, 112, 99–127.
Prins, A.J. (1963) A list of the ants collected in the Kruger
National Park with notes on their distribution. Koedoe, 6,
91–108.
Pudlo, R.J., Beattie, A.J. & Cluver, D.C. (1980) Population
consequences of changes in an ant-seed mutualism in
Saguinaria cadensis. Oecologia, 46, 32–37.
Rebelo, A.G. (1996) Fynbos. Vegetation of South Africa, Lesotho
and Swaziland (ed. by A.B. Low and A.G. Rebelo), pp. 68–
71. Department of Environmental Affairs and Tourism,
Pretoria, South Africa.
van Rensburg, B.J., McGeoch, M.A., Chown, S.L. & van
Jaarsveld, A.S. (1999) Conservation of heterogeneity among
dung beetles in the Maputuland Centre of Endemism, South
Africa. Biological Conservation, 7, 945–965.
van Rensburg, B.J., Chown, S.L. & Gaston, K.J. (2002) Species
richness, environmental correlates, and spatial scale: a test
using South African birds. American Naturalist, 159, 566–577.
Robertson, H.G. (1999) Ants (Hymenoptera: Formicidae) of
Mkomazi. Mkomazi: the ecology, biodiversity and conserva-
tion of a Tanzanian savanna (ed. by M.J. Coe, N.C.
McWilliams, G.N. Stone and M.J. Parker), pp. 321–336.
Royal Geographic Society, London.
Rodrigues, A.S. L., Gregory, R.D. & Gaston, K.J. (2000)
Robustness of reserve selection procedures under temporal
species turnover. Proceedings of the Royal Society of London
B, 267, 49–55.
Rosenzweig, M.L. (1995) Species diversity in space and time.
Cambridge University Press, New York, NY.
Rotenberry, J.T. & Wiens, J.A. (1980) Habitat structure,
patchiness, and avian communities in North American
Steppe vegetation: a multivariate analysis. Ecology, 61,
1228–1250.
Rouget, M., Richardson, D.M. & Cowling, A. (2003a) The
current configuration of protected areas in the Cape Floristic
A. Botes et al.
88 Journal of Biogeography 33, 71–90, ª 2005 Blackwell Publishing Ltd

Region, South Africa – reservation bias and representation
of biodiversity patterns and processes. Biological Conserva-
tion, 112, 129–145.
Rouget, M., Richardson, D.M., Cowling, R.M., Lloyd, J.W. &
Lombard, A.T. (2003b) Current pattern of habitat trans-
formation and future threats to biodiversity in terrestrial
ecosystems of the Cape Floristic Region, South Africa. Bio-
logical Conservation, 112, 63–85.
Rutherford, M.C., Powrie, L.W. & Schulze, R.E. (1999) Cli-
mate change in conservation areas of South Africa and its
potential impact on floristic composition: a first assessment.
Diversity and Distributions, 5, 253–262.
Samways, M.J. (1983) Community structure of ants
(Hymenoptera: Formicidae) in a series of habitats associated
with citrus. Journal of Applied Ecology, 20, 833–847.
Samways, M.J. (1990) Species temporal variability: epigaeic ant
assemblages and management for abundance and scarcity.
Oecologia, 84, 482–490.
Schlettwein, C.H.G. & Giliomee, J.H. (1987) Comparison of
insect biomass and community structure between fynbos
sites of different ages after fire with particular reference to
ants, leafhoppers and grasshoppers. Annals of the University
of Stellenbosch, 2, 1–76.
Slingsby, P. & Bond, W.J. (1985) The influence of ants on the
dispersal distance and seedling recruitment of Leucos-
permum conocarpodendron (L.) Buek (Proteaceae). South
African Journal of Botany, 51, 30–34.
Smith, P.A. (1994) Autocorrelation in logistic regression
modelling of species’ distributions. Global Ecology and Bio-
geography Letters, 4, 47–61.
Smith, J.L., Halvorson, J.J. & Bolton, H. (2002) Soil properties
and microbial activities across a 500 m elevation gradient in
a semi-arid environment. Soil Biology and Biochemistry, 34,
1749–1757.
Stattersfield, A.J., Crosby, M.J., Long, A.J. & Wedge, D.C.
(1998) Endemic bird areas of the world. BirdLife Conservation
Series 7. BirdLife International, Cambridge.
Swart, J.M., Richardson, P.R.K. & Furgeson, J.W.H. (1999)
Ecological factors affecting the feeding behaviour of pango-
lins (Manis temminckii). Journal of Zoology, 247, 281–292.
Tan, K.H. (1996) Soil sampling, preparation and analysis.
Dekker, New York, NY.
Todd, S.W. & Hoffman, M.T. (1999) A fence-line contrast
reveals effects of heavy grazing on plant diversity and
community composition in Namaqualand, South Africa.
Plant Ecology, 142, 169–178.
Turner, J.R.G., Gatehouse, C.M. & Corey, C.A. (1987) Does
solar energy control organic diversity? Butterflies, moths and
the British climate. Oikos, 48, 195–205.
Tyson, P.D. (1999) Atmospheric circulation changes and pal-
aeoclimates of southern Africa. South African Journal of
Science, 95, 194–201.
United States Salinity Laboratory Staff (1954) Diagnosis and
improvement of saline and alkaline soils. USDA Handbook
No. 60, 91. US Government Printing Office, Washington,
DC.
Wartenberg, D. (1989) SAAP: a spatial autocorrelation analysis
program. V4.3. Piscataway, New Jersey.
Westoby, M., Rice, B., Shelley, J.M., Haig, D. & Kohen, J.L.
(1982) Plants’ use of ants for dispersal at West Head, New
South Wales. Ant–plant interactions in Australia (ed. by
R.C. Buckley), pp. 75–87. Dr W. Junk Publishers, The
Hague, The Netherlands.
Wheelright, N.T. & Orians, G.H. (1982) Seed dispersal by
animals: contrasts with pollen dispersal, problems of ter-
minology, and constraints on coevolution. American Nat-
uralist, 119, 402–413.
Witt, A.B.R. & Giliomee, J.H. (2004) The impact of an invasive
ant, Linepithema humile (Mayr), on the dispersal of Phylica
pubescens Aiton seeds in South Africa. African Entomology,
12, 179–185.
WWF (World Wildlife Fund) and IUCN (The World Con-
servation Union) (1994) Centres of plant diversity: a guide for
their conservation. IUC, Cambridge.
Wylie, J. & Currie, D.J. (1993) Species energy theory and
patterns of species richness. II. Predicting mammal species
richness of isolated nature reserves. Conservation Biology, 63,
145–148.
Younge, A. & Fowkes, S. (2003) The Cape Action Plan for the
environment: overview of an ecoregional planning process.
Biological Conservation, 112, 15–28.
SUPPLEMENTARY MATERIAL
The following supplementary material is available online from
http://www.Blackwell-Synergy.com
Appendix S1 Sampling areas and vegetation types along the
altitudinal gradient.
Appendix S2 Subfamilies and species collected during the
two sampling periods.
Appendix S3 Sample-based species accumulation curves of
the ant assemblages.
Appendix S4 Pearson’s product–moment correlations of the
environmental variables.
Appendix S5 Soil characteristics and ground cover of the
sampling sites.
Ant assemblages in the Cederberg
Journal of Biogeography 33, 71–90, ª 2005 Blackwell Publishing Ltd 89

BIOSKETCHES
Antoinette Botes has an MSc in Entomology from the University of Pretoria and is currently a PhD student. Her research interests
include macroecology and conservation ecology.
Melodie A. McGeoch works in the field of spatial ecology. Her particular interests are biodiversity in human-influenced
landscapes, bioindication and climate change impacts on terrestrial biota.
Hamish G. Robertson has specialized in the taxonomy, biology and ecology of African ants.
Adriaan van Niekerk has an MSc in Geographic Information Systems from the University of Stellenbosch and is currently a PhD
student. His main field of research is the development of Spatial Decision Support Systems for environmental management.
Henry P. Davids is at the University of Stellenbosh and has an interest in Cederberg biodiversity.
Steven L. Chown works in the fields of macroecology, evolutionary physiology and community ecology. He has a long-standing
interest in the ecology, physiology and evolution of the biotas of the Southern Ocean islands.
Editor: Bradford Hawkins
A. Botes et al.
90 Journal of Biogeography 33, 71–90, ª 2005 Blackwell Publishing Ltd