antti s. toivonen - universitylib.tkk.fi/dipl/2012/urn100576.pdf · d.sc. (tech.) reino aavikko a...
TRANSCRIPT

Antti S. Toivonen
Identifying and Controlling Stray Readsat RFID Gates
School of Electrical Engineering
Thesis submitted for examination for the degree of Master ofScience in Technology.
Espoo 27.2.2012
Thesis supervisor:
Prof. Jussi Suomela
Thesis instructor:
D.Sc. (Tech.) Reino Aavikko
A’’ Aalto UniversitySchool of ElectricalEngineering

aalto universityschool of electrical engineering
abstract of themaster’s thesis
Author: Antti S. Toivonen
Title: Identifying and Controlling Stray Reads at RFID Gates
Date: 27.2.2012 Language: English Number of pages:10+82
Department of Automation and Systems Technology
Professorship: Automation Technology Code: AS-84
Supervisor: Prof. Jussi Suomela
Instructor: D.Sc. (Tech.) Reino Aavikko
A modern UHF RFID system can reach a read range of over ten meters. Longread range and difficulties to create uniform interrogation zone lead to stray reads.Interrogation zone can be adjusted by controlling the transmit power of RFIDreader, selecting antennas and RFID tags carefully for the purpose, and withdifferent signal quality validation methods. It is common that industry processesprevent using optimal RFID tag size and location for best read reliability. In thesesituations reader transmit power is increased to gain better read reliability. Thisextends the interrogation zone over the designed and leads to stray reads.At UHF band the interrogation zone is not sharp edged. This is due to orientationdifferences between tags, tag to tag differences, multipathing and interferencecaused by multipathing.In this thesis, different methods to identify RFID-tags moving along specifiedroutes in the far field on the specific interrogation zone and discard other readevents as stray events, are studied. Algorithm to detect lay around tags is pro-posed.
Keywords: RFID, detection, portal, phase angle, stray read, RSSI, Doppler shift

aalto-yliopistosahkotekniikan korkeakoulu
diplomityontiivistelma
Tekija: Antti S. Toivonen
Tyon nimi: Hajalukujen tunnistaminen ja poistaminen RFID-porteilla
Paivamaara: 27.2.2012 Kieli: Englanti Sivumaara:10+82
Automaatio- ja systeemitekniikan laitos
Professuuri: Automaatiotekniikka Koodi: AS-84
Valvoja: Prof. Jussi Suomela
Ohjaaja: TkT Reino Aavikko
Modernin UHF RFID-jarjestelman lukuetaisyys on parhaimmillaan yli kymmenenmetria. Suuri lukuetaisyys ja hankaluudet lukualueen tarkassa rajaamisessa johta-vat hajalukuihin. Lukualuetta voidaan saataa RFID-lukijan lahetystehoa muutta-malla, antenni- ja RFID-tunnistevalinnoilla, seka erilaisilla signaalin laatuun liit-tyvilla menetelmilla. Teollisuuden prosessit eivat aina mahdollista tunnisteen si-joittamista lukuvarmuuden kannalta parhaaseen paikkaan. Tallaisissa tapauksissajoudutaan usein kasvattamaan RFID-lukijan lahetystehoa lukuvarmuuden paran-tamiseksi. Tama taas kasvattaa lukualuetta suunniteltua suuremmaksi, mika jo-htaa hajalukuihin.UHF taajuuksilla lukualue ei ole tarkkareunainen, johtuen RFID-tunnisteidenasentoeroista, tunnisteiden yksilokohtaisista eroista seka monikanavakuulumisestaja siihen liittyvasta interferenssista.Tassa tutkimuksessa on etsitty ja kokeiltu menetelmia, joilla voidaan tunnistaamaaritellylla lukualueella lukijan kaukokentassa haluttuja reitteja liikkuvat RFID-tunnisteet ja hylata muut lukutapahtumat hajalukuina. Tutkimuksessa esitetaanuusi algoritmi hajalukujen tunnistamiseksi.
Avainsanat: RFID, tunnistus, portti, vaihekulma, hajaluku, RSSI, Doppler si-irtyma

iv
Preface
The process of writing this thesis began during the summer of 2011. It has beena long but fulfilling journey from the first brain storming sessions to this finishedMasters Thesis with hard black covers and a golden title.
I have had the chance to familiarize with RFID technology while working atVilant Systems Oy for almost four years. When my studies at Aalto Universitywere at a stage to select the field of study for my thesis the choice was obvious.However, the title under which to put the work was not that obvious. I wanted tostudy some field within RFID technology and its applications, which would havesome use after the thesis work has finished. The most promising of the titles wasrelated to a quite common problem confronted while implementing RFID systems –stray reads.
There are magnificent people without whom this thesis would not have beencompleted. I want to thank my instructor Reino Aavikko for guidance through thisthesis work, my supervisor Professor Jussi Suomela for all the academical supportduring the process, Henrik Nyman for inspiring conversations about the details indepth of how RFID systems function and Antti Virkkunen for pushing the worktowards usable results. There are special friends you can call eleven o’clock in theevening and ask them to make a small change to the software used in testing. Morespecial ones commit changes within 5 minutes. Thanks Aketzu! I want to thank mybeloved wife Nina for all the support through the struggle.
This thesis is devoted to my dear son Aatos, who was born in the middle of theproject. I am grateful to him for pointing out the fact that now it is a good time tograduate.
Helsinki, 19.2.2012
Antti S. Toivonen

v
Contents
Abstract ii
Abstract (in Finnish) iii
Preface iv
Contents v
Abbreviations and Glossary viii
1 Introduction 11.1 Introduction to the Research Problem . . . . . . . . . . . . . . . . . . 11.2 Scope of Thesis . . . . . . . . . . . . . . . . . . . . . . . . . . . . . . 2
2 RFID Technology 42.1 History of Radio Frequency Identification . . . . . . . . . . . . . . . . 42.2 Overview of RFID System . . . . . . . . . . . . . . . . . . . . . . . . 52.3 Frequency Bands . . . . . . . . . . . . . . . . . . . . . . . . . . . . . 62.4 Readers . . . . . . . . . . . . . . . . . . . . . . . . . . . . . . . . . . 72.5 Tags . . . . . . . . . . . . . . . . . . . . . . . . . . . . . . . . . . . . 92.6 Antennas . . . . . . . . . . . . . . . . . . . . . . . . . . . . . . . . . 102.7 Portals and Read Points . . . . . . . . . . . . . . . . . . . . . . . . . 102.8 RFID Middleware and Integration . . . . . . . . . . . . . . . . . . . . 112.9 Regulations and Standards . . . . . . . . . . . . . . . . . . . . . . . . 12
2.9.1 Regulatory Bodies . . . . . . . . . . . . . . . . . . . . . . . . 122.9.2 ETSI EN 302 208-1 v 1.4.1 . . . . . . . . . . . . . . . . . . . . 132.9.3 GS1 EPCglobal Class 1 Generation 2 UHF RFID Standard . . 132.9.4 Air Interface . . . . . . . . . . . . . . . . . . . . . . . . . . . . 15
3 Definitions and the Research Problem 183.1 Cases to Study . . . . . . . . . . . . . . . . . . . . . . . . . . . . . . 183.2 State-of-the-art Stray Read Detection . . . . . . . . . . . . . . . . . . 203.3 The Interrogation Zone and the Extended Interrogation Zone . . . . . 223.4 RFID Event . . . . . . . . . . . . . . . . . . . . . . . . . . . . . . . . 233.5 Environmental Considerations . . . . . . . . . . . . . . . . . . . . . . 24
3.5.1 Warehouse Environment . . . . . . . . . . . . . . . . . . . . . 243.5.2 Dense Reader Environment . . . . . . . . . . . . . . . . . . . 243.5.3 RF-absorbing and -reflecting Materials . . . . . . . . . . . . . 253.5.4 Other RF-issues . . . . . . . . . . . . . . . . . . . . . . . . . . 25
3.6 Reducing Interference Caused by Dense Reader Environment . . . . . 253.7 Locating Tags . . . . . . . . . . . . . . . . . . . . . . . . . . . . . . . 26
3.7.1 Detecting Tags at Extended Interrogation Zone . . . . . . . . 263.7.2 Multi-level Localization Problem Solving . . . . . . . . . . . . 27
3.8 Detecting Tag Movement . . . . . . . . . . . . . . . . . . . . . . . . . 27

vi
3.8.1 Detecting Non-Moving Tags . . . . . . . . . . . . . . . . . . . 273.8.2 Detecting Tags Moving Across Interrogation Zone . . . . . . . 28
4 Methods 294.1 Controlling the Interrogation Zone . . . . . . . . . . . . . . . . . . . 29
4.1.1 Reader Transmit Power . . . . . . . . . . . . . . . . . . . . . 294.1.2 Choosing the Right Antenna for the Application . . . . . . . . 294.1.3 Antenna and Tag Positioning . . . . . . . . . . . . . . . . . . 294.1.4 Third Antenna Trick . . . . . . . . . . . . . . . . . . . . . . . 304.1.5 Triggered Reading . . . . . . . . . . . . . . . . . . . . . . . . 30
4.2 Signal Quality Indicators . . . . . . . . . . . . . . . . . . . . . . . . . 314.2.1 Return Signal Strength Indicator (RSSI) . . . . . . . . . . . . 324.2.2 Signal Phase Angle Rotation . . . . . . . . . . . . . . . . . . . 324.2.3 Doppler Shift Over Read Cycle . . . . . . . . . . . . . . . . . 34
4.3 Using Geometry of Antenna Setup to determine Tag Movement . . . 344.3.1 Two Interrogation Zones . . . . . . . . . . . . . . . . . . . . . 354.3.2 Antennas Tilted to the Direction of the Movement . . . . . . . 36
4.4 Layout Based Processing the RFID Event Data . . . . . . . . . . . . 364.5 Statistical Analysis of Multiple Read Events of RFID Tag . . . . . . . 37
4.5.1 Lay Around Tag Detection Algorithm . . . . . . . . . . . . . . 384.6 Virtual Handling Units . . . . . . . . . . . . . . . . . . . . . . . . . . 38
5 Experiments 405.1 Test Environment . . . . . . . . . . . . . . . . . . . . . . . . . . . . . 405.2 Equipment Used in Experiments . . . . . . . . . . . . . . . . . . . . . 41
5.2.1 Impinj Speedway Revolution R420 UHF RFID reader . . . . . 415.2.2 Antennas . . . . . . . . . . . . . . . . . . . . . . . . . . . . . 415.2.3 Stand for the Antenna . . . . . . . . . . . . . . . . . . . . . . 425.2.4 Light Roof Portal Assembly . . . . . . . . . . . . . . . . . . . 425.2.5 Styrofoam Structure to Hold a Tag . . . . . . . . . . . . . . . 435.2.6 Handling Units Used in the Experiments . . . . . . . . . . . . 43
5.3 Preliminary Experiments . . . . . . . . . . . . . . . . . . . . . . . . . 455.3.1 Measurement Process . . . . . . . . . . . . . . . . . . . . . . . 465.3.2 RSSI and Phase Angle Rotation over Distance . . . . . . . . . 47
5.4 Experiments at RFID portal . . . . . . . . . . . . . . . . . . . . . . . 485.4.1 Statistical Measurements to understand Dynamics at a RFID
Gate . . . . . . . . . . . . . . . . . . . . . . . . . . . . . . . . 495.4.2 Lay Around Tag Detection Analysis based on RSSI, Phase
Angle Rotation and Doppler Shift Statistics . . . . . . . . . . 495.4.3 Identifying Lay Around Tags . . . . . . . . . . . . . . . . . . . 505.4.4 Identifying Stray Reads . . . . . . . . . . . . . . . . . . . . . 50
6 Results 516.1 Preliminary Experiments . . . . . . . . . . . . . . . . . . . . . . . . . 51
6.1.1 RSSI, Phase Angle Rotation and Doppler Shift Over Distance 51

vii
6.1.2 Transmit Power Change . . . . . . . . . . . . . . . . . . . . . 526.1.3 Antenna Change . . . . . . . . . . . . . . . . . . . . . . . . . 546.1.4 RFID Chip Change . . . . . . . . . . . . . . . . . . . . . . . . 556.1.5 Operating Mode Change . . . . . . . . . . . . . . . . . . . . . 566.1.6 Other Findings . . . . . . . . . . . . . . . . . . . . . . . . . . 57
6.2 Statistical Measurements to understand Dynamics at a RFID Gate . 586.2.1 Events in Time Domain . . . . . . . . . . . . . . . . . . . . . 586.2.2 Events in RSSI, Phase Angle Rotation and Doppler Domain . 62
6.3 Lay Around Tag Detection Analysis based on RSSI, Phase AngleRotation and Doppler Shift Statistics . . . . . . . . . . . . . . . . . . 64
6.4 Direction Sensing and Lay Around Tag Detection Testing . . . . . . . 666.4.1 Read Rate Testing . . . . . . . . . . . . . . . . . . . . . . . . 676.4.2 Lay Around Tag Identification Testing . . . . . . . . . . . . . 686.4.3 Stray Read Detection . . . . . . . . . . . . . . . . . . . . . . . 71
6.5 Discussion . . . . . . . . . . . . . . . . . . . . . . . . . . . . . . . . . 71
7 Conclusions 74
References 76
Appendix A 78
A Impinj Speedway Revolution Specific Settings 78A.1 ImpinjRFPhaseAngle Parameter . . . . . . . . . . . . . . . . . . . . . 78A.2 ImpinjRFDopplerFrequency Parameter . . . . . . . . . . . . . . . . . 79
Appendix B 80
B Listings 80
Appendix C 82
C Results of the Experiments 82

viii
Abbreviations and Glossary
Abbreviations
AEN Ambient Electromagnetic NoiseASK Amplitude Shift KeyingCRC Cyclic Redundancy CheckCW Continuous WaveDRM Dense Reader ModeDSB Double SidenbandEIRP Equivalent Isotropically Radiated PowerEPC Electronic Product CodeERP Equivalent Radiated PowerERP Enterprise Resource PlanningETSI European Telecommunications Standards InstituteFCC Federal Communications CommissionFHSS Frequency Hopping Spread SpectrumFOV Field of ViewGR Goods ReceiveHF High FrequencyIC Integrated CircuitISM Industrial, Science and MilitaryIO Input / OutputIFF Identify Fried or FoeLBT Listen Before TalkLLRP Low-level Reader ProtocolMES Manufacturing Execution SystemOSI Open Systems InterconnectionPIE Pulse Interval EncodingPSK Phase Shift KeyingPR-ASK Phase Reversal Amplitude Shift KeyingRAF Royal Air ForceRF Radio FrequencyRFID Radio Frequency IdentificationRSSI Return Signal Strength IndicatorSCM Supply Chain ManagementSNR Signal to Noise RationSSB Single SidebandUHF Ultra High FrequencyVHU Virtual Handling UnitWMS Warehouse Management System

ix
Glossary
Air interface The complete communication link between an In-terrogator and a Tag including the physical layer,collision arbitration algorithm, command and re-sponse structure, and data-coding methodology
Business logic High level logic transactions related to the appli-cation
Cross read RFID-tag is detected from neighboring RFID-gateCross talk Nearby RFID-reader powers up a tag which
becomes visible for RFID-reader further away.Causes cross read.
Dense-Interrogator mode A set of Interrogator-to-Tag and Tag-to-Interrogator signaling parameters used indense-Interrogator environments
Doppler shift Shift of perceived frequency due to movementFM0-encoding Data encoding methodFrequency Hopping SpreadSpectrum (FHSS)
Reader can use each channel for only 0.4 seconds,before changing channel
Half-duplex Device can either transmit or receive using a datachannel; not possible to do both at the same time
Handling unit Container used in logistics (e.g. pallet or rollercage)
Interrogator RFID readerInterrogation zone Area where the signal sent by the reader is strong
enough to power up a tag and allow it to backscat-ter a response to the reader
Item Smallest tracked object for logistics process (e.g.card board box, envelope)
Listen Before Talk (LBT) Reader must listen that no other reader is trans-mitting at the selected frequency before it startstransmission
Miller-encoding Data encoding method in which symbols are re-peated for higher redundancy and lower RF footprint
OSI-model Open Systems Interconnection reference modelPhase angle Phase angle of RF signalQ A parameter that an interrogator uses to regulate
the probability of tag response in EPCglobal Gen2Air Interface protocol. Number of slots is 2Q.
Session An inventory process comprising an interrogatorand an associated tag population
Shipment One or several handling units which form one log-ical unit to be transported between specified loca-tions

x
Stray read RFID tag detected by reader which is not relatedto the process or the phase of the process moni-tored
Tari Reference time interval for a data-0 ininterrogator-to-tag signaling

1
1 Introduction
1.1 Introduction to the Research Problem
Radio Frequency Identification (RFID) technology [1] is used to connect events tak-ing place in the physical world to IT-systems automatically without human interven-tion. RFID technology is used in many every day applications like public transportticketing, identifying flying aircraft (IFF), paying purchases without contact (NFC),collecting road tolls, timing laps on a sports track, automatizing orders in vendormanaged inventory (VMI) and locating containers within shipping fields.
In future one every day application for RFID could be self service grocery store.Customer enters the store and picks RFID tagged items from the shelves. RFIDtags of the groceries are read at the exit and list of purchased items is shown forcustomer for acceptance. The payment of the groceries can also be done using RFIDenabled credit card without removing it from the pocket.
There are many security and privacy concerns not to forget technological oneswhich need to be addressed before applications like are made available for the pub-lic. Customer must not be able to remove the RFID tags from the purchases orotherwise prevent reading the tags at the exit. RFID tags at the items should bedisabled immediately after the purchase for privacy purposes. Otherwise it wouldbe easy to track movements of the customer based on the RFID tags in the pur-chases. The reliability of the used technology must be on very high level to alloweffortless buying experience. The benefits of applications like this are clear – timesavings from not having to read all items separately at the cash register, resourcesavings from automated cash registers registers and traceability of purchases fromthe manufacturer all the way to customer as RFID allows all items to have uniqueserial numbers.
One specific type of RFID technology works at UHF band, which has proven tobe suitable for wide variety of applications. Key drivers for general purpose UHFRFID technology are
• Adjustable long read range (starting from few centimeters up to 15 meters)
• High throughput performance
• Low cost
• Standardized operating environment
Typical location for UHF RFID system can be a logistics center where RFIDis utilized to track shipments leaving from and arriving at the site. In this type ofenvironment RFID can provide visibility to the logistics processes, reduce humanerrors and reduce amount of work related to the shipping transactions. It is achallenge to implement a reliable, high performance, RFID system at low cost inwarehouse environment. Issues with stray reads are commonly encountered.

2
RFID interrogation zones, at Ultra High Frequency (UHF) -band, are far frombeing sharp edged. Typically the dependency between signal strength and the dis-tance from the antenna is not linear because of constructive and destructive interfer-ence and antenna suboptimalities. This needs to be considered when RFID systemsare designed.
Difficulties to control interrogation zone in RFID applications often lead to strayreads – unwanted RFID read events, which are not related to the process or phaseof the process being monitored and/or controlled.
Factors affecting the size and shape of the interrogation zone are
• Transmit power of the reader
• Signal loss on cables and connectors
• Antenna gain
• Tag sensitivity
• Near by RFID reader operation
• Ambient Electromagnetic Noise (AEN)
• Destructive and constructive interference
There are direct methods for shaping the interrogation zone. The most obviousof these methods are altering RFID reader transmit power and choosing the rightantenna and tag combination for the purpose. Due to the great variety of itemsmarked with RFID tags, signal strength received by RFID tag can change fromitem to item. This item-to-item signal strength variation encourages using highertransmit power to increase read reliability. Trade-off for this is increased number ofstray reads. Interrogation zones may also be shielded using absorbing and reflectingstructures. Shielding increases the cost of the RFID system and adds environmentalrequirements for the location where the system is built.
In addition to these direct methods of reducing the number of stray reads, thesignal received from RFID tag carries properties which can be used as the qualityfactors of the signal. These factors can be used to identify stray read events.
1.2 Scope of Thesis
In this thesis methods in order to identify and control stray reads are exploredin three basic use cases. I. First case involves lay around tags inside an extendedinterrogation zone. II. The second case involves stray reads from handling unitswhich do not go through the RFID gate. III. The third use case involves strayreads from handling unit going through neighboring RFID gate. This third caseis also known as the cross read case. First to cases are explored in theory and byexperimenting. Third case is explored only in theory.
3
Both, direct methods to shape the interrogation zone and signal property basedmethods to identify stray reads and lay around tags are explored. Emphasis is onthe latter.
The focus of this thesis is on portal applications utilizing passive UHF RFIDtechnology using GS1 EPCglobal Generation 2 standards and protocols on ETSIregulatory area.
There are several regional regulatory bodies, which limit the usage of UHF RFIDtechnology. Most important of these are Federal Communications Commission(FCC) in the United States of America and European Telecommunications Stan-dards Institute (ETSI) in Europe. Because of practical reasons I focus on ETSIregulatory area. Results are mainly applicable on FCC regulatory area as well. Aswavelength is a function of frequency some methods studied in this thesis mightwork better on FCC frequency bands due to wider bandwidth available.

4
2 RFID Technology
2.1 History of Radio Frequency Identification
The idea to identify objects over distance without line of sight arose hand-in-handwith the development of radar technology in the beginning of the 20th century.First radars were able to tell that something was coming. What, when and howwere questions which could be answered. “Who” was a more problematic question.Strength of the reflected part of the signal carried information about the size ofthe object, but there was no method of distinguishing two objects with similar sizewithout a priori information.
First attempts to encode information to the backscattered part of the signalwere made by the Luftwaffe, the German Air Force, during the 2nd World War.Luftwaffe’s pilots performed a flat spin when their aircraft was illuminated by radarwaves. This flat spin altered the backscattered signal in such way, that the radaroperators were capable of distinguishing their own aircraft from the enemy aircraft.This can be understood as the first utilization of passive RFID technology.
More sophisticated method was soon introduced by the Royal Air Force (RAF).RAF installed a device in aircraft, which responded to the radar signal with changingcode [2]. This response message not only allowed to identify RAF’s aircraft from theenemy aircraft, but it also made possible to identify between RAF’s own aircraftfrom each other. This was the first implementation of active RFID technology.Since then transponders and Identify Friend or Foe (IFF) systems have become astandard in civil and military aircraft.
The cost of identifying an object must not exceed the value of knowing theidentity of the object[2]. This fundamental constraint limits the possible applicationsto utilize RFID technology. The development of passive backscattered RFID systemswas a great leap towards low cost RFID solutions and allowed the principle to beused in wide variety of different applications. Passive backscattered RFID is basedon a tag which modulates the response to the backscattered part of the carrier wavesent by the reader [3].
It took about fifty years from the first implementations for RFID to become main-stream technology in applications like supply chain management, ticketing, highwaytoll collecting, production control and asset management. This era started whenWall-Mart, DoD, Metro Group and few other large corporate retailers and institu-tions applied a mandate about RFID tagging for their suppliers[4]. This mandatehad a great impact on the price and availability of the UHF RFID technology andspeeded up the standardization.
In the beginning of year 2000, there were many competing proprietary UHFRFID standards, which had laid a negative impact on the adaptation of UHF RFIDtechnology. EPCglobal Class 1 Generation 2 UHF RFID standard development wasstarted in MIT Auto-ID laboratory to create a unified standard. Standard wasratified by EPCglobal in 2004. Air interface protocol of the same standard wasratified as ISO18000-6C in year 2006.

5
2.2 Overview of RFID System
Figure 1: An overview of passive UHF RFID System.[2]
An overview of UHF RFID system is presented in Figure 1. In the simplest formthe system consists of a RFID reader, an antenna and a tag. The RFID readersends signal to the tag using the antenna. Tag receives the signal and responds backby modulating identification code to the the backscattered part of the carrier wavesent by the reader. This identification code is stored in the internal memory of thetag. RFID reader receives the backscattered signal from the tag and encodes theidentification code the tag sent.
Communication from reader to the tag is called downlink or forward link andcommunication from the tag to the reader is called uplink or reverse link. The termsmentioned before are used in this thesis.
RFID reader may be connected to back-end computer systems which consumethe information about RFID events. This makes the RFID system a subsystemof an IT system which is used to monitor or control material flow related process.RFID is used to connect events taking place in the physical world to the IT-systems.These transactions can be operator initiated or automatic.
RFID systems are categorized into passive, semipassive and active systems de-pending on the usage of internal power. Semipassive tags are also known as Battery-Assisted Passive RFID tags (BAP). This categorization is presented in Figure 2.Passive RFID tags do not have any internal power available. They use only theenergy harvested from the carrier wave transmitted by the reader. Semipassive tagscan have internal power supply to power the tag circuitry. This allows semipassivetags to have simple sensors, such as temperature sensor[4], embedded. Semipassivetags do not use internal power supply for communication purposes. Active tags haveinternal power supply and embedded radio circuitry. Embedded radio is poweredby the internal power supply.
Typical shelf life for tag depends on the tag type. Passive tags have typicallyvery long shelf lives. Semipassive and active tags have shorter shelf lives, because ofdraining battery. Typical shelf life for a tag varies from few months on active tagsto several years of semipassive tags. Shelf life for passive tags is indefinite.
Open Systems Interconnection reference model (OSI) describes 7 layers on which

6
Figure 2: RFID Systems can be classified as passive, semipassive and active.[2]
serve as a framework for the definition of standard protocols [5]. OSI model ispresented in Table 1. Gen2 UHF RFID utilizes layers 1, 2, 6 and 7 on OSI model [6].The 5th layer is about session and this should also be included in the utilized layerslist contrary to what is mentioned in literature[6].
2.3 Frequency Bands
RFID systems can be built to operate on different frequency bands. Commonly usedfrequency bands for RFID are presented in Table 2.
Coupling between the antennas of a reader and a tag depends on the used fre-quency band. Capacitive coupling can be used on very short distances. Inductivecoupling is used in LF and HF RFID systems. UHF RFID systems utilize radiativecoupling [2].
When using inductive coupling, the antenna size matters more than the transmitpower. Read distance is roughly comparable to the antenna size, which makes itdifficult and expensive to build HF systems with long read distance.
UHF RFID systems utilize radiative coupling. The read range is mostly limitedby transmit power, which is typically regulated to 2 W ERP at ETSI regulatory area.Using high base frequency allows higher read rates to be used for the communicationbetween the tag and the reader.
LF and HF systems are more insensitive for metals and liquids present than UHFRFID systems. UHF RFID systems operating at frequency range from 860 MHz to

7
Table 1: OSI-Model. [5]OSI Model
Data unit Layer Function
Host layersData unit
7. Application Network process toapplication
6. Presentation Data representation,encryption and de-cryption, convert ma-chine dependent datato machine indepen-dent data
5. Session Inter host communi-cation, managing ses-sions between applica-tions
Segments 4. Transport End-to-end connec-tions, reliability andflow control
Media layersPacket/Datagram 3. Network Path determination
and logical addressingFrame 2. Data link Physical addressingBit 1. Physical Media, signal and bi-
nary transmission
920MHz are studied in this thesis.
2.4 Readers
There is wide variety of different devices capable to read RFID tags on the market.These devices are built for different purposes. There are stand alone readers, hand-held devices, fixed readers and RFID modules to be integrated into other devices.RFID readers are in most cases capable to alter the information stored on RFIDtag.
Typically, readers are embedded computer systems running linux or WindowsCE/Mobile operating systems.
Some earlier RFID readers were bi-static, which means that the readers had radiocomponents built in a way which needed different antennas to be used for transmitand receive. All modern RFID readers are monostatic which allows single antennato be used for both, transmit and receive.
Typical features which need to be considered when selecting RFID reader forapplication are
• Supported air interface protocol (see section 2.9.3)
• Supported regions (see section 2.9.1)

8
Table 2: Commonly used frequency bands for RFID systems.Frequency Characteristics Standards Typical Applications
LF125/34 kHz
Passive, lowread speed,short range
ISO 11784ISO 18000-2A/B
Access control, live-stock and pet identifi-cation
HF13.56 MHz
Passive, mediumread speed,medium range
ISO 15693ISO 14445ISO 18000-3
Access control, tick-eting, library control,production automa-tion
UHF433.92 MHz
Active, mediumread speed, longrange
ISO 18000-7 (DASH7) Building automation,location based ser-vices, automotive,logistics
UHF860 - 960 MHz
Passive, fastread speed, longrange, sensitiveto liquids andmetals, low cost
ISO 18000-6A/BEPC Global standardsISO 18000-6 Type C
Supply chain applica-tions, asset manage-ment
UHF2.4 GHz
Active, veryhigh read speed,high cost
ISO 18000-4ISO 18185
Road toll collecting,cargo container track-ing
Figure 3: Impinj Speedway Revolution UHF RFID Reader
• Number of antenna ports
• Maximum transmit power
• Sensitivity
• Form factor
• IO-capabilities
• Network connectivity

9
• Performance
• Price.
Impinj Speedway Revolution R420 is a modern widely used stand-alone UHFRFID reader with a relatively small form factor and good performance characteris-tics. Impinj Speedway Revolution R420 can be seen in Figure 3. It has been chosento be used in the experimental part of this thesis as software of the reader grantsaccess to low level information about the transactions between the reader and thetag. Phase angle rotation and Doppler shift over transaction time is included thislow level information.
2.5 Tags
Passive RFID inlay or a tag consists of an antenna and integrated circuit, which hasthe needed components to modulate the backscattered signal and small memory tostore EPC code and other information.
Figure 4: Logical memory map of Gen2 RFID tag.[7]
Size of the memory on IC varies from a few bits in to several kilobytes. Mostcommon memory sizes for Gen2 tags are 128-bit and 512-bit. Memory mapping ofEPCglobal Gen 2 RFID tag can be seen in Figure 4. EPCglobal Gen 2 tag has 4memory banks – user memory, tag ID, EPC and reserved.
Variety on different types of RFID tags available is high. Assortment of RFIDtags can be seen in Figure 5. Figure 5 shows five hard tags of different sizes, a flagtag and wet inlay. Figure 6 shows a roll of UMP Raflatac DogBone wet inlay labels.Paper face labels allow printing human readable text or machine readable barcodeson the paper surface of the tag. Wet inlay is usually a transparent sheet of plasticwith an antenna, chip and glue on the other side. Dry inlay is the same as wet inlaywithout the glue and die-cutting.
A tag can also be integrated into a piece of plastic, which makes the tag morerugged and allows attachment to metal or other material with RF absorbing orreflecting properties.
The antenna of a tag can be designed to work primarily in near field (inductivecoupling) or far field (radiative coupling).

10
Figure 5: Assortment of different kinds of RFID tags.
2.6 Antennas
Different types of reader antennas can be used in RFID applications. Right antennaneeds to be chosen for the application. Typical UHF RFID patch antenna is shownin Figure 7.
Dipole antennas radiate uniformly along a plane around. Patch antennas havegain properties which allow directed antenna beam.
Antenna polarization needs to be considered in system design. Linear polariza-tion allows longer reach, but limits applications as reader antenna and tag antennaneeds to be aligned correctly. Circular polarized antennas allow more freedom tothe antenna and tag placement with the cost of reduced read range.
2.7 Portals and Read Points
RFID Systems utilize different types of read points and portals. In logistics mostcommon type of a RFID portal is a gate, which tracks items going through thegate. A typical example of an RFID gate is presented in Figure 8. The RFID gateconsists of two pylons on the sides of the docking door. In the example case thepylons hold two antennas each. Number and location of the antennas depends onthe application. RFID reader is located inside the cabinet attached to the pylonon the right. Light indicating the gate activity can be seen on the top of the rightpylon.
Shipment Verification Station (SVS) is a box made typically out of metal. One

11
Figure 6: UPM Raflatac DogBone wet label with Monza 3 chip.
side of the box is partly open allowing a handling unit to be put inside. The stationhas antennas inside the metal box. The box works as a Faraday cage and allowsonly those tags to be read which are inside the gate. This type of read points areused to form logical handling units also known as Virtual Handling Units (VHU)out of separate items on a handling unit (e.g. pallet).
Kanban systems can use RFID mailboxes to track consumption of productionmaterials. When one unit of materials is consumed the Kanban card representingthis unit of materials is put inside the RFID mailbox. The RFID reader integratedto the mailbox reads the tag attached to the card and sends information about thetransaction to back end systems.
In access control applications interrogation zone of a RFID read point can be un-derstood as a lock. When a tag containing right code is brought to the interrogationzone the lock is opened.
2.8 RFID Middleware and Integration
A RFID reader and a couple of tags alone do not enable that many useful applica-tions in business environment. To get most use of the system and make differentapplications possible, it is essential to build computer systems which integrate toother systems used in business environment.
“Savant is software that sits between tag readers and enterprise applications,providing variety of computational functions on behalf of applications” [8]. Savant

12
Figure 7: MTI UHF RFID Antenna.
is an old name for RFID middleware used by Auto-ID labs. RFID middleware is re-sponsible on functions like reader health monitoring, reader configuration and datafiltering. Middleware typically implements some business logic related to the appli-cation. RFID middleware offers interfaces allowing it to be integrated to backendcomputer systems like ERP, MES, SCM and WM. Integration to backend systemsis often done using SOAP methods like WebServices. Direct database integration isalso possible.
A subset of RFID middleware is called edgeware. Edgeware is running on thereader and it provides certain amount of functions which can be used to trigger readeroperations and refine the raw tag read data from the reader before it is uploadedto centralized integrated systems [6]. Main idea in edgeware is to reduce server andnetwork load by reducing the amount of events which need to be processed centrally.
2.9 Regulations and Standards
2.9.1 Regulatory Bodies
Usage of RFID technology is regulated by RF regulatory bodies like The EuropeanTelecommunications Standards Institute (ETSI) and The Federal CommunicationsCommission (FCC). Regulatory bodies set the boundaries within which RFID sys-tems must operate. Fundamental restrictions are the maximum transmit powerallowed and the operating frequency. Furthermore, these regulations limit the uti-lization of the given frequency band etc. This is done to prevent interruptions be-

13
Figure 8: RFID Gate at docking door.
tween different RF-systems. Allowed frequencies for UHF RFID systems are shownin Figure 9.
Methods to allow several readers to operate in the same environment are ListenBefore Talk (LBT), Frequency Hopping Spread Spectrum (FHSS) and Dense ReaderMode (DRM).
The simple rule of thumb for Gen2 is that due to the regional RF regulationsreaders are regional but the tags are global, which makes it possible to utilize RFIDin global logistics networks.
2.9.2 ETSI EN 302 208-1 v 1.4.1
The ETSI EN 302 208-1 regulation covers the minimum characteristics considerednecessary in order to make the best use of the available frequencies [9]. The doc-ument defines the limits for short range RFID devices operating at the frequencyrange 865 MHz to 868MHz using up to 2 W ERP.
The frequency range is divided up to four channels of 200kHz each as can beseen in Figure 10. Tags respond using adjacent low power channels.
2.9.3 GS1 EPCglobal Class 1 Generation 2 UHF RFID Standard
There are different standards set by different organizations for RFID systems uti-lizing different frequency bands. This thesis focuses on UHF RFID, thus the most

14
Figure 9: Regulatory status of RFID in UHF spectrum for some countries. ETSIcovers countries in EU. FCC covers USA. [10].
Figure 10: ETSI EN 302 208-1 channel plan [9].
remarkable UHF RFID standard is GS1 EPCglobal Class 1 Generation 2. This stan-dard will be later referenced as Gen2. Gen2 set of standards is currently the mostwidely adapted one and offers very good level of interoperability between devicesfrom different manufacturers.
GS1 EPCglobal has issued a set of global standards defining how UHF RFIDsystems should operate from the way data is encoded in the tag memory, how tag andreader communicate all the way to how the RFID data is integrated into back endsystems. An overview of EPCglobal standards is presented in Figure 11. Another

15
Figure 11: GS1 EPCglobal has issued a set of standards covering most aspects ofRFID technology.
widely acknowledged standard ISO 18000-6C was developed from Gen2, but it onlycovers the RF- and communication part of the standard.
The Electronic Product Code (EPC) is a unique number that is used to identifya specific item in the supply chain [11]. EPC is used in information systems whichneed to track or otherwise refer to physical objects [12]. Usually, EPC codes areencoded on RFID tags, but other media is not excluded.
2.9.4 Air Interface
An interrogator sends information to one or mode tags by modulating a RF carrierusing double-sideband amplitude shift keying (DSB-ASK), single-sideband ampli-tude shift keying (SSB-ASK), or phase-reversal amplitude shift keying (PR-ASK)using pulse-interval encoding (PIE) format [7]. Used PIE symbols can be seen inFigure 12. Symbol length is dependent on the set Tari parameter which is in rangefrom 6.25µs to 25µs.
After the interrogator has finished the transmission it sends an unmodulated RFcarrier and listens for a backscattered reply from a tag. Tags modulate the ampli-tude and/or phase of the RF carrier to send information back to the interrogator.Encoding format is either FM0 or Miller-modulated subcarrier. Communicationsbetween the reader and the tag is half-duplex, meaning that both cannot transmitsimultaneously.

16
Figure 12: PIE Symbols. [7]
Figure 13: Transmit mask for dense reader environment. [7]
Gen 2 protocol defines a mask for dense reader environment. The mask limit’show much transmit power is allowed to leak from the channel frequency. This maskis presented in Figure 13.
Medium Access Control and tag anti-collision in Gen2 is based on Q protocol,which is a variant of slotted Aloha algorithm. The protocol operates in followingway.
1. The reader specifies the number of slots in the inventory round (Q value)
2. Each tag uses pseudo random number generator to pick a number which is putto the slot counter
3. The reader issues commands to mark the beginning of each slot within theround
4. The tag decreases the slot counter by one for each of the rounds
5. Tag replies with a random number when it’s slot counter is 0
6. Reader deciphers the random number and sends an ACK to the tag
7. Tag responds with EPC code

17
This protocol allows the reader to have unique logical sessions with the tags eventhough some tags would have the same EPC code. Random number sent by the tagacts as a handle within this inventory round.
If there are many collisions (many tags respond in the same slot) the reader canincrease the Q value for next inventory round. Also if tags respond only from veryfew slots, the reader can decrease Q value to make inventory cycle faster.
Table 3: Tag flags and persistence values. [7]Flag Required persistence
S0 inventoried flag Tag energized: IndefiniteTag not energized: None
S1 inventoried flag Tag energized:Nominal temperature range: 500ms < persistence < 5sExtended temperature range: Not specifiedTag not energized:Nominal temperature range: 500ms < persistence < 5sExtended temperature range: Not specified
S2 inventoried flag Tag energized: IndefiniteTag not energized:Nominal temperature range: 2s < persistenceExtended temperature range: Not specified
S3 inventoried flag Tag energized: IndefiniteTag not energized:Nominal temperature range: 2s < persistenceExtended temperature range: Not specified
Selected (SL) flag Tag energized: IndefiniteTag not energized:Nominal temperature range: 2s < persistenceExtended temperature range: Not specified
There are four distinct sessions on which the reader can do inventory rounds.Sessions are presented in Table 3. The persistence times between different sessionsdetermine how often the tag takes part in the inventory cycle of the reader. Thesesessions are independent.
Inventoried flag of a tag can have two states A and B for each session. In-ventoried flags of each sessions are independent. Inventoried flags of sessions arepresented in Figure 14. A reader operating at session S1 can inventory a tag popu-lation from A to B. Immediately after that another reader operating at session S2can inventory the same tag population from A to B. This is very useful in multireader environment.
Let’s assume that a reader inventories tags from A to B. If the reader is operatingon a session S0, it will get one read event from each of the tags as long as the tagsare powered on. Each time the tag loses power and receives it again it respondsduring inventory cycle of the reader.

18
Figure 14: Session diagram. [7]
If the reader is operating at session S1, it will read tag population continuouslyand receive read events from a single tag within interval 500 ms to 5 seconds, wetherthe tag has kept its power on or not. Obviously, it is not possible to read anunpowered tag.
If the reader is operating at sessions S2 or S3, it will receive a read event oncefor each of the tags as long as the tags are powered. If the tag loses it’s power forless than 2 seconds the inventoried flag will stay at B and no read event occurs.
Some tag manufacturers set different persistence values for sessions S2 and S3as the protocol allows this. For example the persistence for session S2 can be 5seconds and for S3 15 seconds.
A good example on using the inventoried flag is the Impinj readers’ dual targetmode. When the reader is configured to use dual target mode, it will first inventorytags from A to B and right after that from B to A. If this mode is used, continuousread events are received from powered tags in sessions S2 and S3 too.
3 Definitions and the Research Problem
3.1 Cases to Study
In this thesis three different cases of stray reads are studied. All three cases arecommonly faced while implementing RFID systems for distribution centers or othersimilar locations.
I. In the first case to study, RFID tagged handling units are left laying aroundinside the interrogation zone of RFID gate. This is a common situation at distribu-tion centers. It is beneficial to detect lay around tags and ignore such read eventsreceived. First case is presented in Figure 15. The figure presents two adjacentdocking doors equipped with RFID gates. The point of view is from above. Trucktrailers are parked at the docking doors. Wall of the logistics center is marked with

19
Figure 15: RFID tagged handling units laying around stationary inside interrogationzone.
bold grey bar. RFID gates are marked with vertical yellow bars. Antennas at thegates are marked with diagonal bars. The antenna setup presented in the figure istypical direction sensing configuration with two antennas pointing at the directionof the trailer and two antennas pointing at the direction of the logistics center. Ap-proximate interrogation zones are marked with radial blue lines starting from theantennas. Handling units are marked with red boxes. A picture of similar RFIDgate with normal (non direction sensing) antenna setup can be seen in Figure 8.
II. The second case to study is presented in Figure 16. This case is about a RFIDtagged handling unit passing by the interrogation zone of a RFID gate without goingthrough the gate. This is an essentially different case compared with the lay aroundcase as read events indicate that the tag is moving. However, the direction of themovement is different from those tags which go through the gate.
III. The third studied case is about cross reading. The docking doors of ware-houses are usually placed next to each other as can be seen in Figure 17. Therecan be tens of docking doors right next to each other. In these situations, RFIDgates are also placed next to each other and their interrogation zones can be partlyoverlapping. In the Figure 17, the interrogation zone of the RFID gate on the leftis overlapping with the interrogation zone of the RFID gate on the right. Leftmostantennas of the gate on the left are pointing towards the interrogation zone of thegate at the right. The handling unit moves through the gate at the right, but sometags are read also by the gate at the left. It is essential to know through which gate

20
Figure 16: RFID tagged handling unit moves through interrogation zone withoutgoing through the gate.
the handling unit left or entered the warehouse. Due to overlapping interrogationzones, this is not always so obvious to detect.
In all the studied cases, the number of tags can vary from one to several hundredper handling unit.
Experiments are conducted on first two cases. Third case is explored only theo-retically.
3.2 State-of-the-art Stray Read Detection
The number of academic studies which focus on identifying or controlling stray readsat RFID gates is limited. Academic work shows many studies about methods whichcan be utilized for this need. A number of patents about methodology to addressthis type of problems have been issued.
Academic research focuses on estimating 3D location for the tags [13] [14] [15][16] [17] or locating the mobile vehicle carrying the RFID reader [18]. The tag countis very small in these studies, usually only one tag to be located, which limits theusefulness of the results. However, it does not mean that the same methods mustnot provide similar results in many reader many tags environment.
On commercial field, Intermec uses doppler shift to detect tags belonging to loadon fork lift trucks [19]. Fork lift truck lifts a load. Read cycle is initiated by aRFID reader after the fork lift truck starts to move. Those tags which belong to

21
Figure 17: RFID tagged handling units are loaded at the neighbouring gate, whichis partly inside the interrogation zone of the gate.
the load which was just lifted present lower Doppler shift values (0 values in theory)compared to those tags which are attached to stationary items.
Impinj provides lay around tag suppression as an proprietary extension to LLRPprotocol [20]. Repeated observations of the same tags are suppressed for extendedperiods of time while the tag is energized. This method cannot be used in systemswhere multiple reads per tag are needed as it does not try to determine actual layaround tags.
Thingmagic has patented methodology to determine tag distance based on phaseangle change over frequency change [21]. It allows estimating a distance form RFIDreader to a tag based on multiple measurements of phase angle rotation using dif-ferent frequencies. The drawback of this method is, that at least two measurementsare needed and the tag nor the reader should move in between the measurements.
A patent issued to Nofilis describes a method how to compare the reads from tagsreceived through different antennas to find out wether the tag passed the gate [22].
7iD has patented methods to determine through which adjacent gate the tagwent [23]. The RFID read events from different gates are collected to a centralprocessing unit for further analysis to find the relevant events.

22
3.3 The Interrogation Zone and the Extended InterrogationZone
Rao et al. define read range as the maximum distance at which RFID reader candetect the backscattered signal from the tag [24]. Read range can be calculatedusing Friis free-space formula
r =λ
4π
√PtGtGrτ
Pth
(1)
where λ is the wavelength, Pt is the power transmitted by the reader, Gt is thegain of the transmitting antenna, Gr is the gain of the receiving antenna, Pth is theminimum threshold power necessary to provide enough power for the RFID tag chipand τ is the power transmission coefficient affected by antenna and chip impedances.This states that most passive RFID systems are uplink limited. It is more difficultto power up the chip on the tag than hear the backscattered signal.
A
n
t
e
n
n
a
Figure 18: Typical interrogation zone generated by antenna used in RFID systems.Interrogation zone is marked with green and extended interrogation zone with yellow.
According to RFID for Dummies [25], interrogation zone is “a radio frequencyfield that can be thought of as a giant bubble coming out of the antenna”. It isuseful to define the interrogation zone more accurately. The logical limit for theinterrogation zone would be an area where the RF-field generated by the reader isstrong enough to activate the RFID tag and give it enough power to backscatterdetectable and qualified signal to the reader. The interrogation zone is marked withgreen color in the Figure 18.
When this definition is used, it is obvious that interrogation zone is dependenton the reader and the tag used as some tags and readers are more sensitive thanothers. Additionally, the interrogation zone depends on the operating environment.Large amounts of ambient electromagnetic noise will limit the size of interrogationzone, as backscattered signal is lost in the noise. The interrogation zone is alsoshaped by RF-absorbing or RF-reflecting materials within the interrogation zone.
The qualified aspect of the signal refers to the main problem studied in thisthesis. The signal will be qualified over criteria which depends on the measured

23
properties of the signal like Received Signal Strength Indicator (RSSI). In industrialapplications read reliability plays the key role in the usefulness of the applications.In some applications, the environment or tag position might not be optimum forread reliability, the RF properties of tagged items vary and tags have tag-to-tagdifferences in backscattering ability. In these cases reader transmit power needs tobe increased to increase RF-field strength to allow these not optimally located RFIDtags to be read. Increasing transmit power widens the interrogation zone over thedesired limits.
The area on which the RF-field generated by the reader is strong enough toactivate the tag and give it enough power to backscatter detectable but unqualifiedsignal to the reader is referred as the extended interrogation zone in this study.Extended interrogation zone is marked with yellow color in the Figure 18.
3.4 RFID Event
A RFID event is one logical transaction at the interrogation zone. When a tag passesthrough the gate, it may interact with the reader several times depending on thesettings on the reader. The maximum read rate with current state-of-the-art readersis close to one thousand reads in one second. Small number of readers operatingat full speeds could bring very high load on back end systems, if read events wouldbe transmitted unfiltered. The number of events is reduced greatly by using RFIDparameters like session in reasonable way. In any case these single read events andtheir quality indicators can be processed to create more sophisticated informationwhich can be used in business logic.
A bunch of one hundred read events can be refined to a single RFID event whichcontains information like tag with EPC code A, went through portal B, to directionC at time D. This is reasonable at the system design point of view also. Especially ifthe amount of RFID readers is large, they can produce huge amounts of informationwithin a short time interval [25].
In addition to the one RFID event type described in previous paragraph, therecan also be many other types of RFID events.
• Tag entered the interrogation zone
• Tag left the interrogation zone
• Tag was seen at the interrogation zone
• Tag was encoded
• Tag was commissioned (printed)
• Tag was killed
The exact types of RFID events which are reported by the middleware dependson the application.

24
3.5 Environmental Considerations
3.5.1 Warehouse Environment
Industrial warehouse environment, which is typical for logistics RFID applications,lays challenges on RFID systems. Typically the environment is not fully controllableand there may be interference in physical environment and possibility for processerror. Although storage and transfer areas are separated in most cases, it is notalways possible due to limited space available. There is a need to design RFIDsystems to tolerate handling units left in the extended interrogation zone.
Most of the problems can be solved by warehouse layout design. Layout mustbe designed so that there are no other than RFID transaction related activitiesat the interrogation zone. Interrogation zones can be placed far from each otherand antennas can be placed so that they do not point to other interrogation zones.Material flow must be designed so that no materials are stored near interrogationzones.
Issuing a kill command for those tags, which are not used anymore to avoidinterference with the tracked process is a good practice. Sometimes this is notpossible and these discarded tags can end up near interrogation zones of RFIDgates. These kind of tags present the same problem than the lay around handlingunits waiting to be handled in the previous paragraph. The operating environmentshould be kept clean of discarded RFID tags.
3.5.2 Dense Reader Environment
If a warehouse is fully RFID enabled, it usually means that there are several adjacentdocking doors. It is possible that a RFID reader detects a tag going through anadjacent docking door. This is known as cross reading. There is also a possibilitythat a tag powered up by a reader nearby, responds to inventory command of areader much farther away. This phenomenon is known as cross talk. In cross talkthe tag behaves as a semi-passive tag would. The reader near-by provides the energyto power up the tag circuits. In most cases passive RFID communication is downlinklimited [2]. If the communication would be uplink limited, cross talk would not bepossible. These issues must be in control for successful implementation of a RFIDsystem.
Communication protocols used by RFID readers take multi-reader environmentsinto account with functions like Listen Before Talk (LBT), Dense Reader Mode(DRM) or Frequency Hopping Spread Spectrum (FHSS). If LBT is used, the readeris obliged to listen that the selected channel is free of transmission before it starts totransmit. DRM operating modes of the reader use Miller-modulation to reduce thebandwidth of the signal by increasing the symbol length. Miller-modulation uses 2,4 or 8 subcarrier cycles for one symbol. Increasing the symbol length decreases thedata rate. FHSS distributes the transmission over many different randomly chosenfrequencies and thus reduces the interference between readers as two readers use thesame frequency only for a very short time.

25
3.5.3 RF-absorbing and -reflecting Materials
Both the operating environment and the items tagged may be made of or may con-tain RF-absorbing and -reflecting materials. Liquids absorb RF-energy transmittedby readers and may prevent reading nearby tags. Metals reflect the RF-field gener-ated by the reader shaping the interrogation zone and preventing nearby tags fromresponding. Reflecting materials can also focus RF-energy to some spots outsidethe interrogation zone, and make it possible for tags outside of interrogation zoneto respond.
In general RF-absorbing and -reflecting materials should be avoided in the in-terrogation zone between the reader and the tag.
3.5.4 Other RF-issues
Physical structures like floor, roof, walls and portal structures have RF-reflectingproperties. This causes phenomenon called multipathing. RF-signal sent by thereader or backscattered signal sent by the tag may not pass using the shortest route –the line of sight. These signals may be reflected from some nearby structures. Whensignal arrives the destination through different routes, the phase of these signalsdoes not match. Signals add to each other causing constructive and destructiveinterference. Multipathing weakens backscattered signal and causes variance to thesignal parameters, thus making qualification problem more difficult.
Ambient Electromagnetic Noise (AEN) reduces Signal to Noise Ratio SNR ofthe backscattered signal making detection more difficult. Electric motors and otherelectronic devices can work as a source for AEN. In FCC regulated countries RFIDdevices use the Industrial, Science, Military (ISM) band which is unlicensed butregulated. Many different RF systems like remote controls may operate on thissame band causing interference.
3.6 Reducing Interference Caused by Dense Reader Envi-ronment
Special attention needs to be paid to reduce the interference between readers inmulti-reader environment. Non-controlled interference can reduce reliability andthroughput of an RFID system.
There is a vast difference in the power of a signal transmitted by the reader and abackscatter of a tag. The magnitude difference between a tag response and a signalfrom some other reader is 2 × 10¹⁰ fold. Pointing antennas of two readers towardsof each other should be avoided, because it will affect reader capabilities to receivetransmissions from tags. A RFID reader with multiple antennas of a single readercan be towards each other, as the reader multiplexes the antennas and transmitusing one antenna only [2].
Transmitting should happen only when necessary. RFID gates can be equippedwith motion sensors which trigger reader to read when motion is detected at thegate. This will decrease RF-noise in the environment.

26
Impinj Speedway Revolution R420 supports low duty cycle mode which mini-mizes transmission when no tags are present [20]. When reader is operating in lowduty cycle mode it pings Field of View (FOV) of each antenna for tags at slow rate.When a tag is seen, the reader moves to full duty cycle mode.
Readers operating on adjacent docking doors at distribution centers can be co-ordinated in a such manner that only right- or left-looking antennas are activatedat any given moment. This reduces the AEN received by the readers.
Interference coming from outside to interrogation zone and interference causedby the reader to environment can be reduced by proper shielding. RF-absorbingmaterials can be placed around the interrogation zone. In most cases this is notvery practical so other options should be considered.
Readers operating near each other can be forced to use different frequency chan-nels in ETSI region. This will reduce the interference caused by each other. OnFCC region, the number of available channels per reader cannot be reduced, but itis possible to tell the reader to decrease transmit power on some particular frequen-cies [20].
3.7 Locating Tags
There are many studies considering RFID localization. Some of the previous studyuse RFID tags as beacons and the RFID reader is moving in the area [27]. This kindof localization applications are usually related to navigation in predefined environ-ment. Typical applications include field robotics and positioning forklift trucks in awarehouse. Other studies let the tag move and readers are stationary [28]. Differentlocalization techniques have been compared by Bouet [17]. These studies are closeto the research problem, but do not present ready methods to solve the problemsstudied in this thesis.
3.7.1 Detecting Tags at Extended Interrogation Zone
Cross reads often cause a problem for RFID gates. Sometimes adjacent RFID gatesare placed near each other – the distance between gates can be less than 1.5 meters.Some of the tags moving through an adjacent RFID gate are read. These read eventsfrom the wrong gate need to be identified and discarded.
Cross talk increases the number of cross reads as the nearest gate powers up thetag to make it visible for a reader further away. Known fact is that the RSSI ofread events from cross talking tags is significantly lower than RSSI of the tags in theinterrogation zone of the reader. Hence cross talk reads can usually be suppressedby RSSI filtering.
One solution to this has been presented by 7iD. This patented solution choosesthe first antenna which sees the tag in direction from the antenna beam as the correctantenna [23]. The idea is presented in Figure 19. A handling unit with RFID tagsmoves through the gate on the right. All antennas on adjacent gates pointing rightdetects some of the tags. Blue arrow shows the direction of antenna beams. Basedon this logic the read events from the right-looking antennas of the right most gate

27
Figure 19: Cross read detection by comparing read events from different gates.
are the meaningful ones. This is a very straight forward solution to solve the crossreading issue, but needs decision making and filtering on higher than reader level.
3.7.2 Multi-level Localization Problem Solving
Each message sent by a RFID gate has a cost related to the amount of data trans-ferred and processed within the RFID system. This is why it is advantageous tocreate, filter and analyse the RFID events at as low system level as possible. Never-theless cross reading issue might need to be solved on a higher level, when informa-tion from several different readers is available. The knowledge of the geometry andmutual locations of the interrogation zones allows to form unions and intersectionsof interrogation zones. This enables more detailed localization information to berefined from the events received.
3.8 Detecting Tag Movement
Tag movement detection can base on changing RSSI or phase angle values betweentwo read events of the same tag or on Doppler shift information on single read event.
3.8.1 Detecting Non-Moving Tags
One of the main questions to answer in this study is to find methods how to detectstatic (non-moving) tags. These tags are referred as lay around tags in this thesis.This is also one of the most common problems in logistics environment. A handlingunit may be left near a docking door, which allows a RFID reader to read at leastsome of the tags inside the handling unit. These tags have not gone through theinterrogation zone and no RFID event should be created for them.
Intermec has patented a method to determine which items are part of the fork lifttruck load and which are not. The methods relies on phase angle to detect stationarytags [19]. The movement information of tags is combined to the information aboutmovements of the fork lift truck. A RFID reader and an antenna is mounted on thefork lift truck. If a tag is found stationary compared to the antenna (and the fork

28
lift truck) while the fork lift truck is moving the tag is considered as a part of theload.
Doppler shift based tag movement detection methods have been explored bySensormatic. The company has patented Doppler shift based methodology to beused in fork lift truck application [29].
3.8.2 Detecting Tags Moving Across Interrogation Zone
Commonly the operating environment has space limitations. In such cases it ispossible that the handling units marked with tags are pulled across the extendedinterrogation zone of an RFID gate. Some tags within the handling unit are read,but should be discarded using the suitable qualification criteria.
A positive detection problem is to detect tags moving through a RFID gate andcreate according RFID events. This capability must not be compromised by themethods to solve the two negative detection problems mentioned above.

29
4 Methods
4.1 Controlling the Interrogation Zone
In this chapter few typical ways of adjusting the interrogation zone are introduced.Generally the ideal interrogation zone would match with the extended interrogationzone. Due to limitations in antennas and multipathing in the real world environment,it is difficult to create RF-field with clean envelope, high intensity and sharp edges,where intensity suddenly drops to very low levels.
Known interrogation zone controlling methods are considered in the following.Most of the methods are based on the factors in Friis free-space equation 1.
4.1.1 Reader Transmit Power
In most cases read range is limited by the downlink [2]. A tag needs to harvestenough energy from the signal transmitted by the reader to power up the IC. Inmost cases this amount of energy is sufficient to backscatter detectable response tothe reader. The amount of energy transmitted can be adjusted by changing thereader transmit power within the limitations set by regulatory body and antennasused.
4.1.2 Choosing the Right Antenna for the Application
The size and shape of the interrogation zone depend on the antenna(s) used. Thereare several types of antennas, each type shapes antenna beam differently. The beammight be e.g. wide and uniform or narrow and one sided.
The European RF-regulatory body ETSI limits the maximum Equivalent Ra-diated Power (ERP) to 2W. This means that if a high gain antenna is used, thetransmit power needs to be reduced. Meanwhile the American RF-regulatory bodyFCC limits the maximum Equivalent Isotropically Radiated Power (EIRP) to 4W.This corresponds to 2.44W ERP.
High gain antennas, also known as narrow beam antennas, emit narrow RF-field.These type of antennas can be used to limit the extended interrogation zone in frontand in back of the gate. The interrogation zone is more intense between the gatepylons. The downside is that the interrogation zone is much narrower and gives amoving tag less time to be read. Throughput of the system is limited.
If antennas are placed on the top of the gate facing down, the interrogationzone is physically limited to the floor. Depending on the reflecting and absorbingproperties of the floor this can be a very efficient option on handling unit leveltagging, but not very usable on item level tagging, when tags are usually placed onthe sides of the items.
4.1.3 Antenna and Tag Positioning
Tag location determines how antennas should be positioned. The main principlesare that there should be antennas facing all sides of the handling units on which the

30
tags may be located. Line-of-sight helps to get the read reliability on high level butit is not a necessity.
In handling unit level tagging cases, when there is only one or several tags withthe same ID on the handling unit, positioning antennas on top of the gate is a goodoption. It helps to limit the interrogation zone and reduces possibility to cross read.In this case the tag should be positioned on the top of the handling unit.
If the handling unit contains several items which are tagged individually, tagsshould generally be facing to the sides of the handling unit. This allows stackingitems on top of each other. If the items contain RF-absorbing or RF-reflectingmaterials, no tags should be placed inside the handling unit as reading of such tagsbecomes more difficult.The drawback is that when the antennas are on the sides ofthe gate, confronting cross read issues becomes more probable.
The number of antennas needed is determined by the size of the handling unitand the shape and the size of the antenna RF-field. Most typical cases can be solvedby placing two antennas on each side of the gate. One antenna near the maximumheight of the handling unit and the second antenna near ground.
Some methods involving advanced RF-level processing (e.g. Doppler shift) mayrequire adjusting the antennas to the right angles towards the expected tag move-ment. Measurement of the signal path length from the transmitter within the readerto the antenna is needed, if phase shift rotation measurements are used for triangu-lation.
4.1.4 Third Antenna Trick
The third antenna trick covers a number of methods to divide interrogation zonesinto smaller sections by using unions and intersections of the tag visibility data.The third antenna trick can be used to convert sections of the interrogation zoneto extended interrogation zone. This is done by putting an additional antenna(s)facing away from the interrogation zone. If a tag is seen by one of these additionalantennas, it can be determined to be at the extended interrogation zone and noRFID event is created.
In Figure 20 the RFID gate has two antennas facing inside the RFID gate. Theinterrogation zone of these antennas is shown on blue. Additionally, there is a thirdantenna with an interrogation zone marked with red. The lay around handling unitis partly on the blue and the red interrogation zones. As long as the handling unitis seen with the third antenna, it is considered as a lay around handling unit andno RFID event is created. In this case the interrogation zone is an union of the twoantennas with blue interrogation zones, excluding the intersection marked with red.
4.1.5 Triggered Reading
One way to reduce unwanted RFID events and conserve electricity is triggered read-ing. Photo cell or similar sensor is installed to detect activity at the interrogationzone. The RFID reader is activated only when this sensor is triggered.
A camera can also be used as a motion trigger. There are methods to calculateoptical flow from the consecutive images provided by the camera. The optical flow

31
Figure 20: Third antenna trick is used to control stray reads.
measurements reveal the direction and intensity of the movement, which can bethresholded and used as a trigger for RFID gate.
Triggered reading reduces the amount of stray reads, especially when RFID gatesare adjacent. However the method does not provide final solution for issues with layaround tags, stray reads or cross reading. When a handling unit containing RFIDtags is pulled through the gate, there still might be some lay around tags in theextended interrogation zone.
Triggered reading should be considered if large amount of RFID readers or otherRF-emitting devices are located in the same place. In this type of environmenttriggered reading will reduce ambient electromagnetic noise, as the RFID readersdo not need to query for the tags constantly.
Triggered reading may hinder the operation of lay around tag detection as num-ber of read events from lay around tags is decreased. This limits the possibilities touse statistical methods to identify lay around tags with high certainty.
4.2 Signal Quality Indicators
Backscattered signal received from tag has three main parameters, which are pro-vided by commercially available RFID readers: Return Signal Strength Indicator(RSSI), signal phase angle rotation and Doppler shift. These can be used to findthe qualities which differ in tags located in the interrogation zone and the extendedinterrogation zone. These parameters also offer methods of distinguishing moving

32
tags from stationary tags.
4.2.1 Return Signal Strength Indicator (RSSI)
Return Signal Strength Indicator is the strength of the backscattered signal fromthe tag. It is usually presented in dBm. It tells how strong is the downlink from theRFID tag to the RFID reader. Received signal strength can be derived from Friisequation
Pr = PtτG2rG
2t
(λ
4πr
)4
(2)
where Pr is the signal power received, Pt transmit power of the reader, τ backscattertransmission loss, Gr reader antenna gain, Gt tag antenna gain λ carrier wavelengthin meters and r distance reader and tag antennas. This states that received signalstrength is dependent on the distance by factor of 1/R4.
It is obvious that generally RSSI decreases when distance to the tag increases.The received signal strength decays monotonously as mentioned above in free space,but in typical operational environment for a RFID system the decay over distanceis more complex due to constructive and destructive interferences caused by thereflections of the signal.
It is known that reader transmit power, antenna gain, cable losses and tag designaffect the RSSI. There can even be tag to tag differences between similar make oftags which are caused by small differences in chip to antenna coupling. Tags withdegraded performance should be eliminated while tagging.
RSSI can be used as a thresholding criteria: Tags which respond with RSSI valuelower than the set limit are discarded. This can lead discarding bad tags, tags indifficult locations or tags seen through reflection which needs to be taken to account.
Thresholding can be based on absolute RSSI values or relative RSSI values tosome known tag. A reference tag can be placed in the interrogation zone andread events from load tags can be compared with read events from reference tags.Thresholding has proven to be very useful in filtering out the read events caused bycross talk.
4.2.2 Signal Phase Angle Rotation
In this thesis a term signal phase angle rotation is used instead of the more generalalternative signal phase angle. This is due to the nature of the measurement doneby the reader. The reader does not report the phase angle of backscattered signalreceived from the tag. Instead it reports the difference of phase angles of the sentand the received signals. This justifies adding the rotation extension to the the termfor the sake of clarity.
Relation between wavelength and frequency of RF carrier wave is given by
λ =c
f(3)
where c is the speed of light, f is the frequency and λ is the wavelength.

33
Phase angle rotation of the backscattered signal can be expressed as
θ = 2π
(2R
λ+ θT + θR + θTAG
)(4)
where R is the distance between the reader and the tag, λ is wavelength, θT phaseangle rotation caused by reader’s transmit circuits, θTAG is phase angle rotationcaused by the tag’s reflection characteristics, and θR is the phase angle rotationcaused by the reader’s receive circuits.
The phase angle is a periodic function with period of 2π radians, thus phaseangle values repeat at distances separated by the integer multiples of one-half of thecarrier wavelength.
Rn =nλ
2, n = 1, 2, . . . (5)
In theory phase angle rotation remains the same as long as the signal path, thewavelength and the phase angle rotation characteristics of the reader’s and the tag’scircuits remain the same. These qualities make the phase angle rotation change agood measure for a tag movement at least in theory.
There are several factors which need to be considered when using phase anglerotation to determine relation between the tag and the reader. Multipathing inthe operating environment can alter the signal path between read events. FCCregulations oblige reader to frequency hopping, which affects the wavelength andthis way has a small change in phase angle rotation. Readers operating at ETSIregion change channels to overcome operating environment limitations. FCC allowswider 26MHz bandwidth for RFID. Within this bandwidth the phase angle rotationchanges remarkably. The phase angle rotation needs to be treated antenna- andfrequency-wise.
Sophisticated methods have been developed to use signal phase rotation to lo-cate tags, measure their orientation and speed [19]. These methods include TD-PDOA (Time Domain Phase Difference of Arrival), FD-PDOA (Frequency DomainPhase Difference of Arrival) and SD-PDOA (Spatial Domain Phase Difference ofArrival) [13]. Povalac et al. have further studied the FD-PDOA method [14] andHekimian et al. have studied the SD-PDOA method [15].
Last two methods are interesting in the RFID point of view. ETSI and FCCregulations allow changing the frequency within the given range. In theory it wouldbe possible to calculate the distance to the tag based on how much phase anglerotation changes when frequency changes. If this information would be gatheredfrom several antennas with known locations, it would be possible to tell the taglocation related to the antennas.
Phase angle rotation measurement can also be used to determine tag movementand distinguish stationary tags from moving. If measured phase angle rotationchanges, the tag is moving or an object is moving between the tag and the antenna.
Cyclic type of phase angle rotation can cause problems on this approach. In-consistencies in phase angle rotation change need to be handled. The wavelength ofelectromagnetic radiation at frequencies around 860 MHz is 34 cm. Also two-way

34
signal path needs to be considered which further increases the resolution of one phaseangle rotation cycle to 17 cm. Thus read events should be received at least one fromeach 8.5 cm, which limits the highest allowed speed for the tag with the read rateof the reader. It would be possible to follow a small number of tags accurately, butthe number of tags must not be too high.
The typical geometry of a RFID gate reduces the phase angle rotation change.Antennas are on the side and handling unit moves in front of the antennas. Thephase angle rotation change rate decreases gradually and starts to increase whenthe handling unit passes the middle point of the gate.
The most promising use for phase angle rotation data of read events can beto calculate standard deviation over measured phase angle rotation values for eachantenna separately. Especially at ETSI region the narrow bandwidth will not causesignificant shift in phase angle rotation for the distances used. Standard deviationof the phase angle rotation values could indicate wether the tag is moving or not.
4.2.3 Doppler Shift Over Read Cycle
Doppler shift forms when there is a relative motion between reader and a tag [18].The perceived wavelength of the signal is shortened, if the tag is moving towardsthe reader and lengthened, if the tag is moving away from the reader. Perceivedphase angle rotation over received data packet transmit duration is given by
∆θ = 2π (2fm∆T ) (6)
where fm is Doppler frequency, and ∆T data packet transmit duration.The Doppler frequency perceived by the reader is given by
fm =∆θ
4π∆T(7)
This measurement is greatly affected by the data rate used in the communicationsbetween a RFID tag and a RFID reader. In the high throughput mode, when thedata rate is fast, Doppler shift measurements have proved to be inaccurate [26].The accuracy of Doppler shift measurements can be increased by slowing down thedata rate e.g. by using Dense Reader Mode (DRM) settings for the reader or byincreasing the amount of data to be transmitted by using tags with longer EPCcodes [26].
Doppler shift is very useful in RFID applications, as it provides estimate of speedof tag within a single read event. Doppler shift does not only reveal the speed, butalso the direction of the movement relative to the given antenna. This makes it aneffective tool for detecting stationary tags.
4.3 Using Geometry of Antenna Setup to determine TagMovement
Antenna layouts designed for direction sensing purposes can be utilized to detectlay around tags. Some algorithms used for direction sensing provide lay around tag

35
identification as side result. Those tags which were seen, but the direction of wichcould not be determined are identified as lay around tags.
There are two commonly used antenna layouts for direction sensing. First uti-lizes two separate interrogation zones and second tilted antennas and Doppler shiftmeasurement.
4.3.1 Two Interrogation Zones
Figure 21: Direction sensing with two separate interrogation zones.
If RFID Gate is equipped with two or more antennas, it is possible to dividethe interrogation zone in two parts in the direction of the movement as can be seenin Figure 21. If the tag is seen first in the interrogation zone A and then in theinterrogation zone B, it can be assumed that the tag has moved from A to B. Thiskind of interrogation zone layout can also be used to detect lay around tags. In thiscase those tags which have been seen only at A or at B, but not at both, can bedetermined as lay around tags.
Usually dividing interrogation zone in two parts is done by installing one pairof antennas facing front of the RFID gate and another pair of antennas to the backof the RFID gate. Drawback with two interrogation zones is that it increases thefootprint of the RFID gate.
Common algorithm to be used when two interrogation zones are used to detectdirection of the movement is presented using Python code in Listing B1. Simpledirection sensing algorithm receives a list of RFID read events for a single tag and

36
determines a movement based on these events. If currentSide is unknown in theend, the tag is identified as lay around tag.
4.3.2 Antennas Tilted to the Direction of the Movement
Figure 22: Direction sensing with antennas tilted towards the movement.
Doppler shift values of RFID read events reveal the perpendicular to antennascomponent of tag speed. These measurements can be used to determine direction ofthe movement. In Figure 22 is presented simple direction sensing gate which utilizesDoppler shift measurement.
Doppler shift based algorithm to detect the direction of tag movement is pre-sented in Listing B2. If currentSide is left at unknown the tag is identified as a layaround tag. Proper threshold value needs to be determined.
4.4 Layout Based Processing the RFID Event Data
To address issues with cross read, it is possible to use the information about thelayout of the RFID system. If read events of the same tag come from two differentgates with directed antennas, it is possible to determine what the closest antenna tothe tag was by comparing the antenna directions. The tag must have been in frontof the antenna furthest away in the direction the antenna beams are pointing, if ithas been seen with several antennas pointing the same direction [23]. Cross readpossibility is eliminated if the antennas of both sides of the gate read the tag.

37
4.5 Statistical Analysis of Multiple Read Events of RFIDTag
In this thesis statistical properties of several consequent read events of the sameRFID tag are used for two purposes – to determine the movement of the tag andwether the tag is in interrogation zone or in extended interrogation zone. To get highcertainty for results, high number of read events are needed, which can be consideredas a limitation for these methods. Hence it is not possible to use statistical methodsif a tag is seen only once.
Statistical analysis is carried out offline for recorded data after the experiments.The data is analysed using purpose built program written in Python. Analysis isdone on testrun basis. Statistical analysis is based on all read events of the same tagduring one test run. In practice, this means that the individual experiments per-formed in this thesis cover time ranges from 15 seconds to 1 minute. The algorithmsshould be generalized for running continuously in order to exploit the algorithms inproduction environment.
The program used for analysis recognizes tags by their EPC codes. An objectis created for each tag identified by a unique EPC code. The object contains dataabout all tag read events and it is updated with new information each time the tagis read.
Monitored variables are:
• RSSI
• Mean RSSI
• Standard deviation of RSSI
• Phase angle rotation
• Standard deviation of phase angle rotation
• Doppler shift
• Mean of Doppler shift absolute values
All mean or standard deviation variables are calculated over all the read eventsof the same tag during one test run.
RSSI values are monitored on read event basis. Too weak events may be rejectedby RSSI threshold as weak events may be caused by cross talk.
Mean RSSI calculation is done by PyLab mean function. Mean RSSI containsinformation about the signal strength of the tag over time.
Standard deviation calculation is done by std function of PyLab. Standarddeviation of RSSI values tells about the possible movement of the tag. Tags passingthrough the gate should show first increasing and then decreasing trend in the RSSIvalues, which will increase deviation. Non-moving tags should have quite stableRSSI, excluding temporary changes caused by moving objects in the perimeter.

38
Phase angle rotation has similar properties than RSSI, excluding that it shouldnot be as sensitive to near-by moving objects as long as the signal path length doesnot change. Phase angle rotation depends on the signal path and used frequency.Measurements through different antennas need to be handled as separate, as signalpath changes when antenna changes.
Phase angle is cyclic parameter which changes between 0 and 180 ( - 360 ifquadratic detection is used). Thus directional statistics methods need to be usedfor analysis.
Circular standard deviation is defined by Gaile in Directional Statistics pa-per [30]. PyLab implementation of circular standard deviation was insufficient as itscaled all values to range [0, 1]. Function was overloaded with function presented inListing B3.
Positive Doppler shift values are expected to be measured on handling unitsapproaching the gate and negative values on handling units departing the gate.Overall movement can be detected by using absolute Doppler shift values. Mean ofDoppler shift absolute values is expected to be different on moving tags and non-moving tags. Absolute values of Doppler shift measurements is calculated using absfunction of PyLab. Mean is calculated by using mean function of PyLab.
4.5.1 Lay Around Tag Detection Algorithm
Lay around tags are detected using lay around tag detection algorithm. This algo-rithm is presented in Listing B4.
Algorithm relies to the knowledge that absolute Doppler shift mean and stan-dard deviations of phase angle rotation and RSSI of the lay around tags are low.Furthermore event count of lay around tags is typically high. In most cases layaround tags are seen by only one antenna. Moving tags have typically 1 or 2 readevents from a single antenna which is compensated in the algorithm.
While the algorithm is running and data is analysed, all these known facts in-crease the vote count by one. All votes from different antennas are added togetherand if the total count of votes is higher than 3, the tag is identified as a lay aroundtag. Proper threshold values need to be adjusted based on used reader configuration.The presented algorithm allows each criteria can also have different weights.
4.6 Virtual Handling Units
Virtual Handling Units (VHU) can be used to track movements of item level taggedhandling units. For example, a handling unit can be a pallet containing one or morecardboard boxes. If tagging is done on item level, and no specific tag for shipmentis used, VHU can be formed from the items on the pallet. The handling unit canbe tracked on system level using the knowledge of which items are on the handlingunit. This can be useful in cases where the number of items per handling unit ishigh. Required level for the read rate of RFID gate is decreased. For example, if70% of items creating one VHU have been seen at the RFID gate at a certain time,

39
an assumption can be made that all the items contained by the VHU passed throughthe gate.
VHU information can also be used in lay around detection. If assumed, that allthe items of VHU move as a single unit, and more than 50% of the tags are detectedas lay around tags, all the rest tags with insufficient data can also be regarded aslay around.

40
5 Experiments
Experiments need to be done in a controlled environment in order to avoid un-measured variables affect the results. Experiments in this thesis are planned andconducted in such way, that the effect of unmeasured variables is minimized.
5.1 Test Environment
Previous study shows that walls, floor and roof can cause interference to RSSIand phase angle measurements [13]. This is due to the constructive and destructiveinterference caused by multipathing. Proper test environment is a key to get reliableresults. An anechoic chamber would improve the repeatability of the conductedexperiments. Nevertheless the focus of the thesis lays in applied experimenting andsolving the issues caused by the echoes. The results from an anechoic chamber wouldhave little value for this thesis.
Large free space reduces interference caused by floor and roof. For example theexperiments can be performed outside or in a large warehouse with a high roof.
Antenna and tag placement need to be considered. Keeping the antennas andthe tags as high as possible will reduce the interference caused by the floor. Positionshould not be higher than the middle point between the floor and the roof or theinterference increases again.
The test environment needs to be clean in RF point of view. Ambient Elec-tromagnetic Noise (AEN) is minimized by removing any RF-emitting devices fromthe test environment. AEN is controlled by measuring the test environment usingspectrum analyzer before conducting the experiments. This is important as solvinginterference problems caused by multipathing is important part of this study andinterference caused by AEN would affect the results of the experiments.
Wavelength of the used signal sets the resolution for the measurements. At theRFID band wavelength is from 34.54 cm (865 MHz) to 34.66 cm (868 MHz). Cyclicnature of phase angle rotation needs to be considered. Phase angle rotation valuechanges full 360 cycle within 34.6 cm. To efficiently measure the cyclic changes,resolution needs to be approximately 5 cm.
Distances to the antenna are marked on the floor of the test environment usingtape. Distance between markings varies from 5 cm to 30 cm. This makes it moreconvenient to move the tag from a measurement position to another.
The test environment in the first part of the experiments is the entrance hall ofthe company. The hall is about 10 meters wide, 20 meters long and 15 meters high.Antenna is placed on the middle of the hall, about 3 meters from the other end.The tag is placed on a polyurethane stand in front of the antenna. The distancebetween the stand and the antenna is within a range of 0.3 to 5 meters during thetesting. The second applied part of the experiments is conducted in the garage of thecompany. Garage has a roof lower than the entrance hall. Height of the experimentarea is about 2.5 meters. Width of the experiment area in garage is about 10 metersand length is about 40 meters.

41
Possible AEN is measured using Rohde & Schwarz FSH3 spectrum analyzer.Measured AEN must stay below -90 dBm on 865 – 868 MHz band.
5.2 Equipment Used in Experiments
5.2.1 Impinj Speedway Revolution R420 UHF RFID reader
Experiments were performed using a set of Impinj Speedway Revolution R420 UHFRFID readers. The reader can be seen in Figure 3. Key factors which led to selectingthis reader for the experiments were
• Very good performance
• Very good sensitivity
• Low level reader data available through reader protocol
• Ability to run custom software on the reader
Table 4: Specifications of Impinj Speedway Revolution UHF RFID ReaderSpeedway R420
Air Interface Protocol EPCglobal UHF Class 1 Gen 2 / ISO 18000-6CAntennas 4 monostatic antenna portsTransmit Power +10.0 to +32.5 dBmMax Receive Sensitivity -82 dBmApplication Interface EPCglobal Low Level Reader Protocol (LLRP) v1.0.1Network Connectivity 10/100BASE-T
Table 4 shows the main features of Revolution reader. Readers used in experi-ments had firmware versions 4.8.0 and 4.8.3.
5.2.2 Antennas
Read tests were performed with a set of MTI MT-242027/NRH/K and Cushcraftcircular polarization antennas. Specifications of MTI antenna can be seen in Table5.
Radiation pattern of used MTI antenna is shown in Figure 23.Antennas with linear polarization would have produced more reproducible read
results, especially when placed in a such way that the polarization is vertical [2].Focus of the thesis is on applications. Using linear polarized antennas in applica-tions limits the placement options for the tags and generally discouraged in mostapplications.

42
Table 5: Specifications of MTI MT-242027/NRH/K antennaMTI MT-242027/NRH/K
Frequency Range 865 – 870 MHzGain 8.5 dBicVSWR 1.3:1Azimuth 3dB Beamwidth 65
Elevation 3dB Beamwidth 65
Polarization Right hand circular polarizationInput Impedance 50Ω
Figure 23: Azimuth radiation pattern of MT-242027 antenna at 867 MHz.
5.2.3 Stand for the Antenna
Antennas were placed on stands typically used for lights and loudspeakers. Thesekind of pylons are light to handle and provide good possibilities to attach antennaspointing in different directions. The stand used in the experiments can be seen inFigure 27.
Portal for cross read testing was built using two of these stands. The portalmeasured from wall to wall. The space between walls was divided to three sec-tions presenting the docking doors. Each stand had two antennas pointing oppositedirections.
5.2.4 Light Roof Portal Assembly
Lay around tag detection is tested using a light portal assembly attached over thedocking door. The light roof portal assembly can be seen in Figure 24. Portal con-sists of 4 directional circular polarized antennas, UHF RFID reader and aluminumstructure to hold the antennas. Angles between the antennas are set up so that twoantennas face to the direction of the movement and two antennas the opposite. Theantennas are tinted towards the middle point of the expected handling unit route.
When this antenna configuration is used with Doppler shift methods, it is possibleto determine the direction of the movement in both directions – through the portaland across the portal. This helps to detect lay around tags and stray reads.

43
Figure 24: Light roof portal assembly for lay around tag detection using directionsensing methods.
Alternatively the light portal assembly can be configured to utilize one interro-gation zone. This reduces the read rate as the interrogation zone is smaller thanwith the default setup. The benefit is a smaller foot print for the portal.
5.2.5 Styrofoam Structure to Hold a Tag
RFID tags used in initial testing are attached to styrofoam structure which willcause as little interference as possible to the RF-signals. Styrofoam is light andeasily moldable allowing flexible testing arrangements. A structure of 1.5 metershigh is built from styrofoam to hold the tags while testing. The structure is easy tomove and stable enough to stand still during the measurements.
5.2.6 Handling Units Used in the Experiments
Two handling units were built to be used in the experiments. Both of them werepallets. First pallet had four cardboard sheets set up in A form. Each sheet holding45 UPM Dogbone paperface UHF RFID labels. Total number of labels was 180for this type of pallet. The cardboard sheets were placed over wooden EUR-pallet.First pallet can be seen in Figure 25. Dogbone labels had NXP G2XL chips.
The first pallet turned out not to have enough tags for testing purposes, soanother type of pallet was designed. Second pallet type contained three plasticsheets made of polystyrene (PS). These sheets held one hundred Belt UHF RFID

44
Figure 25: Pallet with four cardboard sheets holding total of 180 UPM Dogbonepaperface tags.
Figure 26: Pallet with 6 sheets of PS plastic holding total of 600 UPM Belt tags.
paperface labels each. Belt labels have a smaller footprint than Dogbone labelsallowing greater label density. Sensitivity of Belt labels is very low when attachedon a cardboard surface. The cardboard sheets needed to be replaced with plasticsheets. Belt labels had Impinj Monza 4 chips. Figure 26 shows a pallet with twotest load units with three hundred tags on top of it. Most of the experiments wereconducted with one unit of three hundred tags.
Tags were encoded in a such way, that the location of the tag on the pallet can beseen from the EPC code. Number on the right indicates the column of tag. Second

45
number from the right indicates the row. Third number from the right indicatessheet number and fourth number indicates the pallet.
5.3 Preliminary Experiments
There are multiple parameters which may affect the measurements. To understandthe effect of each parameter, series of measurements were performed in the beginning.
Altered parameters were:
• Transmit power of the reader
• Antenna model
• RFID chip on the tag
• Operating mode of the reader
Two levels of transmit power is used in the experiments. 25dBm and 30 dBm.Typically transmit power is 25dBm or more in portal applications.
Experiments are conducted using two different antennas. One MTI model andone Laird model. Both have similar gain and frequency response characteristics.There can be differences in the length of signal path with these two antennas, butspecifications do not reveal these differences.
Two different models of RFID chips are used in the experiments. Both of thechip types are on UPM Dogbone paperface labels, so the tag antenna remains thesame. Part of the tags used in experiments have Impinj Monza 4 chips and rest haveNXP G2XL chips.
Impinj Revolution R420 has six different operating mode settings. Operatingmode is set of EPC Gen2 air interface protocol settings, which affect how the com-munications take place between a tag and a reader. Different operating modes havebeen optimized for different use cases by the reader manufacturer. In general oper-ating modes change the reader gradually from high-throughput operation to efficientoperation in a very noisy environment (Dense Reader Mode).
Four different operating modes are tested. These modes are listed in AppendixA. The fifth tested mode is so called auto mode which let’s the reader choose thebest operating mode for the environment.
Measured variables were:
• RSSI
• Phase angle rotation average
• Phase angle rotation variance
Based on these initial measurements the antenna, the tag and the RFID readeroperating mode were chosen for further experiments at the portal.
Picture of test setup used in initial testing is portrayed in Figure 27. The tag isattached on a pylon made of styrofoam. The antenna is attached to a loudspeakerstand. The height of the antenna is 1.5 meters. The tag is on the height. The readerutilizes four channels within ETSI regulated RFID bandwidth 865 – 868 MHz.

46
Figure 27: Test setup to measure phase angle rotation and RSSI over distance.
5.3.1 Measurement Process
Figure 28: Measurements related to experiments were performed online and dataanalysis offline.
The measurement process is shown in Figure 28. VilantEngine v0.9.35 softwarewas run on a laptop with linux operating system. VilantEngine software communi-cated with the RFID reader using LLRP protocol. Software wrote all read eventswith timestamps and other parameters on a file. The file was processed with a pieceof Python software which extracted the read events from the log file and appliedalgorithms presented in this thesis. The python software used for offline analysis

47
uses PyLab environment for numerical analysis and Matplotlib for plotting the data.
5.3.2 RSSI and Phase Angle Rotation over Distance
Preliminary experiments start by measuring how RSSI and phase angle rotationchanges over distance. Previous study shows that the relation between RSSI anddistance is complex outside anechoic chamber [13]. RSSI increases and decreaseswhile distance changes, but the overall trend is decreasing while distance increases.Phase angle rotation is expected to change in cycles of half of the wavelength used.
Figure 29: RSSI and phase angle rotation is measured from different distances be-tween antenna and RFID tag.
Phenomena is measured by changing distance between the antenna and the tagwhile transmit power is kept constant, like in Figure 29.
Table 6: Plan for measurements.Measured values RSSI: average
Phase angle rotation: average and varianceNumber of measurements 15 seconds of measurements at maximum rateRange 40-700 cmResolution 5 cm between 30-200 cm and 30 cm between 200-700 cm
Measurements are repeated with different power settings, different antennas,different tags and different operating modes for the reader. Plan for experiments ispresented in Table 6.

48
5.4 Experiments at RFID portal
Experiments at RFID portal are planned in such way that methods to solve thetwo use cases in the scope of this thesis are explored. Use cases were to identify layaround tags and stray reads from handling unit moving in front of the gate. Thirdcase which is about stray reads from neighboring gate (cross read) is not exploredby experimenting. It is studied in theory only.
Figure 30: Typical configuration for experiment at the portal.
The typical configuration for experiments at the portal can be seen in Figure 30.There is one handling unit on the fork lift. Test run path is marked to the floorusing black duct tape. Two lay around handling units are on the sides of the testrun path. The light roof portal assembly is configured in low footprint mode as theantennas are pointing to single interrogation zone.
Experiments at the RFID portal are done using item level tagging. Each pallethas approximately three hundred tags. Other pallets with three hundred tags presentlay around or stray read tags.
Applied experiments are done offline. This means that data which contains EPCcodes, timestamps, RSSI-, Doppler shift and phase angle rotation values is recordedwhile tests are done. This data is to be analyzed after the experiments. This kind ofarrangement allows more versatile data processing methods to be used, as the bestmethods to identify the stray tags is not known beforehand. Offline data analysisdoes not prevent implementing the found solutions for online data analysis later on,but this is not in the scope of this thesis.

49
Each experiment is repeated several times to get statistical reliability for themethods developed from the data.
The first series of experiments studies statistical properties of RFID events re-ceived from a RFID gate. Target for this study is to find the differences betweenevents of lay around tags and events of moving tags.
The second series of experiments studies methods to identify lay around tags.Methods are based on direction sensing and statistical analysis of the events.
The third series of experiments studies stray reads from pallet moving front ofthe gate. Direction sensing based methods are used to determine wether the palletis moving through the gate or not.
5.4.1 Statistical Measurements to understand Dynamics at a RFID Gate
Series of experiments are conducted to investigate how RSSI, phase angle rotationand Doppler shift values show up in time, RSSI, phase angle rotation and Dopplershift domains.
Phase angle rotation is dependent on signal path. Events received through dif-ferent antennas are not comparable with each other and they need to be handledseparately. To fully utilize possibilities of phase angle rotation, the system should becalibrated. During calibration process the cable length and other factors affectingon signal path length would be measured. On a calibrated system the phase angledistance measurements could be done when location of the antennas is known. Thisis out of the scope of this thesis.
Variables measured for each RFID read event are
• RSSI
• Doppler shift
• Phase angle rotation
• Receiving antenna
• Channel
Means and standard deviations are calculated during offline analysis. Data isanalyzed on run basis. This means that only one transaction which triggers a RFIDevent for each tag is expected happen during the run. Tag can pass the gate exactlyonce during the experiment run to keep the offline analysis sane.
Measurements follow the pattern: moving pallet, lay around pallet, moving tagand lay around tag. Data collected is analyzed in time, RSSI/Phase angle rotationand RSSI/Doppler shift domains.
5.4.2 Lay Around Tag Detection Analysis based on RSSI, Phase AngleRotation and Doppler Shift Statistics
Series of experiments are run to find out if there is a meaningful difference betweenthe RSSI, phase angle rotation and Doppler shift values between the lay-around

50
and the moving tags. Experiments are repeated with different operating mode andsession settings.
5.4.3 Identifying Lay Around Tags
Series of experiments will be conducted using an antenna layout typically used fordirection sensing applications. This type of antenna layout utilizes two separate orpartly overlapping interrogation zones. The interrogation zones are set up along thedirection of the movement. There are several different algorithms used to determinethe tag movement. Some of these algorithms can be used to identify lay aroundtags. In these cases tags which are seen, but of which movement direction cannotbe detected are identified as lay around tags.
Algorithms are used to detect lay around tags are
• Simple Direction Sensing algorithm (Listing B1)
• Doppler Shift algorithm (Listing B2)
• Lay Around Tag Detection Algorithm (Listing B4)
Table 7 tells which measurements are done for each experiment.
Table 7: Measurement definitionsMeasurement DefinitionRead Events (n) Total number of RFID read events per test run.Time (s) Time from the first read event to the last in the test run.Events per Second (n) Number of events divided by the time.Read Rate (%) Percentage of population tags which were seen. Popula-
tion is known.Lay Around Tags DetectionRate (%)
Percentage of lay around tags identified as lay aroundtags. Given for each algorithm used.
False Positive Rate (%) Percentage of tags on pallet which were identified as layaround tags. Given for each algorithm used.
5.4.4 Identifying Stray Reads
An experiment is conducted to find out if it is possible to detect stray reads frompallet moving in front of the gate but which does not go through the gate. TheDoppler shift algorithm and the simple direction sensing algorithm are used to detectthe stray reads.
The experiment is conducted by pulling a pallet sideways across interrogationzone in front of the gate.

51
6 Results
6.1 Preliminary Experiments
On the first test round the target was to find a configuration which could be used inapplied testing. The variables were tags, antennas and reader settings. At the sametime preliminary experiments gave information about how the measured variableschange over distance.
6.1.1 RSSI, Phase Angle Rotation and Doppler Shift Over Distance
In following results channel represent used frequencies as presented in Table 8
Table 8: RF channels used in experiments.Channel Frequency
1 865.7 MHz2 866.3 MHz3 866.9 MHz4 867.5 MHz
Figure 31: Return Signal Strength Indicator over distance.
Figure31 shows that measured RSSI values ranged from -36dBm to -65 dBmin the distances from 30 cm to 420 cm. Within the range of 30 cm to 100 cm,RSSI decreased almost linearly when distance increased. There is cyclic variationin RSSI starting at 100 cm. This is most probably caused by signal reflecting fromthe ground. This is also known as multipathing and it causes constructive- anddestructive interference on the signal. Measurement resolution changes at 200 cmand the cyclic component cannot be seen anymore. There is no noticeable differencein RSSI between different channels used.
How the phase angle rotation changes over distance can be seen at Figure 32. Theresults are projected to scale of π, because the quadrature detection of the readerwas not flawless causing sudden changes to opposite quadrature in the values. Theresolution of 30 cm was barely enough to show the pattern in phase angle rotation

52
Figure 32: Average phase angle rotation over distance.
change over distance. Figure 32 shows the small difference in phase angle rotationwhen using different channels.
Figure 33: Phase angle rotation variance over distance.
Phase angle rotation variance stays at low level up to distances of 2.5 metersas can be seen in Figure 33. There is no noticeable difference in variances betweenchannels.
6.1.2 Transmit Power Change
Experiments were repeated with different transmit power settings. Measurementswere done using distances from 200 cm to 500 cm as this is the most interestingrange for portal applications.
Figure 34 shows that transmit power increases read distance, but has only littleeffect to RSSI as expected. RFID is downlink limited. At 25dBm transmit powerthe tag stopped responding in greater distances than 420 cm. Increasing transmitpower to 30dBm provided read range of over 500 cm.
Phase angle rotation does not change when reader power is changed as can beseen in Figure 35. Phase angle rotation is dependent only from the length of thesignal path. As the distance between the antenna and the tag increases, reflectionscan cause large changes in the phase angle rotation over small distance change.

53
Figure 34: Return Signal Strength Indicator with different power settings.
Figure 35: Average phase angle rotation with different power settings.
Changing reader transmit power does not affect directly on the phase anglerotation variance as can be seen in Figure 36. Increasing power allows reading thetags further distances away. These read events show higher variance in phase angle.
Figure 36: Phase angle rotation variance with different power settings.

54
6.1.3 Antenna Change
Experiments were repeated with two different models of antennas to understand,how a different antenna affects the measurements.
Figure 37: Return Signal Strength Indicator with different antennas.
Antennas tested do not show differences in received RSSI. If the antennas hadremarkably different gain values, it would show up also in RSSI measurements.
Figure 38: Average phase angle rotation with different antennas.
Different antennas had different phase angles on the same distances as can be seenin Figure 38. This can be explained by measurement errors. Quarter of a wavelengtherror while adjusting the distance between the tag and the antenna causes 180 errorin measurement. This is because the signal travels twice the distance between thetag and the reader. It is also possible that the signal travels different distance withinthe antennas.
Measurements with different antennas would need a calibration to be performedbefore the measurements. This measurement was not that important for the thesisso this was not experimented any further.
There were differences on phase angle rotation variance on different antennasover same distances. This may have been caused by reader antenna compatibility.Some readers and antennas couple better than others. MTI antenna was found tobe better as it has less variance as shown in Figure 39.

55
Figure 39: Phase angle rotation variance with different antennas.
6.1.4 RFID Chip Change
Experiments were repeated with two different chip types on the same UPM DogboneRFID tag layout.
Figure 40: Return Signal Strength Indicator with different tags.
Figure 40 shows that NXP chip showed higher RSSI values over distance. Itindicates that the NXP chip is able to reflect more energy back to the reader. Itdoes not tell about maximum read distance or sensitivity as RFID is downlinklimited. Measurements suggests that the NXP chip can harvest less energy from thecarrier wave, which can lead to a shorter read distance. Maximum read distance onthe NXP chip was not measured as it is not in the scope of this thesis.
There was no noticeable difference in the phase angle rotation between the twochip types as shown in Figure 41. Differences at the points of measurement arewithin the tolerances of the test setup.
The chip had effect on the phase angle variance. The NXP chip showed veryconstant phase angle variance characteristics as can be seen in Figures 41 and 42.On Monza 4 phase angle variance increased over distance. This can be a desiredeffect as it can be used to determine the distance to the tag.

56
Figure 41: Average phase angle rotation with different tags.
Figure 42: Phase angle rotation variance with different tags.
6.1.5 Operating Mode Change
Experiments were repeated using different operating modes of the reader.
Figure 43: Return Signal Strength Indicator with different operating mode settings.
Different operating modes of the reader show no differences in RSSI measure-ments as can be seen in Figure 43.

57
Figure 44: Average phase angle rotation with different operating mode settings.
Figure 44 reveals that phase angle rotation is not affected by operating mode.There are some differences at 260 cm and 320 cm measurements.
Figure 45: Phase angle rotation variance with different operating mode settings.
Figure 45 shows that DRM operating modes 1 and 2 showed low phase anglevariance characteristics. High throughput mode 0 has high variance throughoutthe measurements. Most probably the auto setting 1000 has ended up using highthroughput mode as well as there were no other readers present in the same operatingenvironment. This is due to similar variance behavior.
All operating modes except operating mode 0 (High throughput, FM0) resultedto problems detect full 360 phase angle. On other operating modes the phaseangle made 180 hops in random pattern. This behavior varied over distance. Onoperating mode 0 the reader showed none of this activity. Unfortunately the varianceon operating mode 0 is the highest, which limits the usability.
6.1.6 Other Findings
One experiment was conducted placing five UPM Dogbone tags right next to eachother as portrayed in Figure 46. On very short distance all tags could be read, butif the distance from tag to a reader was more than one meter, some tags were notpossible to be read. This needs to be considered when building handling units for
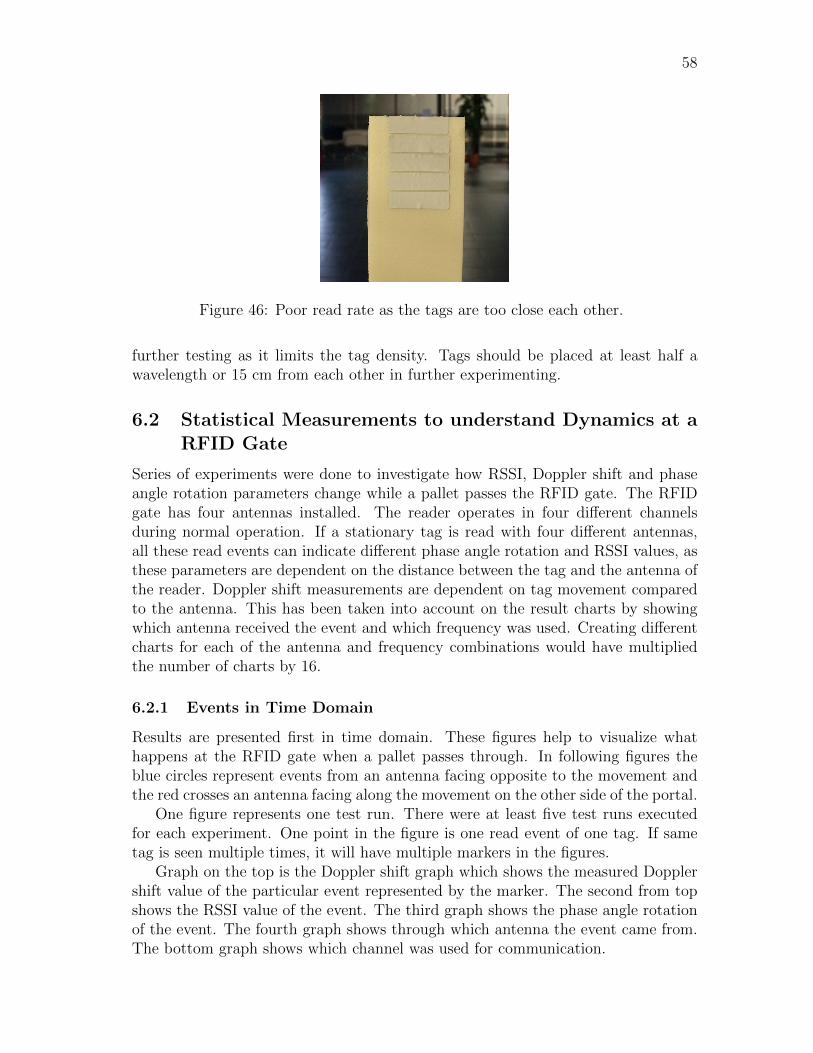
58
Figure 46: Poor read rate as the tags are too close each other.
further testing as it limits the tag density. Tags should be placed at least half awavelength or 15 cm from each other in further experimenting.
6.2 Statistical Measurements to understand Dynamics at aRFID Gate
Series of experiments were done to investigate how RSSI, Doppler shift and phaseangle rotation parameters change while a pallet passes the RFID gate. The RFIDgate has four antennas installed. The reader operates in four different channelsduring normal operation. If a stationary tag is read with four different antennas,all these read events can indicate different phase angle rotation and RSSI values, asthese parameters are dependent on the distance between the tag and the antenna ofthe reader. Doppler shift measurements are dependent on tag movement comparedto the antenna. This has been taken into account on the result charts by showingwhich antenna received the event and which frequency was used. Creating differentcharts for each of the antenna and frequency combinations would have multipliedthe number of charts by 16.
6.2.1 Events in Time Domain
Results are presented first in time domain. These figures help to visualize whathappens at the RFID gate when a pallet passes through. In following figures theblue circles represent events from an antenna facing opposite to the movement andthe red crosses an antenna facing along the movement on the other side of the portal.
One figure represents one test run. There were at least five test runs executedfor each experiment. One point in the figure is one read event of one tag. If sametag is seen multiple times, it will have multiple markers in the figures.
Graph on the top is the Doppler shift graph which shows the measured Dopplershift value of the particular event represented by the marker. The second from topshows the RSSI value of the event. The third graph shows the phase angle rotationof the event. The fourth graph shows through which antenna the event came from.The bottom graph shows which channel was used for communication.

59
High Throughput Configuration
Experiments were first done using session 2 and high throughput operating mode 0.Number of tags on the load was 300 and operating environment had 600 lay aroundtags. The pallet moved at walking speed which is about 1.2 m/s. Each experimentwas repeated for 10 times. The experiment parameters can be seen in Table 6.2.1.
Table 9: ParametersSetting ValueTX Power 30 dBmSession 2Operating Mode 0Number of tags on load 300Number of lay around tags 600Speed of Pallet 1,2 m/sRepeats 10
Figure 47: Pallet moving through portal. Session 2, Operating Mode 0.
Session 2 with dual target mode sets the reader to change antenna once in asecond as seen in Figure 47. This rate is a bit slow for portal with multiple in-terrogation zones. Reader utilizes channel for four seconds before moving to nextchannel. This does not have major implications on the results. Phase angle rotationchanges a bit when the frequency changes.

60
Figure 47 tells that Doppler measurements are useless with very fast data ratesof operating mode 0. RSSI values behave as expected. Tag sensitivity is around -70dBm. RSSI values spike at -40 dBm when the pallet is right in the middle of theport and after that decrease back to low levels.
Figure 48: Lay around pallet. Session 2, Operating Mode 0.
Similar results for lay around pallet are shown in Figure 48. The variation inRSSI values can be explained by antennas 1 and 4 being closer to the lay aroundpallets than antennas 2 and 3. Near 20 seconds tick there is temporary reduction innumber of events. This matches to Figure 47 showing a pallet passing the gate atthis moment.
The tag presented in Figure 49 got five read events while passing the gate.Surprisingly the Doppler shift variance is low, but as we noticed from the previousexperiments with lay around pallets, the Doppler shift measurement is not veryuseful while using operating mode 0. The antennas in this setup were set to singleinterrogation zone configuration. The inbound and outbound antennas were pointingto the same interrogation zone. This explains why the moving tag were first seen atthe inbound antennas then at the outbound antennas and then again at the inboundantennas.
The RSSI values follow the same pattern than in the moving pallet experimentreaching the maximum at 17 seconds. Phase angle rotation variance results cannotbe calculated as the tag got only two measurements from antenna 2 and 3 and oneat antenna 4.
Figure 50 shows a clear pattern which can be used to identify lay around tags.

61
Figure 49: Tag moving through portal. Session 2, Operating Mode 0.
Read events show up as pairs because Session 2 with Dual Target mode was usedand tags are first inventoried to A and then to B. Using operating mode 0 limits theusability of the Doppler measurements as shown in figure. Expected Doppler shiftfor stationary pallet would be 0 Hz, but values up to 240 Hz are measured. RSSIvalues are dependent on the antenna used. Frequency does not seem to affect muchthe phase angle rotation or RSSI measurements.
Dense Reader Environment Configuration
Experiments were repeated using session 1 and dense reader environment optimizedoperating mode 3, which has much lower data rate than operating mode 0. Especiallythe Doppler shift values should be more useful now.
Operating mode 3 increases accuracy of Doppler shift measurements as the datarate is slowed down. This can be seen clearly in Figure 51. The Doppler graphshows first positive values which change to negative at around 15 seconds. This isthe moment when the pallet passes the middle point of the RFID gate and starts tomove further from the antennas. Blue markers represent the inbound antennas andred markers outbound antennas. These antennas are located about one meter fromeach other. RSSI values spike -40 dBm at 15 seconds for inbound antennas and at17 seconds for outbound antennas. This is a clear sign of movement through thegate.
Phase angle rotation chart is missing any events near the 180 degree line. This

62
Figure 50: Lay around tag. Session 2, Operating Mode 0.
could be because circular polarized antennas were used. Belt tags are directionsensitive and it could be so that the tags are very difficult to read when the circularpolarized signal is in the minimum phase for reflected power.
Session 1 changes the reader’s antenna usage pattern. Now the reader is changingantennas at very fast pace. This is good for tracking moving pallets which stay onlyfor a short time within the interrogation zone of one antenna.
Lay around pallet presented in Figure 52, indicate much better Doppler valuesthan the previous measurement in Figure 50 thanks to lower data rate of operatingmode 3. The average Doppler shift is around 0 Hz, but there is some deviation evenon lay around tags. Lay around pallets are closer to the inbound antennas as theRSSI is higher on those.
The tag passing through the gate got only two measurements as can be seen inFigure 53.
In Figure 54 the lay around tag has very steady Doppler, RSSI and phase anglerotation values. The tag is seen only by the antenna 2.
6.2.2 Events in RSSI, Phase Angle Rotation and Doppler Domain
High Throughput Configuration
Experiments were conducted first using session 2 with operating mode 0, a typicalhigh throughput configuration. These figures show RSSI over Doppler and RSSIover phase angle rotation graphs for each of the four antennas. These graphs should

63
Figure 51: Pallet moving through portal.
show how the characteristics of a lay around tag differ from a moving tag.Figure 55 shows that the Doppler shift values depend on the signal strength.
Deviation of Doppler shift is smaller on read events where signal strength was high.Doppler shift deviation is on a very high level on a high throughput operating mode0 with a high data rate.
RSSI over phase angle rotation graphs are not very useful at pallet level as thenumber of data points is very high. These graphs should be useful for tag levelmeasurements and they are presented here as only reference.
Pallet moving through portal is shown in Figure 56. Antennas 1 and 4 read onlysome of the tags at quite low RSSI level. Deviation of Doppler shift is lower on themoving pallet. This may be caused by overall higher RSSI level of successful readevents. Share of very weak read events at -70 dBm is low compared to Figure 55.Lay around pallets were located under antennas 1 and 4 which has decreased theamount of read events of moving pallet through those antennas.
Figure 57 reveals that lay around tags will have low RSSI deviation. There isdeviation on phase angle rotation, which does not seem to be dependent on RSSI.Data points form short lines along phase angle rotation axis, which is explained byreader operating on different channels. Doppler shift deviation is much smaller onantennas 1 and 4 with the highest RSSI.
Again low number of read events from a tag going through RFID gate is shownin Figure 58. There are two events from antenna 3 and one event from antennas 2and 4, but no event from antenna 1.

64
Figure 52: Lay around pallet. Session 1, Operating Mode 3.
Dense Reader Environment Configuration
Operating mode provides better accuracy for Doppler shift as shown in Figure 59.Outbound antennas 1 and 3 show negative tendency for Doppler shift values asinbound antennas 2 and 4 show positive tendency. When RSSI is high, the Dopplershift values are low. This is expected. When the pallet is right under the antennas,the distance to the antennas is shortest so the RSSI is highest. At the same pointthe pallet stops approaching and starts departing the antennas.
Doppler shift for most read events at lay around pallet stay below 2 Hz as shownin Figure 60.
6.3 Lay Around Tag Detection Analysis based on RSSI,Phase Angle Rotation and Doppler Shift Statistics
Data from experiments conducted was analysed to determine if it is possible todiscriminate lay around tags from pallet tags based on mean and standard deviationof measured RSSI, phase angle rotation and Doppler shift values.
π was subtracted from phase angle rotation values over π, because the currentsoftware on the reader has problems recognizing the quadrature of the signal. Thisreduces deviation caused by sudden moves from quarter to another.
Means and standard deviations were calculated over all the events for one tagreceived through one antenna. Signal path varies on events received by different

65
Figure 53: Tag moving through portal. Session 1, Operating Mode 3.
antennas so the phase angle rotation and RSSI measurements are not comparable.Thus one tag can have as many data points on the graphs as there were antennasused.
Absolute Doppler shift values were used to calculate means. This is sufficientas the focus of the experiments conducted was not to sense the direction of themovement.
High Throughput Configuration
Session 2 with Operating Mode 1 gives a bit higher differences in standard deviationof phase angle rotation as seen in Figure 61.
Differences in standard deviations of RSSI and phase angle rotation values andalso in absolute Doppler shift mean can be seen between lay around and pallet tagsas can be seen in Figure 61. Lay around tags are marked with blue ’x’ and pallettags with red circle.
Pallet tags show higher standard deviation in phase angle rotation and RSSI.Absolute Doppler shift mean shows little difference between the lay around tagsand the moving tags. This is mostly because the low accuracy of the Doppler shiftmeasurement with high throughput operating mode. Unfortunately it is not possibleto set dividing limits on these measurements which could be used to discriminateall read events directly. The area of confusion is large. Some lay around tags gotrather high standard deviations of RSSI and phase angle rotation and some moving

66
Figure 54: Lay around tag. Session 1, Operating Mode 3.
tags got low standard deviations. Latter is more common, as the number of readevents of moving tags is generally low.
Tag / antenna combinations with just one event cause another problem. Stan-dard deviation for one measurement is always 0. This can be seen as many of datapoints having 0 standard deviation of phase angle rotation.
Minimum of two events for each tag antenna combination used for detection isneeded in these methods, but to improve data reliability more than 5 events shouldbe received.
Dense Reader Environment Configuration
Session 2 Operating Mode 3 is slower but provides better accuracy in Doppler shiftmeasurements. Figure 62 shows that there is a clear distinction between lay aroundtags and pallet tags in Absolute Doppler Shift Mean for those tag / antenna com-binations with more than one measurement.
6.4 Direction Sensing and Lay Around Tag Detection Test-ing
Experiments at the RFID gate were started using one pallet with 180 Dogbone labelswith NXP chips. Load of the pallet was done from two cardboard sheets put in Ashape. Cardboard sheets had 45 tags each side. Tags were placed 15 cm from each

67
Figure 55: Lay around pallet. Session 2, Operating Mode 0.
other. In the initial tests was found out that if the tags are too near each other, itis not possible to read all tags.
Direction sensing antenna setup on top of the track. Two antennas each sidepointing opposite directions.
Results of all experiments conducted are presented in Appendix C.
6.4.1 Read Rate Testing
The first test run was done without lay around tags. This was done to measureoverall read rate at the portal. Pallet was pulled through the portal at walkingspeed (1.2 m/s).
Results presented at Table C2 indicate that both methods are prone to falsepositive lay around tag identifications. This means that some of the tags on theload were identified as lay around tags. The simple method is a bit better. Ingeneral the number of false positives is low, and it should not cause problems atleast if pallets are processed at Virtual Handling Unit (VHU) level. Lay around tagdetection provided flawless results – no false positives detected.

68
Figure 56: Pallet moving through portal. Session 2, Operating Mode 0.
6.4.2 Lay Around Tag Identification Testing
Dense Reader Environment Configuration
Lay around tag identification testing started with ten lay around tags put to the sidesof the track in lay around tag detection testing. Results at Table C4 indicate thatboth used methods were able to identify all read lay around tags as lay around tags.False positive rates were similar than in run without lay around tags in Table C2.
Lay around tag detection algorithm provided good results without being depen-dent on direction sensing antenna setup. On average, it could detect 80% of the layaround tags as lay around tags. No pallet tags were detected as lay around.
The number of tags was increased to make the test setup more demanding forthe algorithms. Higher number of tags should reveal the differences between thealgorithms better.
First test case was done without moving pallet. Only the lay around tags wereat the interrogation zones. Doppler shift and simple methods provided good layaround detection rate as shown in the results Table C6. Lay around tag detectionalgorithm provided poor results due to the high number of tags and a relativelyshort run time. Most of the tags received only 1 or 2 read events overall, whichprevented the statistical analysis methods to function properly.
Next test run was done with one moving pallet with 300 tags. 600 lay aroundtags were put near the interrogation zones. Both direction sensing based methodsidentified lay around tags at good accuracy. False positive rate is remarkably high

69
Figure 57: Lay around tag. Session 2, Operating Mode 0.
with both algorithms as shown in Table C8. Over 50% of the pallet tags wereidentified as a lay around tag, which is too much for any application to tolerate.Lay around tag detection algorithm provided rather low lay around tag identificationrate, but none of the pallet tags were identified as a lay around tag.
Direction sensing based algorithms faced difficulties with high number of tags.High number of tags combined with relatively slow operating mode (3) leads tosituation, where tag has only been seen at one of the two interrogation zones and isidentified falsely as a lay around tag.
False detection rate could be lowered with following actions:
• Lower total number of tags
• Slower moving speed through the portal
• Faster operating mode of the reader (Less DRM)
• Session 2 with dual target mode could increase total number of reads too
The drawback of selecting a faster operating mode would is lower tolerance for AEN.The system becomes less robust if many readers operate in the same environment.
These results also indicate, that handling units tagged with item level should behandled as VHUs if total number of tags is very high.
Based on the experiments the optimum reader configuration for direction sensingbased lay around tag detection would be Session 2, dual target inventory search mode

70
Figure 58: Tag moving through portal. Session 2, Operating Mode 0.
and operating mode 3. Number of tags should be reduced as the read rate limitedthe accuracy of the system in the experiments.
Session 2 with dual target inventory search mode should provide the highestnumber of read events. Session 1 has persistence time of about 1 second whichlimits read rate for a single tag for 1 event per second. Session 2 has persistencetime of 5 to 15 seconds, but dual target inventory mode overcomes this limitationas the tags are first inventoried to state B and then immediately after back to A.
Operating mode 3 slows down the data rate between the tag and the readerwhich increases accuracy of Doppler shift measurements.
Further experiments were run with settings mentioned above. Results can beseen in Table C10. Lay around detection rate increases a bit, but unfortunatelythese settings have no effect on false positive rate which was considered as themajor drawback of identifying lay around tags based on direction sensing.
Lay around tag detection algorithm provided now good results. It could identifyover 87% of the lay around tags as lay around with no false positives. This indicatesthat the algorithm deserves to be studied further.
High Throughput Configuration
Limits of these methods were tested by increasing the data rate between the tag andreader by using operating mode 1, which is a high throughput mode optimized for avery high number of tags. Result of this experiment run can be seen in Table C12.

71
Figure 59: Pallet moving through portal. Session 1, Operating Mode 3.
Lay around tag identification rate of Doppler shift method dropped a little. Layaround tag detection algorithm provided mediocre results. The identification ratedropped from the tests conducted with operating mode 3. This is mostly becauseof increased deviation in Doppler shift measurements. Still no pallet tags wereidentified as lay around tags.
6.4.3 Stray Read Detection
Experiments were done to measure how well the methods detect stray reads fromtags which do not pass through the gate. Those tags of which status was unknownafter the test run were identified as stray reads.
Direction sensing based methods provided flawless results on identifying strayreads in these setups as shown in Table C14. This is mostly because the stray readsusually come from other side of the gate and are not seen in both of the interrogationzones within short time period, which is the basis of direction sensing.
Some of the lay around tags were so near both interrogation zones that theywere detected as tags moving through the gate.
6.5 Discussion
The results indicate that the methods described in this thesis can be used to identifystray reads and lay around tags if the tagging is done on item level and VHUs are

72
Figure 60: Lay around pallet at the portal. Session 1, Operating Mode 3.
used. Number of tags can be up to 1000. It can be assumed, that the methodswould provide a very good accuracy on low number of tags (up to 100) even withoutusing VHUs. The number of the read events per tag is increased as the total numberof tags goes down.
Study shows that throughput of a single reader and number of other readers inthe same operating environment depend on each other. If there is only one reader inoperating environment it can be used in high throughput operating mode. In densereader environment data rate of a reader needs to be reduced to decrease RF-noiselevels. On the other hand phase angle rotation and Doppler shift measurements workbetter in slow speed operating modes. To fully utilize the potential in statisticalanalysis of phase angle rotation and Doppler shift measurements the number ofevents need to be high, which courages to use high throughput operating mode.It becomes clear that the configuration of RFID system is always a compromisebetween throughput and capabilities to detect lay around tags and stray reads.
Experimenting was done with cardboard loads on the pallets. This type of loadis quite easy for a RFID system as it has very weak RF-absorbing properties. Alltags were visible for the reader from the both sides of the pallet. This is seldom truein real industrial applications. Further testing should be conducted to experimentthe proposed methods using more difficult loads.

73
Figure 61: Session 2, Operating Mode 1 statistics.
Figure 62: Session 2, Operating Mode 3 statistics.

74
7 Conclusions
Interrogation zone of a RFID system operating at UHF band is not sharp edged dueto constructive and destructive interferences. The interrogation zone can be adjusteddirectly by controlling the transmit power of the RFID reader and selecting antennasand tags carefully for the purpose. Quite often suboptimal placement of the RFIDtag and the properties tagged objects decrease the read rate at the RFID gate. Theread rate can be increased by using a higher transmit power on the reader, whichextends the interrogation zone over the desired and leads to stray reads.
The stray reads can be eliminated in the first place by designing the RFIDsystem layout in a way, that possibility for stray reads is minimized. Shielding is tobe considered where cross reading possibility exists. RFID parameters need to beadjusted so that the transmit power is the lowest needed to achieve the desired readrate. Also using a RSSI threshold for the RFID events can be used to discard theweak read events.
There are promising approaches to identifying stray reads based on Doppler shiftand phase angle rotation. The Doppler shift can be measured for a single RFID readevent. It carries information about the speed and direction of the movement. Withsmart positioning of antennas and use of specific algorithms, it is possible to detecthow the tag is moving related to the RFID gate. This information can be usedto identify stray reads and lay around tags. The weakness in Doppler shift basedmethods is that they are dependent on the movement. If a handling unit movesthrough the gate at very slow speed or even stops within the gate, the Doppler shiftbased methods may not work well.
Phase angle rotation data from RFID read event provides another approach toimplement algorithms for stray read and lay around tag identification. Standarddeviation of phase angle rotation on lay around tags was shown low, which can beused for identification purposes.
Based on the experiments conducted the most promising approach to identifylay-around tags seems to be using standard deviation of both phase angle rotationand RSSI and absolute mean of Doppler shift. These parameters were identified todiffer most between lay around tags and moving tags.
The use case with cross reading from adjacent gate is the most difficult of studiedcases to solve. The direction of the movement is through the gate which makes itdifficult to identify using Doppler shift based methods. The number of read eventsis usually low, which prevents using statistics based on phase angle rotation. Crossreading seems to be solved best on higher data processing level. When data receivedfrom different RFID gates is compared within specific time window and orientationof antennas is known, it is possible to determine through which gate the handlingunit went. It is also suggested that triggered reading reduces the amount of crossreads, but does not solve the issue, when docking is taking place on two adjacentRFID gates at the same time.
Further study on this field must be done to develop the methods found on suchlevel, that they can be implemented to production applications. One key questionwhich needs to be answered is how to turn these offline analysis to functioning online

75
algorithms.Development in antenna technology may bring new possibilities to identify lay
around tags. Small phased array antennas could provide tools to set up interro-gation zones more accurately. Beam shaping could help to locate RFID tags moreaccurately. If there is sufficient amount of events available and the RFID system hasbeen calibrated properly, phase angle rotation provides means to calculate distanceto the object. This would allow setting the limits of the interrogation zone withhigher precision.

76
References
[1] Finkenzeller, K. RFID Handbook, Second Edition. Wiley Publishing Inc. 427p., 2003, ISBN 978-0-470-84402-1
[2] Dobkin, D. M. The RF in RFID. Newnes is imprint of Elsevier. 493 p., 2007,ISBN 978-0-7506-8209-1
[3] Rao, K. V. S. An Overview of Backscattered Radio Frequency IdentificationSystem (RFID). IEEE, 1999, p. 746 – 749
[4] Want, R. An Introduction to RFID Technology. Pervasive Computing, January– March 2006, p. 25 – 33
[5] Zimmermann, H. OSI Reference Model – The ISO Model of Architecture forOpen Systems Interconnection. Communications, IEEE Transactions on, Vol-ume 28, April 1980, p. 425 – 432
[6] Thompson, L. et al. RFID Applied. Wiley Publishing Inc. 528 p., 2007, ISBN978-0-471-79365-6
[7] GS1 EPCglobal EPC Radio-Frequency Identity Protocols Class-1 Generation-2 UHF RFID Protocol for Communications at 860 MHz – 960 MHz, Version1.2.0, 108 p. 2008
[8] Auto-ID Savant Specification 1.0. Auto-ID Center, September 2003.
[9] EN 302 208-1 v1.4.1, ETSI, 58 p. 2011-11
[10] Regulatory status for using RFID in the UHF spectrum 25 November2011, URL: http://www.gs1.org/docs/epcglobal/UHF_Regulations.pdf,Referred: 30th January, 2012
[11] Electronic Product Code (EPC): An Overview, http://www.gs1.org/docs/
epcglobal/an_overview_of_EPC.pdf, referenced at 2011-11-19
[12] GS1 EPC Tag Data Standard 1.6. GS1, 218 p., 2011
[13] Nikitin, P. V., Martinez, R., Ramamurthy, S., Leland, H., Spiess, G., Rao, K.V. S. Phase Based Spatial Identification of UHF RFID Tags. IEEE RFID, 2010
[14] Povalac, A., Sebesta, J. Phase of Arrival Ranging Method for UHF RFID TagsUsing Instantaneous Frequency Measurement.
[15] Hekimian-Williams, C., Grant, B., Liu, X., Zhang, Z., Kumar, P. AccurateLocalization of RFID Tags Using Phase Difference. IEEE RFID, 2010
[16] Alippi, C. Cogliati, D., Vanini, G. A statistical approach to localize passiveRFIDs. ISCAS 2006, p. 843 – 846, IEEE, 2006
77
[17] Bouet, M., Santos, A., RFID Tags: Positioning Principles and LocalizationTechniques. IEEE, 2008
[18] Jiexiao, Y., Kai, H. L., Peng, L. A Mobile RFID Localization Algorithm Basedon Instantaneous Frequency Estimation. IEEE, 2011
[19] Pat. US 2009/0207024 A1. (2009). Utilization of Motion and Spatioal Identi-fication in Mobile RFID Interrogator. Intermec IP Corp., Everett, WA, US.Application filed: 13.2.2009, Published: 20.8.2009, 8 pages.
[20] Octane LLRP, Speedway Reader Application Series, Rev. 4.8.2, Impinj Inc.2011
[21] Pat. US 2010/0109903 A1. (2010). Methods and Apparatuses for RFID TagRange Determination. Thingmagic Inc., Cambridge, MA (US). Applicationfiled: Nov. 3, 2009, Published: May 6, 2010, 52 pages.
[22] Pat. DE 10 2009 057 349 A1. (2011). Verfahren und Vorrichtung zum Differen-zieren zwischen Nutzsignalen und Storsignalen bei RFID-Tags. noFilis AutoIDGmbH, 85737 Ismaning, DE. Application filed 7.12.2009, Published: 9.6.2011,13 pages.
[23] Pat. WO 2008/138024 A1. (2008). Method for reducing multiple detection. 7iDTechnologies GmbH, Graz, Austria. (Gangl, G.) Application filed: 15.5.2007,Published: 20.11.2008, 12 pages.
[24] Rao, K. V. S. Antenna Design for UHF RFID Tags: A Review and a PracticalApplication IEEE Transactions on Antennas and Propagation, VOL. 53. NO.12, December 2005, IEEE, 2005
[25] Sweeney, P. J. RFID for Dummies. Wiley Publishing Inc., 2005
[26] Low Level User Data Support, Speedway Revolution Reader Application Note,Revision 2.0, Impinj. Inc., 2011
[27] Choi, B-S., Lee, J-W., Lee, J-J., An Improved Localization System with RFIDTechnology for a Mobile Robot. IEEE, 2008
[28] Khan, M., Ojha, S., Virtual Route Tracking in ZigBee (IEEE 802.15.4) EnabledRFID Interrogator Mesh Network. IEEE, 2008
[29] Pat. WO 2008/030357 A2. (2008). Radio Frequency ID Doppler Motion Detec-tor. Sensormatic Electronics Corporation, 6600 Congress Avenue, Boca Raton,FL 33487 US. Application filed: 27.8.2007, Published: 13.3.2008, 22 pages.
[30] Gaile, G., Burt, J. Directional Statistics. 39p. 1980. ISBN 0 86094 032 2

78
A Impinj Speedway Revolution Specific Settings
Table A1: OctaneLLRP Operating ModesValue Description0 Max Throughput1 Hybrid Mode (High throughput (M=2))2 Dense Reader (M=4)3 Dense Reader (M=8)4 Max Miller (High throughput (M=4))5 Dense Reader (M=4) 2 Faster forward link than mode
2, available with regions; ETSI, China, India, Korea andSouth Africa.
1000 AutoSet1001 AutoSet Single Interrogator – This mode is now identical
to mode 1000
Table A2: OctaneLLRP Inventory Search ModesValue Description0 ‘Reader selected mode’ (default)1 ‘Single target inventory’ High tag count, high-
throughput applications where a reduction in repeatedtag observation is acceptable.
2 ‘Dual target inventory’ Low to medium tag count or low-throughput applications where repeated tag observationis desirable.
3 ‘Single target inventory’ (with suppressed duplicate ob-servations). Maximum tag count, high-throughput ap-plications where a single observation of each tag is ac-ceptable. This search mode suppresses repeated obser-vations for extended periods of time while tags are en-ergized. (Available only for use with Session 1.)
4-65535 Reserved for future use
A.1 ImpinjRFPhaseAngle Parameter
Report the RF phase angle of a singulated tag during normal inventory (EPCbackscatter) using this custom parameter. The PhaseAngle field is a scaled, 12-bit value, with 0 representing 0 (0 rad), and 4096 representing 360 (2π rad).
As an example, if the reported phase angle is 1985, the corresponding angle canbe calculated as:
1985 ×(
360
4096
)= 174.46 or 1985 ×
(2π rad
4096
)= 3.04 rad (A1)

79
A.2 ImpinjRFDopplerFrequency Parameter
Report the estimated RF carrier Doppler frequency shift using this custom param-eter. The estimate is made over the duration of each tag EPC and has units of Hz.This 16-bit parameter has twelve integer bits and four fractional bits. Accuracy andprecision depend on Reader mode and measurement length.
If report accumulation is enabled via the ROReportSpec for the currently execut-ing ROSpec, the RF Doppler frequency reported via this parameter is the Dopplerfrequency of the last tag singulation. No accumulation of Doppler frequency data isavailable.

80
B Listings
1 de f s impleAlgor ithm ( s e l f , events ) :cu r r en tS ide = ”unknown”
3 pendingSide = ”unknown”movements = [ ]
5 f o r event in events :i f pendingSide == ”unknown” :
7 i f event . ant in s e l f . s ideA :pendingSide = ”A”
9 e l i f event . ant in s e l f . s ideB :pendingSide = ”B”
11 e l i f pendingSide == ”A” :i f event . ant in s e l f . s ideB :
13 movement = Direct ionSens ingEvent ( event . epc , event . dateAndTime ,vent . msec , ”AtoB” )
movements . append (movement )15 cur r en tS ide = ”B”
e l i f pendingSide == ”B” :17 i f event . ant in s e l f . s ideA :
movement = Direct ionSens ingEvent ( event . epc , event . dateAndTime ,event . msec , ”BtoA” )
19 movements . append (movement )cur r en tS ide = ”A”
21 re turn currentS ide , movements
Listing B1: Simple Direction Sensing Algorithm
1 de f dopp le rSh i f tA lgor i thm ( s e l f , events , th r e sho ld ) :cu r r en tS ide = ”unknown”
3 movements = [ ]antASum = 0.0
5 antBSum = 0.0antAn = 0
7 antBn = 0f o r event in events :
9 i f event . ant in s e l f . s ideA :antASum += event . doppler
11 antAn += 1e l i f event . ant in s e l f . s ideB :
13 antBSum += event . dopplerantBn += 1
15 t ry :antAAverage = antASum / antAn
17 except ZeroDiv i s i onError :antAAverage = 0 .0
19 t ry :antBAverage = antBSum / antBn
21 except ZeroDiv i s i onError :antBAverage = 0 .0
23 i f antAAverage == 0.0 or antBAverage == 0 . 0 :r e turn currentS ide , movements
25 i f ( antAAverage − th r e sho ld ) > antBAverage :

81
movement = Direct ionSens ingEvent ( events [ −1 ] . epc , events [ −1 ] .dateAndTime , events [ −1 ] .msec , ”AtoB” )
27 cur r en tS ide = ”B”movements . append (movement )
29 e l i f ( antBAverage − th r e sho ld ) > antAAverage :movement = Direct ionSens ingEvent ( events [ −1 ] . epc , events [ −1 ] .
dateAndTime , events [ −1 ] .msec , ”BtoA” )31 cur r en tS ide = ”A”
movements . append (movement )33 re turn currentS ide , movements
Listing B2: Doppler Shift Based Direction Sensing Algorithm
1 de f c i r c s t d ( s e l f , samples , high=2∗pi , low=0) :ang = ( samples − low ) ∗2∗ pi / ( high−low )
3 r e s = mean( exp (1 j ∗ang ) , ax i s=0)V = sq r t (−2∗ l og ( abs ( r e s ) ) )
5 re turn ( ( high−low ) /2 .0/ p i ) ∗ V
Listing B3: Circular Standard Deviation Function
1 de f updateLayAroundStatus ( s e l f ) :i f s e l f . layAroundRef > 3 :
3 s e l f . layAround = Truee l s e :
5 s e l f . layAround = False
7 de f updateLayAroundRef ( s e l f ) :r e s = 0
9 f o r ant , datum in s e l f . phaseDev . i t e r i t em s ( ) :i f s e l f . dopplerMean [ ant ] < 1 . 5 :
11 r e s += 1i f s e l f . phaseDev [ ant ] < 0 . 4 :
13 r e s += 1i f s e l f . RSSIDev [ ant ] < 1 :
15 r e s += 1i f s e l f . antCount [ ant ] > 10 :
17 r e s += 1i f s e l f . antCount [ ant ] in range (1 , 3 ) :
19 r e s −= 1s e l f . layAroundRef = r e s
Listing B4: Lay Around Tag Detection Algorithm

82
C Results of the Experiments
Table C1: ParametersSetting ValueTX Power 30 dBmSession 1Operating Mode 3Number of tags on load 180Number of lay around tags 0Speed of the pallet 1.2 m/sRepeats 10
Table C2: Resultsµ Min Max σ
Read Events (n) 992.50 872 1212 98.66Time (s) 15.93 12.46 22.37 3.67Events per Second (n) 64.19 46.27 74.44 8.86Read Rate (%) 99.06 97.22 100.00 1.12Simple Method False Posi-tive Rate (%)
3.80 0 10.23 3.66
Doppler Shift Method FalsePositive Rate (%)
6.22 1.11 14.77 4.86
Lay Around Tag Detec-tion Algorithm False Posi-tive Rate (%)
0.00 0.00 0.00 0.00
Table C3: ParametersSetting ValueTX Power 30 dBmSession 1Operating Mode 3Number of tags on load 180Number of lay around tags 10Speed of the pallet 1.2 m/sRepeats 5

83
Table C4: Resultsµ Min Max σ
Read Events (n) 1062.80 937 1123 65.87Time (s) 46.23 42.71 47.93 1.86Events per Second (n) 23.05 19.89 26.29 2.03Read Rate (%) 98.67 96.11 100.00 1.67Simple MethodLay Around Tag Identifica-tion Rate (%)
100.00 100.00 100.00 0
False Positive Rate (%) 4.16 0.56 9.66 4.19Doppler Shift MethodLay Around Tag Identifica-tion Rate (%)
100.00 100.00 100.00 0
False Positive Rate (%) 6.63 3.33 11.36 3.77Lay Around Tag DetectionAlgorithmLay Around Tag Identifica-tion Rate (%)
80.00 71.43 85.71 7.00
False Positive Rate (%) 0.00 0.00 0.00 0.00
Table C5: ParametersSetting ValueTX Power 30 dBmSession 1Operating Mode 3Number of tags on load 0Number of lay around tags 900Speed of the pallet 1.2 m/sRepeats 5

84
Table C6: No movementµ Min Max σ
Read Events (n) 1647 1630 1695 24.24Time (s) 14.42 14.10 14.57 0.16Events per Second (n) 114.25 112.49 116.33 1.40Read Rate (%) N/A N/A N/A N/ASimple MethodLay Around Tag Identifica-tion Rate (%)
99.13 98.30 99.72 0.51
False Positive Rate (%) N/A N/A N/A N/ADoppler Shift MethodLay Around Tag Identifica-tion Rate (%)
98.84 98.01 99.72 0.51
False Positive Rate (%) N/A N/A N/A N/ALay Around Tag DetectionAlgorithmLay Around Tag Identifica-tion Rate (%)
2.71 2.54 2.88 0.13
False Positive Rate (%) 0.00 0.00 0.00 0.00
Table C7: ParametersSetting ValueTX Power 30 dBmSession 1Operating Mode 3Number of tags on load 300Number of lay around tags 600Speed of the pallet 1.2 m/sRepeats 10

85
Table C8: Pallet moves, lay around tagsµ Min Max σ
Read Events (n) 4108.60 3699 4772 340.34Time (s) 37.06 33.27 43.16 3.12Events per Second (n) 110.86 110.35 111.51 0.39Read Rate (%) 84.92 81.27 88.29 2.02Simple MethodLay Around Tag Identifica-tion Rate (%)
93.10 91.51 94.51 0.73
False Positive Rate (%) 64.99 58.82 71.04 3.77Doppler Shift MethodLay Around Tag Identifica-tion Rate (%)
96.50 95.65 98.11 0.72
False Positive Rate (%) 68.83 64.31 75.59 3.38Lay Around Tag DetectionAlgorithmLay Around Tag Identifica-tion Rate (%)
32.48 25.79 41.21 4.44
False Positive Rate (%) 0.00 0.00 0.00 0.00
Table C9: ParametersSetting ValueTX Power 30 dBmSession 2Inventory Search Mode 2 (Dual Target)Operating Mode 3Number of tags on load 300Number of lay around tags 300Repeats 10

86
Table C10: Pallet moves, lay around tagsµ Min Max σ
Read Events (n) 5588.1 4921 6141 381.82Time (s) 42.83 37.87 47.05 2.59Events per Second (n) 130.44 121.27 133.09 3.32Read Rate (%) 59.80 34.00 77.33 12.83Simple MethodLay Around Tag Identifica-tion Rate (%)
99.37 98.60 99.65 0.31
False Positive Rate (%) 80.27 67.24 89.36 6.23Doppler Shift MethodLay Around Tag Identifica-tion Rate (%)
99.68 98.95 100.00 0.37
False Positive Rate (%) 82.33 68.53 90.43 5.98Lay Around Tag DetectionAlgorithmLay Around Tag Identifica-tion Rate (%)
87.41 79.65 92.25 3.29
False Positive Rate (%) 0.00 0.00 0.00 0.00
Table C11: ParametersSetting ValueTX Power 30 dBmSession 2Operating Mode 1Number of tags on load 300Number of lay around tags 600Repeats 5

87
Table C12: Pallet moves, lay around tagsµ Min Max σ
Read Events (n) 13150.80 11133 14679 1333.86Time (s) 38.56 37.10 40.98 1.44Events per Second (n) 340.91 300.08 393.12 31.29Read Rate (%) 80.07 68.33 93.00 8.23Simple MethodLay Around Tag Identifica-tion Rate (%)
97.50 97.05 97.89 0.32
False Positive Rate (%) 52.81 27.24 73.66 15.90Doppler Shift MethodLay Around Tag Identifica-tion Rate (%)
97.72 97.05 98.18 0.45
False Positive Rate (%) 55.84 30.47 76.10 15.93Lay Around Tag DetectionAlgorithmLay Around Tag Identifica-tion Rate (%)
47.62 44.44 49.58 1.73
False Positive Rate (%) 0.00 0.00 0.00 0.00
Table C13: ParametersSetting ValueTX Power 30 dBmSession 1Population size 1024Operating Mode 1Inventory Search Mode 1 (Single Target)Number of tags on load 300Number of lay around tags 600Repeats 5

88
Table C14: Pallet moves but not through, lay around tagsµ Min Max σ
Read Events (n) 3597.80 3233 4179 355.87Time (s) 28.24 25.19 32.73 2.82Events per Second (n) 127.42 126.47 128.34 0.66Read Rate (%) 36.60 30.33 38.67 3.17Simple MethodLay Around Tag Identifica-tion Rate (%)
93.50 92.91 94.20 0.46
Stray Read IdentificationRate (%)
100.00 100.00 100.00 0.00
Doppler Shift MethodLay Around Tag Identifica-tion Rate (%)
95.92 95.20 96.34 0.42
Stray Read IdentificationRate (%)
100.00 100.00 100.00 0.00