anxious moods as a risk factor for depressed moods: …
TRANSCRIPT
The Pennsylvania State University
The Graduate School
Department of Psychology
ANXIOUS MOODS AS A RISK FACTOR FOR DEPRESSED MOODS: AN
ECOLOGICAL MOMENTARY ASSESSMENT OF THOSE WITH CLINICAL
ANXIETY AND DEPRESSION
A Thesis in
Psychology
by
Nicholas C. Jacobson
2015 Nicholas C. Jacobson
Submitted in Partial Fulfillment
of the Requirements
for the Degree of
Master of Science
August 2015

The thesis of Nicholas C. Jacobson was reviewed and approved* by the following:
Michelle G. Newman
Professor of Psychology
Thesis Advisor
Louis C. Castonguay
Professor of Psychology
Karen Gasper
Professor of Psychology
Peter Molenaar
Professor of Human Development and Family Studies
Sy-Miin Chow
Associate Professor of Human Development and Family Studies
Melvin M. Mark
Professor of Psychology
Head of the Department of Department or Graduate Program
*Signatures are on file in the Graduate School
iii
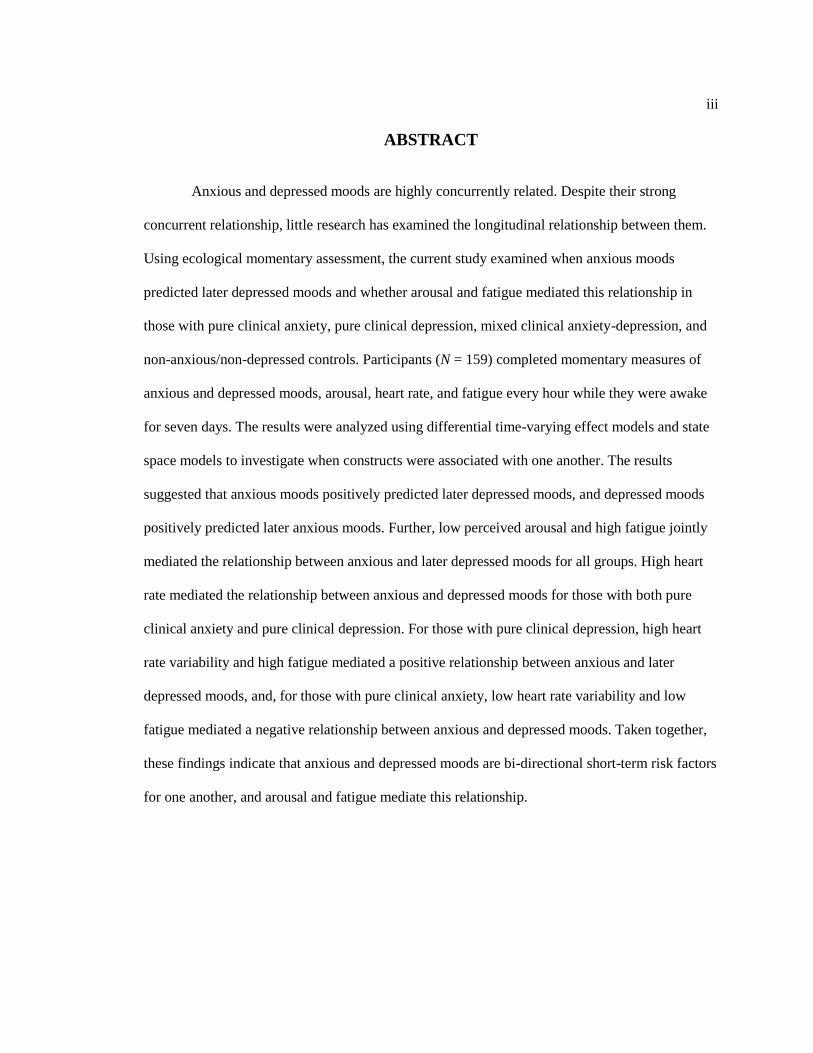
ABSTRACT
Anxious and depressed moods are highly concurrently related. Despite their strong
concurrent relationship, little research has examined the longitudinal relationship between them.
Using ecological momentary assessment, the current study examined when anxious moods
predicted later depressed moods and whether arousal and fatigue mediated this relationship in
those with pure clinical anxiety, pure clinical depression, mixed clinical anxiety-depression, and
non-anxious/non-depressed controls. Participants (N = 159) completed momentary measures of
anxious and depressed moods, arousal, heart rate, and fatigue every hour while they were awake
for seven days. The results were analyzed using differential time-varying effect models and state
space models to investigate when constructs were associated with one another. The results
suggested that anxious moods positively predicted later depressed moods, and depressed moods
positively predicted later anxious moods. Further, low perceived arousal and high fatigue jointly
mediated the relationship between anxious and later depressed moods for all groups. High heart
rate mediated the relationship between anxious and depressed moods for those with both pure
clinical anxiety and pure clinical depression. For those with pure clinical depression, high heart
rate variability and high fatigue mediated a positive relationship between anxious and later
depressed moods, and, for those with pure clinical anxiety, low heart rate variability and low
fatigue mediated a negative relationship between anxious and depressed moods. Taken together,
these findings indicate that anxious and depressed moods are bi-directional short-term risk factors
for one another, and arousal and fatigue mediate this relationship.
iv
TABLE OF CONTENTS
List of Figures .......................................................................................................................... vi
List of Tables ........................................................................................................................... vii
Acknowledgements .................................................................................................................. viii
Chapter 1 Introduction ............................................................................................................. 1
The Current Study ............................................................................................................ 7 Hypotheses ....................................................................................................................... 7
Chapter 2 Method .................................................................................................................... 9
Trait Measures of Anxiety and Depression ...................................................................... 9 Depression Anxiety and Stress Scale (DASS) Depression Scale. ............................ 9 Generalized Anxiety Disorder Questionnaire - IV (GAD-Q-IV). ............................ 10 Social Phobia Diagnostic Questionnaire (SPDQ). ................................................... 10
Trait Measures of Anxiety and Depression ...................................................................... 11 Profile of Mood States – Brief (POMS-B) Anxiety and Depression Scales ............ 11 POMS-B Fatigue Scale ............................................................................................ 12 Arousal ..................................................................................................................... 12 Heart rate and heart rate variability .......................................................................... 13
Phone apparatus ............................................................................................................... 13 Participants ....................................................................................................................... 14 Procedure ......................................................................................................................... 14 Planned Analyses ............................................................................................................. 15
Compliance Rates. .................................................................................................... 15 Concurrent Between and Within-Person Associations. ........................................... 16 Differential Time-Varying Effect Model (DTVEM). .............................................. 16
Chapter 3 Results ..................................................................................................................... 20
Compliance ...................................................................................................................... 20 Cross-Sectional and Within-Person Concurrent Associations ......................................... 20 Hypothesis 1: Anxious Moods Predicting Depressed Moods .......................................... 24 Hypothesis 2: Self-Reported Arousal, Heart Rate, Heart Rate Variability and Fatigue
will Mediate the Relationship between Anxious and Depressed Moods ................. 30 Pure clinical anxiety group. ...................................................................................... 30 Pure clinical depression group ................................................................................. 33 Mixed clinical anxiety-depression group. ................................................................ 36 Non-anxious/non-depressed control group .............................................................. 39
Hypothesis 3: Group Differences with respect to Mediational Pathways ........................ 41
Chapter 4 Discussion ............................................................................................................... 46

v
Appendix A DASS .......................................................................................................... 66 Appendix B GAD-Q-IV .................................................................................................. 68 Appendix C SPDQ .......................................................................................................... 70 Appendix D Anxious and Depressed Mood Questions ................................................... 72 Appendix E Arousal and Fatigue .................................................................................... 73
vi
LIST OF FIGURES
Figure 3-1. Anxious moods predicting depressed moods for the pure clinical anxiety
group. ............................................................................................................................... 25
Figure 3-2. Anxious moods predicting depressed moods for the pure clinical depression
group. ............................................................................................................................... 26
Figure 3-3. Anxious moods predicting depressed moods for the mixed clinical anxiety-
depression group. ............................................................................................................. 27
Figure 3-4. Anxious moods predicting depressed moods for the non-anxious/non-
depressed control group. .................................................................................................. 28
Figure 3-5. Anxious moods, arousal, heart rate, and heart rate variability on depressed
moods for the pure clinical anxiety group. ....................................................................... 32
Figure 3-6. Anxious moods, arousal, heart rate, heart rate variability, and fatigue on
depressed moods for the pure clinical anxiety group. ...................................................... 33
Figure 3-7. Anxious moods, arousal, heart rate, and heart rate variability on depressed
moods for the pure clinical depression group. ................................................................. 35
Figure 3-8. Anxious moods, arousal, heart rate, heart rate variability, and fatigue on
depressed moods for the pure clinical depression group. ................................................. 36
Figure 3-9. Anxious moods, arousal, heart rate, and heart rate variability on depressed
moods for the mixed clinical anxiety-depression group. ................................................. 38
Figure 3-10. Anxious moods, arousal, heart rate, heart rate variability, and fatigue on
depressed moods for the mixed clinical anxiety-depression group. ................................. 39
Figure 3-11. Anxious moods, arousal, heart rate, and heart rate variability on depressed
moods for the non-anxious/non-depressed control group. ............................................... 40
Figure 3-12. Anxious moods, arousal, heart rate, heart rate variability, and fatigue on
depressed moods for the non-anxious/non-depressed control group. .............................. 41

vii
LIST OF TABLES
Table 3-1. Cross-Sectional Between-Person Correlations Associations between Measures ... 21
Table 3-2. Cross-Sectional Between-Person Correlations Associations between Measures ... 23
viii
ACKNOWLEDGEMENTS
I would like to express my gratitude for the guidance from my committee members, and
the support of my family and my wife.
I would like to thank Drs. Michelle Newman, Louis Castonguay, Karen Gasper, Peter
Molenaar, and Sy-Miin Chow for their advice and counsel. This research required expertise in a
large number of domains including psychopathology, psychophysiology, and longitudinal data
analysis. Without the guidance, support, and expertise of my committee, I would not have been
able to carry out this project. My committee members provided essential feedback in the design,
analysis, and interpretation of this project. In particular, I would like to thank my adviser,
Michelle Newman, for her guidance from the inception to the completion of this project. Your
input was invaluable in enhancing this project and helping my ideas come to fruition.
I would next like to thank my parents for their support. You have worked very hard to
give me the best education possible, and I appreciate your reassurance and advice.
Finally, I would like to thank my wife, Amanda. Your patience, support, encouragement,
and love have made everything that I have accomplished possible. For the past decade, you have
been by my side encouraging me to peruse my passions and supporting me every step of the way.
1
Chapter 1
Introduction
Anxiety and depressive disorders are regularly comorbid with each other with lifetime
prevalence estimates of 16-50% (Angold, Costello, & Erkanli, 1999; Seligman & Ollendick,
1998). Whereas a principal diagnosis of major depression is associated with a lifetime diagnosis
of any anxiety disorder in 73% of individuals, a principal diagnosis of any anxiety disorder is
associated with a lifetime diagnosis of depression in 27-77% of people (Brown, Campbell,
Lehman, Grisham, & Mancill, 2001). In addition, when compared to those with pure diagnoses,
individuals with comorbid anxiety and depressive disorders suffer from greater chronicity and
severity of each diagnosis; poorer work and psychosocial functioning; lower perceived quality of
life; and a heightened risk of suicide (Brown, Schulberg, Madonia, Shear, & Houck, 1996;
Kessler et al., 1998; Olfson et al., 1997; Pfeiffer, Ganoczy, Ilgen, Zivin, & Valenstein, 2009;
Sherbourne, Wells, Meredith, Jackson, & Camp, 1996). Thus, a greater understanding of risk and
maintaining factors for anxiety and depression comorbidity is important.
To explain the origin of this striking comorbidity, anxiety has been offered as a greater
risk factor for later depression than is depression for later anxiety. However, to evaluate this
putative risk factor, the following would need to be established: (1) anxiety covaries with
concurrent depression, (2) anxiety is distinct from depression along some important dimensions;
(3) anxiety at time 1 predicts depression at a later time point; (4) depression is a weaker predictor
of later anxiety than is anxiety of later depression; and (5) other risk factors do not better explain
the relationship between anxiety and depression (Kazdin, Kraemer, Kessler, Kupfer, & Offord,
1997).
2
In fact, there is some evidence to support the above criteria. For example, when measured
concurrently, trait anxiety has been found to covary with depression with correlations ranging
from .45 to .73 (Bjelland, Dahl, Haug, & Neckelmann, 2002; Cannon & Weems, 2006; Morgan,
Wiederman, & Magnus, 1998; Norton, Cosco, Doyle, Done, & Sacker, 2013; Watson et al.,
1995). In addition, anxiety has been distinguished from concurrent depression along a number of
dimensions. For example, arousal and fear are more consistent with anxiety than depression, and
anhedonia (lack of positive affect) is consistent with depression but not anxiety (Barlow,
Chorpita, & Turovsky, 1996; Bjelland et al., 2002; Brown et al., 2001; Cannon & Weems, 2006;
Chorpita, Albano, & Barlow, 1998; Clark & Watson, 1991; Morgan et al., 1998; Tellegen, 1985;
Watson et al., 1995). Anxiety and depression can also be distinguished in their etiologies as they
are associated with distinct environmental factors (Eley & Stevenson, 1999; Eley, 1997; Kendler,
Heath, G., & J., 1987; Kendler, Neale, Kessler, Heath, & Eaves, 1992; Thapar & McGuffin,
1997). Loss, school stress, family relationship problems, and friendships are uniquely related to
the onset of depression, whereas anxiety is uniquely related to threats of future danger (e.g.
anxiety induced from a father’s recent diagnosis of cancer and the concern that he may die in the
near future) (Eley & Stevenson, 2000; Finlay-Jones & Brown, 1981; Goodyer & Altham, 1991).
Taken together, these studies provide some support for the first and second criteria for
establishing a risk factor (Kazdin et al., 1997). Likewise, trait anxiety tends to predict heightened
trait depression over prospective time periods with estimates ranging from .16 to .45, but trait
depression does not significantly predict later heightened trait anxiety. Similarly, the hazards ratio
of persons with an anxiety disorder developing a later depressive disorder ranged from 1.49 to
7.1, and the relationship was not significant in depressive disorders predicting the later onset of
an anxiety disorder (Gallerani, Garber, & Martin, 2010; Goodwin & Surgeons, 2002; see
Jacobson & Newman, 2012 for a meta-analysis; Viana & Rabian, 2009). These findings satisfy
the third and fourth criteria for establishing a risk factor.
3
The above data provide support for trait anxiety as a prospective risk factor for trait
depression, but may ignore important fluctuations between anxiety and depression that occur less
than one month apart. Both anxiety and depression are conceptualized as mood states (varying
based on an individual’s environment) and traits (stable across different environments) (Krohne,
Spaderna, Spielberger, & Schmukle, 2002; Spielberger, Gorsuch, Lushene, Vagg, & Jacobs,
1983). Nonetheless, there is very little data on the impact of fluctuating mood states of anxiety
and depression on anxious and depressive traits. Given that the trait-based scales often summarize
the past weeks, months, or years, fluctuations in the mood state relationship between anxiety and
depression may explain the trait-based co-occurrence findings (as the co-occurrence rates could
be overemphasized because the time trajectory of individual symptoms are not taken into
account).
In addition to focusing on traits as opposed to mood states, research on the prospective
relationship between anxiety and depression has relied mostly on self-reported recall of symptom
chronicity (Adams & Boscarino, 2011; Aderka, Weisman, Shahar, & Gilboa-Schechtman, 2004;
Alipour, Lamyian, & Hajizadeh, 2012; Alpert et al., 1999; Alpert, Maddocks, Rosenbaum, &
Fava, 1994; Andrade, Eaton, & Chilcoat, 1996; Aronson & Logue, 1987; Austin, Tully, & Parker,
2007; Van Ameringen, Mancini, Styan, & Donison, 1991). For example, these studies often ask
persons to recall their symptoms from the past few months to years (Adams & Boscarino, 2011;
Alpert et al., 1999; Alpert et al., 1994; Andrade et al., 1996; Aronson & Logue, 1987; Van
Ameringen et al., 1991), weeks (Aderka et al., 2004; Austin et al., 2007), or “in general” (i.e., no
specified time period) (Aderka et al., 2004; Alipour et al., 2012; Austin et al., 2007). Thus, the
methodology of these studies may be flawed due to substantial recall biases (Shiffman et al.,
1997; Solhan, Trull, Jahng, & Wood, 2009; Stone, Broderick, Shiffman, & Schwartz, 2004; van
den Brink, Bandell-Hoekstra, & Abu-Saad, 2001). The study of mood state processes rectifies
recall biases through the collection of real-time assessments or the use of small reflection periods.
4
Momentary assessments have additional advantages. Such advantages include targeting
intensive repeated measures and leading to the collection of a substantial sampling of everyday
life (Bolger & Laurenceau, 2013). In addition, this methodology is implemented outside of the
laboratory and in participants’ natural settings. As mood state processes occupy much of each
person’s time, memory, and attention (Wheeler & Reis, 1991), this research is capable of
addressing much of “life as it is lived” (Allport, 1942). It is therefore more ecologically valid than
reliance on recall across time.
In implementing these novel methodologies to assess the relationship between anxious
and depressed moods, only one study has examined individual differences in concurrent
covariation using intensive repeated measures. This study of inter-individual variability, using
mood questionnaires completed once per day, showed that in persons whose mood was accounted
for by valence or pleasantness of an affective experience, concurrent anxious and depressed
moods covaried highly (r = .90; mean r = .68). However, this relationship was weaker in those
whose mood was focused mostly on arousal (r = .16) (Feldman, 1995). Thus, there may be
individual differences in the degree to which anxious and depressed moods covary when
measured concurrently.
In addition to the little research on concurrent covariation between measured anxious and
depressed moods, only a few studies have examined the temporal relationship between these
mood states using intensive repeated measures, and hence tested the third and fourth criteria for a
risk factor (Starr & Davila, 2011; Swendsen, 1998, 1997). Using ecological momentary
assessments with paper and pencil measures, Swendsen (1997) and Swendsen (1998) measured
anxious and depressed moods at random interval prompts (in separate three hour blocks) five
times per day for seven days in non-clinical undergraduate samples. Analyzing only the data
collected one day after each participant’s most stressful event of the week (averaging the data
from the entire day following the stressful event), Swendsen (1997) found that baseline anxious
5
moods predicted depressed moods one day after the occurrence of a stressful event, and baseline
depressed moods did not predict anxious moods. Similarly, in the hours following each
participant’s most stressful event, Swendsen (1998) found that anxious moods predicted later
depressed moods sometime between one to nine hours later (Swendsen reported that more
analyses were conducted but did not specify which time periods were used), and not vice versa.
Starr and Davila (2011) employed an end of the day diary assessment for 21 days among those
with generalized anxiety disorder who had a history of depressive symptoms. These authors
found that anxious moods significantly predicted later depressed moods, and not vice versa (when
controlling for concurrent depressed moods). Starr and Davila also found that the strongest lagged
predictor within the 21-day period was a two-day period. Thus across three studies, anxious
moods significantly predicted depressed moods across hours and days, whereas depressed moods
did not predict later anxious moods.
Although these studies were among the first to examine the longitudinal relationship
between anxious and depressed moods, each of them has notable limitations, which should be
addressed. For example, despite having data to assess the temporal relationship between anxious
and depressed moods at other time points, Swendsen (1997) and Swendsen (1998) only examined
times following the most stressful event. Swendsen (1998) also did not control for prior auto-
correlations of anxious and depressed moods. Thus, the author’s findings could be due to a high
stable concurrent correlation between anxious and depressed moods, rather than being due to their
temporal relationship. Moreover, the generalizability of Starr and Davila’s (2011) findings may
be limited as generalized anxiety disorder was participants’ primary diagnosis. Hence participants
may have considered anxious thoughts to be more concerning than depressive ones in the moment
and may have pushed aside depressive thoughts until they were no longer in an anxious mood.
Most importantly, each of these studies only chose to examine lagged time points that were
convenient and ignored more than 80% of their available data regarding the time relationship
6
between anxious and depressed moods. Thus, more research is needed to address the
generalizability of these findings and to assess this relationship across additional time periods.
Moreover, Swendsen (1997; 1998) and Starr and Davila (2011) did not examine
mediators between anxious and depressed moods, which might contribute to a greater
understanding of why and how anxious moods predict depressed moods. If there is variation in
the relationship between anxious and depressed moods across shorter time periods, then such
variability can only be explained by a mechanism that also fluctuates.
Proposing a mechanism that may fluctuate across short-time periods, Akiskal (1985)
hypothesized that anxious moods produce depressed moods through hyperarousal and fatigue.
Based on this theory, anxious moods create excessive hyperarousal, and the heightened degree of
energy expended during anxious moods produces fatigue over time. This fatigue is theorized to
lead to depression based on an inability to function at a normal capacity (e.g. low energy, reduced
activity levels). Thus, Akiskal theorized the existence of two mediators of anxious and depressed
moods: hyperarousal and fatigue.
There is some support for Akiskal’s theory in studies focused on trait anxiety and
depression. For example, trait anxiety predicts later fatigue, (Fleer, Sleijfer, Hoekstra, Tuinman,
& Hoekstra-Weebers, 2005), and fatigue predicts later trait depression (Corwin, Brownstead,
Barton, Heckard, & Morin, 2005). However, no studies have examined hyperarousal and fatigue
as mediators of anxious and depressed moods. Both perceived arousal and physiological
assessments may be means to test this theory. Hyperarousal is evidenced by high heart rate and
low heart rate variability (Friedman & Thayer, 1998). High heart rate and low heart rate
variability have been associated with both trait anxiety and trait depression (Gorman & Sloan,
2000). Additionally, one ecological momentary assessment study found that state worry
significantly predicted concurrent and later low-heart rate variability (Brosschot, Van Dijk, &
Thayer, 2007). Concurrent hyperarousal has also been shown to be negatively concurrently
7
associated with fatigue (Crofford, 1998). However, no research has been published regarding
anxious moods predicting later hyperarousal, hyperarousal predicting later fatigue, or
hyperarousal or fatigue mediating the relationship between anxious moods and later depressed
moods. We examined hyperarousal (through self-reported arousal, heart rate, and heart rate
variability) and fatigue (through self-reported fatigue) as potential mechanisms of the relationship
between anxiety and depression at each assessment period.
The Current Study
The proposed study examined the short-term temporal relationship between anxious and
depressed moods among participants with pure clinical anxiety (generalized anxiety disorder
and/or social phobia), pure clinical depression (major depression), mixed clinical anxiety-
depression (comorbid generalized anxiety disorder/social phobia with major depressive disorder),
and non-anxious/non-depressed controls. It utilized an ecological momentary assessment design
wherein participants periodically recorded their moods. Smartphones were used to randomly
prompt participants once per hour for seven days during the times in which the participants were
awake to assess momentary anxious moods, depressed moods, arousal, and fatigue. Group
differences were examined to determine if the relationship between anxious and depressed moods
was different across diagnostic groups (e.g. pure clinical anxiety versus pure clinical depression,
mixed clinical anxiety-depression versus non-anxious/non-depressed controls).
Hypotheses
We hypothesized that: (1) anxious moods would positively predict later depressed moods
within a one-day interval, (2) anxious moods and later depressed moods would be mediated by
8
arousal and fatigue such that anxiety would positively predict arousal, arousal would positively
predict fatigue, and fatigue would positively predict depression; (3) the relationship between
anxiety and later depression, as well as each of the mediational relationships between anxiety and
later depression would be stable across the pure clinical anxiety group, pure clinical depression
group, mixed clinical anxiety-depression group, and non-anxious/non-depressed control group.
9
Chapter 2
Method
Trait Measures of Anxiety and Depression
Depression Anxiety and Stress Scale (DASS) Depression Scale.
The DASS Depression scale was used to assess DSM-IV major depressive disorder.
When compared to a structured interview, this scale has good sensitivity (80-86%) and specificity
(64-80%) in assessing DSM-IV major depressive disorder using a cutoff score of 12 or higher as
indicative of depression (Dahm, Ponsford, Wong, & Schönberger, 2009; Mitchell, Burns, &
Dorstyn, 2008). Accordingly, the cut-point of 12 was used to select individuals with major
depressive disorder. The Depression scale has excellent convergent validity (r = .78 with the
Personal Disturbance Depression scale, r = .66 with the Hamilton Depression Scale) (Crawford &
Henry, 2003) and adequate discriminant validity (r = .62 for Personal Disturbance Anxiety scale,
r = .59 for the Hamilton Anxiety Scale)(Crawford & Henry, 2003). The Depression scale also has
excellent internal consistency (α = .95) (Crawford & Henry, 2003). In regard to the Diagnostic
and Statistical Manual 5th Edition (DSM-5), the only change between DSM-IV major depressive
disorder and DSM-5 major depressive disorder is DSM-5’s removal of bereavement as an
exception to the diagnosis. As the Depression Scale does not assess bereavement, it is likely that
the DASS would have high convergent validity with DSM-5 major depressive disorder.
10
Generalized Anxiety Disorder Questionnaire - IV (GAD-Q-IV).
The GAD-Q-IV was used to assess DSM-IV generalized anxiety disorder (Newman et
al., 2002). The GAD-Q-IV demonstrated good sensitivity (76-90%) and specificity (83-100%)
(Moore, Anderson, Barnes, Haigh, & Fresco, 2013; Newman et al., 2002); in addition, the GAD-
Q-IV has adequate kappa agreement (kappa =.67) (Newman et al., 2002). We used DSM-IV
criteria to determine the diagnosis of generalized anxiety disorder based on the participants’ self-
report. The GAD-Q-IV has also showed good discriminant validity among other measures of
anxiety (r = .45 with the PTSD Checklist, r = .34 with the Social Interaction Anxiety Scale) and
depression (r = .26 in correlation with the Zung Self-Rating Depression Scale); in addition to
adequate convergent validity (r range .55-.66 with the Penn State Worry Questionnaire)
(Newman et al., 2002). Although originally designed to measure the DSM-IV criteria, the DSM-5
criteria for generalized anxiety disorder has remained the same; thus, this measure assesses both
DSM-IV and DSM-5 generalized anxiety disorder.
Social Phobia Diagnostic Questionnaire (SPDQ).
The SPDQ is a 25-item self-report measure to diagnose DSM-IV social phobia (Newman,
Kachin, Zuellig, Constantino, & Cashman-McGrath, 2003). The SPDQ showed good sensitivity
(82%) and specificity (85%), and adequate kappa agreement (.66) with a structured interview
(Newman et al., 2003). The SPDQ showed good discriminant validity with other anxiety and
depression measures (r = .31 for the Panic Disorder Severity Scale, r = .38 for the Penn State
Worry Questionnaire, r = .28 for the GAD-Q-IV, r = .32 for the Beck Depression Inventory), and
adequate convergent validity (r = .61 with the Social Avoidance and Distress Scale) (Newman et
al., 2003). In regard to the DSM-5 diagnoses, the content of the DSM-IV criteria for social phobia
11
(called social anxiety disorder in the DSM-5) has widely remained the same (American
Psychiatric Association, 2013). Although there are many semantic changes to the diagnoses (and
changes to the specifiers), the only substantive difference is that the DSM-IV requires the client
to believe that the phobia is excessive and unreasonable (American Psychiatric Association,
2000); however in the DSM-5, that determination is left to the clinician (American Psychiatric
Association, 2013). Given these minimal changes, it is likely that the SPDQ will assess DSM-5
social anxiety disorder with high convergent validity.
Trait Measures of Anxiety and Depression
Profile of Mood States – Brief (POMS-B) Anxiety and Depression Scales
The POMS-B tension/anxiety (5-items) and depression/dejection scales (5-items) were
used to measure momentary levels of anxiety and depression. The POMS-B items were
constructed by using the five largest factor loadings from each of the POMS scales (McNair &
Heuchert, 2005). For the purpose of this manuscript, the tension/anxiety scale will hereinafter be
referred to as the POMS anxiety scale, whereas the depression/dejection scale will be hereinafter
referred to as the POMS depression scale. Both scales ask persons how they are feeling right now.
Example items include “nervous” and “anxious” for the anxiety scale, and “sad” and “gloomy”
for the depression scale. The POMS-B showed high internal consistencies for both the anxiety
and depression scales in both males and females in college and clinical samples (α range .86-.89)
(McNair & Heuchert, 2005). Moreover, the POMS-B is highly representative of the full POMS,
which demonstrates validity based on external validation using emotion manipulations (McNair
& Heuchert, 2005; Pillard, Atkinson, & Fisher, 1967; Pillard & Fisher, 1967). As the scale was
collected via smartphone, the scale was modified from a categorical number system to a
12
continuous slider scale to assess anxiety and depression to ensure continuity between different
scales and to measure the scales continuously. The left and right anchors of the scale were
identical to the original measures.
POMS-B Fatigue Scale
The POMS-B fatigue/inertia scale was used to measure fatigue, and it will be hereafter
referred to as the POMS fatigue scale. Example items include “exhausted” and “fatigued”. The
POMS fatigue scale has demonstrated validity based on external validation using experimental
manipulation of physical exertion (Steptoe & Cox, 1988). The POMS-B fatigue scale has
demonstrated high internal consistency in psychiatric samples for males and females (α range .92-
.93). As with the POMS anxiety and depression scales, the POMS fatigue scale was modified to
work as a continuous slider.
Arousal
A face-valid self-reported measure of arousal (Russell, 2003) measured persons’ level of
arousal at the current time prompt (asking: “Which of these things best describes how you feel
right now?,” scale: “Sleepy to Activated” continuous slider). This item combines both poles of an
arousal scale used in a previous study, and this item is similar to the items used in the previous
study (Feldman, 1995). An item with the same pole has been validated using experimental
manipulations and shown significant changes within-persons (Cohen & Andrade, 2004), and
items using nearly identical poles have also been found to change based on experimental
manipulations of arousal (e.g. “sleepy/alert”, Nilsson, Johansson, & Frantzich, 2009) (e.g.
"sleepy/active", Septianto, 2014).
13
Heart rate and heart rate variability
Heart rate was assessed using an open-source application utilizing the camera on
smartphones (Wetherell, 2013). The application uses photoplethysmographic signals that are
obtained by taking pictures of the color changes in the index finger when the finger is pressed
against the phone’s camera. This method of obtaining heart rate and heart rate variability through
smartphone applications has recently been validated (Scully et al., 2012) and has been shown to
have high convergence with traditional measures (r =.98 – 1.00 with heart rate, and r = .90-.97 in
RMSSD) (Bolkhovsky, Scully, & Chon, 2012). The application collects the amount of time
between each heart rate. When running feasibility tests for this study, the application had high
agreement with the gold standard of measurement using the ECG150 in the Biopac MP150 with
calculations of BPM (r = .79). The amount of time between successive heartbeats enables the
calculation of the rMSSD, which is the square root of the mean of the sum of square differences
between adjacent RR intervals over the length of the analyses (Massin, Derkenne, & von Bernuth,
1999). The rMSSD is highly correlated with other measures of heart rate variability including the
ultralow frequency index (r = .76), very low frequency index (r = .78), low frequency index (r =
.80), high frequency index (r = .91), low to high frequency index ratio (r = .60), and combined
low and high frequency indices (r = .80) (Massin et al., 1999).
Phone apparatus
Participants used their own smartphones or were given LG LS670 Android 2.2 phones for
data collection (specifications: 320 x 480 pixels, 3.2 inch screen, multitouch, Qualcomm
Snapdragon S1 MSM7627 600 MHz processor) if they did not have an Android phone. A
14
customized application was used for all of the questionnaires and to launch the heart rate
application at each prompt.
Participants
The pure clinical anxiety group (N = 56, 38% Male, M = 19.05 years old, 67.8%
Caucasian, 7.1% African American, 8.9% Hispanic/Latino, 12.5% Asian American, 1.8%
Multiracial/multiethnic, 1.8% other), pure clinical depression group (N = 7, 29% Male, M = 18.42
years old, 57.1% Caucasian, 28.6% Asian American, 14.3% other), mixed clinical anxiety-
depression group (N = 43, 42% Male, M = 19.21 years old, 62.8% Caucasian, 9.3% African
American, 4.7% Hispanic/Latino, 18.6% Asian American, 2.3% Multiracial/multiethnic, 2.3%
other), and the non-anxious/non-depressed control group (N = 53, 62% Male, M = 19.36 years
old, 77.4% Caucasian, 9.4% African American, 1.9% Hispanic/Latino, 1.9% Asian American,
1.8% Multiracial/multiethnic, 7.5% other) were selected from an undergraduate subject pool.
Based on the cut-off procedures described above, participants diagnosed with major depressive
disorder, generalized anxiety disorder, and social phobia were sampled.
Procedure
After being selected as possible participants for the pure clinical anxiety (generalized
anxiety disorder or social phobia), pure clinical depression (major depressive disorder), mixed
clinical anxiety-depression group (generalized anxiety disorder/major depressive disorder and
social phobia/major depressive disorder), and non-anxious/non-depressed control (no diagnoses)
groups, potential participants were contacted via email inviting them to participate in a study
predicting moods. Those who expressed interest were asked to attend a short information session.
15
During the information session, participants gave consent to participate in the study.
Next, they installed applications on their smartphone or were provided an Android smartphone if
they did not own a compatible device, and received instructions on how to complete the
questionnaires. During the introductory session, participants were shown a PowerPoint
demonstration regarding the use of the questionnaires and heart rate application. In an attempt to
control for ceiling and floor effects, participants were asked to try not to use the ends of the
scales, and to only use the ends of the scales in extreme circumstances for each of the
questionnaires. Additionally, each question in the survey was explained so that participants had a
clear understanding of what they were being asked to report.
For the next seven days following the information session, participants were
prompted once per hour during the times in which they were awake. At each prompt, participants
were asked to complete the Heart Rate/Heart Rate Variability assessment (30 seconds long),
POMS-B anxiety (5-items), POMS-B depression (5-items), self-reported arousal item (1 item),
and POMS-B fatigue (5-items). As such, participants completed 16 questions at each prompt.
Following the assessment, participants came to a debriefing session to return the phones.
Planned Analyses
Compliance Rates.
Compliance rates were calculated by dividing the number of completed prompts by the
number of total prompts (note that this would be different for every subject based on the number
of hours that each subject indicated he/she would be awake).
16
Concurrent Between and Within-Person Associations.
Prior to the primary analyses, between and within-person associations were examined. To
examine between-person associations, averaging the raw data for each person within each group
created summary statistics. The correlation, mean, and standard deviation of the mean scores of
each person’s average scores were then assessed. Next, the percentage of variation accounted for
by between-person variation compared to within-person variation was estimated using multilevel
models of each item with only the group-level intercept and the intercept within persons. The
percentage of between-person variation was estimated based on the percentage of variation
explained by the random intercepts divided by the total variation (i.e. this is an intraclass
correlation coefficient). The rest of the variation not accounted for based on the residual variation
explained the percentage of within-person variation. Within-person concurrent associations were
examined by using state-space models modeling only autoregressive lags of each item and
examining the residual covariation of each item for each group.
Differential Time-Varying Effect Model (DTVEM).
The primary analyses were conducted using DTVEMs, which allow one to investigate
when processes optimally predict one another at an individual or group level (Jacobson, Chow, &
Newman, 2015). DTVEM includes two primary stages: (1) an exploratory stage used to identify
optimal time lags and (2) a confirmatory stage to model the optimal time lags in the time series.
The exploratory stage of DTVEM operates within the domain of generalized additive mixed
models (GAMMs), using a varying coefficient framework. Specifically, DTVEM allows for the
estimation of the linear relationship between predictors and the outcome as a nonlinear function
of time differences. Following the initial exploratory stage, the confirmatory stage is used to
17
estimate the lags identified in the first stage to test if these individual points are significant in a
more traditional fashion. In this case, the confirmatory phase was implemented through state-
space models with each person’s lagged estimates constrained to be equal for all persons within
the group. All analyses were carried out through the DTVEM function, utilizing both mgcv (for
stage 1) (Wood, 2014) and OpenMx (for stage 2) (Boker et al., 2010). Note that once significant
lags have been identified, the exploratory phase is conducted again to ensure that any significant
lags are not missed (see Jacobson et al., 2015 for more details). Note that the state-space approach
represents the final stage for each DTVEM.
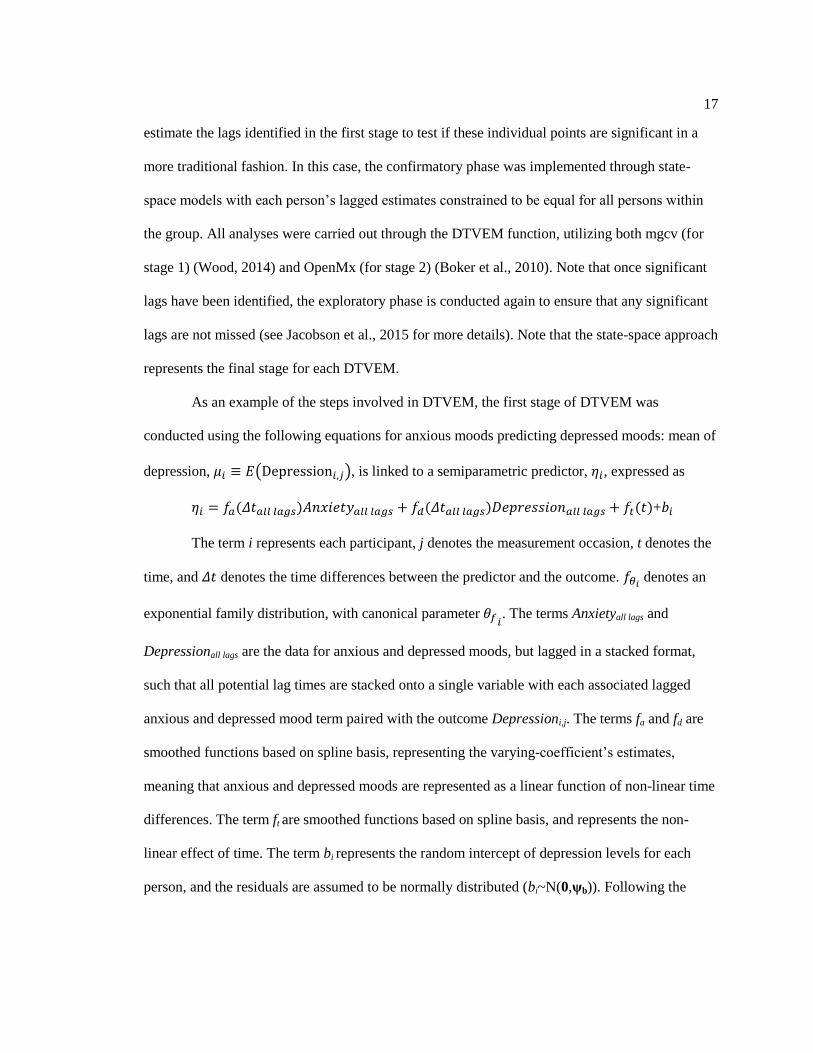
As an example of the steps involved in DTVEM, the first stage of DTVEM was
conducted using the following equations for anxious moods predicting depressed moods: mean of
depression, 𝜇𝑖 ≡ 𝐸(Depression𝑖,𝑗), is linked to a semiparametric predictor, 𝜂𝑖, expressed as
𝜂𝑖 = 𝑓𝑎(𝛥𝑡𝑎𝑙𝑙 𝑙𝑎𝑔𝑠)𝐴𝑛𝑥𝑖𝑒𝑡𝑦𝑎𝑙𝑙 𝑙𝑎𝑔𝑠 + 𝑓𝑑(𝛥𝑡𝑎𝑙𝑙 𝑙𝑎𝑔𝑠)𝐷𝑒𝑝𝑟𝑒𝑠𝑠𝑖𝑜𝑛𝑎𝑙𝑙 𝑙𝑎𝑔𝑠 + 𝑓𝑡(𝑡)+𝑏𝑖
The term i represents each participant, j denotes the measurement occasion, t denotes the
time, and 𝛥𝑡 denotes the time differences between the predictor and the outcome. 𝑓𝜃𝑖 denotes an
exponential family distribution, with canonical parameter 𝜃𝑓𝑖. The terms Anxietyall lags and
Depressionall lags are the data for anxious and depressed moods, but lagged in a stacked format,
such that all potential lag times are stacked onto a single variable with each associated lagged
anxious and depressed mood term paired with the outcome Depressioni,j. The terms fa and fd are
smoothed functions based on spline basis, representing the varying-coefficient’s estimates,
meaning that anxious and depressed moods are represented as a linear function of non-linear time
differences. The term ft are smoothed functions based on spline basis, and represents the non-
linear effect of time. The term bi represents the random intercept of depression levels for each
person, and the residuals are assumed to be normally distributed (bi~N(0,ψb)). Following the
18
exploratory phase, the confirmatory phase was implemented by a state-space model, modeling
only the lags identified in the first stage.
Although DTVEM can utilize all potential time lags in the time series, a max lag of 24
hours was put into place as there is an exponential increase in the amount of time it takes to run
models as the number of lags increases (this is due to the implementation of state space models at
the confirmatory stage, e.g. DTVEM with only two predictors and one outcome took two weeks
to converge with a max lag of 24 hours). Additionally, although DTVEM allows for the modeling
of both univariate and multivariate outcomes, which facilitates modeling all mediating
relationships in a single model, the models take extremely long to converge (again due to the state
space models taking a long time to run with a lagged structure). As such, mediation was tested in
a piecewise fashion, using the joint significance test. Note that mediation will be considered to be
established upon the joint significance of a predictor on a mediator and a mediator on an outcome
alone (i.e. no significant direct effect required) (Hayes, 2009).
Group differences were tested using the log-likelihood ratio test, Akaike information
criterion (AIC), and Bayesian information criterion (BIC). Specifically, the fit of the model with
unconstrained parameters was compared to the fit of the model after parameters have been
constrained to be equal across groups. When there is disagreement among the fit indices, the
model fit was determined based on the majority of the fit indices (note that, in practice, the log
likelihood ratio test always supported the overall decision). Model comparison proceeded in three
primary steps for each potential pairwise relationship: (1) all cross-lags between the predictor and
the outcome were constrained to be equal simultaneously, (2) each cross lag was constrained to
be equal separately, and (3) each combination of the individual groups was constrained to be
equal for each lag. Proceeding in this fashion allows one to test if there are any group differences
for any of the cross-lags, determine whether any lags have significant differences between
groups, and determine whether any groups are significantly different from one another. All

19
hypotheses were tested using group-level confirmatory state-space models. The presented results
are based on the final models after applying group differences.
20
Chapter 3
Results
Compliance
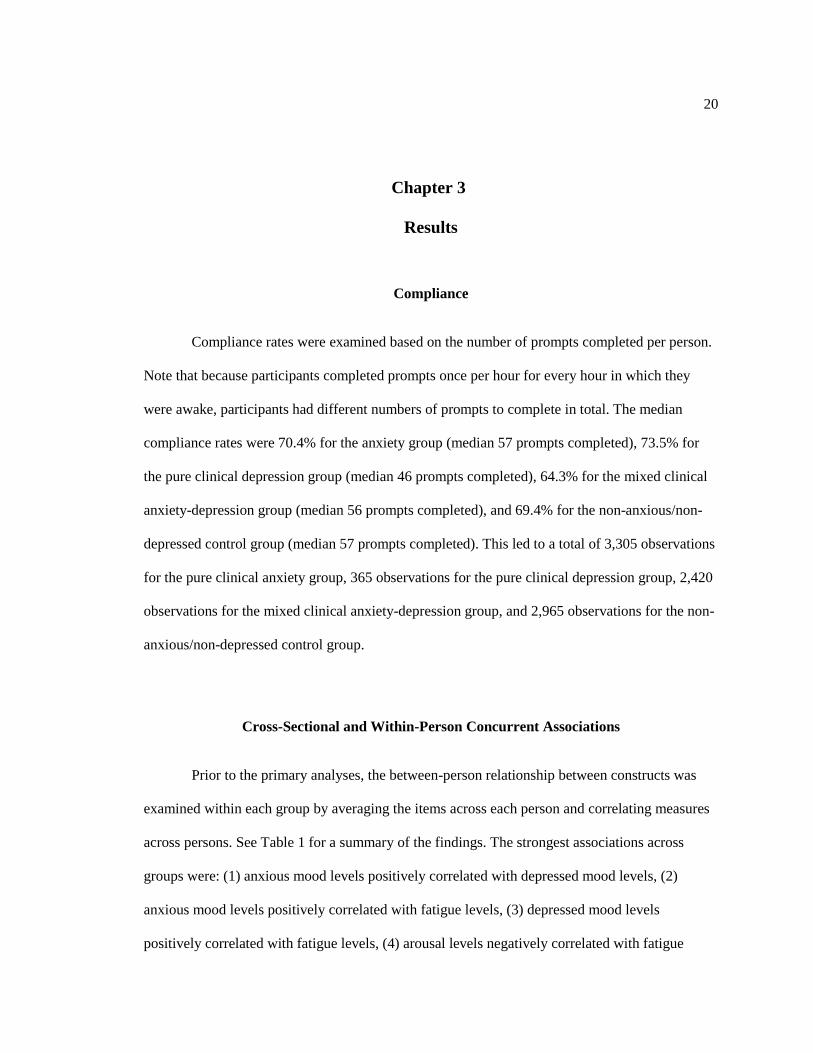
Compliance rates were examined based on the number of prompts completed per person.
Note that because participants completed prompts once per hour for every hour in which they
were awake, participants had different numbers of prompts to complete in total. The median
compliance rates were 70.4% for the anxiety group (median 57 prompts completed), 73.5% for
the pure clinical depression group (median 46 prompts completed), 64.3% for the mixed clinical
anxiety-depression group (median 56 prompts completed), and 69.4% for the non-anxious/non-
depressed control group (median 57 prompts completed). This led to a total of 3,305 observations
for the pure clinical anxiety group, 365 observations for the pure clinical depression group, 2,420
observations for the mixed clinical anxiety-depression group, and 2,965 observations for the non-
anxious/non-depressed control group.
Cross-Sectional and Within-Person Concurrent Associations
Prior to the primary analyses, the between-person relationship between constructs was
examined within each group by averaging the items across each person and correlating measures
across persons. See Table 1 for a summary of the findings. The strongest associations across
groups were: (1) anxious mood levels positively correlated with depressed mood levels, (2)
anxious mood levels positively correlated with fatigue levels, (3) depressed mood levels
positively correlated with fatigue levels, (4) arousal levels negatively correlated with fatigue
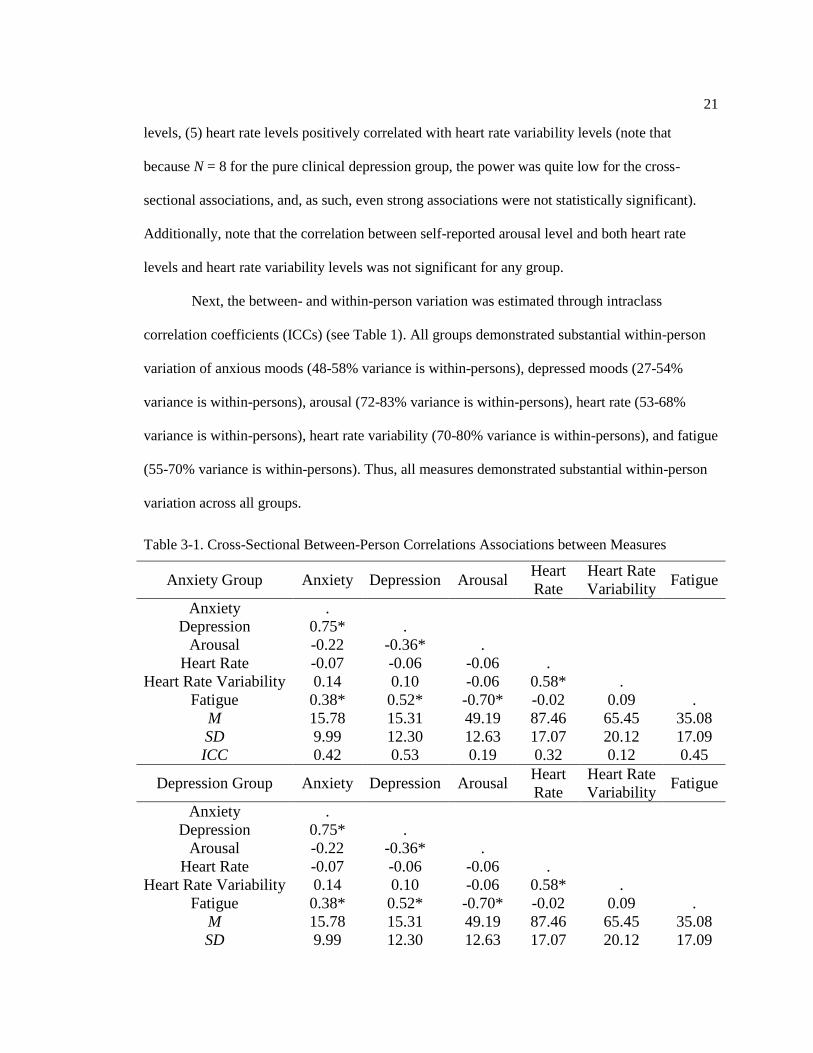
21
levels, (5) heart rate levels positively correlated with heart rate variability levels (note that
because N = 8 for the pure clinical depression group, the power was quite low for the cross-
sectional associations, and, as such, even strong associations were not statistically significant).
Additionally, note that the correlation between self-reported arousal level and both heart rate
levels and heart rate variability levels was not significant for any group.
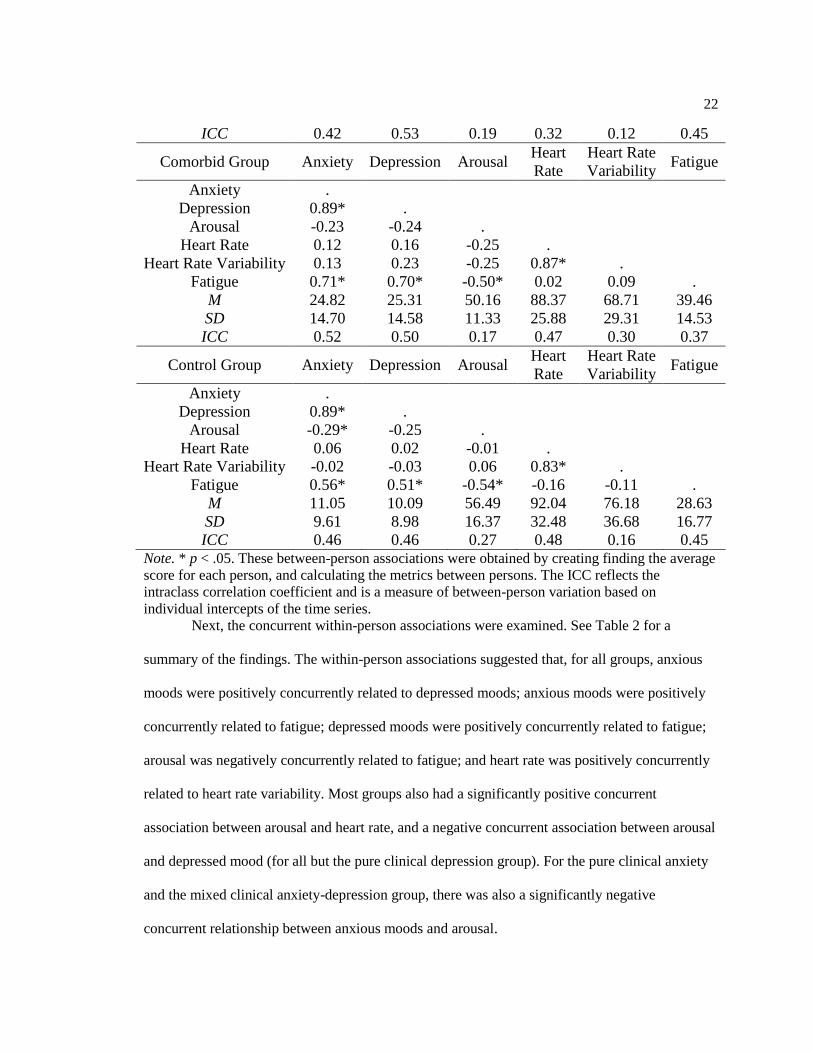
Next, the between- and within-person variation was estimated through intraclass
correlation coefficients (ICCs) (see Table 1). All groups demonstrated substantial within-person
variation of anxious moods (48-58% variance is within-persons), depressed moods (27-54%
variance is within-persons), arousal (72-83% variance is within-persons), heart rate (53-68%
variance is within-persons), heart rate variability (70-80% variance is within-persons), and fatigue
(55-70% variance is within-persons). Thus, all measures demonstrated substantial within-person
variation across all groups.
Table 3-1. Cross-Sectional Between-Person Correlations Associations between Measures
Anxiety Group Anxiety Depression Arousal Heart
Rate
Heart Rate
Variability Fatigue
Anxiety .
Depression 0.75* .
Arousal -0.22 -0.36* .
Heart Rate -0.07 -0.06 -0.06 .
Heart Rate Variability 0.14 0.10 -0.06 0.58* .
Fatigue 0.38* 0.52* -0.70* -0.02 0.09 .
M 15.78 15.31 49.19 87.46 65.45 35.08
SD 9.99 12.30 12.63 17.07 20.12 17.09
ICC 0.42 0.53 0.19 0.32 0.12 0.45
Depression Group Anxiety Depression Arousal Heart
Rate
Heart Rate
Variability Fatigue
Anxiety .
Depression 0.75* .
Arousal -0.22 -0.36* .
Heart Rate -0.07 -0.06 -0.06 .
Heart Rate Variability 0.14 0.10 -0.06 0.58* .
Fatigue 0.38* 0.52* -0.70* -0.02 0.09 .
M 15.78 15.31 49.19 87.46 65.45 35.08
SD 9.99 12.30 12.63 17.07 20.12 17.09
22
ICC 0.42 0.53 0.19 0.32 0.12 0.45
Comorbid Group Anxiety Depression Arousal Heart
Rate
Heart Rate
Variability Fatigue
Anxiety .
Depression 0.89* .
Arousal -0.23 -0.24 .
Heart Rate 0.12 0.16 -0.25 .
Heart Rate Variability 0.13 0.23 -0.25 0.87* .
Fatigue 0.71* 0.70* -0.50* 0.02 0.09 .
M 24.82 25.31 50.16 88.37 68.71 39.46
SD 14.70 14.58 11.33 25.88 29.31 14.53
ICC 0.52 0.50 0.17 0.47 0.30 0.37
Control Group Anxiety Depression Arousal Heart
Rate
Heart Rate
Variability Fatigue
Anxiety .
Depression 0.89* .
Arousal -0.29* -0.25 .
Heart Rate 0.06 0.02 -0.01 .
Heart Rate Variability -0.02 -0.03 0.06 0.83* .
Fatigue 0.56* 0.51* -0.54* -0.16 -0.11 .
M 11.05 10.09 56.49 92.04 76.18 28.63
SD 9.61 8.98 16.37 32.48 36.68 16.77
ICC 0.46 0.46 0.27 0.48 0.16 0.45 Note. * p < .05. These between-person associations were obtained by creating finding the average
score for each person, and calculating the metrics between persons. The ICC reflects the
intraclass correlation coefficient and is a measure of between-person variation based on
individual intercepts of the time series.
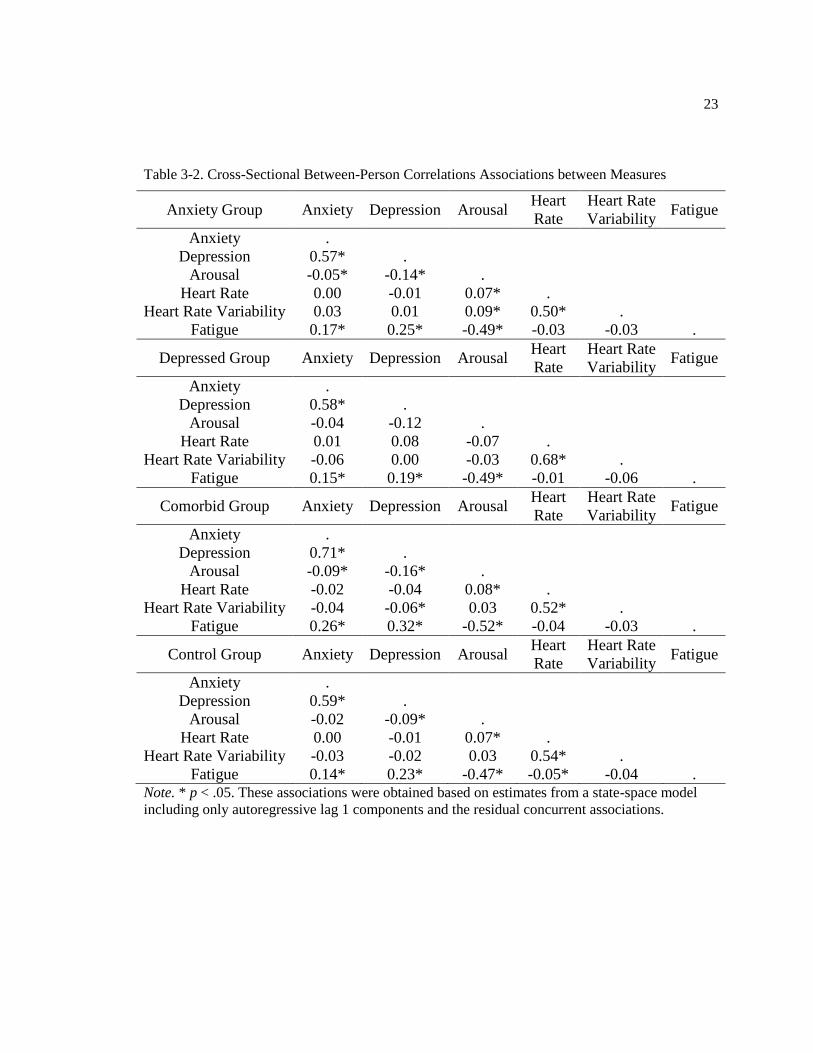
Next, the concurrent within-person associations were examined. See Table 2 for a
summary of the findings. The within-person associations suggested that, for all groups, anxious
moods were positively concurrently related to depressed moods; anxious moods were positively
concurrently related to fatigue; depressed moods were positively concurrently related to fatigue;
arousal was negatively concurrently related to fatigue; and heart rate was positively concurrently
related to heart rate variability. Most groups also had a significantly positive concurrent
association between arousal and heart rate, and a negative concurrent association between arousal
and depressed mood (for all but the pure clinical depression group). For the pure clinical anxiety
and the mixed clinical anxiety-depression group, there was also a significantly negative
concurrent relationship between anxious moods and arousal.
23
Table 3-2. Cross-Sectional Between-Person Correlations Associations between Measures
Anxiety Group Anxiety Depression Arousal Heart
Rate
Heart Rate
Variability Fatigue
Anxiety .
Depression 0.57* .
Arousal -0.05* -0.14* .
Heart Rate 0.00 -0.01 0.07* .
Heart Rate Variability 0.03 0.01 0.09* 0.50* .
Fatigue 0.17* 0.25* -0.49* -0.03 -0.03 .
Depressed Group Anxiety Depression Arousal Heart
Rate
Heart Rate
Variability Fatigue
Anxiety .
Depression 0.58* .
Arousal -0.04 -0.12 .
Heart Rate 0.01 0.08 -0.07 .
Heart Rate Variability -0.06 0.00 -0.03 0.68* .
Fatigue 0.15* 0.19* -0.49* -0.01 -0.06 .
Comorbid Group Anxiety Depression Arousal Heart
Rate
Heart Rate
Variability Fatigue
Anxiety .
Depression 0.71* .
Arousal -0.09* -0.16* .
Heart Rate -0.02 -0.04 0.08* .
Heart Rate Variability -0.04 -0.06* 0.03 0.52* .
Fatigue 0.26* 0.32* -0.52* -0.04 -0.03 .
Control Group Anxiety Depression Arousal Heart
Rate
Heart Rate
Variability Fatigue
Anxiety .
Depression 0.59* .
Arousal -0.02 -0.09* .
Heart Rate 0.00 -0.01 0.07* .
Heart Rate Variability -0.03 -0.02 0.03 0.54* .
Fatigue 0.14* 0.23* -0.47* -0.05* -0.04 . Note. * p < .05. These associations were obtained based on estimates from a state-space model
including only autoregressive lag 1 components and the residual concurrent associations.

24
Hypothesis 1: Anxious Moods Predicting Depressed Moods
The first hypothesis, that anxious moods would significantly predict later depressed
moods, was tested with a multi-group confirmatory state-space model. The results presented here
will include both group estimates that have been constrained to be equal if there were no
significant differences across groups and groups’ specific estimates.
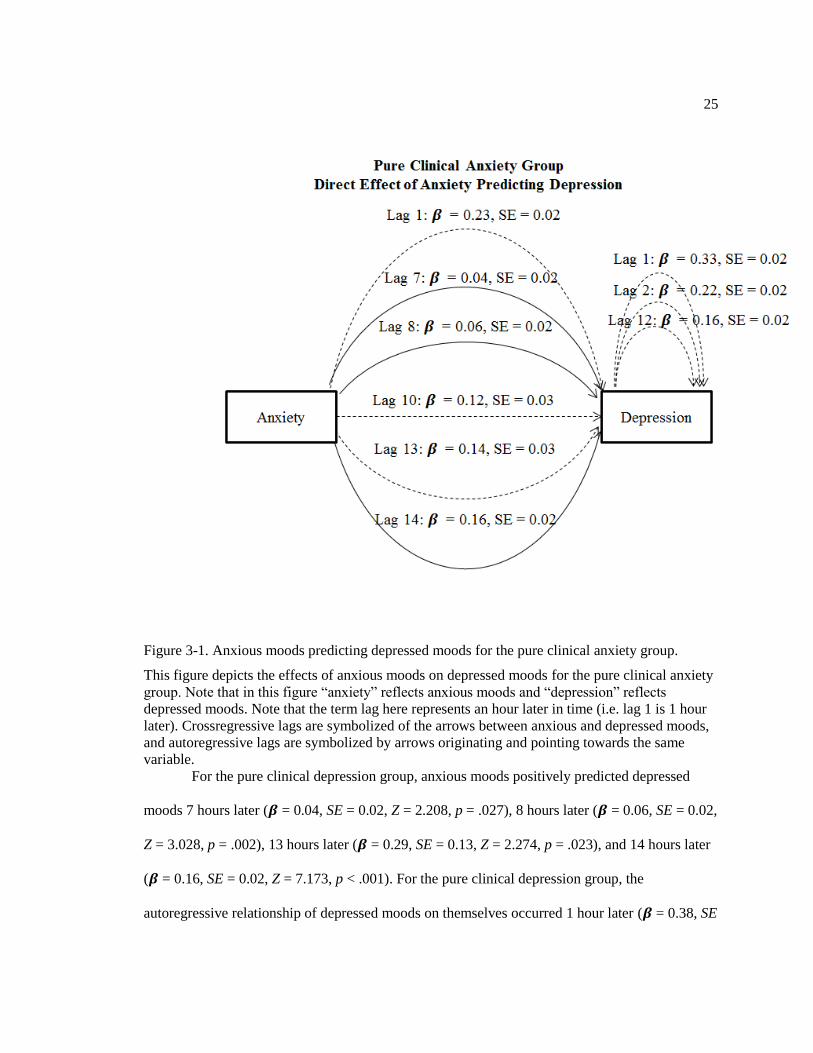
For the pure clinical anxiety group, anxious moods significantly positively predicted later
depressed moods 1 hour later (𝜷 = 0.23, SE = 0.02, Z = 10.151, p < .001), 7 hours later, (𝜷 =
0.04, SE = 0.02, Z = 2.208, p = .027), 8 hours later (𝜷 = 0.06, SE = 0.02, Z = 3.028, p = .002), 10
hours later (𝜷 = 0.12, SE = 0.03, Z = 3.705, p < .001), 13 hours later (𝜷 = 0.14, SE = 0.03, Z =
3.961, p < .001), and 14 hours later (𝜷 = 0.16, SE = 0.02, Z = 7.173, p < .001). For the pure
clinical anxiety group, the autoregressive relationship of depressed moods on themselves was
significant 1 hour later (𝜷 = 0.23, SE = 0.02, Z = 10.151, p < .001), 2 hours later (𝜷 = 0.33, SE =
0.02, Z = 16.996, p < .001), and 12 hours later (𝜷 = 0.22, SE = 0.02, Z = 10.559, p < .001).
25
Figure 3-1. Anxious moods predicting depressed moods for the pure clinical anxiety group.
This figure depicts the effects of anxious moods on depressed moods for the pure clinical anxiety
group. Note that in this figure “anxiety” reflects anxious moods and “depression” reflects
depressed moods. Note that the term lag here represents an hour later in time (i.e. lag 1 is 1 hour
later). Crossregressive lags are symbolized of the arrows between anxious and depressed moods,
and autoregressive lags are symbolized by arrows originating and pointing towards the same
variable.
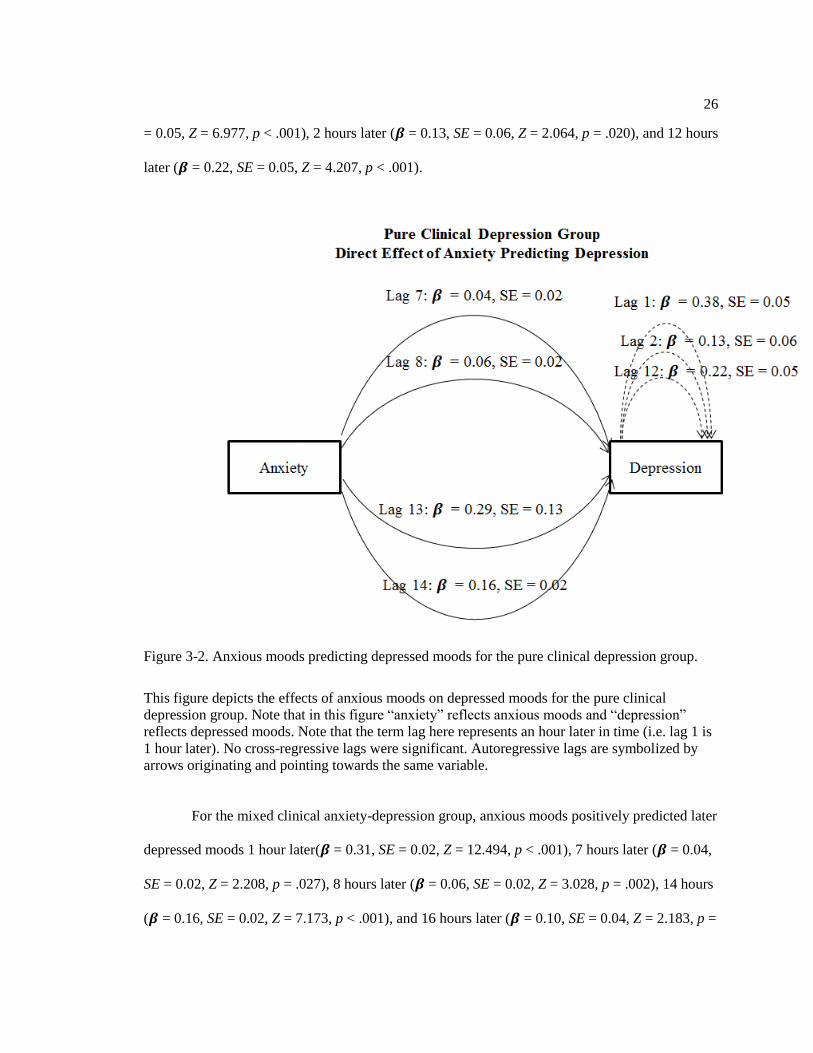
For the pure clinical depression group, anxious moods positively predicted depressed
moods 7 hours later (𝜷 = 0.04, SE = 0.02, Z = 2.208, p = .027), 8 hours later (𝜷 = 0.06, SE = 0.02,
Z = 3.028, p = .002), 13 hours later (𝜷 = 0.29, SE = 0.13, Z = 2.274, p = .023), and 14 hours later
(𝜷 = 0.16, SE = 0.02, Z = 7.173, p < .001). For the pure clinical depression group, the
autoregressive relationship of depressed moods on themselves occurred 1 hour later (𝜷 = 0.38, SE
26
= 0.05, Z = 6.977, p < .001), 2 hours later (𝜷 = 0.13, SE = 0.06, Z = 2.064, p = .020), and 12 hours
later (𝜷 = 0.22, SE = 0.05, Z = 4.207, p < .001).
Figure 3-2. Anxious moods predicting depressed moods for the pure clinical depression group.
This figure depicts the effects of anxious moods on depressed moods for the pure clinical
depression group. Note that in this figure “anxiety” reflects anxious moods and “depression”
reflects depressed moods. Note that the term lag here represents an hour later in time (i.e. lag 1 is
1 hour later). No cross-regressive lags were significant. Autoregressive lags are symbolized by
arrows originating and pointing towards the same variable.
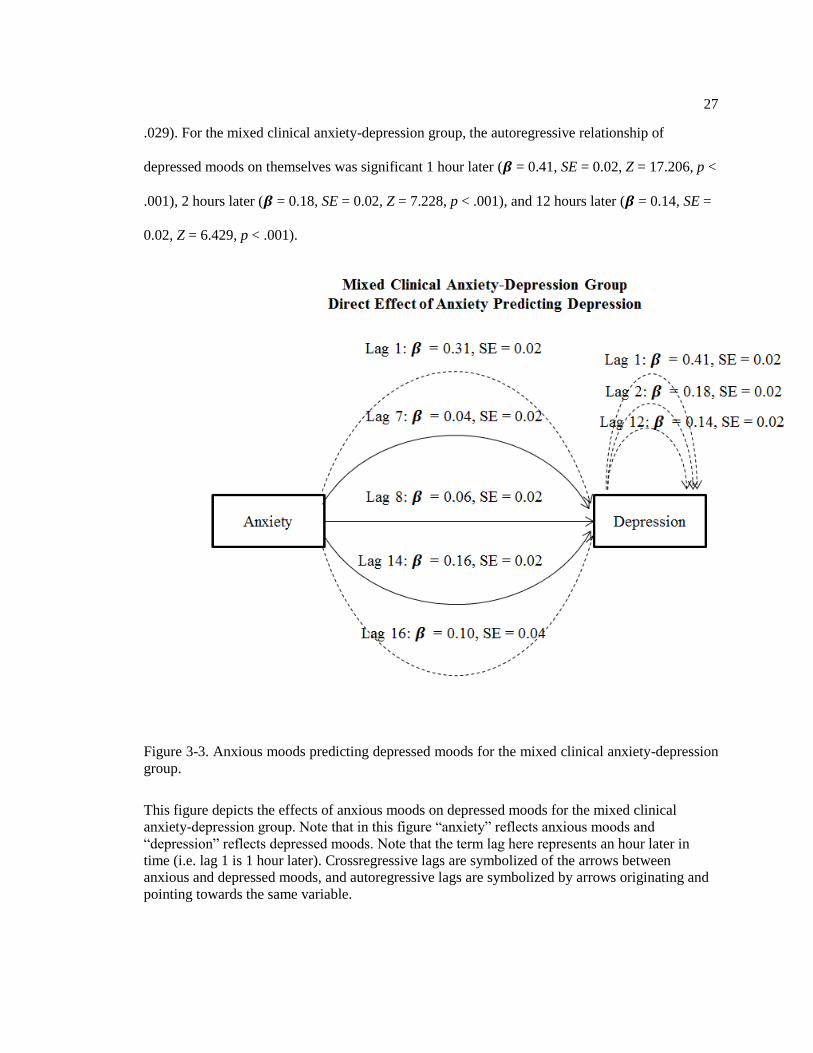
For the mixed clinical anxiety-depression group, anxious moods positively predicted later
depressed moods 1 hour later(𝜷 = 0.31, SE = 0.02, Z = 12.494, p < .001), 7 hours later (𝜷 = 0.04,
SE = 0.02, Z = 2.208, p = .027), 8 hours later (𝜷 = 0.06, SE = 0.02, Z = 3.028, p = .002), 14 hours
(𝜷 = 0.16, SE = 0.02, Z = 7.173, p < .001), and 16 hours later (𝜷 = 0.10, SE = 0.04, Z = 2.183, p =
27
.029). For the mixed clinical anxiety-depression group, the autoregressive relationship of
depressed moods on themselves was significant 1 hour later (𝜷 = 0.41, SE = 0.02, Z = 17.206, p <
.001), 2 hours later (𝜷 = 0.18, SE = 0.02, Z = 7.228, p < .001), and 12 hours later (𝜷 = 0.14, SE =
0.02, Z = 6.429, p < .001).
Figure 3-3. Anxious moods predicting depressed moods for the mixed clinical anxiety-depression
group.
This figure depicts the effects of anxious moods on depressed moods for the mixed clinical
anxiety-depression group. Note that in this figure “anxiety” reflects anxious moods and
“depression” reflects depressed moods. Note that the term lag here represents an hour later in
time (i.e. lag 1 is 1 hour later). Crossregressive lags are symbolized of the arrows between
anxious and depressed moods, and autoregressive lags are symbolized by arrows originating and
pointing towards the same variable.
28
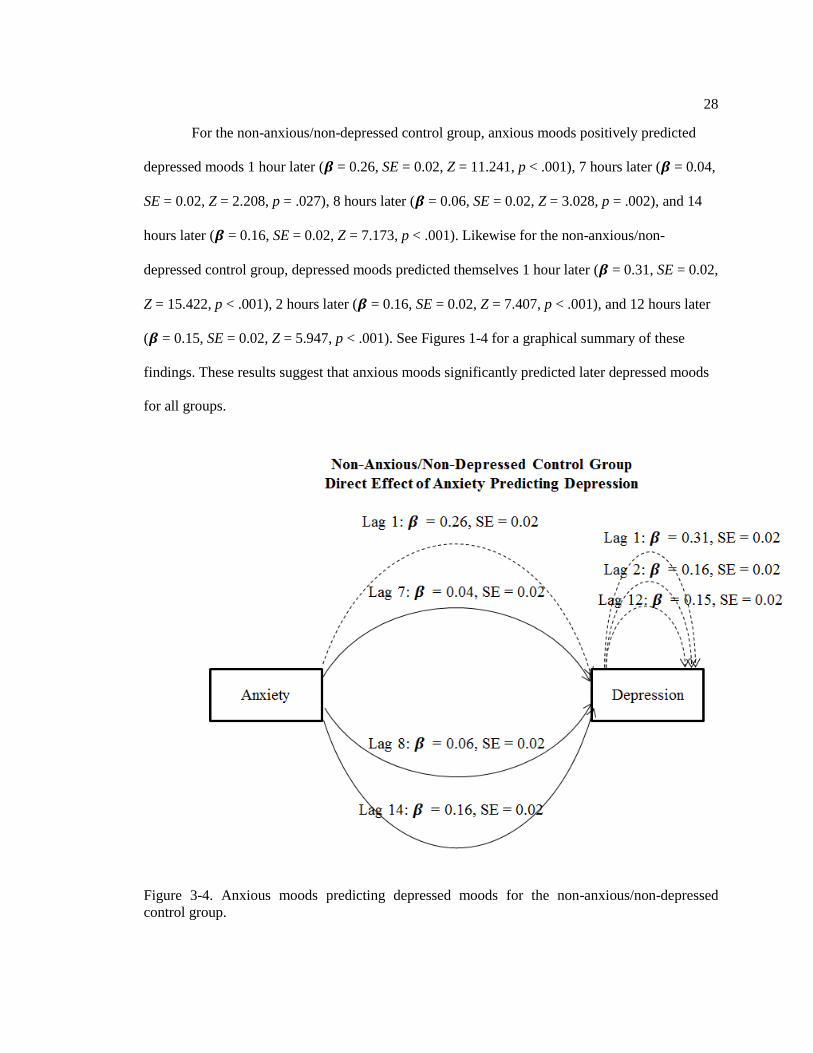
For the non-anxious/non-depressed control group, anxious moods positively predicted
depressed moods 1 hour later (𝜷 = 0.26, SE = 0.02, Z = 11.241, p < .001), 7 hours later (𝜷 = 0.04,
SE = 0.02, Z = 2.208, p = .027), 8 hours later (𝜷 = 0.06, SE = 0.02, Z = 3.028, p = .002), and 14
hours later (𝜷 = 0.16, SE = 0.02, Z = 7.173, p < .001). Likewise for the non-anxious/non-
depressed control group, depressed moods predicted themselves 1 hour later (𝜷 = 0.31, SE = 0.02,
Z = 15.422, p < .001), 2 hours later (𝜷 = 0.16, SE = 0.02, Z = 7.407, p < .001), and 12 hours later
(𝜷 = 0.15, SE = 0.02, Z = 5.947, p < .001). See Figures 1-4 for a graphical summary of these
findings. These results suggest that anxious moods significantly predicted later depressed moods
for all groups.
Figure 3-4. Anxious moods predicting depressed moods for the non-anxious/non-depressed
control group.

29
This figure depicts the effects of anxious moods on depressed moods for the mixed non-
anxious/non-depressed control group. Note that in this figure “anxiety” reflects anxious moods
and “depression” reflects depressed moods. Note that the term lag here represents an hour later in
time (i.e. lag 1 is 1 hour later). Crossregressive lags are symbolized of the arrows between
anxious and depressed moods, and autoregressive lags are symbolized by arrows originating and
pointing towards the same variable.
The bi-directional relationship of depressed moods on anxious moods was also examined.
For the pure clinical anxiety group, depressed moods positively predicted anxious moods 1 hour
later (𝜷 = 0.26, SE = 0.01, Z = 21.482, p < .001), 2 hours later (𝜷 = 0.14, SE = 0.02, Z = 6.361, p
< .001), and 7 hours later (𝜷 = 0.21, SE = 0.02, Z = 8.354, p < .001). Also, anxious moods
predicted themselves 1 hour (𝜷 = 0.42, SE = 0.02, Z = 23.136, p < .001), 3 hours (𝜷 = 0.10, SE =
0.02, Z = 5.460, p < .001), 6 hours (𝜷 = -0.05, SE = 0.03, Z = -1.979, p = .024), and 7 hours later
(𝜷 = 0.18, SE = 0.03, Z = 5.369, p < .001).
For the pure clinical depression group, depressed moods positively predicted positively
anxious moods 1 hour later (𝜷 = 0.26, SE = 0.01, Z = 21.482, p < .001) and 7 hours later (𝜷 =
0.42, SE = 0.06, Z = 7.451, p < .001). Also, anxious moods predicted themselves 1 hour (𝜷 =
0.38, SE = 0.02, Z = 17.268, p < .001), 3 hours (𝜷 = 0.09, SE = 0.02, Z = 4.591, p < .001) and 7
hours later (𝜷 = 0.29, SE = 0.03, Z = 8.398, p < .001).
For the mixed clinical anxiety-depression group, depressed moods positively predicted
anxious moods 1 hour (𝜷 = 0.26, SE = 0.01, Z = 21.482, p < .001), 2 hours (𝜷 = 0.10, SE = 0.02,
Z = 4.344, p < .001), and 7 hours later (𝜷 = 0.26, SE = 0.03, Z = 9.969, p < .001). In addition,
anxious moods predicted themselves 1 hour (𝜷 = 0.31, SE = 0.02, Z = 15.081, p < .001), 3 hours
(𝜷 = 0.08, SE = 0.02, Z = 4.433, p < .001), and 7 hours later (𝜷 = 0.25, SE = 0.03, Z = 8.022, p <
.001).
With respect to the non-anxious/non-depressed control group, depressed moods
positively predicted anxious moods 1 hour (𝜷 = 0.26, SE = 0.01, Z = 21.482, p < .001), 2 hours
30
(𝜷 = 0.05, SE = 0.02, Z = 2.580, p = .010) and 7 hours later (𝜷 = 0.29, SE = 0.03, Z = 11.100, p <
.001). Further, anxious moods predicted themselves 1 hour later (𝜷 = 0.42, SE = 0.07, Z = 6.132,
p < .001).
Hypothesis 2: Self-Reported Arousal, Heart Rate, Heart Rate Variability and Fatigue will
Mediate the Relationship between Anxious and Depressed Moods
As mediational relationships were analyzed using pairwise models, separate models were
implemented for each potential mediator within each group.
Pure clinical anxiety group.
High anxious moods predicted low arousal 1 hour later (𝜷 = -0.08, SE = 0.01, Z = -5.674,
p < .001). Low arousal predicted high fatigue 1 (𝜷 = -0.26, SE = 0.02, Z = -10.700, p < .001) and
2 hours later (𝜷 = -0.13, SE = 0.02, Z = -7.667, p < .001). However, low arousal predicted low
fatigue 7 (𝜷 = 0.10, SE = 0.04, Z = 2.429, p = .015), 8 hours later (𝜷 = 0.05, SE = 0.02, Z = 2.106,
p = .035), and 13 hours later (𝜷 = 0.11, SE = 0.02, Z = 4.804, p < .001). High fatigue significantly
predicted depressed moods 1 hour later (𝜷 = 0.24, SE = 0.02, Z = 12.665, p < .001). Thus, arousal
and fatigue formed a mediational chain between anxious and depressed moods, and these
pathways explained a positive relationship between anxious and depressed moods 3 hours later
and 4 hours later. Additionally, arousal and fatigue mediated a significantly negative pathway
betweeen anxious and depressed moods 9, 10, and 15 hours later. Thus, the results showed two
types of pathways that operated at different times: (1) high anxious moods predicted low arousal,
low arousal predicted high fatigue immediately, and high fatigue predicted high depressed moods,
31
and (2) high anxious moods predicted low arousal, low arousal predicted delayed low fatigue, and
low fatigue predicted low depressed moods.
High anxious moods also predicted high heart rate 12 hours later (𝜷 = 0.25, SE = 0.02, Z
= 14.622, p < .001). Heart rate did not significantly predict fatigue. However, high heart rate
directly predicted higher depressed moods 6 hours later (𝜷 = 0.06, SE = 0.03, Z = 2.371, p =
.018). Thus, heart rate significantly mediated the relationship between anxious and depressed
moods, explaining a significantly positive relationship between anxious and depressed moods 18
hours later.
High anxious moods predicted lower heart rate variability 10 (𝜷 = -0.24, SE = 0.04, Z = -
6.757, p < .001) and 12 hours later (𝜷 = -0.24, SE = 0.04, Z = -6.922, p < .001). lower heart rate
variability predicted lower fatigue 11 hours later (𝜷 = 0.08, SE = 0.03, Z = 2.620, p = .009). low
fatigue significantly predicted low depressed moods 1 hour later (𝜷 = 0.24, SE = 0.02, Z =
12.665, p < .001). Thus, heart rate variability and fatigue formed a joint mediational pathway
between anxious and depressed moods such that high anxious moods predicted low depressed
moods 22 and 24 hours later. See Figures 5-6 for a visual depiction of these findings.
32
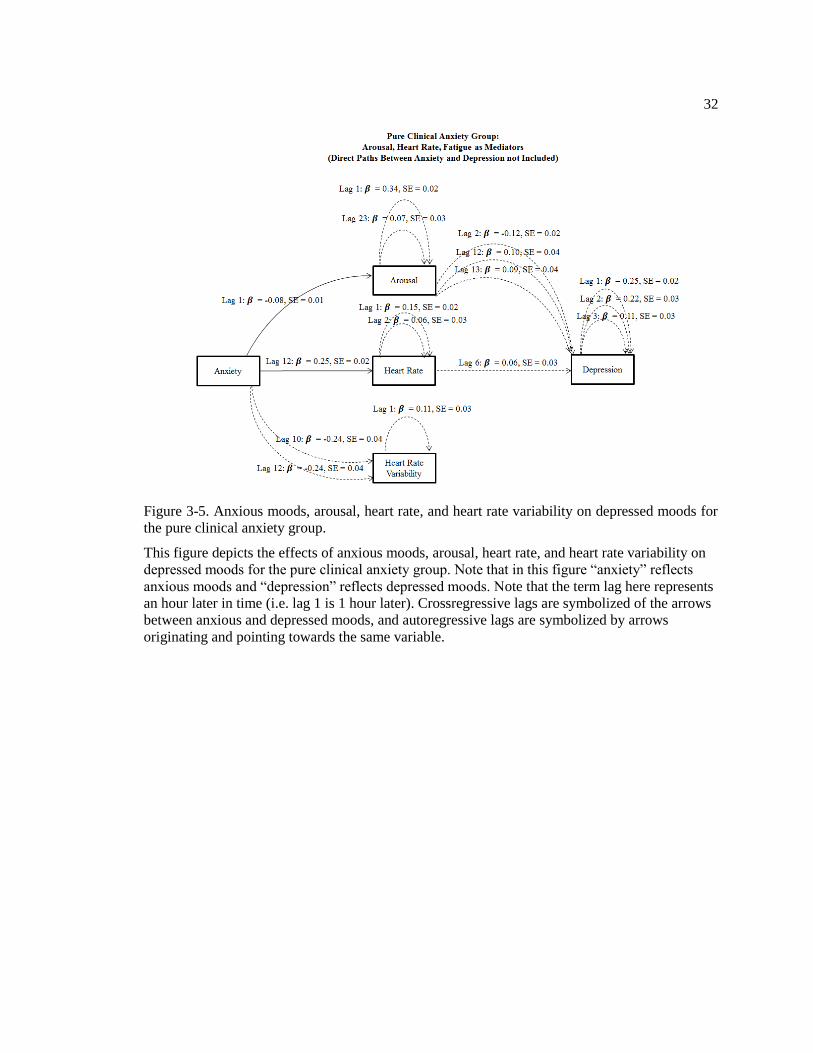
Figure 3-5. Anxious moods, arousal, heart rate, and heart rate variability on depressed moods for
the pure clinical anxiety group.
This figure depicts the effects of anxious moods, arousal, heart rate, and heart rate variability on
depressed moods for the pure clinical anxiety group. Note that in this figure “anxiety” reflects
anxious moods and “depression” reflects depressed moods. Note that the term lag here represents
an hour later in time (i.e. lag 1 is 1 hour later). Crossregressive lags are symbolized of the arrows
between anxious and depressed moods, and autoregressive lags are symbolized by arrows
originating and pointing towards the same variable.
33
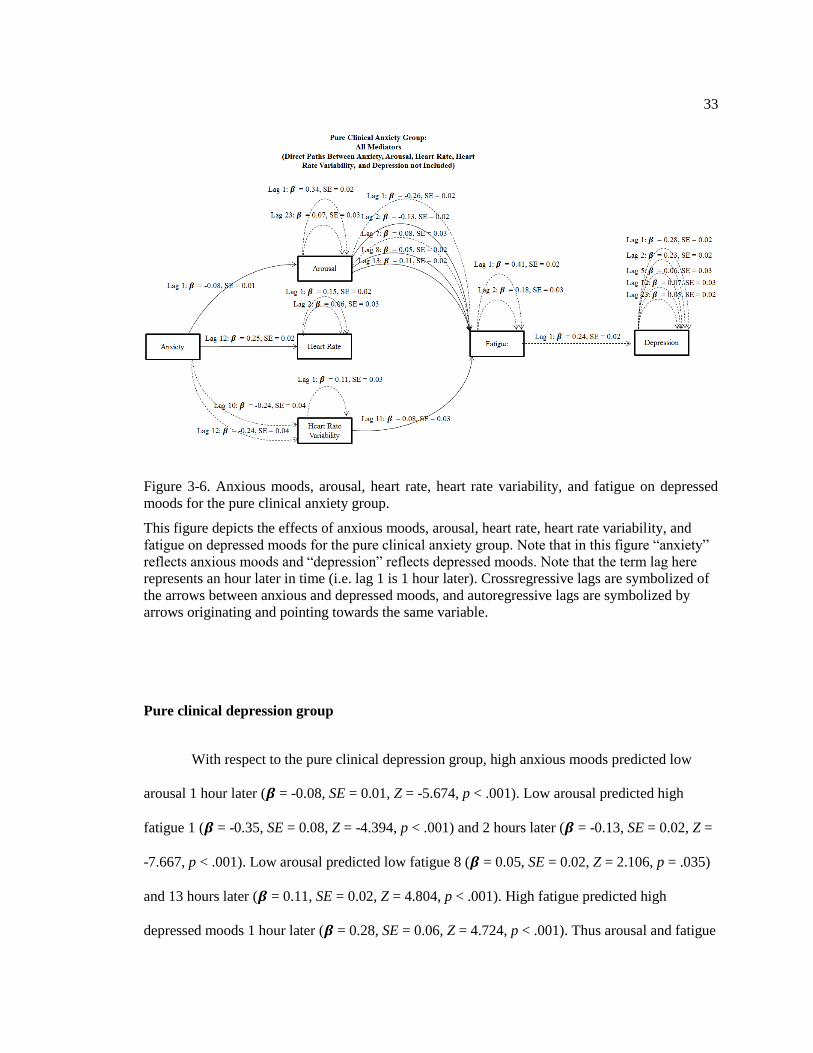
Figure 3-6. Anxious moods, arousal, heart rate, heart rate variability, and fatigue on depressed
moods for the pure clinical anxiety group.
This figure depicts the effects of anxious moods, arousal, heart rate, heart rate variability, and
fatigue on depressed moods for the pure clinical anxiety group. Note that in this figure “anxiety”
reflects anxious moods and “depression” reflects depressed moods. Note that the term lag here
represents an hour later in time (i.e. lag 1 is 1 hour later). Crossregressive lags are symbolized of
the arrows between anxious and depressed moods, and autoregressive lags are symbolized by
arrows originating and pointing towards the same variable.
Pure clinical depression group
With respect to the pure clinical depression group, high anxious moods predicted low
arousal 1 hour later (𝜷 = -0.08, SE = 0.01, Z = -5.674, p < .001). Low arousal predicted high
fatigue 1 (𝜷 = -0.35, SE = 0.08, Z = -4.394, p < .001) and 2 hours later (𝜷 = -0.13, SE = 0.02, Z =
-7.667, p < .001). Low arousal predicted low fatigue 8 (𝜷 = 0.05, SE = 0.02, Z = 2.106, p = .035)
and 13 hours later (𝜷 = 0.11, SE = 0.02, Z = 4.804, p < .001). High fatigue predicted high
depressed moods 1 hour later (𝜷 = 0.28, SE = 0.06, Z = 4.724, p < .001). Thus arousal and fatigue
34
formed a mediational chain to explain a positive relationship between anxious and depressed
moods 3 and 4 hours later. Additionally, the results suggested that arousal and fatigue also
mediated a negative relationship between anxious and depressed moods 10 and 15 hours later, as
high anxious moods predicted low arousal, low arousal predicted low fatigue, and low fatigue
predicted low depressed moods.
High anxious moods also predicted high heart rate 4 (𝜷 = 0.18, SE = 0.07, Z = 2.518, p =
.012) and 12 hours later (𝜷 = 0.25, SE = 0.02, Z = 14.622, p < .001). High heart rate predicted
high fatigue 18 hours later (𝜷 = 0.37, SE = 0.09, Z = 4.170, p < .001). High fatigue predicted high
depressed moods 1 hour later (𝜷 = 0.28, SE = 0.06, Z = 4.724, p < .001). Therefore, heart rate and
fatigue mediated a significantly positive relationship between anxious and depressed moods 23
and 31 hours later.
High anxious moods predicted high heart rate variability 10 (𝜷 = 0.18, SE = 0.09, Z =
2.066, p = .039) and 12 hours later (𝜷 = 0.54, SE = 0.10, Z = 5.329, p < .001). High heart rate
variability predicted high fatigue 11 hours later (𝜷 = 0.24, SE = 0.11, Z = 2.272, p = .023). High
fatigue predicted high depressed moods 1 hour later (𝜷 = 0.28, SE = 0.06, Z = 4.724, p < .001).
Thus, heart rate variability and fatigue form a mediational chain to explain a positive relationship
between anxious and depressed moods 22 and 24 hours later. See Figures 7-8 for a visual
depiction of these findings.
35
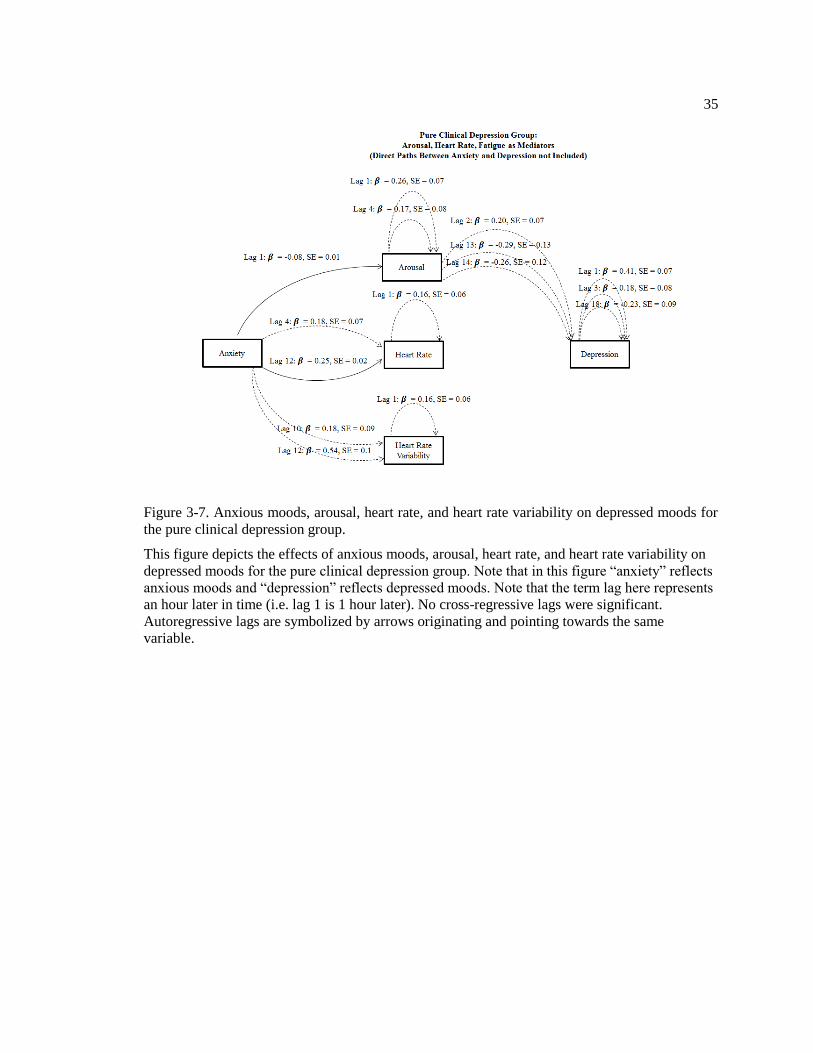
Figure 3-7. Anxious moods, arousal, heart rate, and heart rate variability on depressed moods for
the pure clinical depression group.
This figure depicts the effects of anxious moods, arousal, heart rate, and heart rate variability on
depressed moods for the pure clinical depression group. Note that in this figure “anxiety” reflects
anxious moods and “depression” reflects depressed moods. Note that the term lag here represents
an hour later in time (i.e. lag 1 is 1 hour later). No cross-regressive lags were significant.
Autoregressive lags are symbolized by arrows originating and pointing towards the same
variable.
36
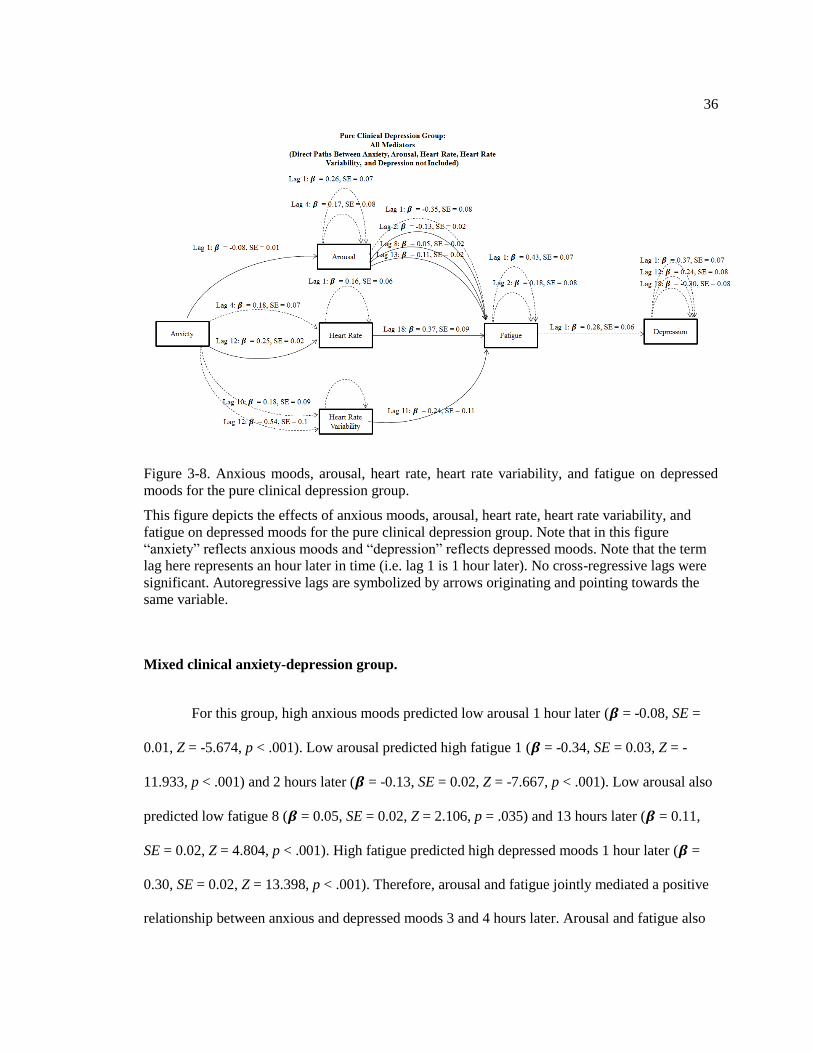
Figure 3-8. Anxious moods, arousal, heart rate, heart rate variability, and fatigue on depressed
moods for the pure clinical depression group.
This figure depicts the effects of anxious moods, arousal, heart rate, heart rate variability, and
fatigue on depressed moods for the pure clinical depression group. Note that in this figure
“anxiety” reflects anxious moods and “depression” reflects depressed moods. Note that the term
lag here represents an hour later in time (i.e. lag 1 is 1 hour later). No cross-regressive lags were
significant. Autoregressive lags are symbolized by arrows originating and pointing towards the
same variable.
Mixed clinical anxiety-depression group.
For this group, high anxious moods predicted low arousal 1 hour later (𝜷 = -0.08, SE =
0.01, Z = -5.674, p < .001). Low arousal predicted high fatigue 1 (𝜷 = -0.34, SE = 0.03, Z = -
11.933, p < .001) and 2 hours later (𝜷 = -0.13, SE = 0.02, Z = -7.667, p < .001). Low arousal also
predicted low fatigue 8 (𝜷 = 0.05, SE = 0.02, Z = 2.106, p = .035) and 13 hours later (𝜷 = 0.11,
SE = 0.02, Z = 4.804, p < .001). High fatigue predicted high depressed moods 1 hour later (𝜷 =
0.30, SE = 0.02, Z = 13.398, p < .001). Therefore, arousal and fatigue jointly mediated a positive
relationship between anxious and depressed moods 3 and 4 hours later. Arousal and fatigue also
37
jointly mediated a negative relationship between anxious and depressed moods 10 and 15 hours
later, as high anxious moods predicted low arousal, low arousal predicted delayed low fatigue,
and low fatigue predictd low depressed moods.
High anxious moods predicted low heart rate 4 hours later (𝜷 = -0.06, SE = 0.03, Z = -
2.202, p = .028) and predicted high heart rate 12 hours later (𝜷 = 0.25, SE = 0.02, Z = 14.622, p <
.001). Heart rate did not significantly predict fatigue or depressed moods. Thus for the mixed
clinical anxiety-depression group, heart rate did not mediate the relationship between anxious and
depressed moods.
High anxious moods predicted low heart rate variability 10 (𝜷 = -0.16, SE = 0.05, Z = -
3.513, p < .001) and 12 hours later (𝜷 = -0.20, SE = 0.05, Z = -3.789, p < .001). However, heart
rate variability did not significantly predict fatigue or depressed moods. As such, heart rate
variability did not mediate the relationship between anxious and depressed moods for the mixed
clinical anxiety-depression group. See Figures 9-10 for a visual depiction of these findings.
38
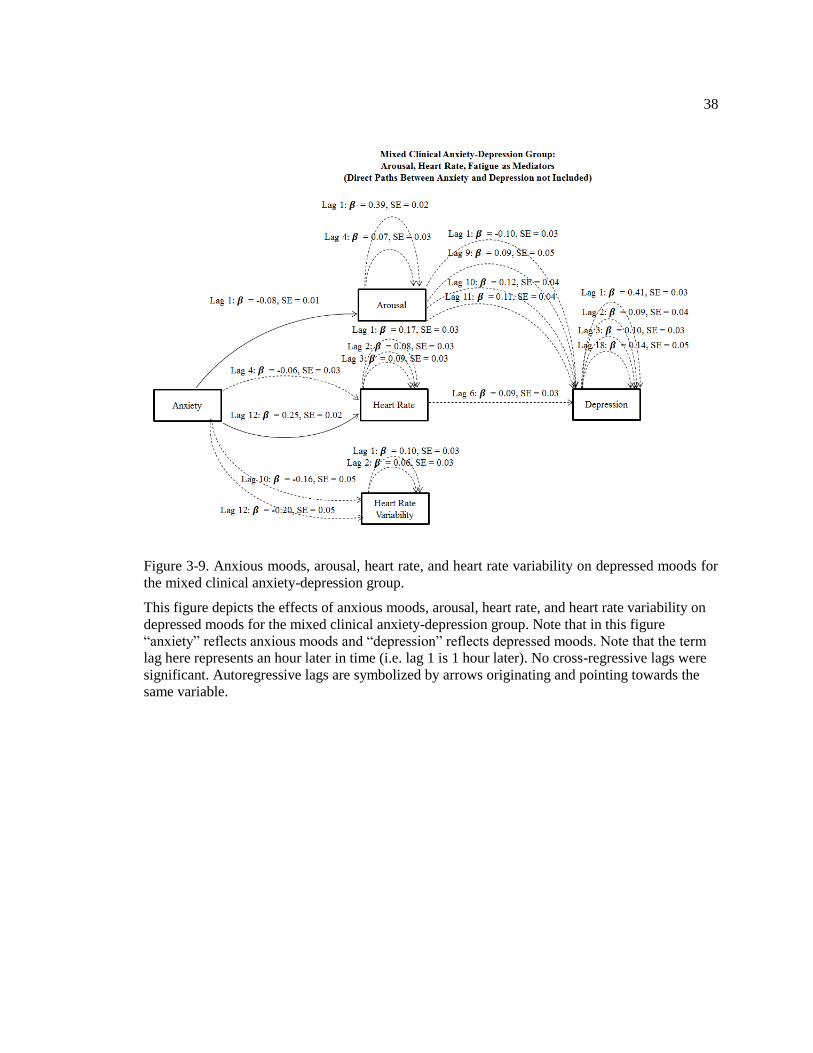
Figure 3-9. Anxious moods, arousal, heart rate, and heart rate variability on depressed moods for
the mixed clinical anxiety-depression group.
This figure depicts the effects of anxious moods, arousal, heart rate, and heart rate variability on
depressed moods for the mixed clinical anxiety-depression group. Note that in this figure
“anxiety” reflects anxious moods and “depression” reflects depressed moods. Note that the term
lag here represents an hour later in time (i.e. lag 1 is 1 hour later). No cross-regressive lags were
significant. Autoregressive lags are symbolized by arrows originating and pointing towards the
same variable.
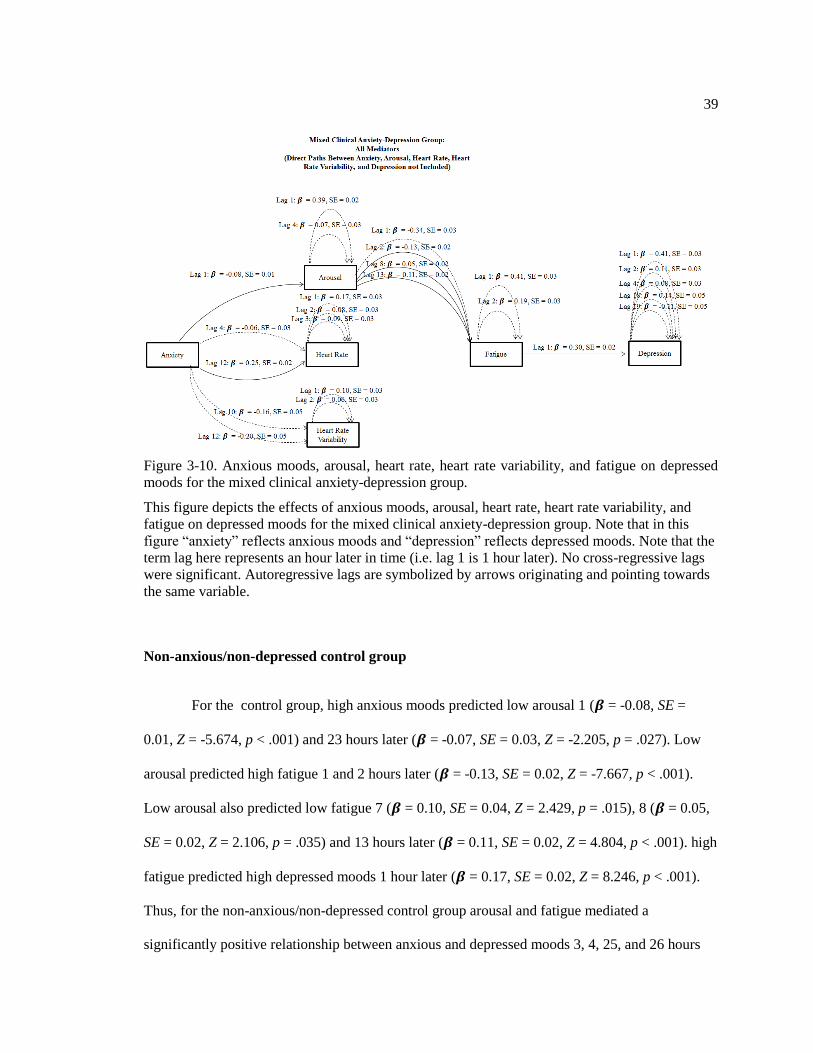
39
Figure 3-10. Anxious moods, arousal, heart rate, heart rate variability, and fatigue on depressed
moods for the mixed clinical anxiety-depression group.
This figure depicts the effects of anxious moods, arousal, heart rate, heart rate variability, and
fatigue on depressed moods for the mixed clinical anxiety-depression group. Note that in this
figure “anxiety” reflects anxious moods and “depression” reflects depressed moods. Note that the
term lag here represents an hour later in time (i.e. lag 1 is 1 hour later). No cross-regressive lags
were significant. Autoregressive lags are symbolized by arrows originating and pointing towards
the same variable.
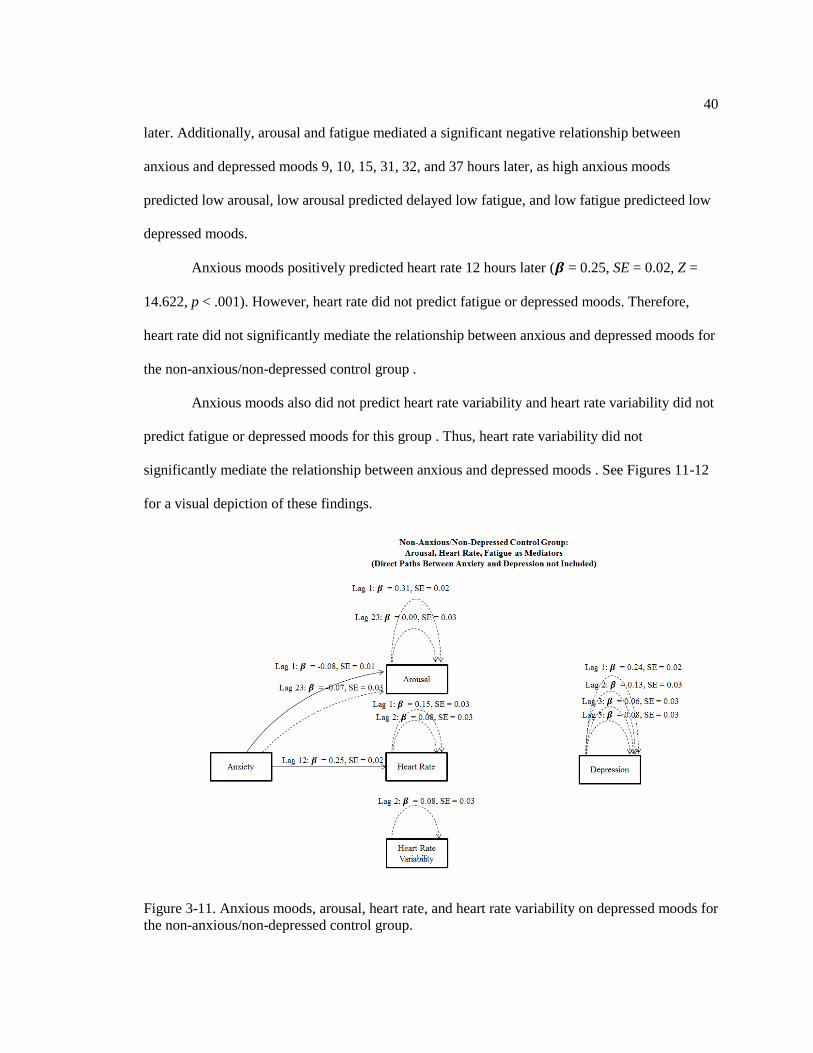
Non-anxious/non-depressed control group
For the control group, high anxious moods predicted low arousal 1 (𝜷 = -0.08, SE =
0.01, Z = -5.674, p < .001) and 23 hours later (𝜷 = -0.07, SE = 0.03, Z = -2.205, p = .027). Low
arousal predicted high fatigue 1 and 2 hours later (𝜷 = -0.13, SE = 0.02, Z = -7.667, p < .001).
Low arousal also predicted low fatigue 7 (𝜷 = 0.10, SE = 0.04, Z = 2.429, p = .015), 8 (𝜷 = 0.05,
SE = 0.02, Z = 2.106, p = .035) and 13 hours later (𝜷 = 0.11, SE = 0.02, Z = 4.804, p < .001). high
fatigue predicted high depressed moods 1 hour later (𝜷 = 0.17, SE = 0.02, Z = 8.246, p < .001).
Thus, for the non-anxious/non-depressed control group arousal and fatigue mediated a
significantly positive relationship between anxious and depressed moods 3, 4, 25, and 26 hours
40
later. Additionally, arousal and fatigue mediated a significant negative relationship between
anxious and depressed moods 9, 10, 15, 31, 32, and 37 hours later, as high anxious moods
predicted low arousal, low arousal predicted delayed low fatigue, and low fatigue predicteed low
depressed moods.
Anxious moods positively predicted heart rate 12 hours later (𝜷 = 0.25, SE = 0.02, Z =
14.622, p < .001). However, heart rate did not predict fatigue or depressed moods. Therefore,
heart rate did not significantly mediate the relationship between anxious and depressed moods for
the non-anxious/non-depressed control group .
Anxious moods also did not predict heart rate variability and heart rate variability did not
predict fatigue or depressed moods for this group . Thus, heart rate variability did not
significantly mediate the relationship between anxious and depressed moods . See Figures 11-12
for a visual depiction of these findings.
Figure 3-11. Anxious moods, arousal, heart rate, and heart rate variability on depressed moods for
the non-anxious/non-depressed control group.
41
This figure depicts the effects of anxious moods, arousal, heart rate, and heart rate variability on
depressed moods for the mixed clinical anxiety-depression group. Note that in this figure
“anxiety” reflects anxious moods and “depression” reflects depressed moods. Note that the term
lag here represents an hour later in time (i.e. lag 1 is 1 hour later). Crossregressive lags are
symbolized of the arrows between anxious and depressed moods, and autoregressive lags are
symbolized by arrows originating and pointing towards the same variable.
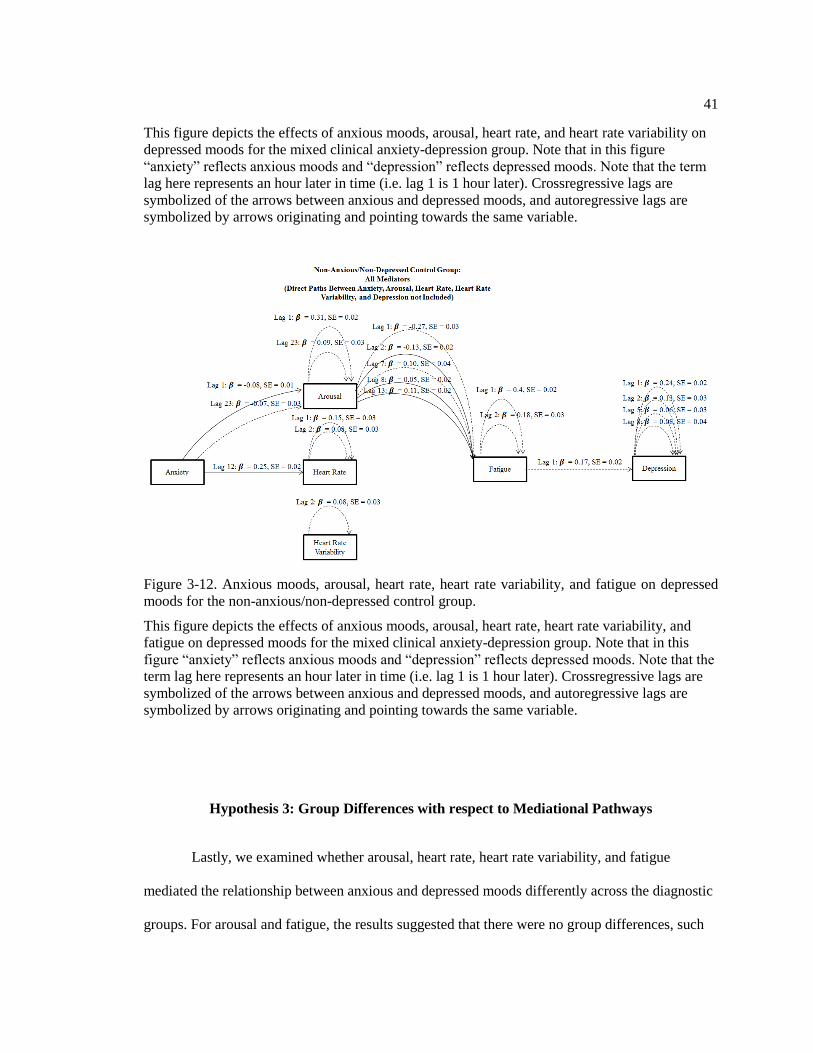
Figure 3-12. Anxious moods, arousal, heart rate, heart rate variability, and fatigue on depressed
moods for the non-anxious/non-depressed control group.
This figure depicts the effects of anxious moods, arousal, heart rate, heart rate variability, and
fatigue on depressed moods for the mixed clinical anxiety-depression group. Note that in this
figure “anxiety” reflects anxious moods and “depression” reflects depressed moods. Note that the
term lag here represents an hour later in time (i.e. lag 1 is 1 hour later). Crossregressive lags are
symbolized of the arrows between anxious and depressed moods, and autoregressive lags are
symbolized by arrows originating and pointing towards the same variable.
Hypothesis 3: Group Differences with respect to Mediational Pathways
Lastly, we examined whether arousal, heart rate, heart rate variability, and fatigue
mediated the relationship between anxious and depressed moods differently across the diagnostic
groups. For arousal and fatigue, the results suggested that there were no group differences, such
42
that for all groups high anxious moods predicted low arousal, low arousal predicted immediate
high fatigue and delayed low fatigue, and high fatigue predicted high depressed moods.
However, there were group differences in the mediational pathways for heart rate and
fatigue. Specifically, both heart rate and fatigue only significantly mediated the relationship
between anxious and depressed mood for the pure clinical depression group. Additionally, heart
rate directly mediated the relationship between anxious and depressed mood only for the pure
clinical anxious group.
Lastly, there were significant group differences in the mediational pathway for heart rate
variability and fatigue. For the pure clinical depression group, high anxious moods predicted high
heart rate variability, high heart rate variability predicted high fatigue, and high fatigue predicted
high depressed moods. In contrast, for the pure clinical anxiety group, high anxious moods
predicted low heart rate variability, low heart rate variability predicted low fatigue, and low
fatigue predicted low depressed moods. Thus, heart rate variability mediated a positive
relationship between anxious and depressed moods for the pure clinical depression group,
whereas it mediated a negative relationship between anxious and depressed moods for the pure
clinical anxiety group. See Table 3 for a comprehensive list of all the findings between groups.
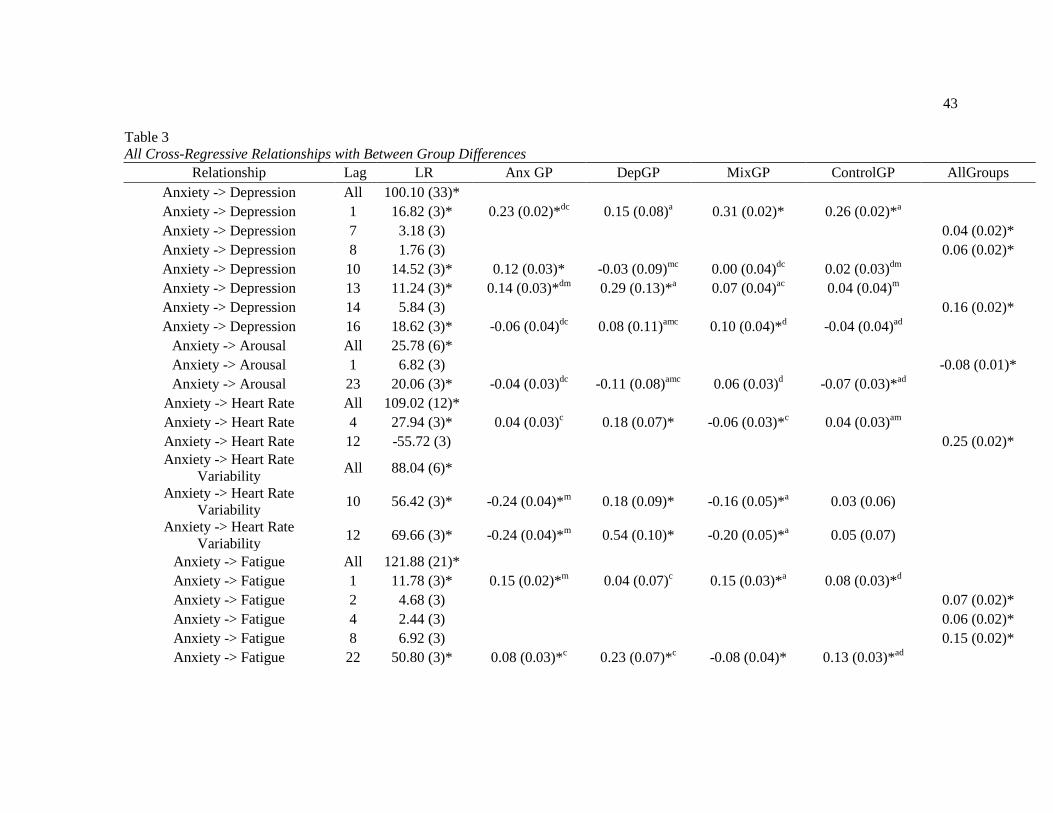
43
Table 3
All Cross-Regressive Relationships with Between Group Differences
Relationship Lag LR Anx GP DepGP MixGP ControlGP AllGroups
Anxiety -> Depression All 100.10 (33)*
Anxiety -> Depression 1 16.82 (3)* 0.23 (0.02)*dc
0.15 (0.08)a 0.31 (0.02)* 0.26 (0.02)*
a
Anxiety -> Depression 7 3.18 (3)
0.04 (0.02)*
Anxiety -> Depression 8 1.76 (3)
0.06 (0.02)*
Anxiety -> Depression 10 14.52 (3)* 0.12 (0.03)* -0.03 (0.09)mc
0.00 (0.04)dc
0.02 (0.03)dm
Anxiety -> Depression 13 11.24 (3)* 0.14 (0.03)*dm
0.29 (0.13)*a 0.07 (0.04)
ac 0.04 (0.04)
m
Anxiety -> Depression 14 5.84 (3)
0.16 (0.02)*
Anxiety -> Depression 16 18.62 (3)* -0.06 (0.04)dc
0.08 (0.11)amc
0.10 (0.04)*d -0.04 (0.04)
ad
Anxiety -> Arousal All 25.78 (6)*
Anxiety -> Arousal 1 6.82 (3)
-0.08 (0.01)*
Anxiety -> Arousal 23 20.06 (3)* -0.04 (0.03)dc
-0.11 (0.08)amc
0.06 (0.03)d -0.07 (0.03)*
ad
Anxiety -> Heart Rate All 109.02 (12)*
Anxiety -> Heart Rate 4 27.94 (3)* 0.04 (0.03)
c 0.18 (0.07)* -0.06 (0.03)*
c 0.04 (0.03)
am
Anxiety -> Heart Rate 12 -55.72 (3)
0.25 (0.02)*
Anxiety -> Heart Rate
Variability All 88.04 (6)*
Anxiety -> Heart Rate
Variability 10 56.42 (3)* -0.24 (0.04)*
m 0.18 (0.09)* -0.16 (0.05)*
a 0.03 (0.06)
Anxiety -> Heart Rate
Variability 12 69.66 (3)* -0.24 (0.04)*
m 0.54 (0.10)* -0.20 (0.05)*
a 0.05 (0.07)
Anxiety -> Fatigue All 121.88 (21)*
Anxiety -> Fatigue 1 11.78 (3)* 0.15 (0.02)*m 0.04 (0.07)
c 0.15 (0.03)*
a 0.08 (0.03)*
d
Anxiety -> Fatigue 2 4.68 (3)
0.07 (0.02)*
Anxiety -> Fatigue 4 2.44 (3)
0.06 (0.02)*
Anxiety -> Fatigue 8 6.92 (3)
0.15 (0.02)*
Anxiety -> Fatigue 22 50.80 (3)* 0.08 (0.03)*c 0.23 (0.07)*
c -0.08 (0.04)* 0.13 (0.03)*
ad
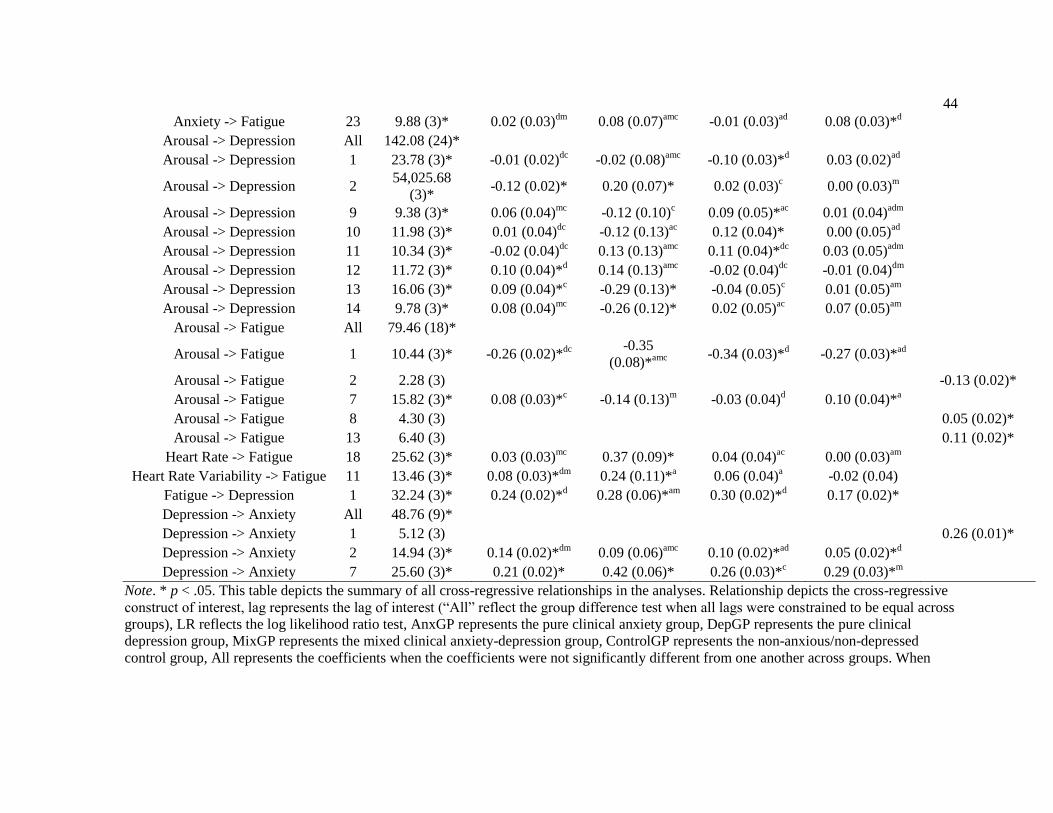
44
Anxiety -> Fatigue 23 9.88 (3)* 0.02 (0.03)dm
0.08 (0.07)amc
-0.01 (0.03)ad
0.08 (0.03)*d
Arousal -> Depression All 142.08 (24)*
Arousal -> Depression 1 23.78 (3)* -0.01 (0.02)
dc -0.02 (0.08)
amc -0.10 (0.03)*
d 0.03 (0.02)
ad
Arousal -> Depression 2 54,025.68
(3)* -0.12 (0.02)* 0.20 (0.07)* 0.02 (0.03)
c 0.00 (0.03)
m
Arousal -> Depression 9 9.38 (3)* 0.06 (0.04)mc
-0.12 (0.10)c 0.09 (0.05)*
ac 0.01 (0.04)
adm
Arousal -> Depression 10 11.98 (3)* 0.01 (0.04)
dc -0.12 (0.13)
ac 0.12 (0.04)* 0.00 (0.05)
ad
Arousal -> Depression 11 10.34 (3)* -0.02 (0.04)
dc 0.13 (0.13)
amc 0.11 (0.04)*
dc 0.03 (0.05)
adm
Arousal -> Depression 12 11.72 (3)* 0.10 (0.04)*
d 0.14 (0.13)
amc -0.02 (0.04)
dc -0.01 (0.04)
dm
Arousal -> Depression 13 16.06 (3)* 0.09 (0.04)*
c -0.29 (0.13)* -0.04 (0.05)
c 0.01 (0.05)
am
Arousal -> Depression 14 9.78 (3)* 0.08 (0.04)
mc -0.26 (0.12)* 0.02 (0.05)
ac 0.07 (0.05)
am
Arousal -> Fatigue All 79.46 (18)*
Arousal -> Fatigue 1 10.44 (3)* -0.26 (0.02)*dc
-0.35
(0.08)*amc
-0.34 (0.03)*
d -0.27 (0.03)*
ad
Arousal -> Fatigue 2 2.28 (3)
-0.13 (0.02)*
Arousal -> Fatigue 7 15.82 (3)* 0.08 (0.03)*c -0.14 (0.13)
m -0.03 (0.04)
d 0.10 (0.04)*
a
Arousal -> Fatigue 8 4.30 (3)
0.05 (0.02)*
Arousal -> Fatigue 13 6.40 (3)
0.11 (0.02)*
Heart Rate -> Fatigue 18 25.62 (3)* 0.03 (0.03)mc
0.37 (0.09)* 0.04 (0.04)ac
0.00 (0.03)am
Heart Rate Variability -> Fatigue 11 13.46 (3)* 0.08 (0.03)*dm
0.24 (0.11)*a 0.06 (0.04)
a -0.02 (0.04)
Fatigue -> Depression 1 32.24 (3)* 0.24 (0.02)*
d 0.28 (0.06)*
am 0.30 (0.02)*
d 0.17 (0.02)*
Depression -> Anxiety All 48.76 (9)*
Depression -> Anxiety 1 5.12 (3)
0.26 (0.01)*
Depression -> Anxiety 2 14.94 (3)* 0.14 (0.02)*dm
0.09 (0.06)amc
0.10 (0.02)*ad
0.05 (0.02)*d
Depression -> Anxiety 7 25.60 (3)* 0.21 (0.02)* 0.42 (0.06)* 0.26 (0.03)*
c 0.29 (0.03)*
m
Note. * p < .05. This table depicts the summary of all cross-regressive relationships in the analyses. Relationship depicts the cross-regressive
construct of interest, lag represents the lag of interest (“All” reflect the group difference test when all lags were constrained to be equal across
groups), LR reflects the log likelihood ratio test, AnxGP represents the pure clinical anxiety group, DepGP represents the pure clinical
depression group, MixGP represents the mixed clinical anxiety-depression group, ControlGP represents the non-anxious/non-depressed
control group, All represents the coefficients when the coefficients were not significantly different from one another across groups. When
45
there were significant differences, individual coefficients from the unconstrained model, and individual differences between groups were
tested by constraining two relationships to be different. The superscripts: a (for pure clinical anxiety), d (for the pure clinical depression), m
(for the mixed clinical anxiety group), and c (for the non-anxious non-depressed control group) represent that the reference group was not
significantly different from the other group.
46
Chapter 4
Discussion
Supporting my first hypothesis and consistent with previous research (Starr & Davila,
2011; Swendsen, 1998), these results suggested that anxious moods positively predicted
depressed moods multiple times within a day. Given that the relationships controlled for the
effect of depressed moods on themselves, anxious moods appear to have an important and
powerful role in predicting depressed moods for all groups. Thus, anxious moods are a short-term
risk factor for depressed moods for those with pure clinical anxiety, pure clinical depression,
mixed clinical anxiety-depression, and non-anxious/non-depressed controls.
Contrary to research showing that anxious moods were unidirectional predictors of later
depressed moods (Starr & Davila, 2011; Swendsen, 1998), we found a bidirectional relationship
for all four diagnostic groups. Thus, any increase in one mood was followed by a subsequent
increase in the other. Notably, the strength of anxious moods on depressed moods was greater
than the strength of depressed moods on anxious moods. Consequently, a variation in anxious
moods is a more powerful influence than a variation in depressed moods in this bi-directional
relationship.
In addition to demonstrating direct pathways between anxious and depressed moods, I
also identified common mechanisms for this relationship across diagnostic groups. Supporting my
second hypothesis and consistent with the theory of Akiskal (1985), perceived arousal and fatigue
mediated the prospective positive relationship between anxious and depressed moods for all
groups. However, our results were slightly divergent from what I originally hypothesized and
what would be predicted by Akiskal as high anxious moods were associated with later low
47
perceived arousal, low perceived arousal was shortly followed by high fatigue, and high fatigue
was associated with later high depressed moods for all groups. Also, in contrast to my second
hypothesis and with a slight variation to Akiskal’s (1985) theory, perceived arousal and fatigue
mediated a significantly negative relationship between anxious and depressed moods that
occurred later in time, showing that low perceived arousal first predicted more fatigue and more
depression but later predicted less fatigue and less depression.
Although the negative relationship beween anxious moods and perceived arousal was
inconsistent with Akiskal’s theory, an association between anxious moods and subsequent low
perceived arousal has been theorized by Thayer (1989). However, Thayer suggests that whereas
high anxious moods are associated with low perceived arousal, high anxious moods predict
subsequent increases in objectively measured physiological arousal. Thayer theorizes that, upon
experiencing anxious moods, persons immediately feel as if they have low energy levels. He
suggests that this feeling occurs due to individuals shifting their attention to perceived dangers
after the onset of anxious moods. Specifically, Thayer reasons that this attentional shift coincides
with not only individuals’ thoughts that the perceived danger will require a large amount of
energy to solve the problem, but also individuals feeling unable to summon enough energy to
solve the instant problem. Consequently, although the results partially contrast Akiskal’s
hypothesis, Thayer has provided theoretical backing for these findings.
As predicted by Thayer, the heart rate findings diverged from the findings for perceived
arousal. Specifically, high anxious moods were associated with later high heart rate across all of
the groups. Also consistent with previous research (Cacioppo, Tassinary, Stonebraker, & Petty,
1987), there was a small positive concurrent relationship between perceived arousal and heart rate
across all groups (with the exception of the pure clinical depression group), suggesting that the
systems of perceived arousal and physiological arousal are largely distinct as there is only 1%
shared variance between perceived arousal and physiological arousal across the groups. Taken
48
together, these results suggest that perceived arousal and physiological arousal are concurrently
independent and that anxious moods have unique relationships with perceived arousal and
physiological arousal over time.
Thayer offers numerous reasons to explain the divergence in how anxious moods predict
perceived arousal and physiological arousal. First, Thayer theorizes that perceived arousal is
defined by one’s potential to become aroused rather than be aroused, and, as such, perceived
arousal may conflict with physiological arousal because perceived arousal does not often
accompany energetic behavior (i.e. thinking one has enough arousal to perform well on a 100
meter dash, but not having the accompanying heart rate that would be associated with this
increase). Thayer secondly explains that perceived arousal is often dictated by perceived societal
norms (i.e. during work you should be active) and reasons that these patterns would not hold for
individuals at young ages before they are socialized to adopt societal norms. Thus, Thayer
theorizes that social conventions negatively impact an individual’s ability to accurately predict
his/her arousal. Thayer’s third reason as to why perceived arousal and heart rate diverge is that
perceived arousal may combine multiple separate systems of arousal, including muscle tension,
heart rate, breathe rate, and perspiration. Lastly, Thayer states that one may not perceive changes
in arousal because an individual’s attentions shift as a result of distractions in his/her
environment, and, consequently, perceived arousal would not correspond to changes in
physiological arousal due to the decrease in accuracy of perceived arousal. Consequently, Thayer
theorizes that perceived arousal would diverge from heart rate as perceived arousal is affected by
societal norms, expectations, distractions, and focus on other independent facets of physiological
activity.
Despite all groups having a positive relationship between anxious moods and heart rate,
there were large differences between the groups as to whether heart rate and fatigue mediated the
relationship between anxious and depressed moods. Namely, heart rate and fatigue jointly
49
mediated the relationship between anxious and depressed moods only for the pure clinical
depression group. Specific to this group, the pattern was as theorized by Akiskal such that high
anxious moods predicted high heart rate, high heart rate predicted high fatigue, and high fatigue
predicted high depressed moods. Paired with the evidence that fatigue levels were higher for the
pure clinical depression group compared to any other group, these findings may suggest that
those with pure clinical depression are more chronically fatigued, and, as such, an increase in
energy expenditure from physiological activity may be more draining for these persons because
they have less energy to begin with (i.e. they run out of fuel because they are almost always
“running on empty”). However, perhaps due to the lower levels of stable fatigue in the other
groups, the results may suggest that the other groups have enough of an energy reserve that
physiological activity does not affect them (i.e. they still have “gas in the tank”).
Partially in line with Akiskal’s (1985) theory, the results also indicated that heart rate
directly mediated the relationship between anxious and depressed moods for the pure clinical
anxiety group, such that high anxious moods were associated with high heart rate, and high heart
rate was associated with high depressed moods. As heart rate did not predict fatigue for the pure
clinical anxiety group, this suggests that for those with pure clinical anxiety, physiological
arousal is directly related to the onset of depressed moods. It is possible that these findings are
due to increases and subsequent decreases in cortisol as cortisol degrades over approximately the
same time period as the relationship between heart rate and depressed moods (Iranmanesh,
Lizarralde, Johnson, & Veldhuis, 1989). Consequently future research should assess if the direct
relationship between heart rate and depressed moods is due to the effects of decreases in
neurotransmitter levels. Paired with the findings for the pure clinical depression group, these
findings suggest that heart rate only mediates the relationship between anxious and depressed
moods for those with pure clinical anxiety and pure clinical depression.
50
Similar to the results for heart rate, there were large between-group differences in heart
rate variability and fatigue mediating the relationship between anxious and depressed moods. For
the pure clinical depression group, both heart rate variability and fatigue mediated a positive
relationship between anxious and depressed moods, supporting my second hypothesis. However,
contrary to this hypothesis, the manner in which heart rate variability and fatigue mediated this
relationship occurred in the opposite direction for the pure clinical depression group. Specifically
for this group, high anxious moods actually predicted high heart rate variability, high heart rate
variability predicted high fatigue, and high fatigue predicted high depressed moods. Thus, the
cross-sectional research that generally shows that low heart rate variability is related to anxiety
(Gorman & Sloan, 2000) does not inform the short-term longitudinal relationship of anxious
moods predicting later heart rate variability. For the pure clinical depression group, these findings
suggest that high heart rate variability aids in the maintenance of the relationship between anxious
and depressed moods.
The findings for heart rate variability and fatigue mediating the relationship between
anxious and depressed moods for the clinical anxiety group were different than what was found
for the pure clinical depression group. For this group, and consistent with the research (e.g.,
Gorman & Sloan) high anxious moods predicted low heart rate variability, thereby mediating a
negative relationship between anxious and depressed moods. Given that heart rate variability was
associated with itself over time for both the pure clinical anxiety group and the pure clinical
depression group, these findings may suggest that anxious moods can predict stable low or high
heart rate variability depending on whether one has pure clinical anxiety or pure clinical
depression. Further, lower heart rate variability predicts low fatigue and depressed moods.
Nonetheless, since this study did not examine the relationship between heart rate variability and
later anxious moods, it is possible that low heart rate variability is a risk factor for later anxious
moods. Consequently, those with pure clinical anxiety experience less fatigue and depressed
51
moods by maintaining a stable heart rate, and those with pure clinical depression put themselves
at a greater risk for later fatigue and depressed moods by having an unstable heart rate.
Differences in rigidity may explain the differential relationship between anxious moods
and heart rate variability for the pure clinical anxiety group compared to the pure clinical
depression group. Namely, those with anxiety disorders have been hypothesized to maintain a
state of rigidity, wherein persons with anxiety disorders do not react to environmental situations
because they adhere to the rigid patterns within their daily lives (Newman, Llera, Erickson,
Przeworski, & Castonguay, 2013). Others have also found that people with anxiety disorders tend
to have a high stable heart rate (Newman et al., 2013). In contrast to anxiety disorders, individuals
with depressive disorders have been theorized to possess overflexibility in mood (i.e. “lability”)
(Roberts & Kassel, 1997). As heart rate variability has been theorized to be a measure of
autonomic rigidity (Appelhans & Luecken, 2006), these findings may support the notion that
when persons with pure anxiety disorders experience high anxious moods, they react with
increased rigidity, whereas those with pure depressive disorders react with increased flexibility.
Regarding group differences in how anxious moods predicted depressed moods, the
pattern of the results may also suggest there are both common and specific mediators for the
groups due to the pattern of when anxious moods predict depressed moods (and vice versa).
Group similarities and differences in when anxious moods predict depressed moods are important
as they may imply that some mechanisms are overlapping and some are specific to each group. It
is possible that common times of anxious moods predicting depressed moods across groups
reflect common mechanisms between anxious and depressed moods that unfold over the same
course of time for all groups. However, times that are specific to certain groups may also suggest
that there are unique mechanisms of how anxious moods predict depressed moods for different
diagnostic groups. Given these findings, future research should evaluate other mechanisms
between anxious and depressed moods that may include behavior (i.e. avoidance), emotions (i.e.
52
valence versus arousal focus), cognitions (i.e. helplessness and hopelessness, perseverative
negative thinking), and other potential mediators of this relationship as each of these potential
mediators may influence this relationship over different time courses.
Despite the strengths of the current study, there are also limitations. Firstly, I did not
measure anxiety and depressive disorders using clinical interviews. Secondly, the participants
may not be representative of the general population given that they were selected from an
undergraduate sample, and it is possible that students may have unique relationships between
anxious and depressed moods due to college lifestyle characteristics. Further research should
examine these relationships with a clinical interview and include individuals from the general
population. Due to the emphasis on ecological validity, the results sacrificed experimental
control. Consequently, future research should examine whether anxious moods are actually a
cause of depressed moods by applying an experimental manipulation to examine whether
perturbations in anxious moods are associated with increases in later depressed moods. Future
studies should also examine other potential mediators to explain the relationship between anxious
and depressed moods.
53
References
Adams, R. E., & Boscarino, J. A. (2011). Perievent panic attack and depression after the
World Trade Center disaster: A structural equation model analysis. International
Journal of Emergency Mental Health, 13, 69-79.
Aderka, I. M., Weisman, O., Shahar, G., & Gilboa-Schechtman, E. (2004). The
relationship of peer victimization to social anxiety and loneliness in adolescent
females. Journal of Adolescence, 27, 351-362.
doi:10.1016/j.adolescence.2004.03.003
Akiskal, H. S. (1985). Anxiety: definition, relationship to depression, and proposal for an
integrative model. In H. Tuma & J. D. Maser (Eds.), Anxiety and the Anxiety
Disorders (pp. 787–797). Hillsdale, NJ.: Lawrence Erlbaum Associates.
Alipour, Z., Lamyian, M., & Hajizadeh, E. (2012). Anxiety and fear of childbirth as
predictors of postnatal depression in nulliparous women. Women and Birth, 25,
e37-43. doi:10.1016/j.wombi.2011.09.002
Allport, G. W. (1942). The use of personal documents in psychological science: Prepared
for the Committee on Appraisal of Research. New York, NY: Social Science
Research Council. doi: 10.1037/11389-000
Alpert, J. E., Fava, M., Uebelacker, L. A., Nierenberg, A. A., Pava, J. A., Worthington, J.
J., & Rosenbaum, J. F. (1999). Patterns of Axis I comorbidity in early-onset
versus late-onset major depressive disorder. Biological Psychiatry, 46, 202-211.
54
Alpert, J. E., Maddocks, A., Rosenbaum, J. F., & Fava, M. (1994). Childhood
psychopathology retrospectively assessed among adults with early onset major
depression. Journal of Affective Disorders, 31, 165-171.
Andrade, L., Eaton, W. W., & Chilcoat, H. D. (1996). Lifetime co-morbidity of panic
attacks and major depression in a population-based study: Age of onset.
Psychological Medicine, 26, 991-996. doi:10.1017/S0033291700035315
Angold, A., Costello, E. J., & Erkanli, A. (1999). Comorbidity. Journal of Child
Psychology and Psychiatry, 40, 57-57-87. doi:10.1111/1469-7610.00424
Appelhans, B. M., & Luecken, L. J. (2006). Heart rate variability as an index of regulated
emotional responding. Review of General Psychology, 10, 229-240.
doi:10.1037/1089-2680.10.3.229
Aronson, T. A., & Logue, C. M. (1987). On the longitudinal course of panic disorder:
Development history and predictors of phobic complications. Comprehensive
Psychiatry, 28, 344-355. doi:10.1016/0010-440X(87)90071-X
Austin, M.-P., Tully, L., & Parker, G. (2007). Examining the relationship between
antenatal anxiety and postnatal depression. Journal of Affective Disorders, 101,
169-174. doi:10.1016/j.jad.2006.11.015
Barlow, D. H., Chorpita, B. F., & Turovsky, J. (1996). Fear, panic, anxiety, and disorders
of emotion. In D. A. Hope (Ed.), Current theory and research in motivation, Vol.
43. (pp. 251-328). Lincoln, NE: University of Nebraska Press.
Bjelland, I., Dahl, A. A., Haug, T. T., & Neckelmann, D. (2002). The validity of the
Hospital Anxiety and Depression Scale: An updated literature review. Journal of
Psychosomatic Research, 52, 69-77. doi:10.1016/S0022-3999(01)00296-3
55
Boker, S., Neale, M., Maes, H., Wilde, M., Spiegel, M., Brick, T., & Fox, J. (2010).
OpenMx: Multipurpose software for statistical modelling. [Computer software
manual]. Retrieved from http://openmx. psyc. virginia. edu
Bolger, N., & Laurenceau, J.-P. (2013). Intensive Longitudinal Methods: An Introduction
to Diary and Experience Sampling Research: Guilford Press.
Bolkhovsky, J. B., Scully, C. G., & Chon, K. H. (2012, Aug. 28 -Sept. 1). Statistical
analysis of heart rate and heart rate variability monitoring through the use of
smart phone cameras. Paper presented at the Annual International Conference of
the IEEE Engineering in Medicine and Biology Society (EMBC), San Diego, CA.
Brosschot, J. F., Van Dijk, E., & Thayer, J. F. (2007). Daily worry is related to low heart
rate variability during waking and the subsequent nocturnal sleep period.
International Journal of Psychophysiology, 63, 39-47.
doi:10.1016/j.ijpsycho.2006.07.016
Brown, C., Schulberg, H. C., Madonia, M. J., Shear, M. K., & Houck, P. R. (1996).
Treatment outcomes for primary care patients with major depression and lifetime
anxiety disorders. American Journal of Psychiatry, 153, 1293-1300.
doi:10.1176/ajp.153.10.1293
Brown, T. A., Campbell, L. A., Lehman, C. L., Grisham, J. R., & Mancill, R. B. (2001).
Current and lifetime comorbidity of the DSM-IV anxiety and mood disorders in a
large clinical sample. Journal of Abnormal Psychology, 110, 585-599.
doi:10.1037/0021-843X.110.4.585
56
Cacioppo, J. T., Tassinary, L. G., Stonebraker, T. B., & Petty, R. E. (1987). Self-report
and cardiovascular measures of arousal: fractionation during residual arousal.
Biological Psychology, 25, 135-151.
Cannon, M. F., & Weems, C. F. (2006). Do anxiety and depression cluster into distinct
groups?: A test of tripartite model predictions in a community sample of youth.
Depression and Anxiety, 23, 453-460. doi:10.1002/da.20215
Chorpita, B. F., Albano, A. M., & Barlow, D. H. (1998). The structure of negative
emotions in a clinical sample of children and adolescents. The Journal of
Abnormal Psychology, 107, 74-85.
Clark, L. A., & Watson, D. (1991). Tripartite model of anxiety and depression:
Psychometric evidence and taxonomic implications. Journal of Abnormal
Psychology, 100, 316-336. doi:10.1037/0021-843X.100.3.316
Cohen, J. B., & Andrade, E. B. (2004). Affective intuition and task-contingent affect
regulation. Journal of Consumer Research, 31, 358-367. doi:10.1086/422114
Corwin, E. J., Brownstead, J., Barton, N., Heckard, S., & Morin, K. (2005). The impact
of fatigue on the development of postpartum depression. Journal of Obstetric,
Gynecologic, and Neonatal Nursing, 34, 577-586.
doi:10.1177/0884217505279997
Crawford, J. R., & Henry, J. D. (2003). The Depression Anxiety Stress Scales (DASS):
Normative data and latent structure in a large non-clinical sample. British Journal
of Clinical Psychology, 42, 111-131. doi:10.1348/014466503321903544
Crofford, L. J. (1998). The hypothalamic-pituitary-adrenal stress axis in fibromyalgia and
chronic fatigue syndrome. Zeitschrift fur Rheumatologie, 57 Suppl 2, 67-71.
57
Dahm, J., Ponsford, J., Wong, D., & Schönberger, M. (2009). Utility of the Depression
Anxiety Stress Scales in assessing depression and anxiety following traumatic
brain injury. Paper presented at the 32nd Australian Association for Cognitive
and Behavior Therapy (AACBT), Perth, Australia.
Eley, T., & Stevenson, J. (1999). Using Genetic Analyses to Clarify the Distinction
Between Depressive and Anxious Symptoms in Children. Journal of Abnormal
Child Psychology, 27, 105-114. doi:10.1023/A:1021947113860
Eley, T., & Stevenson, J. (2000). Specific Life Events and Chronic Experiences
Differentially Associated with Depression and Anxiety in Young Twins. Journal
of Abnormal Child Psychology, 28, 383-394. doi:10.1023/A:1005173127117
Eley, T. C. (1997). General genes: A new theme in developmental psychopathology.
Current Directions in Psychological Science, 6, 90-95. doi:10.1111/1467-
8721.ep11512831
Feldman, L. A. (1995). Valence focus and arousal focus: Individual differences in the
structure of affective experience. Journal of Personality and Social Psychology,
69, 153.
Finlay-Jones, R., & Brown, G. W. (1981). Types of stressful life event and the onset of
anxiety and depressive disorders. Psychological Medicine, 11, 803-815.
doi:10.1017/s0033291700041301
Fleer, J., Sleijfer, D. T., Hoekstra, H. J., Tuinman, M. A., & Hoekstra-Weebers, J. E.
(2005). Prevalence, changes in and correlates of fatigue in the first year after
diagnosis of testicular cancer. Anticancer Research, 25, 4647-4653.
58
Friedman, B. H., & Thayer, J. F. (1998). Autonomic balance revisited: Panic anxiety and
heart rate variability. Journal of Psychosomatic Research, 44, 133-151.
doi:10.1016/S0022-3999(97)00202-X
Gallerani, C. M., Garber, J., & Martin, N. C. (2010). The temporal relation between
depression and comorbid psychopathology in adolescents at varied risk for
depression. Journal of Child Psychology and Psychiatry and Allied Disciplines,
51, 242-249. doi:10.1111/j.1469-7610.2009.02155.x
Goodwin, R. D., & Surgeons, M. (2002). Anxiety disorders and the onset of depression
among adults in the community. Psychological Medicine, 32, 1121-1124.
doi:10.1017/S0033291702005482
Goodyer, I. M., & Altham, P. M. E. (1991). Lifetime exit events and recent social and
family adversities in anxious and depressed school-age children and adolescents
— I. Journal of Affective Disorders, 21, 219-228. doi:10.1016/0165-
0327(91)90001-9
Gorman, J. M., & Sloan, R. P. (2000). Heart rate variability in depressive and anxiety
disorders. American Heart Journal, 140, S77-S83. doi:10.1067/mhj.2000.109981
Hayes, A. F. (2009). Beyond Baron and Kenny: Statistical Mediation Analysis in the
New Millennium. Communication Monographs, 76, 408-420.
doi:10.1080/03637750903310360
Iranmanesh, A. L. I., Lizarralde, G., Johnson, M. L., & Veldhuis, J. D. (1989). Circadian,
ultradian, and episodic release of β-endorphin in men, and its temporal coupling
with cortisol. Journal of Clinical Endocrinology and Metabolism, 68, 1019-1026.
doi:10.1210/jcem-68-6-1019
59
Jacobson, N. C., & Newman, M. G. (2012, November). The temporal relationship
between anxiety and depression: A meta-analysis. Paper presented at the 46th
Annual Association for Behavioral and Cognitive Therapies, National Harbor,
Maryland.
Jacobson, N. C., Chow, S.-M., & Newman, M. G. (2015). The Differential Time-Varying
Effect Model (DTVEM): A Tool for Diagnosing Optimal Measurement and
Modeling Intervals in Intensive Longitudinal Data. Submitted for publication.
Kazdin, A. E., Kraemer, H. C., Kessler, R. C., Kupfer, D. J., & Offord, D. R. (1997).
Contributions of risk-factor research to developmental psychopathology. Clinical
Psychology Review, 17, 375-406.
Kendler, K., Heath, A. C., G., M. N., & J., E. L. (1987). Symptoms of anxiety and
symptoms of depression: Same genes, different environments? Archives of
General Psychiatry, 44, 451-457. doi:10.1001/archpsyc.1987.01800170073010
Kendler, K. S., Neale, M. C., Kessler, R. C., Heath, A. C., & Eaves, L. J. (1992). Major
depression and generalized anxiety disorder. Same genes, (partly) different
environments? Archives of General Psychiatry, 49, 716-722.
doi:10.1001/archpsyc.1992.01820090044008
Kessler, R. C., Stang, P. E., Wittchen, H. U., Ustun, T. B., Roy-Burne, P. P., & Walters,
E. E. (1998). Lifetime panic-depression comorbidity in the National Comorbidity
Survey. Archives of General Psychiatry, 55, 801-808.
doi:10.1001/archpsyc.55.9.801
60
Krohne, H. W., Spaderna, H., Spielberger, C., & Schmukle, S. (2002). The State-Trait
Depression Scales: An international comparison. Anxiety, Stress and Coping, 15,
105-122. doi:10.1080/10615800290028422
Massin, M. M., Derkenne, B., & von Bernuth, G. (1999). Correlations between indices of
heart rate variability in healthy children and children with congenital heart
disease. Cardiology, 91, 109-113. doi:6889
McNair, D., & Heuchert, J. (2005). Profile of Mood States technical update. North
Tonawanda, NY: Multi-Health Systems.
Mitchell, M. C., Burns, N. R., & Dorstyn, D. S. (2008). Screening for depression and
anxiety in spinal cord injury with DASS-21. Spinal Cord, 46, 547-551.
doi:10.1038/sj.sc.3102154
Moore, M. T., Anderson, N. L., Barnes, J. M., Haigh, E. A., & Fresco, D. M. (2013).
Using the GAD-Q-IV to identify generalized anxiety disorder in psychiatric
treatment seeking and primary care medical samples. Journal of Anxiety
Disorders, 28, 25-30. doi:10.1016/j.janxdis.2013.10.009
Morgan, C. D., Wiederman, M. W., & Magnus, R. D. (1998). Discriminant validity of the
SCL-90 dimensions of anxiety and depression. Assessment, 5, 197-201.
doi:10.1177/107319119800500210
Newman, M. G., Llera, S. J., Erickson, T. M., Przeworski, A., & Castonguay, L. G.
(2013). Worry and generalized anxiety disorder: A review and theoretical
synthesis of research on nature, etiology, and treatment. Annual Review of
Clinical Psychology, 9, 275-297. doi:10.1146/annurev-clinpsy-050212-185544
61
Newman, M. G., Zuellig, A. R., Kachin, K. E., Constantino, M. J., Przeworski, A.,
Erickson, T., & Cashman-McGrath, L. (2002). Preliminary reliability and validity
of the generalized anxiety disorder questionnaire-IV: A revised self-report
diagnostic measure of generalized anxiety disorder. Behavior Therapy, 33, 215-
233. doi:10.1016/s0005-7894(02)80026-0
Nilsson, D., Johansson, M., & Frantzich, H. (2009). Evacuation experiment in a road
tunnel: A study of human behaviour and technical installations. Fire Safety
Journal, 44, 458-468. doi:10.1016/j.firesaf.2008.09.009
Norton, S., Cosco, T., Doyle, F., Done, J., & Sacker, A. (2013). The Hospital Anxiety
and Depression Scale: A meta confirmatory factor analysis. Journal of
Psychosomatic Research, 74, 74-81. doi:10.1016/j.jpsychores.2012.10.010
Olfson, M., Fireman, B., Weissman, M., Leon, A. C., Sheehan, D. V., Kathol, R. G., . . .
Farber, L. (1997). Mental disorders and disability among patients in a primary
care group practice. American Journal of Psychiatry, 154, 1734-1740.
doi:10.1176/ajp.154.12.1734
Pfeiffer, P. N., Ganoczy, D., Ilgen, M., Zivin, K., & Valenstein, M. (2009). Comorbid
anxiety as a suicide risk factor among depressed veterans. Depression and
Anxiety, 26, 752-757. doi:10.1002/da.20583
Pillard, R. C., Atkinson, K. I. M. W., & Fisher, S. (1967). The effect of different
preparations on film-induced anxiety. The Psychological Record, 17, 35-41.
Pillard, R. C., & Fisher, S. (1967). Effects of chlordiazepoxide and secobarbital on film-
induced anxiety. Psychopharmacology, 12, 18-23.
62
Roberts, J. E., & Kassel, J. D. (1997). Labile self-esteem, life stress, and depressive
symptoms: Prospective data testing a model of vulnerability. Cognitive Therapy
and Research, 21, 569-589. doi:10.1023/A:1021861503072
Russell, J. A. (2003). Core affect and the psychological construction of emotion.
Psychological Review, 110, 145-172. doi:10.1037/0033-295X.110.1.145
Scully, C., Jinseok, L., Meyer, J., Gorbach, A. M., Granquist-Fraser, D., Mendelson, Y.,
& Chon, K. H. (2012). Physiological parameter monitoring from optical
recordings with a mobile phone. IEEE Transactions on Biomedical Engineering,
59, 303-306. doi:10.1109/TBME.2011.2163157
Seligman, L. D., & Ollendick, T. H. (1998). Comorbidity of anxiety and depression in
children and adolescents: An integrative review. Clinical Child and Family
Psychology Review, 1, 125-125-144. doi:10.1023/a:1021887712873
Septianto, F. (2014). The'Chopin'Effect? An exploratory study on how musical tempo and
mode influence consumer preferences. (December 8, 2014). Retrieved from
http://ssrn.com/abstract=2535081
Sherbourne, C. D., Wells, K. B., Meredith, L. S., Jackson, C. A., & Camp, P. (1996).
Comorbid anxiety disorder and the functioning and well-being of chronically ill
patients of general medical providers. Archives of General Psychiatry, 53, 889.
doi:10.1001/archpsyc.1996.01830100035005
Shiffman, S., Hufford, M., Hickcox, M., Paty, J. A., Gnys, M., & Kassel, J. D. (1997).
Remember that? A comparison of real-time versus retrospective recall of smoking
lapses. Journal of Consulting and Clinical Psychology, 65, 292-300.
doi:10.1037/0022-006X.65.2.292.a

63
Solhan, M. B., Trull, T. J., Jahng, S., & Wood, P. K. (2009). Clinical assessment of
affective instability: Comparing EMA indices, questionnaire reports, and
retrospective recall. Psychological Assessment, 21, 425-436.
doi:10.1037/a0016869
Spielberger, C. D., Gorsuch, R. L., Lushene, R., Vagg, P. R., & Jacobs, G. A. (1983).
Manual for the State-Trait Anxiety Inventory STAI (Form Y). Palo Alto, CA: Mind
Garden.
Starr, L. R., & Davila, J. (2011). Temporal patterns of anxious and depressed mood in
generalized anxiety disorder: A daily diary study. Behaviour Research and
Therapy, 50, 131-141. doi:10.1016/j.brat.2011.11.005
Steptoe, A., & Cox, S. (1988). Acute effects of aerobic exercise on mood. Health
Psychology, 7, 329-340. doi:10.1037/0278-6133.7.4.329
Stone, A. A., Broderick, J. E., Shiffman, S. S., & Schwartz, J. E. (2004). Understanding
recall of weekly pain from a momentary assessment perspective: absolute
agreement, between- and within-person consistency, and judged change in weekly
pain. Pain, 107, 61-69. doi:10.1016/j.pain.2003.09.020
Swendsen, J. D. (1998). The helplessness–hopelessness theory and daily mood
experience: An idiographic and cross-situational perspective. Journal of
Personality and Social Psychology, 74, 1398-1408. doi:10.1037/0022-
3514.74.5.1398
Swendsen, J. D. (1997). Anxiety, depression, and their comorbidity: An experience
sampling test of the helplessness-hopelessness theory. Cognitive Therapy and
Research, 21, 97-114. doi:Doi 10.1023/A:1021872410824
64
Tellegen, A. (1985). Structures of mood and personality and their relevance to assessing
anxiety, with an emphasis on self-report. In A. H. Tuma & J. D. Maser (Eds.),
Anxiety and the anxiety disorders (pp. 681-706). Hillsdale, NJ, England:
Lawrence Erlbaum Associates, Inc.
Thapar, A., & McGuffin, P. (1997). Anxiety and Depressive Symptoms in Childhood–A
Genetic Study of Comorbidity. Journal of Child Psychology and Psychiatry, 38,
651-656. doi:10.1111/j.1469-7610.1997.tb01692.x
Thayer, R. (1989). Arousal: A basic element of mood and behavior. The biopsychology of
mood and arousal (pp. 46-66). New York, NY: Oxford University Press.
Van Ameringen, M., Mancini, C., Styan, G., & Donison, D. (1991). Relationship of
social phobia with other psychiatric illness. Journal of Affective Disorders, 21,
93-99. doi:10.1016/0165-0327(91)90055-W
van den Brink, M., Bandell-Hoekstra, E. N., & Abu-Saad, H. H. (2001). The occurrence
of recall bias in pediatric headache: a comparison of questionnaire and diary data.
Headache, 41, 11-20.
Viana, A. G., & Rabian, B. (2009). Fears of cognitive dyscontrol and publicly observable
anxiety symptoms: Depression predictors in moderate-to-high worriers. Journal
of Anxiety Disorders, 23, 1126-1126-1131. doi:10.1016/j.janxdis.2009.07.017
Watson, D., Weber, K., Assenheimer, J. S., Clark, L. A., Strauss, M. E., & McCormick,
R. A. (1995). Testing a tripartite model: I. Evaluating the convergent and
discriminant validity of anxiety and depression symptom scales. Journal of
Abnormal Psychology, 104, 3-14. doi:10.1037/0021-843X.104.1.3
65
Wetherell, J. (2013). Android Heart Rate Monitor. Retrieved from
https://code.google.com/p/android-heart-rate-monitor/
Wheeler, L., & Reis, H. T. (1991). Self-Recording of Everyday Life Events: Origins,
Types, and Uses. Journal of Personality, 59, 339-354. doi:10.1111/j.1467-
6494.1991.tb00252.x
Wood, S. (2014). Package 'mgcv'.
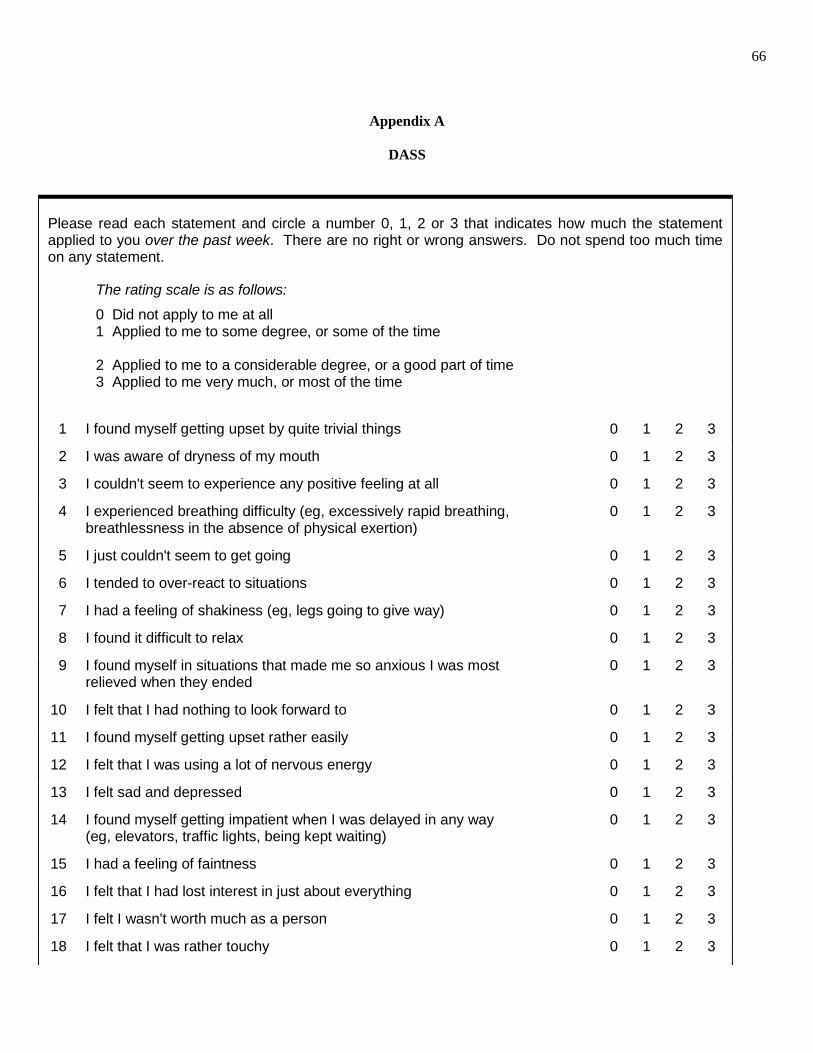
66
Appendix A
DASS
Please read each statement and circle a number 0, 1, 2 or 3 that indicates how much the statement applied to you over the past week. There are no right or wrong answers. Do not spend too much time on any statement.
The rating scale is as follows:
0 Did not apply to me at all 1 Applied to me to some degree, or some of the time
2 Applied to me to a considerable degree, or a good part of time 3 Applied to me very much, or most of the time
1 I found myself getting upset by quite trivial things 0 1 2 3
2 I was aware of dryness of my mouth 0 1 2 3
3 I couldn't seem to experience any positive feeling at all 0 1 2 3
4 I experienced breathing difficulty (eg, excessively rapid breathing, breathlessness in the absence of physical exertion)
0 1 2 3
5 I just couldn't seem to get going 0 1 2 3
6 I tended to over-react to situations 0 1 2 3
7 I had a feeling of shakiness (eg, legs going to give way) 0 1 2 3
8 I found it difficult to relax 0 1 2 3
9 I found myself in situations that made me so anxious I was most relieved when they ended
0 1 2 3
10 I felt that I had nothing to look forward to 0 1 2 3
11 I found myself getting upset rather easily 0 1 2 3
12 I felt that I was using a lot of nervous energy 0 1 2 3
13 I felt sad and depressed 0 1 2 3
14 I found myself getting impatient when I was delayed in any way (eg, elevators, traffic lights, being kept waiting)
0 1 2 3
15 I had a feeling of faintness 0 1 2 3
16 I felt that I had lost interest in just about everything 0 1 2 3
17 I felt I wasn't worth much as a person 0 1 2 3
18 I felt that I was rather touchy 0 1 2 3
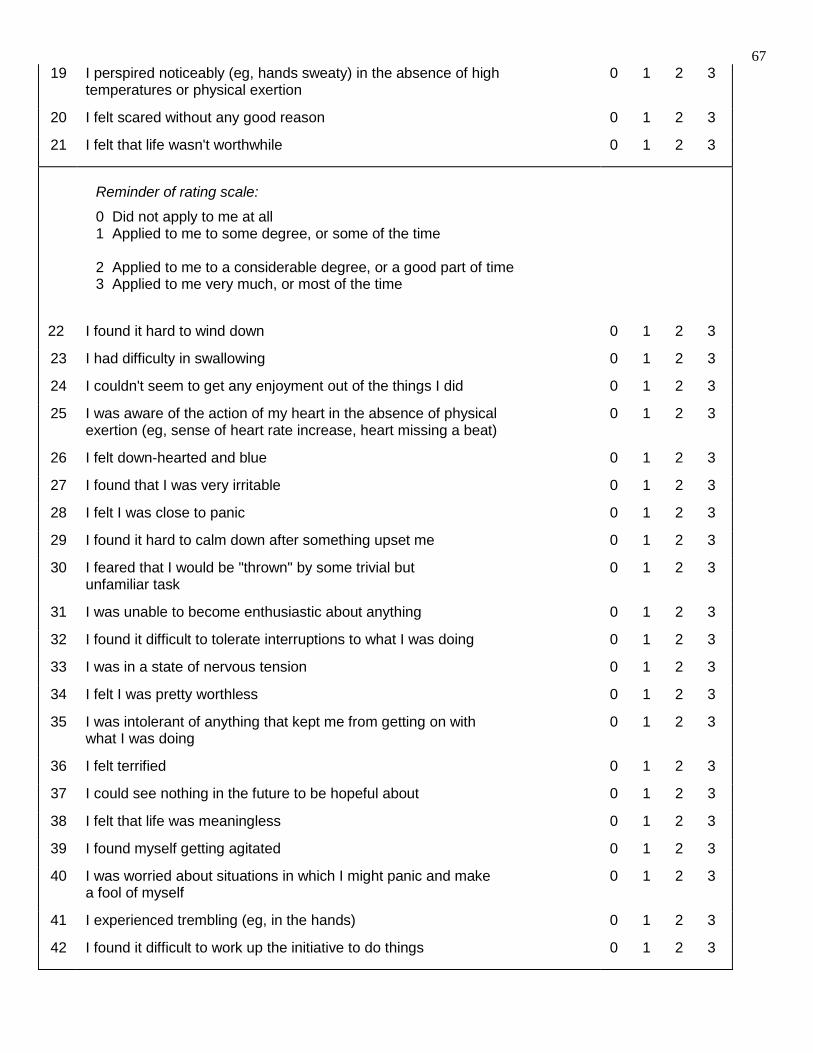
67
19 I perspired noticeably (eg, hands sweaty) in the absence of high temperatures or physical exertion
0 1 2 3
20 I felt scared without any good reason 0 1 2 3
21 I felt that life wasn't worthwhile 0 1 2 3
Reminder of rating scale:
0 Did not apply to me at all 1 Applied to me to some degree, or some of the time
2 Applied to me to a considerable degree, or a good part of time 3 Applied to me very much, or most of the time
22 I found it hard to wind down 0 1 2 3
23 I had difficulty in swallowing 0 1 2 3
24 I couldn't seem to get any enjoyment out of the things I did 0 1 2 3
25 I was aware of the action of my heart in the absence of physical exertion (eg, sense of heart rate increase, heart missing a beat)
0 1 2 3
26 I felt down-hearted and blue 0 1 2 3
27 I found that I was very irritable 0 1 2 3
28 I felt I was close to panic 0 1 2 3
29 I found it hard to calm down after something upset me 0 1 2 3
30 I feared that I would be "thrown" by some trivial but unfamiliar task
0 1 2 3
31 I was unable to become enthusiastic about anything 0 1 2 3
32 I found it difficult to tolerate interruptions to what I was doing 0 1 2 3
33 I was in a state of nervous tension 0 1 2 3
34 I felt I was pretty worthless 0 1 2 3
35 I was intolerant of anything that kept me from getting on with what I was doing
0 1 2 3
36 I felt terrified 0 1 2 3
37 I could see nothing in the future to be hopeful about 0 1 2 3
38 I felt that life was meaningless 0 1 2 3
39 I found myself getting agitated 0 1 2 3
40 I was worried about situations in which I might panic and make a fool of myself
0 1 2 3
41 I experienced trembling (eg, in the hands) 0 1 2 3
42 I found it difficult to work up the initiative to do things 0 1 2 3
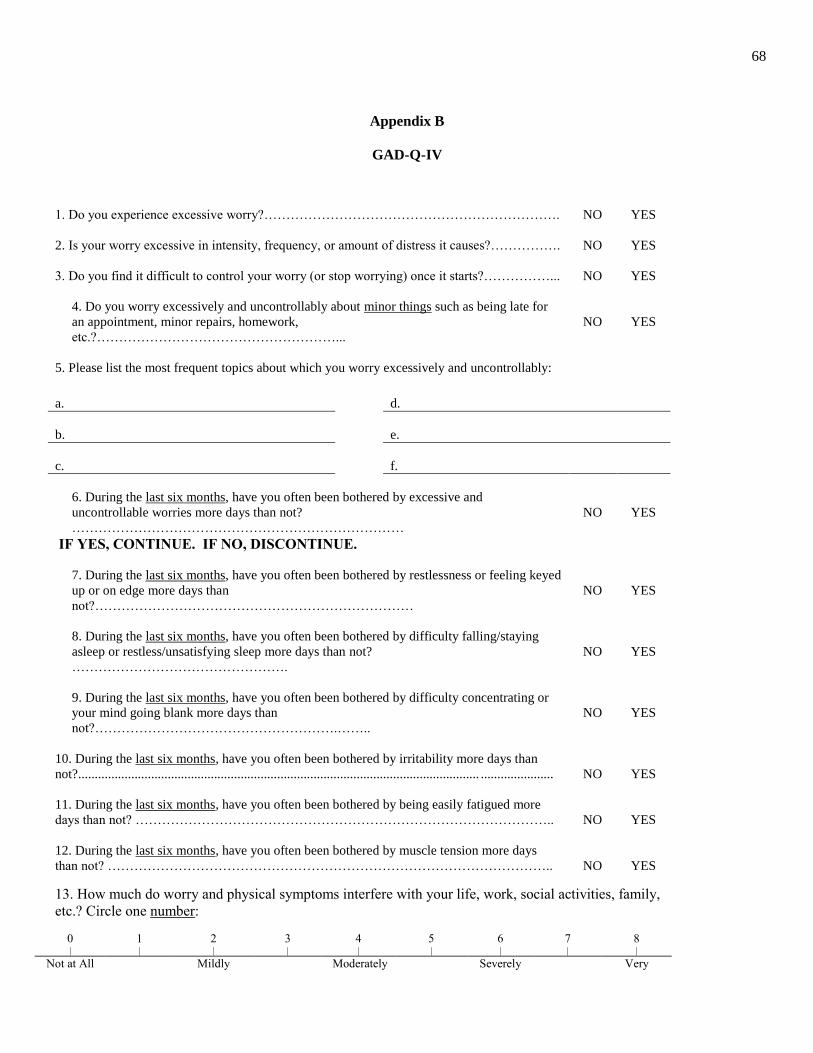
68
Appendix B
GAD-Q-IV
1. Do you experience excessive worry?…………………………………………………………. NO YES
2. Is your worry excessive in intensity, frequency, or amount of distress it causes?…………….
NO
YES
3. Do you find it difficult to control your worry (or stop worrying) once it starts?……………...
NO
YES
4. Do you worry excessively and uncontrollably about minor things such as being late for
an appointment, minor repairs, homework,
etc.?………………………………………………...
NO
YES
5. Please list the most frequent topics about which you worry excessively and uncontrollably:
a.
d.
b.
e.
c.
f.
6. During the last six months, have you often been bothered by excessive and
uncontrollable worries more days than not?
…………………………………………………………………
NO
YES
IF YES, CONTINUE. IF NO, DISCONTINUE.
7. During the last six months, have you often been bothered by restlessness or feeling keyed
up or on edge more days than
not?………………………………………………………………
NO
YES
8. During the last six months, have you often been bothered by difficulty falling/staying
asleep or restless/unsatisfying sleep more days than not?
………………………………………….
NO
YES
9. During the last six months, have you often been bothered by difficulty concentrating or
your mind going blank more days than
not?……………………………………………….……..
NO
YES
10. During the last six months, have you often been bothered by irritability more days than
not?......................................................................................................................... ......................
NO
YES
11. During the last six months, have you often been bothered by being easily fatigued more
days than not? …………………………………………………………………………………..
NO
YES
12. During the last six months, have you often been bothered by muscle tension more days
than not? ………………………………………………………………………………………..
NO
YES
13. How much do worry and physical symptoms interfere with your life, work, social activities, family,
etc.? Circle one number:
0 1 2 3 4 5 6 7 8 | | | | | | | | |
Not at All Mildly Moderately Severely Very
69
Severely
14. How much are you bothered by worry and physical symptoms (how much distress does it cause
you)? Circle one number:
0 1 2 3 4 5 6 7 8 | | | | | | | | |
No Distress Mild Distress Moderate
Distress
Severe
Distress
Very
Severe
Distress
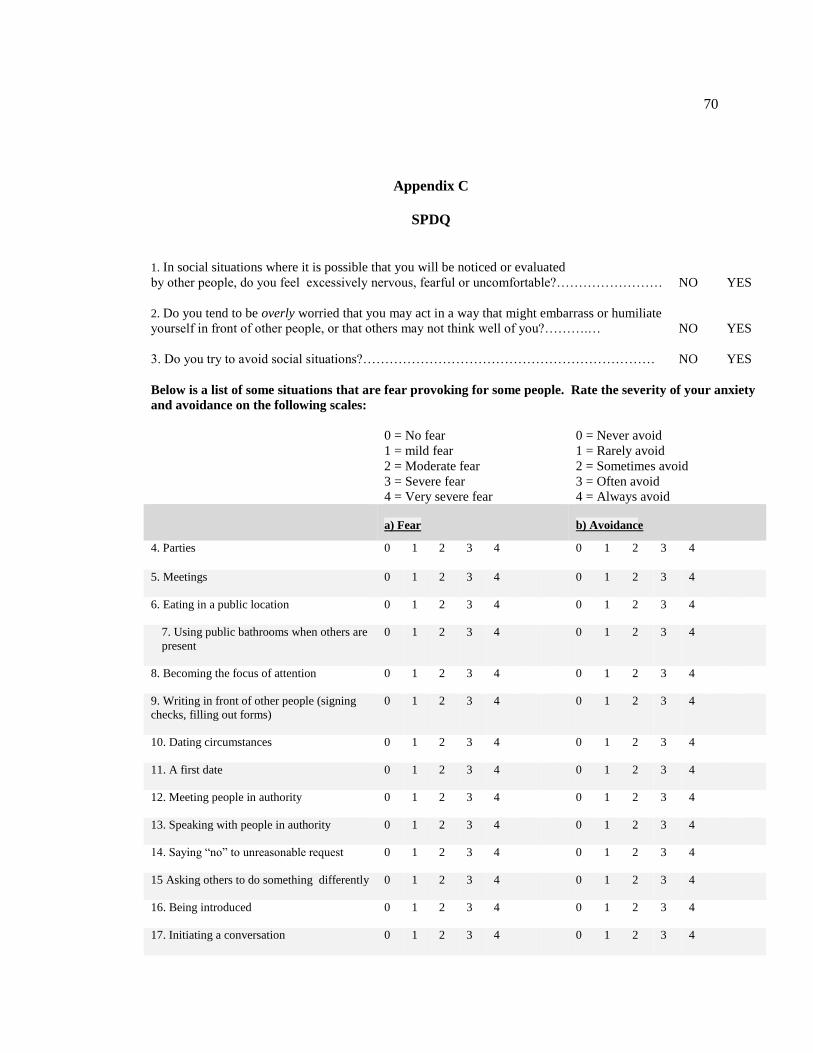
70
Appendix C
SPDQ
1. In social situations where it is possible that you will be noticed or evaluated
by other people, do you feel excessively nervous, fearful or uncomfortable?…………………… NO YES
2. Do you tend to be overly worried that you may act in a way that might embarrass or humiliate
yourself in front of other people, or that others may not think well of you?……….…
NO
YES
3. Do you try to avoid social situations?…………………………………………………………
NO
YES
Below is a list of some situations that are fear provoking for some people. Rate the severity of your anxiety
and avoidance on the following scales:
0 = No fear 0 = Never avoid
1 = mild fear 1 = Rarely avoid
2 = Moderate fear 2 = Sometimes avoid
3 = Severe fear 3 = Often avoid
4 = Very severe fear 4 = Always avoid
a) Fear
b) Avoidance
4. Parties
0 1 2 3 4 0 1 2 3 4
5. Meetings
0 1 2 3 4 0 1 2 3 4
6. Eating in a public location
0 1 2 3 4 0 1 2 3 4
7. Using public bathrooms when others are
present
0 1 2 3 4 0 1 2 3 4
8. Becoming the focus of attention
0 1 2 3 4 0 1 2 3 4
9. Writing in front of other people (signing
checks, filling out forms)
0 1 2 3 4 0 1 2 3 4
10. Dating circumstances
0 1 2 3 4 0 1 2 3 4
11. A first date
0 1 2 3 4 0 1 2 3 4
12. Meeting people in authority
0 1 2 3 4 0 1 2 3 4
13. Speaking with people in authority
0 1 2 3 4 0 1 2 3 4
14. Saying “no” to unreasonable request
0 1 2 3 4 0 1 2 3 4
15 Asking others to do something differently
0 1 2 3 4 0 1 2 3 4
16. Being introduced
0 1 2 3 4 0 1 2 3 4
17. Initiating a conversation
0 1 2 3 4 0 1 2 3 4
71
18. Keeping a conversation going
0 1 2 3 4 0 1 2 3 4
19. Giving a speech
0 1 2 3 4 0 1 2 3 4
20. Using the telephone
0 1 2 3 4 0 1 2 3 4
21. Others judging you
0 1 2 3 4 0 1 2 3 4
22. Being under observation by others
0 1 2 3 4 0 1 2 3 4
23. Being teased
0 1 2 3 4 0 1 2 3 4
24. Do you tend to experience fear each time you are in feared social
situations………………… NO YES
25. Does the fear come on as soon as you encounter feared social
situations?……….………….
NO
YES
26. Would you say that your social fear is excessive or
unreasonable?…………………………..
NO
YES
27. Circle the degree to which your social fear interferes with your life, work, social activities, family, etc?
0 1 2 3 4 5 6 7 8 | | | | | | | | |
Not at All
Mildly Moderate
ly
Severely Very
Severely/
Disabling
28. How distressing do you find your social fear? (Circle one)
0 1 2 3 4 5 6 7 8 | | | | | | | | |
No
distress
Mild
distress
Moderate
distress
Severe
distress
Very
Severe
29. Has what you have been able to achieve in your job or in school been negatively effected
by your social fear?
NO
YES
Start here
72
Appendix D
Anxious and Depressed Mood Questions
Anxious Mood Questions:
1. How ANXIOUS do you feel right now?
a. Not at all - Extremely
2. How TENSE do you feel right now?
a. Not at all - Extremely
3. How NERVOUS do you feel right now?
a. Not at all - Extremely
4. How SHAKY do you feel right now?
a. Not at all - Extremely
5. How UNEASY do you feel right now?
a. Not at all - Extremely
Depressed Mood Questions:
6. How SAD do you feel right now?
a. Not at all - Extremely
7. How DISCOURAGED do you feel right now?
a. Not at all - Extremely
8. How LONELY do you feel right now?
a. Not at all - Extremely
9. How UNWORTHY do you feel right now?
a. Not at all - Extremely
10. How GLOOMY do you feel right now?
a. Not at all - Extremely
73
Appendix E
Arousal and Fatigue
Self-reported arousal:
1. Which of these things best describes how you feel right now?
a. Sleepy – Activated
Physiological arousal:
1. Heart rate and heart rate variability
2.
Fatigue:
2. How WORNOUT do you feel right now?
a. Not at all - Extremely
3. How FATIGUED do you feel right now?
a. Not at all - Extremely
4. How EXHAUSTED do you feel right now?
a. Not at all - Extremely
5. How SLUGGISH do you feel right now?
a. Not at all - Extremely
6. How WEARY do you feel right now?
a. Not at all - Extremely