anycast in context: a tale of two systems
TRANSCRIPT
Anycast in Context: A Tale of Two SystemsThomas Koch
Columbia UniversityKe Li
Columbia UniversityCalvin Ardi
USC/ISI
Ethan Katz-BassettColumbia University
Matt CalderMicrosoft/Columbia University
John HeidemannUSC/ISI
ABSTRACT
Anycast is used to serve content including web pages and DNS, andanycast deployments are growing. However, prior work examiningroot DNS suggests anycast deployments incur significant inflation,with users often routed to suboptimal sites. We reassess anycastperformance, first extending prior analysis on inflation in the rootDNS. We show that inflation is very common in root DNS, affectingmore than 95% of users. However, we then show root DNS latencyhardly matters to users because caching is so effective. These find-ings lead us to question: is inflation inherent to anycast, or caninflation be limited when it matters? To answer this question, weconsider Microsoft’s anycast CDN serving latency-sensitive con-tent. Here, latency matters orders of magnitude more than for rootDNS. Perhaps because of this need, only 35% of CDN users experi-ence any inflation, and the amount they experience is smaller thanfor root DNS. We show that CDN anycast latency has little inflationdue to extensive peering and engineering. These results suggestprior claims of anycast inefficiency reflect experiments on a sin-gle application rather than anycast’s technical potential, and theydemonstrate the importance of context when measuring systemperformance.
CCS CONCEPTS
• Networks→ Network performance analysis.
KEYWORDS
Anycast, root DNS, routing, latency, CDN.
ACM Reference Format:
Thomas Koch, Ke Li, Calvin Ardi, Ethan Katz-Bassett, Matt Calder, and JohnHeidemann. 2021. Anycast in Context: A Tale of Two Systems. In ACMSIGCOMM 2021 Conference (SIGCOMM ’21), August 23–27, 2021, VirtualEvent, USA. ACM, New York, NY, USA, 20 pages. https://doi.org/10.1145/3452296.3472891
1 INTRODUCTION
IP anycast is an approach to routing in which geographically diverseservers known as anycast sites all use the same IP address. It isused by a number of operational Domain Name System (DNS) [1, 7,
Permission to make digital or hard copies of all or part of this work for personal orclassroom use is granted without fee provided that copies are not made or distributedfor profit or commercial advantage and that copies bear this notice and the full citationon the first page. Copyrights for components of this work owned by others than ACMmust be honored. Abstracting with credit is permitted. To copy otherwise, or republish,to post on servers or to redistribute to lists, requires prior specific permission and/or afee. Request permissions from [email protected] ’21, August 23–27, 2021, Virtual Event, USA© 2021 Association for Computing Machinery.ACM ISBN 978-1-4503-8383-7/21/08. . . $15.00https://doi.org/10.1145/3452296.3472891
31, 39, 65] and Content Delivery Network (CDN) [16, 21, 30, 65, 75]deployments today, in part because of its ability to improve latencyto clients and decrease load on each anycast server [45, 55, 64].
However, studies have argued that anycast often provides sub-optimal performance compared to the lowest latency one couldachieve given deployed sites [51, 54, 67]. Notably, the SIGCOMM2018 paper "Internet Anycast: Performance, Problems, & Potential"has drawn attention to the fact that anycast can inflate latency byhundreds of milliseconds [51], leaving readers of the paper witha poor impression of anycast. Conversely, other work has showninflation is quite low in Microsoft’s anycast CDN [16] and GooglePublic DNS [50], but used different coverage, metrics, and method-ology, so it is difficult to directly compare results. Perhaps becauseof the very different takeaways of these studies, we have found thatsome experts in the community have negative opinions of anycast.In particular, it seems surprising that anycast continues to see moreadoption and growth in production systems – why continue to useanycast if it causes inflation?
To understand the impact of anycast inefficiency, and its wideuse in spite of inflation, we step back and evaluate anycast as a com-ponent of actual applications/services. User-affecting performancedepends on the anycast deployment, how anycast is used withinthe service, and how users interact with the service. To see theseeffects, we consider anycast’s role within two real-world systems:the root DNS and Microsoft’s anycast CDN serving web content.These applications have distinct goals, they are key componentsof the Internet, and they are two of the dominant, most studiedanycast use cases.
We analyze root DNS [39] packet traces which are availablevia DITL [26] and which are featured in existing anycast studies[23, 51, 54, 58, 69], with increased coverage compared to prior work.The 13 root letters operate independently with diverse deploymentstrategies, enabling the study of different anycast deploymentsproviding the same service. We analyze two days of unsampledpacket captures from nearly all root DNS letters, consisting of tensof billions of queries from millions of recursive resolvers queryingon behalf of all users worldwide, giving us broad coverage.
We also examine Microsoft’s CDN using the same methodol-ogy we use for the root DNS so we can directly compare results.Microsoft’s CDN configures subsets of sites into multiple anycast“rings” of different sizes, providing deployment diversity, but alloperated by one organization. We analyze global measurementsfrom over a billionMicrosoft users in hundreds of countries/regions,giving us a complete view of CDN performance.
With these measurements, we present the largest study of any-cast latency and inflation to date. We first validate and extend priorwork on inflation in anycast deployments [51]. Whereas that workfocused primarily on a single root letter, we analyze almost the

SIGCOMM ’21, August 23–27, 2021, Virtual Event, USA
whole root DNS. By joining root DNS captures with global-scaletraces of user behavior, we find that more users than previouslythought experience some inflation (on average, more than 95%), andas many as 40% of users experience more than 100 ms of inflationto some root letters (§3). However, average inflation per query tothe roots is lower than previously thought, since each recursiveresolver can preferentially query its best performing root letter– on average, only 10% of users experience more than 100 ms ofinflation.
Do recursives have to implement preferential querying strategiesfor their users so that inflation does not hurt user performance?The answer is a resounding “no” – using new methodology thatamortizes DNS queries over users who benefit from cached queryresults, we find differences in latency and inflation among rootletters are hardly perceived by users – most users interact with theroot DNS once per day (§4). Delay is minimal due to caching ofroot DNS records with long TTLs at recursive resolvers.
The inflated anycast routes to root DNS could be a result oflatency not mattering, causing root operators to not optimize forit, or inflation could be inherent in anycast routing as suggested inprior work. To determine which is the case, we use measurementsfrom Microsoft’s CDN and find that, were latency to Microsoft’sCDN to be hypothetically inflated as to individual root letters, itwould result in hundreds of milliseconds of additional latency perpage load. This increased latency would negatively affect the user’soverall experience, especially when compared to root DNS. Thekey difference is that users incur several RTTs to Microsoft’s CDNwhen fetching web content, whereas users rarely wait for a queryto the root DNS because of DNS caching (§5.1).
With this context, we thenmeasure actual inflation inMicrosoft’sCDN and find that inflation is kept comparatively small (§5.2), espe-cially compared to individual root letters. To explain why inflationis so different in these deployments, we contrast AS-level connec-tivity and inflation between the users, Microsoft’s CDN, and roots.We find that Microsoft is able to control inflation through extensivepeering and engineering investment (§7.1), even though inefficiencyincreases with larger deployments (§7.2). Through discussions withoperators of root DNS and CDNs, we find recent root DNS expan-sion has (surprisingly) been driven by a desire to reduce latency andmitigate DDoS attacks, while CDN expansion is driven by marketforces (§7.3).
The comparison between performance in these two deploymentsallows us to put results from prior work in perspective [16, 23, 51,69]. Even though root inflation is large, users rarely experience it,making its impact on the average query quite small. In contrast,users frequently interact with the CDN, and inflation there is small.These inflation results make sense, given the economic incentivesof the organizations running Microsoft’s CDN and the root DNS.While we expect these results to hold for other latency-sensitiveservices using anycast, as they have similar economic incentives,a key takeaway from our work is that anycast must be analyzedin the context of the service in which it is used (§7.3), and so wecannot make definitive statements about generalizability. Hence,we do not refute past claims that anycast can inflate latencies, butwe expand on these studies to show that, where it counts, anycastperformance can be quite good.
This paper poses no ethical issues.
2 METHODOLOGY AND DATASETS
We use a combination of DNS packet captures and global CDNmeasurements to measure latency and inflation. Root DNS datais readily available [26], while CDN data is proprietary. We sup-plement these datasets with measurements from RIPE Atlas [71].We summarize our many data sets’ characteristics, strengths, andweaknesses in Appendix A.
2.1 Root DNS
The first of the two systems we discuss, the root DNS, is a criti-cal part of the global DNS infrastructure. DNS is a fundamentallookup service for the Internet, typically mapping hostnames to IPaddresses [22, 56]. To resolve a name to its result, a user sends DNSrequests to a recursive resolver (recursive). The recursive queriesauthoritative DNS servers as it walks the DNS tree from root, totop-level domain (TLD), and down the tree. Recursives cache resultsto answer future requests according to TTLs of records. The rootDNS server is provided by 13 letters [39], each with a differentanycast deployment with 6 to 254 anycast sites (as of July 2021),run by 12 organizations. A root DNS site can be local or global –local sites serve small geographic areas or certain ASes (controlledby restricting the propagation of the anycast BGP announcementfrom the site), while global sites are globally reachable.
We use three datasets: for end-users, we use long-term packetcaptures from the Information Sciences Institute (ISI) at USC,and DNS and browser measurements from daily use of two of theauthors. For DNS servers, we use 48-hour packet captures at mostroot servers from Day in the Life of the Internet (DITL) [26].
Packet captures from ISI provide a local view of root DNS queries.The recursive resolver runs BIND v9.11.14. The captures, from 2014to the present, reflect all traffic (incoming and outgoing) traversingport 53 of the recursive resolver. We use traces from 2018 (about100 million queries), as they overlap temporally with our otherdatasets. This recursive resolver received queries from hundredsof users on laptops, and a number of desktop and rack-mountedcomputers of a network research group, so the results may deviatefrom a typical population. We found no measurement experimentsor other obvious anomalies in the period we use.
We use the 2018 DITL captures, archived by DNS-OARC [26], toobtain a global view of root DNS use. DITL occurs annually, witheach event including data from most root servers. The 2018 DITLtook place 2018/04/10-12 and included 12 root letters (all exceptG root). Traces from I root are fully anonymized, so we did notuse them. Traces from B root are partially anonymized, but only atthe /24 level. Our analysis does not rely on addresses more specificthan /24, so we use all data from B root and all other roots exceptG and I. Although the 2018 DITL is older than the most recentlyavailable, it is significantly more complete than recent DITLs; inAppendix B.3 we conduct analysis on the 2020 DITL and find noneof our main conclusions change.
Since we aim to understand in part how root DNS latency affectsusers, we filter queries in DITL that do not affect user latency andqueries generated by recursives about which we have no user data.We describe this pre-processing of DITL and subsequent joining ofroot query volumes with Microsoft’s CDN user population counts.

SIGCOMM ’21, August 23–27, 2021, Virtual Event, USA
Of the 51.9 billion daily queries to all roots, we discard 31 billionqueries to non-existing domain names and 2 billion PTR queries.About 28% of non-existing domain name queries are NXDomainhijacking detection from Chromium-based browsers [4, 34, 73], andso involve machine startup and not browsing latency. Prior worksuggests the remainder are generated by other malfunctioning,automated software [28]. Similarly, while PTR queries have someuses (traceroutes and confirming hostnames during authentication),they are not part of typical user web latency. In Appendix B.1,we find that including invalid TLD queries significantly changesthe conclusions we can draw about how users interact with theroot DNS, and we provide more justification for this step. We nextremove queries from prefixes in private IP space [38] (7% of allqueries). Finally, we analyze only IPv4 data and exclude IPv6 traffic(12% of queries) because we lack v6 user data.
Sources of DNS queries in DITL are typically recursive resolvers,so the captures alone provide no information about how manyDNS queries each user makes. To estimate per-user latency, weaugment these traces with the approximate number of Microsoftusers of each recursive, gathered in 2019 (the oldest user data wehave). This user data is from Microsoft DNS data, which countsunique IP addresses as “users”. This definition undercounts multiplehuman users that use a single IP address with Network AddressTranslation. Microsoft maps recursives to user IP addresses with anexisting technique that instruments users to request DNS recordsfor domains Microsoft controls when users fetch content [17, 53].
We join the DITL captures and Microsoft user counts by therecursive resolver /24, aggregating DITL query volumes and Mi-crosoft user IP counts, each grouped by /24 prefix1 to increase theamount of recursives for which we have user data. This aggregationis justified since many organizations use colocated servers withinthe same /24 as recursives [31, 63]. Prior work has also found thatup to 80% of /24’s are collocated [29]. We provide additional justifi-cation for this preprocessing step in Appendix B.2, by showing alladdresses in a /24 in DITL are almost always routed to the sameanycast site. For simplicity, we henceforth refer to these /24’s asrecursives, even though each /24 may contain several recursives.We call this joined dataset of query volumes and user counts byrecursive DITL∩CDN.
In an effort to make our results more reproducible, and as a pointof comparison, we also use public Internet population user countdata from APNIC to amortize root DNS queries [37] (i.e., insteadof using proprietary Microsoft data). APNIC obtains these AS userpopulation estimates by first gathering lists of IP addresses fromGoogle’s Ad delivery network, separated by country. APNIC con-verts this distribution of IP addresses to a distribution of ASNs,normalized by country Internet-user populations. We use the Team-Cymru IP to ASN mapping to map IP addresses seen in the DITLcaptures to their respective ASes [25] and accumulate queries byASN. We were able to map 99.4% of DITL IP addresses to an ASN,representing 98.6% of DITL query volume. The assumption thatrecursives are in the same AS as the users they serve is obviouslyincorrect for public DNS services, but we do not make an effort tocorrect for these cases. Overall, we believe Microsoft user counts
1We aggregate user IP addresses by recursive /24 before counting to ensure we do notdouble-count users.
R28R47R74R95R110
Figure 1:Microsoft’s CDN rings and user populations. Sites in smaller
rings are also in larger rings, and the legend indicates the number of
sites in that ring. We do not show some front-ends too close to each
other to improve readability. User populations are shown as circles,
with the radius of the circle proportional to the number of users in
that region, demonstrating that Microsoft has deployed front-ends
in areas of user concentration.
are more accurate, but APNIC data is more accessible to otherresearchers and so provides a useful comparison.
2.2 Microsoft’s CDN
We also analyze Microsoft’s large anycast CDN that serves webcontent to over a billion users from more than 100 sites. Traffic des-tined for Microsoft’s CDN enters its network at a point of presence(PoP) and is routed to one of the anycast sites serving the content(front-ends). Microsoft organizes its deployment into groups ofsites, called rings, that conform to varying degrees of regulatoryrestrictions (e.g., ISO 9001, HIPAA), each with its own anycast ad-dress. The rings have the property that a site in a smaller ring isalso in all larger rings. Other CDNs have to work with similar reg-ulatory restrictions [2]. Hence, traffic from a user prefix destinedfor Microsoft’s CDN may end up at different front-ends (dependingon which ring the application uses), but often will ingress into thenetwork at the same PoP. Users are routed to rings via anycast andfetch web content from a front-end via its anycast address. Usersare always routed to the largest allowed ring given the application’sregulatory restrictions (performance differences among rings arenot taken into account).
Microsoft’s anycast rings provide different size anycast deploy-ments for study. In Figure 1 we show Microsoft’s front-ends anduser concentrations. Rings are named according to the number offront-ends they contain, and front-ends are labeled according tothe smallest ring to which they belong (or else all front-ends wouldbe labelled as R110). We do not show some front-ends too close toeach other to improve readability. Circles are average user locations,where the radius of the circle is proportional to the population ofusers in that region. Figure 1 suggests that front-end locations tendto be near large populations, providing at least one low latencyoption to most users. Appendix F illustrates latency differences byregion.
User locations are aggregated by region, a geographic area usedinternally by Microsoft to break the world into regions that generatesimilar amounts of traffic and so contain similar numbers of users.A region often corresponds to a large metropolitan area. We refer tousers at the ⟨region, AS⟩ granularity, because users in the same⟨region, AS⟩ location are often routed to the same front-ends andso (generally) experience similar latency. There are 508 regions in

SIGCOMM ’21, August 23–27, 2021, Virtual Event, USA
total: 135 in Europe, 62 in Africa, 102 in Asia, 2 in Antarctica, 137in North America, 41 in South America, and 29 in Oceania.
To study performance inMicrosoft’s CDN, we use twomajor datasources: server-side logs and client-side measurements. Server-sidelogs at front-ends collect information about user TCP connections,including the user IP address and TCP handshake RTT. Using theseRTTs as latency measurements, we compute median latencies fromusers in a ⟨region, AS⟩ location to each front-end that servesthem.2 Microsoft determines the location and AS of users usinginternal databases.
Client-side measurements come from a measurement systemoperated by Microsoft [17]. Latency measurements are the time ittakes for Microsoft users to fetch a small image via HTTP.3 Themeasurement system instructs clients using CDN services to issuemeasurements to multiple rings, which enables us to remove biasesin latency patterns due to services hosted on different rings havingdifferent client footprints (e.g., enterprise versus residential traffic).Microsoft collects latencies of users populations, noting the locationand AS of the user. Since these measurements come directly fromend-users, we do not know which front-end the user hit. For bothclient-side measurements and server-side logs, we collect statisticsfor over a billion users across 15,000 ⟨region, AS⟩ locations.
We also use RIPE Atlas to ping anycast rings, because we cannotshare absolute latency numbers. We calibrate these results versusour (private) data measuring latency for CDN users. In total, wecollect 7,000 ping measurements to rings from 1,000 RIPE Atlasprobes in more than 500 ASes to augment CDN latency measure-ments. (Probes were selected randomly, and measured three timesto each ring.)
3 ROUTES TO ROOT DNS ARE INFLATED
Earlier work has found query distance to the root DNS is oftensignificantly inflated [13, 23, 51, 67, 69]. Similar to this work, wefind that queries often travel to distant sites despite the presenceof a geographically closer site. We extend this understanding in anumber of ways. While previous work considered only subsets ofroot DNS activity and focused on geographic inflation for recursivesrather than users, we calculate inflation for nearly all root letters,and place inflation in the context of users, rather than recursiveresolvers. These contributions are significant for several reasons.First, considering more root letters allows us to evaluate inflationin different deployments, and with most letters we can evaluatethe root DNS system. Since a recursive makes queries to many rootletters, favoring those with low latency [60], system performanceand inflation can (and does) differ from component performance.Second, we weight recursive resolvers by the number of users,which allows us to see how users are affected by inflation. Finally,we extend prior work by conducting an analysis of latency (asopposed to geographic) inflation with large coverage.
Previous studies of anycast have separated inflation into twotypes, unicast and anycast, in an attempt to tease out how much la-tency anycast specifically adds to queries [13, 16, 51, 69]. For severalreasons, we choose to consider inflation relative to the deployment,
2We also looked at other percentiles (e.g., 95th) and found the qualitative results to besimilar.3DNS resolution and TCP connection time are factored out.
rather than try to infer which inflation would exist in an equivalentunicast deployment. First, coverage of measurement platforms usedto determine unicast inflation such as RIPE Atlas (vantage pointsfor anycast studies [51, 69]) is not representative [10]. Second, cal-culating unicast inflation requires knowledge of the best unicastalternative from every recursive seen in DITL to every root letter,something that would be difficult to approximate with RIPE Atlasbecause some letters do not publish their unicast addresses. Third,we find it valuable to compare latency to a theoretical lower bound,since user routes to the best unicast alternative may still be inflated.
We measure two types of inflation for the root DNS, by lookingat which sites recursive resolvers are directed to. DITL captures area rich source of data because they provide us with a global viewof which recursives access which locations (§2.1). Our inflationanalysis covers 224 countries/regions and 22,243 ASes (Atlas coversabout 3,700 ASes as of July 2021).
We calculate the first type of inflation – geographic inflation(Eq. (1)) – over 10 of the 13 root letters, omitting G which does notprovide data, H which only had one site in 2018 (and so has zero in-flation), and I, where anonymization prevents analysis. Geographicinflation measures, at a high level, how users are routed to sitescompared to the closest front-end (i.e., efficiency)4.
We calculate the second type of inflation – latency inflation(Eq. (2)) – over the root letters mentioned above by looking atthe subset of DNS queries that use TCP, using the handshaketo capture RTT [57]. Our latency inflation analysis further ex-cludes D and L root, due to malformed DITL PCAPs. Latency infla-tion uses measured latencies to determine inflation, so it reflectsconstraints due to physical rights-of-way and connectivity, badrouting, and peering choices. We calculate median latency overeach ⟨root, resolver /24, anycast site⟩ for which we haveat least 10 measurements, providing us latencies for resolvers rep-resenting 40% of DITL query volume to these roots.
3.1 Methodology
To calculate geographic inflation, we first geolocate all recursivesin our DITL∩CDN dataset using MaxMind [41], following priormethodology which affirmed MaxMind to be suitably accurate forgeolocating recursive resolvers in order to assess inflation [51]. Wethen compute geographic inflation (scaled by the speed of light infiber) for each recursive sending queries to root server 𝑗 as
GI (𝑅, 𝑗) = 2𝑐 𝑓
(∑︁𝑖
𝑁 (𝑅, 𝑗𝑖 )𝑑 (𝑅, 𝑗𝑖 )𝑁 (𝑅, 𝑗) −min
𝑘𝑑 (𝑅, 𝑗𝑘 )) (1)
where 𝑁 (𝑅, 𝑗𝑖 ) is the number of queries to site 𝑗𝑖 by recursive 𝑅,𝑁 (𝑅, 𝑗) = ∑
𝑖 𝑁 (𝑅, 𝑗𝑖 ) is the total number of queries to all sites 𝑗𝑖in root 𝑗 by recursive 𝑅, 𝑐 𝑓 is the speed of light in fiber, the factorof 2 accounts for the round trip latency, 𝑑 (𝑅, 𝑗𝑘 ) is the distancebetween the recursive resolver and site 𝑗𝑘 , and both the summationand minimization are over the global sites in this letter deployment(see Section 2.1 for the distinction between local and global). Weonly consider global sites, since we do not know which recursivescan reach local sites. For recursives which can reach a local site4It would be interesting to measure topological inflation (extra distance traveled on theInternet topology, beyond shortest-path propagation-delay), but it would be difficultto do so using existing methods without sacrificing significant coverage.
SIGCOMM ’21, August 23–27, 2021, Virtual Event, USA
but instead reach a global site, Equation (1) (and Equation (2)) mayunderestimate actual inflation.
GI (𝑅, 𝑗) is an approximation of the inflation one would expectto experience when executing a single query to root deployment 𝑗from recursive 𝑅, averaged over all sites. The overall geographicinflation of a recursive is then the empirical mean over all roots.Even though queries from the same recursive /24 are usually routedtogether, they may be routed to different sites due to load balancingin intermediate ASes (see Appendix B.2 for measures of how oftenthis occurs), so we average geographic inflation across sites fora recursive. Geographic inflation is useful to investigate since itshows how our results compare with prior work, how many usersare being inflated, and it gives us a measure of "efficiency" (§7.2) .
We also calculate latency inflation, again considering recursivequerying patterns seen in DITL. We calculate latency inflationLI (𝑅, 𝑗) for users of recursive 𝑅 to root 𝑗 as
LI (𝑅, 𝑗) =∑︁𝑖
𝑁 (𝑅, 𝑗𝑖 )𝑙 (𝑅, 𝑗𝑖 )𝑁 (𝑅, 𝑗) − 3 × 2
2𝑐 𝑓min𝑘
𝑑 (𝑅, 𝑗𝑘 ) (2)
where 𝑙 (𝑅, 𝑗𝑖 ) is the median latency of recursive 𝑅 towards rootsite 𝑗𝑖 and the other variables are as in Equation (1). Prior worknotes that routes rarely achieve a latency of less than the great circledistance between the endpoints divided by 2𝑐 𝑓
3 [46], so we use 2𝑐 𝑓3
to lower bound the best latency recursives could achieve. Latencyinflation is a measure of potential performance improvement userscould see due to changes in routing or expanding the physicalInternet (e.g., laying fiber).
One limitation is that we do not account for the fact that thesource addresses of some queries in the DITL traces may be spoofed.Spoofing is more likely to make our calculated inflation larger,especially in cases where the spoofer is far away from the physicalinterface it is spoofing (i.e., from our perspective, the route looksinflated when actually the source address was spoofed). We donot attempt to correct for these cases since it would be difficult todistinguish between legitimately poor routing and spoofed traffic.
3.2 Results
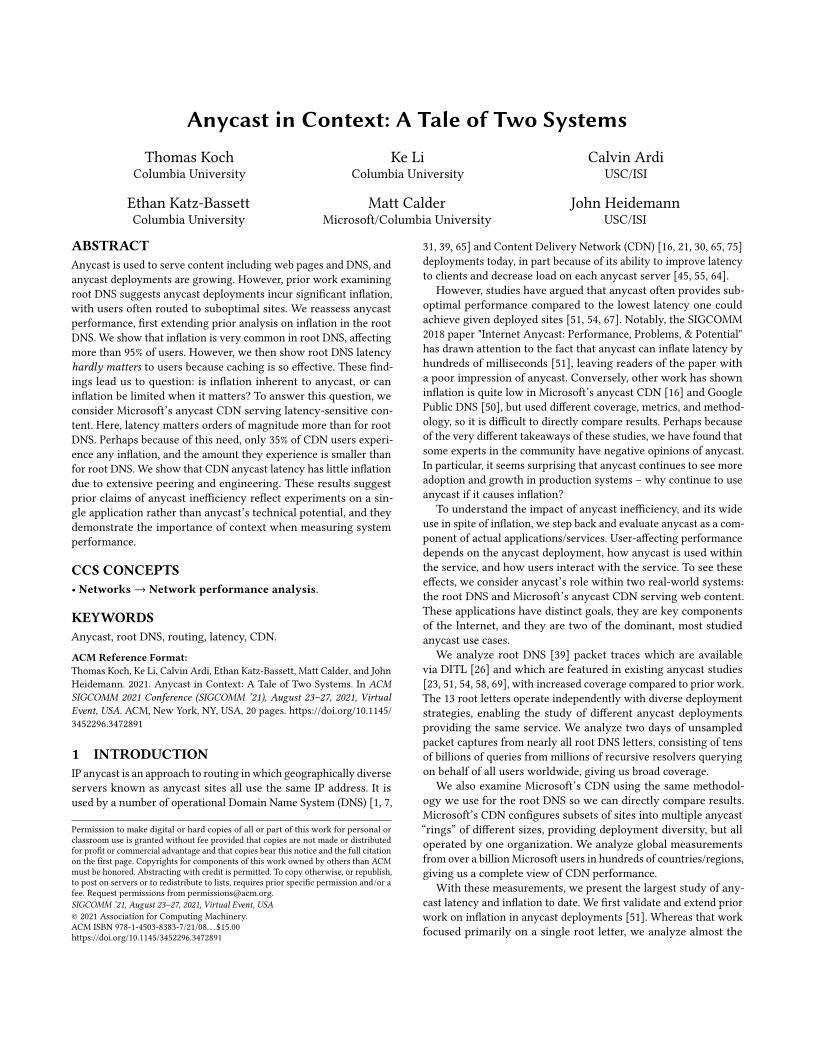
Figure 2a demonstrates that the likelihood of a root DNS queryexperiencing any geographic inflation (Eq. (1)) roughly grows withdeployment size (y-axis intercept), expanding on results in priorwork which presented an orthogonal, aggregated view [51]. TheAll Roots line takes into account that each recursive spreadsits queries across different roots. It has the lowest y-intercept ofany line in Figure 2a, which implies that nearly every recursiveexperiences some inflation to at least one root and that the set ofinflated recursives varies across roots. Hence, our analysis showsthat nearly every user will (on average) experience inflation whenquerying the root DNS, and 10.8% of users are likely to be inflatedby more than 2,000 km (20 ms).
Figure 2b shows that queries to these roots experience frequentlatency inflation (Eq. (2)), with between 20% and 40% of users expe-riencing greater than 100 ms of inflation (B root is a clear exception,but only had 2 sites, so inflation is less meaningful). Latency infla-tion starts at approximately zero, which follows from our choiceof “optimal” latency (Eq. (2)). Compared to geographic inflation,latency inflation is particularly larger in the tail. For example, at
0 20 40 60 80 100 120 140Geographic Inflation per Root Query (ms)
0.00.10.20.30.40.50.60.70.80.91.0
CDF
of U
sers
B - 2A - 5M - 5C - 10E - 15D - 20K - 52J - 68F - 94L - 138All Roots
(a)
0 25 50 75 100 125 150 175 200Latency Inflation per Root Query (ms)
0.00.10.20.30.40.50.60.70.80.91.0
CDF
of U
sers
B - 2A - 5M - 5C - 10E - 15K - 52J - 68F - 94All Roots
(b)
Figure 2: Inflation measured using geographic information (2a) and
TCP RTT estimates (2b). Generally, larger deployments are more
likely to inflate paths, and inflation in the roots is quite large. The
legends indicate the number of global sites per letter during the 2018
DITL.
the 95𝑡ℎ percentile C root has 240 ms of latency inflation butonly 70 ms of geographic inflation. However, inflation for the rootDNS as a whole is not as bad as individual root letters as shownby lines All Roots , which take into account that recursives canpreferentially query low latency root servers [60].
Our latency inflation metric shows C root is more inflated thanpreviously thought, inflating 35% of users by more than 100 ms com-pared to 20% reported in prior work [51] (although the comparisonto prior work is not perfect since what was measure is different).Other prior work found significant inflation in the roots, but it isdifficult to directly compare results since inflation was presentedin different ways [23, 69].
Clearly, routing to individual root letters often is inflated, withmany queries traveling thousands more kilometers than needed,and being inflated by hundreds of milliseconds for some users.
4 ROOT DNS LATENCY AND INFLATION
HARDLY MATTER
With a richer understanding of inflation in the root DNS, one mightwonder why inflation in root letters is large given growing deploy-ments and root DNS’s importance in the Internet. We now showthat root DNS inflation does not result in much user-visible latency.
4.1 Measuring Root DNS Latency Matters
The root DNS servers host records for TLDs (e.g., COM, ORG).There are approximately one thousand TLDs, and nearly all of the

SIGCOMM ’21, August 23–27, 2021, Virtual Event, USA
corresponding DNS records have a TTL of two days. Hence, due toshared caches at local resolvers, one might think root DNS latencytrivially does not matter for users. Recent work even suggests theroot DNS can be done away with entirely [5] or largely replacedby preemptive caching in recursives [48]. We offer several reasonswhy we found it necessary to explicitly measure root DNS latency’simpact on users, rather than use intuition.
First, there is a lot of attention being placed on the root DNSin the professional and research communities. For example, someexperts have asked us in conversation why CDNs use anycast, whenanycast inflates latencies in the root DNS so much. The SIGCOMM2018 paper “Internet Anycast: Performance, Problems, & Potential”has drawn attention to the fact that anycast can inflate latency tothe root DNS by hundreds of milliseconds [51]. Blog posts from theroot letters discuss latency improvements and inflation reductions[3, 14, 61, 79] – why does latency matter to roots? Moreover, overthe past 5 years the number of root DNS sites has steadily increasedto more than double, from 516 to 1367. Why is there so muchinvestment in more sites?
Second, there is value in quantitatively analyzing systems, espe-cially global systems that operate at scale, even if we can intuitively,qualitatively reason about these systems without conducting anal-ysis. We conduct analysis using data from eleven of thirteen rootletters, giving us a truly global view of how users interact with theroot DNS. We are aware of only one other study which looked athow caching affects root DNS queries [44], but that study is old, islimited to one recursive resolver, and does not place DNS queriesin the context of user experience.
Third, although TTLs of TLD records are two days, recursiveresolver implementations can be buggy. We noticed millions ofqueries per day for TLD records being sent to the root letters bysome recursives (§4.3), and found a bug in the popular BIND recur-sive resolver software that causes unnecessary queries to the roots(Appendix E). Hence, making arguments about root DNS latencyrequires careful analysis.
4.2 HowWe Measure Root DNS
Measuring how root DNS latency affects users poses several chal-lenges. To put root DNS latency into context we must understand(1) how user-application performance is affected when applicationsmake root queries, (2) how often end-hosts and recursive resolversinteract with root DNS, given their caches, (3) what the latency isfrom the anycast deployment, and (4) how these effects vary by loca-tion and root letter. These challenges both motivate our subsequentanalyses and also highlight the limitations of prior work which donot capture these subtleties of root DNS latency [23, 51, 58, 69].
Therefore, precisely determining how root DNS latency affectsusers would require global, OS-level control to select recursivesand view OS DNS caches; global application-level data to see whenDNS queries are made and how this latency affects application-performance; global recursive data to see caches, root queries, andtheir latencies; and global root traces to see how queries to theroots are routed. As of July 2021, only Google might have this data,and assembling it would be daunting.
To overcome these challenges we take two perspectives of rootDNS interactions: local (close to the user) and global (across more
than a billion users). Our local perspective precisely measures howroot DNS queries are amortized over users browsing sessions, whileour global analysis estimates the number of queries users worldwideexecute to the roots.
4.3 Root DNS Latency Hardly Matter
Local Perspective: To obtain a precise measure of how root DNSqueries are amortized over a small population, we use packet cap-tures of a recursive resolver at ISI (§2.1). We also measure from twoauthors’ computers to observe how an individual user interactswith the root servers (with no shared cache), since ISI traces donot give us context about user experience. Data from two usersis limited, which is a reflection of the challenges we identified inSection 4.2. However, these experiments offer precise measures ofhow these authors interact with root DNS (which no prior work hasinvestigated), supplementing the global-scale data used for most ofthe paper.
Using traces gathered at ISI, we calculate the number of queriesto any root server as a fraction of user requests to the recursiveresolver. We call this metric the root cache miss rate, as it approx-imates how often a TLD record is not found in the cache of therecursive in the event of a user query. It is approximate becausethe resolver may have sent multiple root requests per user query,and some root requests may not be triggered by a user query. Thedaily root cache miss rates of the resolver range from 0.1% to 2.5%(not shown), with a median value of 0.5%. The overall cache missrate across 2018 was also 0.5%. The particular cache miss rate mayvary depending on user querying behavior and recursive resolversoftware, but clearly the miss rate is small, due to shared caches.Appendix D shows the minimal impact root DNS latency has onusers of ISI and a CDF of DNS latency experienced by users at ISI.
Since the measurements at ISI can only tell us how often rootDNS queries are generated, we next look at how root DNS latencycompares to end-user application latency. On two authors’ workcomputers (in separate locations), we direct all DNS traffic to local,non-forwarding, caching recursive resolvers running BIND 9.16.5and capture all DNS traffic between the user and the resolver, andbetween the resolver and the Internet.
We run the experiment for four weeks and observe a mediandaily root cache miss rate of 1.5% – similar to but larger than thecache miss rate at ISI. The larger cache miss rate makes sense,given the local users do not benefit from shared caches. We alsouse browser plugins to measure median daily active browsing timeand median daily cumulative page load time, so we can place DNSlatency into perspective. Active browsing time is defined as theamount of time a user spends interacting with the page (with a 30second timeout), whereas page load time is defined as the time untilthe window.onLoad event. Median daily root DNS latency is 1.6%of median daily page load time and 0.05% of median daily activebrowsing time, meaning that root DNS latency is barely perceptibleto these users when loading web pages, even without shared caches.In general, we overestimate the impact of DNS and root DNS latencysince DNS queries can occur as a result of any application runningon the authors’ machines (not just browsing).
Global Perspective: Towards obtaining a global view of howusers interact with the root DNS, we next look at global querying

SIGCOMM ’21, August 23–27, 2021, Virtual Event, USA
10−3 10−2 10−1 100 101 102 103
Queries per User per Day
0.0
0.2
0.4
0.6
0.8
1.0
CDF
of U
sers
IdealCDNAPNIC
Figure 3: A CDF of the number of queries each user executes to the
roots per day. The CDN and APNIC lines represent different user-
count datasets. The Ideal line presents an idealized assumption
about recursive query behavior. Most users wait for less than one
query to the roots per day, regardless of which user data we use.
behavior of recursives. As discussed in Section 4.2, it is difficult tomodel caching at resolvers and how caching saves users latency,since caching hides user query patterns (by design) and differs withrecursive implementation. To overcome this challenge, we use a newmethodology that amortizes queries over large user populations,by joining DNS query patterns with user data.
Given query volumes towards root servers from recursives anduser counts using each recursive from the DITL captures (§2.1),we estimate the number of queries to the roots that users wait forper day. Figure 3 is a CDF of the expected number of queries peruser per day, where lines CDN and APNIC use a different user-count dataset (§2.1), and line Ideal uses hypothetical assumptionswhich we describe below. Figure 3 demonstrates that most userswait for no more than one query to the roots per day, regardless ofwhich user data we use.
To generate each line in Figure 3, we divide (i.e., amortize) thenumber of queries to the root servers made by each recursive by thenumber of users that recursive represents. We weight this quotient(i.e., daily queries per user) by user count and calculate the resultingCDF. We calculate the number of queries per day each recursivemakes from DITL by first calculating daily query rates at each site(i.e., total queries divided by total capture time) and subsequentlysumming these rates across sites. We include nearly every rootquery captured across the root servers, so Figure 3 provides a trulyglobal view of how users interact with the root DNS.
The two lines CDN and APNIC correspond to amortizing DITLqueries over Microsoft and APNIC user counts, respectively. Hence,the set of ‘users’ each line represents is technically different, but weplace them on the same graph for comparison. Even though the twomethodologies of estimating user counts behind root queries arevery different ( CDN uses an internal measurement system, whileAPNIC uses Internet population estimates by country), amortizingqueries over these sets of users still yields the same high levelconclusions about how users interact with the root DNS, suggestingthat our methodology and conclusions are sound – users rarelyinteract with the root DNS executing about one query per day atthe median. Users in the tail are likely either spammers, have buggyrecursive software, or represent recursives with more users thanDITL∩CDN suggests (e.g., cellular networks). APNIC user estimatesare not affected by NATs, and APNIC has a smaller tail.
The line labeled Ideal does not use DITL query volumes tocalculate daily user query counts, but instead represents a hypothet-ical scenario in which each recursive queries for all TLD recordsexactly once per TTL, and amortizes these queries uniformly overtheir respective user populations (we use Microsoft user counts forIdeal ). The resulting hypothetical median daily query count of0.007 could represent a future in which caching works at recursivesoptimally – not querying the roots when not necessary. Idealalso demonstrates the degree to which the assumption that recur-sives only query once per TTL underestimates the latency usersexperience due to the root DNS (§4.2) – the assumption is orders ofmagnitude off from reality.
We have shown root DNS latency, and therefore inflated routesto the roots, makes no difference to most users. This result raisesthe question – are paths to the roots inflated because anycast intrin-sically results in inflation? Or rather, does latency not mattering inthis setting lead to anycast deployments that are not optimized forlatency and hence tend to have inflated routes? To answer thesequestions, we turn to a new system using anycast to serve latency-sensitive content – Microsoft’s CDN.
5 LATENCY MATTERS FOR MICROSOFT’S
CDN
We demonstrate that latency (and hence inflation) does matter forMicrosoft users when fetching web content, unlike for most usersin the root DNS, principally due to the number of RTTs users incurwhen fetching web content.
5.1 RTTs in a Page Load
To estimate the latency a user experiences when interacting withMicrosoft’s CDN (§5.2), we first estimate the number of RTTs re-quired to load a typical web page hosted by Microsoft’s CDN.
The number of RTTs in a page load depends on a variety offactors, so we aim to lower bound the number. We lower bound thenumber of RTTs since a lower bound is a conservative measure ofthe impact of CDN inflation, as the latency inflation accumulateswith each additional RTT, and larger pages (more RTTs) wouldbe impacted more. We provide an estimate of this lower boundbased on modeling and evaluation of a set of web pages hosted byMicrosoft’s CDN using Selenium (a headless web browser), findingthat 10 RTTs is a reasonable estimate. Due to length restrictions,we include the full details of our measurements and methodologyin Appendix C.
5.2 Microsoft’s CDN User Latency
We now measure how users are impacted by latency of Microsoft’sCDN. First, using measurements from RIPE Atlas probes, we demon-strate that CDN latency results in significant delay to users whenfetching web content. Then, using both client-side measurementsand server-side logs, we also show that latency usually decreaseswith more sites. Consequently, Microsoft has a major incentive tolimit inflation experienced by users, and investments in more any-cast sites positively affect user experience much more in the caseof Microsoft’s CDN than in the roots. The positive effect on userexperience has been a major reason for recent expansion (§7.3).
SIGCOMM ’21, August 23–27, 2021, Virtual Event, USA
0 200 400 600 800 1000 1200CDN Latency per Web Page Load (ms)
0.00.10.20.30.40.50.60.70.80.91.0
CDF
of R
IPE
Prob
es
R47
R28R110
R95
R74
R28R47R74R95R110
0 20 40 60 80 100 120CDN Latency per RTT (ms)
(a)
−100 0 100 200 300 400Latency Change per Page Load (Smaller Ring - Bigger Ring) (ms)
0.00.10.20.30.40.50.60.70.80.91.0
CDF
of (R
egio
n, A
S) L
ocat
ions
R28 - R47R47 - R74R74 - R95R95 - R110
−10 0 10 20 30 40Latency Change per RTT (Smaller Ring - Bigger Ring) (ms)
(b)
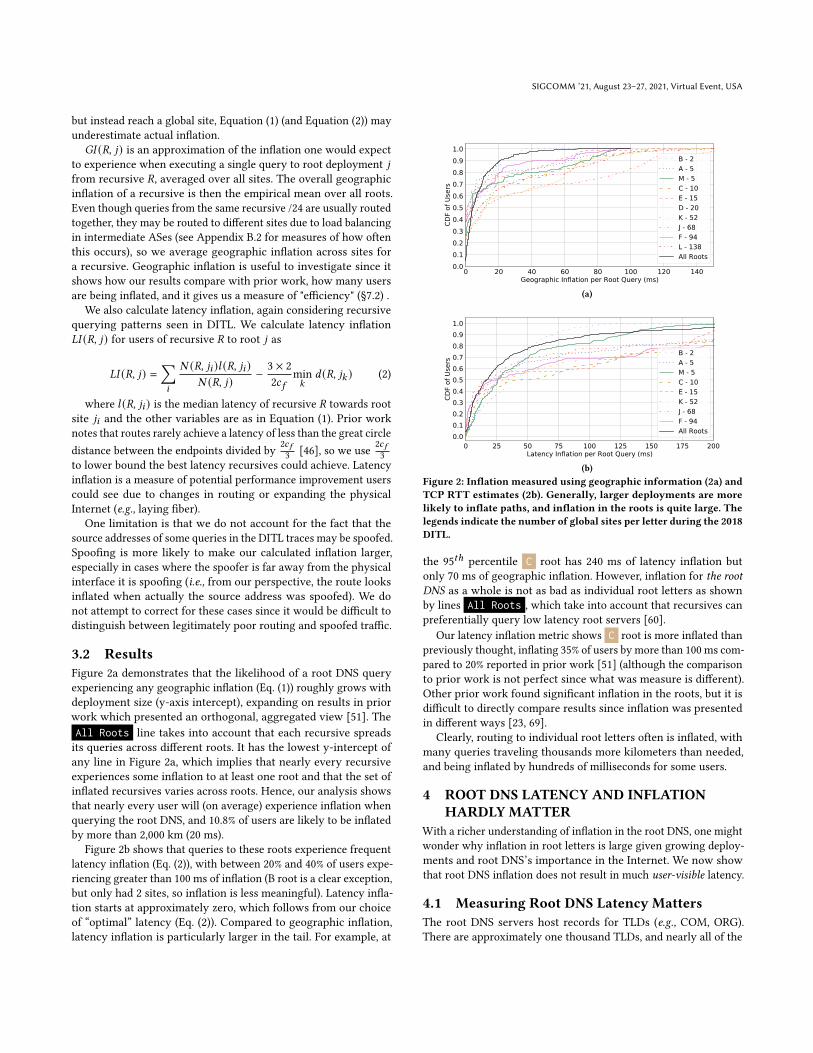
Figure 4: RTTs and latencies per web page load from RIPE probes to
CDN rings (4a), and change in median latency for Microsoft users
in ⟨region, AS⟩ locations when transitioning rings (4b). Axes with
per-RTT latencies are blue, while axes with per-page-load latencies
are red. Latencies per page load can be significant, so Microsoft has
an incentive to reduce inflation.
Microsoft’s CDN has groups of sites called rings (§2.2). Eachlarger ring adds some sites to those of the smaller ring. Each ringprovides an IP anycast CDN, so we report results for each of therings individually. Different ring sizes reflect some of the benefit ofadditional anycast locations, but a user’s traffic usually ingressesto Microsoft’s network at the same PoP regardless of ring, sinceall routers announce all rings. Users experience latency from Mi-crosoft’s as they retrieve web objects (e.g., web pages or supportingdata) hosted by Microsoft’s CDN. Hence, in order to assess howMicrosoft users experience latency, we must measure what the RTTis from users to front-ends and how many RTTs are incurred whenfetching web content. We use our estimate from Section 5.1 thatusers incur at least 10 RTTs in a page load. To obtain per-page-loadlatency, we scale anycast latency by the number of RTTs.
In Figure 4a, we show latencies to rings. Figure 4a uses laten-cies measured from RIPE Atlas probes (§2.2), as we cannot shareabsolute latencies from Microsoft measurements since Microsoftconsiders this data proprietary. Although RIPE Atlas has limitedcoverage [10], we compare (but cannot share) to CDN measure-ments, which contain latencies from all ⟨region, AS⟩ locationsto all rings. We observed that the distribution of RIPE Atlas probelatencies is overall somewhat lower than that of Microsoft’s users
globally (not shown in figure), so Figure 4a likely underestimatesthe latency users typically experience.
Users can experience up to 1,000 ms in anycast latency per pageload, and, for large deployments (e.g., R95 ), half of RIPE Atlasprobes experience approximately 100 ms of latency per page load(Fig. 4a). Therefore, unsurprisingly, latency to Microsoft’s CDNfactors into user experience, and so Microsoft has an incentive todecrease latency for users. The difference in median latency perpage load between R28 and R110 is approximately 100ms, whichis a measure of how investments in more front-ends can help users.Similarly, a root deployment with more sites tends to have lowerlatency than a root deployment with fewer sites (§7.2), but suchreductions in latency hardly affect user experience (§4).
Latency benefits with more sites are not uniform, and perfor-mance falls into one of two “groups” – R28 and R47 have similaraggregate performance, as do R74 , R95 , and R110 . This group-ing corresponds to the way rings “cover” users – R74 provides asignificant additional number of Microsoft users with a geographi-cally close front-end over R47 (§7.2).
To show how adding front-ends tends to help individual⟨region, AS⟩ locations (in addition to aggregate perfor-mance), Figure 4b shows the difference in median latency fora ⟨region, AS⟩ location from one ring to the next larger ring,calculated using CDN measurements (as opposed to RIPE Atlasprobes). Most ⟨region, AS⟩ locations experience either equal orbetter latency to the next largest ring, with diminishing returns asmore front-ends are added. A small fraction of users experiencesmall increases in latency when moving to larger rings – 90% ofusers experience a decrease of at most a few millisecond increaseand 99% experience less than a 10 ms increase. Hence, Microsoftdoes not sacrifice fairness for performance improvements.
We next investigate if Microsoft’s clear incentive to reduce la-tency (and therefore inflation) translates to lower inflation fromusers to Microsoft’s CDN than from users to the root DNS.
6 ANYCAST INFLATION CAN BE SMALL
We next investigate whether Microsoft’s incentive to reduce infla-tion translates to an anycast deployment with less inflation than inthe roots, representing the study of anycast CDN inflation with thebest coverage to date – measurements are from billions of users inhundreds of countries/regions and 59,000 ASes. Critically, we areable to directly compare inflation between root DNS andMicrosoft’sCDN, since we use the same methodology with broad coverage.
To measure anycast inflation for Microsoft’s CDN we use geo-graphic information and server-side measurements (§2.2). Server-side logs give us a global view of which clients hit which front-endsand the latencies they achieved. Latency is measured via server-sidelogging of TCP round-trip times. Front-ends act as TCP proxies forfetching un-cached content from data centers. Routing over theglobal WAN is near optimal [36], so measuring inflation using la-tency to front-ends (as opposed to measuring inflation using end toend latency) captures all routing inefficiency. We also use Microsoftuser locations, which are determined using an internal database.
As in Section 3, we calculate both geographic and latency infla-tion. We calculate geographic inflation as in Equation (1), except allusers in a ⟨region, AS⟩ location are assigned the mean location
SIGCOMM ’21, August 23–27, 2021, Virtual Event, USA
0 5 10 15 20 25 30 35 40Geographic Inflation per RTT (ms)
0.00.10.20.30.40.50.60.70.80.91.0
CDF
of U
sers
R28R47R74R95R110Root DNS
(a)
0 25 50 75 100 125 150 175 200Latency Inflation per RTT (ms)
0.00.10.20.30.40.50.60.70.80.91.0
CDF
of U
sers
R28R47R74R95R110Root DNS
(b)
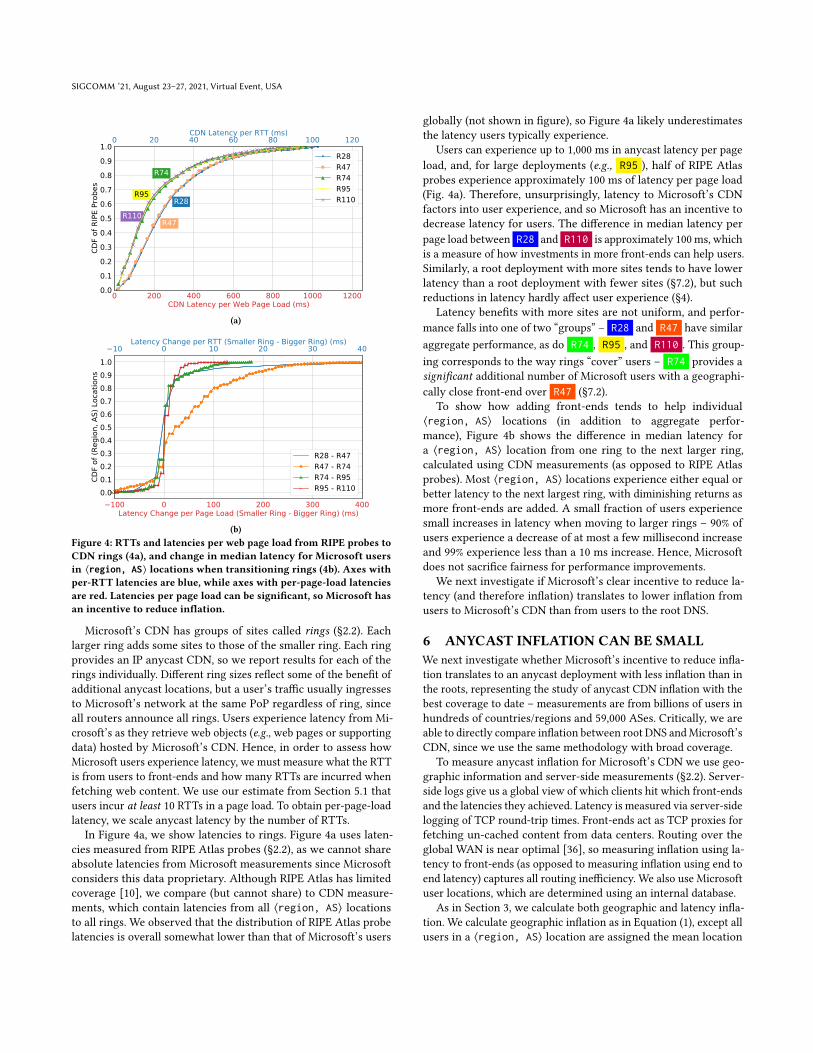
Figure 5: Inflation measured using geographic information (5a) and
CDN server side logs (5b). Inflation is more prevalent for larger
deployments but is still small for most users.
of users in the ⟨region, AS⟩ location. Anycast inflation results inextra latency for every packet (and corresponding ACK) exchangedbetween a client and an anycasted service, resulting in a per RTTcost, so we refer to inflation as “per RTT”. Application-layer inter-actions may incur this cost multiple times (as in the case of loadinga large web object from a CDN) or a single time (as in the case oftypical DNS request/response over UDP).
Microsoft users usually experience no geographic inflation(Fig. 5a, y-axis intercepts), and 85% of users experience less than10 ms (1, 000 𝑘𝑚) of geographic inflation per RTT for all rings.Conversely, 97% of root DNS users experience some geographicinflation, and 25% of users experience geographic inflation morethan 10 ms (1, 000 𝑘𝑚) per RTT. The fact that geographic inflationis larger and more prevalent in the roots than in Microsoft’s CDN(at every percentile) suggests Microsoft optimizes its deploymentto control it (§7).
We next calculate latency inflation for each ring as in Equa-tion (2). We calculate median latencies over user populationswithin a ⟨region, AS⟩ location hitting a front-end in a given ring,the assumption being that measurements from some users in a⟨region, AS⟩ location hitting the same site are representative ofall users in that ⟨region, AS⟩ location hitting that site. More than83% of such medians were taken over more than 500 measurements,so our observations should be robust. There is roughly constantlatency inflation as the number of front-ends grows (Fig. 5b),
which highlights that even though users have more low latencyoptions (front-ends), they can still take circuitous routes to closefront-ends. However, Microsoft is able to keep latency inflationbelow 30 ms for 70% of users in all rings and below 60 ms for 90%of users. In Microsoft’s CDN, 99% of users experience less than 100ms of inflation, but 10% experience more than 100 ms to the roots.
An interesting takeaway from Figure 5b is that system-wideper-query root DNS inflation is quite similar to CDN inflation, afact that is not clear from prior work [16, 51] since prior work useddifferent methodology and looked at fewer root letters. However,inflation in individual root letters is quite worse than in Microsoft’sCDN (Fig. 2b). Although inflation in the roots does not matter tomost users (§4.3), it is still interesting to see how recursive resolverscan take advantage of the thirteen independent deployments ofroot letters, and choose which letter is the best for them, in a waythat is not possible in Microsoft’s CDN.
Compared to prior work which also studied inflation in Mi-crosoft’s CDN [16], we find an improvement – 95% of users experi-ence inflation under 80 ms now compared to 85% 5 years ago. Thisimprovement (representing millions of users) is despite the factthat Microsoft’s CDN has more than doubled in size and that weuse a stricter measure of inflation, and is evidence that expansionreduces efficiency (in terms of % of users at their closest site) butinflation can be kept low through careful deployment (§7.2). Fig-ure 5b also offers a complementary view of inflation compared toprior work [16], which does not take into account that routing froma ⟨region, AS⟩ location to all front-ends might be sub-optimal.
Compared to Figure 5a, Figure 5b demonstrates there is roomfor improvement – at least half of users visit their closest front-end,but those users might take circuitous routes to those front-end asshown by the low y-axis intercepts in Figure 5b. There is still roomfor latency optimization in anycast deployments, which is an activearea of research [43, 47, 82].
7 INCENTIVES AND INVESTMENT SHAPE
DEPLOYMENTS AND PATHS
We have definitively answered the questions regarding inflationthat we posed at the end of Section 4.3. We now investigate whyinflation is so different in root DNS andMicrosoft’s CDN by lookingat path lengths (§7.1), investigate how geographical differences indeployments affect inflation (§7.2), and present reasons behind theexpansion of both root DNS and CDNs (§7.3).
7.1 Microsoft’s CDN Has Shorter AS Paths, and
Short AS Paths are More Direct
CDNs have a financial incentive to keep latency low for users andhave the resources to build efficient systems. Microsoft deploysstate-of-the-art network routing automation [68, 80], a global SDNWAN [36, 42], and expensive peering agreements when they makeeconomic sense and/or help user experience. These strategies resultin short, low latency routes between users and Microsoft.
We can capture some of these engineering efforts by measuringhow Microsoft connects to users. CDNs peer widely with end-usernetworks and so have direct paths to many users [54, 78]. Withfewer BGP decision points, paths are often less inflated [70]. Thisintuition motivates the following investigation of AS path lengths

SIGCOMM ’21, August 23–27, 2021, Virtual Event, USA
CDN AllRoots
L F J K D E C M A B0.0
0.2
0.4
0.6
0.8
1.0
Perc
ent o
f Pat
hs
2 ASes 3 ASes 4 ASes 5+ ASes
(a)
CDN AllRoots
F J K D E C A B0
20
40
60
80
Geog
raph
ic In
flatio
n (m
s)
2 ASes3 ASes4+ ASes
(b)
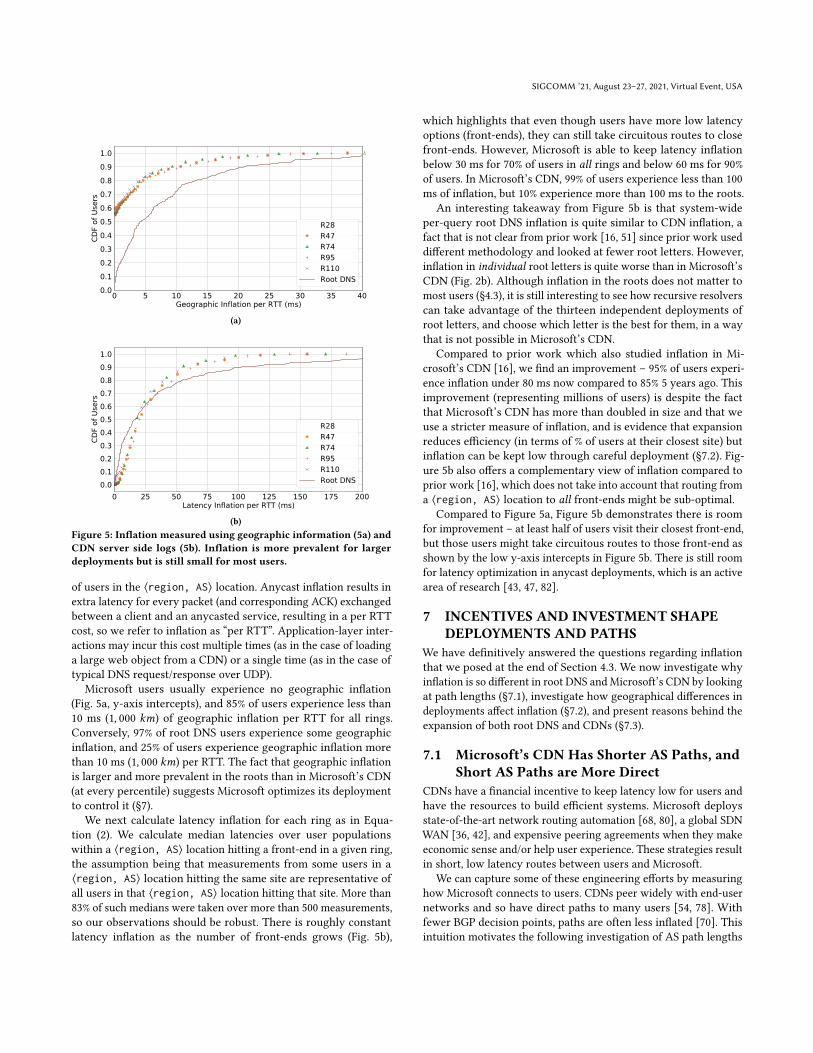
Figure 6: Distribution of the number of ASes traversed to reach
various destinations (6a) and the correlation between the AS path
length towards a destination and geographic inflation (6b). Microsoft
is closely connected to many eyeball ASes, and this connectivity
correlates with lower inflation. We group paths towards roots and
Microsoft by ⟨region, AS⟩ locations, except for ‘All Roots’ which
groups paths by ⟨region, AS, root⟩ locations.
towards roots and Microsoft and of how path lengths relate to infla-tion, which is summarized by Figure 6. Figure 6 quantifies one keydifference between root DNS and CDN deployments, but publiclyavailable data cannot capture all of Microsoft’s optimizations.
To quantify differences in AS path length between Microsoft androots, Figure 6a shows AS path lengths to roots and Microsoft fromRIPE Atlas probes. We use the maximum number of active RIPEAtlas probes for which we can calculate AS paths to all destinations,amounting to 7,200 RIPE Atlas probes in 158 countries/regions and2,400 ASes. Although RIPE Atlas probes do not have representativecoverage [10], it is the best publicly available system, and we areonly interested in qualitative, comparative conclusions.
Lengths towards Microsoft’s CDN are based on traceroutes fromactive Atlas probes in August 2020, whereas lengths towards theroots are based on traceroutes from RIPE Atlas probes in April2018 (the time of DITL).5 We perform IP to AS mapping usingTeam Cymru [25], removing IP addresses that are private, asso-ciated with IXPs, or not announced publicly by any ASes. Wemerge AS siblings together into one ‘organization’. We derive sib-ling data from CAIDA’s AS to organization dataset [15]. We grouppaths by ⟨region, AS⟩ location, except for ‘All Roots’, for whichwe group paths by ⟨region, AS, root⟩ location. We assign each⟨region, AS⟩ location equal weight; when a given ⟨region, AS⟩location hosts multiple RIPE Atlas probes that measure differentpath lengths to a given destination, the location’s weight is splitevenly across the measured lengths.
5We use AS path lengths from traceroutes towards the roots measured in 2018 inFigure 6, so that we can pair AS path length directly with 2018 DITL inflation data.
Figure 6a shows shorter paths to Microsoft than to the roots.(Weighting by traffic volumes yielded similar results.) 69% of allpaths to Microsoft only traverse two ASes (direct from RIPE Atlasprobe AS to destination AS), and only 5% of paths to Microsofttraverse four or more ASes. Conversely, between 5% and 44% pathsto root letters only traverse two ASes, and between 12% and 63% ofpaths to roots traverse four or more ASes.
To demonstrate how short AS paths tend to have lower infla-tion, Figure 6b shows the correlation between AS path length andgeographic inflation6. We compare to geographic (as opposed tolatency) inflation since we are able to calculate it for more root let-ters. For the inflation towards destinations in Figure 6b, we use thegeographic inflation associated with that ⟨region, AS⟩ locationcalculated for Figure 2 and Figure 5a. The AS path length towardseach destination is the most common AS path length measuredacross RIPE Atlas probes in the same ⟨region, AS⟩ location. Fig-ure 6b demonstrates that paths that traverse fewer ASes tend tobe inflated less. All Roots shows that this is true globally, acrossroot letters, and the results for each individual root letter showsgeographic inflation is less for paths traversing 2 ASes than it is forpaths traversing more (except for B and E root). The relationshipbetween inflation and AS path length is very different across rootletters, which is evidence of different deployment strategies.
Overall, our results demonstrate that shorter paths tend to haveless inflation, users have shorter paths toMicrosoft than towards theroots, and Microsoft tends to have less inflation across path lengths.We believe these observations are a result of strategic businessinvestments that Microsoft puts toward peering and optimizing itsrouting and infrastructure. In addition to shorter AS paths generallybeing less inflated [70], direct paths toMicrosoft’s CDN in particularsidestep the challenges of BGP by aligning the best performingpaths with the BGP decision process [20]. Direct paths will usuallybe preferred according to BGP’s top criteria, local preference andAS path length (because by definition they are the shortest andfrom a peer, and ASes usually set local preference to prefer peerroutes in the absence of customer routes, which for Microsoft willonly exist during a route leak/hijack). Among the multiple directpaths to Microsoft that a router may learn when its AS connectsto Microsoft in different locations, the decision will usually fallto lowest IGP cost, choosing the nearest egress into Microsoft.Microsoft collocates anycast sites with all its peering locations, andso the nearest egress will often (and, in the case of the largest ring,always) be collocated with the nearest anycast site, aligning earlyexit routing with global optimization in a way that is impossible inthe general case or with longer AS paths [70]. At smaller ring sizes,Microsoft can use traffic engineering (for example, not announcingto particular ASes at particular peering points) when it observesan AS making poor routing decisions.
7.2 Larger Deployments are Less Efficient but
Have Lower Latency
CDN latency in Figure 4a and inflation in Figure 5 reveal a rela-tionship that some may find non-intuitive – as deployment size
6The plot is a box-and-whisker, with the 5 horizontal lines from bottom to top foreach ⟨deployment, AS path length⟩ representing minimum, first quartile, median,third quartile, and maximum values.
SIGCOMM ’21, August 23–27, 2021, Virtual Event, USA
0 50 100Number of Global Sites
20
40
60
80
100
120
140
160
Med
ian
Late
ncy
(ms)
R28 R47R74 R95 R110
A
B
C DE F
H
IJK L
M
0 50 100Number of Global Sites
0.3
0.4
0.5
0.6
Effic
ienc
y (%
of U
sers
)
R28
R47R74
R95 R110B
A
M
CE
D
K
J
F
L
(a)
250 500 750 1000 1250 1500 1750 2000Coverage Radius of Site (km)
0.00.10.20.30.40.50.60.70.80.91.0
Perc
ent o
f Use
r Pop
ulat
ion All Roots
R110L - 138R95F - 94R74J - 68R47K - 52R28D - 20
(b)
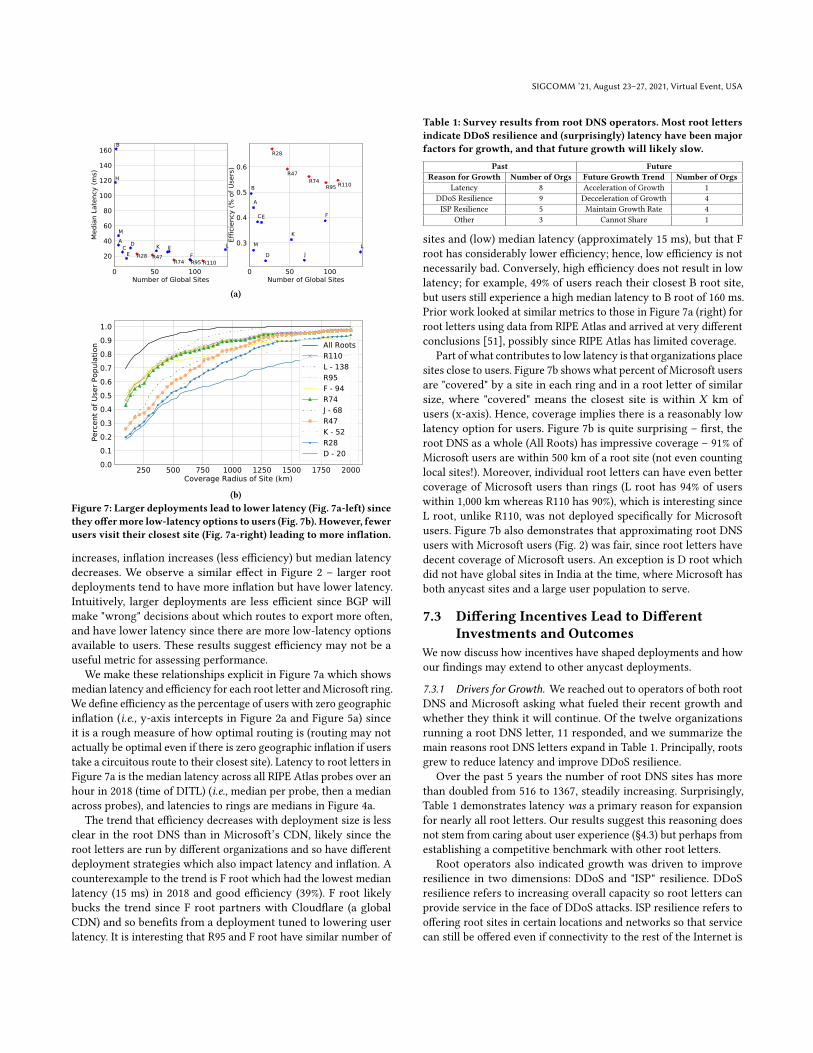
Figure 7: Larger deployments lead to lower latency (Fig. 7a-left) since
they offermore low-latency options to users (Fig. 7b). However, fewer
users visit their closest site (Fig. 7a-right) leading to more inflation.
increases, inflation increases (less efficiency) but median latencydecreases. We observe a similar effect in Figure 2 – larger rootdeployments tend to have more inflation but have lower latency.Intuitively, larger deployments are less efficient since BGP willmake "wrong" decisions about which routes to export more often,and have lower latency since there are more low-latency optionsavailable to users. These results suggest efficiency may not be auseful metric for assessing performance.
We make these relationships explicit in Figure 7a which showsmedian latency and efficiency for each root letter andMicrosoft ring.We define efficiency as the percentage of users with zero geographicinflation (i.e., y-axis intercepts in Figure 2a and Figure 5a) sinceit is a rough measure of how optimal routing is (routing may notactually be optimal even if there is zero geographic inflation if userstake a circuitous route to their closest site). Latency to root letters inFigure 7a is the median latency across all RIPE Atlas probes over anhour in 2018 (time of DITL) (i.e., median per probe, then a medianacross probes), and latencies to rings are medians in Figure 4a.
The trend that efficiency decreases with deployment size is lessclear in the root DNS than in Microsoft’s CDN, likely since theroot letters are run by different organizations and so have differentdeployment strategies which also impact latency and inflation. Acounterexample to the trend is F root which had the lowest medianlatency (15 ms) in 2018 and good efficiency (39%). F root likelybucks the trend since F root partners with Cloudflare (a globalCDN) and so benefits from a deployment tuned to lowering userlatency. It is interesting that R95 and F root have similar number of
Table 1: Survey results from root DNS operators. Most root letters
indicate DDoS resilience and (surprisingly) latency have been major
factors for growth, and that future growth will likely slow.
Past Future
Reason for Growth Number of Orgs Future Growth Trend Number of Orgs
Latency 8 Acceleration of Growth 1DDoS Resilience 9 Decceleration of Growth 4ISP Resilience 5 Maintain Growth Rate 4
Other 3 Cannot Share 1
sites and (low) median latency (approximately 15 ms), but that Froot has considerably lower efficiency; hence, low efficiency is notnecessarily bad. Conversely, high efficiency does not result in lowlatency; for example, 49% of users reach their closest B root site,but users still experience a high median latency to B root of 160 ms.Prior work looked at similar metrics to those in Figure 7a (right) forroot letters using data from RIPE Atlas and arrived at very differentconclusions [51], possibly since RIPE Atlas has limited coverage.
Part of what contributes to low latency is that organizations placesites close to users. Figure 7b shows what percent of Microsoft usersare "covered" by a site in each ring and in a root letter of similarsize, where "covered" means the closest site is within 𝑋 km ofusers (x-axis). Hence, coverage implies there is a reasonably lowlatency option for users. Figure 7b is quite surprising – first, theroot DNS as a whole (All Roots) has impressive coverage – 91% ofMicrosoft users are within 500 km of a root site (not even countinglocal sites!). Moreover, individual root letters can have even bettercoverage of Microsoft users than rings (L root has 94% of userswithin 1,000 km whereas R110 has 90%), which is interesting sinceL root, unlike R110, was not deployed specifically for Microsoftusers. Figure 7b also demonstrates that approximating root DNSusers with Microsoft users (Fig. 2) was fair, since root letters havedecent coverage of Microsoft users. An exception is D root whichdid not have global sites in India at the time, where Microsoft hasboth anycast sites and a large user population to serve.
7.3 Differing Incentives Lead to Different
Investments and Outcomes
We now discuss how incentives have shaped deployments and howour findings may extend to other anycast deployments.
7.3.1 Drivers for Growth. We reached out to operators of both rootDNS and Microsoft asking what fueled their recent growth andwhether they think it will continue. Of the twelve organizationsrunning a root DNS letter, 11 responded, and we summarize themain reasons root DNS letters expand in Table 1. Principally, rootsgrew to reduce latency and improve DDoS resilience.
Over the past 5 years the number of root DNS sites has morethan doubled from 516 to 1367, steadily increasing. Surprisingly,Table 1 demonstrates latency was a primary reason for expansionfor nearly all root letters. Our results suggest this reasoning doesnot stem from caring about user experience (§4.3) but perhaps fromestablishing a competitive benchmark with other root letters.
Root operators also indicated growth was driven to improveresilience in two dimensions: DDoS and "ISP" resilience. DDoSresilience refers to increasing overall capacity so root letters canprovide service in the face of DDoS attacks. ISP resilience refers tooffering root sites in certain locations and networks so that servicecan still be offered even if connectivity to the rest of the Internet is
SIGCOMM ’21, August 23–27, 2021, Virtual Event, USA
severed. According to both operator responses and publicly avail-able sources, growth additionally stems from open hosting policies[40, 62, 74] (almost any AS can volunteer to host a new site) andfrom teaming up with large CDNs like Cloudflare. Root operatorresponses about future plans for growth suggest that the increaseof root DNS sites will slow in the coming years.
With such decentralized deployment (in part by design to pro-mote resilience), coordinated optimization of root DNS latency isdifficult, even if latency optimization were a goal. By contrast, Mi-crosoft’s CDN is latency-sensitive and is centrally run. Operatorsoptimize and monitor latency, thereby minimizing inflation (§6)with direct paths to many users (§7.1). Unlike some root letters,Microsoft does not (externally) compare latency with other CDNs,considering latency proprietary. Construction of new front-endsoften follows business needs to support new markets. These com-mercial motivations contrast with the above root DNS reasons forexpansion, yet the number of front-ends for Microsoft’s CDN hasmore than doubled in the past five years.
7.3.2 Other Anycast Systems. A key takeaway from our resultsis that one cannot generalize our results to other systems usinganycast. Anycast must be assessed in the context of the system inwhich it resides. Prior work took the results of one system (rootDNS) and assumed it applied generally to a technique (anycast)which resulted in misleading conclusions [51]. It would be difficultto even extend our results to systems with similar deployments,since the degree to which performance improvements are due tothe deployment and the degree to which they are due to tuning ofroute configurations is unknown [9].
Other systems using anycast include Akamai DNS authoritativeresolvers [1], Google Cloud VMs [32], and Google Public DNS[31]. All of these services have different performance requirementsfor users; i.e., they all want inflation to be "low" but how "low"it needs to be depends on the application. For example, GoogleCloud VMs can host game engines which have much stricter latencyrequirements than fetching HTTP objects. We hope future workwill take these considerations into account when assessing anycast.
8 RELATEDWORK
Root DNS Anycast. Many prior studies look at latency and in-flation performance in the root DNS [13, 51, 52, 67, 69]. Our workbuilds on these studies, conducting analysis for nearly every rootletter and calculating inflation for millions of recursives in 35,000ASes. These larger scale measurements offer broad coverage, en-able comparisons among root letter deployments, and allow us toassess inflation in the root DNS system as a whole. We also cal-culate latency inflation differently than in prior work, which webelieve offers a useful, orthogonal picture of inflation, and calculateinflation using the same methodology for both Microsoft’s androot DNS, which allows us to compare inflation directly betweenMicrosoft’s CDN and root DNS (not possible with prior studies).Finally, we place latency and inflation in the context of user experi-ence, while prior work on the root DNS does not. Other prior worklooks at anycast’s ability defend against DDoS attacks [58, 67]; wedo not consider anycast’s performance in this context. Other priorwork discussed how ad-hoc anycast deployments can lead to poorperformance and load balancing and is an early study of inflation
in the root DNS [13]. Our work supports these conclusions anduses them in a larger conversation about anycast in the contextof applications. We also confirm observations in prior work thatanycast site affinity is high [12], at least over the duration of DITL.
CDN Anycast. Some CDNs use IP anycast [16, 21, 30, 65, 75].Some prior work looked at inflation in CDNs [16], finding it tobe similarly low. Our work presents a much larger study of la-tency and inflation (more than twice as many front-ends, ordersof magnitude more users and measurements), updating the numer-ical results and lending confidence to the result that inflation islow; places performance metrics in the context of user experience;compares performance to other systems that use anycast; and pro-vides some evidence of how CDNs can keep inflation low. Otherprior work looked at how prefix announcement configurationscan impact the performance of an anycast CDN [54]. More recentwork has investigated how to diagnose and improve anycast perfor-mance through measurements in production systems [17, 43, 76].Concurrent work examined addressing challenges faced by CDNs,proposing a scheme to decouple addressing from services that iscompatible with anycast [27]. Our work characterizes, rather thanchanges, anycast CDN performance.
Recursive Resolvers, The Benefits of Caching, andWeb Performance.Prior work has looked at statistics and latency implications of localresolvers [18, 44]. We calculate similar statistics using recent data.Some previous work looked at certain pathological behaviors ofpopular recursives and the implications these behaviors have onroot DNS load times [34, 49, 73, 81]. We present additional patho-logical behavior of a popular recursive in Appendix E. Many studiescharacterize web performance and consider DNS’s role in a pageload [8, 11, 72], although none consider how root DNS specificallycontributes to page load time and how this relates to user experi-ence. Recent work considers placing DNS in the context of otherapplications but does not look at root DNS latency in particular [6].
9 CONCLUSION
While anycast performance is interesting in its own right, priorstudies have drawn conclusions primarily from anycast for rootDNS [51].We have shown that anycast operates differently in CDNs,with less inflation. Differences stem from the impact the anycastservice’s latency and inflation has on user-perceived latency. Ourresults show the importance of considering multiple subjects inmeasurement studies and suggest why anycast continues to seewide, growing deployment.
Acknowledgements. This paper has been partially funded byNSF CNS-1835253 and NSF CNS-1836872. John Heidemann’s workwas supported in part by NSF CNS-1925737 and OAC-1739034. Wewould like to thank our shepherd Xiaowei Yang and the anonymousreviewers for their insightful comments, root DNS operators fortheir feedback on our analysis, and Dave Levin and Marcel Floresfor their detailed feedback on an early draft of the paper.

SIGCOMM ’21, August 23–27, 2021, Virtual Event, USA
REFERENCES
[1] Akamai. 2020. Designing DNS for Availability and Resilience Against DDoSAttacks. akamai.com/us/en/multimedia/documents/white-paper/akamai-designing-dns-for-availability-and-resilience-against-ddos-attacks.pdf
[2] Akamai. 2021. Akamai Compliance Programs. akamai.com/us/en/about/compliance/
[3] Mehmet Akcin. 2015. Comparing Root Server Performance Around the World.thousandeyes.com/blog/comparing-dns-root-server-performance
[4] Adiel Akplogan, Roy Arends, David Conrad, Alain Durand, Paul Hoffman, DavidHuberman, Matt Larson, Sion Lloyd, Terry Manderson, David Soltero, SamanehTajalizadehkhoob, and Mauricio Vergara Ereche. 2020. Analysis of the Effectsof COVID-19-Related Lockdowns on IMRS Traffic. (April 2020). icann.org/en/system/files/files/octo-008-en.pdf
[5] Mark Allman. 2019. On Eliminating Root Nameservers from the DNS. In Proceed-ings of the 18𝑡ℎ ACM Workshop on Hot Topics in Networks (HOTNETS) (Princeton,NJ, USA). ACM.
[6] Mark Allman. 2020. Putting DNS in Context. In Proceedings of the 2020 InternetMeasurement Conference (IMC) (Online). ACM.
[7] Amazon. 2020. Amazon Route 53 FAQs. aws.amazon.com/route53/faqs/[8] Internet Archive. 2020. The HTTP Archive Project. httparchive.org/[9] Todd Arnold, Matt Calder, Italo Cunha, Arpit Gupta, Harsha V. Madhyastha,
Michael Schapira, and Ethan Katz-Bassett. 2019. Beating BGP is Harder than weThought. In Proceedings of the 18𝑡ℎ ACM Workshop on Hot Topics in Networks(HOTNETS) (Princeton, NJ, USA). ACM.
[10] ToddArnold, Ege Gürmeriçliler, Georgia Essig, Arpit Gupta,Matt Calder, VasileiosGiotsas, and Ethan Katz-Bassett. 2020. (HowMuch) Does a Private WAN ImproveCloud Performance? In INFOCOM (Online). IEEE.
[11] Alemnew Sheferaw Asrese, Pasi Sarolahti, Magnus Boye, and Jorg Ott. 2016.WePR: A Tool for Automated Web Performance Measurement. In 2016 IEEEGlobecom Workshops (Washington D.C., USA). IEEE.
[12] Hitesh Ballani and Paul Francis. 2005. Towards a Global IP Anycast Service.In Proceedings of the 2005 ACM SIGCOMM Conference (Philadelphia, PA, USA).ACM.
[13] Hitesh Ballani, Paul Francis, and Sylvia Ratnasamy. 2006. A Measurement-Based Deployment Proposal for IP Anycast. In Proceedings of the 2006 InternetMeasurement Conference (IMC) (Rio de Janeiro, Brazil). ACM.
[14] Ray Bellis. 2015. Researching F-root Anycast Placement Using RIPE At-las. labs.ripe.net/author/ray_bellis/researching-f-root-anycast-placement-using-ripe-atlas/
[15] CAIDA. 2020. Inferred AS to Organization Mapping Dataset. caida.org/data/as-organizations/
[16] Matt Calder, Ashley Flavel, Ethan Katz-Bassett, Ratul Mahajan, and JitendraPadhye. 2015. Analyzing the Performance of an Anycast CDN. In Proceedings ofthe 2015 Internet Measurement Conference (IMC) (Tokyo, Japan). ACM.
[17] Matt Calder, Ryan Gao, Manuel Schröder, Ryan Stewart, Jitendra Padhye, RatulMahajan, Ganesh Ananthanarayanan, and Ethan Katz-Bassett. 2018. Odin: Mi-crosoft’s Scalable Fault-Tolerant CDN Measurement System. In 15𝑡ℎ USENIXSymposium on Networked Systems Design and Implementation (NSDI) (Renton,WA, USA). USENIX.
[18] Thomas Callahan, Mark Allman, and Michael Rabinovich. 2013. On Modern DNSBehavior and Properties. ACM SIGCOMM Computer Communication Review (July2013).
[19] Neal Cardwell, Stefan Savage, and Tom Anderson. 2000. Modelling TCP Latency.In INFOCOM (Tel-Aviv, Israel). IEEE.
[20] Yi-Ching Chiu, Brandon Schlinker, Abhishek Balaji Radhakrishnan, Ethan Katz-Bassett, and Ramesh Govindan. 2015. Are We One Hop Away from a BetterInternet? In Proceedings of the 2015 Internet Measurement Conference (IMC) (Tokyo,Japan). ACM.
[21] Danilo Cicalese, Jordan Augé, Diana Joumblatt, Timur Friedman, and Dario Rossi.2015. Characterizing IPv4 Anycast Adoption and Deployment. In Proceedings ofthe 11𝑡ℎ ACM Conference on Emerging Networking Experiments and Technologies(CoNEXT) (Heidelberg, Germany). ACM.
[22] Cloudflare. 2020. What is DNS? cloudflare.com/learning/dns/what-is-dns/[23] Lorenzo Colitti, Erik Romijn, Henk Uijterwaal, and Andrei Robachevsky. 2006.
Evaluating the Effects of Anycast on DNS Root Name Servers. RIPE DocumentRIPE-393 (Oct. 2006).
[24] Gerald Combs. 2020. Tshark. wireshark.org/docs/man-pages/tshark.html[25] Team Cymru. 2020. IP to ASN Mapping Service. team-cymru.com/community-
services/ip-asn-mapping/[26] DNS-OARC. 2018. A Day in the Life of the Internet. dns-oarc.net/oarc/data/
ditl/2018[27] Marwan Fayed, Lorenz Bauer, Vasileios Giotsas, Sami Kerola, Marek Majkowski,
Pavel Odinstov, Jakub Sitnicki, Taejoong Chung, Dave Levin, Alan Mislove,Christopher A.Wood, and Nick Sullivan. 2021. The Ties that un-Bind: DecouplingIP from Web Services and Sockets for Robust Addressing Agility at CDN-Scale.In Proceedings of the 2021 ACM SIGCOMM Conference (Online). ACM.
[28] Hongyu Gao, Vinod Yegneswaran, Jian Jiang, Yan Chen, Phillip Porras, ShaliniGhosh, and Haixin Duan. 2014. Reexamining DNS from a Global Recursive
Resolver Perspective. IEEE/ACM Transactions on Networking (Oct. 2014).[29] Manaf Gharaibeh, Han Zhang, Christos Papadopoulos, and John Heidemann.
2016. Assessing Co-locality of IP Blocks. In Proceedings of 19𝑡ℎ IEEE GlobalInternet Symposium (San Francisco, CA, USA). IEEE.
[30] Danilo Giordano, Danilo Cicalese, Alessandro Finamore, Marco Mellia, MaurizioMunafò, Diana Zeaiter Joumblatt, and Dario Rossi. 2016. A First Characterizationof Anycast Traffic from Passive Traces. In Network Traffic Measurement andAnalysis Conference (TMA) (Louvain la Neuve, Belgium). IFIP/ACM.
[31] Google. 2020. Google Public DNS. developers.google.com/speed/public-dns[32] Google. 2021. Cloud Load Balancing. cloud.google.com/load-balancing[33] GTmetrix. 2019. The Top 1,000 Sites on the Internet. gtmetrix.com/top1000.html[34] Wes Hardaker. 2020. What’s in a Name? blog.apnic.net/2020/04/13/whats-in-a-
name/[35] John Heidemann, Katia Obraczka, and Joe Touch. 1997. Modelling the Perfor-
mance of HTTP Over Several Transport Protocols. ACM/IEEE Transactions onNetworking (Oct. 1997).
[36] Chi-Yao Hong, Srikanth Kandula, Ratul Mahajan, Ming Zhang, Vijay Gill, MohanNanduri, and RogerWattenhofer. 2013. Achieving High Utilization with Software-Driven WAN. In Proceedings of the 2013 ACM SIGCOMM Conference (Hong Kong).ACM.
[37] Geoff Huston. 2014. How Big is that Network? labs.apnic.net/?p=526[38] IANA. 2020. IANA IPv4 Special-Purpose Address Registry. iana.org/assignments/
iana-ipv4-special-registry/iana-ipv4-special-registry.xhtml[39] IANA. 2020. Root Servers. root-servers.org[40] ICANN. 2020. Packet Clearing House. icannwiki.org/Packet_Clearing_House[41] MaxMind Inc. 2020. IP Geolocation. maxmind.com/en/geoip2-databases[42] Sushant Jain, Alok Kumar, Subhasree Mandal, Joon Ong, Leon Poutievski, Arjun
Singh, Subbaiah Venkata, Jim Wanderer, Junlan Zhou, and Min Zhu. 2013. B4:Experience with a Globally-Deployed Software Defined WAN. In Proceedings ofthe 2013 ACM SIGCOMM Conference (Hong Kong). ACM.
[43] Yuchen Jin, Sundararajan Renganathan, Ganesh Ananthanarayanan, JunchenJiang, Venkata N Padmanabhan, Manuel Schroder, Matt Calder, and ArvindKrishnamurthy. 2019. Zooming in on Wide-Area Latencies to a Global CloudProvider. In Proceedings of the 2019 ACM SIGCOMM Conference. ACM.
[44] Jaeyeon Jung, Emil Sit, Hari Balakrishnan, and Robert Morris. 2002. DNS Perfor-mance and the Effectiveness of Caching. IEEE/ACM Transactions on networking(Feb. 2002).
[45] Dina Katabi and John Wroclawski. 2000. A Framework for Global IP-Anycast(GIA). In Proceedings of the 2000 ACM SIGCOMM Conference (Stockholm, Sweden).ACM.
[46] Ethan Katz-Bassett, John P. John, Arvind Krishnamurthy, David Wetherall,Thomas Anderson, and Yatin Chawathe. 2006. Towards IP Geolocation Using De-lay and Topology Measurements. In Proceedings of the 2006 Internet MeasurementConference (IMC) (Rio de Janeiro, Brazil). ACM.
[47] Rupa Krishnan, Harsha V. Madhyastha, Sridhar Srinivasan, Sushant Jain, ArvindKrishnamurthy, Thomas Anderson, and Jie Gao. 2009. Moving Beyond End-to-End Path Information to Optimize CDN Performance. In Proceedings of the 2009Internet Measurement Conference (IMC) (Chicago, IL, USA). ACM.
[48] W. Kumari and P. Hoffman. 2020. Running a Root Server Local to a Resolver.Technical Report 8806. Internet Request For Comments. www.rfc-editor.org/rfc/rfc8806.txt
[49] Matthew Lentz, Dave Levin, Jason Castonguay, Neil Spring, and Bobby Bhat-tacharjee. 2013. D-mystifying the D-root Address Change. In Proceedings of the2013 Internet Measurement Conference (IMC) (Barcelona, Spain). ACM.
[50] Zhihao Li. 2019. Diagnosing and Improving the Performance of Internet Anycast.Ph.D. Dissertation. University of Maryland, College Park.
[51] Zhihao Li, Dave Levin, Neil Spring, and Bobby Bhattacharjee. 2018. InternetAnycast: Performance, Problems, & Potential. In Proceedings of the 2018 ACMSIGCOMM Conference (Budapest, Hungary). ACM.
[52] Jinjin Liang, Jian Jiang, Haixin Duan, Kang Li, and Jianping Wu. 2013. MeasuringQuery Latency of Top Level DNS Servers. In International Conference on Passiveand Active Network Measurement (PAM) (Hong Kong). Springer.
[53] Zhuoqing Morley Mao, Charles Cranor, Fred Douglis, Michael Rabinovich, OliverSpatscheck, and Jia Wang. 2002. A Precise and Efficient Evaluation of the Prox-imity Between Web Clients and their Local DNS Servers. In USENIX AnnualTechnical Conference (Monterey, CA, USA). USENIX.
[54] Stephen McQuistin, Sree Priyanka Uppu, and Marcel Flores. 2019. Taming Any-cast in the Wild Internet. In Proceedings of the 2019 Internet Measurement Confer-ence (IMC) (Amsterdam, Netherlands). ACM.
[55] Christopher Metz. 2002. IP Anycast Point-To-(Any) Point Communication. IEEEInternet Computing (Aug. 2002).
[56] P. Mockapetris. 1987. Domain Names - Implementation and Specification. ietf.org/rfc/rfc1035.txt
[57] Giovane C. M. Moura, John Heidemann,Wes Hardaker, Jeroen Bulten, Joao Ceron,and Cristian Hesselman. 2020. Old But Gold: Prospecting TCP to Engineer DNSAnycast (extended). ISI-TR-740, USC/Information Sciences Institute, Tech. Report(2020).

SIGCOMM ’21, August 23–27, 2021, Virtual Event, USA
[58] Giovane C. M. Moura, Ricardo de Oliveira Schmidt, John Heidemann, Wouter B.de Vries, Moritz Muller, Lan Wei, and Cristian Hesselman. 2016. Anycast vs.DDoS: Evaluating the November 2015 Root DNS Event. In Proceedings of the 2016Internet Measurement Conference (IMC) (Santa Monica, CA, USA). ACM.
[59] Mozilla. 2020. Window: Load Event. developer.mozilla.org/en-US/docs/Web/API/Window/load_event
[60] Moritz Müller, Giovane C. M. Moura, Ricardo de Oliveira Schmidt, and JohnHeidemann. 2017. Recursives in theWild: Engineering Authoritative DNS Servers.In Proceedings of the 2017 Internet Measurement Conference (IMC) (London, UnitedKingdom). ACM.
[61] RIPE NCC. 2006. Evaluating The Effects Of Anycast On DNS Root Nameservers.ripe.net/publications/docs/ripe-393#efficiency
[62] RIPE NCC. 2018. Hosting a K-root Node. ripe.net/analyse/dns/k-root/hosting-a-k-root-node
[63] OpenDNS. 2020. Data Center Locations. opendns.com/data-center-locations/[64] Craig Partridge, Trevor Mendez, and Walter Milliken. 1993. Host Anycasting
Service. tools.ietf.org/html/rfc1546[65] Matthew Prince. 2013. Load Balancing without Load Balancers. blog.cloudflare.
com/cloudflares-architecture-eliminating-single-p/[66] Jan Rüth, Christian Bormann, and Oliver Hohlfeld. 2017. Large-Scale Scanning of
TCP’s Initial Window. In Proceedings of the 2017 Internet Measurement Conference(IMC) (London, United Kingdom).
[67] Sandeep Sarat, Vasileios Pappas, and Andreas Terzis. 2006. On the Use of Anycastin DNS. In Proceedings of the ACM SIGMETRICS Conference (Banff, Canada). ACM.
[68] Brandon Schlinker, Hyojeong Kim, Timothy Cui, Ethan Katz-Bassett, Harsha V.Madhyastha, Italo Cunha, James Quinn, Saif Hasan, Petr Lapukhov, and HongyiZeng. 2017. Engineering Egress with Edge Fabric: Steering Oceans of Content tothe World. In Proceedings of the 2017 ACM SIGCOMM Conference (Los Angeles,CA, USA). ACM.
[69] Ricardo de Oliveira Schmidt, John Heidemann, and Jan Harm Kuipers. 2017.Anycast Latency: How Many Sites Are Enough? In International Conference onPassive and Active Network Measurement (PAM) (Sydney, Australia). Springer.
[70] Neil Spring, Ratul Mahajan, and Thomas Anderson. 2003. The Causes of PathInflation. In Proceedings of the 2003 conference on Applications, technologies, ar-chitectures, and protocols for computer communications (Karlsruhe, Germany).
ACM.[71] RIPE NCC Staff. 2015. RIPE Atlas: A Global Internet Measurement Network.
Internet Protocol Journal (2015).[72] Srikanth Sundaresan, NazaninMagharei, Nick Feamster, Renata Teixeira, and Sam
Crawford. 2013. Web Performance Bottlenecks in Broadband Access Networks.In Proceedings of the ACM SIGMETRICS Conference (Pittsburgh, PA, USA). ACM.
[73] Matthew Thomas. 2020. Chromium’s Impact on Root DNS Traffic. blog.apnic.net/2020/08/21/chromiums-impact-on-root-dns-traffic
[74] Verisign. 2021. FAQ on RIRS Node Hosting. verisign.com/en_US/domain-names/internet-resolution/node-hosting/index.xhtml
[75] Verizon. 2020. verizondigitalmedia.com/media-platform/delivery/network/[76] Lan Wei, Marcel Flores, Harkeerat Bedi, and John Heidemann. 2020. Bidirec-
tional Anycast/Unicast Probing (BAUP): Optimizing CDN Anycast. In NetworkOperations and Management Symposium (Online). IEEE/IFIP.
[77] Lan Wei and John Heidemann. 2017. Does Anycast Hang Up on You? In NetworkTraffic Measurement and Analysis Conference (TMA) (Dublin, Ireland). IFIP/ACM.
[78] Florian Wohlfart, Nikolaos Chatzis, Caglar Dabanoglu, Georg Carle, and WalterWillinger. 2018. Leveraging Interconnections for Performance: The Serving In-frastructure of a Large CDN. In Proceedings of the 2018 ACM SIGCOMMConference(Budapest, Hungary). ACM.
[79] Young Xu. 2017. 2017 Update: Comparing Root Server Performance Glob-ally. thousandeyes.com/blog/2017-update-comparing-root-server-performance-globally/
[80] Kok-Kiong Yap, Murtaza Motiwala, Jeremy Rahe, Steve Padgett, Matthew Holli-man, Gary Baldus, Marcus Hines, Taeeun Kim, Ashok Narayanan, Ankur Jain,et al. 2017. Taking the Edge off with Espresso: Scale, Reliability and Programma-bility for Global Internet Peering. In Proceedings of the 2017 ACM SIGCOMMConference (Los Angeles, CA, USA). ACM.
[81] Yingdi Yu, Duane Wessels, Matt Larson, and Lixia Zhang. 2012. Authority ServerSelection in DNS Caching Resolvers. ACM SIGCOMM Computer CommunicationReview (April 2012).
[82] Yaping Zhu, Benjamin Helsley, Jennifer Rexford, Aspi Siganporia, and SridharSrinivasan. 2012. LatLong: Diagnosing Wide-Area Latency Changes for CDNs.IEEE Transactions on Network and Service Management (2012).

SIGCOMM ’21, August 23–27, 2021, Virtual Event, USA
10−3 10−2 10−1 100 101 102 103
Queries per User per Day
0.0
0.2
0.4
0.6
0.8
1.0
CDF
of U
sers
IdealCDNAPNIC
Figure 8: Daily queries by users to the root DNS, calculated by amor-
tizing root DNS requests over user populations, when including or
excluding queries for invalid TLDs. Counting invalid queries dras-
tically increases median daily query counts to 22 ( CDN ), a 20-fold
increase, or to 6 ( APNIC ), a 6-fold increase, depending on which user
data we use.
Appendices are supporting material that has not been peer-reviewed.
A SUMMARY OF DATA
We use a myriad of datasets in the work, which is a result of ourpresenting answers to the questions we pose in several differentways (each with strengths and weaknesses). This approach allowsus to overcome the limitations of individual datasets, by combiningmultiple views with different tradeoffs. To aid in comprehensibility,we summarize each of our datasets in Table 2 and Table 3.
As an example of how we use multiple views with differenttradeoffs, consider the differences between the DITL packet traces(containing 51.9 billion queries across 50,000 ASes) and our localDNS / activity measurements (10 thousand measurements, 2 users).DITL allows us to see, globally, how recursive resolvers interactwith the root DNS, allowing us to make definitive statements aboutglobal inflation and query volumes. However, DITL does not tellus how individual users interact with the root DNS, and translat-ing DITL queries to user experience requires heuristic argumentsabout caching (§4.3). Our local DNS and activity measurements,although limited, give us precise reference points for how root DNSfactors into everyday Internet browsing experience, which we findvaluable.
B QUANTIFYING THE IMPACT OF
METHODOLOGICAL DECISIONS
When analyzing latency and inflation, we often make assumptionsor choose to conduct analysis a certain way. In what follows, we jus-tify our various assumptions and pre-processing steps, and analyzethe effects of these assumptions on our results.
B.1 Effect of Removing Invalid TLD Queries
In Section 4 we estimate the number of queries users experiencedue to the root DNS by amortizing queries over user populations.Out of 51.9 billion daily requests to all roots, we observe 31 billiondaily requests for bogus domain names and 2 billion daily requestsfor PTR records. We choose to not count these towards user querycounts, because we believe many of these queries do not lie on thecritical path of user applications and so do not cause user-facing
latency. This decision has a significant effect on conclusions we candraw, decreasing daily query counts to root DNS resolution by 20×.
We base this decision on prior work which investigated thenature of queries with invalid TLDs landing at the roots. ICANNhas found that 28% of queries for non-existent domains at L rootresult from captive-portal detection algorithms in Chromium-basedbrowsers [4]. Researchers at USC have found that more than 90% ofsingle-string (not separated by dots) queries at the root match theChromium captive-portal pattern [34]. We remove captive-portaldetection queries from consideration since they occur on browserstartup and network reconnect, not during regular browsing, andthey can occur in parallel with browsing.
Some might argue that queries for invalid TLDs are associatedwith user latency because typos for URLs (when typing into abrowser search bar, for example) cause users to generate a queryto the root servers. However, typos only generate a query to theroot server if the TLD is misspelled (as opposed to the hostname).Hence typos, in general, cause users latency, but only specific typoswill cause users root latency. Moreover, prior work has found thatapproximately 60% of queries for invalid TLDs reaching root serversare for domains such as local, no_dot, belkin, and corp [28]. It isunlikely these queries are caused by typos, since they are actual (asopposed to misspelled) words and resemble domains often seen insoftware or in corporate networks. Chromium queries and queriesfor a certain set of invalid TLDs therefore account for around 86%of all queries for invalid TLDs at the roots, suggesting the vastmajority of queries we exclude are not directly associated with userlatency.
Nevertheless, it is still valuable to assess how including thesequeries for invalid TLDs changes the conclusions we can makeabout root DNS latency experienced by users. Figure 8 shows dailyuser latencies due to root DNS resolution when we include requestsfor invalid TLDs and PTR records in daily query volumes. UsingCDN user counts, users experience a median of 22 queries to theroot DNS each day – about 20×more thanwhenwe exclude requestsfor invalid queries (§4). This drastic 20-fold increase is surprisinggiven we only (roughly) double the amount of queries by includinginvalid queries. The difference is best explained by the fact thata majority of invalid queries are generated by /24s with a largenumber of users. Since the y-axis of Figure 8 is the number of users(not /24s), counting invalid queries shifts the graph far to the right.Hence, counting invalid queries drastically affects the conclusionswe can draw. There is a less severe 6-fold increase in the numberof queries per user per data calculated using APNIC data. Overall,including invalid TLD queries drastically changes our quantitativeconclusions about user interaction with the root DNS but may notchange our qualitative conclusions, since 20 queries a day to theroots is still small.
B.2 Representativeness of Daily Root Latency
Analysis
In Section 4 we estimate the number of queries users experience dueto the root DNS by amortizing queries over user populations. Toobtain estimates of user populations, we obtain counts of Microsoftusers who use recursives (§2.1). Naturally recursives used by Mi-crosoft users and recursives seen in DITL do not overlap perfectly.

SIGCOMM ’21, August 23–27, 2021, Virtual Event, USA
Table 2: Summary of Datasets
Dataset
# of
MeasurementsDuration Year
# of
ASesTechnology/Format
Sampled CDN Server-Side Logs (§6) 11.0 ×10⁹ 1 week 2019 59 000 Windows TCP/IP, HTTPService (TCP RTT)Sampled CDN Client-Side Measurements (§5.2) 50.0 ×10⁷ 1 week 2019 10 600 Odin [17] (HTTP GET)CDN User Counts (§4.3) — 1 month 2019 39 000 Custom URL DNS RequestsAPNIC User Counts (§4.3) — updated daily 2019 23 000 Google Ad Delivery NetworkDITL Packet Traces (§2.1) 51.9 ×10⁹ 2 days 2018 50 300 Packet TracesDITL ∩ CDN (§3, §4.3, §7) 18.6 ×10⁹ — 2018–2019 35 500 Root DNS query and user countsRIPE Atlas (§5.2, §7.1) 10.0 ×10³ 1 hour Various 3 300 ping, tracerouteUSC/ISI (§4.3) 10.0 ×10⁷ 1 year 2018 1 Packet TracesLocal DNS / Activity Measurements (§4.3) 68.0 ×10⁴ 1 month 2020 2 Packet Traces, Chrome Webtime Tracker
Table 3: Strengths and Weaknesses of Datasets
Dataset Strengths Weaknesses
Sampled CDN Server-Side Logs (§6) Has client to front-end mappings, global coverage Cannot hold user population fixed across ringsSampled CDN Client-Side Measurements (§5.2) Can hold user population fixed across rings, global coverage Do not know which front-end the client reached, smaller scaleCDN User Counts (§4.3) Precise estimates of user counts, global coverage Under estimates user countsAPNIC User Counts (§4.3) Global coverage, publicly accessible Not validated, coarse granularityDITL Packet Traces (§2.1) Global coverage Noisy, only above the recursive resolverDITL ∩ CDN (§3, §4.3, §7) Global coverage, attributes queries to users Excludes v6RIPE Atlas (§5.2, §7.1) Historic data, reproducibility Limited coverageUSC/ISI (§4.3) Precise, below the recursive, Limited coverage, no information about usersLocal DNS / Activity Measurements (§4.3) Precise, at the end user Limited coverage, small scale
10−3 10−2 10−1 100 101 102 103
Queries per User per Day
0.0
0.2
0.4
0.6
0.8
1.0
CDF
of U
sers
IdealCDNAPNIC
Figure 9: A CDF of the number of queries Microsoft users experience
due to root DNS resolution, per day, without joining recursives by
/24 in DITL with recursives seen by Microsoft ( CDN ). This unrep-
resentative analysis yields an estimate of daily user queries far, far
lower than in Section 4.3.
Table 4: Statistics displaying the extent to which the recursives of
users in Microsoft’s CDN overlap recursives seen in the 2018 DITL
captures without users and volumes by /24. Also shown in paren-
theses are corresponding statistics when joining by /24. Joining the
datasets by /24 increases most measures of representation by tens of
percents, with some measures increased by up to 64%.
dataset Statistic Percent Overlap (by /24)
DITL ∩ CDN
DITL Recursives 2.45% (29.3%) of DITL RecursivesDITL Volume 8.4% (72.2%) of DITL Query VolumeCDN Recursives 41.9% (78.8%) of CDN RecursivesCDN Volume 47.05% (88.1%) of CDN Query Volume
To increase the representativeness of our analysis, we aggregateMicrosoft user counts and DITL query volumes by resolver /24,and join the two datasets on /24 to create the DITL∩CDN dataset.The intuition behind this preprocessing step is that IP addresses inthe same /24 are likely colocated, owned by the same organization,
and act as recursives for similar sets of users. We now justify thisdecision and discuss the implications of this preprocessing step onthe results presented in Section 4.3.
In Table 4 we summarize the extent to which the recursivesseen by Microsoft are representative of the recursives seen in DITL,and vice-versa, without aggregating by /24. We also display cor-responding statistics when aggregating by /24 for comparison inparentheses. Clearly joining by /24 makes a significant difference,increasing various measures of overlap by tens of percents and incertain cases by up to 64%.
As an analogy to Figure 3, in Figure 9 we show the number ofqueries each Microsoft user executes to the roots per day withoutaggregating query and user statistics by /24 ( CDN ). We also showAPNIC as in Figure 3 for comparison, even though APNIC is notaffected by /24 volume aggregation. Users of CDN only send 0.036queries to the roots each day at the median – roughly one 30𝑡ℎ ofthe estimate obtained when aggregating statistics by /24. This smalldaily user latency makes sense, given that we only capture 8.4% ofDITL volume without joining the datasets by /24 (Table 4).
Table 4 and Figure 9, demonstrate that the decision to aggregatestatistics and join DITL captures with Microsoft user counts by /24led to both much greater representativeness of the analysis and verydifferent conclusions about user interactions with the root DNS.We would now like to justify this decision using measurements. If,as we assume, IP addresses in the same /24 are colocated, they areprobably routed similarly. Prior work has shown that only a smallfraction of anycast paths are unstable [77], and so we expect that,over the course of DITL, IP addresses in the same /24 reach thesame anycast sites.
As a way of quantifying routing similarity in a /24, in Figure 10we show the percent of queries from each /24 in DITL that do notreach the most “popular” anycast site for each /24 in each rootdeployment. We label root letters alongside the total number of
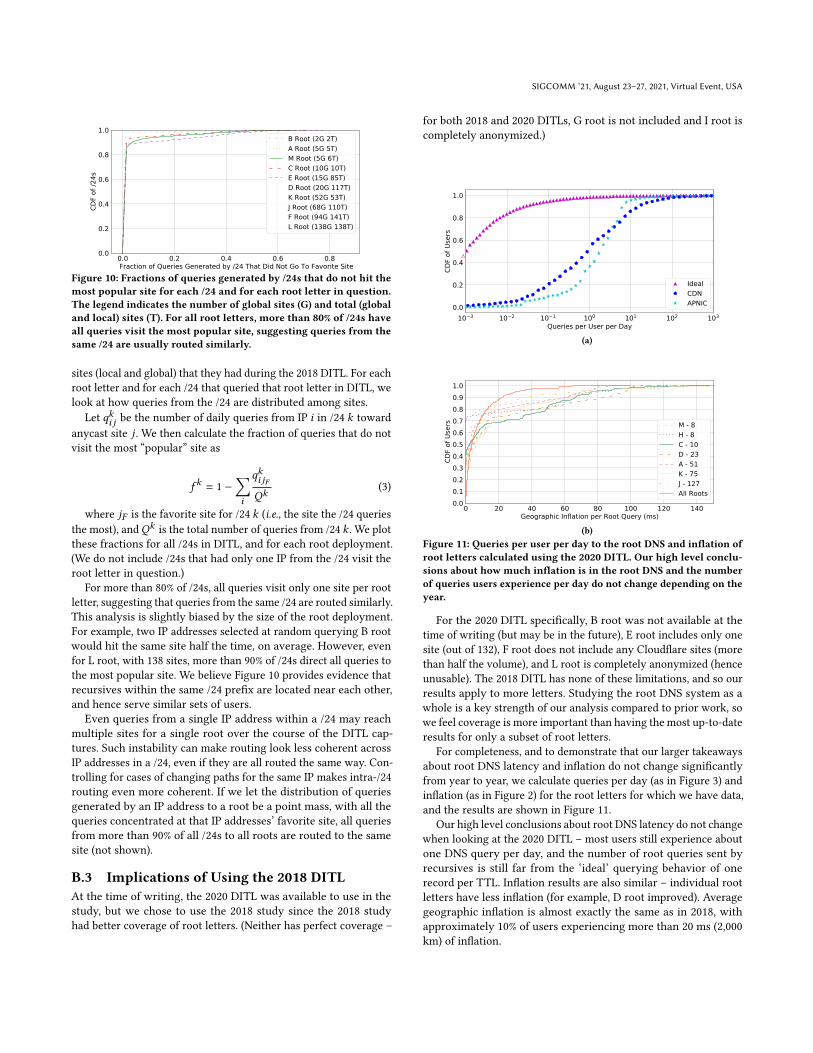
SIGCOMM ’21, August 23–27, 2021, Virtual Event, USA
0.0 0.2 0.4 0.6 0.8Fraction of Queries Generated by /24 That Did Not Go To Favorite Site
0.0
0.2
0.4
0.6
0.8
1.0
CDF
of /2
4s
B Root (2G 2T)A Root (5G 5T)M Root (5G 6T)C Root (10G 10T)E Root (15G 85T)D Root (20G 117T)K Root (52G 53T)J Root (68G 110T)F Root (94G 141T)L Root (138G 138T)
Figure 10: Fractions of queries generated by /24s that do not hit the
most popular site for each /24 and for each root letter in question.
The legend indicates the number of global sites (G) and total (global
and local) sites (T). For all root letters, more than 80% of /24s have
all queries visit the most popular site, suggesting queries from the
same /24 are usually routed similarly.
sites (local and global) that they had during the 2018 DITL. For eachroot letter and for each /24 that queried that root letter in DITL, welook at how queries from the /24 are distributed among sites.
Let 𝑞𝑘𝑖 𝑗be the number of daily queries from IP 𝑖 in /24 𝑘 toward
anycast site 𝑗 . We then calculate the fraction of queries that do notvisit the most “popular” site as
𝑓 𝑘 = 1 −∑︁𝑖
𝑞𝑘𝑖 𝑗𝐹
𝑄𝑘(3)
where 𝑗𝐹 is the favorite site for /24 𝑘 (i.e., the site the /24 queriesthe most), and𝑄𝑘 is the total number of queries from /24 𝑘 . We plotthese fractions for all /24s in DITL, and for each root deployment.(We do not include /24s that had only one IP from the /24 visit theroot letter in question.)
For more than 80% of /24s, all queries visit only one site per rootletter, suggesting that queries from the same /24 are routed similarly.This analysis is slightly biased by the size of the root deployment.For example, two IP addresses selected at random querying B rootwould hit the same site half the time, on average. However, evenfor L root, with 138 sites, more than 90% of /24s direct all queries tothe most popular site. We believe Figure 10 provides evidence thatrecursives within the same /24 prefix are located near each other,and hence serve similar sets of users.
Even queries from a single IP address within a /24 may reachmultiple sites for a single root over the course of the DITL cap-tures. Such instability can make routing look less coherent acrossIP addresses in a /24, even if they are all routed the same way. Con-trolling for cases of changing paths for the same IP makes intra-/24routing even more coherent. If we let the distribution of queriesgenerated by an IP address to a root be a point mass, with all thequeries concentrated at that IP addresses’ favorite site, all queriesfrom more than 90% of all /24s to all roots are routed to the samesite (not shown).
B.3 Implications of Using the 2018 DITL
At the time of writing, the 2020 DITL was available to use in thestudy, but we chose to use the 2018 study since the 2018 studyhad better coverage of root letters. (Neither has perfect coverage –
for both 2018 and 2020 DITLs, G root is not included and I root iscompletely anonymized.)
10−3 10−2 10−1 100 101 102 103
Queries per User per Day
0.0
0.2
0.4
0.6
0.8
1.0
CDF
of U
sers
IdealCDNAPNIC
(a)
0 20 40 60 80 100 120 140Geographic Inflation per Root Query (ms)
0.00.10.20.30.40.50.60.70.80.91.0
CDF
of U
sers M - 8
H - 8C - 10D - 23A - 51K - 75J - 127All Roots
(b)
Figure 11: Queries per user per day to the root DNS and inflation of
root letters calculated using the 2020 DITL. Our high level conclu-
sions about how much inflation is in the root DNS and the number
of queries users experience per day do not change depending on the
year.
For the 2020 DITL specifically, B root was not available at thetime of writing (but may be in the future), E root includes only onesite (out of 132), F root does not include any Cloudflare sites (morethan half the volume), and L root is completely anonymized (henceunusable). The 2018 DITL has none of these limitations, and so ourresults apply to more letters. Studying the root DNS system as awhole is a key strength of our analysis compared to prior work, sowe feel coverage is more important than having the most up-to-dateresults for only a subset of root letters.
For completeness, and to demonstrate that our larger takeawaysabout root DNS latency and inflation do not change significantlyfrom year to year, we calculate queries per day (as in Figure 3) andinflation (as in Figure 2) for the root letters for which we have data,and the results are shown in Figure 11.
Our high level conclusions about root DNS latency do not changewhen looking at the 2020 DITL – most users still experience aboutone DNS query per day, and the number of root queries sent byrecursives is still far from the ‘ideal’ querying behavior of onerecord per TTL. Inflation results are also similar – individual rootletters have less inflation (for example, D root improved). Averagegeographic inflation is almost exactly the same as in 2018, withapproximately 10% of users experiencing more than 20 ms (2,000km) of inflation.

SIGCOMM ’21, August 23–27, 2021, Virtual Event, USA
C NUMBER OF RTTS IN A PAGE LOAD
To estimate the latency a user experiences when interacting withMicrosoft’s CDN (§5.2), we first estimate the number of RTTs re-quired to load a typical web page hosted by Microsoft’s CDN. Thenumber of RTTs in a page load depends on a variety of factors, sowe aim to find a reasonable lower bound on the number of RTTsusers incur for typical pages. A lower bound on the number ofRTTs to load pages is a conservative measure of the impact ofCDN inflation, as latency inflation accumulates with each addi-tional RTT, and larger pages (more RTTs) would be impacted more.We provide an estimate of this lower bound based on modelingand evaluation of a set of web pages hosted by Microsoft’s CDNusing Selenium (a headless web browser), finding that 10 RTTs isa reasonable estimate. We scale latency by the number of RTTs inSection 5.2 to demonstrate how improvements in latency help users(and, conversely, how inflation hurts users).
Users incur latency to Microsoft’s CDN when they downloadweb objects via HTTP. We calculate the number of RTTs requiredto download objects in each connection separately, and sum RTTsover connections while accounting for parallel connections. Fora single TCP connection, the number of RTTs during a page loaddepends on the size of files being downloaded. This relationship isapproximated by
𝑁 =⌈𝑙𝑜𝑔2
𝐷
𝑊
⌉(4)
where 𝑁 is the number of RTTs, 𝐷 is the total number of bytessent by the TCP connection from the server to the user, and𝑊 isthe initial congestion window size in bytes [19, 35]. Although𝑊is set by the server, Microsoft and a majority of web pages [66]set this value to approximately 15 kB so we use this value. Wedo not consider QUIC or persistent connections across pages indetail here, but larger initial windows will result in fewer RTTs.We test mostly landing pages, for which persistent connectionsare uncommon. Moreover, such considerations likely would notchange our qualitative conclusions about how users experienceCDN latency.
We make the following assumptions to establish a lower boundon 𝑁 : (1) we do not account for connections limited by the receivewindow or the application, as the RTT-based congestion windowlimitation we calculate is still a lower bound, (2) TCP is always inslow start mode, which implies the window size doubles each RTTand serves as a lower bound on the actual behavior of Microsoft’sstandard CUBIC implementation, and (3) all TCP and TLS hand-shakes after the first do not incur additional RTTs (i.e., they areexecuted in parallel to other requests).
Modern browsers can open many TCP connections in parallel,to speed up page loads. Summing up RTTs across parallel connec-tions could therefore drastically overestimate the number of RTTsexperienced users. To determine the connections over which toaccumulate RTTs, we first start by only considering the connec-tion with the most data. We then iteratively add connections insize-order (largest to smallest) that do not overlap temporally withother connections for which we have accumulated RTTs. The ‘datasize’ of a connection may represent one or more application-layerobjects.
We load nine web pages owned by Microsoft, twenty times foreach page. We choose popular pages hosted on Microsoft’s CDN
with dynamic content suggested to us by a CDN operator. We useSelenium and Chrome to open web pages and use Tshark [24] tocapture TCP packets during the page load. When the browser’sloadEventEnd event fires, the whole page has loaded, includingall dependent resources such as stylesheets and images [59]. So, tocalculate the total data size for each connection, we use the ACKvalue in the last packet sent to the server before loadEventEndminus the SEQ value in the first packet received from the server.We then calculate the number of RTTs using Equation (4), and adda final two RTTs for TCP and TLS handshakes. We find only a fewpercent of CDN web pages are loaded within 10 RTTs, and 90% ofall page loads are loaded within 20 RTTs, so 10 RTTs is a reasonablelower bound.
D LATENCY MEASUREMENTS AT A
RECURSIVE RESOLVER
To obtain a local perspective of how users experience root DNSlatency, we use packet traces from ISI. Here, we characterize DNSand root DNS latencies users experience at the resolver, along witha useful visualization of how inconsequential root DNS latency isfor users at this resolver. This analysis complements our globalview of how users interact with the root DNS in Section 4.3, as itdemonstrates how often everyday users might send queries to theroot relative to other DNS queries.
10−2 10−1 100 101 102 103 104 105
Latency (ms)
0.0
0.2
0.4
0.6
0.8
1.0
CDF
of Q
uerie
s
Figure 12: CDF of user DNS query latencies seen at a recursive resolve
at ISI, over the course of one year. Latencies are measured from the
timestamp when the recursive resolver receives a client query to the
timestamp when the recursive sends a response to that client query.
The sub-millisecond latency for more than half of queries suggests
most queries to this recursive are served by the local cache.
Figure 12 shows the latencies of all queries seen at the recur-sive resolver over one year, where latencies are measured from thetimestampwhen the recursive resolver receives a client query to thetimestamp when the recursive sends a response to that client query.Latencies are divided into (roughly) 3 regions: sub-millisecond la-tency, low latency (millisecond - tens of milliseconds), and highlatency (hundreds of milliseconds). The first region corresponds tocached queries, so roughly half of queries are (probably) cached.The second region corresponds to DNS resolutions for which theresolving server was geographically close. Finally, the third regionlikely corresponds to queries that had to travel to distant servers,or required a few rounds of recursion to fully resolve the domain.

SIGCOMM ’21, August 23–27, 2021, Virtual Event, USA
0 50 100 150 200 250 300 350Root DNS Latency (ms)
0.0
0.9
0.99
0.999
0.9999
0.99999
0.999999
CDF
of Q
uerie
s
Figure 13: RootDNS latency for queriesmade by users of ISI recursive
resolver during 2018. This plot demonstrates the benefits of caching
and high TTLs of TLD records – fewer than 1% of queries generate a
root request, and fewer than 0.1% incur latencies greater than 100 ms.User queries that did not generate a query to a root server were given
a latency of 0.
The sub-millisecond latency for more than half of queries suggestsmost queries to this recursive are served by the local cache. Theselatencies are similar to those presented in previous work that alsostudied a recursive resolver serving a small user population [18].Queries in the second and third regions include queries that didnot query the root (since those records were cached) but did queryother parts of the DNS hierarchy.
As discussed in Section 4, root DNS queries make up a smallfraction of all queries shown in Figure 12. To visualize just howsmall this fraction is, Figure 13 shows a CDF of root DNS latencyexperienced for queries over 2018. Requests that do not generatea query to a root server are counted as having a root latency of0. Figure 13 demonstrates the benefits of shared caches and highTTLs of TLD records – fewer than 1% of queries generate a rootrequest, and fewer than 0.1% incur latencies greater than 100 ms.
E CASE STUDY: REDUNDANT ROOT DNS
QUERIES
When we investigate the traffic from a recursive resolver to theroot servers in Section 4, we see as many as 900 queries to the rootserver in a day for the COM NS record. Given the 2 day TTL ofthis record, this query frequency is unexpectedly large. This largefrequency motivated us to analyze why these requests to rootsoccurred. We consider a request to the root to be redundant if aquery for the same record occurred less than 1 TTL ago. Prior workhas investigated redundant requests to root servers as well, andour analysis can be considered complementary since we discoverdifferent reasons for redundant requests [28].
To observe these redundant requests in a controlled environment,we deploy a BIND instance (the resolver in Section 2.1 runs BINDv9.11.17) locally and enable cache and recursion. We do not actuallylook up the cache of the local BIND instance to see which recordsare in it. Instead, we save the TTL of the record and the timestampat which we receive the record to know if the record should be inBIND’s cache. We use BIND version 9.11.18 and 9.16.1. Because9.16.1 is one of the newest releases and 9.11.18 is a release fromseveral years ago, we can assume that pathological behavior iscommon in all versions between these two releases. After deployingthe instance, we simulate user behavior by opening the top-1000web pages according to GTmetrix [33] using Selenium and headless
Chrome. While loading web pages, we collect network packets onport 53 using Tshark [24].
For these page loads, we observe 69,215 DNS A & AAAA-typerequests generated by the recursive resolver. 3,137 of these requestsare sent to root servers, and 2,950 of these root DNS queries areredundant. Over 70% of redundant requests are AAAA-type. Afterinvestigating the cause of these redundant queries, we find over 90%of these redundant requests follow a similar pattern. This patternis illustrated by the example in Table 5.
In Table 5, we show queries the recursive resolver makes whena user queries for the A record of bidder.criteo.com. In step 1, therecursive resolver receives a DNS query from a client. Accordingto TTL heuristics, the COM A record is in the cache. In step 3, theTLD server responds with records of authoritative nameservers for“criteo.com”. Then, the recursive chooses one of them to issue thefollowing request to. However, for some reason (e.g., packet loss),the recursive resolver does not get a response from the nameserverin step 4. Hence, the resolver uses another nameserver in step 5,which it learned in step 3. At the same time, as seen in step 6 to11, the recursive sends (redundant) DNS requests to root servers,querying the AAAA-type records for these nameservers. These re-quests are redundant since the AAAA record for COMwas receivedless than two days ago.
From the pattern demonstrated in Table 5, we hypothesize thatredundant requests to the root servers will be generated for certainrecords when the following conditions are met.
(1) A query from the recursive resolver to an authoritative name-server times-out.
(2) The record queried for by the resolver to the root DNS serverwas not included in the Additional Records section of theTLD’s response.
The second condition is also why we were seeing more AAAA-type redundant requests, because usually there are more A-typerecords in the Additional Records section than AAAA-type records.
To see how much traffic is caused by our hypothesis in a realscenario, we analyze packet captures on a recursive resolver (BIND9.11.17) serving users at ISI. To keep consistent with the otheranalysis we do on this dataset (§4), we use packet captures from2018. 79.8% of requests to roots are redundant and in the patternwe described. The other 20.2% consists of necessary requests andrequests for which we have no hypothesis as to how they weregenerated. We contacted developers at BIND, who said this may bea bug.
Software behavior as described here can lead to orders of magni-tude more root DNS requests than would be necessary if recursivesqueried for the record once per TTL. As demonstrated in Figure 3,focusing on reducing the number of these queries could both im-prove user experience and reduce load on the root server.
F VISUALIZATION OF MICROSOFT CDN
PERFORMANCE
In Section 2.2 we show the rings of a large anycast CDN and howusers are distributed with respect to those rings. This visualizationdoes not include any information about latency, so we provide onehere. In Figure 14 we show front-ends in R110, and associated la-tency users experience to R110 in each region. Transparent circles

SIGCOMM ’21, August 23–27, 2021, Virtual Event, USA
Table 5: Redundant root DNS requests. The last five requests to J root are redundant which may be caused by an unanswered request in step 4.
Step
Relative
Timestamp (second)
From To Query name Query type Response
1 0.00000 client resolver bidder.criteo.com A2 0.01589 resolver 192.42.93.30 (g.gtld) bidder.criteo.com A
3 0.02366 192.42.93.30 (g.gtld) resolver bidder.criteo.com Ans23.criteo.com ns22.criteo.comns25.criteo.com ns26.criteo.comns27.criteo.com ns28.criteo.com.
4 0.02387 resolver 74.119.119.1 (ns25.criteo.com) bidder.criteo.com A5 0.82473 resolver 182.161.73.4 (ns28.criteo.com) bidder.criteo.com A6 0.82555 resolver 192.58.128.30 (j.root) ns22.criteo.com AAAA7 0.82563 resolver 192.58.128.30 (j.root) ns23.criteo.com AAAA8 0.82577 resolver 192.58.128.30 (j.root) ns27.criteo.com AAAA9 0.82584 resolver 192.58.128.30 (j.root) ns25.criteo.com AAAA10 0.82592 resolver 192.58.128.30 (j.root) ns26.criteo.com AAAA11 0.82620 resolver 192.58.128.30 (j.root) ns28.criteo.com AAAA
0.0
0.2
0.4
0.6
0.8
1.0
Late
ncy
(rela
tive)
Figure 14: A visualization of front-ends in R110 (purple Xs), and user populations (transparent circles). User populations are colored according
to the relative latency they experience and have size proportional to user population. Red corresponds to high latency, and green corresponds
to low latency. Latency generally gets lower the closer users are to a front-end, and front-ends are concentrated around large user populations.
represent user populations and their radii are proportional to theuser population. Population circles are colored according to averagemedian latency users in the metro experience to R110 – red indi-cates higher latency while green indicates lower latency. Latency
generally gets lower the closer users are to a front-end. The CDNhas focused on deploying front-ends near large user populations,which has driven latencies quite low for nearly all users.