“a comparison of gp visiting in northern ireland and … for a medical card. eligibility for a...
TRANSCRIPT

“A COMPARISON OF GP VISITING IN NORTHERN IRELAND AND THE REPUBLIC OF IRELAND*”
Patrick McGregora, Anne Nolanb,♦, Brian Nolanb and Ciaran O’Neilla
Working Paper 22
Research Programme on “Health Services, Health Inequalities and Health and Social Gain”
This programme is supported by the Health Research Board, and is being carried out by researchers at the Economic and Social Research Institute (ESRI), University College Dublin
and the University of Ulster.
Working Papers are not for publication and should not be quoted without the prior permission of the author(s): • a School of Economics and Politics, University of Ulster, Northern Ireland. b Economic and Social Research Institute, Dublin, Ireland.
* This research forms part of the research programme “The Provision and Use of Health Services, Health Inequalities and Health and Social Gain” funded by the Health Research Board and undertaken by researchers from the Economic and Social Research Institute, University College Dublin and the University of Ulster. ♦ Email: [email protected]
1 INTRODUCTION
In Northern Ireland, all residents are entitled to free GP services while in the Republic of Ireland,
only the 30 per cent of the population who qualify on the basis of an income means test are entitled
to free GP services. Given the similarity in the institutional features of GP services in Northern
Ireland and the Republic, this allows us to analyse the impact of charges on GP use. In 2001, the
average number of GP visits per person per annum in Northern Ireland was 3.8 in comparison with
3.2 in the Republic. However, it is important to distinguish between those who are eligible for free
GP visits in the Republic (“medical cardholders”) and those who are not (“non-medical
cardholders”). While medical cardholders had an average of 5.3 visits per annum, non-medical
cardholders had only 2.2 visits per annum. This clearly illustrates that there are three distinct
populations of interest:
(1) Northern Ireland, all of whom receive free GP visits
(2) Medical cardholders in the Republic, who also receive free GP visits
(3) Non-medical cardholders in the Republic, who must pay in full for GP visits
In this paper we compare group (1) with groups (2) and (3), to assess the impact of charging for GP
services on utilisation. Aggregate visiting rates suggest that medical cardholders in the Republic
have a higher number of visits per annum than the Northern Ireland population (even though neither
group has to pay for GP services, or prescription medicines); however, medical cardholders in the
Republic are a particularly disadvantaged group, not only in terms of income, but also in terms of
health status and other socio-economic characteristics. We therefore expect little difference in
visiting rates between groups (1) and (2) once differences in socio-economic characteristics are
taken into account, but expect that visiting will be lower for group (3) than group (1) due to the
impact of charges (see Section 4 for further details).
In terms of institutions and the operation of the GP service in Northern Ireland and the Republic, the
major difference is the existence of charges in the Republic for those above the income threshold

for a medical card. Eligibility for a medical card in the Republic is dependent upon income and is
decided on the basis of a means test with the income thresholds set nationally and updated annually.
In 2001 (the period under review in this paper), the weekly income thresholds for a medical card
were €126.97 for a single person, €183.47 for a married couple and €229.19 for a married couple
with two children aged 16 years or younger. The limits increase for those aged 66 years and over
(e.g. for a married couple the limit increases to €205.69).1 From 1 July 2001, all individuals aged 70
years and over are also entitled to a medical card, regardless of income. In special circumstances
(e.g. those who contracted Hepatitis C directly or indirectly from the use of contaminated blood
products administered by the state), an individual who is otherwise ineligible on the basis of income
or age may be granted a medical card. In 2001, 31.2 per cent of the population were eligible a
medical card (General Medical Services Payments Board, 2002). Medical cardholders receive all
public health services free of charge, including GP consultations and prescribed medicines. The
remainder of the population must pay in full for each GP consultation, and for all prescribed
medicines up to a monthly limit (€53 in 2001).
In the Republic, GPs are self-employed individuals who may or may not decide to provide services
to public patients under the General Medical Services (GMS) Scheme. In 2003, it was estimated
that there were approximately 2,700 GPs practising in the Republic (Indecon Economic
Consultants, 2003), which corresponds to a GP per 1,000 population ratio of approximately 0.7.
Approximately 95 per cent of GPs provide services to medical cardholders under the GMS (FÁS,
2005) and are reimbursed for these services by the Primary Care Reimbursement Service
(previously the General Medical Services Payments Board), primarily on a capitation basis.2 The
capitation payment is weighted for the age, sex and distance from doctor’s surgery of the patient.
1 The average gross weekly industrial wage in March 2001 was €447.32 (Central Statistics Office, 2005).
2 Prior to 1989, GPs were also remunerated on a fee-for-service basis for their public patients. In light of evidence presented by Tussing (1985) in favour of demand inducement by GPs under a fee-for-service system, this system was changed to capitation in 1989. However, research by Madden et al. (2005) showed that the difference in GP visiting between medical cardholders and non-medical cardholders did not narrow following the switch to capitation in 1989.

There are some additional fee-for-service payments for procedures such as suturing and for out-of-
hours consultations, but about 67 per cent of total payments to GPs in the GMS scheme are from
capitation (General Medical Services Payments Board, 2002). Private patients pay a fee-for-service,
and the average fee in 2002 was €33 (Indecon Economic Consultants, 2003).
Under the terms of the GMS contract, a GP cannot discriminate between public and private patients
in terms of the quality and quantity of treatment. In most cases, patients do not need to make an
appointment to see their GP, although weekend and out-of-hours services may not necessarily be
provided by the individual’s personal GP. Approximately a third of GP practices in Ireland are
single-handed practices3, and only a minority employ other health service professionals such as
nurses or physiotherapists. The majority of GPs do not undertake dispensing duties; a network of
privately owned and operated pharmacies provides this service. GPs act as gatekeepers for
secondary care, with admission to the in-patient department of public hospitals on the basis of a
referral from a GP, referral from an out-patient clinic or from A&E.
In Northern Ireland, all residents are entitled to free health services under the NHS. A new GP
contract was implemented in Northern Ireland in April 2004; previously (and for the period
applicable to this paper), individual GP practices operated under the terms of the 1990 contract,
which allowed GP practices to operate a fundholding system (see Appleby, 2005). Each practice
was allocated a budget from the Department of Health and was responsible for how this money was
spent and what services were provided. Hospital expenses were also covered under the practice
budget. Practices were allowed to re-invest any savings made. Under the 1990 GMS (General
Medical Services) contract, GPs were reimbursed through a mixture of capitation, item of service
3 In 2003, it was estimated that 32 per cent of GPs operated as single-handed practices, 29 per cent were two-handed
practices and 36 per cent were in partnerships of three or more (National General Practice Information Technology
Group, 2003).
payments, target payments for screening and immunisation and fixed sums for seniority and other
GP or practice characteristics. In 2003, there were 1,084 GPs practicing in Northern Ireland (Royal
College of General Practitioners, 2005), which is equivalent to approximately 0.6 GPs per 1,000
population.
Since 1997, the Personal Medical Service (PMS) contracts operate alongside the GMS. The services
provided under the PMS contract have to include all those previously provided under the GMS
contract and some additional locally negotiated services for particular population groups. PMS
practices are paid an income equal to what they obtained under their previous GMS contract plus
extra payments for extra services. As in the Republic, dispensing of pharmaceuticals is carried out
by local pharmacies, and GPs similarly act as gatekeepers to secondary care. In 2001, there were
1,061 GPs working in 359 practices in Northern Ireland (Appleby, 2005), and in 2003, 19 per cent
of practices were single practices, 28 per cent consisted of two GPs and 52 per cent consisted of
three GPs or more (Royal College of General Practitioners, 2005).
Section 2 provides an overview of research on the impact of charging for health services. Section 3
introduces the data used in our paper while Section 4 presents our model and estimation strategy.
Section 5 presents empirical results and Section 6 summarises and concludes.
2 THE IMPACT OF CHARGING FOR GP SERVICES
The primary rationale for user charges in developing countries is to raise additional revenue to
supplement limited state expenditure on health. In developed countries in contrast, the emphasis is
on the need to contain costs by discouraging excessive utilisation of health services (see Creese,
1997). Proponents of user fees highlight the efficiency gains from encouraging individuals to
become more aware of the costs of their use of health services, as well as the potential to redirect
demand towards the most appropriate level of care. Opponents highlight the equity concerns,
primarily in terms of shifting the burden of finance towards the poorer and unhealthier sections of
society. In terms of efficiency, there are also very real concerns that user fees discourage both
“necessary” as well as “unnecessary” utilisation, which potentially leads to the need for more
expensive care further down the line. In addition, there are doubts over the ability of user charges to
enhance efficiency, in the context of a system where most resource-using decisions in healthcare are
made by the providers of health services, rather than the patients (see also Nolan, 1993a and
CHSRF, 2001).
Across OECD countries, there is much variation in the extent to which user fees are levied for
different health services, although most countries have some degree of cost sharing with regard to
pharmaceuticals (see European Observatory on Health Care Systems, 2002). In the context of GP
services, the Republic of Ireland is unusual in the extent to which a large majority of the population
pay in full for GP visits; in most European countries, GP visits are free (e.g., UK) or heavily
subsidised (e.g., France) for the vast majority of the population.
One of the most extensive studies of the impact of charging on the utilisation of health services is
the RAND Health Insurance Experiment (HIE), which began in 1972 and lasted until 1981.
Individuals were randomly assigned to a number of different insurance plans, which differed in the
degree of cost sharing for health services. The study assessed the impact of these differing levels of
cost sharing on the use of health services, health status and patient satisfaction. The study found that
the larger the degree of cost sharing, the larger the reduction in use, although the overall effect on
health outcomes was small4. In addition, within each plan, the probability of health services use
4 Comparing those given free care with those with some degree of cost sharing, individuals in the bottom 20 per cent of
the income distribution who were given free care had better results at the end of the study on blood pressure, vision and
oral health (but for individuals with average characteristics, there was no significant difference in health outcomes). In

increases with income. Crucially, the study found that the reductions in use as cost sharing
increased applied to both “appropriate” as well as “inappropriate ” services, thus casting doubt on
the ability of charges to discourage only non-essential care (see Keeler, 1992). An analysis based on
a natural experiment among Medicaid beneficiaries in California in 1971/1972 found that while out-
patient utilisation decreased for those exposed to cost-sharing, in-patient utilisation increased with
the result that the overall costs of the California Medicaid programme increased over the period
(Helms et al., 1978). Beck (1974) examined the impact of the introduction of a co-payment on poor
families in Saskatchewan in 1968 and found a statistically significant negative effect on the
utilisation of GP services, and in common with the RAND HIE, a positive income effect. While
most research on the impact of charging for health services has been based on US data, the key
finding is that while cost-sharing does reduce utilisation, they are very real concerns over the extent
to which reductions in use are confined to “unnecessary” consultations and the extent to which the
burden is particularly pronounced for those on the lowest incomes.
For Northern Ireland, McGregor et al., 2003 attempt to estimate the extent of “non-essential” GP
visiting. They find that the income sensitivity of GP visits is stable across most socio-economic
groups (with the exception of the retired), and estimate that approximately 16 per cent of GP visits
may be considered income sensitive, or “non-essential”. A similar analysis undertaken for England
estimates the extent of “non-essential” visiting at 5 per cent of all visits (McGregor et al., 2005),
thus reducing the case for the introduction of charges to reduce “unnecessary” consultations.
Indeed, Scott et al., 2003 found that for New Zealand, even offering substantial subsidies to those
on low incomes does not completely remove the disincentive to visit for those on low incomes.
terms of self-assessed measures of health, there was no significant difference between the two groups after the study
period (Manning et al., 1987 and Keeler, 1992).

In the Republic of Ireland, previous analyses have examined the impact of medical card eligibility
on patterns of GP visiting, i.e., comparing groups (2) and (3) above (see Tussing, 1985, Nolan,
1991, Nolan, 1993b, Nolan and Nolan, 2003, Madden et al., 2005, Nolan, 2005 and Nolan and
Nolan, 2005). All studies found that medical card eligibility was highly significant in determining
differences in GP visiting patterns across the population, reflecting primarily the difference in
relative prices faced by the two groups. While it may be expected that charges have more of an
impact on low-income individuals, research by Nolan and Nolan, 2005 found that impact of fees on
GP visiting was not confined to those just above the income threshold. Comparing GP visiting rates
among non-medical cardholders showed that there was little significant difference in visiting by
income decile (although those in the highest income deciles were significantly more likely to visit
their GP than those in lower income deciles). In New Zealand, the community services card (CSC)
operates in a similar manner to the Irish medical card, except that it covers a larger proportion of the
population (approximately 50 per cent) and cardholders receive a subsidy from the government for
each GP visit (equivalent to approximately one third of the full cost), rather than free GP visits in
the Irish case. Examining the utilisation of GP services, Scott et al., 2003 found that even after
controlling for need (age, gender and various measures of health status) and other socio-economic
characteristics, cardholders were significantly more likely to visit their GP, and those on low
incomes were significantly less likely to visit their GP. They interpret the latter result as evidence
that even with subsidised GP visits, those on low incomes still face significant financial barriers to
accessing GP services.
3 DATA
For the Republic, we use the Living in Ireland Survey (LIIS). The LIIS, which began in 1994 and
ended in 2001, is the Irish component of the European Community Household Panel (ECHP). It
involves an annual survey of a representative sample of private households and individuals aged 16
years and over in each EU member state, based on a standardised questionnaire. The Irish data were

collected by the ESRI and where possible, the same households were followed through time. A
more detailed description of the design and conduct of the survey as well as response rates and the
representativeness of the survey are provided in Nolan, 1991 and Callan et al., 1989. Health
information on medical card eligibility, insurance coverage, number of visits to GPs, number of
nights in hospital, physical and psychological health status etc. were obtained for all adults in the
household, in addition to information on labour force status, occupation, income, style of living,
financial situation and attitudes. As the Northern Ireland data are only available from 2001, we use
the final wave (2001) of the LIIS. The sample includes all adults aged 16 years and over, amounting
to 6,521 observations. After deleting observations for which information on one or more variables
of interest was missing, completed observations are available for 6,438 observations.
The Northern Ireland Household Panel Survey (NIHPS), which began in 2001, is an extension of
the long-running British Household Panel Survey (BHPS), and uses an identical questionnaire. It
too involves an annual survey of a random sample of households, and collects information on a
variety of individual and household demographic and socio-economic characteristics. The full list
of variables is provided in Freed Taylor et al., 2005. The NIHPS contains complete information on
3,457 individuals.
Our dependent variable is the number of GP visits in the previous year. While the LIIS records the
actual number, NIHPS responses are coded into five categories (as in the BHPS), namely, 0, 1-2, 3-
5, 6-10 and 11+ visits per annum. To ensure comparability of the data across the two surveys, we
code the LIIS data similarly, to obtain an ordinal categorical variable with these 5 categories.
Explanatory variables closely correspond to those used in previous analyses of GP utilisation and
refer to individual and household demographic and socio-economic characteristics. Firstly, we
include a set of age and gender dummies. Age is represented by a categorical variable with seven
categories (representing ten-yearly intervals, i.e., age16-24, age25-34 etc.), with the former
regarded as the reference category. Highest level of education achieved is represented by a variable
with four categories: third level, upper secondary, lower secondary and primary level or lower, with
the latter also regarded as the reference category.5 We use a categorical indicator of present marital
status that distinguishes between being married, separated or divorced, widowed and never married.
Employment status is obtained by classifying individuals into three mutually exclusive categories:
employed, unemployed and economically inactive, which is also the reference category.6 As an
indicator of the financial resources of the household, we use weekly gross household income,
adjusted for household size and composition7, converted into € and divided by 100. The current
version of the paper omits health status from the estimation due to data comparability problems.8 In
5 In Northern Ireland, third level corresponds to higher degree, first degree, teaching qualification, nursing qualification,
upper secondary to other higher qualification and A levels, lower secondary to O levels, commercial qualification,
GSCEs and apprenticeships and primary to other qualification or no qualification. In the Republic, third level
corresponds to higher degree, primary degree or diploma, upper secondary to leaving certificate or vocational
qualification, lower secondary to group, intermediate or junior certificates and primary to no education, primary level or
some secondary education. See also Freed Taylor et al., 2003.
6 In Northern Ireland, employed corresponds to self-employed, employed and those on government training schemes,
and inactive to retired, maternity leave, family care, full-time students, long-term sick and others. In the Republic,
employed refers to full- and part-time employees, self-employed, apprenticeship, state employment scheme or state
training scheme and inactive to those in education, retired, home duties, remedial training and other. See also Freed
Taylor et al., 2003.
7 The equivalence scale we use is: 1 for the HOH, 0.66 for any other adults aged 14 years and older in the household
and 0.33 for children aged under 14 years.
8 Differences between the LIIS and the NIHPS are most pronounced for the health status variables, where few variables
are directly comparable between the two sources. In terms of self-assessed health for example, the two questions are
very different with the LIIS asking respondents “In general, how good would you say your health is? Would you say it
is: very good, good, fair, bad or very bad?” and the NIHPS asking respondents ”Please think back over the last 12
months about how your health has been. Compared to people of your own age, would you say that your health has on

the regressions that follow, we regard Northern Ireland as the base category, and include a dummy
variable to represent residents of the Republic of Ireland.
While Northern Ireland has a slightly higher average number of GP visits per annum than the South
(3.8 versus 3.2), the figure for the Republic masks a considerable difference between medical
cardholders and non-medical cardholders. Medical cardholders have an average of 5.3 GP visits per
annum, while non-medical cardholders only average 2.2 visits. Even when we divide the samples
on the basis of age (see Table 1), medical cardholders in the Republic have the highest levels of GP
visiting among the three groups (except among the youngest age group where the Northern Ireland
sample has the highest visiting levels). While GP visiting is a clearly increasing function of age for
all three samples, the difference between medical cardholders and the other groups widens as age
increases.
Table 1 Average number of GP visits by age category, 2001 NI RoI ROI Med ROI Non-Med Age 16-24 2.9 1.9 2.7 1.8
Age 25-34 3.5 2.5 3.7 2.2
Age 35-44 3.3 2.4 4.3 2.0
Age 45-54 3.8 2.9 5.2 2.2
Age 55-64 4.5 3.6 5.5 2.8
Age 65+ 4.8 5.7 6.4 3.5
Total 3.8 3.2 5.3 2.2
the whole been: excellent, good, fair, poor or very poor?” For this reason, we exclude health status from our initial
estimations, but will return to this issue in future work.

Dividing the samples on the basis of income quintile shows that GP visiting is a decreasing function
of income, particularly for the medical cardholder9 and Northern sub-samples (see Table 2). Once
again, medical cardholders have the highest number of GP visits per annum at each income quintile,
followed by the Northern sub-sample.
Table 2 GP visiting by income quintile, 2001 NI RoI ROI Med ROI Non-Med Income1 4.2 5.0 5.7 2.7
Income2 4.4 3.4 5.1 2.2
Income3 4.1 2.9 4.7 2.3
Income4 3.7 2.4 4.7 2.1
Income5 3.6 2.3 4.0 2.2
Total 3.8 3.2 5.3 2.2
While medical cardholders in the Republic are a particularly disadvantaged group in terms of
income, employment status and health status, for the third, fourth and fifth income deciles where
there are few, if any, medical cardholders, it is unlikely that controlling for additional factors will
remove all of the difference between the Northern Ireland and Republic sub-samples (where those
in the North have between 1.4 times and 1.6 times more visits than those in the Republic).
4 ECONOMETRIC MODELLING
To estimate the effect of charges on GP utilisation, we divide the sample on the basis of income
quintile and estimate separate models of GP visiting for each income quintile. Assuming the
distribution of health status is the same within each quintile in Northern Ireland and the Republic,
this ensures that we are comparing like-with-like. The model we estimate is:
9 Although the numbers with medical cards in the higher income deciles are very small.

iiroi3i2roi10i x*dxdy εβββα ++++= (1)
where is the dependent variable (number of GP visits in the previous year or dummy variable
indicating at least one GP visit in the previous year, whichever is appropriate), is a dummy
variable indicating a resident of the Republic (i.e., Northern Ireland is the reference category), is
the vector of independent variables (e.g. age, gender, education level etc.) and are
interactions between living in the Republic and the vector of independent variables. We use
likelihood ratio tests to decide between the unrestricted and restricted versions of the model (i.e.,
with and without the interaction terms).
iy
roid
ix
iroi x*d
Assuming the distribution of health status is similar within income quintiles in Northern Ireland and
the Republic, we would expect 1β to be insignificant for the lowest income quintile (as neither
group has to pay for GP services, there should be no significant difference in visiting between
Northern Ireland and the Republic). For the remainder of the income quintiles (where the proportion
with medical cards decreases as we move up the quintiles), we expect 1β to be negative and
significant, indicating the impact of charges on utilisation.
We also estimated the models with additional controls for medical card status in the Republic, i.e.,
iinmc4imc4i3nmc2mc10i x*dx*dxddy εβββββα ++++++= (2)
where is a dummy variable indicating a medical card patient in the Republic, represents a
non-medical card patient in the Republic (and residents of Northern Ireland are the base category).
However, as we do not have comparable health status variables from the two surveys, any
significant difference between the Republic and Northern Ireland (e.g. a negative coefficient for
mcd mcd
2β ) could largely reflect differences in health status between Northern Ireland and medical
cardholders/non-medical cardholders in the Republic.

To compare across income quintiles, we also estimate a pooled model, which takes the following
form:
iiq5iroi5qroi4i3q2roi10i x*dx*dd*dxddy εββββββα +++++++= (3)
where is a dummy variable indicating a resident of the Republic, represents income quintile,
is the vector of independent variables, are interactions between living in the Republic
and income quintile, are interactions between living in the Republic and the vector of
independent variables and are interactions between income quintile and the vector of
independent variables. We use likelihood ratio tests to decide between the unrestricted and
restricted versions of the model (i.e., with and without the interaction terms). However, as we do
not have comparable health status indicators, the results from this model need to be treated with
caution (e.g., a positive and significant effect of being in the higher income quintiles could largely
represent a health status effect).
roid qd
ix qroi d*d
iroi x*d
iq x*d
As the dependent variable in all models is an ordered categorical variable with mutually exclusive
categories, we use an ordered logit model:
γ
γ
εβ
>=
≤≤=
≤=
+=
*i
*i
*ii
ii*i
yif3
y0if2
0yif1y
and
'xy
(4)

where is the underlying latent variable reflecting demand for GP visits, *iy γ is an unknown
parameter that is estimated jointly with β and ( )2i ,0NID~ σε .10 All models are estimated by
maximum likelihood using STATA9.
5 EMPIRICAL RESULTS
Table 3 shows the results for the ordered logit models of GP visiting for model (1) for each of the
five income quintiles, with and without two-way interactions between NI/ROI and the vector of
demographic and socio-economic characteristics. For the first four income quintiles, the
unrestricted models with two-way interactions are preferred on the basis of likelihood ratio tests,
but for the highest income quintile, the restricted (i.e., no interactions) model is preferred. For the
lowest income quintile, there is no significant difference between the level of GP visiting in
Northern Ireland and the Republic. This is consistent with expectations since the majority of those
in the lowest income quintile in the Republic are medical cardholders (75.6 per cent). For the
second income quintile, there is also no significant difference in GP visiting between Northern
Ireland and the Republic, although for the third and fourth income quintiles, GP visiting in the
Republic is significantly lower than in Northern Ireland. For the fifth income quintile, GP visits are
lower in the Republic although this result is only marginally significant and the coefficient is much
smaller than those for the third and fourth income quintiles. Since the proportion of medical
cardholders declines as we move up the income distribution (it is less than 10 per cent for the fourth
10 Two-step approaches are increasingly common in the literature (see for example Jimenez-Martin et al., 2001 and
Pohlmeier and Ulrich, 1995). It has been argued that two-step approaches may be more appropriate in accounting for
the nature of the decision-making process underlying the decision to visit a GP in that different variables may affect the
decision to visit a GP (contact decision) and secondly, the decision about the number of visits (frequency decision). In
addition, the same variables may affect the two decisions in different ways. The most common interpretation of the two-
step model is in terms of a principal-agent framework whereby the patient initiates the visit to their GP but the GP
decides on the frequency of treatment.

income quintile and less than 5 per cent for the fifth and highest income quintile), these results
essentially indicate the significant effect of charges on GP utilisation.
However, the results do suggest that the burden of charges falls as income increases, with visiting in
the Republic and Northern Ireland only marginally significantly different for those in the top
income quintile, but significantly lower for those in the third and fourth income quintiles (who
largely pay in full for their GP care) in comparison with Northern Ireland residents who receive free
GP care. This is largely consistent with research by Nolan and Nolan, 2005 which found that among
non-medical cardholders in the Republic, there is little significant difference in GP visiting as we
move up the income distribution, except at the very top where visiting is significantly higher.
Estimation results for the remainder of the independent variables (and interactions where
appropriate) are not presented in Table 3 but indicate that GP visiting in all quintiles is positively
related to age, gender and marital status, and negatively related to employment status, with the
interactions for the first, second, third and fourth income quintile models suggesting that the effect
of age in particular is more strongly positive in the Republic.
Repeating the above analysis but dividing the RoI variable by medical card status (see Table 4)
suggests that for the first income quintile, there is no significant difference between Northern
Ireland and medical cardholders in the Republic or non-medical cardholders in the Republic in the
level of GP visiting (although it must be remembered that the numbers of non-medical cardholders
in this quintile are very small). For the second, third, fourth and fifth (highest) income quintiles,
visiting is significantly lower in the Republic among non-medical cardholders; we can say little
about the effect among medical cardholders due to the declining numbers in each quintile as income
increases. Once again, these results do suggest that the burden of charges falls as income increases,
with the coefficient on non-medical cardholder in the Republic for the fifth income quintile lower

and less significant than those for the second, third and fourth income quintiles. However, this
analysis needs to be repeated with controls for health status, as many of the significant differences
could be due to a differing distribution of health status within income quintiles in Northern Ireland
and the Republic (for example, the significant non-medical cardholder coefficient in the third,
fourth and fifth income quintiles could be largely due to the fact that non-medical cardholders in the
South in these quintiles are healthier on average than those in comparable quintiles in Northern
Ireland).
Finally, table 4 presents the results for the pooled ordered logit model. As we do not (yet) have
comparable health status indicators for the two jurisdictions, the results need to be treated with
caution. In particular, the significantly negative effect for the highest income quintile may be
expected in large part to represent a health status effect. Nonetheless, the model with two-way
interactions is preferred on the basis of likelihood ratio tests, and indicates that there are significant
differences in the effect of income quintile on visiting between Northern Ireland and the Republic.
Namely, in comparison with being in each of the income quintiles in Northern Ireland, residents of
the Republic have significantly fewer visits for each income quintile. However, there is once again
some evidence to show that the differences between Northern Ireland and Republic residents are
lesser for those in the highest income quintile, suggesting that the impact of charges in the Republic
lessens as we move up the income distribution.
SUMMARY AND CONCLUSIONS
The purpose of this paper was to compare levels of GP visiting in Northern Ireland and the
Republic, in the context of a situation where over 70 per cent of those in the Republic must pay in
full for their GP visits, while the remainder of the population of the Republic, and all Northern

Ireland residents, receive free GP care. The similarity of the institutional set-up for GP services in
the North and the Republic allows us to assess the impact of charging for GP services on GP
services utilisation. We compared levels of GP visiting by income quintile in Northern Ireland and
the Republic, and found for the higher income quintiles, where the distinction between Northern
Ireland (free GP care) and the Republic of Ireland (charges for GP care) is clearer, that the level of
GP visiting is significantly lower in the Republic of Ireland. We have no reason to believe that the
distribution of health status within income quintiles is any different between the two jurisdictions;
therefore for the middle and higher income quintiles, the results show clearly the effect of charging
for GP visits. In addition, the results indicate that the burden of charges falls somewhat as income
increases, with the coefficient on ROI smaller and less significant for the highest income quintile
than for the middle-income quintiles. Comparing across income quintiles using a pooled model,
while difficult in the absence of comparable health status controls, reinforces this picture.
Unfortunately, we can say little about whether such charges deter “necessary” as well as
“unnecessary” GP consultations without any information on the optimal number of visits for
different population groups. Indeed, it is impossible to say whether Northern Ireland residents are
visiting too frequently or Republic of Ireland residents too infrequently. However, we can say
something about the distributional effect of charges, with our results indicating that the burden
lessens as income increases; to what extent this result would still hold once health status is
controlled for is open to question. This highlights areas in need of further development, principally,
the specification of comparable health status variables so that we can compare non-medical
cardholders in the Republic with those in Northern Ireland to get a more accurate indication of the
effect of charging for GP services.

Table 3 Estimated Coefficients from Ordered Logit Model of GP Visiting, 2001 (Quintile Sub-Samples) Restricted Model Unrestricted Model
Q1
(lowest)
Q2 Q3 Q4 Q5
(highest)
Q1
(lowest)
Q2 Q3 Q4 Q5
(highest)
ROI 0.11
(0.09)
-0.28
(0.09)***
-0.39
(0.09)***
-0.63
(0.09)***
-0.17
(0.09)*
-0.10
(0.31)
-0.22
(0.33)
-0.99
(0.35)***
-1.01
(0.37)***
-0.61
(0.44)
N 1,936 1,931 1,942 1,926 1,948 1,936 1,931 1,942 1,926 1,948
Log-Likelihood -2,940.0 -2,806.0 -2,743.7 -2,578.7 -2,532.8 -2,910.2 -2,988.6 -2,727.6 -2,563.2 -2,523.7
Two-way interactions NO NO NO NO NO YES YES YES YES YES
LR Test of restricted
model
205.0,14χ = 23.68
59.61
Reject
34.95
Reject
32.26
Reject
31.15
Reject
18.28
Do not
reject
Notes Standard errors in parentheses; * significant at 10 per cent level; ** significant at 5 per cent level; *** significant at 1 per cent level.
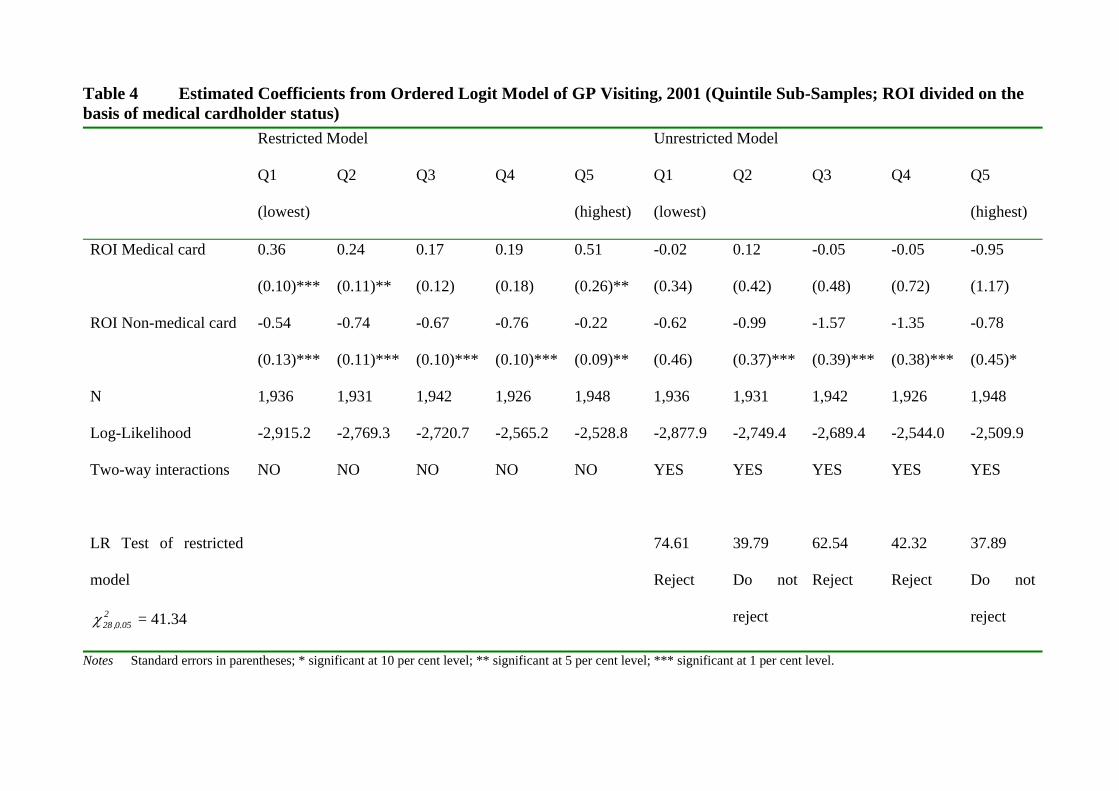
Table 4 Estimated Coefficients from Ordered Logit Model of GP Visiting, 2001 (Quintile Sub-Samples; ROI divided on the basis of medical cardholder status) Restricted Model Unrestricted Model
Q1
(lowest)
Q2 Q3 Q4 Q5
(highest)
Q1
(lowest)
Q2 Q3 Q4 Q5
(highest)
ROI Medical card 0.36
(0.10)***
0.24
(0.11)**
0.17
(0.12)
0.19
(0.18)
0.51
(0.26)**
-0.02
(0.34)
0.12
(0.42)
-0.05
(0.48)
-0.05
(0.72)
-0.95
(1.17)
ROI Non-medical card -0.54
(0.13)***
-0.74
(0.11)***
-0.67
(0.10)***
-0.76
(0.10)***
-0.22
(0.09)**
-0.62
(0.46)
-0.99
(0.37)***
-1.57
(0.39)***
-1.35
(0.38)***
-0.78
(0.45)*
N
1,936 1,931 1,942 1,926 1,948 1,936 1,931 1,942 1,926 1,948
Log-Likelihood -2,915.2 -2,769.3 -2,720.7 -2,565.2 -2,528.8 -2,877.9 -2,749.4 -2,689.4 -2,544.0 -2,509.9
Two-way interactions NO NO NO NO NO YES YES YES YES YES
LR Test of restricted
model
205.0,28χ = 41.34
74.61
Reject
39.79
Do not
reject
62.54
Reject
42.32
Reject
37.89
Do not
reject
Notes Standard errors in parentheses; * significant at 10 per cent level; ** significant at 5 per cent level; *** significant at 1 per cent level.
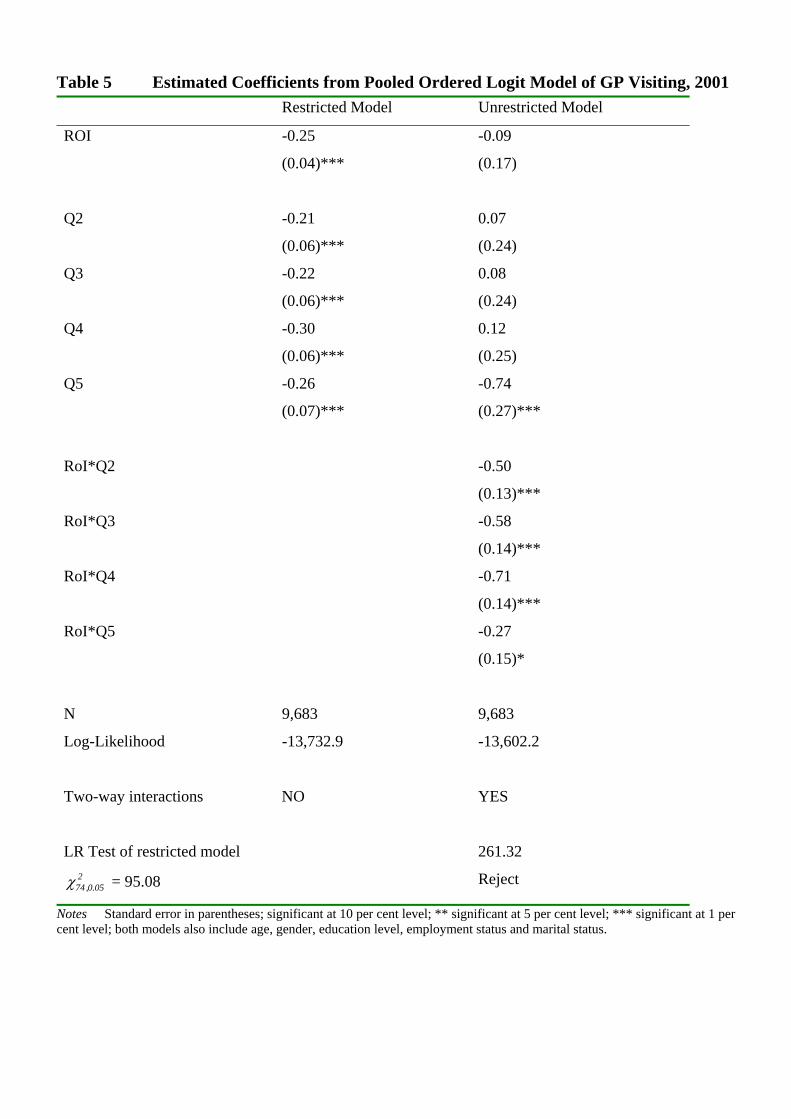
Table 5 Estimated Coefficients from Pooled Ordered Logit Model of GP Visiting, 2001 Restricted Model Unrestricted Model
ROI -0.25
(0.04)***
-0.09
(0.17)
Q2 -0.21
(0.06)***
0.07
(0.24)
Q3 -0.22
(0.06)***
0.08
(0.24)
Q4 -0.30
(0.06)***
0.12
(0.25)
Q5 -0.26
(0.07)***
-0.74
(0.27)***
RoI*Q2 -0.50
(0.13)***
RoI*Q3 -0.58
(0.14)***
RoI*Q4 -0.71
(0.14)***
RoI*Q5 -0.27
(0.15)*
N 9,683 9,683
Log-Likelihood -13,732.9 -13,602.2
Two-way interactions NO YES
LR Test of restricted model 2
05.0,74χ = 95.08
261.32
Reject
Notes Standard error in parentheses; significant at 10 per cent level; ** significant at 5 per cent level; *** significant at 1 per cent level; both models also include age, gender, education level, employment status and marital status.

BIBLIOGRAPHY
Appleby, J. (2005). Independent Review of Health and Social Care Services in Northern Ireland. Belfast: Department of Finance and Personnel.
Beck, R. (1974). The Effects of Co-Payments on the Poor. The Journal of Human Resources, 9 (1), 129-142. Callan, T., Nolan, B., Whelan, B., Hannan, D., Creighton, S. (1989). Poverty, Income and Welfare in Ireland. General Research Series Paper No. 146. Dublin: Economic and Social Research Institute. Canadian Health Services Research Foundation (2001). Myth Busters. Ottawa: Canadian Health Services Research Foundation. European Observatory on Health Care Systems (2002). Funding Health Care: Options for Europe. Buckingham: Open University Press. FÁS (2005). Healthcare Skills Monitoring Report, Dublin: FÁS. Freed Taylor, M. (ed.), Brice, J., Buck, N. and Prentice-Lane, E. (2003). British Household Panel Survey User Manual Volume B11 Codebook, Colchester, University of Essex. General Medical Services Payments Board (2002). Report for the year ended 31 December 2002, Dublin: General Medical Services Payments Board. Helms, J., Newhouse, J. and Phelps, C. (1978). Copayments and demand for the medical care: the California Medicaid experience. Bell Journal of Economics, 9, 192-208. Indecon Economic Consultants (2003). Indecon’s Assessment of Restrictions in the Supply of Professional Services, Dublin: Competition Authority.
Jimenez-Martin, S., Labeaga, J. and Martinez-Granado, M. (2002). Latent Class Versus Two-Part Models in the Demand for Physician Services Across the European Union. Health Economics, 11 (4), 301-322.
McGregor, P., McKee, P. and O’Neill, C. (2003). The Income Sensitivity of GP Utilisation: a conceptual and empirical exploration using the Northern Ireland Household Panel Survey. Working Paper No. 7 of Research Programme on Health Services, Health Inequalities and Health and Social Gain: ESRI, ISSC and University of Ulster.
McGregor, P., McKee, P. and O’Neill, C. (2005). The Utilisation of GP Services in England. Working Paper No. 15 of Research Programme on Health Services, Health Inequalities and Health and Social Gain: ESRI, ISSC and University of Ulster. Madden, D., Nolan, A. and Nolan, B. (2005). GP Reimbursement and Visiting Behaviour in Ireland. Health Economics 14 (10), 1047-1060.
Nolan, A. (2005). A Dynamic Analysis of the Utilisation of GP Services, Working Paper No.13 of Research Programme on Health Services, Health Inequalities and Health and Social Gain: ESRI, ISSC and University of Ulster.

Nolan, A. and Nolan, B. (2003). A Cross-Sectional Analysis of the Utilisation of GP Services in Ireland: 1987-2001. Working Paper No.1 of Research Programme on Health Services, Health Inequalities and Health and Social Gain: ESRI, ISSC and University of Ulster. Nolan, A. and Nolan, B. (2005). Eligibility for free care, need and GP services in Ireland, mimeo, Dublin: ESRI.
Nolan, B. (1991). The Utilisation and Financing of Health Services in Ireland. General Research Series Paper No. 155. Dublin: Economic and Social Research Institute.
Nolan, B. (1993a). Charging for Public Health Services in Ireland: Why and How? Policy Research Series Paper No. 19. Dublin: Economic and Social Research Institute. Nolan, B. (1993b). Economic Incentives, Health Status and Health Services Utilisation. Journal of Health Economics, 12, 151-169.
Pohlmeier, W. and Ulrich, V. (1995). An Econometric Model of the Two-Part Decision Process in the Demand for Health. The Journal of Human Resources, 30 (2), 339-361.
Royal College of General Practitioners (2005). Key Statistics from General Practice. Factsheet No. 5, London: Royal College of General Practitioners.
Scott, K., Marwick, J. and Crampton, P. (2003). Utilization of General Practitioner Services in New Zealand and its Relationship with Income, Ethnicity and Government Subsidy. Health Services Management Research, 16, 45-55.
Tussing, A. (1985). Irish Medical Care Resources: An Economic Analysis. General Research Series Paper No. 126. Dublin: Economic and Social Research Institute.