“if mice were only people talk 10291… · human proof of mechanism proof% of%concept%...
TRANSCRIPT

“If mice were only people….” Re-thinking Pre-Clinical In Vivo Models To Increase the
Probability of Clinical Success
Beth Ann Murphy, PhD Nina Jochnowitz
1

Pharma Industry is Challenged
2
ACME PHARMA Co.
Research Budget
Scien9fic and Technological Advancements
• Many analyses that probe and propose reasons for the decrease in R&D producAvity.
• Consensus is that drug discovery needs to change to be able to deliver novel drugs in the current environment.

Target Discovery
Lead Discovery
Iden9fy a cellular or molecular structure
involved in the pathology of interest.
Can you make a drug to modulate the target?
Lead Op9miza9on Make the Lead have druglike proper9es
Pre-‐clinical Safety/Tox Ph I Ph II Ph III Ph IV
Is the Lead safe to give to people?
IND/ Clinical
Candidate NDA
DISCOVERY DEVELOPMENT CLINICAL
Preclinical Candidate
◦Healthy ◦PK ◦Toxicity
◦Disease ◦PK/Toxicity ◦Efficacy?
◦Longer ◦Safety/Efficacy ◦Risk vs. Benefit ◦Label info.
Post-‐marke9ng
Drug Discovery and Development Process
Druglike Proper9es • Bioavailable • PharmacokineAc (ADME) • Maintain effect on the target
Purpose: demonstrate that the clinical candidate is safe and has pharmacological acAvity that jusAfies tesAng in
humans.
Inves9ga9onal New Drug Applica9on FDA’s Sponsor’s Purpose: seek approval to market.
Purpose: Clinical data support labeling claims
New Drug Applica9on
Compound #
Cost
5,000-‐ 10,000 1
Cost to bring a drug to market was $2.56 billion in 2013 dollars. (Tu?s Center for the Study of Drug Development).

Drug Discovery—Convergence of Disciplines
Patent Law
CombinatorialChemistry
SyntheticChemistry
PhysicalChemistry
Biochemistry
Enzymology
Immunology Pharmacology
InformationTechnology
Modelling
Toxicology
Pathology Behavior
Physiology
Project Management
Medicine
Epidemiology
Genetics

What is the problem?
5
Problem: Drugs discovered in the Preclinical stage frequently fail to translate into clinical success (~10% overall success). • 1991-‐2000 = 11% success rate (Nat. Rev. Drug Discov. 2004 Aug; 3(8):711-‐715.) • 2005-‐2010 = 6% success rate (Nat. Rev. Drug Discov. 2014 Jun; 13(6):419-‐431.)
Preclinical
But why doesn’t the preclinical work translate to humans?
Ph 3 Ph 1 Ph 2
1990’s
100 11
2000’s
6

Animals ≠ Humans
6
• GeneAc • Surgical ManipulaAon • Mimic a chronic condiAon in an acute Ame-‐frame. • Apply animal behavior to a human behavior.
= ≠
• Effects in preclinical in vivo disease models are poor predictors of efficacy in the clinic.

Pathological Process
PHARMACOKINETICS PHARMACODYNAMICS
TransducAon to Efficacy/Safety Target Exposure
Target Occupancy
kon
koff
Target Engagement
Target Mechanism
Biological Process
Outcome Patho-‐physiology
Cp Drug Ce
Plasma
keo
Target site
Biological Process
Think about it Differently: What is a Drug Actually Doing

1. An integrated and quanAtaAve understanding of the PKPD relaAonships and how these translate to humans. Human PK – can we get enough drug to
where it needs to be? Human Target Engagement – can we
modulate the target with the right intensity and duraAon?
Think about it Differently
8
PHARMACOKINETICS PHARMACODYNAMICS
TransducAon to Efficacy/Safety Target Exposure
Target Occupancy
kon
koff
Target Engagement
Target Mechanism
Biological Process
Outcome Patho-‐physiology
Cp Dose Ce
Plasma
keo
Target site
2. Confidence in target-‐disease linkage. Human geneAcs Validated preclinical model
1. 2.
3. Iden9fy and test assump9ons Integrate data to reduce
assumpAons IdenAfy criAcal assumpAons and
assess impact

TranslaBonal Biomarker Bubble Diagram
Proof of Concept Proof of Mechanism Human
Preclinical Species
Patho-physiology or Disease
Process
Efficacy / Outcome
Patho-physiology or Disease
Process
Efficacy/Outcome
Target Mechanism
of Action Biomarker
Physiological ResponseBiomarker
In-Vitro Assays
DrugConcentration
(PK)
In-Vitro Assays
DrugConcentration
(PK)
Target Engagement
Biomarker
Target Mechanism
of Action Biomarker
Physiological ResponseBiomarker
Target Engagement
Biomarker

Example : Respond to Data from a Clinical Trial
LDL HDL XCETP Catalyzes the exchange of TG and CE between HDL and VLDL/LDL
CETP
TG
CE
Inhibit CETP Increase HDL Protect from CVD
“BAD” “GOOD”
Increase HDL Protect from CVD
Lead-‐Op9miza9on Drug Discovery Program for Cardiovascular Disease
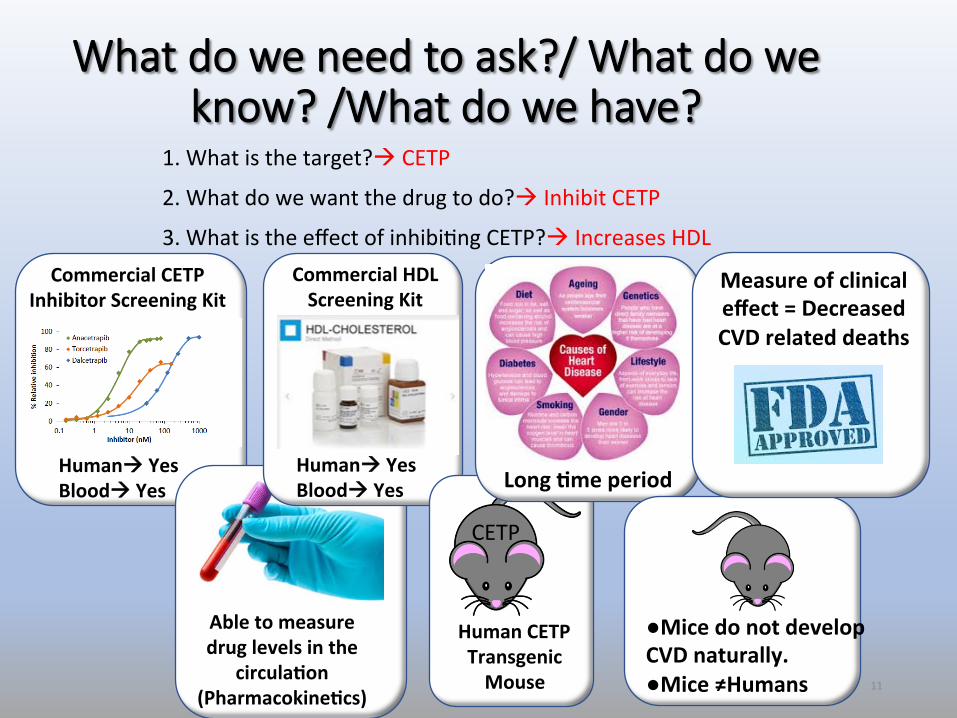
What do we need to ask?/ What do we know? /What do we have?
11
Commercial CETP Inhibitor Screening Kit
Humanà Yes Bloodà Yes
1. What is the target?à CETP
2. What do we want the drug to do?à Inhibit CETP
3. What is the effect of inhibiAng CETP?à Increases HDL
Able to measure drug levels in the
circula9on (Pharmacokine9cs)
Commercial HDL Screening Kit
Humanà Yes Bloodà Yes
CETP
Human CETP Transgenic Mouse
Long 9me period
●Mice do not develop CVD naturally. ●Mice ≠Humans
Measure of clinical effect = Decreased CVD related deaths
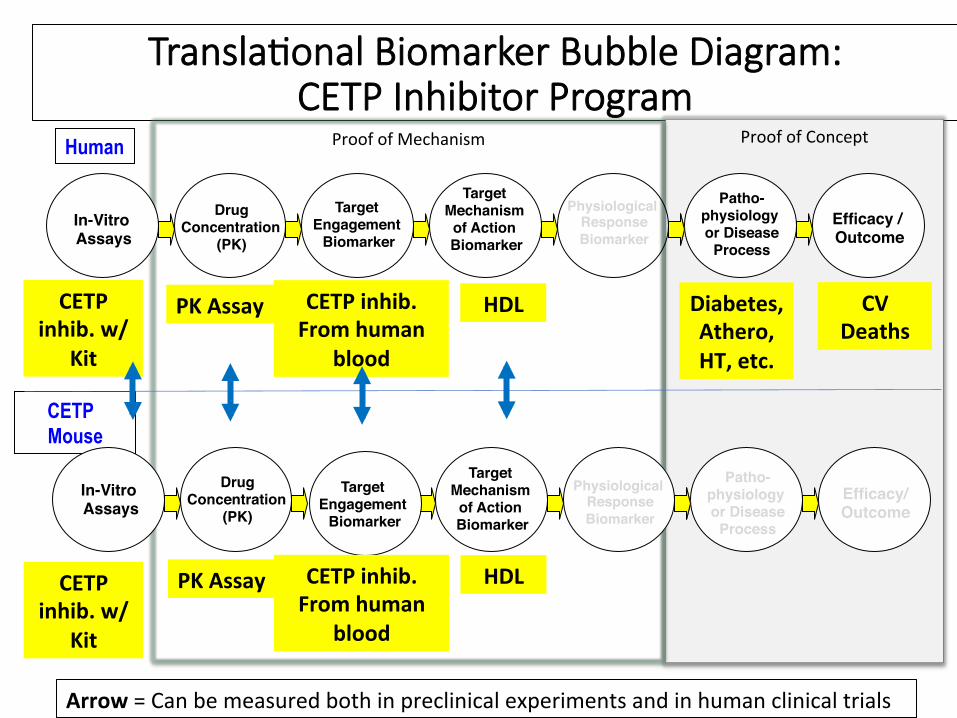
TranslaBonal Biomarker Bubble Diagram: CETP Inhibitor Program
Proof of Concept Proof of Mechanism Human
CETP Mouse
Patho-physiology or Disease
Process
Efficacy / Outcome
Patho-physiology or Disease
Process
Efficacy/Outcome
Target Mechanism
of Action Biomarker
Physiological ResponseBiomarker
In-Vitro Assays
DrugConcentration
(PK)
In-Vitro Assays
DrugConcentration
(PK)
Target Engagement
Biomarker
Arrow = Can be measured both in preclinical experiments and in human clinical trials
Target Mechanism
of Action Biomarker
Physiological ResponseBiomarker
Target Engagement
Biomarker
CETP inhib. w/
Kit
PK Assay
CETP inhib. w/
Kit
PK Assay
CETP inhib. From human
blood
CETP inhib. From human
blood
HDL
HDL
CV Deaths
Diabetes, Athero, HT, etc.

13
Case Study

14
Case Study An9-‐Thrombo9c Drug For Stroke and AFIB

15
What are the Main Cause and Effects of Thrombotic Events1. Cause Atrial Fibrillation 2. Effect Stroke(s)
What is the Human cost?1. Lives2. Annually, Death rate is nearing 300,000 in the
USA3. More than 1,500,000 hospitalizations annually
What is the Financial cost?1. Personal2. Broad Economic losses (work related)3. Forty Billion ($40,000,000) dollars!

Atrial Fibrillation - AFIBDisease of the heart characterized by irregular and often faster heartbeat.Causes of an Irregular Heartbeat• Hypertension, Diabetes, Congestive heart failure, Dehydration,
Hyperkalemia, Mitro-valve Prolapse, Poisoning, (cocaine, amphetamine, digitalis…), Anaphylaxis, hyper & hypo-thyroidism, Cardiomyopathy
Indications• Abnormal electrical discharges (signals) that generate chaotically
throughout the upper chambers of the heart (atria).• Reduction in the Atria to pump blood into the ventricles
• Response is the heart to beat too rapidly.• AFIB causes turbulence of the blood which causes clot formation.• https://youtu.be/fxUITWjrhhs• Management: Rate Control, Maintenance of normal rhythm, stroke
preventionCost
• Prevention: Pharmacological and/or surgical (Cardio conversion, Catheter Ablation, surgical ablation, atrial pacemaker)
• Annually more than 130,000 deaths in the USA. • More than 750,000 hospitalizations occur annually. • AFib costs the United States about $6 billion each year, diagnosis and
treatment. 16

StrokesSudden death of brain cells from lack of oxygen.
• Caused by blockage of blood flow or rupture of an artery to the brain.• Ischemic stroke (part of the brain loses blood flow, bleeding from periphery)• Hemorrhagic stroke (brain bleed, Transient Ischemic Attack, TIA >24 hours)
Indications• Sudden loss of speech, weakness, or paralysis of one side of the body can
be symptoms. • Confirmation by scanning the brain with special X-ray tests, such as CAT
scans.Costs
The death rate and level of disability resulting from strokes can be dramatically reduced by immediate and appropriate medical care. • Prevention involves minimizing risk factors, such as controlling high blood
pressure and diabetes. • Stroke kills about 140,000 Americans each year—that’s 1 out of every 20
deaths.• Annually795,000 people in the United States have a stroke. About 610,000
of these are first or new strokes• About 87% of all strokes are ischemic strokes.• Stroke costs the United States an estimated $34 billion
Animal Models: AV Shunt
17

Project A: An9-‐Coagulant Drug Discovery Program: Intrinsic Pathway Inhibitor
CLOT 18

ELIQUIS (apixaban) PRT-‐054,021 (betrixaban) SAVAYSA(edoxaban) XARELTO(rivoroxaban)
Vitamin K antagonists (warfarin)
Vitamin K antagonists (warfarin)
Coagula9on Factor Targets of Currently Approved SOC or An9-‐Coagulant Drugs
19

What do we need to ask?/ What do we know? /What do we have?
20
1. What is the target?à fIXa
2. What do we want the drug to do?à Inhibit excess thromboAc acAvity
3. What is the effect of inhibiAng factor 9?à Decreased in thromboAc events
Able to measure drug levels in the circula9on (Pharmacokine9cs)
Commercial aPTT Screening Kit
Humanà Yes Bloodà Yes
Long 9me period
●Rabbits do not develop CVD naturally. ●Rabbits ≠ Humans
Measure of clinical effect = Decreased CVD related deaths
AVS Model
Commercial FIXa Inhibitor Screening Kit
Humanà Yes Bloodà Yes
AVS
aPTT

aPTT: A Rou9ne Clinical Test and a Biomarker of Intrinsic Pathway Coagula9on
ACTIVATED PARTIAL THROMBOPLASTIN TIME
(APTT) 21
TIME TO CLOT
Inhibitors of the Intrinsic Pathway à
↑ APTT
Back
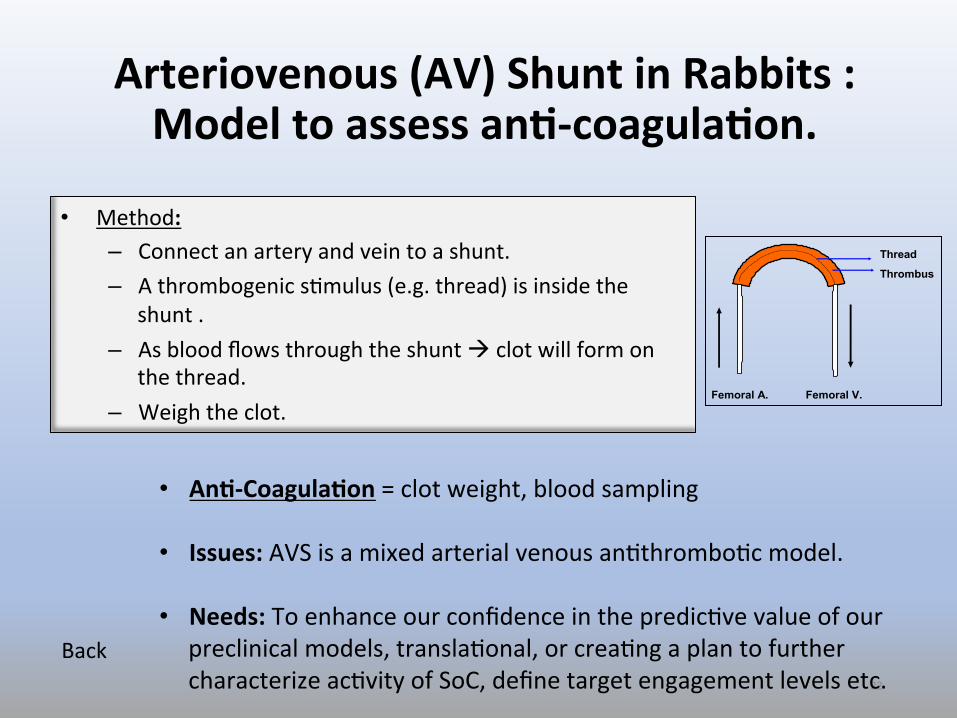
Arteriovenous (AV) Shunt in Rabbits : Model to assess an9-‐coagula9on.
22
To carotid artery To jugular vein
AV-Shunt
ThreadThrombus
AV-shunt
Thread
Thrombus
Femoral A. Femoral V.
• Method: – Connect an artery and vein to a shunt. – A thrombogenic sAmulus (e.g. thread) is inside the
shunt . – As blood flows through the shunt à clot will form on
the thread. – Weigh the clot.
• An9-‐Coagula9on = clot weight, blood sampling
• Issues: AVS is a mixed arterial venous anAthromboAc model.
• Needs: To enhance our confidence in the predicAve value of our preclinical models, translaAonal, or creaAng a plan to further characterize acAvity of SoC, define target engagement levels etc.
Back

Arteriovenous (AV) Shunt in Rats : Model to assess an9-‐coagula9on.
23
To carotid artery To jugular vein
AV-Shunt
ThreadThrombus
AV-shunt
Thread
Thrombus
Femoral A. Femoral V.
• Method: – Connect an artery and vein to a shunt. – A thrombogenic sAmulus (e.g. thread) is inside the
shunt . – As blood flows through the shunt à clot will form on
the thread. – Weigh the clot.
• An9-‐Coagula9on = clot weight • Can take blood samples from the AVS rats.

Work Sheet
24
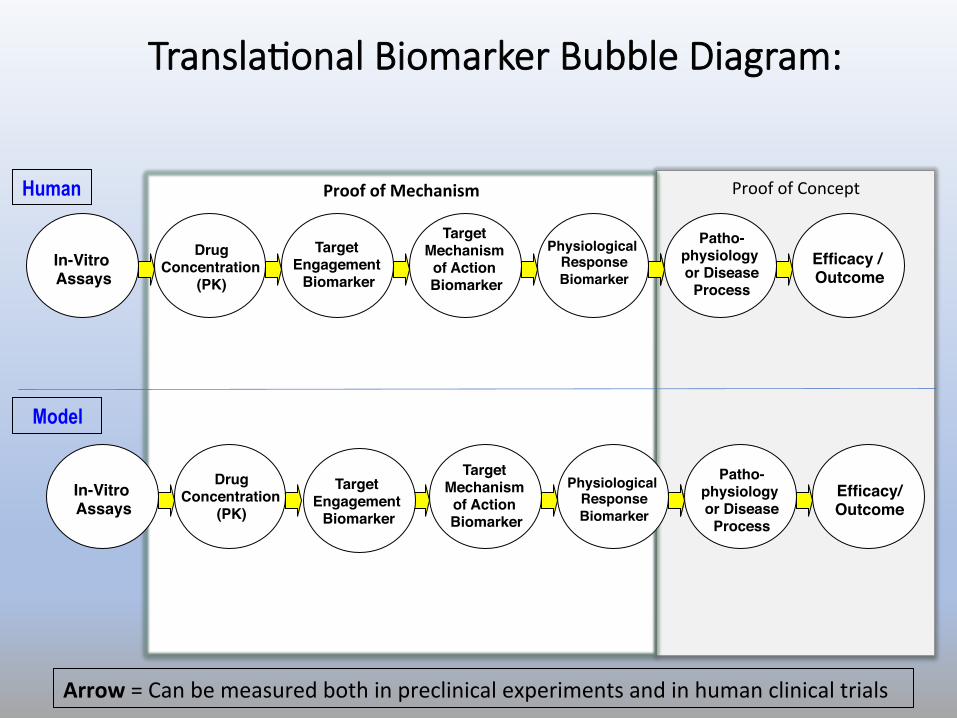
TranslaBonal Biomarker Bubble Diagram:
Proof of Concept Proof of Mechanism Human
Model
Patho-physiology or Disease
Process
Efficacy / Outcome
Patho-physiology or Disease
Process
Efficacy/Outcome
Target Mechanism
of Action Biomarker
Physiological ResponseBiomarker
In-Vitro Assays
DrugConcentration
(PK)
In-Vitro Assays
DrugConcentration
(PK)
Target Engagement
Biomarker
Arrow = Can be measured both in preclinical experiments and in human clinical trials
Target Mechanism
of Action Biomarker
Physiological ResponseBiomarker
Target Engagement
Biomarker

26
In vitro assay: Measure of in vitro acAvity, such as potency or affinity Drug concentra9on: The pharmacokineAcs of the compound typically measured as unbound plasma concentraAons and/or target site exposure Target engagement biomarker: Measurement of compound binding to target, such as with PET or measuring anAbody bound to anAgen. Target Mechanism of Ac9on Biomarker: A proximal biochemical or proximal physiological (eg electrophysiological) response as a result of compound interacAon with the target Physiological Response Biomarker: A physiological or Assue response driven by compound acAvity at the target, but not directly linked to pathophysiology Pathophysiology or Disease Process: A biochemical response involved in the disease process or acAvity in an animal model or on a clinical endpoint that serves as an index of the disease process Efficacy/Outcome: AcAvity in an animal model of disease that has been demonstrated to predict clinical efficacy or posiAve effect on a clinical endpoint endorsed by regulators as sufficient for approval
Explana9on of Bubbles

Case Study: TranslaBonal Biomarker Bubble Diagram
Proof of Concept Proof of Mechanism
Human
Patho-physiology or Disease
ProcessEfficacy / Outcome
Patho-physiology or Disease
Process
Efficacy/Outcome
In-Vitro Assays
DrugConcentration
(PK)
In-Vitro Assays
DrugConcentration
(PK)
aPTT
AVS aPTT, Ex vivo aPTT
Plasma
Plasma
Green shading = Biomarkers that are translaAonal and/or support IVIVC and have been validated/reduced to pracAce Blue arrow = Need for mathemaAcal translaAonal modelling across species * Indicates assay in development
Target Mechanism
of Action Biomarker
Physiological ResponseBiomarker
Target Mechanism
of Action Biomarker
Physiological ResponseBiomarker
Target Engagement
Biomarker
Ex vivo aPTT, PT
Phase II: ThromboAc
events; Stroke, TIA, Pulmonary
Phase III:CVD Related Deaths
X X
X XRabbit
Target Engagement
Target Engagement
BiomarkerX