aon investment research and insights msci s … investment research and insights msci s announcement...
TRANSCRIPT
Aon Investment Research and Insights
MSCI’s Announcement to Add China A-Shares to its Emerging Markets IndexLooking Beyond the Tiny Percentage
November 2017
Aon HewittRetirement and Investment
2 Name of study or publication
Introduction . . . . . . . . . . . . . . . . . . . . . . . . . . . . . . . . . . . . . . . . . . . . . . . 3
China A-Shares, a big market but a tiny weight in the MSCI EM index . . 3
Background of the baby step . . . . . . . . . . . . . . . . . . . . . . . . . . . . . . . . . 6
When A-Shares are fully included . . . . . . . . . . . . . . . . . . . . . . . . . . . . . . . 7
Implications . . . . . . . . . . . . . . . . . . . . . . . . . . . . . . . . . . . . . . . . . . . . . . . 8
More than the influx of passive money . . . . . . . . . . . . . . . . . . . . . . . . 10
Conclusion . . . . . . . . . . . . . . . . . . . . . . . . . . . . . . . . . . . . . . . . . . . . . . . 11
Table of contents
About Aon Investment Research and InsightsAon Hewitt’s robust portfolio of ideas, tools and researched solutions support trustees and sponsors to anticipate their future investment requirements.
By beginning to identify investment research and communicate ideas before they are needed we can shorten the implementation times for our clients and act in a timely way when opportunities are correctly priced.
To learn more and to access other research and insights from Aon’s investment experts, visit aonhewitt.com/investment
Aon Hewitt | Retirement and Investment | Research and Insights MSCI’s Announcement to Add China A-Shares to its Emerging Markets Index 3
China A-Shares, a big market but a tiny weight in the MSCI EM index
Introduction
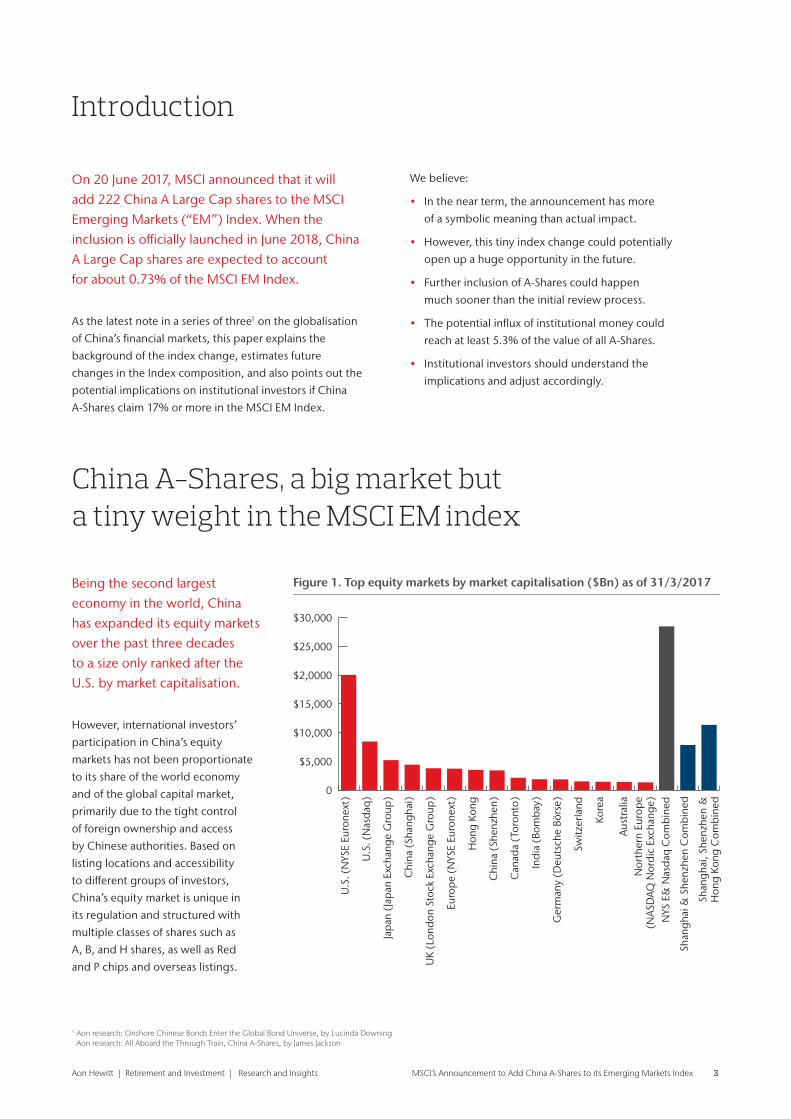
On 20 June 2017, MSCI announced that it will add 222 China A Large Cap shares to the MSCI Emerging Markets (“EM”) Index. When the inclusion is officially launched in June 2018, China A Large Cap shares are expected to account for about 0.73% of the MSCI EM Index.
As the latest note in a series of three1 on the globalisation
of China’s financial markets, this paper explains the
background of the index change, estimates future
changes in the Index composition, and also points out the
potential implications on institutional investors if China
A-Shares claim 17% or more in the MSCI EM Index.
We believe:
• In the near term, the announcement has more
of a symbolic meaning than actual impact.
• However, this tiny index change could potentially
open up a huge opportunity in the future.
• Further inclusion of A-Shares could happen
much sooner than the initial review process.
• The potential influx of institutional money could
reach at least 5.3% of the value of all A-Shares.
• Institutional investors should understand the
implications and adjust accordingly.
Figure 1. Top equity markets by market capitalisation ($Bn) as of 31/3/2017Being the second largest economy in the world, China has expanded its equity markets over the past three decades to a size only ranked after the U.S. by market capitalisation.
However, international investors’
participation in China’s equity
markets has not been proportionate
to its share of the world economy
and of the global capital market,
primarily due to the tight control
of foreign ownership and access
by Chinese authorities. Based on
listing locations and accessibility
to different groups of investors,
China’s equity market is unique in
its regulation and structured with
multiple classes of shares such as
A, B, and H shares, as well as Red
and P chips and overseas listings.
0
$5,000
$10,000
$15,000
$2,0000
$25,000
$30,000
Shan
ghai
, She
nzhe
n &
Hon
g Ko
ng C
omb
ined
Shan
ghai
& S
henz
hen
Com
bin
ed
NYS
E&
Nas
daq
Com
bin
ed
Nor
ther
n Eu
rop
e(N
ASD
AQ N
ord
ic E
xcha
nge)
Aus
tral
ia
Kore
a
Switz
erla
nd
Ger
man
y (D
euts
che
Börs
e)
Ind
ia (
Bom
bay
)
Can
ada
(Tor
onto
)
Chi
na (
Shen
zhen
)
Hon
g Ko
ng
Euro
pe
(NYS
E Eu
rone
xt)
UK
(Lon
don
Sto
ck E
xcha
nge
Gro
up)
Chi
na (
Shan
ghai
)
Jap
an (
Jap
an E
xcha
nge
Gro
up)
U.S
. (N
asd
aq)
U.S
. (N
YSE
Euro
next
)
1 Aon research: Onshore Chinese Bonds Enter the Global Bond Universe, by Lucinda Downing Aon research: All Aboard the Through Train, China A-Shares, by James Jackson
Aon Hewitt | Retirement and Investment | Research and Insights MSCI’s Announcement to Add China A-Shares to its Emerging Markets Index 4
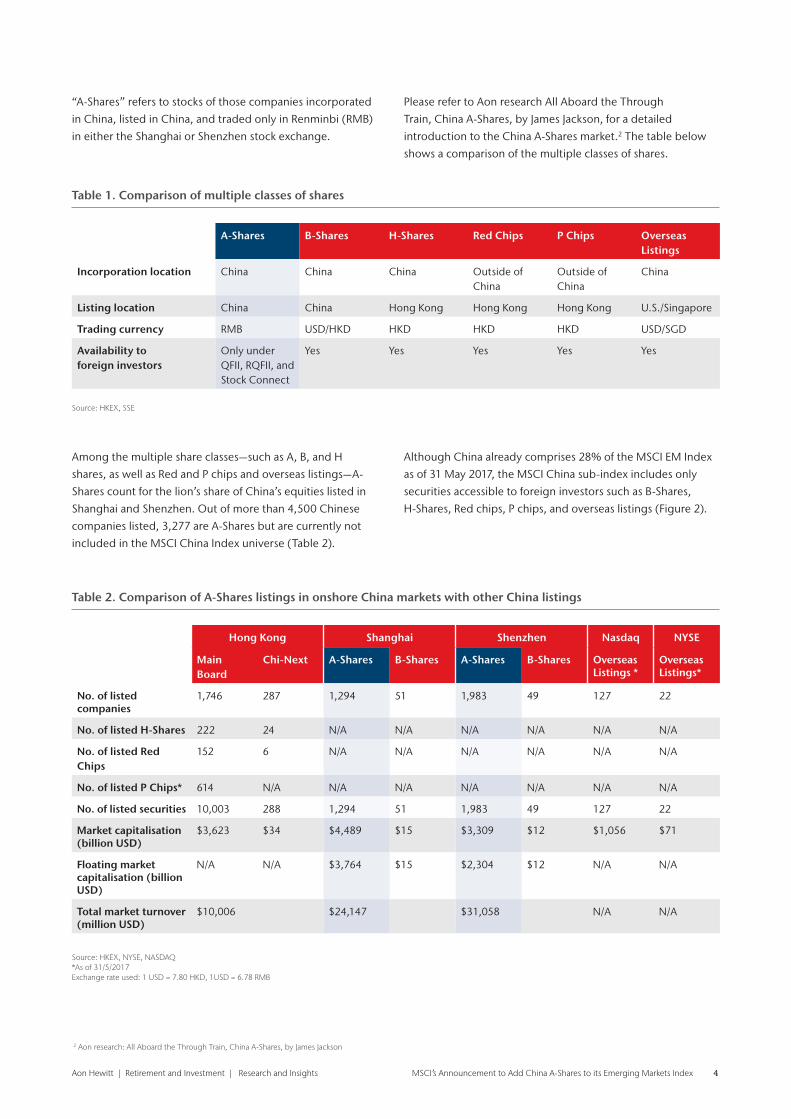
Table 1. Comparison of multiple classes of shares
Table 2. Comparison of A-Shares listings in onshore China markets with other China listings
A-Shares B-Shares H-Shares Red Chips P Chips Overseas Listings
Incorporation location China China China Outside of China
Outside of China
China
Listing location China China Hong Kong Hong Kong Hong Kong U.S./Singapore
Trading currency RMB USD/HKD HKD HKD HKD USD/SGD
Availability to foreign investors
Only under QFII, RQFII, and Stock Connect
Yes Yes Yes Yes Yes
Hong Kong Shanghai Shenzhen Nasdaq NYSE
Main Board
Chi-Next A-Shares B-Shares A-Shares B-Shares Overseas Listings *
Overseas Listings*
No. of listed companies
1,746 287 1,294 51 1,983 49 127 22
No. of listed H-Shares 222 24 N/A N/A N/A N/A N/A N/A
No. of listed Red Chips
152 6 N/A N/A N/A N/A N/A N/A
No. of listed P Chips* 614 N/A N/A N/A N/A N/A N/A N/A
No. of listed securities 10,003 288 1,294 51 1,983 49 127 22
Market capitalisation (billion USD)
$3,623 $34 $4,489 $15 $3,309 $12 $1,056 $71
Floating market capitalisation (billion USD)
N/A N/A $3,764 $15 $2,304 $12 N/A N/A
Total market turnover (million USD)
$10,006 $24,147 $31,058 N/A N/A
“A-Shares” refers to stocks of those companies incorporated
in China, listed in China, and traded only in Renminbi (RMB)
in either the Shanghai or Shenzhen stock exchange.
Please refer to Aon research All Aboard the Through
Train, China A-Shares, by James Jackson, for a detailed
introduction to the China A-Shares market.2 The table below
shows a comparison of the multiple classes of shares.
Among the multiple share classes—such as A, B, and H
shares, as well as Red and P chips and overseas listings—A-
Shares count for the lion’s share of China’s equities listed in
Shanghai and Shenzhen. Out of more than 4,500 Chinese
companies listed, 3,277 are A-Shares but are currently not
included in the MSCI China Index universe (Table 2).
Although China already comprises 28% of the MSCI EM Index
as of 31 May 2017, the MSCI China sub-index includes only
securities accessible to foreign investors such as B-Shares,
H-Shares, Red chips, P chips, and overseas listings (Figure 2).
Source: HKEX, NYSE, NASDAQ*As of 31/5/2017Exchange rate used: 1 USD = 7.80 HKD, 1USD = 6.78 RMB
Source: HKEX, SSE
2 Aon research: All Aboard the Through Train, China A-Shares, by James Jackson
Aon Hewitt | Retirement and Investment | Research and Insights MSCI’s Announcement to Add China A-Shares to its Emerging Markets Index 5
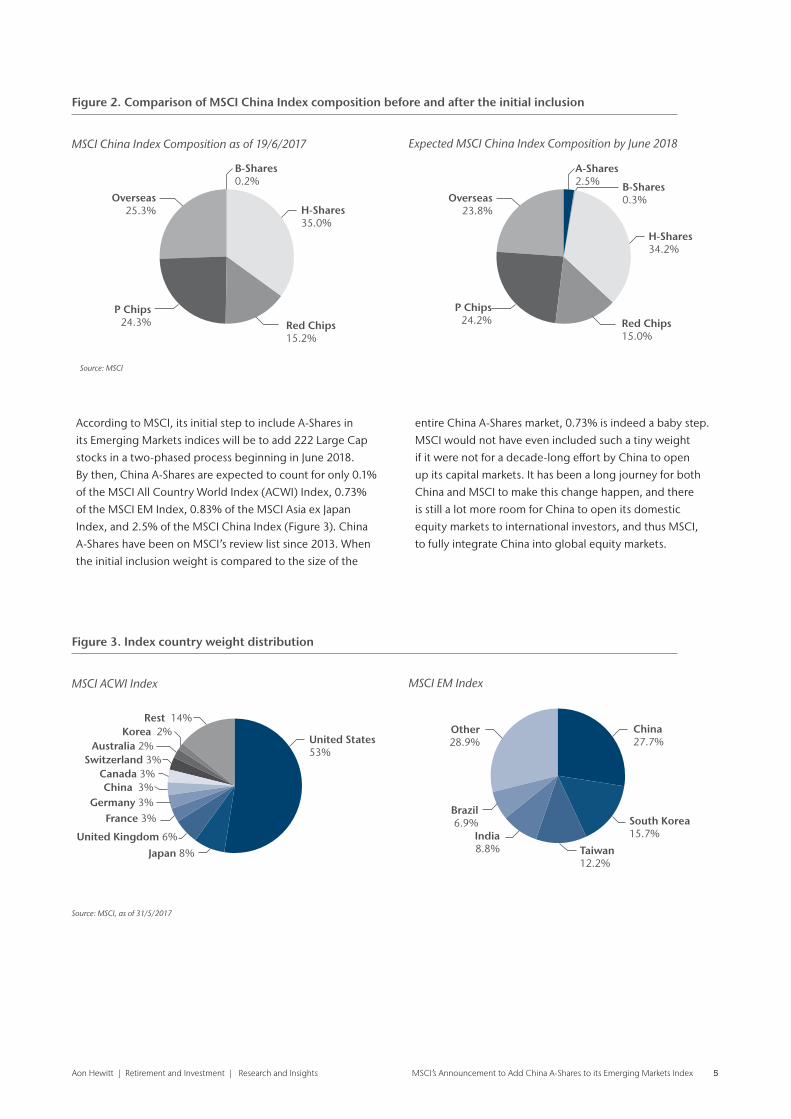
Figure 2. Comparison of MSCI China Index composition before and after the initial inclusion
Figure 3. Index country weight distribution
Expected MSCI China Index Composition by June 2018
MSCI EM Index
MSCI China Index Composition as of 19/6/2017
MSCI ACWI Index
Source: MSCI, as of 31/5/2017
Source: MSCI
According to MSCI, its initial step to include A-Shares in
its Emerging Markets indices will be to add 222 Large Cap
stocks in a two-phased process beginning in June 2018.
By then, China A-Shares are expected to count for only 0.1%
of the MSCI All Country World Index (ACWI) Index, 0.73%
of the MSCI EM Index, 0.83% of the MSCI Asia ex Japan
Index, and 2.5% of the MSCI China Index (Figure 3). China
A-Shares have been on MSCI’s review list since 2013. When
the initial inclusion weight is compared to the size of the
entire China A-Shares market, 0.73% is indeed a baby step.
MSCI would not have even included such a tiny weight
if it were not for a decade-long effort by China to open
up its capital markets. It has been a long journey for both
China and MSCI to make this change happen, and there
is still a lot more room for China to open its domestic
equity markets to international investors, and thus MSCI,
to fully integrate China into global equity markets.
Overseas25.3%
P Chips24.3% Red Chips
15.2%
H-Shares35.0%
B-Shares0.2%
Overseas23.8%
P Chips24.2% Red Chips
15.0%
H-Shares34.2%
B-Shares0.3%
A-Shares2.5%
Rest 14% Korea 2%
Australia 2% Switzerland 3%
Canada 3% China 3%
Germany 3% France 3%
United Kingdom 6%
Japan 8%
United States53%
Other28.9%
Brazil6.9%
India8.8% Taiwan
12.2%
South Korea15.7%
China 27.7%
Aon Hewitt | Retirement and Investment | Research and Insights MSCI’s Announcement to Add China A-Shares to its Emerging Markets Index 6
Background of the baby step
China’s A-Shares market has not been easy for foreign investors to access. They could only gain access to China’s A-Shares market through strictly controlled quota schemes—such as the Qualified Foreign Institutional Investor (QFII) scheme and the Renminbi Qualified Foreign Institutional Investor (RQFII) program—and Stock Connect, the latest platform since 2014. The Stock Connect program allowed foreign investors to access A-Shares traded in the Shanghai or Shenzhen stock exchange via the Hong Kong stock exchange, though with some restrictions such as daily trading volume.3 Embracing foreign capital in its domestic equity market was a slow and extremely cautious process for China.
The process for MSCI to include China A-Shares in its index
series has also been very slow. Among MSCI Global Market
Accessibility criteria, “openness to foreign ownership”
and “ease of capital inflows/outflows” are among the
major obstacles to MSCI not including China A-Shares in
the EM Index after three annual reviews prior to 2017.
China has gradually relaxed its QFII scheme and RQFII
program since 2012. MSCI and the institutional investment
community welcomed this liberalisation of China’s domestic
equity market and applauded when China launched the
Shanghai-Hong Kong and Shenzhen-Hong Kong Stock
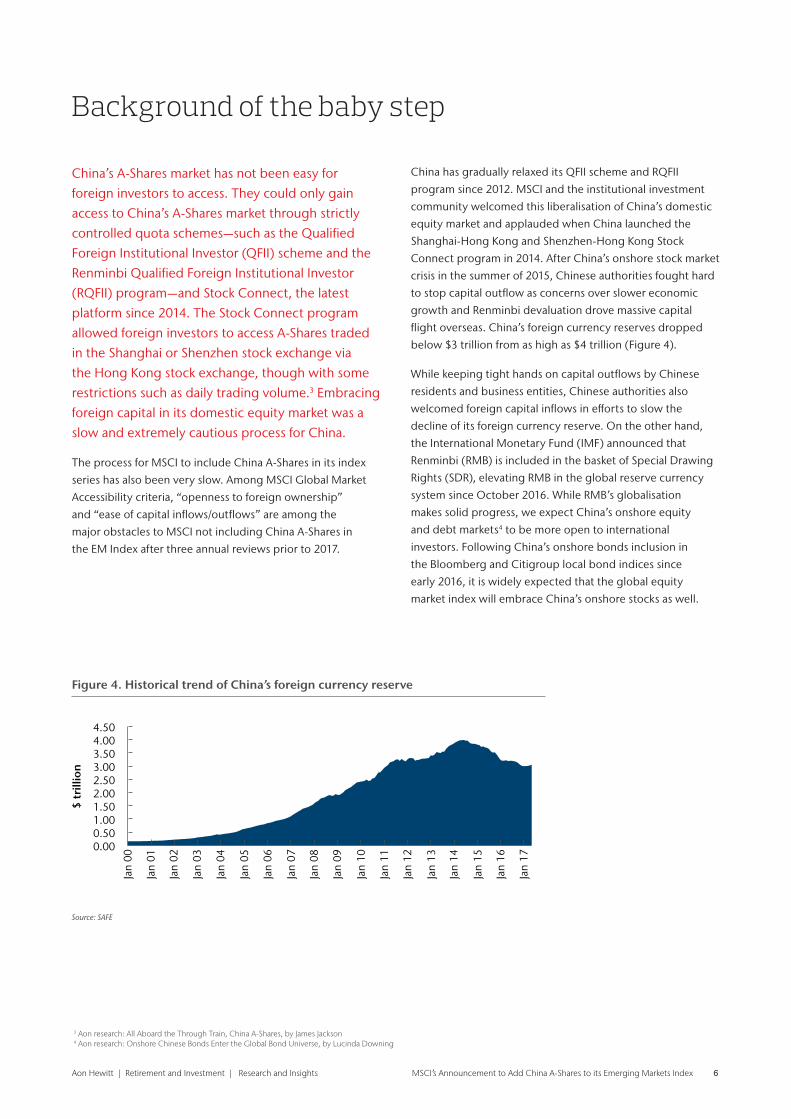
Connect program in 2014. After China’s onshore stock market
crisis in the summer of 2015, Chinese authorities fought hard
to stop capital outflow as concerns over slower economic
growth and Renminbi devaluation drove massive capital
flight overseas. China’s foreign currency reserves dropped
below $3 trillion from as high as $4 trillion (Figure 4).
While keeping tight hands on capital outflows by Chinese
residents and business entities, Chinese authorities also
welcomed foreign capital inflows in efforts to slow the
decline of its foreign currency reserve. On the other hand,
the International Monetary Fund (IMF) announced that
Renminbi (RMB) is included in the basket of Special Drawing
Rights (SDR), elevating RMB in the global reserve currency
system since October 2016. While RMB’s globalisation
makes solid progress, we expect China’s onshore equity
and debt markets4 to be more open to international
investors. Following China’s onshore bonds inclusion in
the Bloomberg and Citigroup local bond indices since
early 2016, it is widely expected that the global equity
market index will embrace China’s onshore stocks as well.
Figure 4. Historical trend of China’s foreign currency reserve
0.00
Jan
00
Jan
01
Jan
02
Jan
03
Jan
04
Jan
05
Jan
06
Jan
07
Jan
08
Jan
09
Jan
10
Jan
11
Jan
12
Jan
13
Jan
14
Jan
15
Jan
16
Jan
17
0.501.001.502.002.503.003.504.004.50
$ tr
illio
n
Source: SAFE
3 Aon research: All Aboard the Through Train, China A-Shares, by James Jackson4 Aon research: Onshore Chinese Bonds Enter the Global Bond Universe, by Lucinda Downing
Aon Hewitt | Retirement and Investment | Research and Insights MSCI’s Announcement to Add China A-Shares to its Emerging Markets Index 7
When A-Shares are fully included
As MSCI stated, “Further inclusion of China A-Shares could potentially include an increase of the currently announced 5% inclusion factor5 “as well as the addition of China A Mid Cap shares” depending on “how China’s A Shares market aligns with international market accessibility standards.”
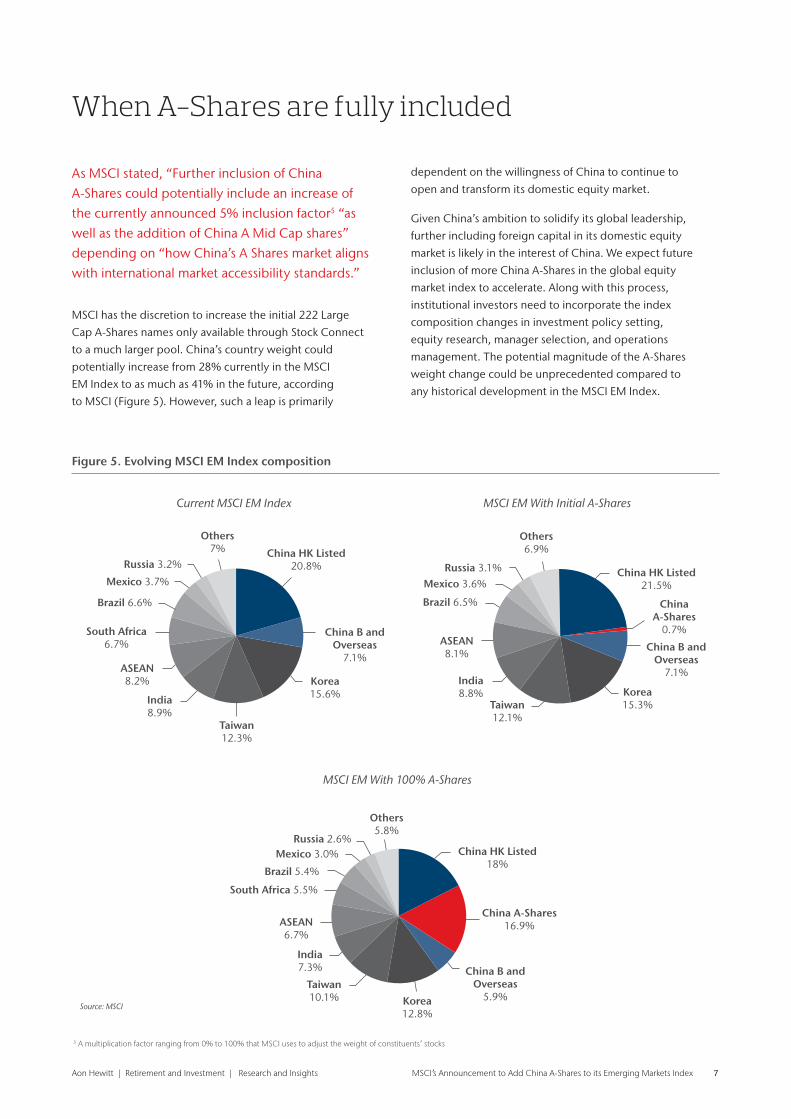
MSCI has the discretion to increase the initial 222 Large
Cap A-Shares names only available through Stock Connect
to a much larger pool. China’s country weight could
potentially increase from 28% currently in the MSCI
EM Index to as much as 41% in the future, according
to MSCI (Figure 5). However, such a leap is primarily
dependent on the willingness of China to continue to
open and transform its domestic equity market.
Given China’s ambition to solidify its global leadership,
further including foreign capital in its domestic equity
market is likely in the interest of China. We expect future
inclusion of more China A-Shares in the global equity
market index to accelerate. Along with this process,
institutional investors need to incorporate the index
composition changes in investment policy setting,
equity research, manager selection, and operations
management. The potential magnitude of the A-Shares
weight change could be unprecedented compared to
any historical development in the MSCI EM Index.
Figure 5. Evolving MSCI EM Index composition
5 A multiplication factor ranging from 0% to 100% that MSCI uses to adjust the weight of constituents’ stocks
Others7%
Russia 3.2%
Mexico 3.7%
Brazil 6.6%
South Africa6.7%
ASEAN8.2%
India8.9%
Taiwan12.3%
Korea15.6%
China B andOverseas
7.1%
China HK Listed20.8%
Others6.9%
Russia 3.1%Mexico 3.6%
Brazil 6.5%
ASEAN8.1%
India8.8%
Taiwan12.1%
Korea15.3%
China B andOverseas
7.1%
ChinaA-Shares
0.7%
China HK Listed21.5%
Others5.8%
Russia 2.6%Mexico 3.0%
Brazil 5.4%
South Africa 5.5%
ASEAN6.7%
India7.3%
Taiwan10.1% Korea
12.8%
China B andOverseas
5.9%
China A-Shares16.9%
China HK Listed18%
Source: MSCI
Current MSCI EM Index MSCI EM With Initial A-Shares
MSCI EM With 100% A-Shares
Aon Hewitt | Retirement and Investment | Research and Insights MSCI’s Announcement to Add China A-Shares to its Emerging Markets Index 8
If China’s country weight claims 41% in the EM Index, and A-Shares alone count for 17%, as MSCI has illustrated as a future possibility, investors will need to incorporate the A-Shares market risk/return profile in their capital market assumptions for Emerging Markets Equity.
When A-Shares are at a full inclusion stage, we believe
investors need to re-evaluate the capability of their broad
mandate managers in Emerging Markets or Asia markets
and be ready to deploy specialist managers if necessary.
Whether adopting a passive or active strategy, investors
will have to assess their prior experience and exposure
and identify available resources. Certain style and factor
investment managers will need to calibrate their factor
investing approaches for some unique characteristics
of A-Shares. On the operational front, investors need
to embrace different trading and settlement rules.
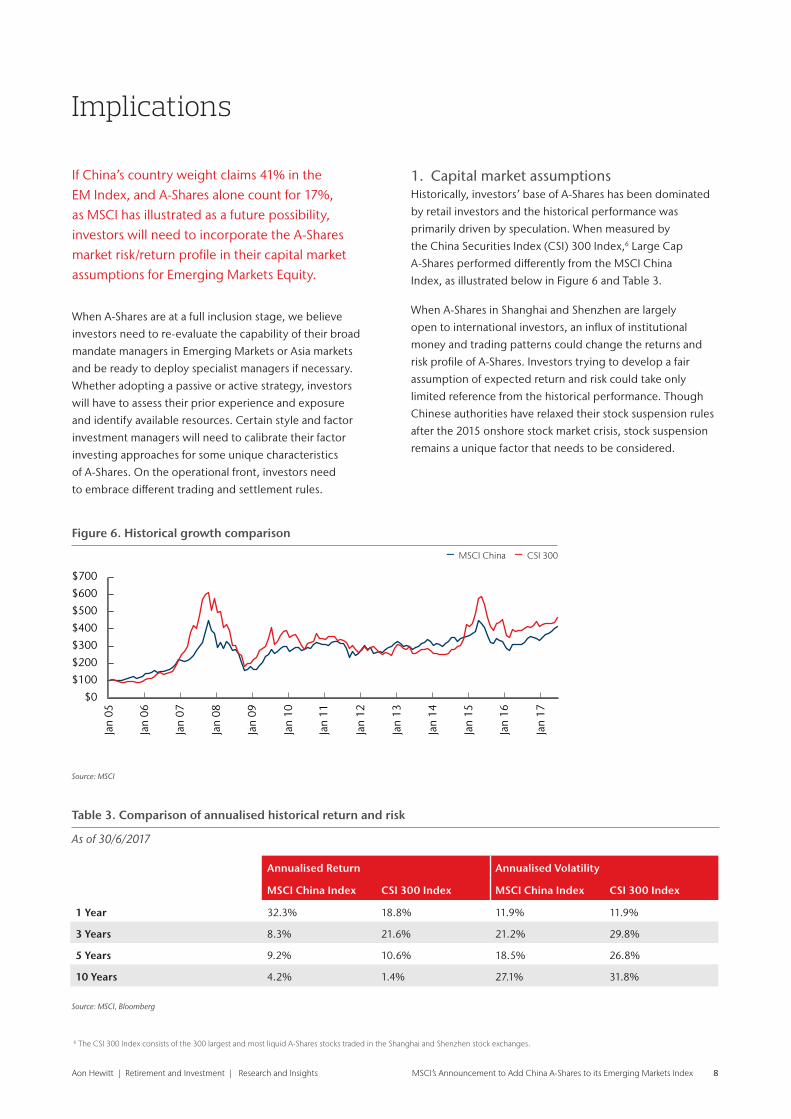
1 . Capital market assumptions Historically, investors’ base of A-Shares has been dominated
by retail investors and the historical performance was
primarily driven by speculation. When measured by
the China Securities Index (CSI) 300 Index,6 Large Cap
A-Shares performed differently from the MSCI China
Index, as illustrated below in Figure 6 and Table 3.
When A-Shares in Shanghai and Shenzhen are largely
open to international investors, an influx of institutional
money and trading patterns could change the returns and
risk profile of A-Shares. Investors trying to develop a fair
assumption of expected return and risk could take only
limited reference from the historical performance. Though
Chinese authorities have relaxed their stock suspension rules
after the 2015 onshore stock market crisis, stock suspension
remains a unique factor that needs to be considered.
Implications
Figure 6. Historical growth comparison
– MSCI China – CSI 300
Table 3. Comparison of annualised historical return and risk
As of 30/6/2017
Annualised Return Annualised Volatility
MSCI China Index CSI 300 Index MSCI China Index CSI 300 Index
1 Year 32.3% 18.8% 11.9% 11.9%
3 Years 8.3% 21.6% 21.2% 29.8%
5 Years 9.2% 10.6% 18.5% 26.8%
10 Years 4.2% 1.4% 27.1% 31.8%
$0
$100
$200
$300
$400
$500
$600
$700
Jan
05
Jan
06
Jan
07
Jan
08
Jan
09
Jan
10
Jan
11
Jan
12
Jan
13
Jan
14
Jan
15
Jan
16
Jan
17
Source: MSCI
Source: MSCI, Bloomberg
6 The CSI 300 Index consists of the 300 largest and most liquid A-Shares stocks traded in the Shanghai and Shenzhen stock exchanges.
Aon Hewitt | Retirement and Investment | Research and Insights MSCI’s Announcement to Add China A-Shares to its Emerging Markets Index 9
2 . Passive vs . active considerations Asset owners need to evaluate whether a passive or
active strategy is the best approach to gain exposure. We
believe investors without prior exposure or experience
with A Shares are better off adopting a passive strategy.
Nevertheless, the challenge is then shifted to managers and
custodian banks, which need to be ready to include 2,000+
companies. Investors already embracing an active strategy
in their Emerging Markets Equity mandate need to realise
that current active Emerging Markets managers will be
challenged with a far broader research base, yet presented
with opportunities of alpha generation. Asset owners need
to check whether their equity fund managers have sufficient
resources to develop insights around the A-Shares market.
3 . Broader mandate or specialist manager We still believe a broader mandate of Emerging Markets
and ACWI Asia would be appropriate at the initial stage of
MSCI EM Index inclusion. However, at a full inclusion stage,
investors must determine whether a broader mandate
manager has sufficient capability to cover the entire
China market. Otherwise, a specialist manager should be
considered. By that time, we suspect that MSCI might roll
out the Emerging Markets ex China Index to pair with the
China Index so that investors have sufficient flexibility to
deploy different strategies. We encourage investors to review
and evaluate their current Global Equity and Emerging
Markets managers in the context of the evolving landscape.
4 . Calibration of style and factor investment approach
We would like to point out some unique China A-Shares
market characteristics for investors who are used to
mature markets in the U.S. and Europe. For example,
many state-owned enterprises (SOEs) are traded at
relatively low price-to-earnings (P/E) ratios compared to
the broader A-Shares. We suggest that traditional value
investors resist comparing SOEs to other value stocks on
the same platform. Due to the unique stock suspension
rule in Shanghai and Shenzhen exchanges, historical
volatility might not accurately reflect a stock’s real risk
level. Low-volatility managers will need to calibrate their
approach to count in the impact of stock suspensions.
High turnover of fund managers7 is common in China.
Therefore, short track records of many funds in A-Shares
are another reality for investors relying on back testing.
5 . Different trading and settlement rulesA-Shares are subject to some unique trading rules, such as
a daily price limit of +/10% and unit of trading quantity.
Most A-Shares are limited to a daily trading price range of
+10% to 10% of the prior day’s closing price. Currently,
trading quantity of A-Shares cannot be any random number
of shares, but has to be in the multiples of 100 shares. In
addition to the trading rule difference, the current settlement
cycle of A-Shares through Stock Connect is also different
from the schedule in the U.S. Securities settle on T and
money on T+1 for A-Shares through Stock Connect, as
compared to securities on T and money on T+3 in the U.S.8
If such a settlement cycle difference remains in the future,
we don’t see it as a risk for managers and brokers. Over the
past few years, working with local brokers, sub-custodian
banks, and clearing houses in China, many institutions have
already handled investing, and custody and accounting
in the China market effectively through Stock Connect.
7 Aon Hewitt Retirement & Investment Blog: “Volatility in China’s Stock Market” by Fei Amy Shang and John Thompson – https://retirementandinvestmentblog.aon.com/BlogHome/Blog/October-2015/Volatility-in-China’s-Stock-Market.aspx
8 http://english.sse.com.cn/investors/shhkconnect/clear/
Aon Hewitt | Retirement and Investment | Research and Insights MSCI’s Announcement to Add China A-Shares to its Emerging Markets Index 10
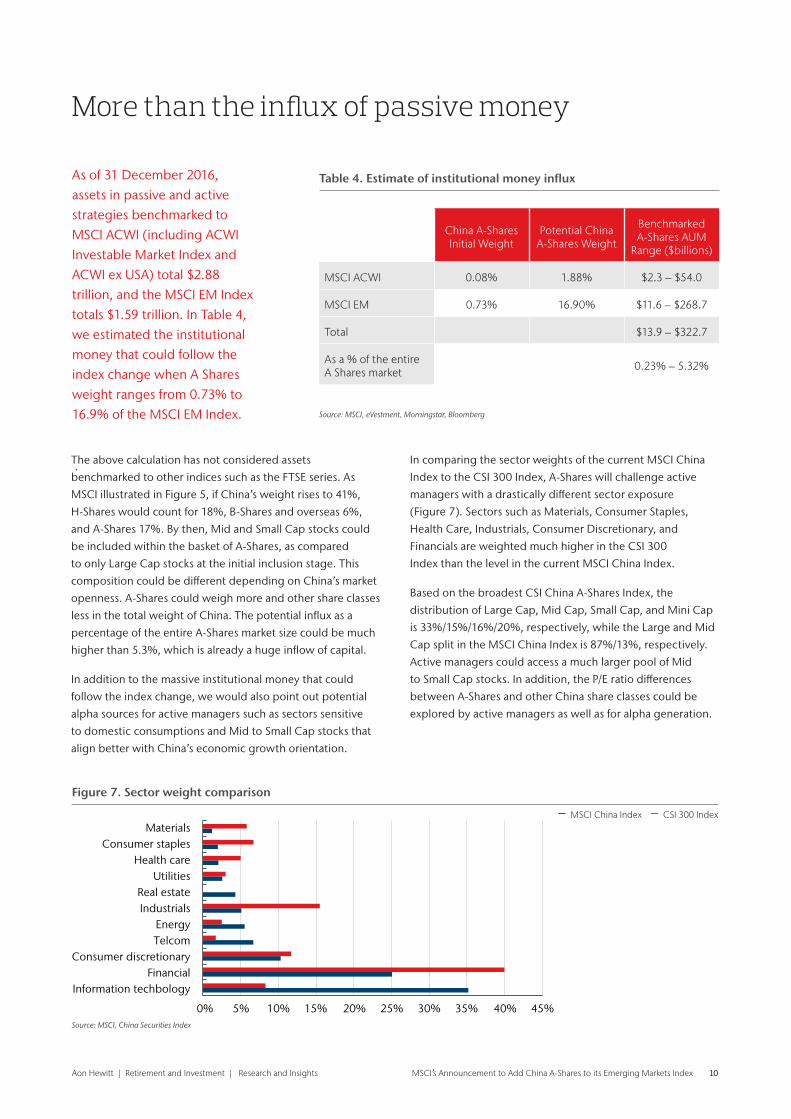
As of 31 December 2016, assets in passive and active strategies benchmarked to MSCI ACWI (including ACWI Investable Market Index and ACWI ex USA) total $2.88 trillion, and the MSCI EM Index totals $1.59 trillion. In Table 4, we estimated the institutional money that could follow the index change when A Shares weight ranges from 0.73% to 16.9% of the MSCI EM Index.
The above calculation has not considered assets
benchmarked to other indices such as the FTSE series. As
MSCI illustrated in Figure 5, if China’s weight rises to 41%,
H-Shares would count for 18%, B-Shares and overseas 6%,
and A-Shares 17%. By then, Mid and Small Cap stocks could
be included within the basket of A-Shares, as compared
to only Large Cap stocks at the initial inclusion stage. This
composition could be different depending on China’s market
openness. A-Shares could weigh more and other share classes
less in the total weight of China. The potential influx as a
percentage of the entire A-Shares market size could be much
higher than 5.3%, which is already a huge inflow of capital.
In addition to the massive institutional money that could
follow the index change, we would also point out potential
alpha sources for active managers such as sectors sensitive
to domestic consumptions and Mid to Small Cap stocks that
align better with China’s economic growth orientation.
In comparing the sector weights of the current MSCI China
Index to the CSI 300 Index, A-Shares will challenge active
managers with a drastically different sector exposure
(Figure 7). Sectors such as Materials, Consumer Staples,
Health Care, Industrials, Consumer Discretionary, and
Financials are weighted much higher in the CSI 300
Index than the level in the current MSCI China Index.
Based on the broadest CSI China A-Shares Index, the
distribution of Large Cap, Mid Cap, Small Cap, and Mini Cap
is 33%/15%/16%/20%, respectively, while the Large and Mid
Cap split in the MSCI China Index is 87%/13%, respectively.
Active managers could access a much larger pool of Mid
to Small Cap stocks. In addition, the P/E ratio differences
between A-Shares and other China share classes could be
explored by active managers as well as for alpha generation.
More than the influx of passive money
Table 4. Estimate of institutional money influx
Source: MSCI, eVestment, Morningstar, Bloomberg
China A-Shares Initial Weight
Potential China A-Shares Weight
Benchmarked A-Shares AUM
Range ($billions)
MSCI ACWI 0.08% 1.88% $2.3 – $54.0
MSCI EM 0.73% 16.90% $11.6 – $268.7
Total $13.9 – $322.7
As a % of the entire A Shares market 0.23% – 5.32%
Figure 7. Sector weight comparison
– MSCI China Index – CSI 300 Index
0%
Information techbologyFinancial
Consumer discretionaryTelcomEnergy
IndustrialsReal estate
UtilitiesHealth care
Consumer staplesMaterials
5% 10% 15% 20% 25% 30% 35% 40% 45%Source: MSCI, China Securities Index
Aon Hewitt | Retirement and Investment | Research and Insights MSCI’s Announcement to Add China A-Shares to its Emerging Markets Index 11
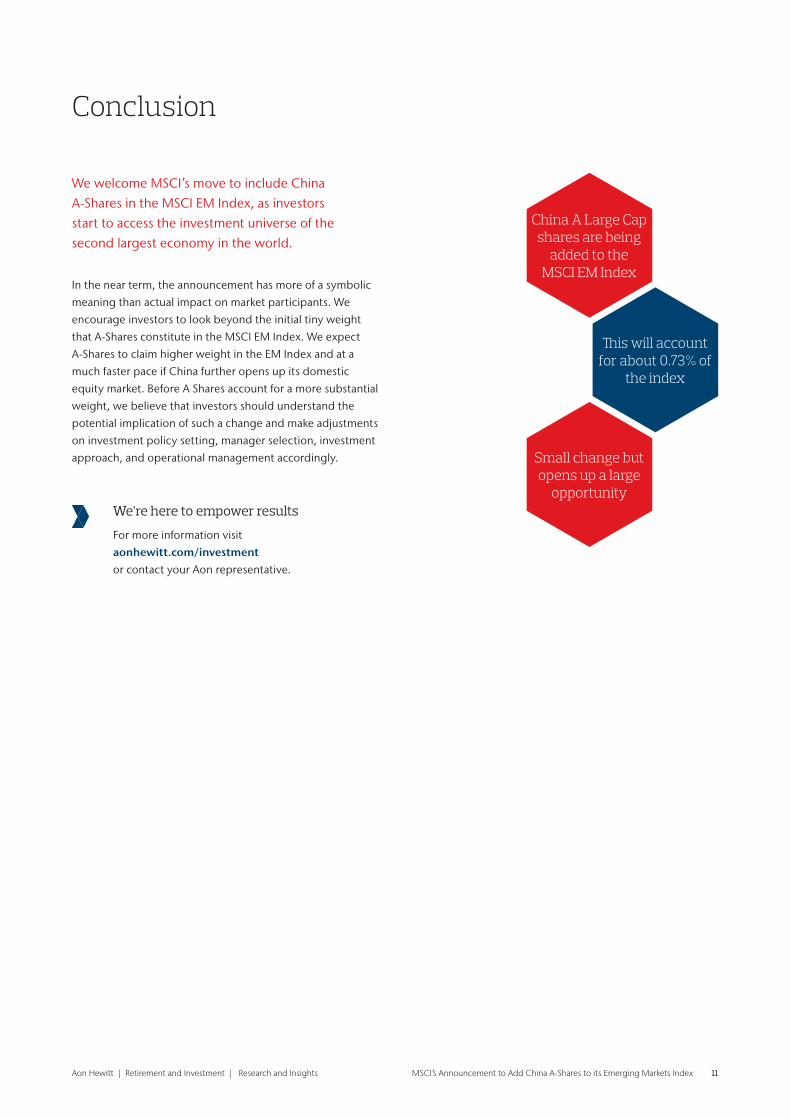
Conclusion
This will account for about 0.73% of
the index
China A Large Cap shares are being
added to the MSCI EM Index
Small change but opens up a large
opportunity
We welcome MSCI’s move to include China A-Shares in the MSCI EM Index, as investors start to access the investment universe of the second largest economy in the world.
In the near term, the announcement has more of a symbolic
meaning than actual impact on market participants. We
encourage investors to look beyond the initial tiny weight
that A-Shares constitute in the MSCI EM Index. We expect
A-Shares to claim higher weight in the EM Index and at a
much faster pace if China further opens up its domestic
equity market. Before A Shares account for a more substantial
weight, we believe that investors should understand the
potential implication of such a change and make adjustments
on investment policy setting, manager selection, investment
approach, and operational management accordingly.
We’re here to empower results
For more information visit
aonhewitt.com/investment or contact your Aon representative.
Aon Hewitt | Retirement and Investment | Research and Insights MSCI’s Announcement to Add China A-Shares to its Emerging Markets Index 12
Contacts
With thanks to our author
Fei Amy Shang, CFASenior Investment ConsultantInvestment Policy Services+1(312) 381 [email protected]
John BelgroveSenior [email protected]+44 (0)20 7086 9021
Kate Charsley [email protected]+44 (0)117 900 4414
Sion ColeSenior Partner and Head of Client [email protected]+44 (0)20 7086 9432Follow me on twitter – @PensionsSion
Tim [email protected]+44 (0)20 7086 0252 Follow me on Twitter @investmenttim
Tim GilesHead of UK Investment [email protected]+44 (0)20 7086 9115
Aon Hewitt empowers organisations and individuals to
secure a better future through innovative retirement,
health, and talent solutions. We advise and design a
wide range of solutions that enable our clients’ success.
Our teams of experts help clients navigate the risks and
opportunities to optimise financial security; redefine
health solutions for greater choice, affordability, and
wellbeing; and achieve sustainable growth by driving
business performance through people performance.
We serve more than 20,000 clients through our 15,000
professionals located in 50 countries around the world.
For more information, please visit aon.com
About Aon Hewitt
About Aon Aon plc (NYSE:AON) is a leading global professional
services firm providing a broad range of risk, retire-
ment and health solutions. Our 50,000 colleagues in
120 countries empower results for clients by using
proprietary data and analytics to deliver insights that
reduce volatility and improve performance.
For further information on our capabilities and to
learn how we empower results for clients, please visit
http://aon.mediaroom.com.
© Aon plc 2017. All rights reserved.This document and any enclosures or attachments are prepared on
the understanding that it is solely for the benefit of the addressee(s).
Unless we provide express prior written consent, no part of this
document should be reproduced, distributed or communicated to
anyone else and, in providing this document, we do not accept or
assume any responsibility for any other purpose or to anyone other
than the addressee(s) of this document.
Notwithstanding the level of skill and care used in conducting due
diligence into any organisation that is the subject of a rating in this
document, it is not always possible to detect the negligence, fraud,
or other misconduct of the organisation being assessed or any
weaknesses in that organisation’s systems and controls or operations.
This document and any due diligence conducted is based upon
information available to us at the date of this document and takes no
account of subsequent developments. In preparing this document we
may have relied upon data supplied to us by third parties (including
those that are the subject of due diligence) and therefore no warranty
or guarantee of accuracy or completeness is provided. We cannot
be held accountable for any error, omission or misrepresentation of
any data provided to us by third parties (including those that are the
subject of due diligence). This document is not intended by us to
form a basis of any decision by any third party to do or omit to do
anything.
Any opinions or assumptions in this document have been derived
by us through a blend of economic theory, historical analysis and/or
other sources. Any opinion or assumption may contain elements of
subjective judgement and are not intended to imply, nor should be
interpreted as conveying, any form of guarantee or assurance by us of
any future performance. Views are derived from our research process
and it should be noted in particular that we can not research legal,
regulatory, administrative or accounting procedures and accordingly
make no warranty and accept no responsibility for consequences
arising from relying on this document in this regard.
Calculations may be derived from our proprietary models in use at
that time. Models may be based on historical analysis of data and
other methodologies and we may have incorporated their subjective
judgement to complement such data as is available. It should be
noted that models may change over time and they should not be
relied upon to capture future uncertainty or events.
Aon Hewitt Limited is authorised and regulated by the
Financial Conduct Authority. Registered in England & Wales.
Registered No: 4396810.
Registered Office:
The Aon Centre
The Leadenhall Building
122 Leadenhall Street
London EC3V 4AN
Copyright © 2017 Aon plc
aon.com