aops, biological networks, and data analysis · aops, biological networks, and data analysis ed...
TRANSCRIPT
AOPs, biological networks, and data analysis
Ed Perkins, Ph.D., US Army Senior Scientist (ST) Environmental networks and toxicology US Army Engineer Research and Development Center Vicksburg, MS 39180
• Bridging biological networks and AOPs • Using Omics data with AOPs
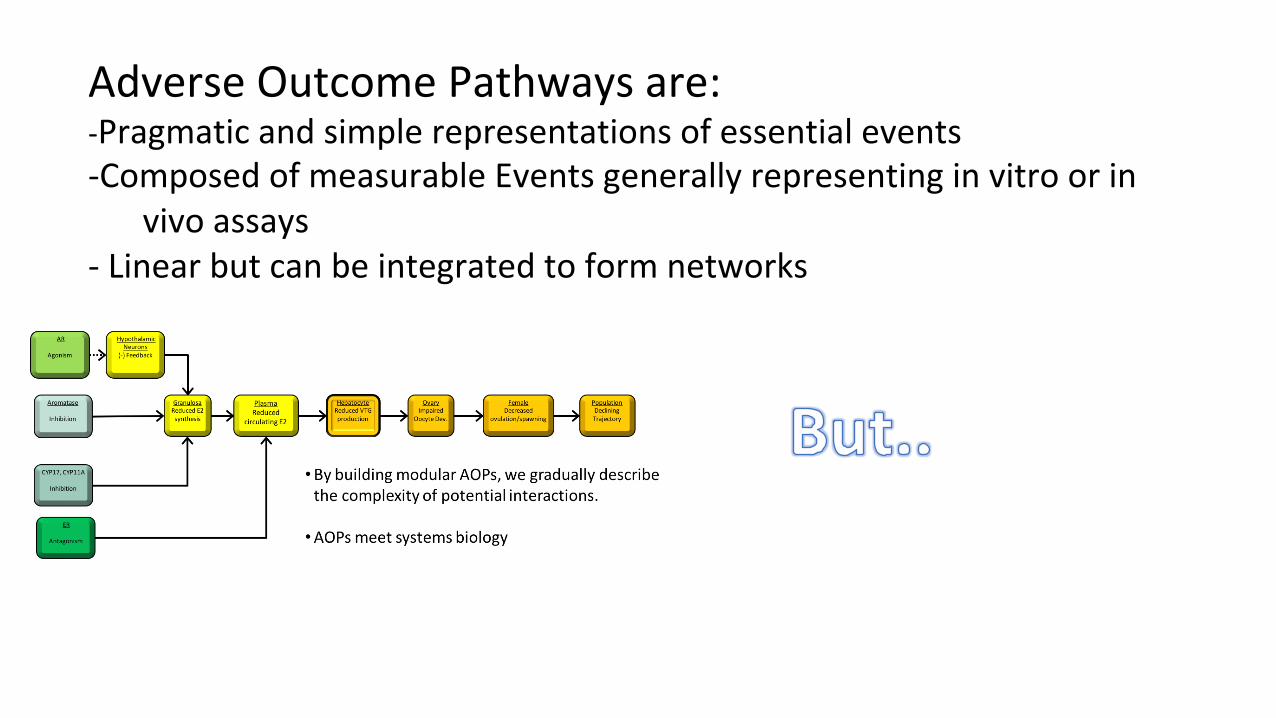
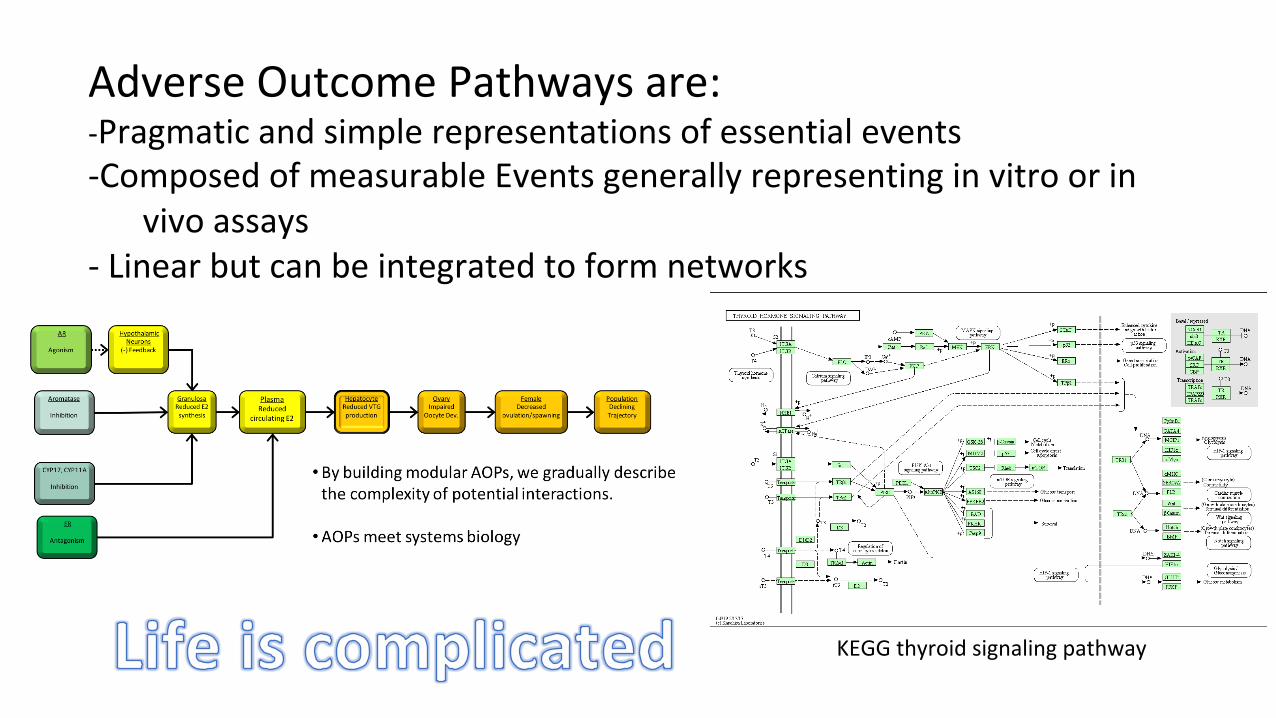
Adverse Outcome Pathways are: -Pragmatic and simple representations of essential events -Composed of measurable Events generally representing in vitro or in
vivo assays - Linear but can be integrated to form networks
Adverse Outcome Pathways are: -Pragmatic and simple representations of essential events -Composed of measurable Events generally representing in vitro or in
vivo assays - Linear but can be integrated to form networks
KEGG thyroid signaling pathway
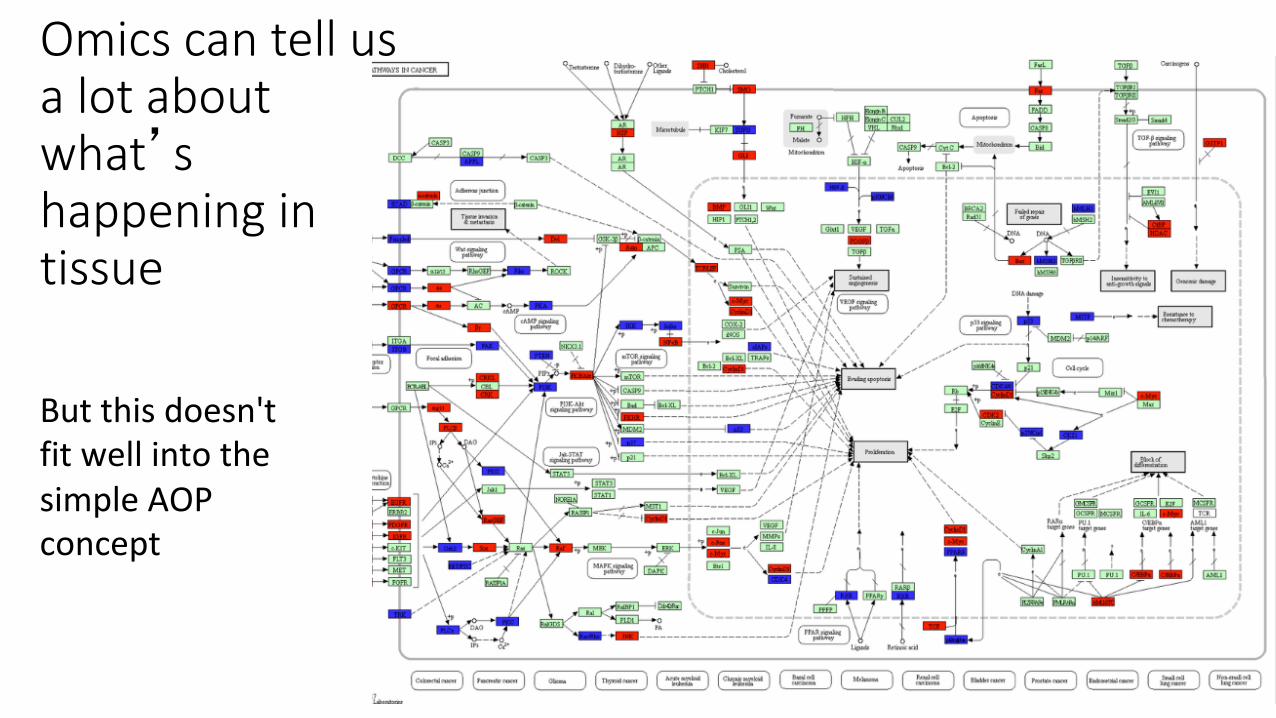
Omics can tell us a lot about what’s happening in tissue
But this doesn't fit well into the simple AOP concept
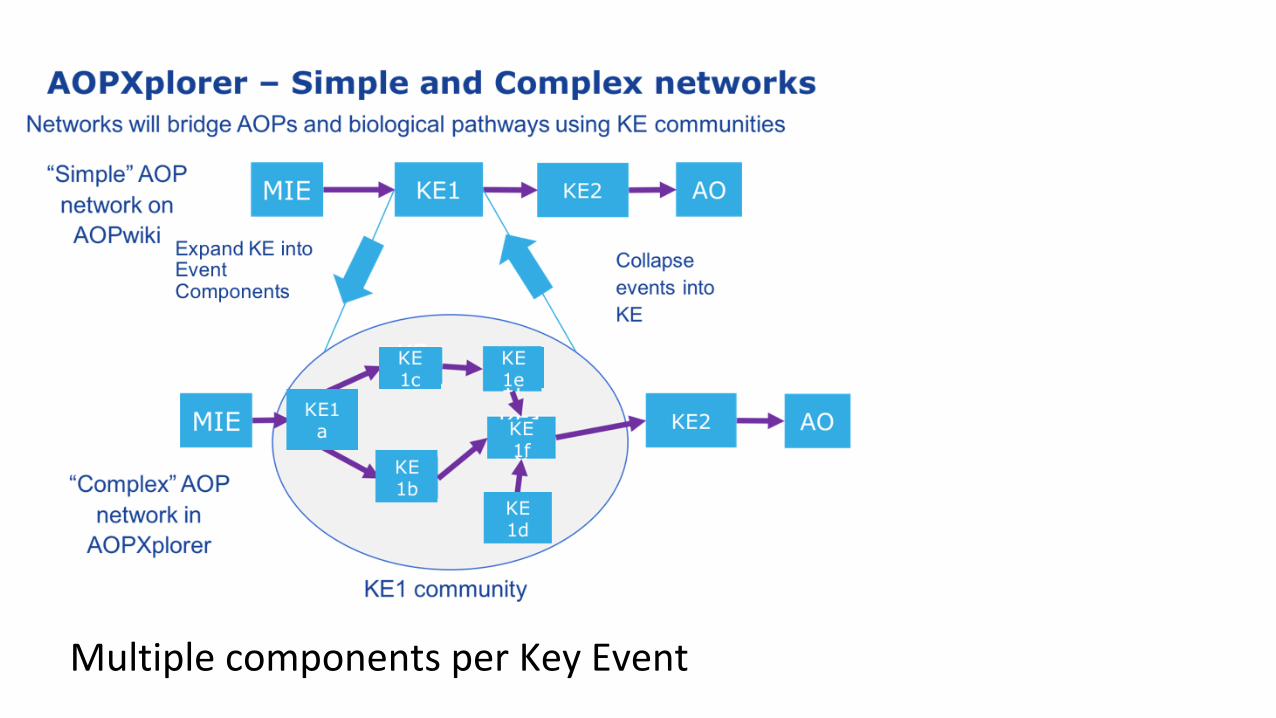
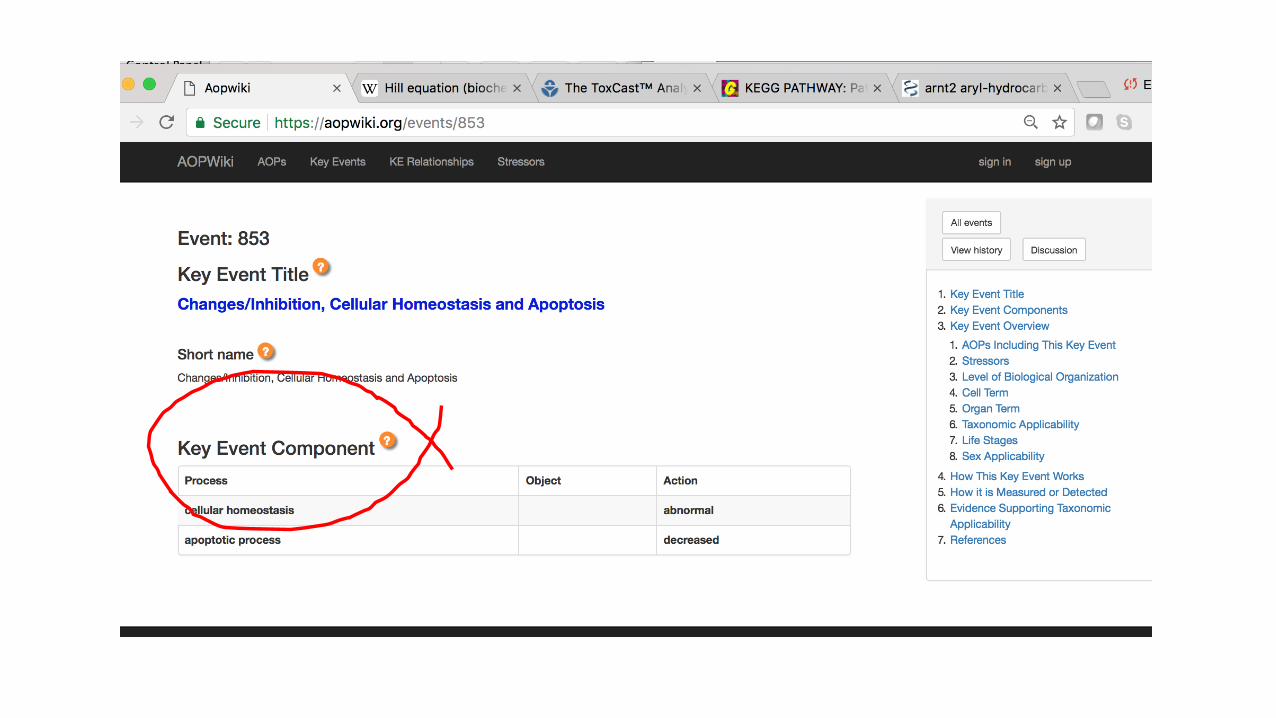
Multiple components per Key Event
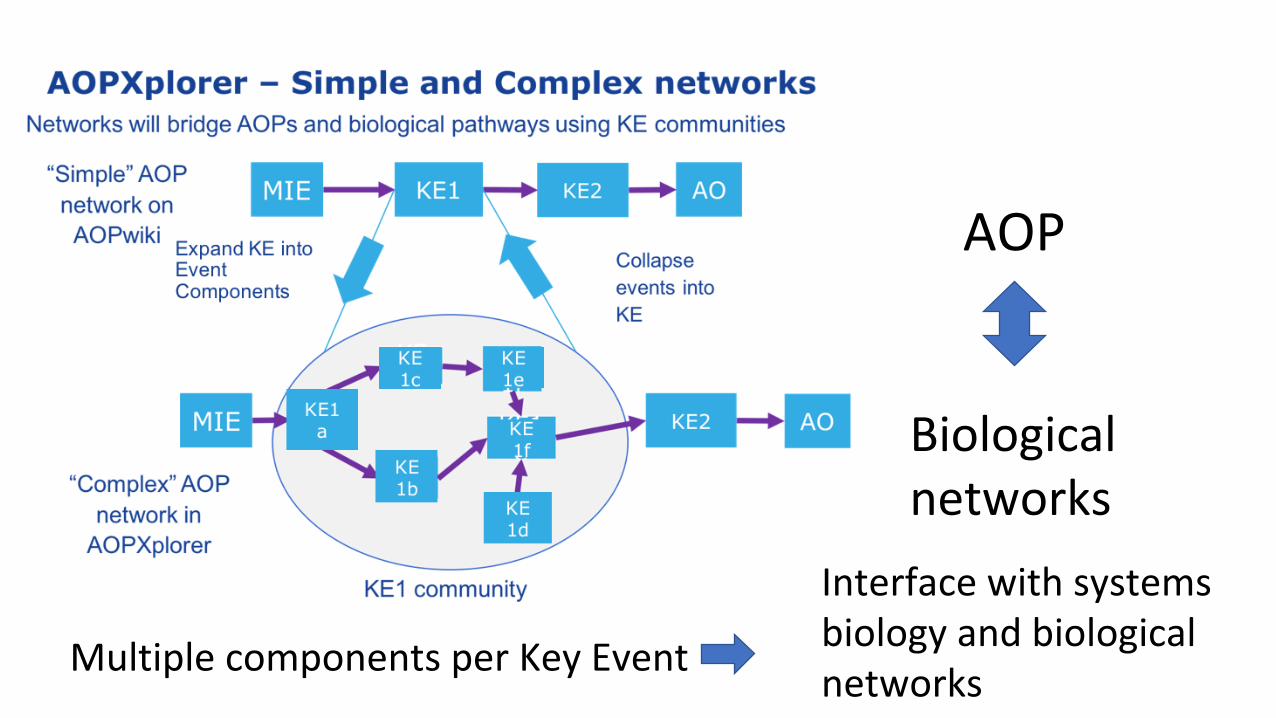
Biological networks
Interface with systems biology and biological Multiple components per Key Event networks
AOP
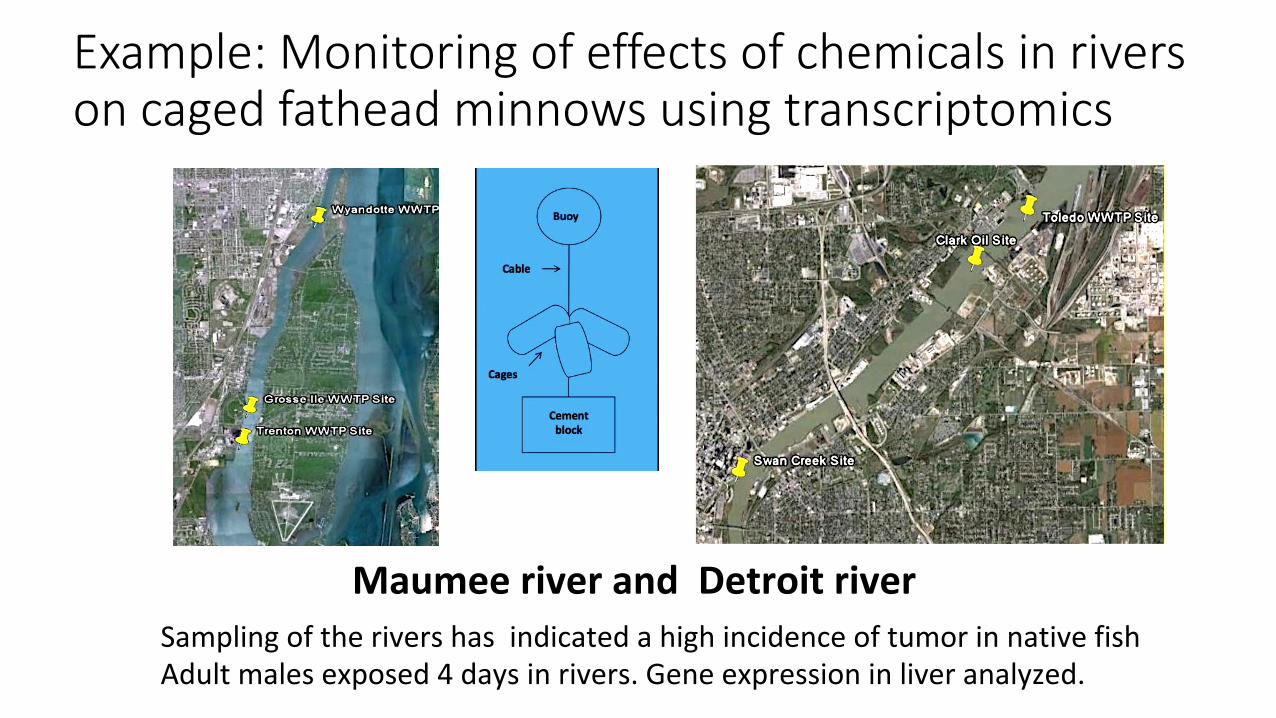
Example: Monitoring of effects of chemicals in rivers on caged fathead minnows using transcriptomics
Maumee river and Detroit river Sampling of the rivers has indicated a high incidence of tumor in native fish Adult males exposed 4 days in rivers. Gene expression in liver analyzed.
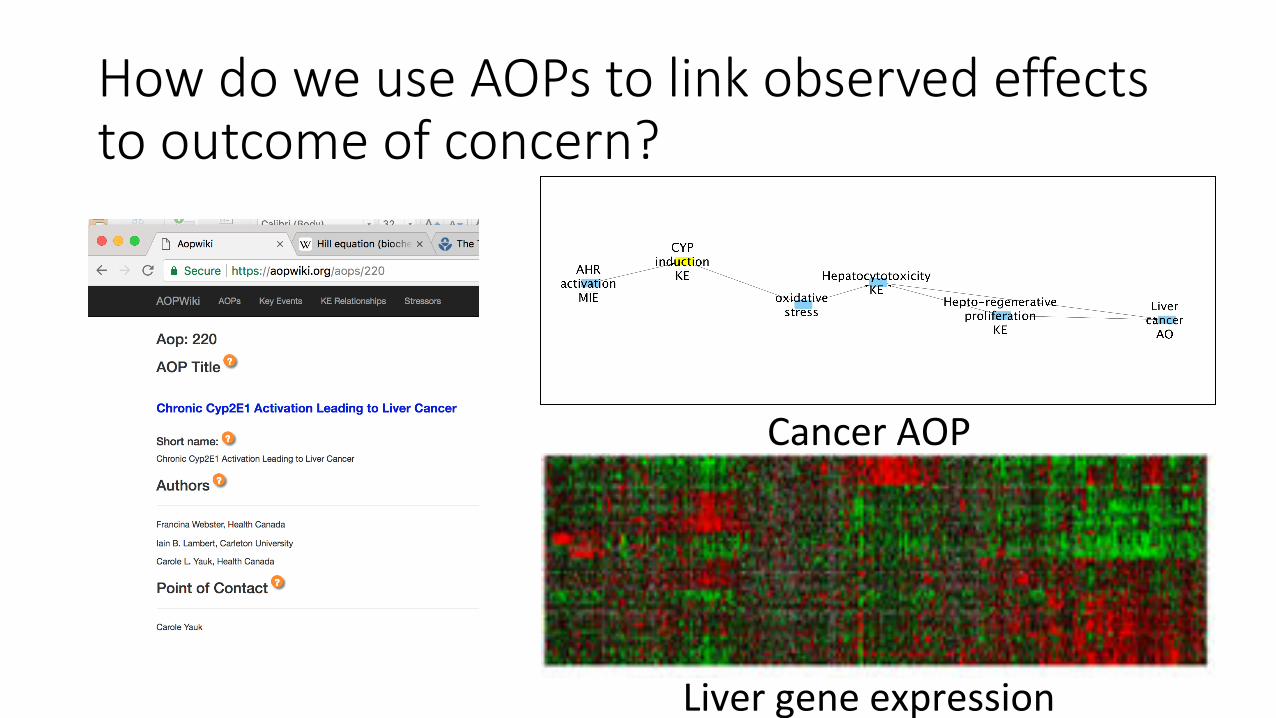
How do we use AOPs to link observed effects to outcome of concern?
Cancer AOP
Liver gene expression
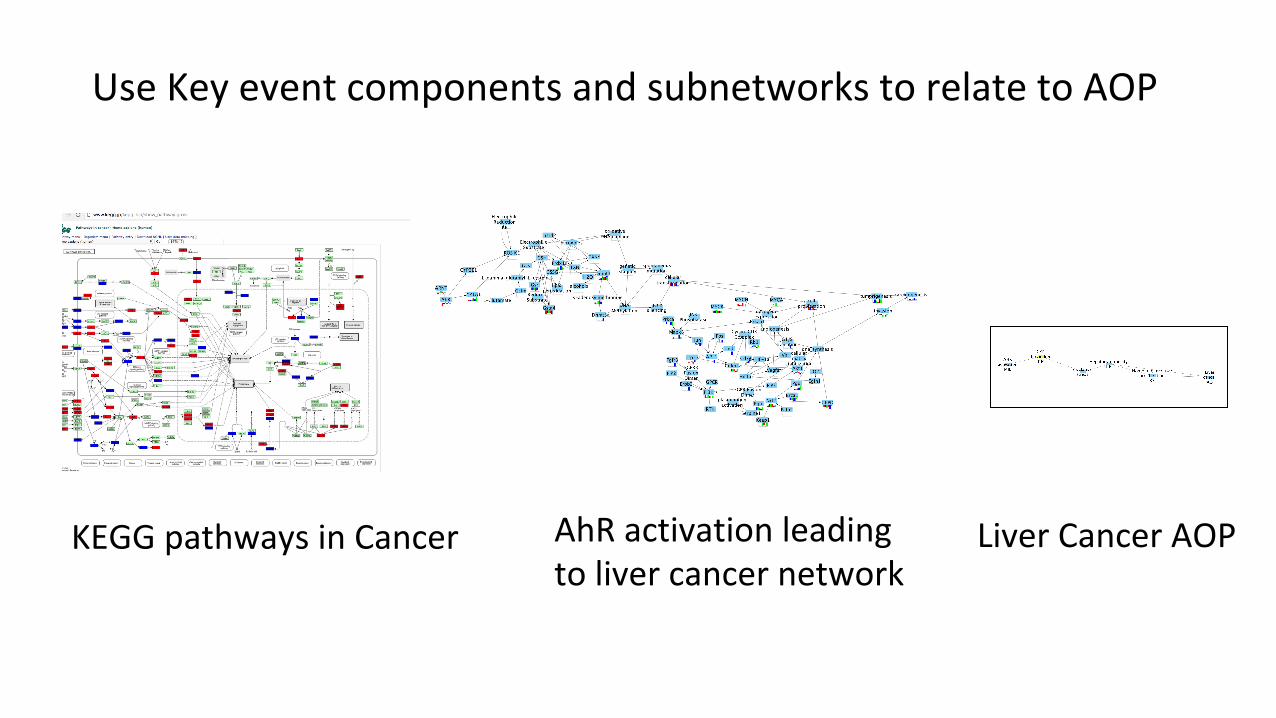
Use Key event components and subnetworks to relate to AOP
KEGG pathways in Cancer AhR activation leading Liver Cancer AOP to liver cancer network
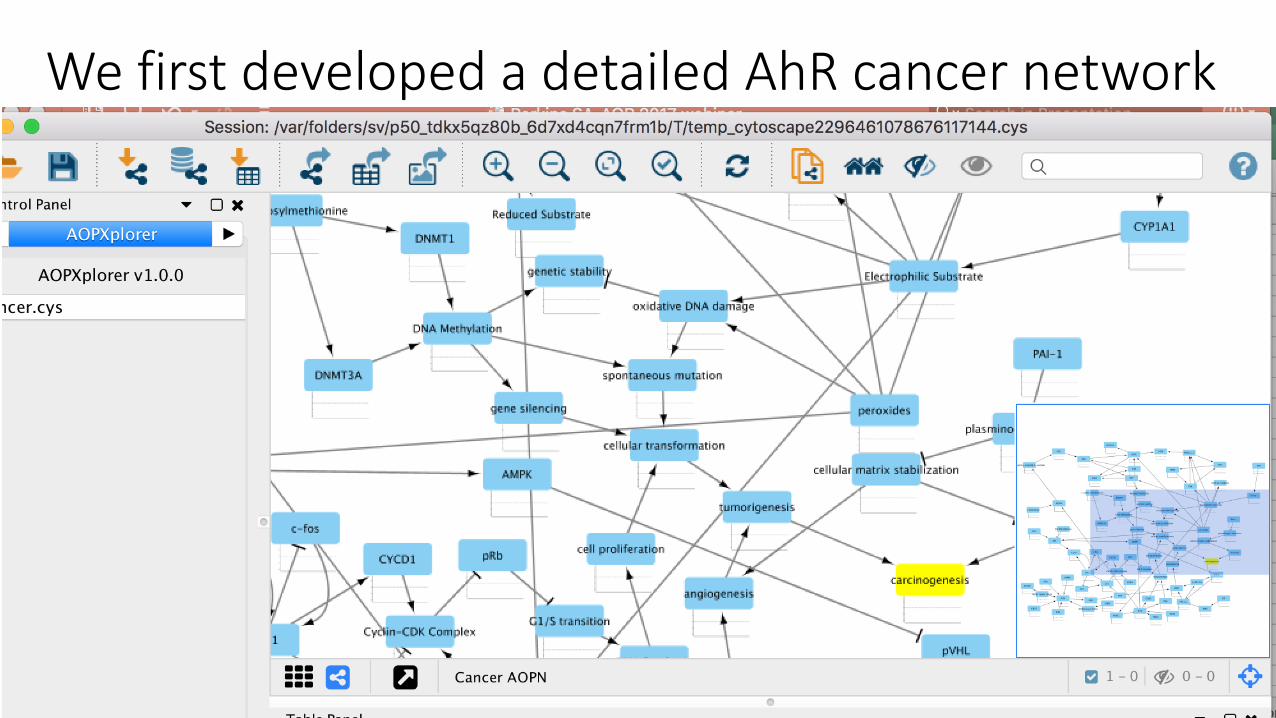
We first developed a detailed AhR cancer network
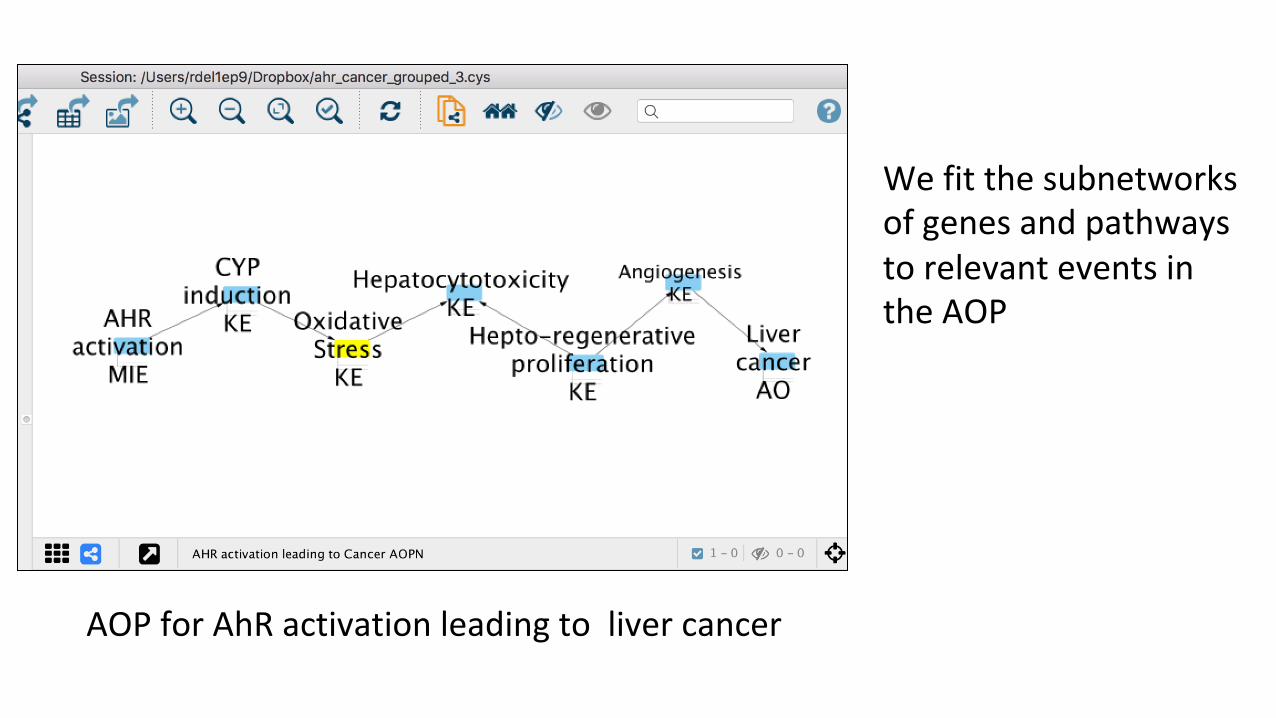
We fit the subnetworks of genes and pathways to relevant events in the AOP
AOP for AhR activation leading to liver cancer
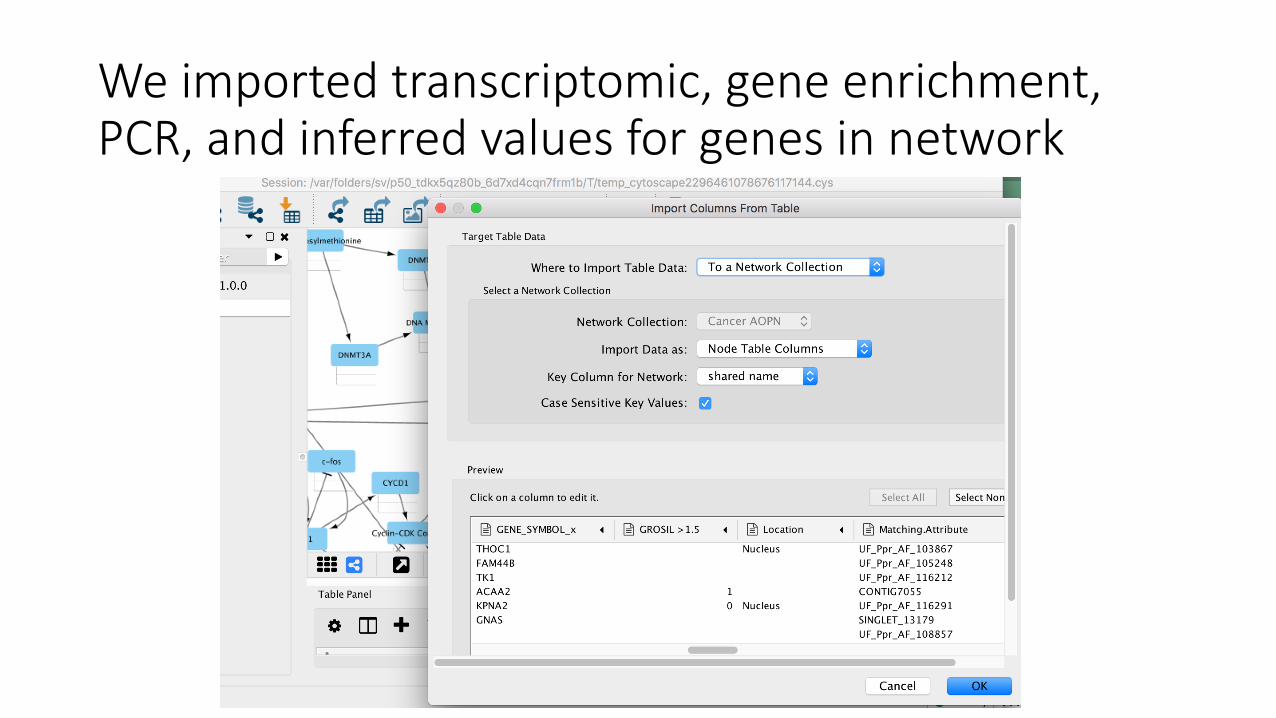
We imported transcriptomic, gene enrichment, PCR, and inferred values for genes in network
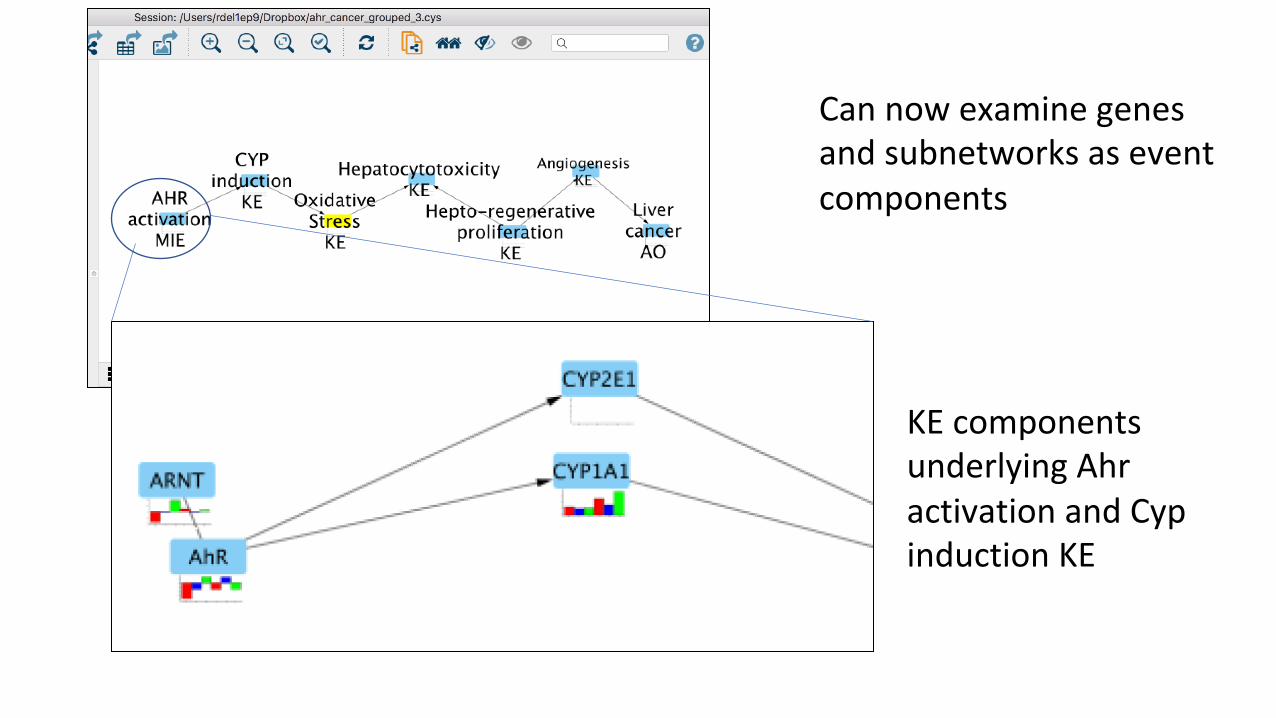
Can now examine genes and subnetworks as event components
KE components underlying Ahr activation and Cyp induction KE
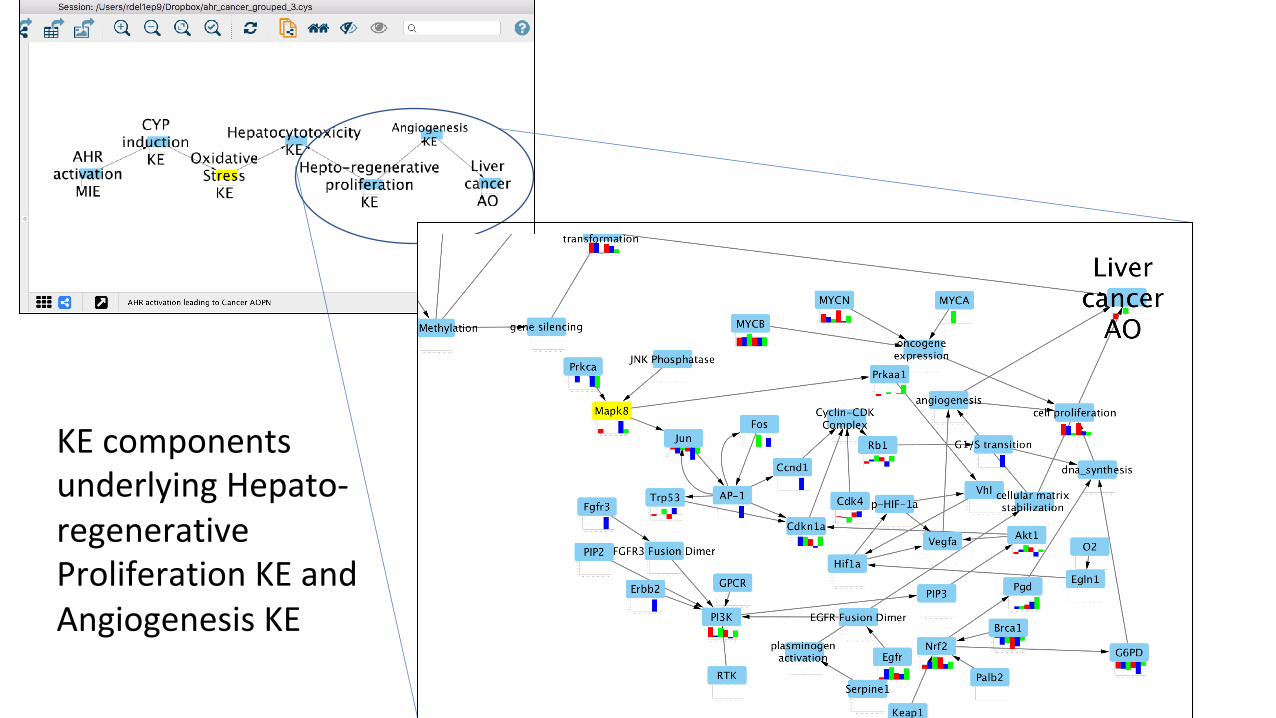
KE components underlying Hepato-regenerative Proliferation KE and Angiogenesis KE
IPA Enrichment z-score IPA Enrichment z-score
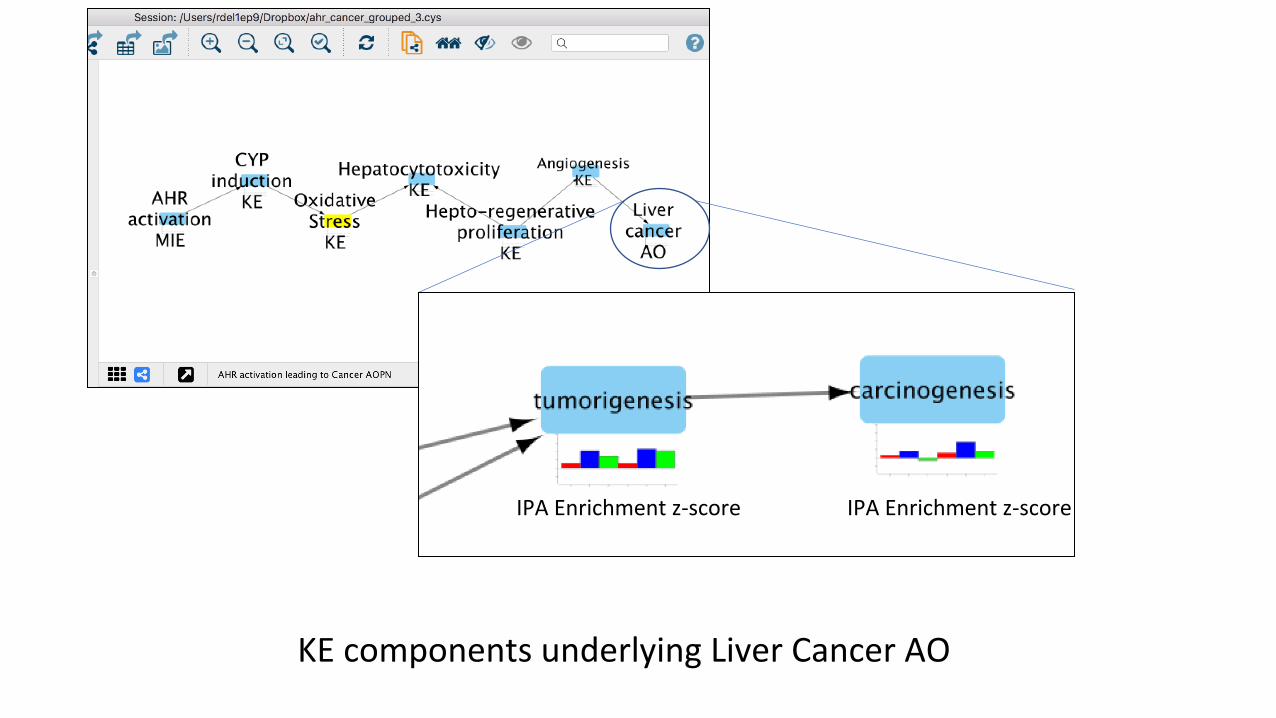
KE components underlying Liver Cancer AO
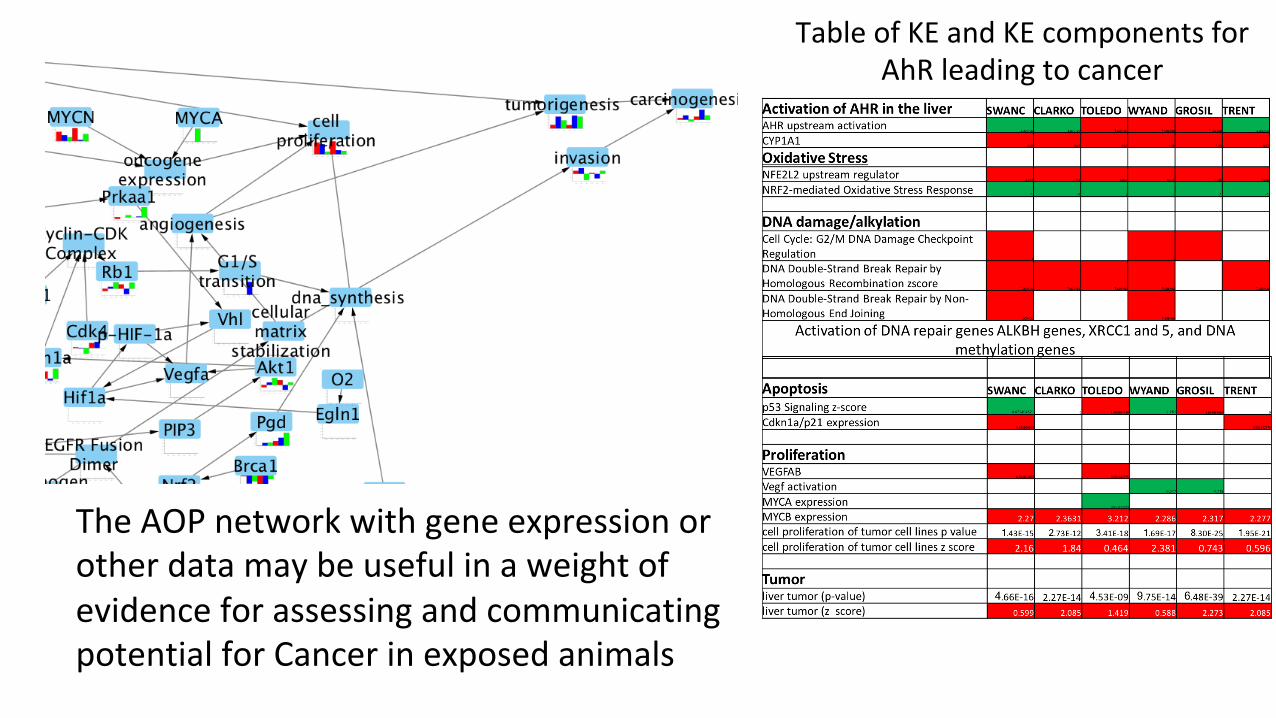
Table of KE and KE components for AhR leading to cancer
The AOP network with gene expression or other data may be useful in a weight of evidence for assessing and communicating potential for Cancer in exposed animals
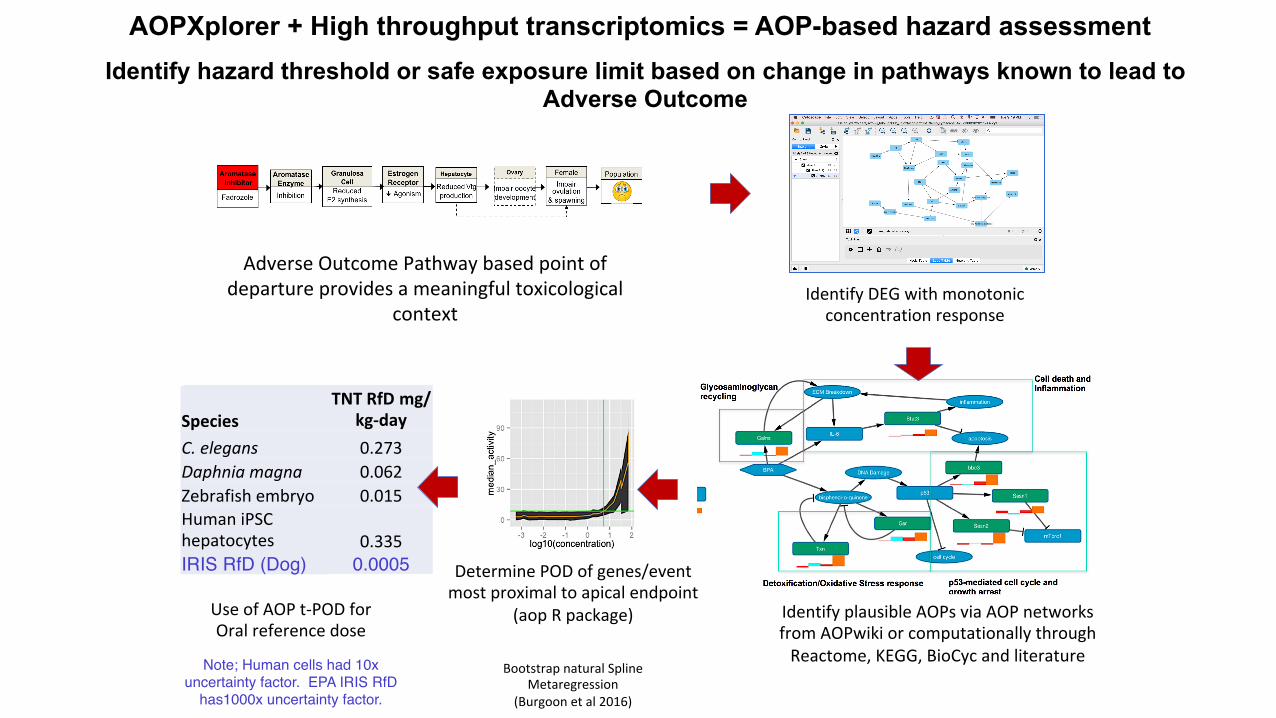
AOPXplorer + High throughput transcriptomics = AOP-based hazard assessment Identify hazard threshold or safe exposure limit based on change in pathways known to lead to
Adverse Outcome
Identify DEG with monotonic concentration response
Adverse Outcome Pathway based point of departure provides a meaningful toxicological
context
Species C. elegans Daphnia magna Zebrafish embryo
TNT RfD mg/ kg-day
0.273 0.062 0.015
Human iPSC
IRIS RfD (Dog) hepatocytes 0.335
0.0005
Use of AOP t-POD for Oral reference dose
Determine POD of genes/event most proximal to apical endpoint
(aop R package) Identify plausible AOPs via AOP networks from AOPwiki or computationally through Reactome, KEGG, BioCyc and literature Note; Human cells had 10x Bootstrap natural Spline
uncertainty factor. EPA IRIS RfD Metaregression has1000x uncertainty factor. (Burgoon et al 2016)

Quantitative approaches for AOPs
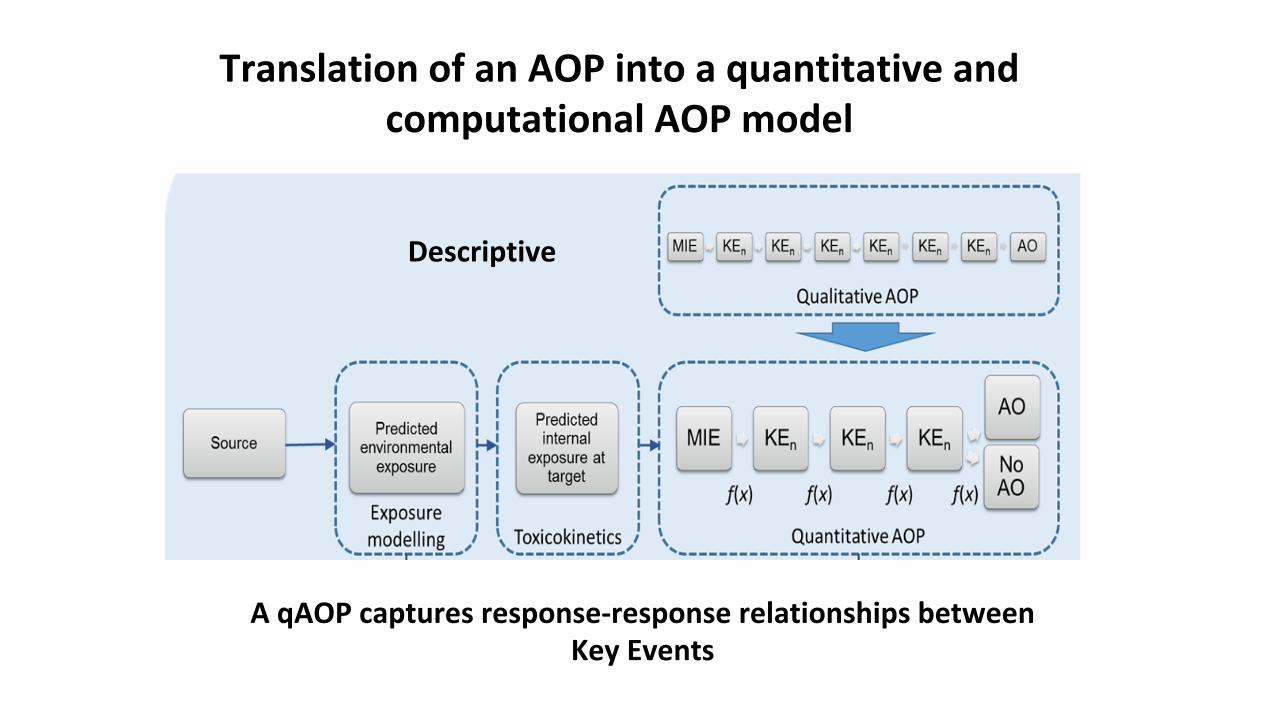
Translation of an AOP into a quantitative and computational AOP model
Descriptive
A qAOP captures response-response relationships between KeyEvents
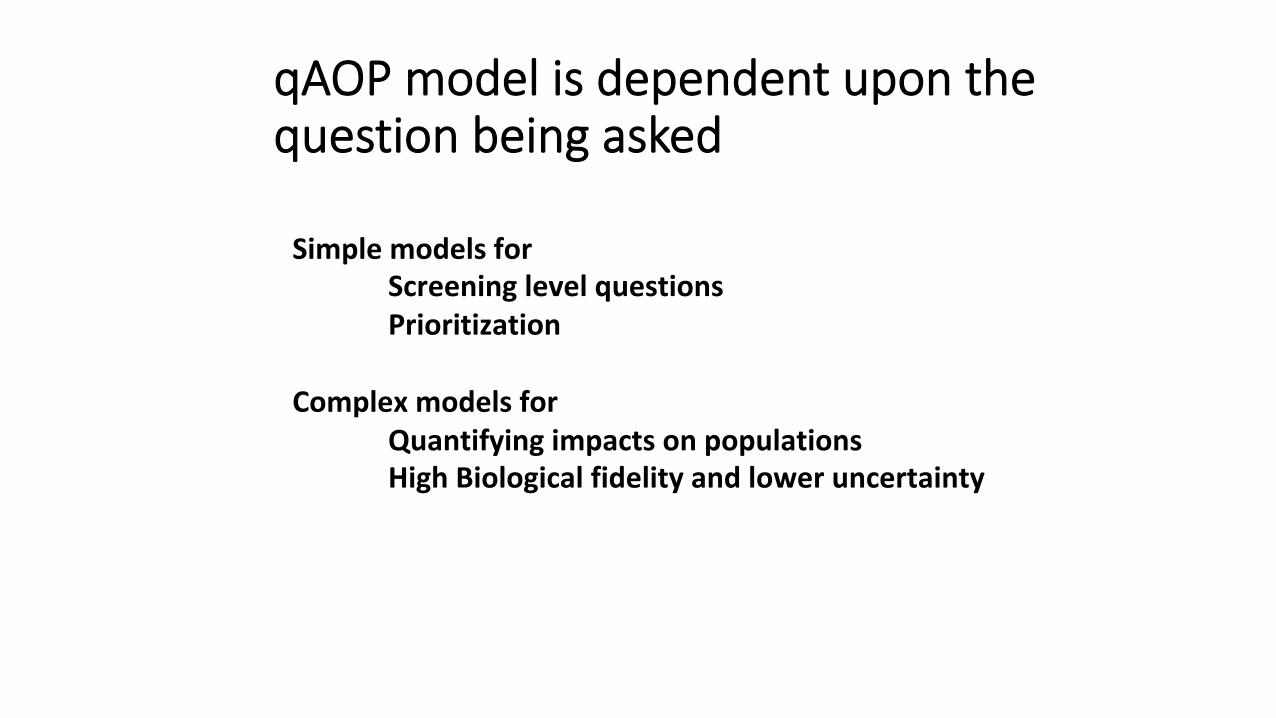
qAOP model is dependent upon the question being asked
Simple modelsfor Screeninglevelquestions Prioritization
Complexmodelsfor Quantifying impacts on populations HighBiologicalfidelityandlower uncertainty
1 2 3 4 5
1 2 3 4 5
1 2 3 4 5
b
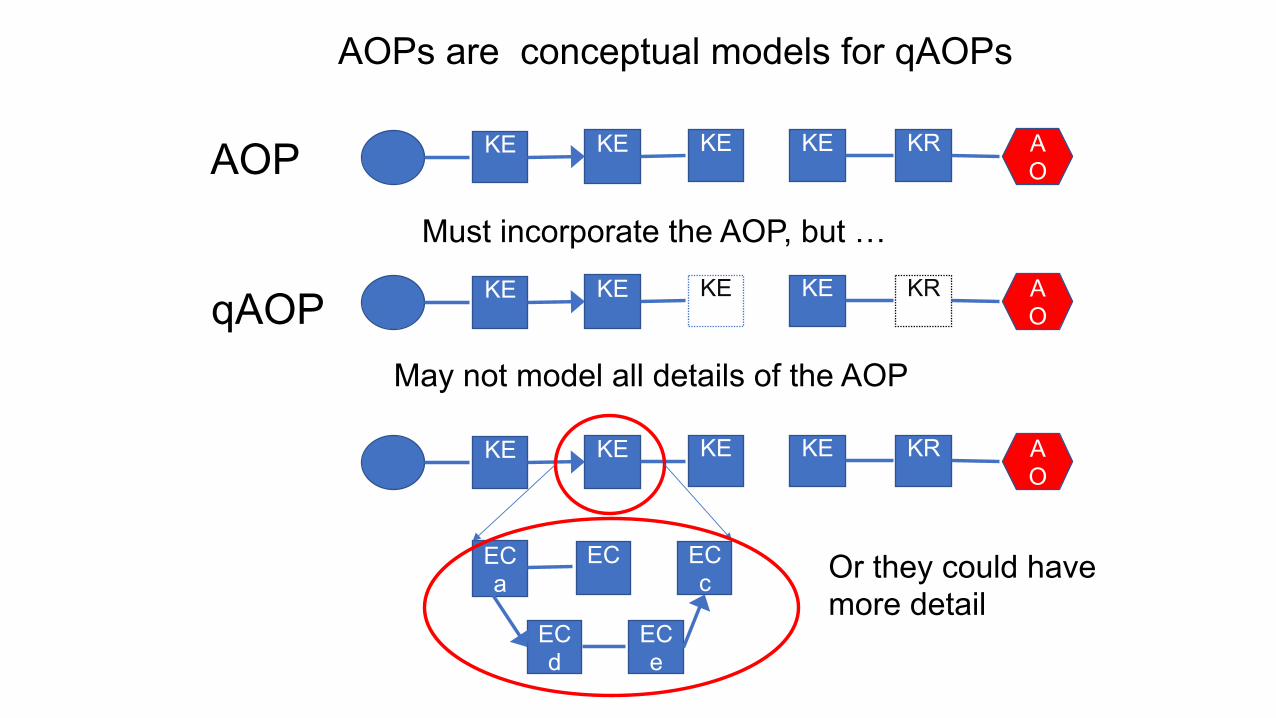
AOPs are conceptual models for qAOPs
AOP
qAOP
KE KE KE KE KR A O
KE KE KE KE KR A O
KE KE KE KE KR A O
EC a
EC EC c
EC d
EC e
May not model all details of the AOP
Or they could have more detail
Must incorporate the AOP, but …
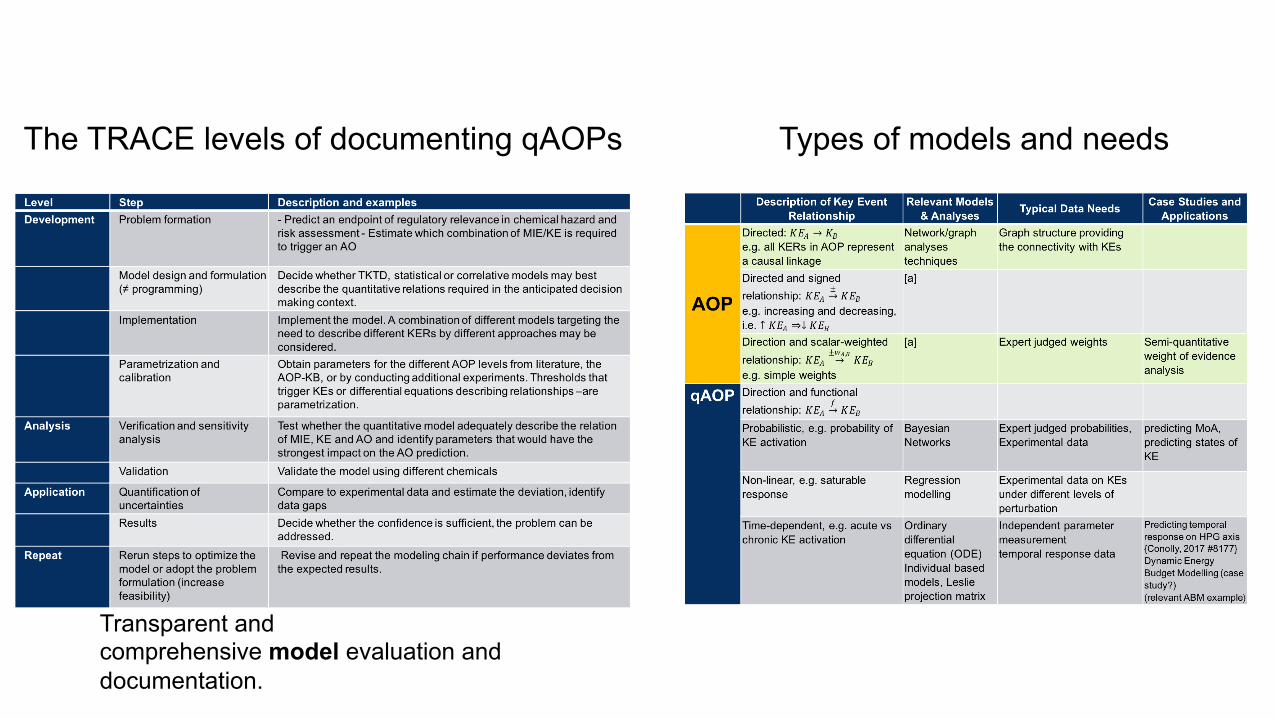
The TRACE levels of documenting qAOPs Types of models and needs
Transparent and comprehensive model evaluation and documentation.
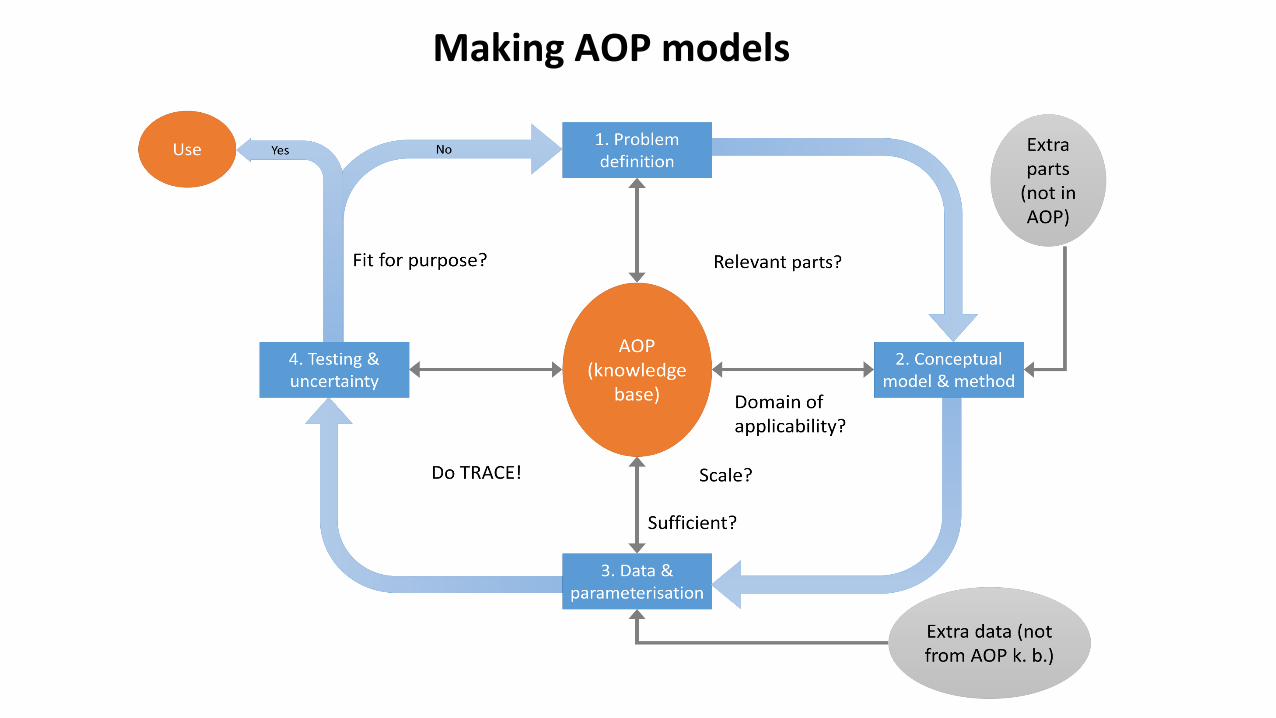
Making AOP models
Application of qAOP models
NFE2/Nrf2
LRH-1 FXR SHP
PPAR-alpha
LXR FAS PPAR-gamma
HSD17b4 FA beta oxidation Cytosolic
FA
Stea-tosis
Lipo-genesis
mTORC-1 LFAB-P
AKT aPKC
PI3K
SREBP-1 SCD1
mTORC-2
Insulin receptor
+ - + |95 5 - | 5 95
+ - + | 5 95 - | 95 5
+ - + |95 5 - | 5 95
+ - + |95 5 - | 5 95
+ - + |95 5 - | 5 95
+ - + |95 5 - | 5 95
+ - + | 5 95 - | 95 5
+ - + |99 1 - | 1 99
Lipo & LFAB-P ++ -+ +- -- + |99 99 99 1 - | 1 1 1 99
FXR & SHP & LXR +++ -++ +-+ --+ ++- -+- +-- --- + | 50 50 50 1 99 50 50 1 - | 50 50 50 99 1 50 50 99
CytoFA & Fab-ox. ++ -+ +- -- + | 1 1 99 99 - | 99 99 1 1
AKT + PI3K ++ +- -+ -- + |95 5 50 5 - | 5 5 50 95
+ - + |99 1 - | 1 99
+ - + |100 0 - | 0 100
LRH-1 & LXR & PPAR-g +++ -++ +-+ --+ ++- -+- +-- --- FAS + | 95 75 75 50 75 50 50 1 FAS - | 5 25 25 50 25 50 50 99
mTORC1 & aPKC ++ -+ +- -- + |95 5 95 5 - | 5 95 5 95
+ - + |95 5 - | 5 95
+ - + |95 5 - | 5 95
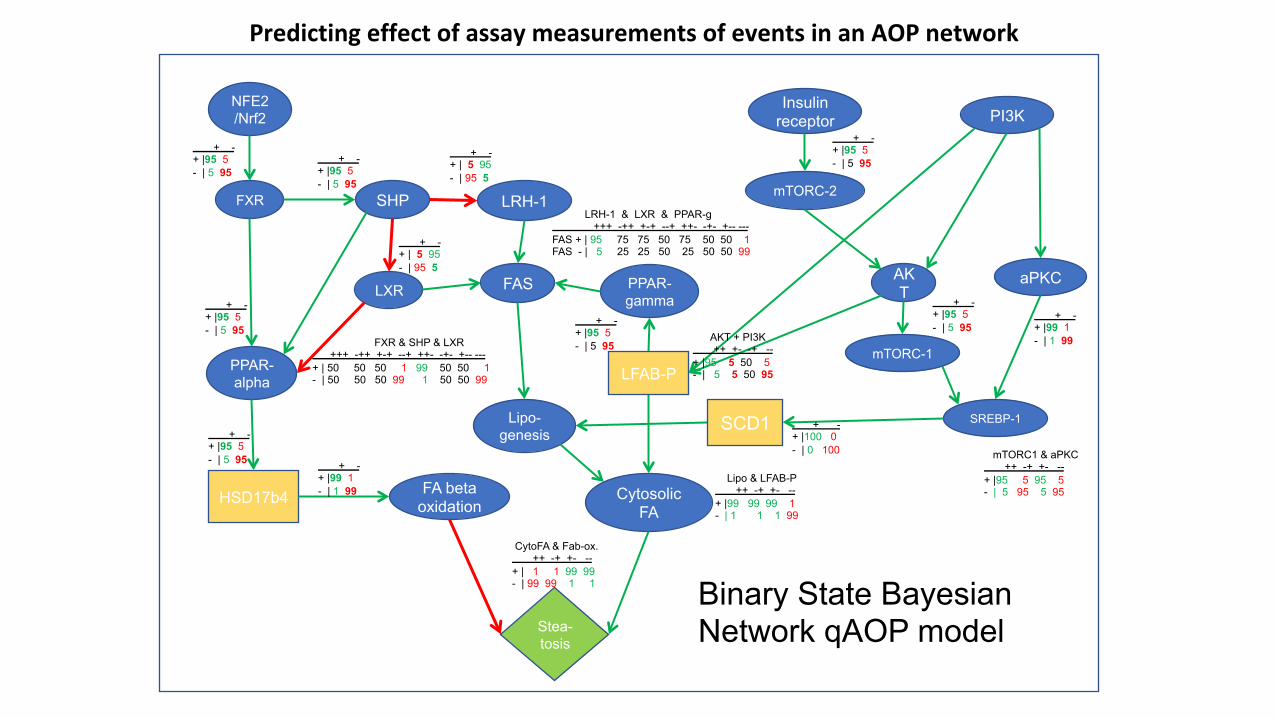
Binary State Bayesian Network qAOP model
PredictingeffectofassaymeasurementsofeventsinanAOPnetwork
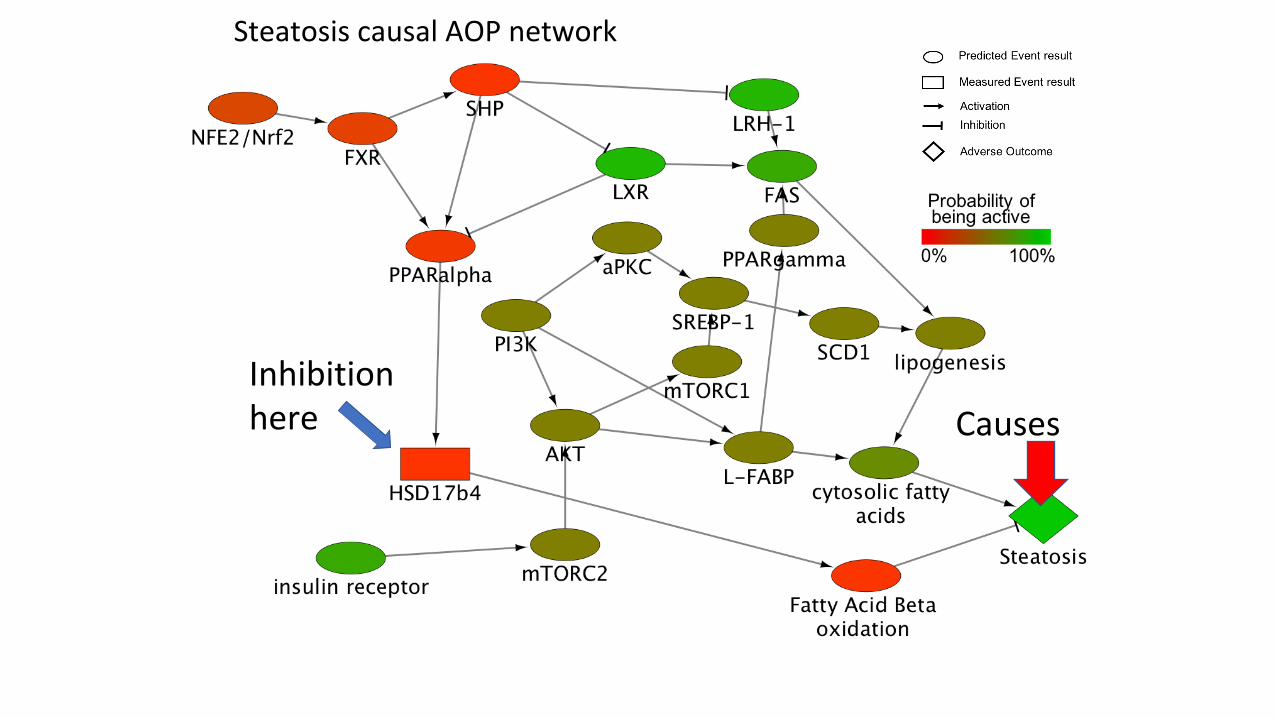
SteatosiscausalAOPnetwork
Inhibitionhere Causes
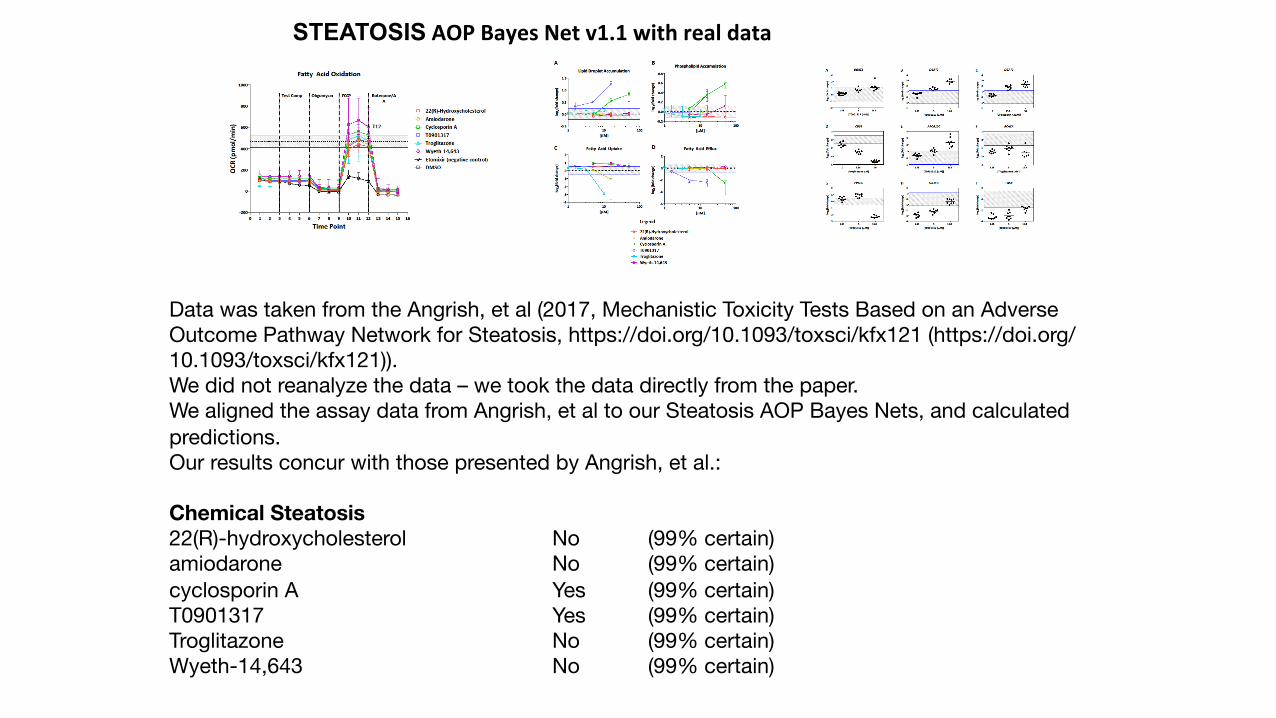
Data was taken from the Angrish, et al (2017, Mechanistic Toxicity Tests Based on an Adverse Outcome Pathway Network for Steatosis, https://doi.org/10.1093/toxsci/kfx121 (https://doi.org/10.1093/toxsci/kfx121)). We did not reanalyze the data – we took the data directly from the paper. We aligned the assay data from Angrish, et al to our Steatosis AOP Bayes Nets, and calculated predictions. Our results concur with those presented by Angrish, et al.: Chemical Steatosis 22(R)-hydroxycholesterol No (99% certain) amiodarone No (99% certain) cyclosporin A Yes (99% certain) T0901317 Yes (99% certain) Troglitazone No (99% certain) Wyeth-14,643 No (99% certain)
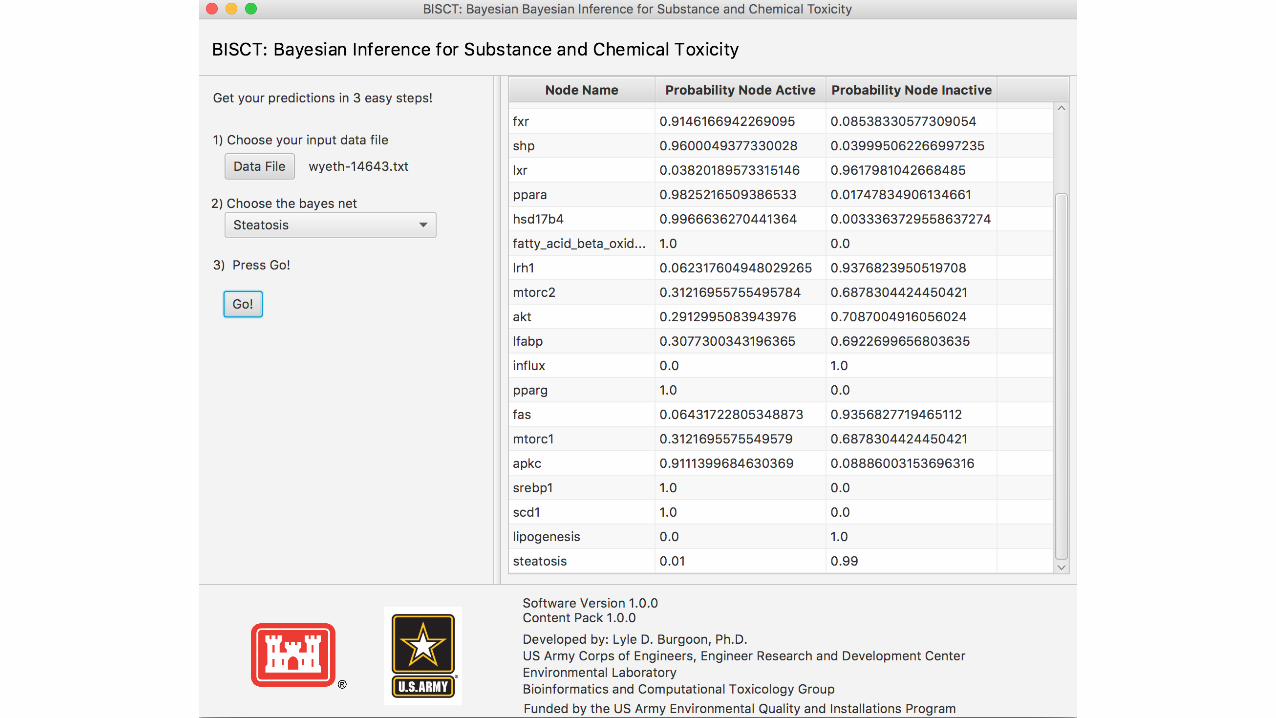
STEATOSISAOPBayesNetv1.1withrealdata
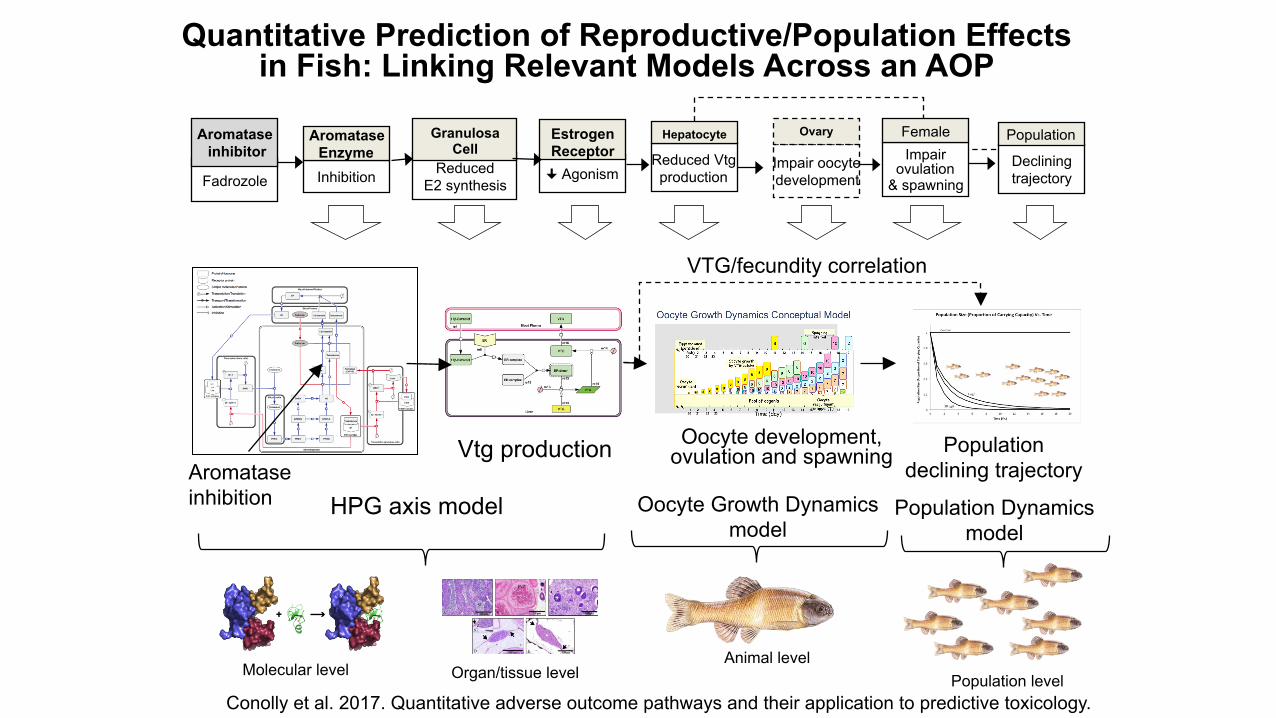
Quantitative Prediction of Reproductive/Population Effects in Fish: Linking Relevant Models Across an AOP
Animal level Organ/tissue level
Vtg production Oocyte development, ovulation and spawning
Aromatase inhibition
Population declining trajectory
Population level
VTG/fecundity correlation
Fadrozole Inhibition • Agonism
Estrogen Receptor Reduced Vtg
production
Hepatocyte
Impair oocyte development
Ovary
Impair ovulation
& spawning
Female
Declining trajectory
Population Aromatase Enzyme
Reduced E2 synthesis
Granulosa Cell
Aromatase inhibitor
HPG axis model
Molecular level
Oocyte Growth Dynamics model
Population Dynamics model
Conolly et al. 2017. Quantitative adverse outcome pathways and their application to predictive toxicology.
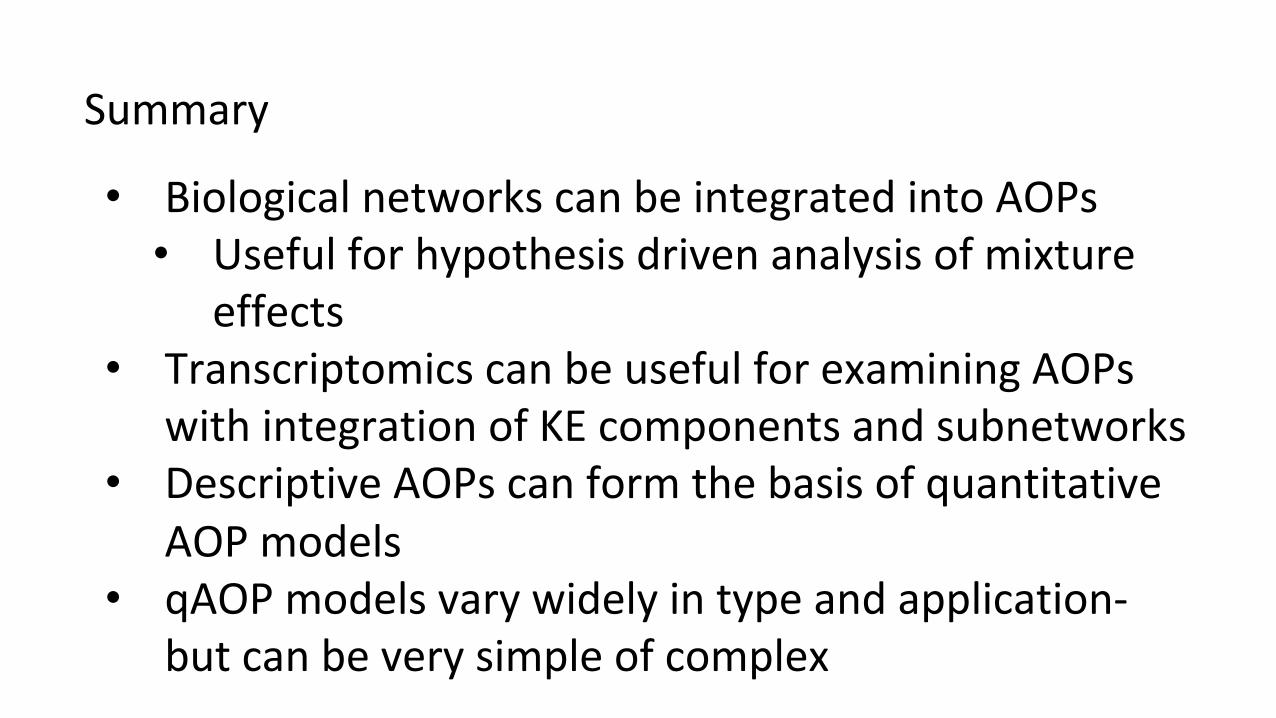
Summary
• BiologicalnetworkscanbeintegratedintoAOPs• Usefulforhypothesisdrivenanalysisofmixture
effects• TranscriptomicscanbeusefulforexaminingAOPs
withintegrationofKEcomponentsandsubnetworks• DescriptiveAOPscanformthebasisofquantitative
AOPmodels• qAOPmodelsvarywidelyintypeandapplication-
butcanbeverysimpleofcomplex
Thanks!
EPA – ORD • Gary Ankley • Brett Blackwell • Jenna Cavallin • Tim Collette • John Davis • Keith Houck • Kathy Jensen • Mike Kahl
USACE ERDC • Natalia Garcia-Reyero
• Lyle Burgoon
• Carlie LaLone • David Miller • Marc Mills • Jonathan Mosley • Shibin Li • Quincy Teng • Joe Tietge • Dan Villeneuve • Huajun Zhen
Caged fish studies
Lyle Burgoon, Stefan Scholz, Roman Ashauer, Rory Conolly, Brigitte Landesmann, Cameron Mackay, Cheryl Murphy, Nathan Pollesch, James R. Wheeler, and Anze Zupanic
AOP modeling
AOPXplorerandnetworksareavailableasaCytoscapeappfromwithinCytoscape.SeeLyleBurgoon([email protected])