ap-42 fish processing i final report - us epa · fish processing final report for u.s ... fish oil...
TRANSCRIPT

I MRI@ REPORT I I I I I' I I I I I I I I 1 I I
Emission Factor Documentation for AP-42 Section 9.13.1
Fish Processing
Final Report
For U.S. Environmental Protection Agency Office of Air Quality Planning and Standards
Emission Inventory Branch Research Triangle Park, NC 2771 1
Attn: Mr. Dallas Safriet (MD-14) Emission Factor and Methodology
EPA Contract No. 68-D2-0159 Work Assignment No. 1-08
MRI Project No. 4601 -08
March 1994 I I I MIDWEST RESEARCH INSTITUTE 401 Harrison Oaks Boulevard, Caw, NC 27513-2412 (919) 677-0249
'I

NOTICE
The information in this document has been funded wholly or in part by the United States Environmental Protection Agency under Contract No. 68-D2-0159 to Midwest Research Institute. It has been subjected to the Agency's peer and administrative review, and it has been approved for publication as an EPA document. Mention of trade names or commercial products does not constitute endorsement or recommendation for use.
I I 1 P I I 1 I I I I I I I I I I I I

I E 1 I I I I I I I C 1 I 1 'I' I I I \I
PREFACE
This report was prepared by Midwest Research Institute (MRI) for the Emissions Inventory Branch, Technical Support Division, Office of Air Quality Planning and Standards (OAQPS), U.S. Environmental Protection Agency (EPA), under EPA Contract No. 68-D2-0159. The EPA work assignment manager for this project is Mr. Dallas Safriet.
iii

I 11 I I I I I I I I I 1
1 I I 1 I I I I
This page is for blank for reproduction
iv
-
I I, I I I I I I I I I 1 I I I E 1 I 1
CONTENTS
Preface . . . . . . . . . . . . . . . . . . . . . . . . . . . . . . . . . . . . . . . . . . . . . . . . . . iii Figures . . . . . . . . . . . . . . . . . . . . . . . . . . . . . . . . . . . . . . . . . . . . . . . . . . vii
1. 2.
3.
4.
5.
INTRODUCTION . . . . . . . . . . . . . . . . . . . . . . . . . . . . . . . . . . 1-1 INDUSTRY DESCRIPTION . . . . . . . . . . . . . . . . . . . . . . . . . . . 2-1
2.1 INDUSTRY CHARACTERIZATION . . . . . . . . . . . . . . 2-1 2.2 PROCESS DESCRIPTION . . . . . . . . . . . . . . . . . . . . 2-1 2.3 EMISSIONS . . . . . . . . . . . . . . . . . . . . . . . . . . . . . 2-9 2.4 EMISSION CONTROL TECHNOLOGY . . . . . . . . . . . 2-10
GENERAL DATA REVIEW AND ANALYSIS PROCEDURES . . . . . . . . . . . . . . . . . . . . . . . . . . . . . . . . . . . 3-1
3.1 LITERATURE SEARCH AND SCREENING . . . . . . . . . . . . . . . . . . . . . . . . . . . . 3-1
3.2 DATA QUALITY RATING SYSTEM . . . . . . . . . . . . . 3-2 3.3 EMISSION FACTOR QUALITY RATING
SYSTEM . . . . . . . . . . . . . . . . . . . . . . . . . . . . . . 3-3
POLLUTANT EMISSION FACTOR DEVELOPMENT . . . . . . . . . . . 4-1 4.1 REVIEW OF SPECIFIC DATA SETS . . . . . . . . . . . . . 4-1 4.2 DEVELOPMENT OF CANDIDATE
EMISSION FACTORS. . . . . . . . . . . . . . . . . . . . . . 4-1 PROPOSED AP-42 SECTION 9.1 3.1 . . . . . . . . . . . . . . . . . . . . 5-1

I I I I I I I I I I I 1' I I I I I I 'I
This page is for blank for reproduction
vi

I R 1 I 1 1 1 I I I I I I 1, I 1 I I I
LIST OF FIGURES
Number
2- 1 Flow diagram of precooking method . . . . . . . . . . . . . . . . . . . 2-2 2-2 Flow diagram of raw packing method . . . . . . . . . . . . . . . . . . . 2-4 2-3 Flow diagram of fish meal and crude fish oil
processing . . . . . . . . . . . . . . . . . . . . . . . . . . . . . . . . . . . . . 2-6 2-4 Diagram of a twin screw press . . . . . . . . . . . . . . . . . . . . . . . 2-7 2-5 Diagram of a disc-type centrifuge . . . . . . . . . . . . . . . . . . . . . 2-7 2-6 Oil hardening process . . . . . . . . . . . . . . . . . . . . . . . . . . . . . 2-8
vii

I I 1 I I 1 I I I I I I I I I 1 I I I
SECTION 1
INTRODUCTION
The document Compilation o f Air Pollutant Emissions Factors (AP-42) has been published by the U.S. Environmental Protection Agency (EPA) since 1972. Supplements to AP-42 have been issued to add new emission source categories and to update existing emission factors. The EPA also routinely updates AP-42 in response to the needs of federal, state, and local air pollution control programs and industry.
An emission factor relates the quantity (weight) of pollutants emitted to a unit of source activity. Emission factors reported in AP-42 are used to:
1. Estimate areawide emissions; 2. Estimate emissions for a specific facility; and 3. Evaluate emissions relative to ambient air quality.
The purpose of this background report is to provide information to support preparation of AP-42 Section 9.13.1, Fish Processing. The proposed Section 9.13.1 supersedes the current Section 6.6, Fish Processing.
This report contains five sections. Following this introduction, Section 2 gives a description of the fish canning and byproduct manufacturing industry, including a brief characterization of the industry, an overview of the process, and the identification of emissions and emission control technology. Section 3 describes the literature search, screening of emission source data, and the EPA quality ranking system for emission data and emission factors. Section 4 describes the results of the literature search. Section 5 presents the proposed AP-42 Section 9.13.1.
1-1
~-

I I I I I I I I I I I I I I I I I I 1
SECTION 2
INDUSTRY DESCRIPTION
2.1 INDUSTRY CHARACTERIZATION’
Fish canning and byproduct manufacturing (SIC 2091) are conducted in 136 plants in 12 states. The majority of these plants are in Washington, Alaska, Maine, Louisiana, and California, though some processing also occurs in Delaware, Florida, Illinois, Maryland, New York, and Virginia.
The fish canning and byproduct manufacturing industry is growing. In 1990, there was an 18 percent increase in the quantity of fish processed, and additional increases were expected in 1992 as well. Exports of canned fish and fish meal also are increasing because of diminishing supply in other countries.
2.2 PROCESS DESCRIPTION2-’3
2.2.1 Canning
Fish canning is accomplished by one of t w o basic methods: precooking and raw packing. In the precooking method, the raw fish are cleaned and cooked before the canning step. In the raw pack method, the raw fish are cleaned and placed in cans before cooking. The precooking method is typically used for larger fish, such as tuna, while the raw pack method is used for smaller fish, such as sardines. Both methods are described below.
The precooking method (Figure 2-1) begins with thawing the fish, if necessary. The fish are then eviscerated and washed. Steam, oil, hot air, or smoke is then used to cook the fish for periods from 1.5 to 10 hours, depending
2- 1

. - . .
I I I I I I I I I I I I I I I I I I
VOC Emissions
4 Steam, Hot Air, Oil,
Whole Fish and Washing Water, or Smoke (SCC 30201204)
Refrigeration In Air
Removal of Heads, Fins, Bones. etc.
Sealing and Addition of Oil Placement in Cutting or Retorting Brine, or Water Cans Chopping +
(Source Classification Codes in parentheses.)
Figure 2-1. Flow diagram of precooking method.
2-2

I 1 I I I I I I I I I I I I I I I I I
on size of the fish. Precooking removes the oils and coagulates the protein in the fish to loosen the meat.
The fish are then cooled, which may takes several hours. Refrigeration may be used to reduce the cooling time. After cooling, the head, fins, bones, and undesirable meat are removed, and the remainder is cut or chopped to be put in cans. Oil, brine, and/or water are added to the cans, which are sealed and RreSSUre cooked.
The raw pack method of canning (Figure 2-2) also begins with thawing, if necessary. Fish are then weighed, washed, and possibly brined, or "nobbed", which includes removing the heads, viscera, and tails. The fish are placed in cans, then cooked, drained, and dried. Then liquid, such as oil, brine, water, or sauce, is added to each can. Finally, the can is sealed, washed, and sterilized with steam or hot water.
2.2.2 Bvoroducts Processing
There are four processes that can be used for the extraction of fish oil:
1. Dry process; 2. Enzyme process; 3. Solvent extraction; and 4. Wet steam process.
The only process used in the United States is the wet steam process.
Fish oil processors do not use fish parts (byproducts) as a source of the oil because of the difficulty in control of the quality of the oil; only whole fish are used. The most common fish used for oil production is menhaden; other fish species that are used include anchovy, sardines, and mackerel. Fish parts are commonly used in the preparation of mink food and in food products for commercial aquariums (e.g., Sea World, etc.). The manufacture of fish byproducts like surimi or minced fish is not prominent and contributes little to emissions.
2-3

- -. -
I 1 I 1 I I I I I I I I I I I I I I I
n
2-4

I I I I I I I I I I I I I I I I I I 1
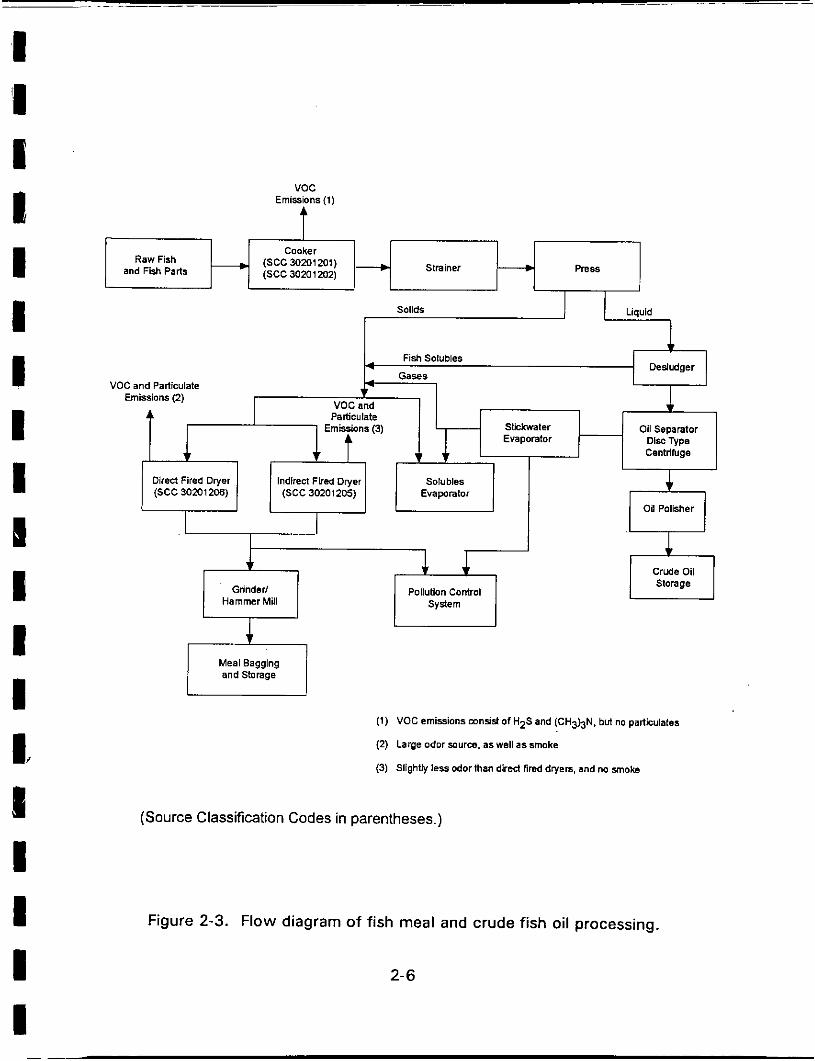
During fish oil processing (Figure 2-31, fish are cooked at approximately 100°C (lower for some species) in a continuous cooker. This process coagulates the protein and ruptures the cell walls to release the water and oil. The mixture may be strained with an auger in a perforated casing before pressing. Pressing occurs in a screw press (Figure 2-4) where the pressure increases and the volume decreases as the fish are moved along the screw press. The liquid from the mixture, known as pressing liquor, is squeezed out through a perforated casing. The solids are termed the press cake.
The press liquor, consisting of water, oil, and some solids, is transported to a centrifuge or desludger, where the solids are removed. These solids will later be returned to the press cake in the drying step. The remaining press liquor enters an oil separator where the oil and water are separated using a disc-type centrifuge (Figure 2-5). The oil is "polished" by using hot water washes and centrifugation and then sent to an oil-refining operation. The water removed from the oil, referred to as stickwater, goes to an evaporator to concentrate the solids.
The press cake, stickwater, and solids are mixed into a meal and sent to either a direct-fired or indirect-fired dryer (steam tube dryer). A direct-fired dryer consists of a slowly rotating cylinder through which air, heated to about 6OOOC by an open flame, passes through the meal to evaporate the liquid. An indirect-fired dryer consists of a fixed cylinder with rotating scrapers that heats the meal with steam or hot fluids flowing through discs, tubes, coils, or the dryer casing itself. Air passes through this apparatus, but it is not heated and flows opposite to the meal to entrain the evaporated water. Indirect-fired dryers require twice as much time as direct-fired dryers to dry the meal.
The dried fish meal is cooled, ground to a size that passes through a U. S. No. 7 standard screen, and transferred by pneumatic conveyor to storage. The ground mean is stored in bulk or in paper, burlap, or woven plastic bags. The protein meal is then used in animal and pet feed.
The "polished oil" is further purified by a process called "hardening" (Figure 2-6). First, the polished oil is refined by stirring the oil with an alkaline solution in a large vat. The alkaline solution reacts with the free fatty acids in the oil to form insoluble soaps. The mixture is allowed to settle overnight, and the
2-5
I I I 1 I I I I I E I I I I 5 I I I
VOC and Particulate
voc
f Fish Soiubles
4 Dedudger
4 Gates
Emissions(1)
t
Particulate
Conker
Slrainer --c press Raw Fish
and Fish Parts
Emissions (3) Slickwater Oil Separator Evaporator Disc Type
(1) VOC emissions mnist of H2S and (CH3bN. bul no particulates
(2) Large odor source. as well as smoke
(3) Slightly less odor than dired find dryers. and no smoke
Dired Fired Dryer Indirect Fired Dryer Solubles (SCC 30201206) (SCC 30201205) Evaporator
(Source Classification Codes in parentheses.)
4 Oil Polisher
Figure 2-3. Flow diagram of fish meal and crude fish oil processing.
2-6
$--A 1 Poilutian Control Grinder/
Crude Storage 1 Oil
Hammer Mill System

Figure 2-4. Diagram of a twin screw press.
Figure 2-5. Diagram of a disc-type centrifuge.
2-7

I 1 I c I I P I I 1 I i m 1 I I
I I
i
- Crude Oil
I.
+ Refining + Bleaching + Vat 1
I
I Figure 2-6. Oil hardening.
i 2-8

cleared oil is extracted off the top. The oil is then washed with hot water to remove any remaining soaps.
Bleaching occurs in the next step by mixing the oil with natural clays to remove oil pigments and colored matter. This process proceeds at temperatures of around 80° to 116OC, in either a batch or continuous mode. After bleaching, the unsaturated fatty acid chains are saturated through hydrogenation. A nickel catalyst, at a concentration of 0.05 to 0.1 percent by weight, is added to an oil vat, the mixture is heated and stirred, and hydrogen is injected into the mixture to react with the unsaturated fatty acids. After hydrogenation is completed, the oil is cooled and filtered to remove the nickel.
The hydrogenated oil is refined again before the deodorization step, which removes odor and flavor-producing chemicals. This process occurs in a vacuum chamber where dry, oxygen-free steam is bubbled through the oil to remove the undesirable chemicals. Volatilization of the undesirable chemicals occurs a t temperatures between 170' to 230OC. The oil is then cooled to about 38OC before exposure to air to prevent formation of undesirable chemicals.
2.3 EMISSIONS
Although smoke and particulate may be a problem, odors are the most objectionable emissions from fish processing plants. The fish byproducts segment results in more of these odorous contaminants than cannery ope'rations, because of the greater state of decomposition of the materials processed. In general, decayed feedstocks produce greater concentrations of odors.
The largest odor source in the fish byproducts segment is the fish meal driers. Usually, direct-fired driers emit more odors than steam-tube driers. Direct-fired driers also will emit smoke and particulate.
Odors from reduction cookers are emitted in volumes appreciably less than from fish meal driers. Odorous gases from reduction cookers consist primarily of hydrogen sulfide (H,S) and trimethylamine [(CH,),NI. Hydrogen sulfide and trimethylamine are not currently listed as Hazardous Air Pollutants (HAPS). There are virtually no particulate emissions from reduction cookers.
2-9

Some odors also are produced by canning processes. Generally, the precooked method emits less odorous gases than the raw pack method. This is because in the precooked method, the odorous exhaust gases are trapped in the cookers, whereas in the raw pack method, the steam and odorous gases are commonly vented directly to the atmosphere.
2.4 EMISSION CONTROL TECHNOLOGY
Fish cannery and fish reduction odors can be controlled with afterburners, chlorinator-scrubbers, or condensers. Afterburners are most effective, providing virtually 100 percent odor control, but they are costly from a fuel-use standpoint. Chlorinator scrubbers have been found to be 95 to 99 percent effective in controlling odors from cookers and driers. Condensers are the least effective control device.
Particulate emissions from the fish meal process are usually limited to the dryers, primarily the direct-fired dryers, and to the grinding and conveying of the dried fish meal. Because there is a relatively small quantity of fines in the ground fish meal, particulate emissions from the grinding, pneumatic conveyors, and bagging operations are expected to be very low. Generally, cyclones have been found to be an effective means to collect particulate from the dryers, grinders, conveyors, and the bagging of the ground fish meal.
REFERENCES FOR SECTION 2
1.
2.
3.
J. M. Farren, et al., U.S. Industrial Outlook '92, U.S. Department of Commerce, 1992.
A. B. Bimbo and J. B. Crowther, "Fish Meal and Oil: Current Uses," Journal of the American Oil Chemists' Society, n, pp. 221-227, March 1992.
J. H. Merritt, "Developments in Fish Handling and Processing: An Engineering Perspective," Proceedings of the Institute for Mechanical Engineers, 203, 1989.
2-10

4. D. Warne, Manual on Fish Canning, Food and Agricultural Organization of the United Nations, Rome, 1988.
5. R. E. Martin, "Seafood Products, Technology, and Research in the United States" Food Technology. pp. 58-62, March 1988.
6. G. Stefanson, "Enzymes in the Fishing Industry," Food Technology, pp. 64- 65, March 1988.
7. W. T. McComis and J. H. Litchfield, "Meat, Fish, and Poultry Processing Wastes," Journal of the Water Pollution Control Federation, 60(61, June 1988.
8. J. K. Babbit, "Suitability of Seafood Species as Raw Materials," Food Technology, pp. 97-101, March 1986.
9. J. M. Regenstein, "The Potential for Minced Fish," Food Technology,
pp. 101-106, March 1986. I
10. F. W. Wheaton and T. B. Lawson, Processing Aquatic Food Products, John Wiley and Sons, New York, NY, 1985.
1 1. M. Windsor and S . Barlow, Introduction to Fishery Byproducts, Fishing News Books, LTD., Surrey, England, 1981.
12. H. D. Bouland, "Changes in Seafood Processing Technology." Presentation at the 1981 Summer Meeting of the American Society of Agricultural Engineers, Orlando, FL, June 1981.
13. M. T. Gillies, Seafood Processing, Noyes Data Corporation, Park Ridge, NJ, 1971.
2-1 1

SECTION 3
GENERAL DATA REVIEW AND ANALYSIS PROCEDURES
3.1 LITERATURE SEARCH AND SCREENING
Review of emissions data began with a literature and source test search. First, EPA literature and data were reviewed including review of the AP-42 background files located in the Emission Inventory Branch (EIB) and data base searches on the Crosswalk/Air Toxic Emission Factor Data Base Management System (XATEF), the VOC/PM Speciation Data Base Management System (SPECIATE), and the Air Chief CD-ROM. New references were identified primarily through reviews of literature describing changes in fish-processing technology.
During the review of each document, the following criteria were used to determine the acceptability of reference documents for emission factor development:
1. The report must be a primary reference:
a. Source testing must be from a referenced study that does not reiterate information from previous studies.
b. The document must constitute the original source of test data.
2. The referenced study must contain test results based on more than one test run.
3. The report must contain sufficient data to evaluate the testing procedures and source operating conditions.
3- 1

3.2 DATA QUALITY RATING SYSTEM'
Based on OAQPS guidelines, the following data are always excluded from consideration in developing AP-42 emission factors:
1. Test series averages reported in units that cannot be converted to the selected reporting units;
2. Test series representing incompatible test methods; and
3. Test series in which the production and control processes are not clearly identified and described.
If there is no reason to exclude a particular data set, data are assigned a quality rating based on an A to D scale specified by OAQPS as follows:
A-This rating requires that multiple tests be performed on the same source using sound methodology and reported in enough detail for adequate validation. Tests do not necessarily have to conform to the methodology specified by EPA reference test methods, although such methods are used as guides.
B-This rating is given to tests performed by a generally sound methodology but lacking enough detail for adequate validation.
C-This rating is given t o tests that are based on an untested or new methodology or that lack a significant amount of background data.
D-This rating is given to tests that are based on a generally unacceptable method but may provide an order-of-magnitude value for the source.
The following are the OAQPS criteria used to evaluate source test reports for sound methodology and adequate detail:
1. Source ooeration. The manner in which the source was operated should be well documented in the report, and the source should be operating within typical parameters during the test.
3-2

I I I I 1 I 1 I I 1 1 1 I I I’ I I I 1
2. Samolina orocedures. The sampling procedures should conform to a generally accepted methodology. If actual procedures deviate from accepted methods, the deviations must be well documented. When this occurs, an evaluation should be made of how such alternative procedures could influence the test results.
3. Samolina and Drocess data. Adequate sampling and process data should be documented in the report. Many variations can occur without warning during testing and sometimes without being noticed. Such variations can induce wide deviations in sampling results. If a large spread between test results cannot be explained by information contained in the test report, the data are suspect and are given a lower rating.
4. Analvsis and calculations. The test reports should contain original raw data sheets. The nomenclature and equations used are compared to those specified by EPA (if any) t o establish equivalency. The depth of review of the calculations is dictated by the reviewer’s confidence in the ability and conscientiousness of the tester, which in turn is based on factors such as consistency of results and completeness of other areas of the test report.
3.3 EMISSION FACTOR QUALITY RATING SYSTEM’
EPA guidelines specify that the quality of the emission factors developed from analysis of the test data be rated utilizing the following general criteria:
A-Excellent: The emission factor was developed only from A-rated test data taken from many randomly chosen facilities in the industry population. The source category* was specific enough to minimize variability within the source category population.
6-Above averaae: The emission factor was developed only from A-rated test data from a reasonable number of facilities. Although no specific bias was
* Source category: A category in the emission factor table for which an emission factor has been calculated.
3-3
I I I I 1 I 1 I I 1 I 1 4 I I I I I I
I
evident, it was not clear if the facilities tested represented a random sample of the industries. As in the A-rating, the source category was specific enough to minimize variability within the source category population.
C-Averaae: The emission factor was developed only from A- and 6-rated test data from a reasonable number of facilities. Although no specific bias was evident, it was not clear if the facilities tested represented a random sample of the industry. As in the A-rating, the source category was specific enough to minimize variability within the source category population.
D-Below averaae: The emission factor was developed only from A- and E-rated test data from a small number of facilities, and there was reason to suspect that these facilities did not represent a random sample of the industry. There also may be evidence of variability within the source category population. Limitations on the use of the emission factor are footnoted in the emission factor table.
E-Poor: The emission factor was developed from C- and D-rated test data, and there was reason to suspect that the facilities tested did not represent a random-sample of the industry. There also may be evidence of variability within the source category population. Limitations on the use of these factors are footnoted.
The use of the above criteria is somewhat subjective depending to a large extent on the individual reviewer. Details of how each candidate emission factor was rated are provided in Section 4.
REFERENCE FOR SECTION 3
1, Technical Procedures for Developing AP-42 Emission Factors and Preparing AP-42 Sections, U.S. Environmental Protection Agency, Office of Air Quality Planning and Standards, Research Triangle Park, NC, October 1993.
I' 3-4

I I I 1
I 1 I I 1 I I I I I I 1 I 1
a SECTION 4
POLLUTANT EMISSION FACTOR DEVELOPMENT
This section describes the references and test data that were evaluated to determine whether revisions or additions were appropriate to AP-42 Section 6.1 3.1, Fish Processing.
4.1 REVIEW OF SPECIFIC DATA SETS
No source tests or other documents that could be used to develop new or improved emission factors for the AP-42 section were located during the literature search. However, the description and process flow diagrams were revised in the proposed AP-42 Section 9.13.1. The references that were reviewed are listed at the end of this section.
4.2 DEVELOPMENT OF CANDIDATE EMISSION FACTORS /
No new emission factors were developed because no new source tests or emissions data were found.
REFERENCES FOR SECTION 4
1. A. 6. Bimbo and J. 6. Crowther, "Fish Meal and Oil: Current Uses," Journal of the American Oil Chemists' Society, u, pp. 221 -227, March 1992.
2. J. H. Merritt, "Developments in Fish Handling and Processing: An Engineering Perspective," Proceedings of the Institute for Mechanical Engineers, 203, 1989.
3. D. Warne, Manual on Fish Canning, Food and Agricultural Organization of the United Nations, Rome 1988.
4- 1

I 1 1 PI 1 I I I I I I I I 1 1 I I I I
4.
5.
6.
7.
8.
9.
10.
11.
12.
R. E. Martin, "Seafood Products, Technology, and Research in the United States," Food Technology, pp. 58-62, March 1988.
G. Stefanson, "Enzymes in the Fishing Industry," Food Technology, pp. 64- 65, March 1988.
W. T. McComis and J. H. Litchfield, "Meat, Fish, and Poultry Processing Wastes," Journal of the Water Pollution Control Federation, 600, June 1988.
J. K. Babbit, "Suitability of Seafood Species as Raw Materials," Food Technology, pp. 97-1 01, March 1986.
J. M. Regenstein, "The Potential for Minced Fish," Food Technology, pp. 101-106, March 1986.
F. W. Wheaton and T. B. Lawson, Processing Aquatic Food Products, John Wiley and Sons, New York, NY, 1985.
M. Windsor:and S. Barlow, Introduction to-Fishery Byproducts, Fishing News Books, LTD., Surrey, England, 1981.
H. D. Bouland, "Changes in Seafood Processing Technology," for presentation at the 1981 Summer Meeting of the American Society of Agricultural Engineers, Orlando, FL, June 1981.
M. T. Gillies, Seafood Processing, Noyes Data Corporation, Park Ridge, NY, 1971.
4- 2

I 1 I 1 I I I I I 1 I I I I 1 I 1 I I
SECTION 5
PROPOSED AP-42 SECTION 9.13.1
A proposed revision of the existing AP-42 Section 6.6 Fish Processing is presented in the following pages as it would appear in the document.
5- 1

;I I I I 1 I I I I 1 3 I I I I 1 1 I I
9.13.1 FISH PROCESSING
9.13.1.1 General
Fish canning and byproduct manufacturing are conducted in 136 plants in 12 states. The majority of these plants are in Washington, Alaska, Maine, Louisiana, and California. Some processing occurs in Delaware, Florida, Illinois, Maryland, New York, and Virginia. The industry experienced an 18 percent increase in the quantity of fish processed in 1990, and additional increases were expected in 1992 as well. Exports of canned fish and fish meal also are increasing because of diminishing supply in other countries.
9.13.1.2 Process Description
Fish processing includes both the canning of fish for human consumption and the production of fish byproducts such as meal and oil. Either a precooking method or a raw pack method can be used in canning. In the precooking method, the raw fish are cleaned and cooked before the canning step. In the raw pack method, the raw fish are cleaned and placed in cans before cooking. The precooking method is used typically for larger fish such as tuna, while the raw pack method is used for smaller fish such as sardines.
The byproduct manufacture segment of the fish industry uses canning or filleting wastes and fish that are not suitable for human consumption to produce fish meal and fish oil.
Canning - The precooking method of canning (Figure 9.13.1-1) begins with thawing the fish, if necessary. The fish are eviscerated and washed, then cooked. Cooking is accomplished using steam, oil, hot air, or smoke for 1.5 to 10 hours, depending on fish size. Precooking removes the fish oils and coagulates the protein in the fish to loosen the meat. The fish are then cooled, which may take several hours. Refrigeration may be used to reduce the cooling time. After cooling, the head, fins, bones, and undesirable meat are removed, and the remainder is cut or chopped to be put in cans. Oil, brine, and/or water are added to the cans, which are sealed and pressure cooked before
I shipment.
The raw pack method of canning (Figure 9.13.1-2) also begins with thawing and weighing the fish. They are then washed and possibly brined, or "nobbed", which is removing the heads, viscera, and tails. The fish are placed in cans and then cooked, drained, and dried. After drying, liquid, which may be oil, brine, water, sauce, or other liquids, is added to the cans. Finally, the cans are sealed, washed, and sterilized with steam or hot water.
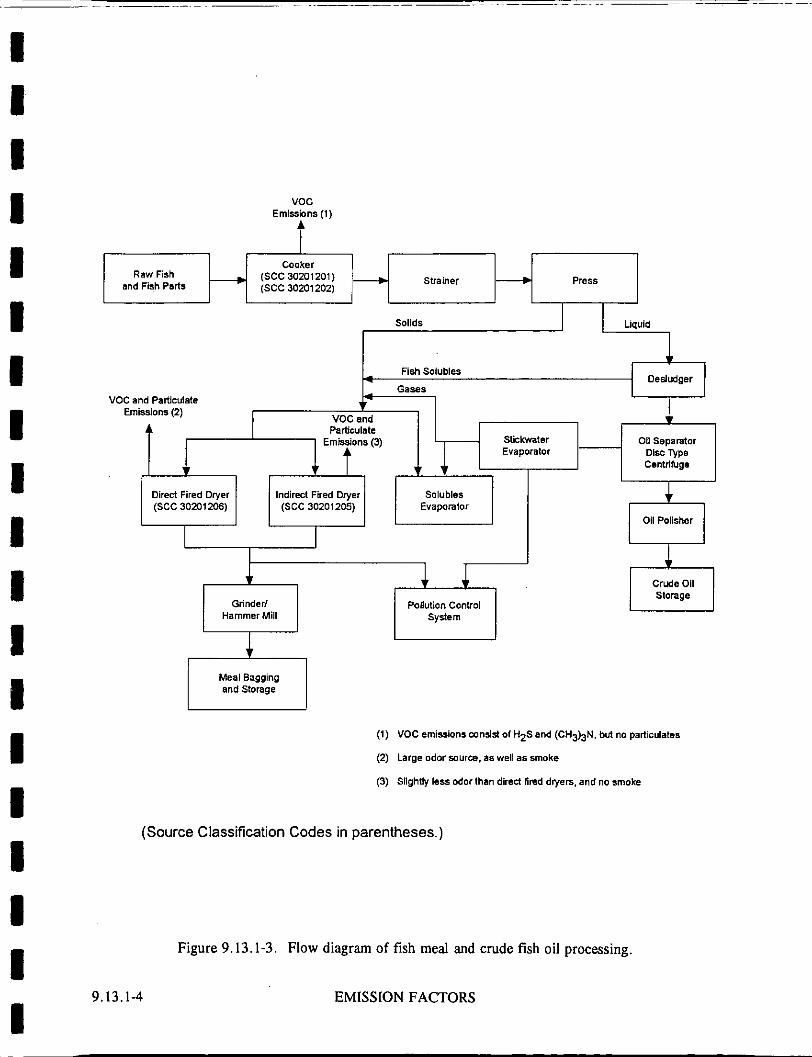
Byproduct Manufacture - The only process used in the U. S. to extract oil from the fish is the wet steam process. Fish byproduct manufacturing (Figure 9.13.1-3) begins with cooking the fish at 100°C (lower for some species) in a continuous cooker. This process coagulates the protein and ruptures the cell walls to release the water and oil. The mixture may be strained with an auger in a perforated casing before pressing with a screw press. As the fish are moved along the screw press, the pressure is increased and the volume is decreased. The liquid from the mixture, known as pressing liquor, is squeezed out through a perforated casing.
The pressing liquor, which consists of wafer, oil, and some solids, is transported to a centrifuge or desludger, where the solids are removed. These solids are later returned to the press
Food And Agricultural Industry 9.13.1-1

I I I I I I I I 1 I I 1 I I I 1 I
Sealing and Retorting
VOC Emissions
Addition of Oil + Placement in Cutting or Brine, or Water Cans Chopping
t Steam, Hot Air, 011,
Whole Fish and Washing Water, or Smoke (SCC 30201204)
Refrigeration In Air
Removal of Heads, Fins, Bones, etc.
(Source Classification Codes in parentheses.)
Figure 9.13.1-1. Flow diagram of precooking method.
9.13.1-2
1 EMISSION FACTORS

-
'I I I I I I I I I I
I I I I I I I I
a
v)
Food And Agricultural Industry 9.13.1-3
I I
VOC and Particulate
voc Emissions 11)
f Fish Soiubles + Dedudger
Gases 4
t
Particulate Emissons (3)
Sollds
Sl i i fwter 01 Separalor E"apOrato, Disc Type
Csntdiuge
(1) VOC emissions mnsist of H2S and (CH3hN. but no particulates
(2) Large odor source. as well as smoke
(3) Slightly less odor than dired Rred dryers. and no smoke
'I
Direct Fired Dryer Indirect Fired Dryer Solubles (SCC 30201206) (SCC 3020lZOS) Evaporalor
(Source Classification Codes in parentheses.)
4 Oil Polisher
Figure 9.13.1-3. Flow
Gnnderl Pollution Control
diagram of fish meal and crude fish oil processing.
EMISSION FACTORS
Hammer Mill System

I I I I I I I I I I I I I I I I I I I
cake in the Vdrying step. The oil and water are separated using a disc-type centrifuge in the oil separator. The oil is "polished" by using hot water washes and centrifugation and is then sent to an oil-refining operation. The water removed from the oil (stickwater) goes to an evaporator to concentrate the solids.
The press cake, stickwater, and solids are mixed and sent to either a direct-fired or an indirect-fired dryer (steam tube dryer). A direct-fired dryer consists of a slowly rotating cylinder through which air, heated to about 600°C by an open flame, passes through the meal to evaporate the liquid. An indirect-fired dryer consists of a fixed cylinder with rotating scrapers that heat the meal with steam or hot fluids flowing through discs, tubes, coils, or the dryer casing itself. Air also passes through this apparatus, but it is not heated and flows in the opposite direction to the meal to entrain the evaporated water. Indirect-fired dryers require twice as much time to dry the meal as direct-fired dryers.
The dried meal is cooled, ground to a size that passes through a U. S. No. 7 standard screen, and transferred by pneumatic conveyor to storage. The ground meal is stored in bulk or in paper, burlap, or woven plastic bags. This meal is used in animal and pet feed because of its high protein content.
Hydrogenalion Crude Oil Refining Bleaching Val 1
Deodorization Chamber
Hardened Oil € Bottling and Storage
Figure 9.13.1-4. Oil hardening process.
The "polished oil" is further purified by a process called "hardening" (Figure 9.13.1-4). First, the polished oil is refined by mixing the oil with an alkaline solution in a large stirred vat. The alkaline solution reacts with the free fatty acids in the oil to form insoluble soaps. The mixture is allowed to settle overnight, and the cleared oil is extracted off the top. The oil is then washed with hot water to remove any remaining soaps.
Bleaching occurs in the next step by mixing the oil with natural clays to remove oil pigments and colored matter. This process proceeds at temperatures between 80" and 116"C, in either a batch or continuous mode. After bleaching, hydrogenation of the unsaturated fatty acid chains is the next
Food And Agricultural Industry 9.13.1-5

I I I I I I I I I I I I I I I I I I
step. A nickel catalyst, at a concentration of 0.05 to 0.1 percent by weight, is added to a vat of oil, the mixture is heated and stirred, and hydrogen is injected into the mixture to react with the unsaturated fatty acid chains. After the hydrogenation is completed, the oil is cooled and filtered to remove the nickel.
The hydrogenated oil is refined again before the deodorization step, which removes odor and flavor-producing chemicals. Deodorization occurs in a vacuum chamber where dry, oxygen-free steam is bubbled through the oil to remove the undesirable chemicals. Volatilization of the undesirable chemicals occurs at temperatures between 170" to 230°C. The oil is then cooled to about 38°C before exposure to air to prevent formation of undesirable chemicals.
9.13.1.2 Emissions And Controls
Although smoke and particulate may be a problem, odors are the most objectionable emissions from fish processing plants. The fish byproducts segment results in more of these odorous contaminants than canning, because the fish are often in a further state of decomposition, which usually results in greater concentrations of odors.
The largest odor source in the fish byproducts segment is the fish meal driers. Usually, direct-fired driers emit more odors than steam-tube driers. Direct-fired driers also emit smoke and particulate.
Odorous gases from reduction cookers consist primarily of hydrogen.sulfide (H,S) and trimethylamine [(CH,),N] but are emitted from this stage in appreciably smaller volumes than from fish meal driers. There are virtually no particulate emissions from reduction cookers.
Some odors are produced by the canning processes. Generally, the precooked method emits fewer odorous gases than the raw pack method. In the precooked process, the odorous exhaust gases are trapped in the cookers, whereas in the raw pack process, the steam and odorous gases typically are vented directly to the atmosphere.
Fish cannery and fish byproduct processing odors can be controlled with afterburners, chlorinator-scrubbers, or condensers. Afterburners are most effective, providing virtually 100 percent odor control, but they are costly from a fuel-use standpoint. Chlorinator scrubbers have been found to be 95 to 99 percent effective in controlling odors from cookers and driers. Condensers are the least effective control device.
Particulate emissions from the fish meal process are usually limited to the dryers, primarily the direct-fired dryers, and to the grinding and conveying of the dried fish meal. Because there is a relatively small quantity of fines in the ground fish meal, particulate emissions from the grinding, pneumatic conveyors, and bagging operations are expected to be very low. Generally, cyclones have been found to be an effective means to collect particulate from the dryers, grinders, conveyors, and the bagging of the ground fish meal.
Emission factors for fish processing are presented in Table 9.13.1-1
EMISSION FACTORS

I I I I I I I I I I I I I I I I I I I
Particulate kg/Mg Ib/ton
Neg Neg
Neg Neg
2.5 5
4 8
Neg Neg
Table 9.13.1-1 (Metric And English Units). UNCONTROLLED EMISSION FACTORS FOR FISH CANNING AND
BYPRODUCT MANUFACTURE'
EMISSION FACTOR RATING: C
Trimethylamine Hydrogen sulfide
kg/Mg Ib/ton kgA4g Ib/ton [(CH,),NI (Ha
C C C C
0.15c 0.3' O.OOSc 0.01' 1 .IS' 3 3 0.10= 0.2c
b b b b
b b b b
Process (SCC) Cookers, canning (SCC 30201204) Cookers, scrap
Fresh fish (SCC 30201201) Stale fish (SCC 30201202)
Steam tube dryer (SCC 30201205)
Direct-fired dryer (SCC 30201206)
'Reference 1 . Factors are in terms of raw fish processed. SCC = Source Classification Code. Neg = negligible.
bEmissions suspected, but data are not available for quantification. qeference 2.
References for Section 9.13.1
' 1 . W. H. Prokop, "Fish Processing", Air Pollution Engineering Manual, Van Nostrand Reinhold, New York, 1992.
2. W. Summer, Methods OfAir Deodorization, Elsevier Publishing, New York City, 1963.
3. M. T. Gillies, Seafood Processing, Noyes Data Corporation, Park Ridge, NJ, 1971.
4. F. W. Wheaton and T. B. Lawson, Processing Aquatic Food Products, John Wiley and Sons, New York, 1985.
5. M. Windsor and S. Barlow, Introduction To Fishery Byproducts, Fishing News Books, Ltd., Surrey, England, 1981.
6. D. Warne, Manual On Fish Gznning, Food And Agricultural Organization Of The United Nations, Rome, Italy, 1988.
Food And Agricultural Industry 9.13.1-7