ap biology - jackson county school district · pdf file... identify a particular environmental...
TRANSCRIPT
AP Biology
AP Biology
Lab Review
AP Biology
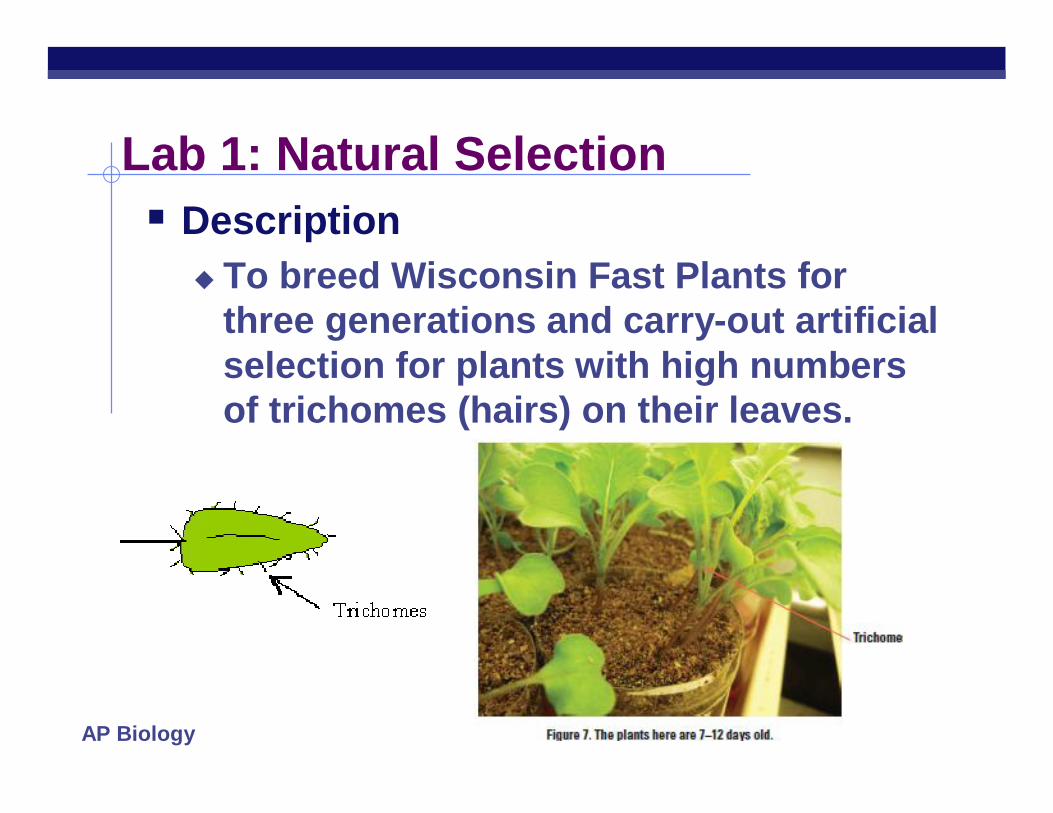
Description To breed Wisconsin Fast Plants for
three generations and carry-out artificial selection for plants with high numbers of trichomes (hairs) on their leaves.
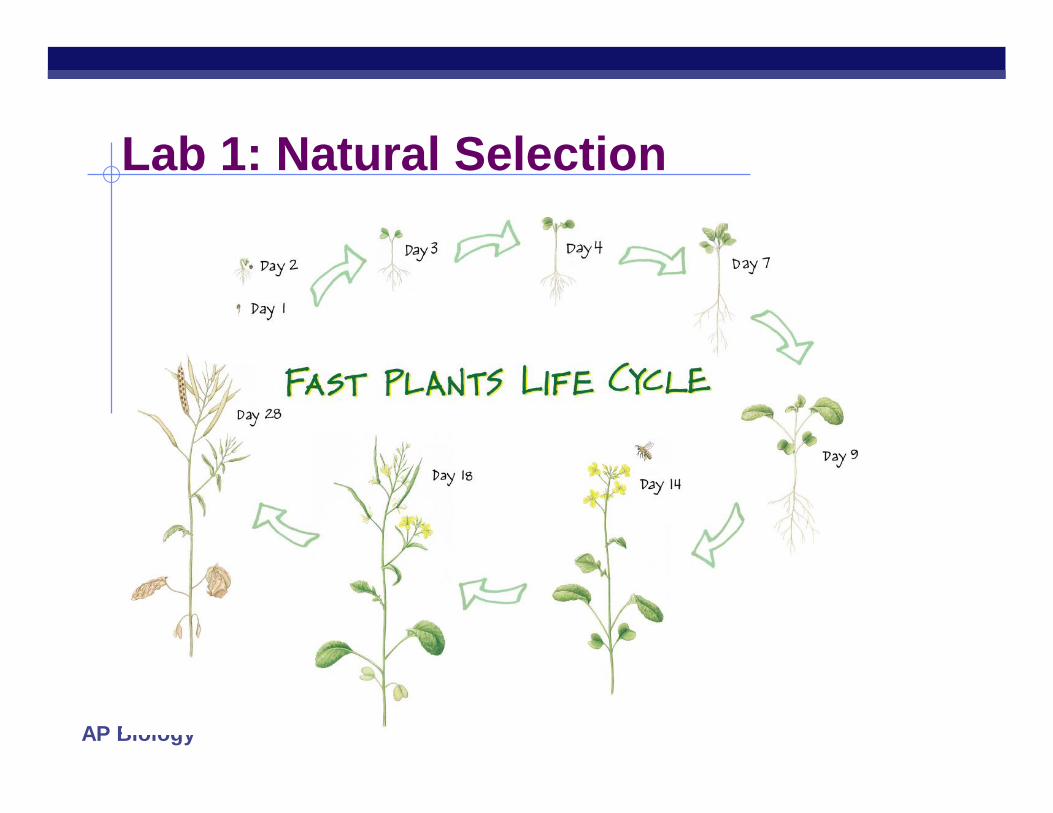
Lab 1: Natural Selection
AP Biology
Lab 1: Natural Selection
AP Biology
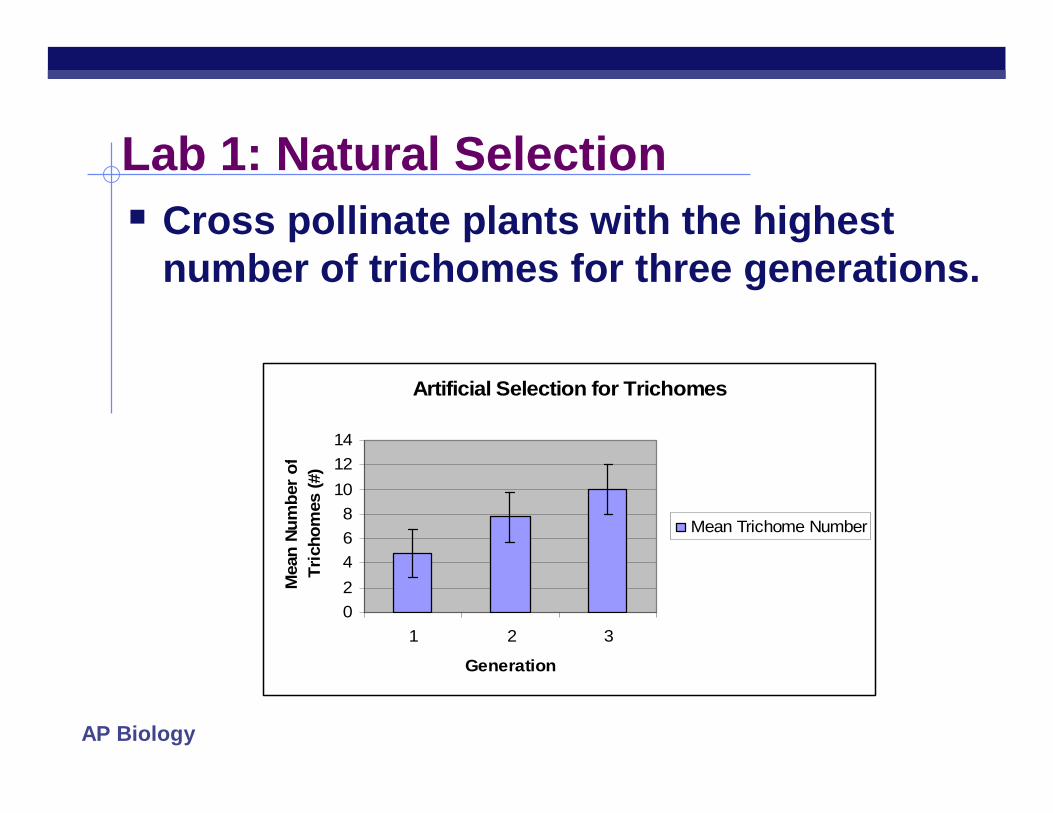
Lab 1: Natural Selection Cross pollinate plants with the highest
number of trichomes for three generations.
Artificial Selection for Trichomes
02468
101214
1 2 3
Generation
Mea
n Nu
mbe
r of
Tr
icho
mes
(#)
Mean Trichome Number
AP Biology
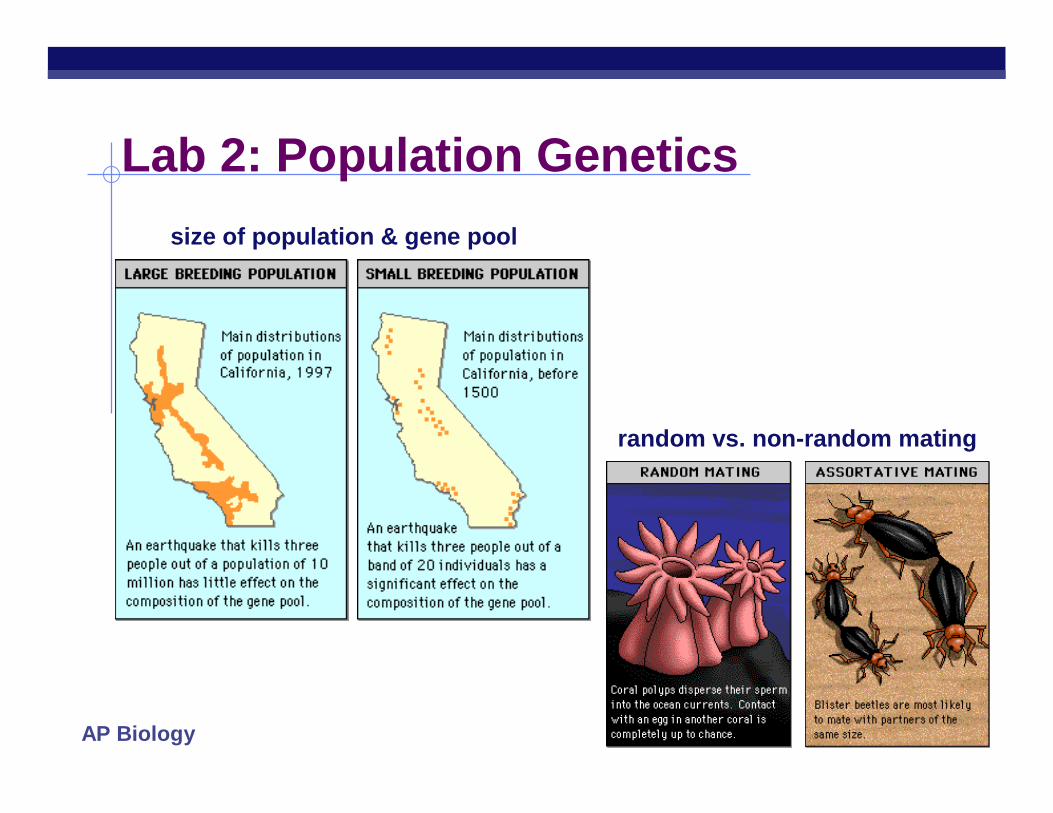
Lab 2: Population Genetics
random vs. non-random mating
size of population & gene pool
AP Biology
Lab 2: Population Genetics Description
Students created an excel spreadsheet to look at allele frequencies changed over generations.
Students then were given different situations (i.e. selection, etc.) and asked to alter their spreadsheet to show how it changed the frequencies.
AP Biology
Lab (Not AP): Population Genetics Description
simulations were used to study effects of different parameters on frequency of alleles in a population selection heterozygous advantage genetic drift
AP Biology
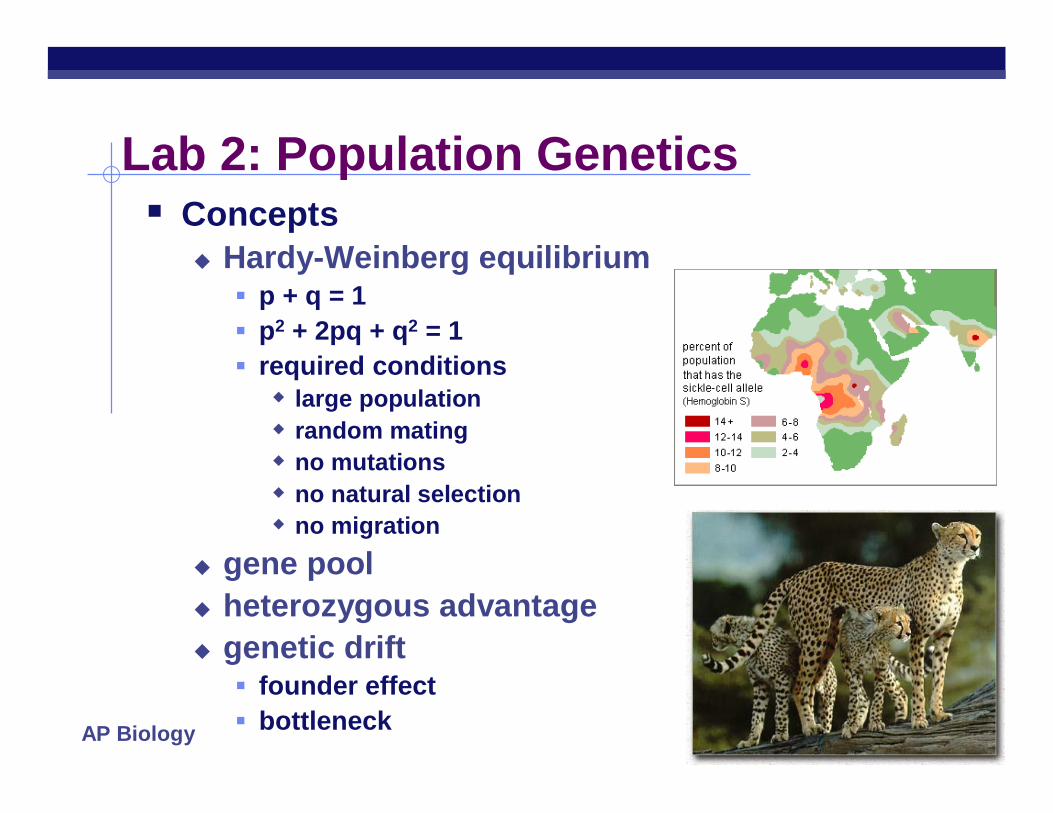
Lab 2: Population Genetics Concepts
Hardy-Weinberg equilibrium p + q = 1 p2 + 2pq + q2 = 1 required conditions large population random mating no mutations no natural selection no migration
gene pool heterozygous advantage genetic drift founder effect bottleneck
AP Biology
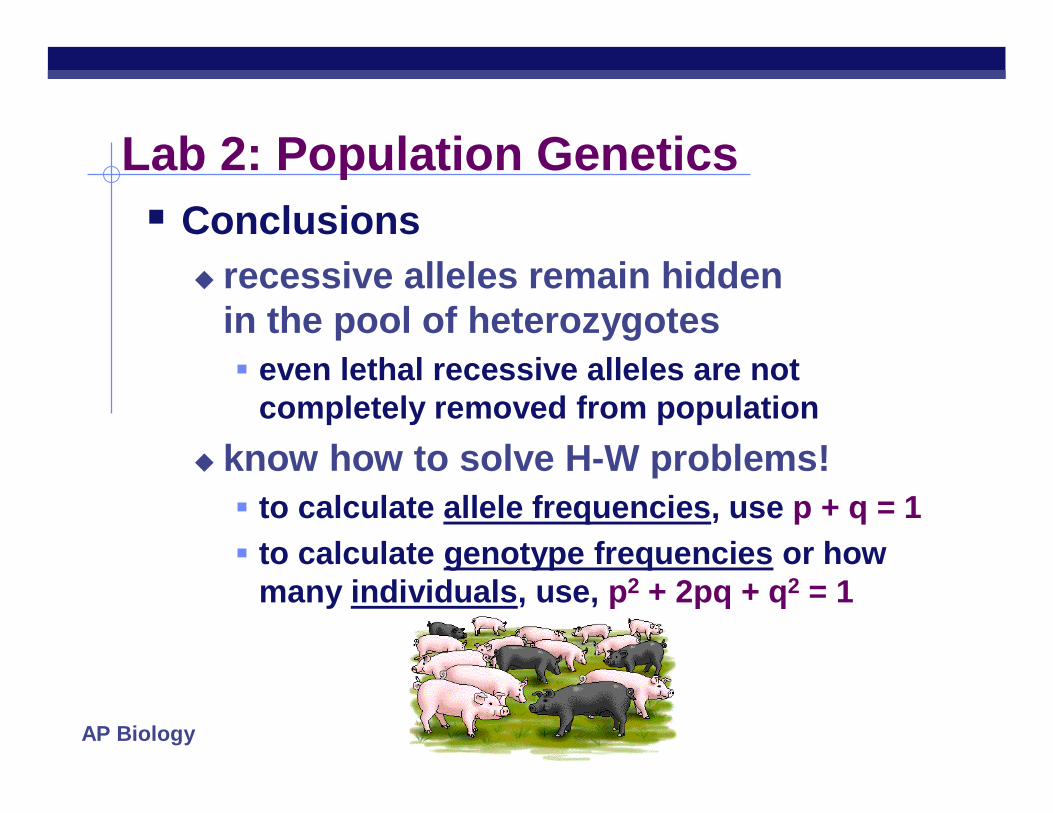
Lab 2: Population Genetics Conclusions
recessive alleles remain hidden in the pool of heterozygotes even lethal recessive alleles are not
completely removed from population know how to solve H-W problems! to calculate allele frequencies, use p + q = 1 to calculate genotype frequencies or how
many individuals, use, p2 + 2pq + q2 = 1
AP Biology
Lab 2: Population Genetics ESSAY 2008B-3. Evolution is one of the unifying themes of biology. Evolution involves
change in the frequencies of alleles in a population. For a particular genetic locus in a population, the frequency of the recessive allele (a) is 0.4 and the frequency of the dominant allele (A) is 0.6. (a) What is the frequency of each genotype (AA, Aa, aa) in this
population? What is the frequency of the dominant phenotype? (b) How can the Hardy-Weinberg principle of genetic equilibrium be used
to determine whether this population is evolving? (c) Identify a particular environmental change and describe how it might
alter allelic frequencies in this population. Explain which condition of the Hardy-Weinberg principle would not be met.
AP Biology
Lab 3: Comparing DNA Using BLAST Description
Part I: draw a cladogram based on gene and protein similarities among four different species
Part II: BLAST to compare gene sequences from an “unknown” fossil to extant gene sequences. placed that organism on a cladogram with
known living organisms.
AP Biology
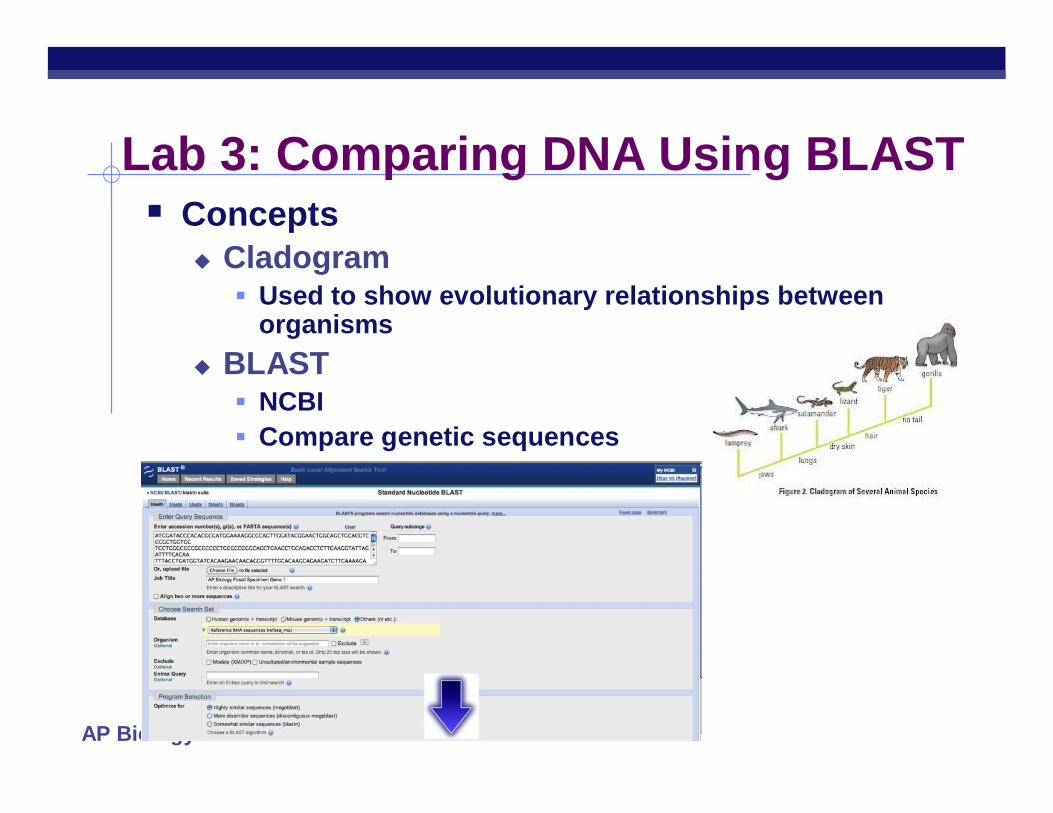
Lab 3: Comparing DNA Using BLAST Concepts
Cladogram Used to show evolutionary relationships between
organisms BLAST NCBI Compare genetic sequences
AP Biology
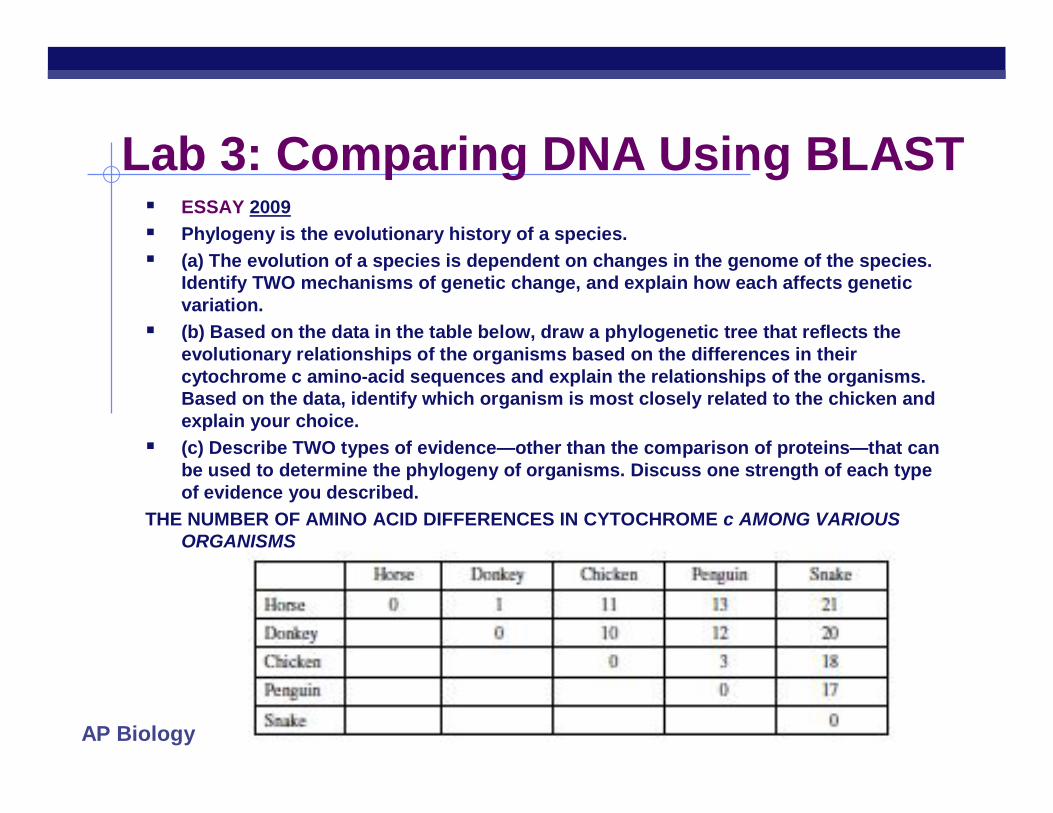
Lab 3: Comparing DNA Using BLAST ESSAY 2009 Phylogeny is the evolutionary history of a species. (a) The evolution of a species is dependent on changes in the genome of the species.
Identify TWO mechanisms of genetic change, and explain how each affects genetic variation.
(b) Based on the data in the table below, draw a phylogenetic tree that reflects the evolutionary relationships of the organisms based on the differences in their cytochrome c amino-acid sequences and explain the relationships of the organisms. Based on the data, identify which organism is most closely related to the chicken and explain your choice.
(c) Describe TWO types of evidence—other than the comparison of proteins—that can be used to determine the phylogeny of organisms. Discuss one strength of each type of evidence you described.
THE NUMBER OF AMINO ACID DIFFERENCES IN CYTOCHROME c AMONG VARIOUS ORGANISMS
AP Biology
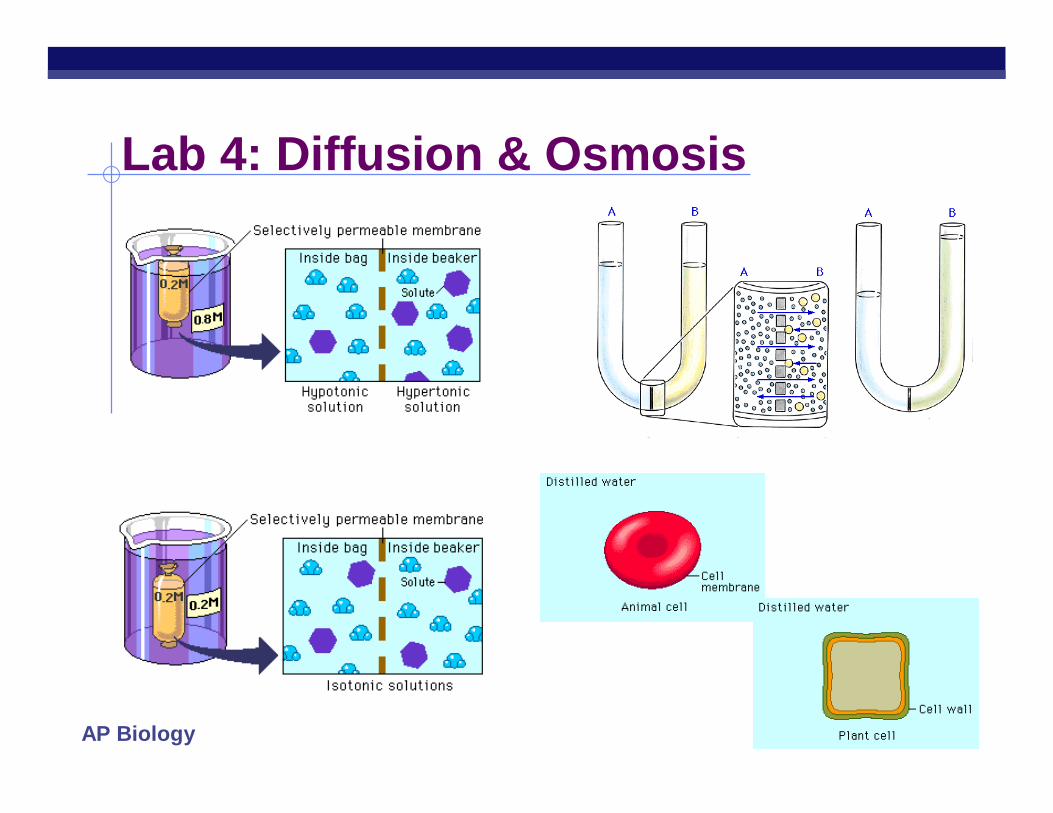
Lab 4: Diffusion & Osmosis
AP Biology
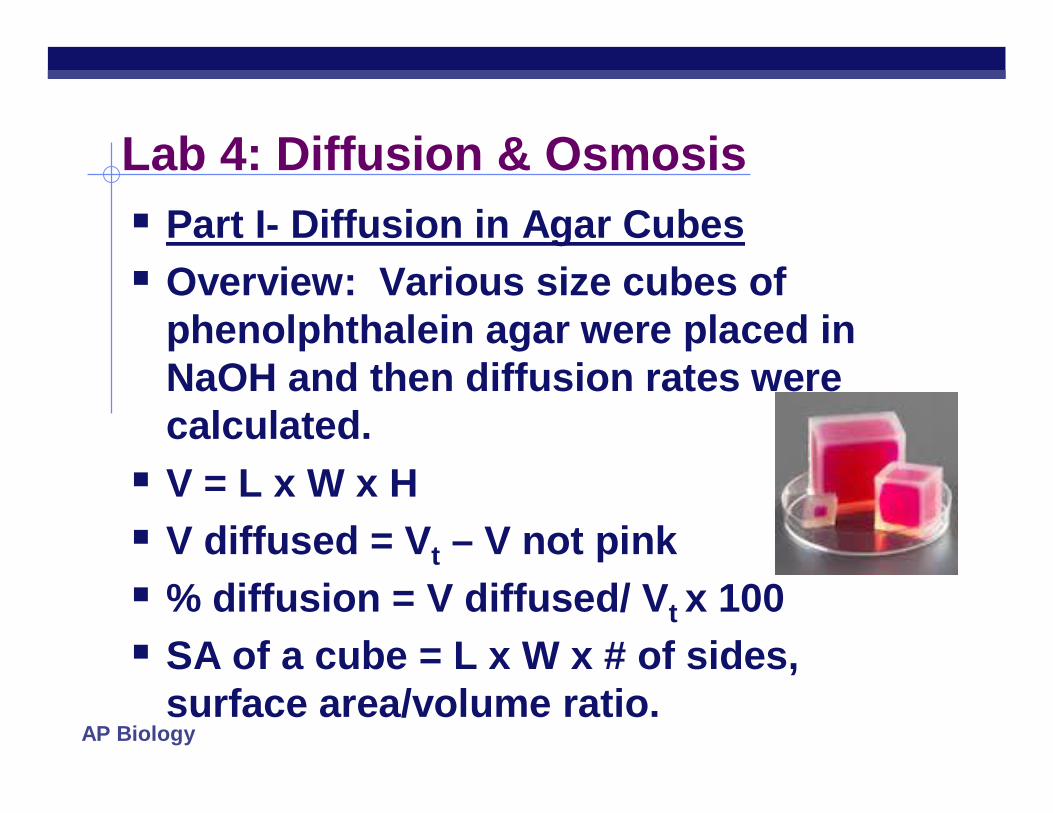
Lab 4: Diffusion & Osmosis Part I- Diffusion in Agar Cubes Overview: Various size cubes of
phenolphthalein agar were placed in NaOH and then diffusion rates were calculated. V = L x W x H V diffused = Vt – V not pink % diffusion = V diffused/ Vt x 100 SA of a cube = L x W x # of sides,
surface area/volume ratio.
AP Biology
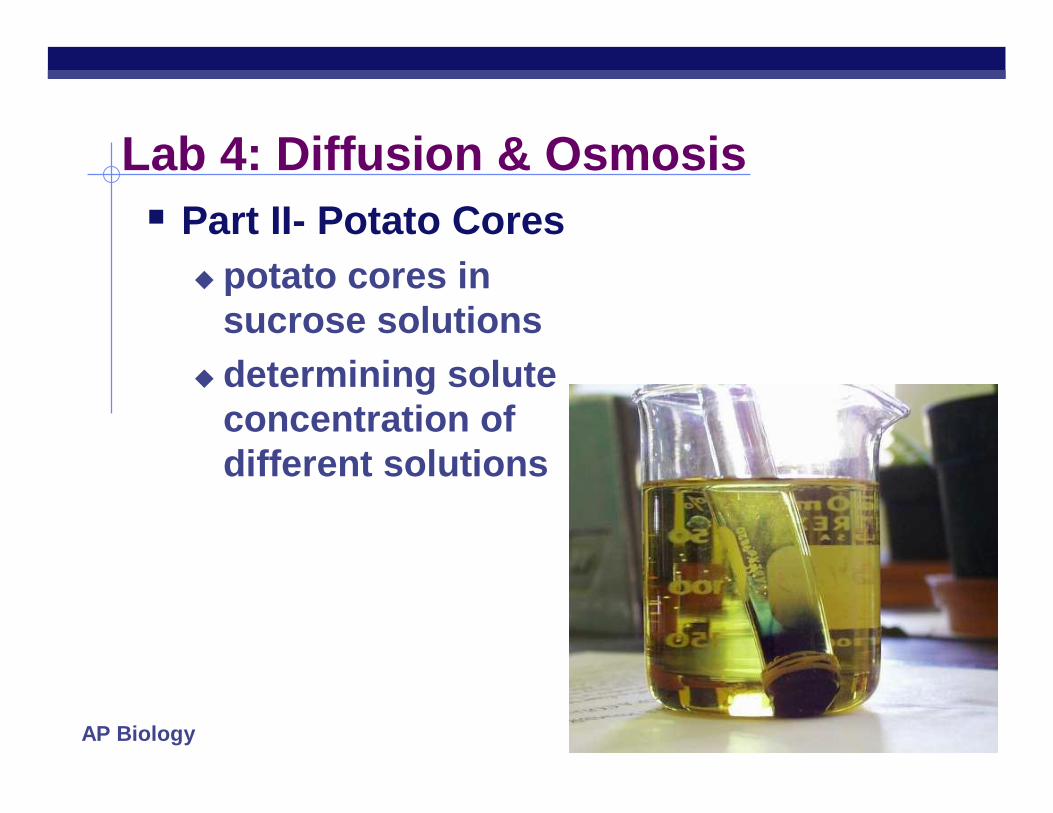
Lab 4: Diffusion & Osmosis Part II- Potato Cores
potato cores in sucrose solutions
determining solute concentration of different solutions
AP Biology
Lab 4: Diffusion & Osmosis Part III- Design Your Own Experiment
(Dialysis Bags) Overview: Students were provided with
dialysis bags, colored sucrose solutions of unknown molarities, and basic lab equipment to use to design an experiment on how to determine the molarities of the colored solutions.
AP Biology
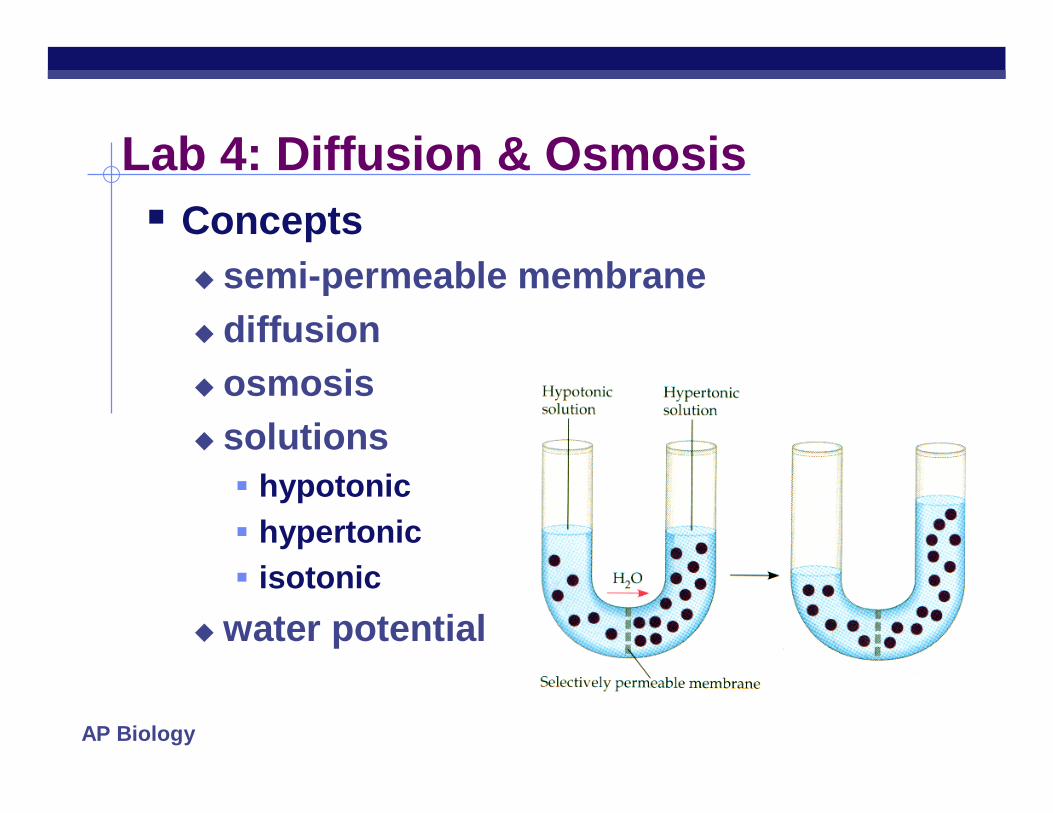
Lab 4: Diffusion & Osmosis Concepts
semi-permeable membrane diffusion osmosis solutions hypotonic hypertonic isotonic
water potential
AP Biology
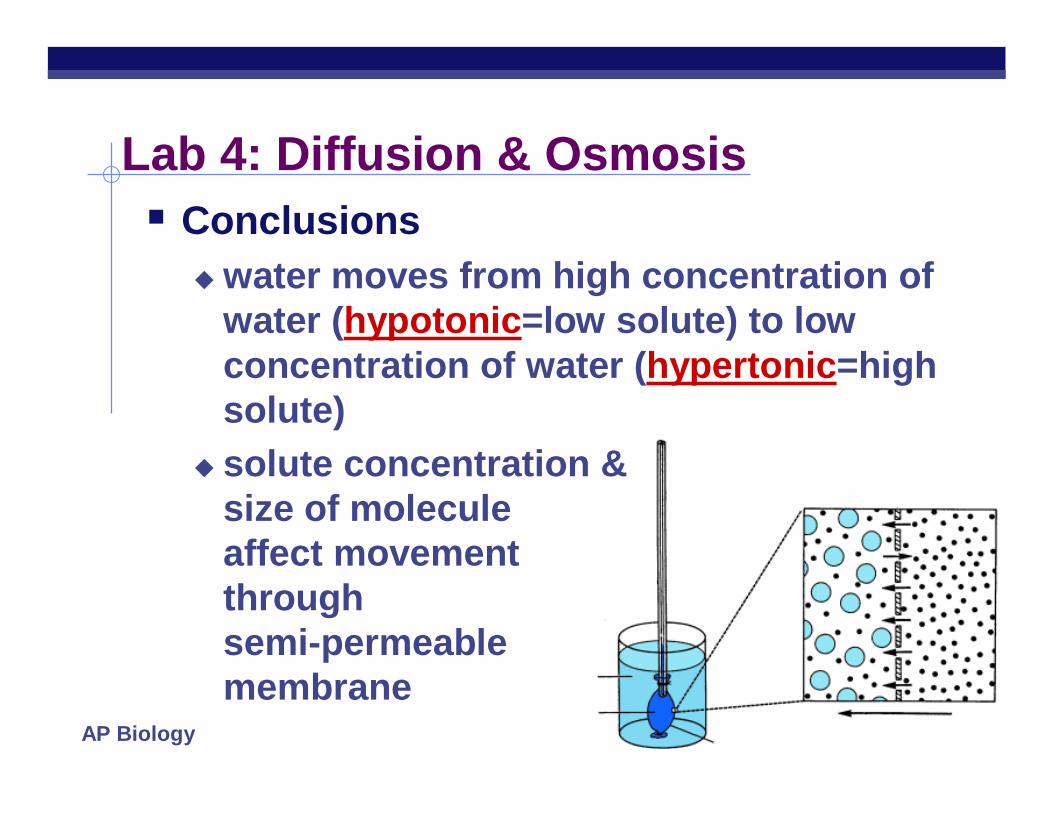
Lab 4: Diffusion & Osmosis Conclusions
water moves from high concentration of water (hypotonic=low solute) to low concentration of water (hypertonic=high solute)
solute concentration & size of molecule affect movement through semi-permeable membrane
AP Biology
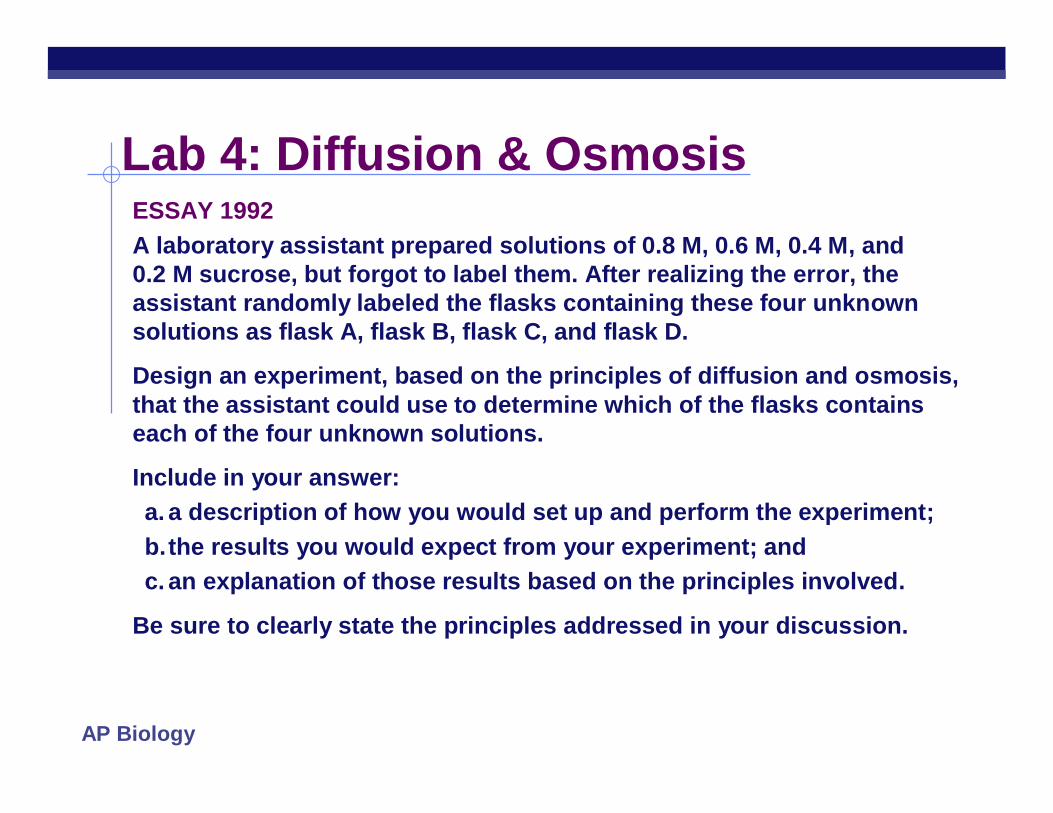
Lab 4: Diffusion & OsmosisESSAY 1992A laboratory assistant prepared solutions of 0.8 M, 0.6 M, 0.4 M, and 0.2 M sucrose, but forgot to label them. After realizing the error, the assistant randomly labeled the flasks containing these four unknown solutions as flask A, flask B, flask C, and flask D.
Design an experiment, based on the principles of diffusion and osmosis, that the assistant could use to determine which of the flasks contains each of the four unknown solutions.
Include in your answer:a. a description of how you would set up and perform the experiment;b.the results you would expect from your experiment; andc. an explanation of those results based on the principles involved.
Be sure to clearly state the principles addressed in your discussion.
AP Biology
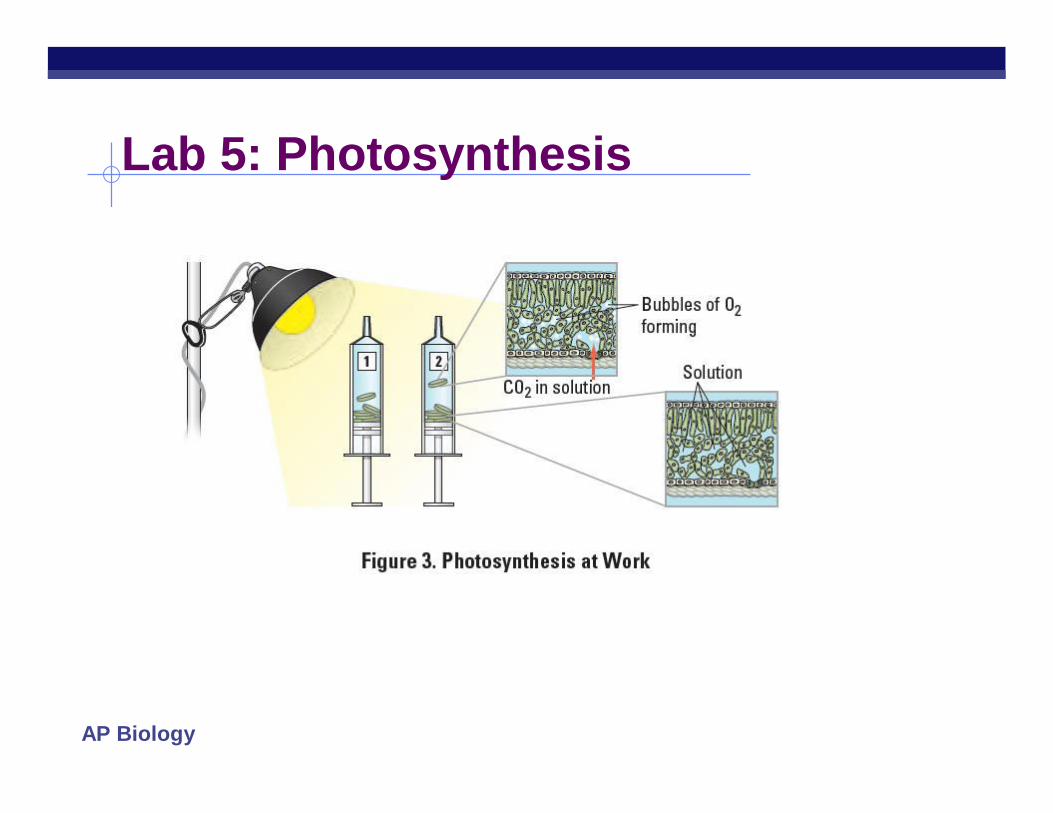
Lab 5: Photosynthesis
AP Biology
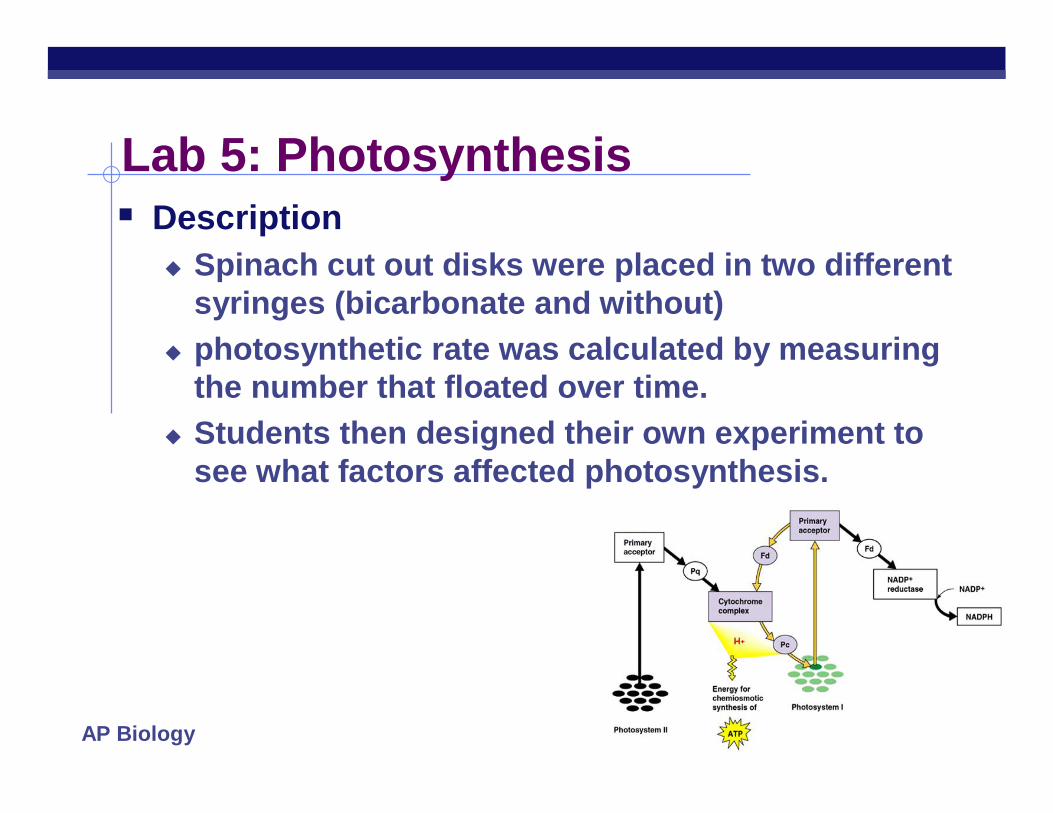
Lab 5: Photosynthesis Description
Spinach cut out disks were placed in two different syringes (bicarbonate and without)
photosynthetic rate was calculated by measuring the number that floated over time.
Students then designed their own experiment to see what factors affected photosynthesis.
AP Biology
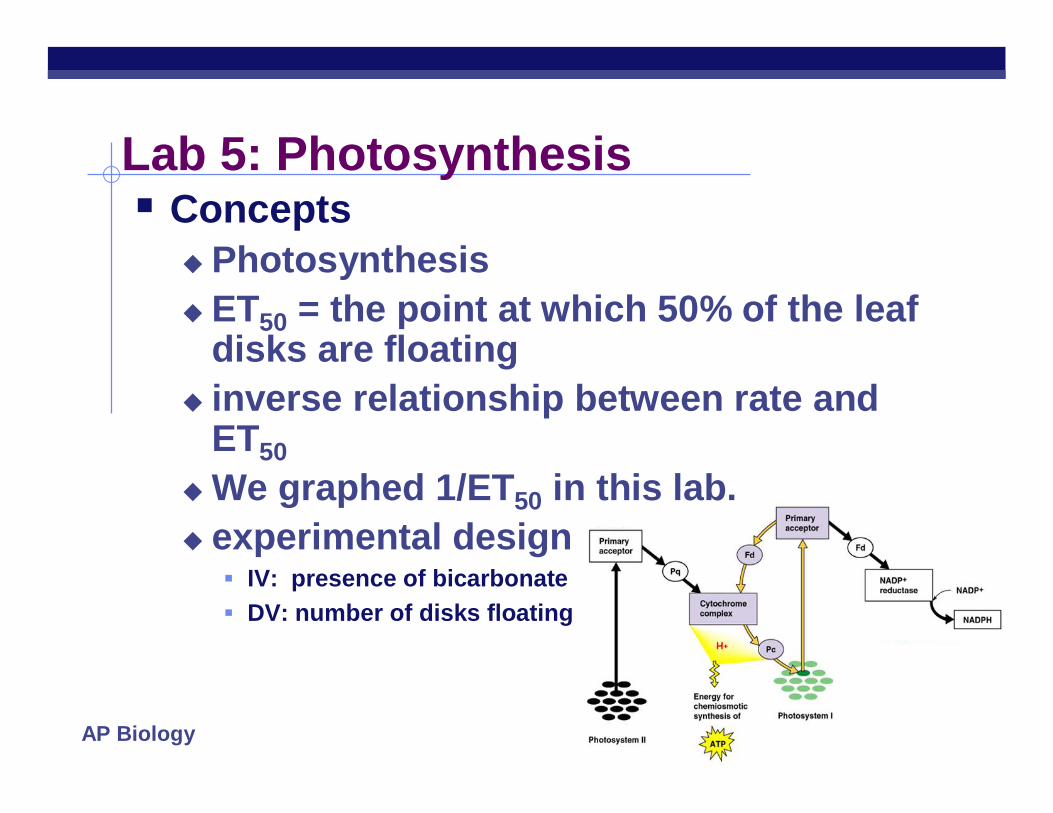
Lab 5: Photosynthesis Concepts
Photosynthesis ET50 = the point at which 50% of the leaf
disks are floating inverse relationship between rate and
ET50We graphed 1/ET50 in this lab. experimental design
IV: presence of bicarbonate DV: number of disks floating

AP Biology
Lab 5: Photosynthesis ESSAY 1999-1: The rate of photosynthesis may vary with changes that occur in
environmental temperature, wavelength of light, and light intensity. Using a photosynthetic organism of your choice, choose only ONE of the three variables (temperature, wavelength of light, or light intensity) and for this variable
design a scientific experiment to determine the effect of the variable on the rate of photosynthesis for the organism;
explain how you would measure the rate of photosynthesis in yourexperiment;
AP Biology
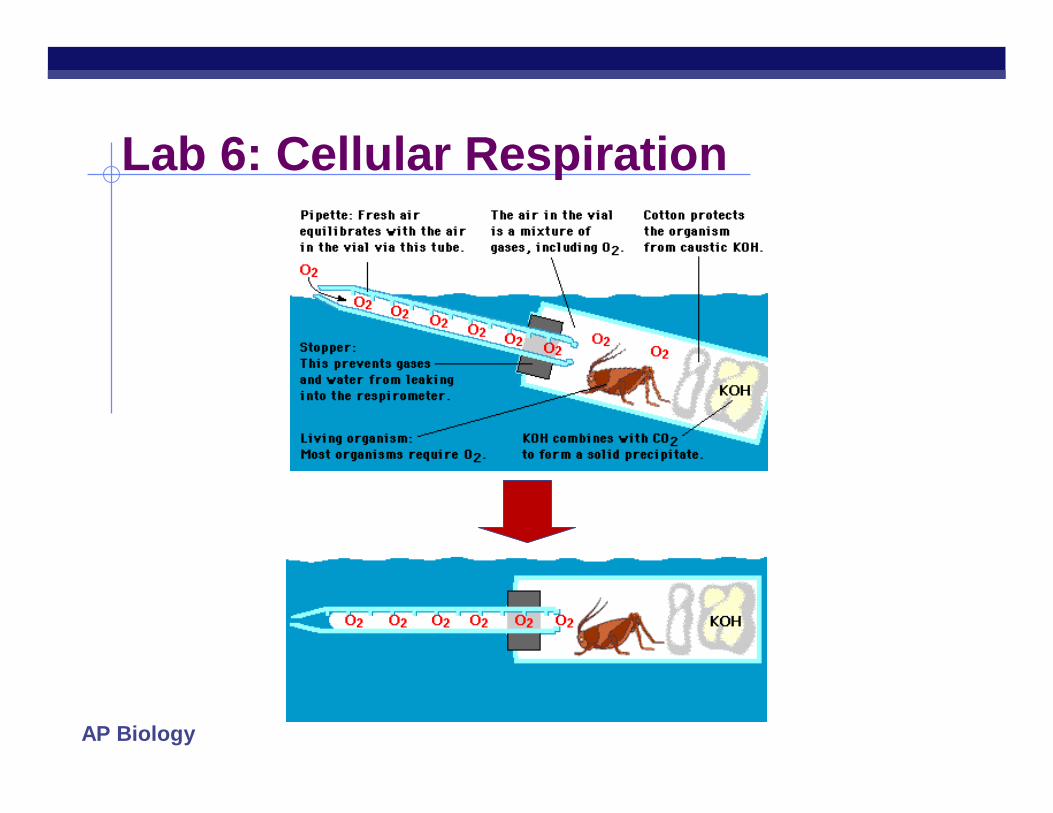
Lab 6: Cellular Respiration
AP Biology
Lab 6: Cellular Respiration Description
using respirometer to measure rate of O2 production by pea seeds non-germinating peas germinating peas effect of temperature control for changes in pressure &
temperature in roomDesign experiment to determine other
factors that affect cell respiration (type of seed, age of seed, etc.)
AP Biology
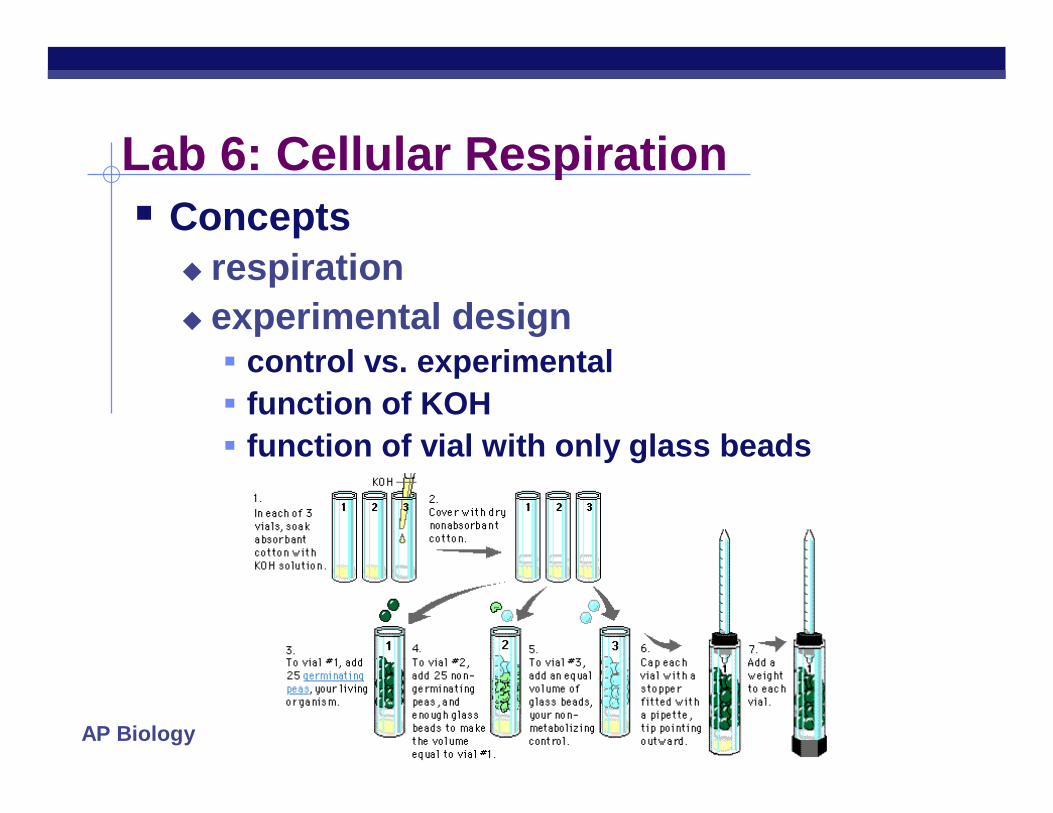
Lab 6: Cellular Respiration Concepts
respiration experimental design control vs. experimental function of KOH function of vial with only glass beads
AP Biology
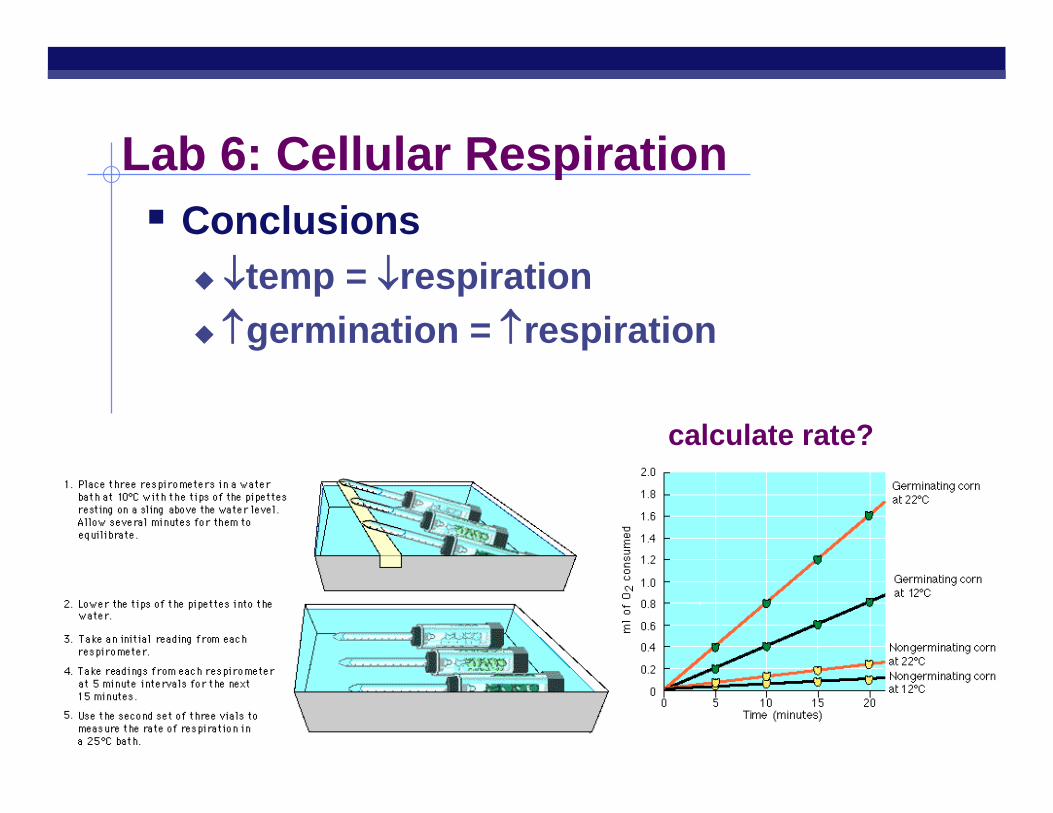
Lab 6: Cellular Respiration Conclusions
temp = respiration germination = respiration
calculate rate?
AP Biology
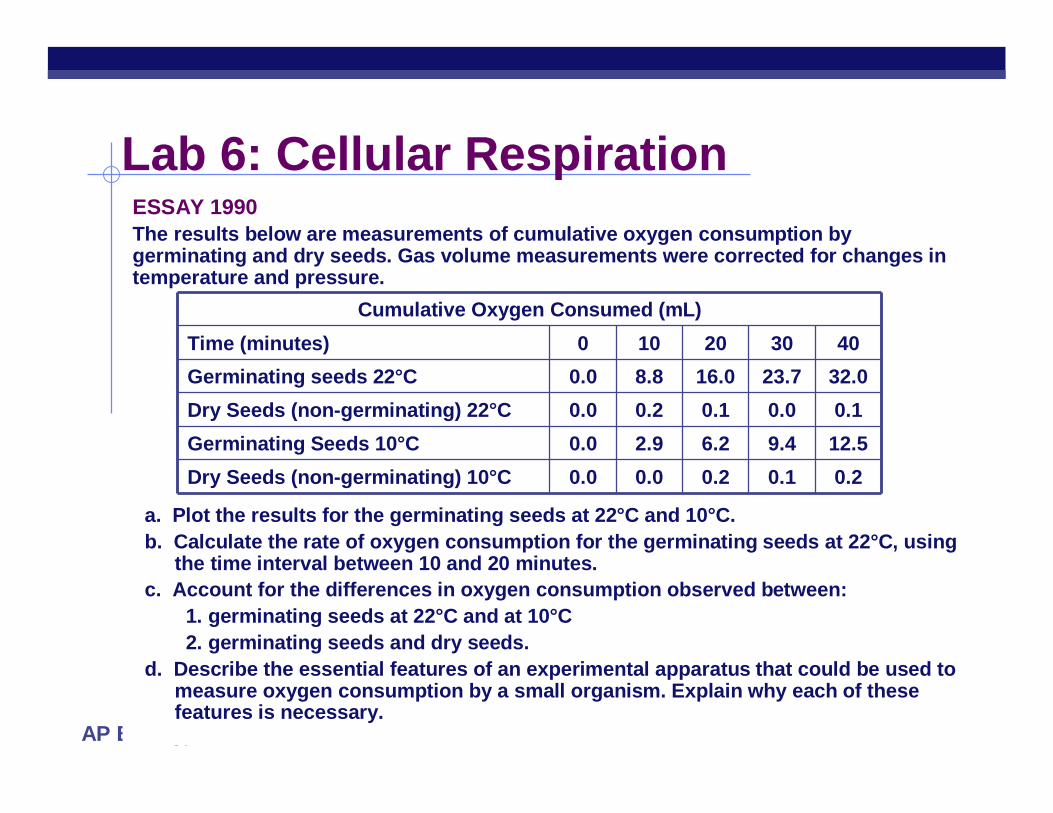
Lab 6: Cellular RespirationESSAY 1990The results below are measurements of cumulative oxygen consumption by germinating and dry seeds. Gas volume measurements were corrected for changes in temperature and pressure.
a. Plot the results for the germinating seeds at 22°C and 10°C. b. Calculate the rate of oxygen consumption for the germinating seeds at 22°C, using
the time interval between 10 and 20 minutes. c. Account for the differences in oxygen consumption observed between:
1. germinating seeds at 22°C and at 10°C2. germinating seeds and dry seeds.
d. Describe the essential features of an experimental apparatus that could be used to measure oxygen consumption by a small organism. Explain why each of these features is necessary.
Cumulative Oxygen Consumed (mL)Time (minutes) 0 10 20 30 40Germinating seeds 22°C 0.0 8.8 16.0 23.7 32.0Dry Seeds (non-germinating) 22°C 0.0 0.2 0.1 0.0 0.1Germinating Seeds 10°C 0.0 2.9 6.2 9.4 12.5Dry Seeds (non-germinating) 10°C 0.0 0.0 0.2 0.1 0.2
AP Biology
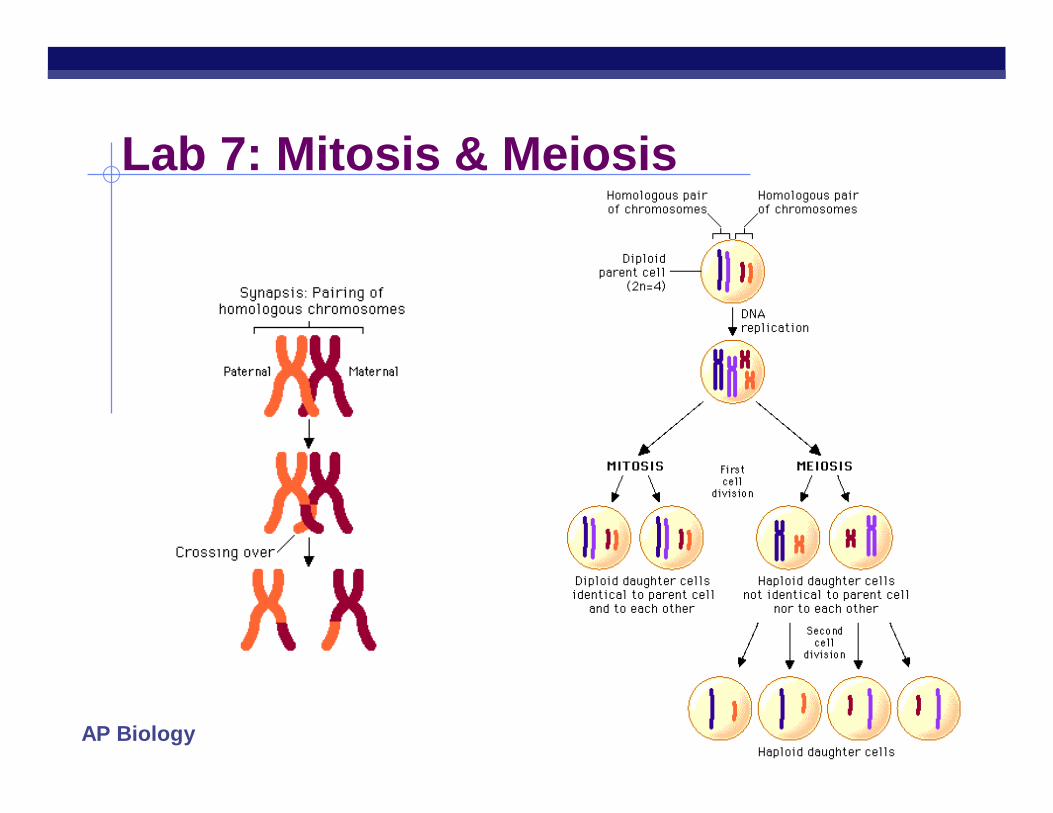
Lab 7: Mitosis & Meiosis
AP Biology
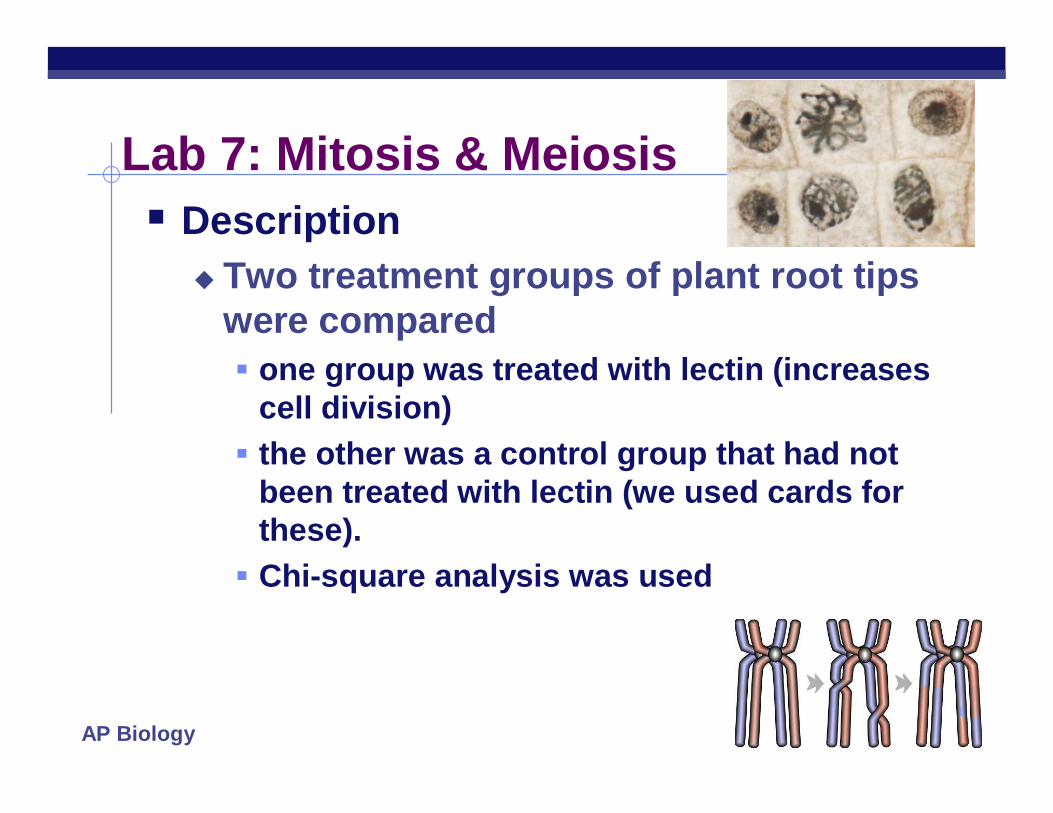
Lab 7: Mitosis & Meiosis Description
Two treatment groups of plant root tips were compared one group was treated with lectin (increases
cell division) the other was a control group that had not
been treated with lectin (we used cards for these). Chi-square analysis was used
AP Biology
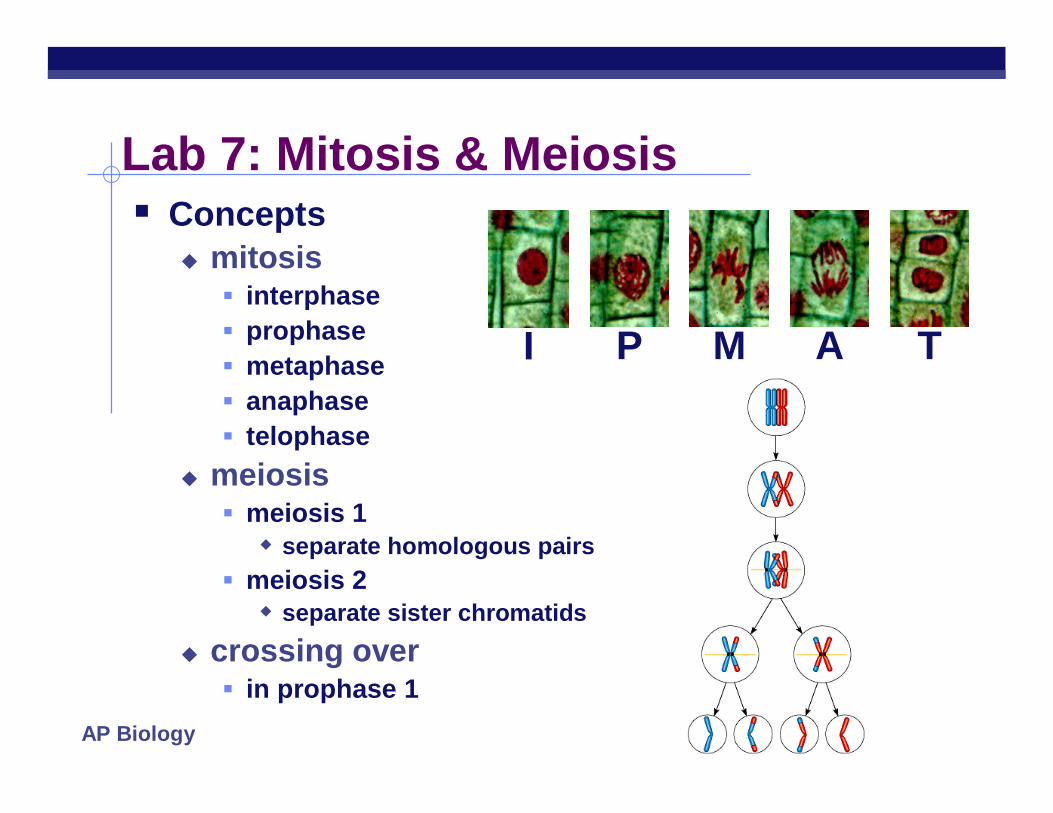
Lab 7: Mitosis & Meiosis Concepts
mitosis interphase prophase metaphase anaphase telophase
meiosis meiosis 1 separate homologous pairs
meiosis 2 separate sister chromatids
crossing over in prophase 1
I P M A T
AP Biology
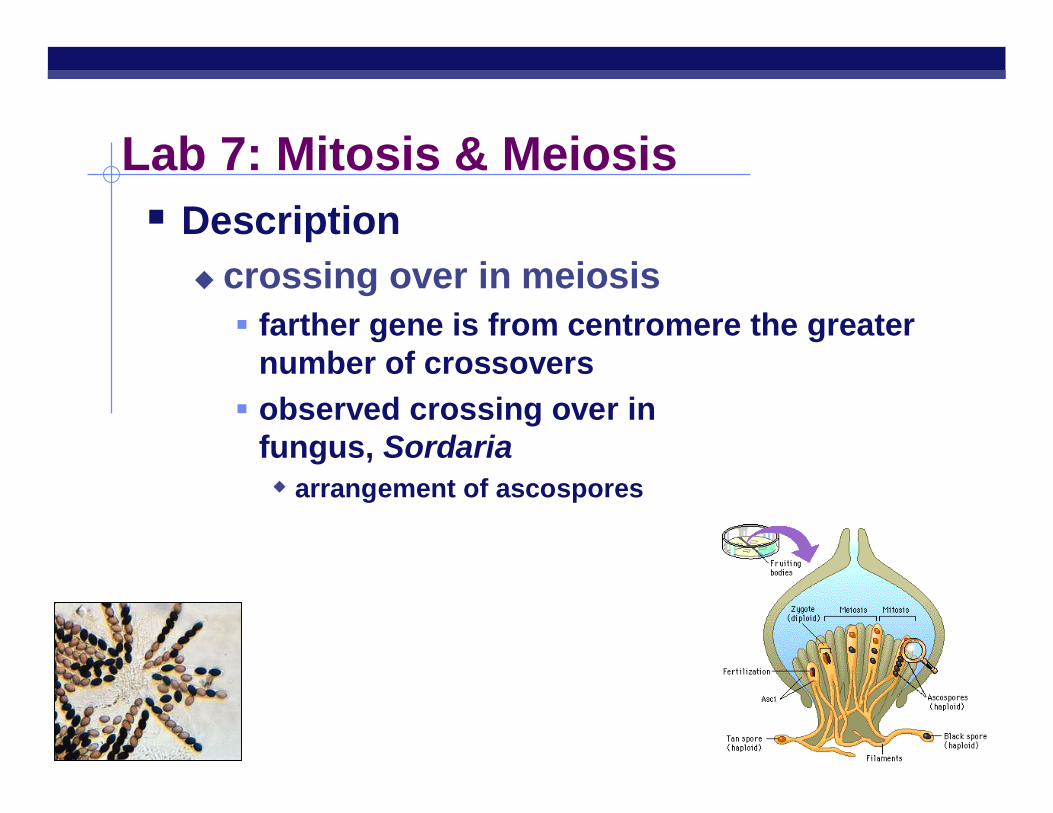
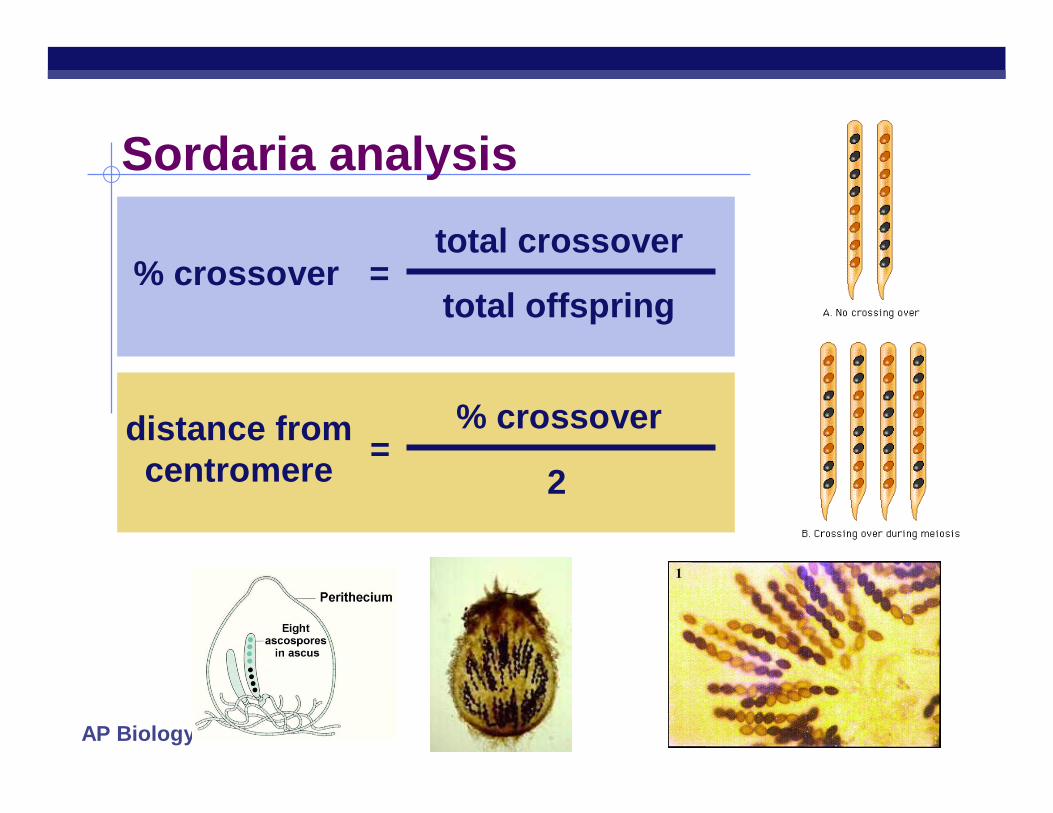
Lab 7: Mitosis & Meiosis Description
crossing over in meiosis farther gene is from centromere the greater
number of crossovers observed crossing over in
fungus, Sordaria arrangement of ascospores
AP Biology
Sordaria analysis
% crossovertotal crossover
total offspring=
distance fromcentromere
% crossover
2=
AP Biology
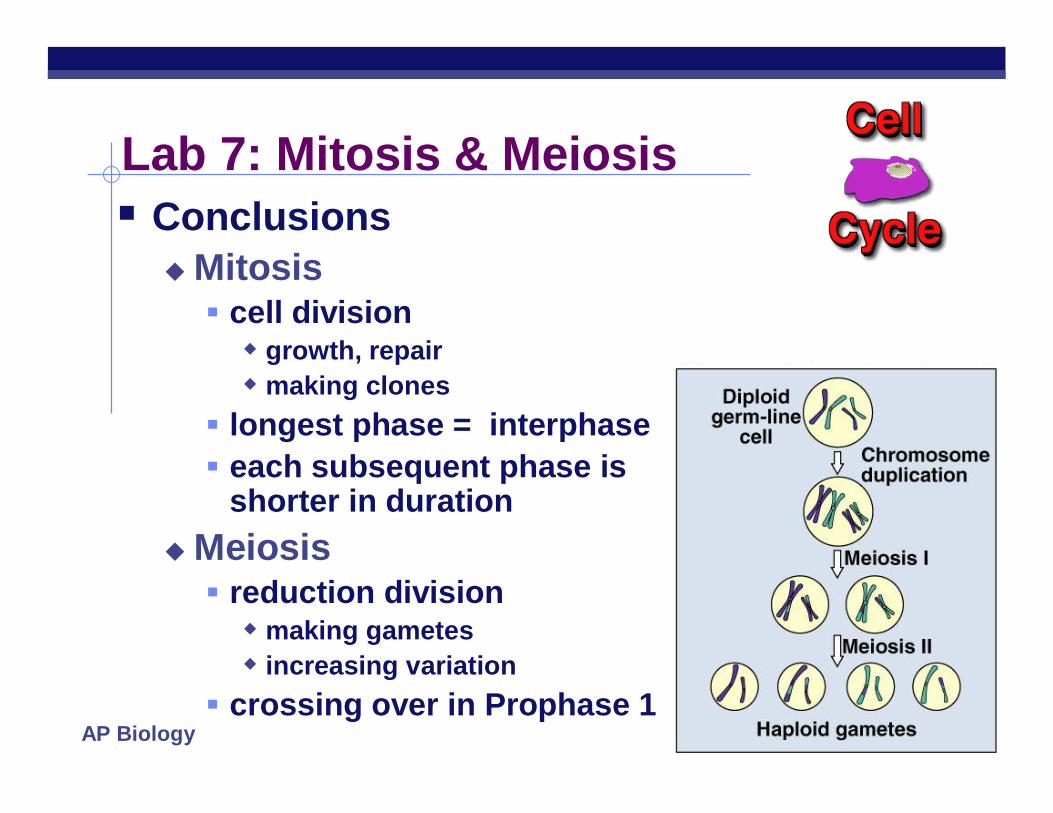
Lab 7: Mitosis & Meiosis Conclusions
Mitosis cell division growth, repairmaking clones
longest phase = interphase each subsequent phase is
shorter in durationMeiosis reduction divisionmaking gametes increasing variation
crossing over in Prophase 1
AP Biology
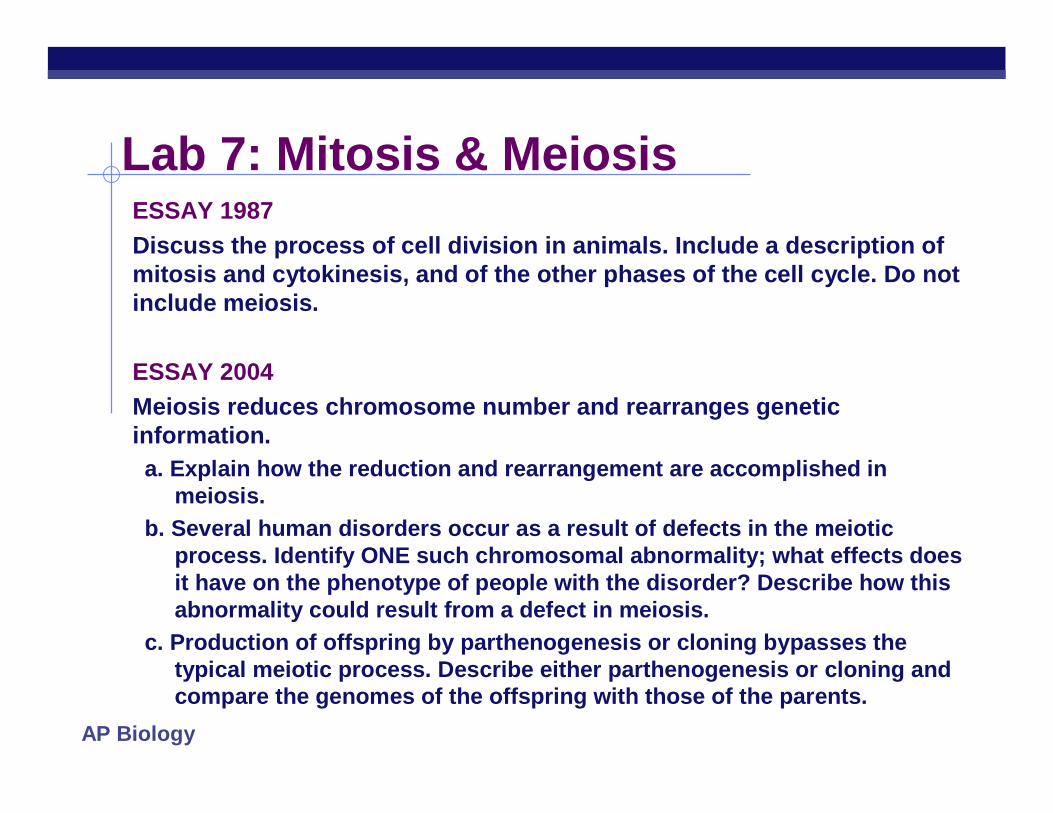
Lab 7: Mitosis & MeiosisESSAY 1987Discuss the process of cell division in animals. Include a description of mitosis and cytokinesis, and of the other phases of the cell cycle. Do not include meiosis.
ESSAY 2004Meiosis reduces chromosome number and rearranges genetic information.a. Explain how the reduction and rearrangement are accomplished in
meiosis.b. Several human disorders occur as a result of defects in the meiotic
process. Identify ONE such chromosomal abnormality; what effects does it have on the phenotype of people with the disorder? Describe how this abnormality could result from a defect in meiosis.
c. Production of offspring by parthenogenesis or cloning bypasses the typical meiotic process. Describe either parthenogenesis or cloning and compare the genomes of the offspring with those of the parents.
AP Biology
Lab 8: Molecular Biology
AP Biology
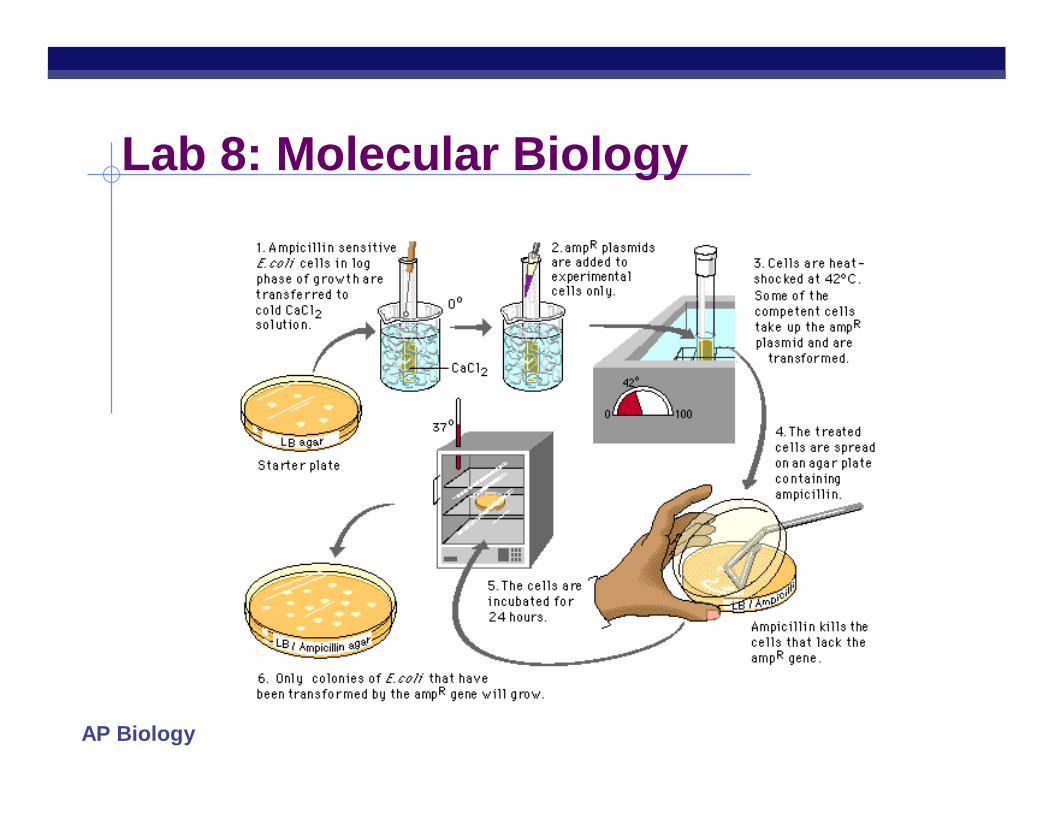
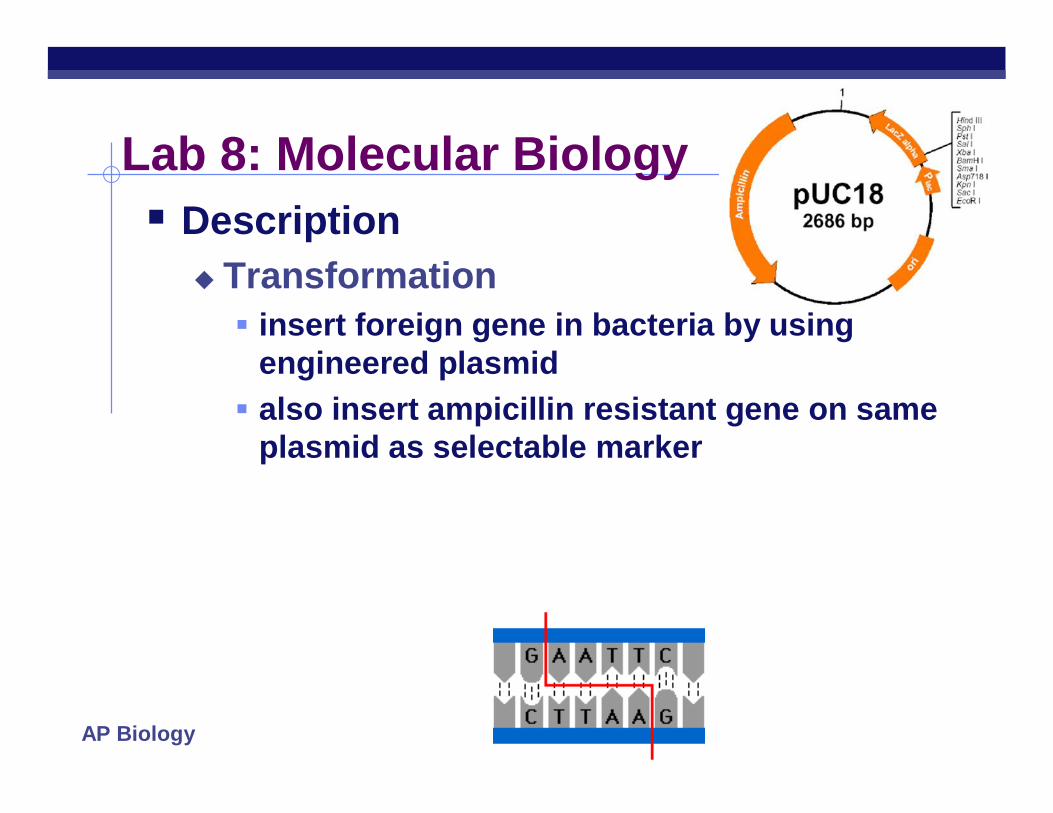
Lab 8: Molecular Biology Description
Transformation insert foreign gene in bacteria by using
engineered plasmid also insert ampicillin resistant gene on same
plasmid as selectable marker
AP Biology
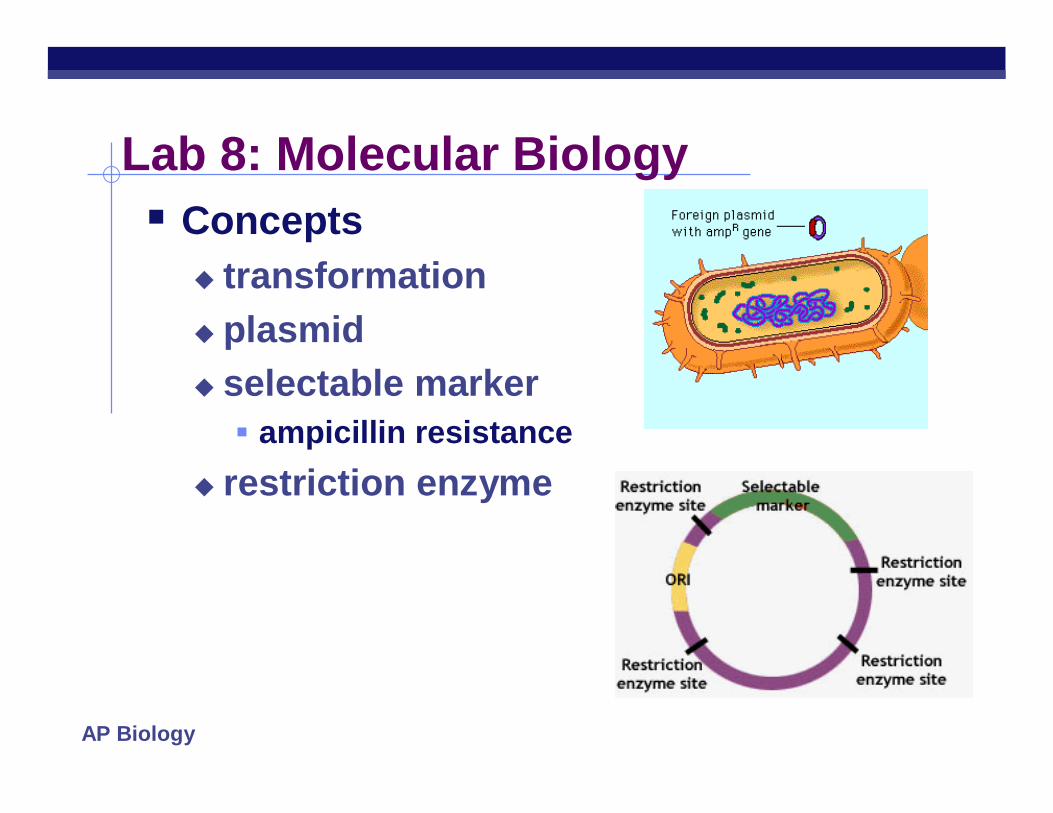
Lab 8: Molecular Biology Concepts
transformation plasmid selectable marker ampicillin resistance
restriction enzyme
AP Biology
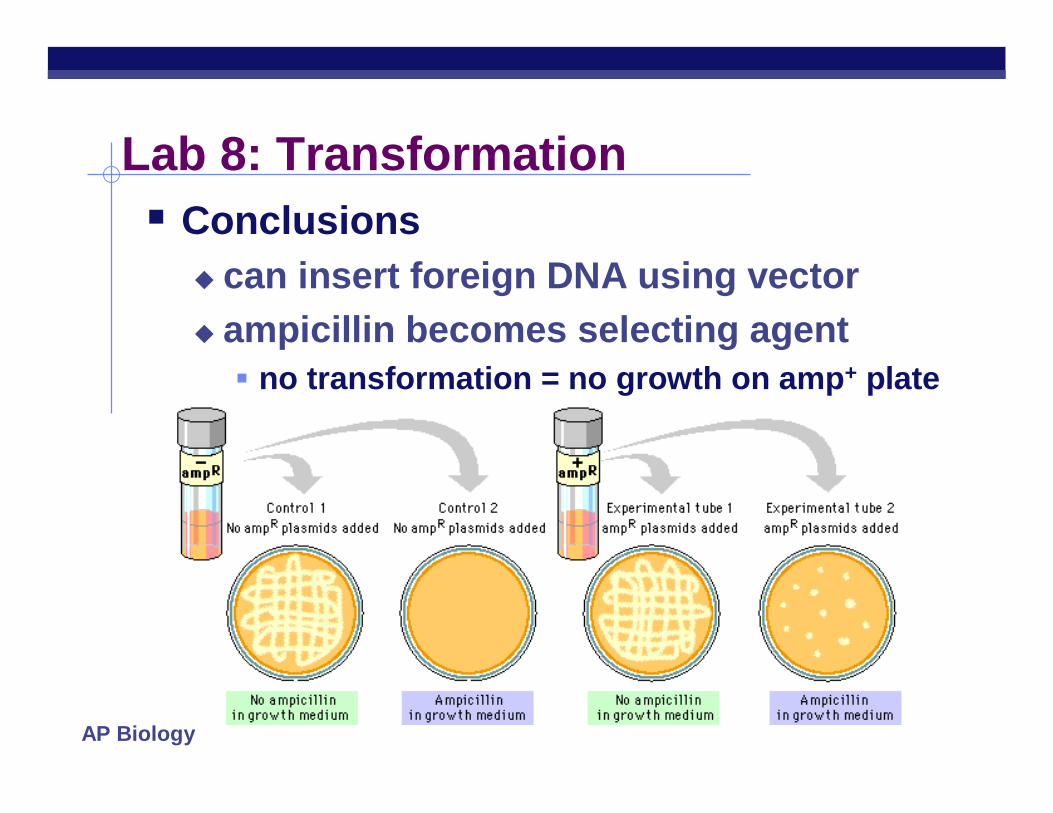
Lab 8: Transformation Conclusions
can insert foreign DNA using vector ampicillin becomes selecting agent no transformation = no growth on amp+ plate
AP Biology
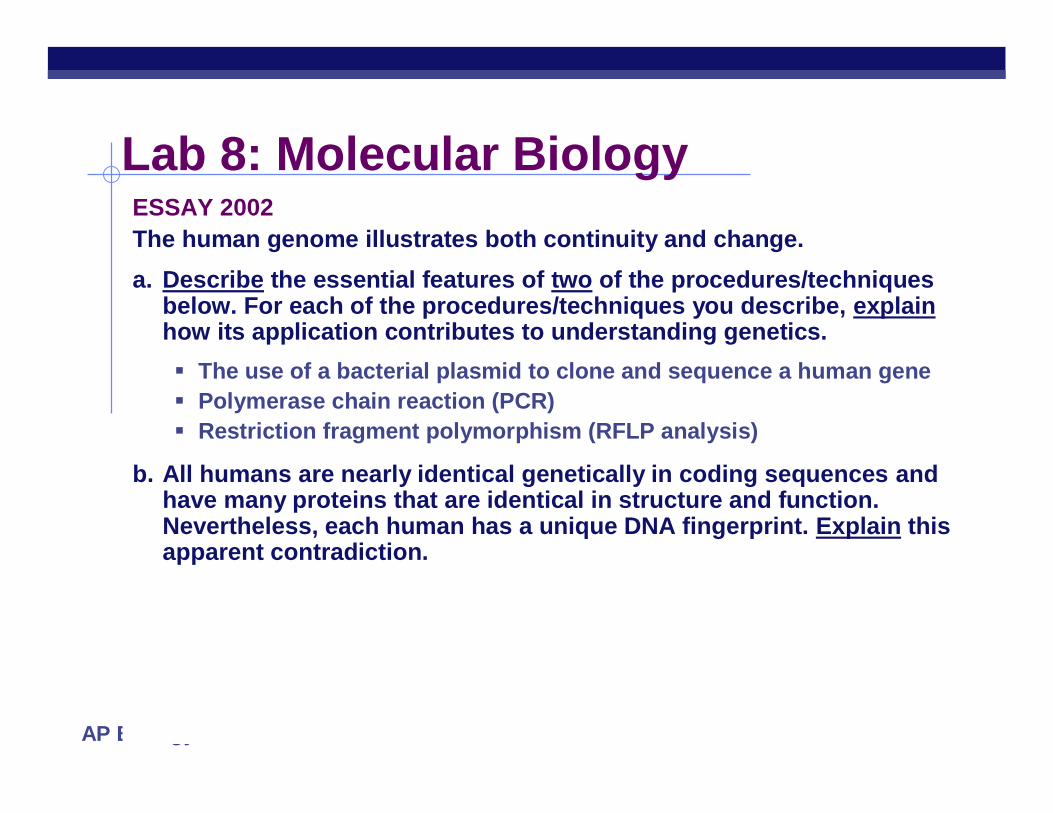
Lab 8: Molecular BiologyESSAY 2002The human genome illustrates both continuity and change.a. Describe the essential features of two of the procedures/techniques
below. For each of the procedures/techniques you describe, explainhow its application contributes to understanding genetics. The use of a bacterial plasmid to clone and sequence a human gene Polymerase chain reaction (PCR) Restriction fragment polymorphism (RFLP analysis)
b. All humans are nearly identical genetically in coding sequences and have many proteins that are identical in structure and function.Nevertheless, each human has a unique DNA fingerprint. Explain this apparent contradiction.
AP Biology
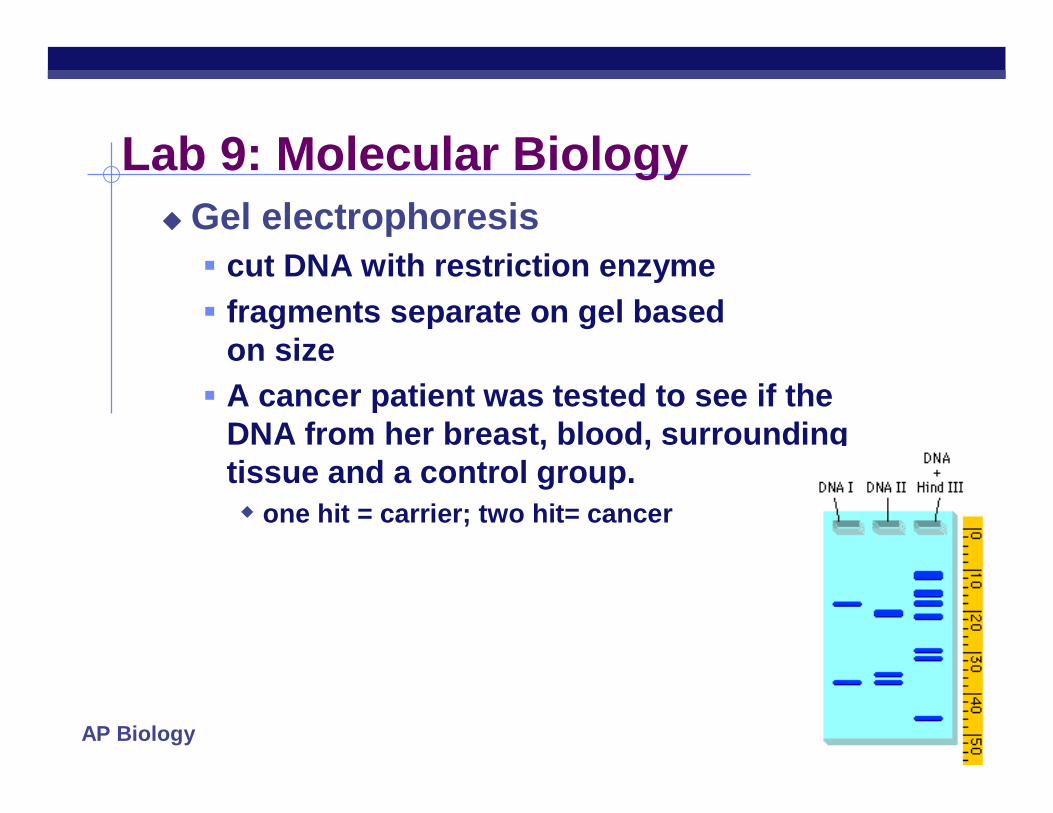
Lab 9: Molecular BiologyGel electrophoresis cut DNA with restriction enzyme fragments separate on gel based
on size A cancer patient was tested to see if the
DNA from her breast, blood, surrounding tissue and a control group. one hit = carrier; two hit= cancer
AP Biology
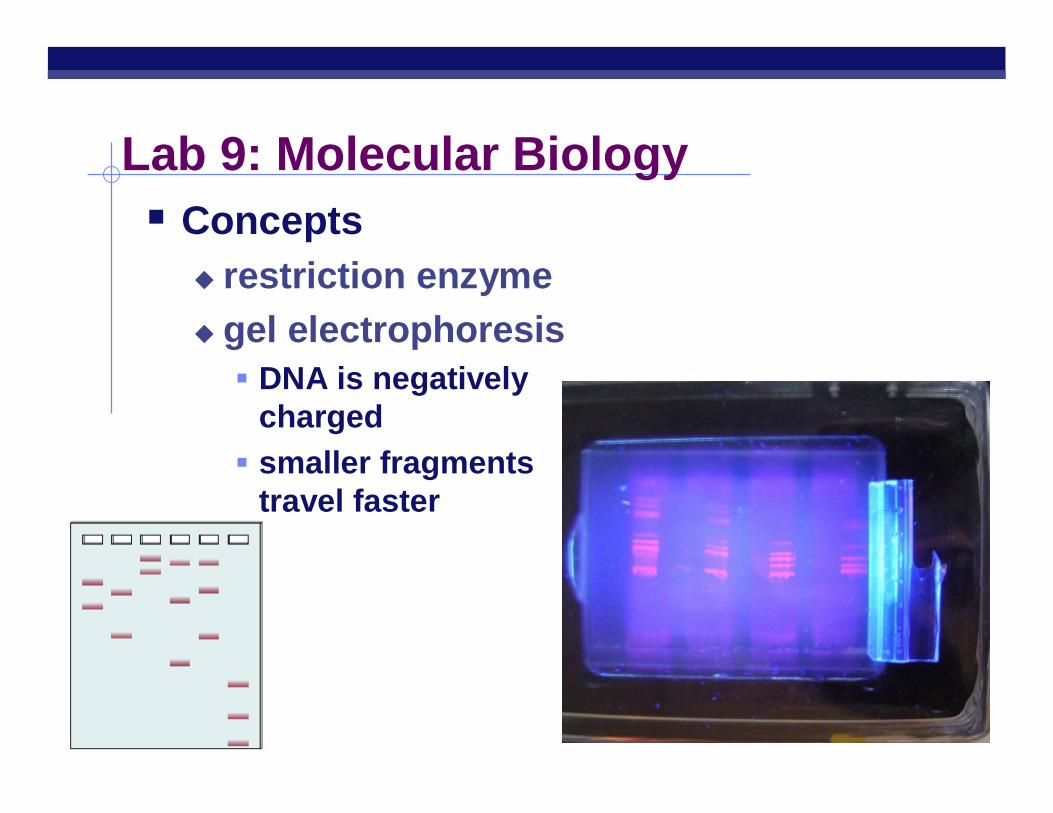
Lab 9: Molecular Biology Concepts
restriction enzyme gel electrophoresis DNA is negatively
charged smaller fragments
travel faster
AP Biology
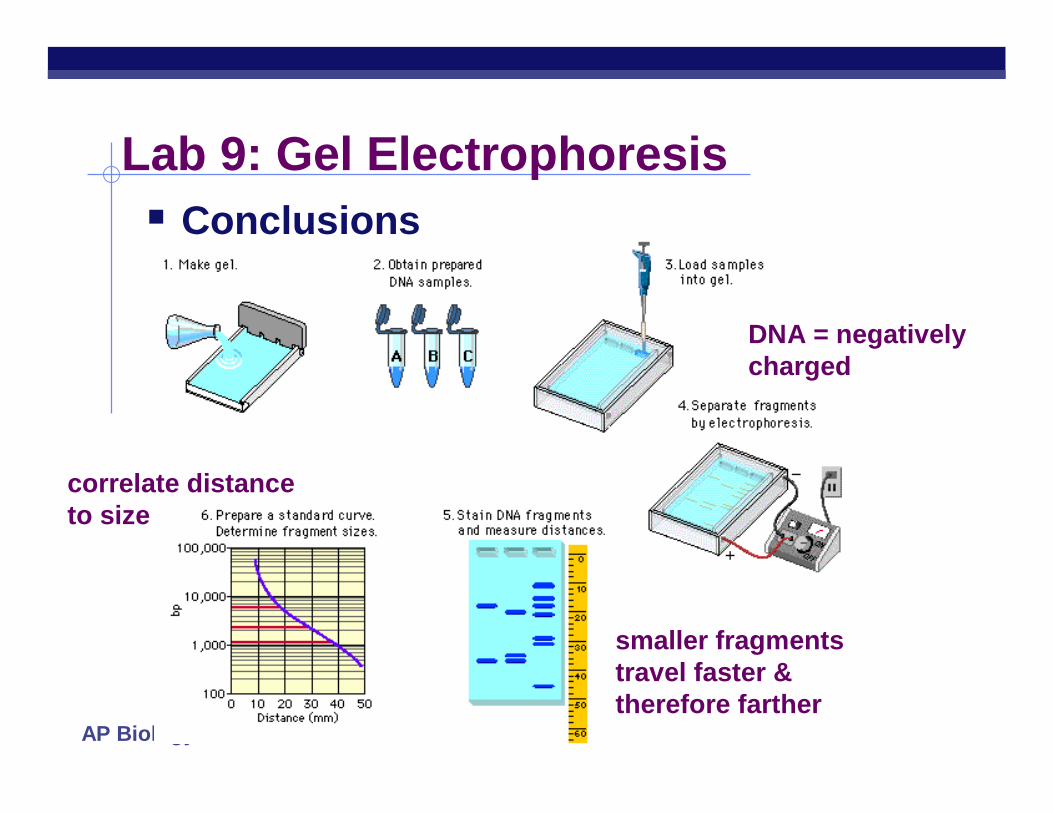
Lab 9: Gel Electrophoresis Conclusions
DNA = negatively charged
smaller fragments travel faster & therefore farther
correlate distance to size
AP Biology
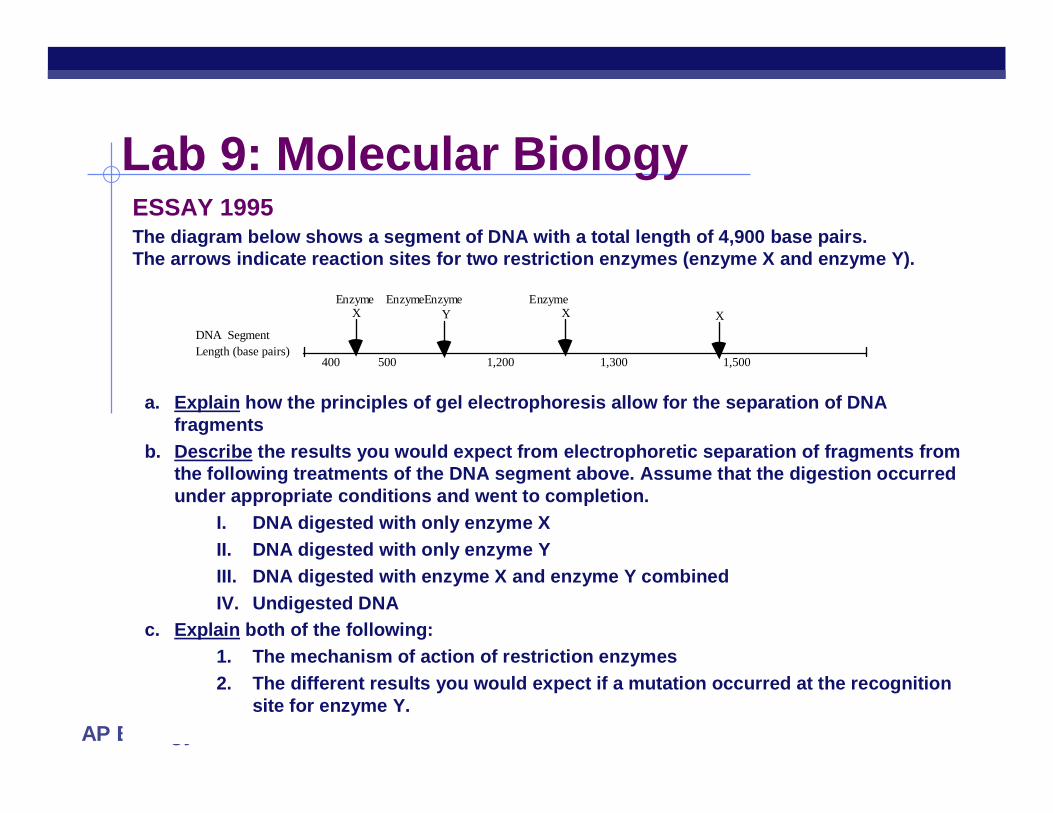
Lab 9: Molecular BiologyESSAY 1995The diagram below shows a segment of DNA with a total length of 4,900 base pairs. The arrows indicate reaction sites for two restriction enzymes (enzyme X and enzyme Y).
a. Explain how the principles of gel electrophoresis allow for the separation of DNA fragments
b. Describe the results you would expect from electrophoretic separation of fragments from the following treatments of the DNA segment above. Assume that the digestion occurred under appropriate conditions and went to completion.
I. DNA digested with only enzyme XII. DNA digested with only enzyme YIII. DNA digested with enzyme X and enzyme Y combinedIV. Undigested DNA
c. Explain both of the following:1. The mechanism of action of restriction enzymes2. The different results you would expect if a mutation occurred at the recognition
site for enzyme Y.
DNA SegmentLength (base pairs)
400 500 1,200 1,300 1,500
X X X Enzyme EnzymeEnzyme Enzyme
Y
AP Biology
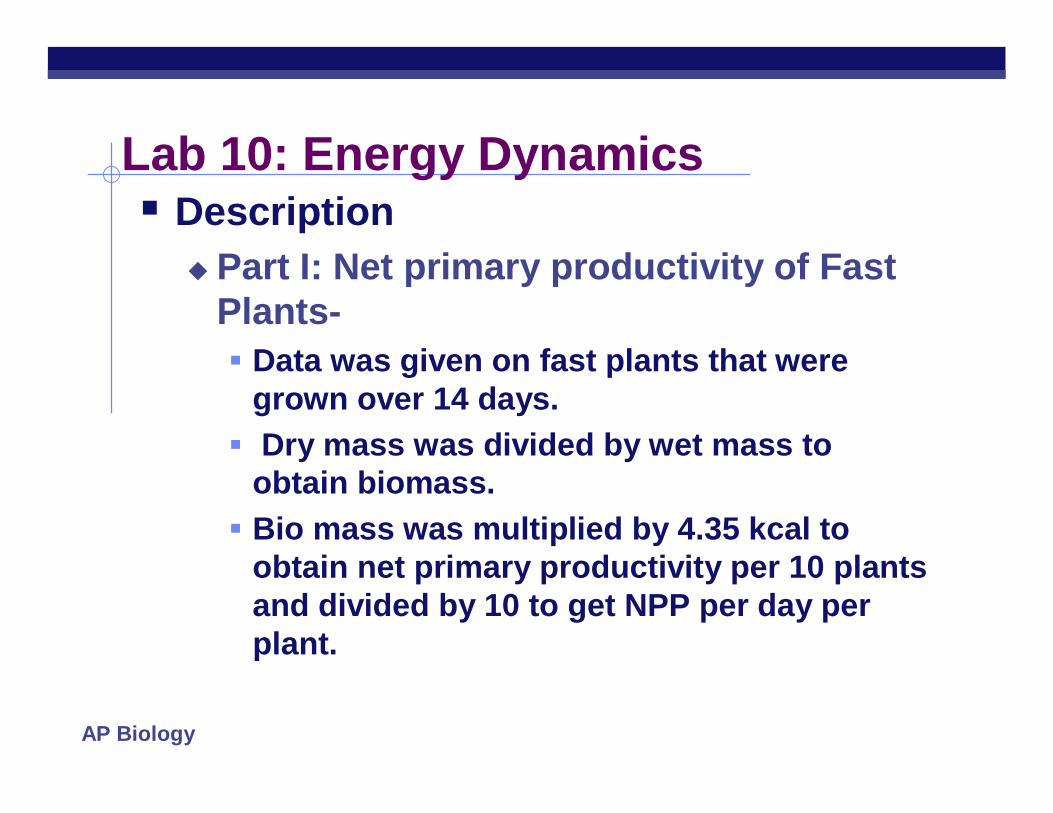
Lab 10: Energy Dynamics Description
Part I: Net primary productivity of Fast Plants- Data was given on fast plants that were
grown over 14 days. Dry mass was divided by wet mass to
obtain biomass. Bio mass was multiplied by 4.35 kcal to
obtain net primary productivity per 10 plants and divided by 10 to get NPP per day per plant.
AP Biology
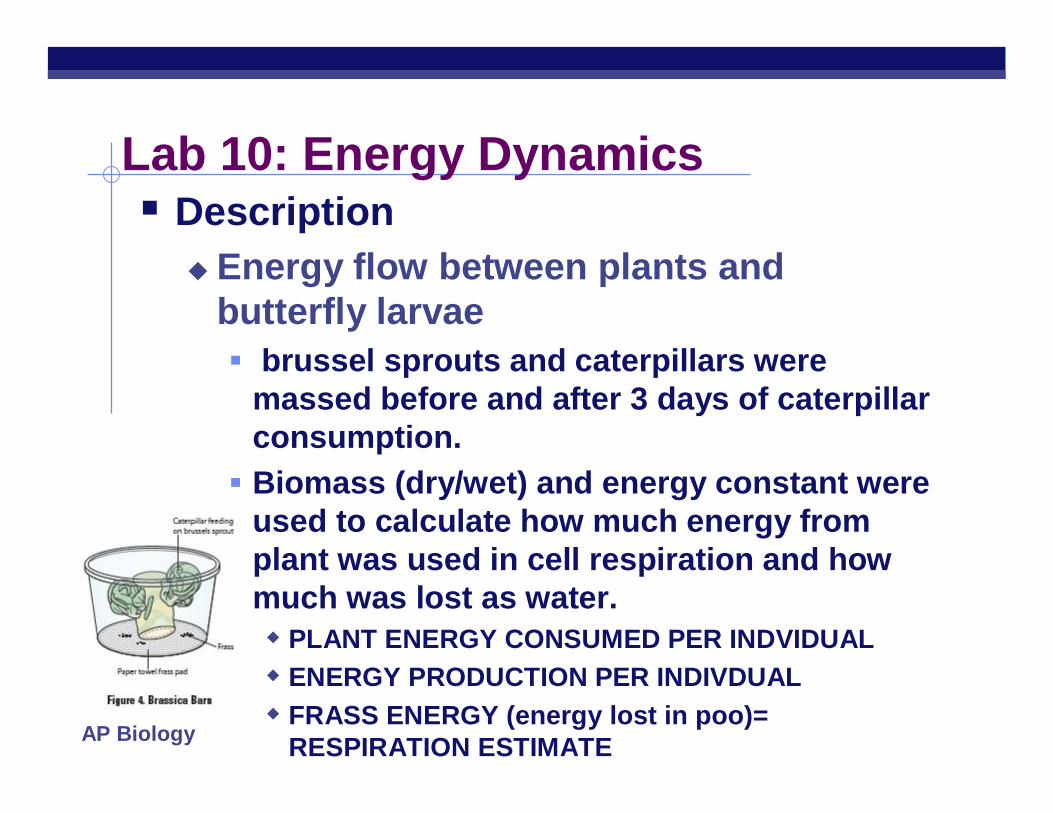
Lab 10: Energy Dynamics Description
Energy flow between plants and butterfly larvae brussel sprouts and caterpillars were
massed before and after 3 days of caterpillar consumption. Biomass (dry/wet) and energy constant were
used to calculate how much energy from plant was used in cell respiration and how much was lost as water. PLANT ENERGY CONSUMED PER INDVIDUAL ENERGY PRODUCTION PER INDIVDUAL FRASS ENERGY (energy lost in poo)=
RESPIRATION ESTIMATE
AP Biology
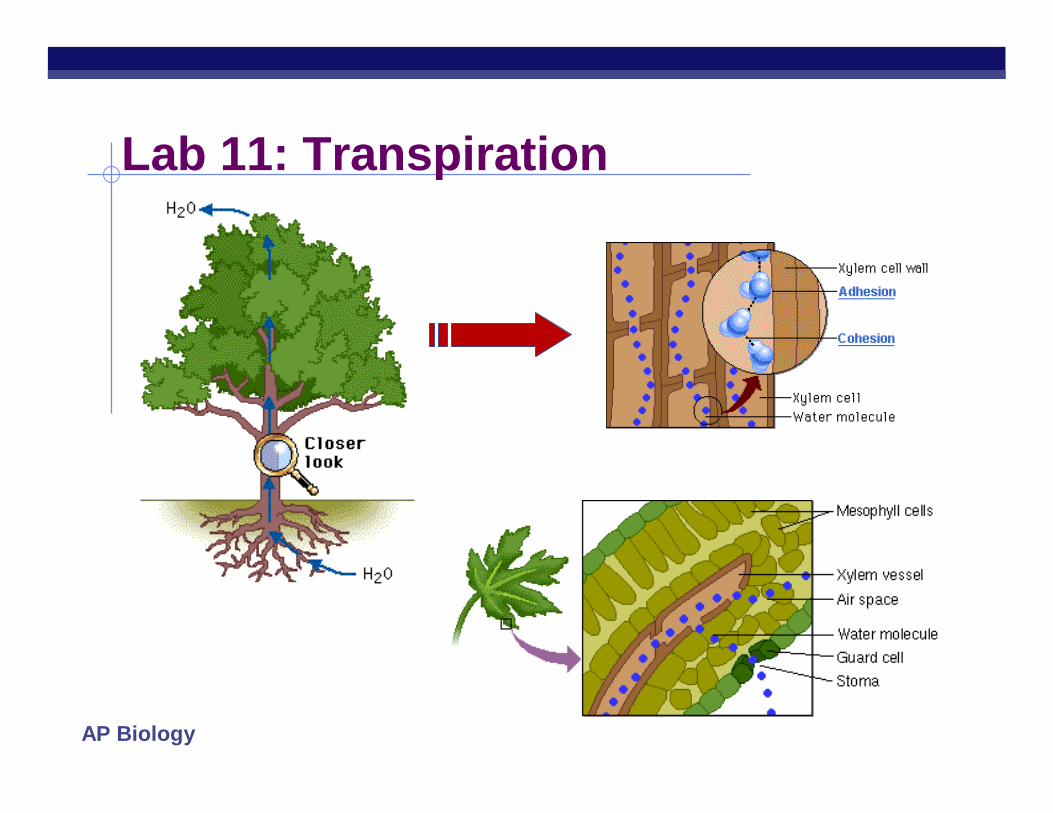
Lab 11: Transpiration
AP Biology
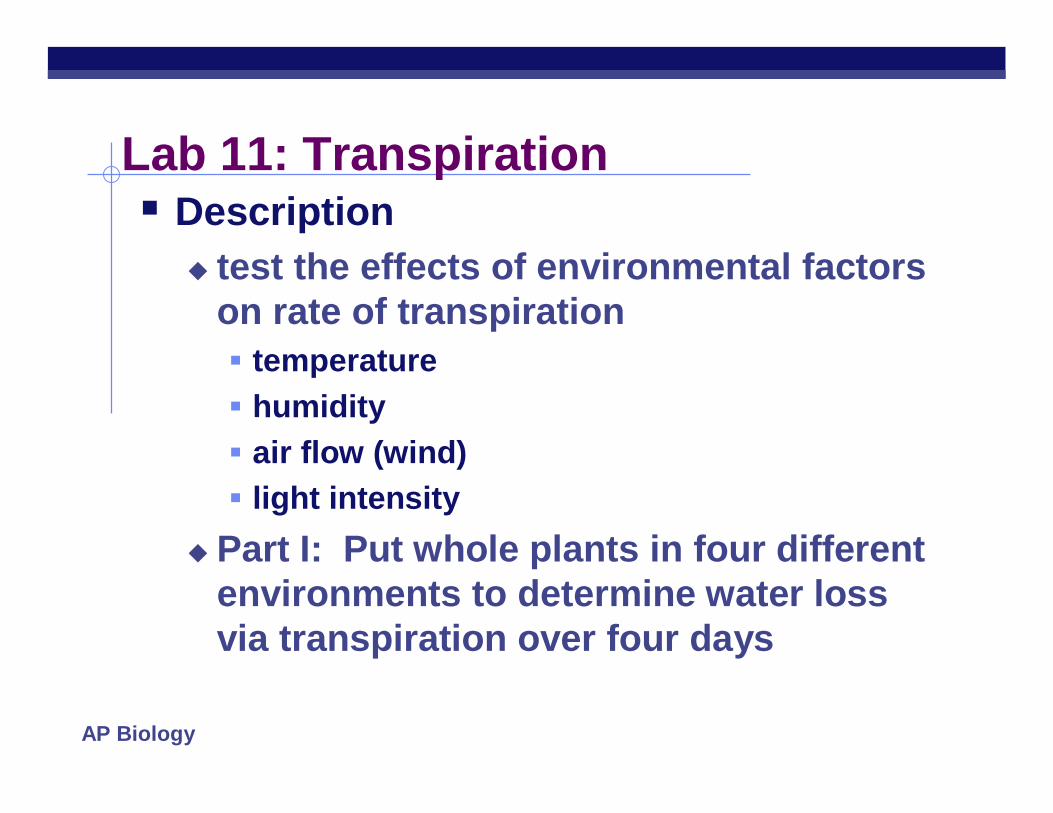
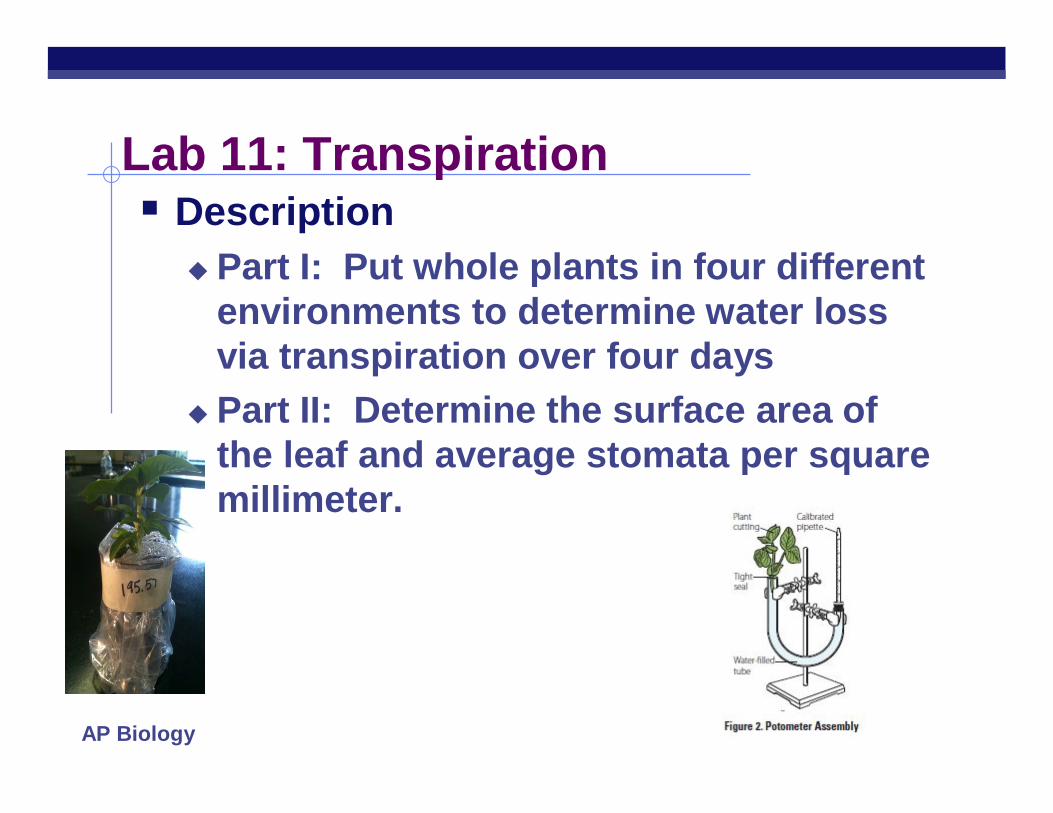
Lab 11: Transpiration Description
test the effects of environmental factors on rate of transpiration temperature humidity air flow (wind) light intensity
Part I: Put whole plants in four different environments to determine water loss via transpiration over four days
AP Biology
Lab 11: Transpiration Description
Part I: Put whole plants in four different environments to determine water loss via transpiration over four days
Part II: Determine the surface area of the leaf and average stomata per square millimeter.
AP Biology
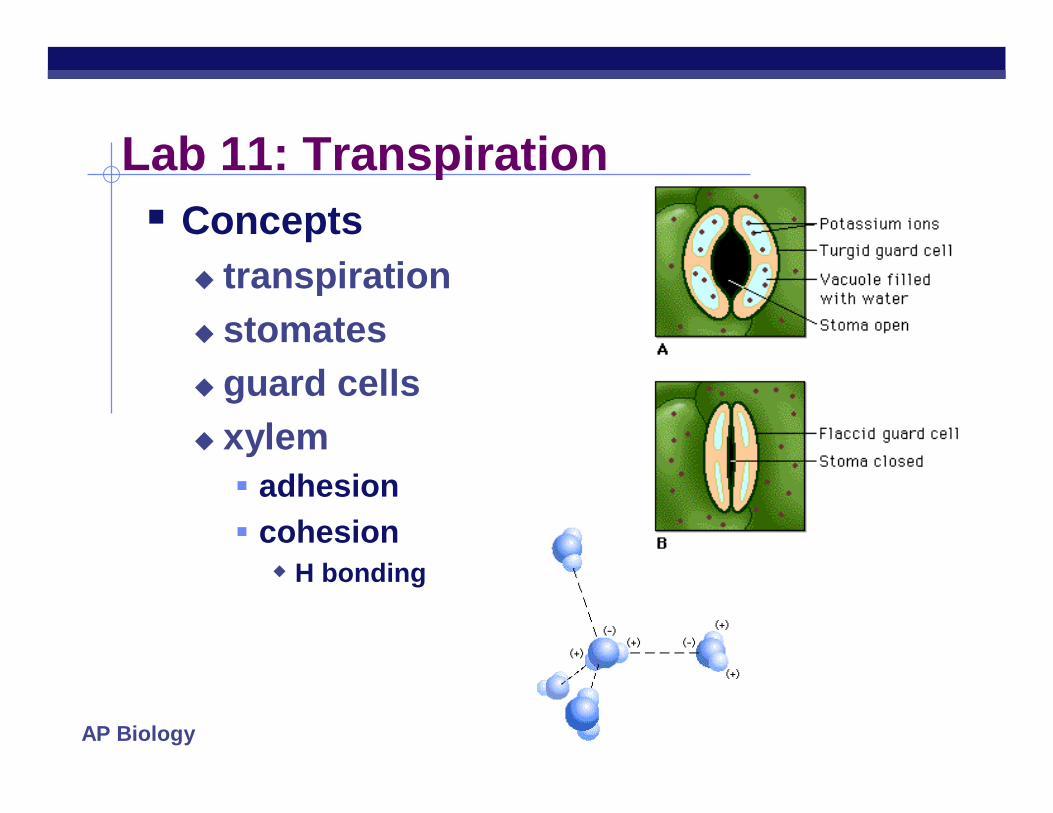
Lab 11: Transpiration Concepts
transpiration stomates guard cells xylem adhesion cohesion H bonding
AP Biology
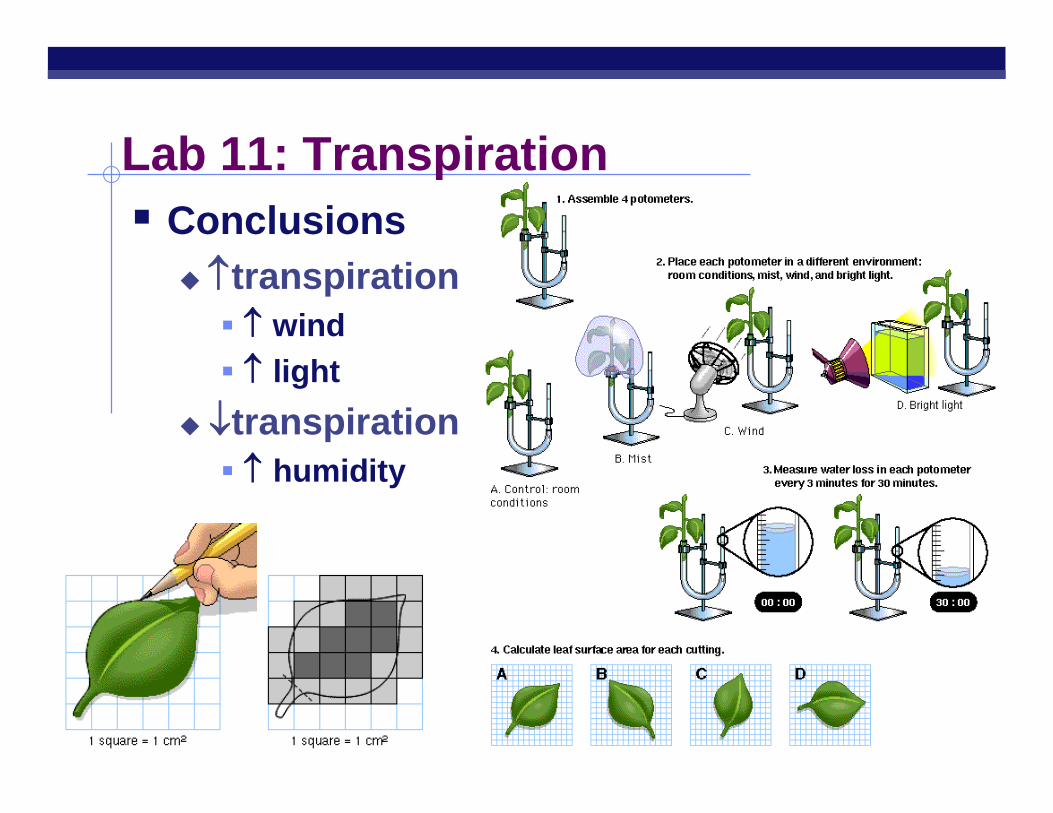
Lab 11: Transpiration Conclusions
transpiration wind light
transpiration humidity
AP Biology
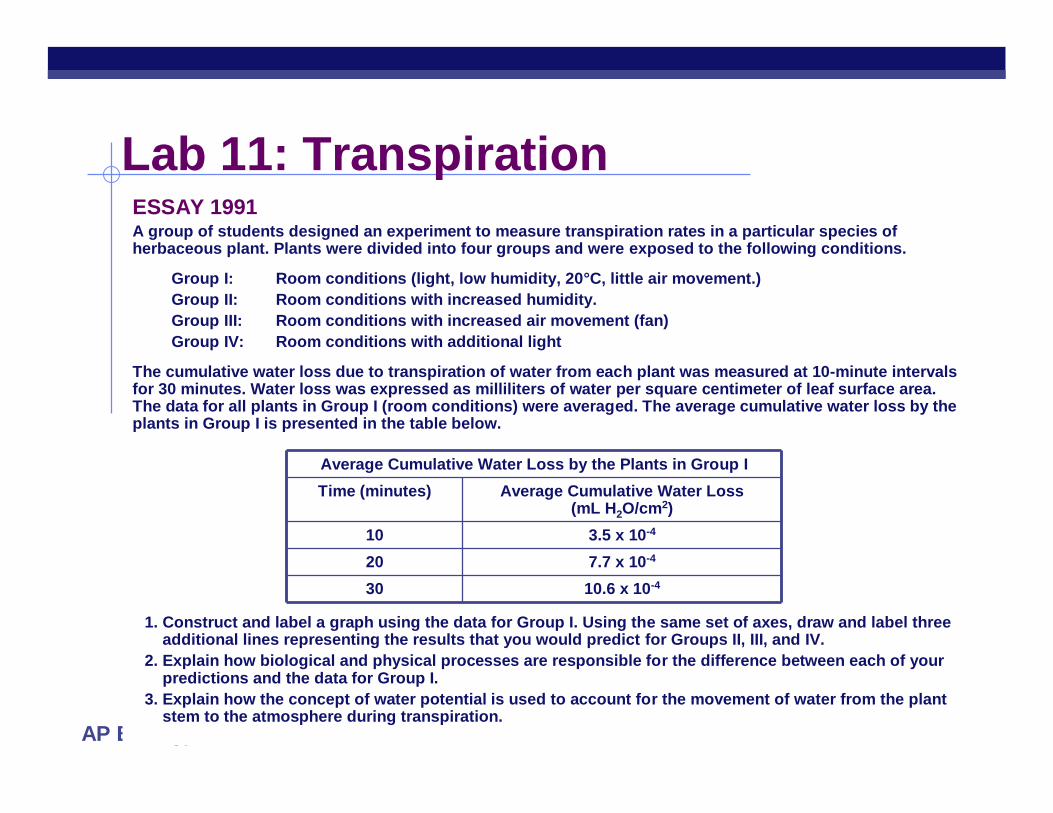
Lab 11: TranspirationESSAY 1991A group of students designed an experiment to measure transpiration rates in a particular species of herbaceous plant. Plants were divided into four groups and were exposed to the following conditions.
Group I: Room conditions (light, low humidity, 20°C, little air movement.)Group II: Room conditions with increased humidity.Group III: Room conditions with increased air movement (fan)Group IV: Room conditions with additional light
The cumulative water loss due to transpiration of water from each plant was measured at 10-minute intervals for 30 minutes. Water loss was expressed as milliliters of water per square centimeter of leaf surface area. The data for all plants in Group I (room conditions) were averaged. The average cumulative water loss by the plants in Group I is presented in the table below.
1. Construct and label a graph using the data for Group I. Using the same set of axes, draw and label three additional lines representing the results that you would predict for Groups II, III, and IV.
2. Explain how biological and physical processes are responsible for the difference between each of your predictions and the data for Group I.
3. Explain how the concept of water potential is used to account for the movement of water from the plant stem to the atmosphere during transpiration.
Average Cumulative Water Loss by the Plants in Group ITime (minutes) Average Cumulative Water Loss
(mL H2O/cm2)10 3.5 x 10⁻⁴
20 7.7 x 10⁻⁴
30 10.6 x 10⁻⁴

AP Biology
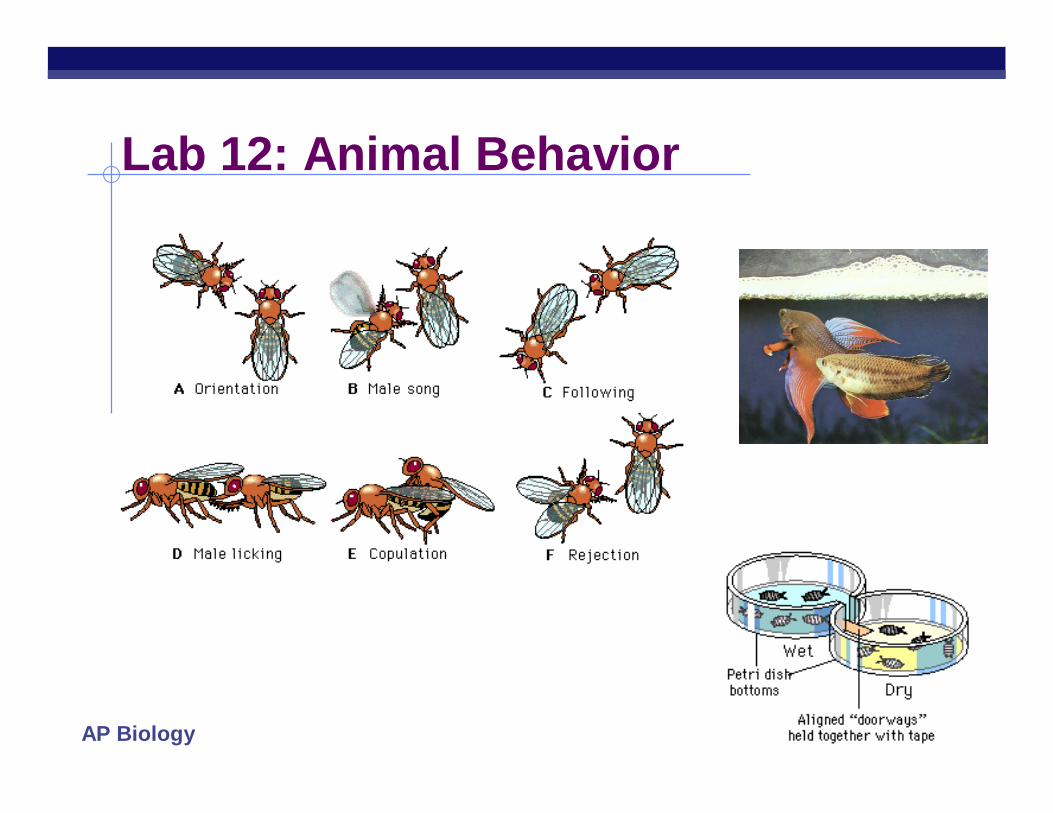
Lab 12: Animal Behavior Description
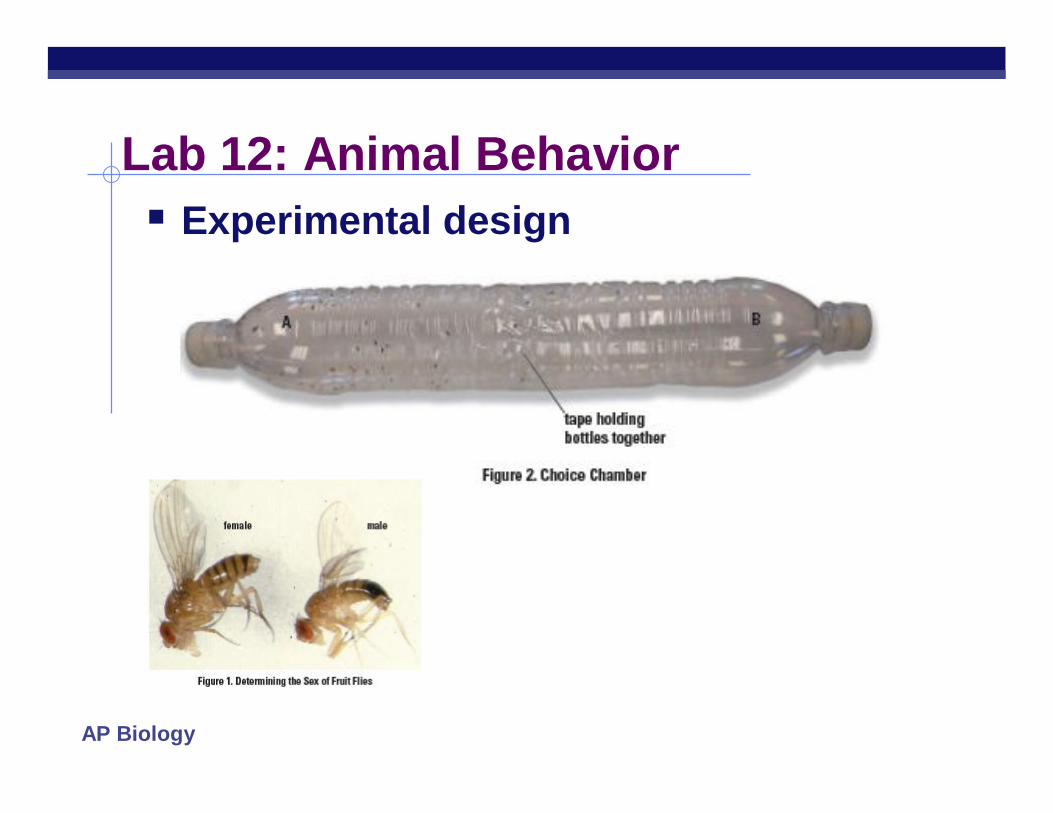
set up an experiment to study behavior in an organism Betta fish agonistic behavior Drosophila mating behavior pillbug kinesis
AP Biology
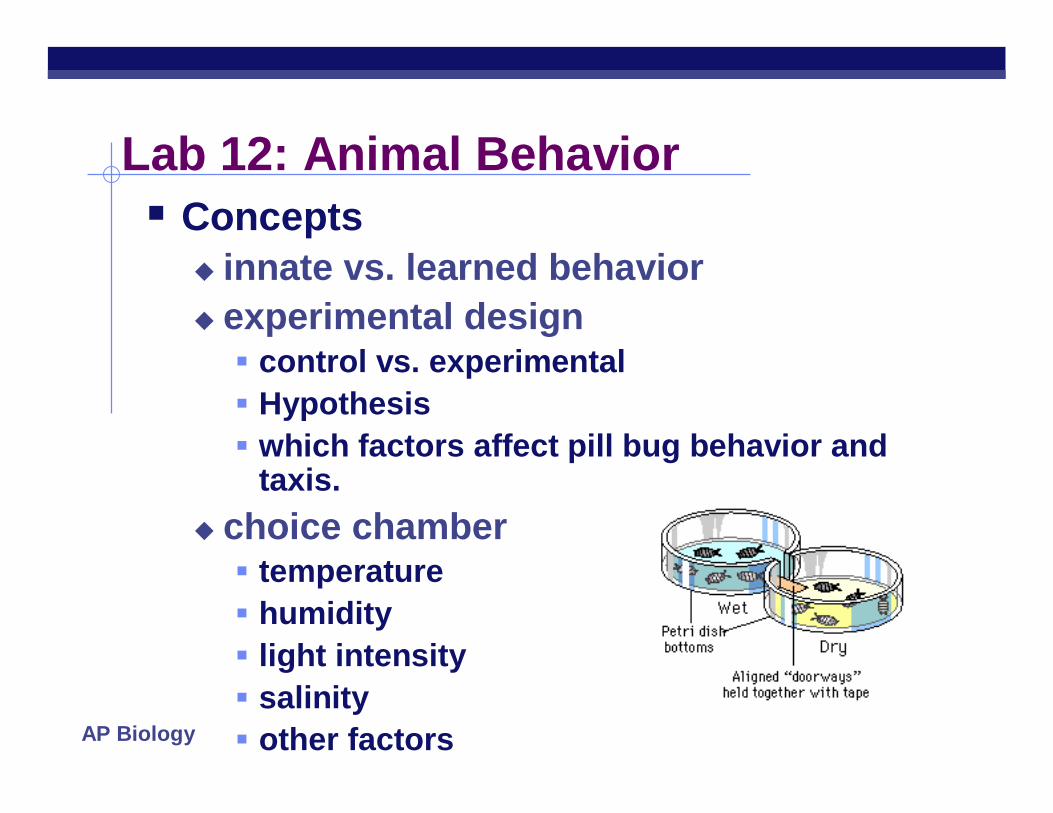
Lab 12: Animal Behavior Concepts
innate vs. learned behavior experimental design control vs. experimental Hypothesis which factors affect pill bug behavior and
taxis. choice chamber temperature humidity light intensity salinity other factors
AP Biology
Lab 12: Animal Behavior Hypothesis development
Poor:I think pillbugs will move toward the wet side of a choice chamber.
Better:If pillbugs prefer a moist environment, then when they are randomly placed on both sides of a wet/dry choice chamber and allowed to move about freely for 10 minutes, most will be found on the wet side.
AP Biology
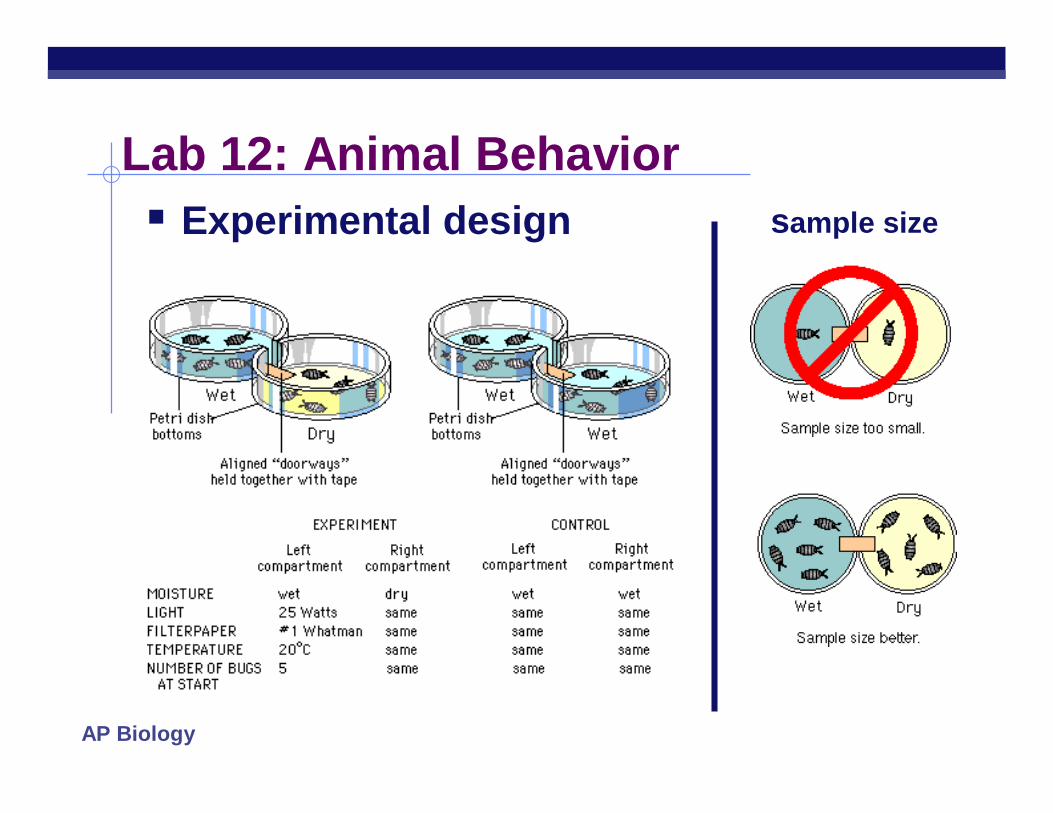
Lab 12: Animal Behavior Experimental design sample size
AP Biology
Lab 12: Animal Behavior Experimental design
AP Biology
Lab 12: Animal Behavior
AP Biology
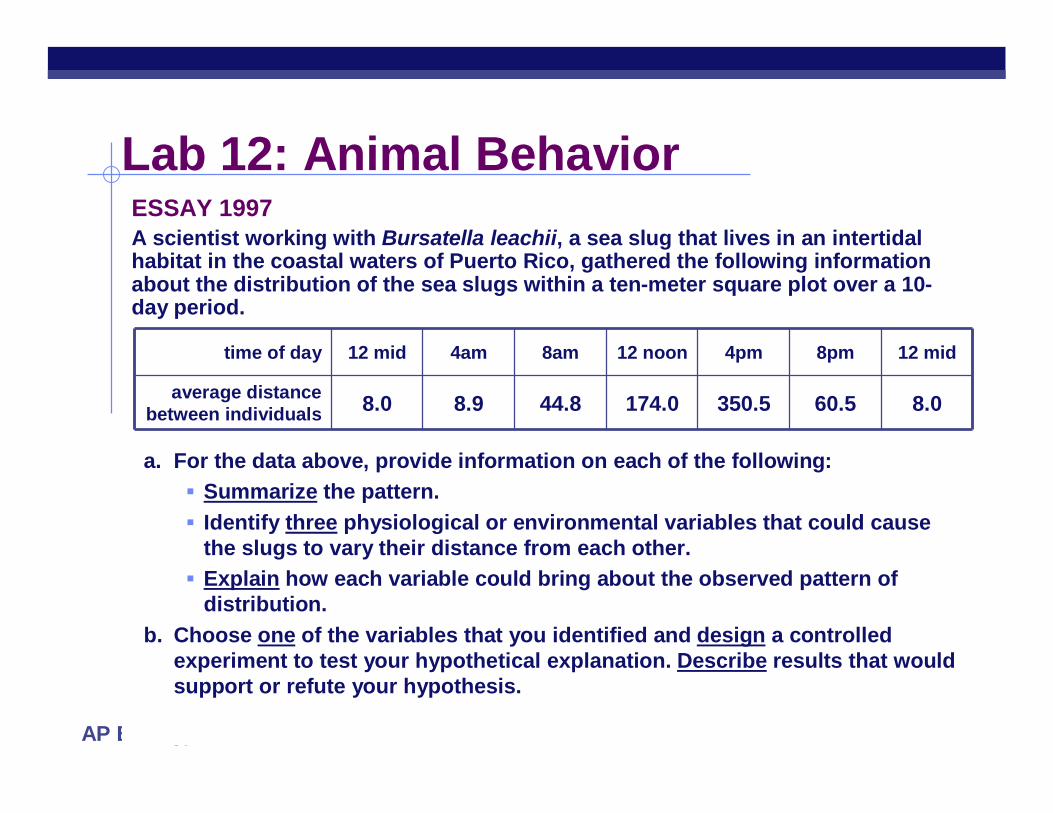
Lab 12: Animal BehaviorESSAY 1997A scientist working with Bursatella leachii, a sea slug that lives in an intertidal habitat in the coastal waters of Puerto Rico, gathered the following information about the distribution of the sea slugs within a ten-meter square plot over a 10-day period.
a. For the data above, provide information on each of the following: Summarize the pattern. Identify three physiological or environmental variables that could cause
the slugs to vary their distance from each other. Explain how each variable could bring about the observed pattern of
distribution.b. Choose one of the variables that you identified and design a controlled
experiment to test your hypothetical explanation. Describe results that would support or refute your hypothesis.
time of day 12 mid 4am 8am 12 noon 4pm 8pm 12 mid
average distance between individuals 8.0 8.9 44.8 174.0 350.5 60.5 8.0
AP Biology
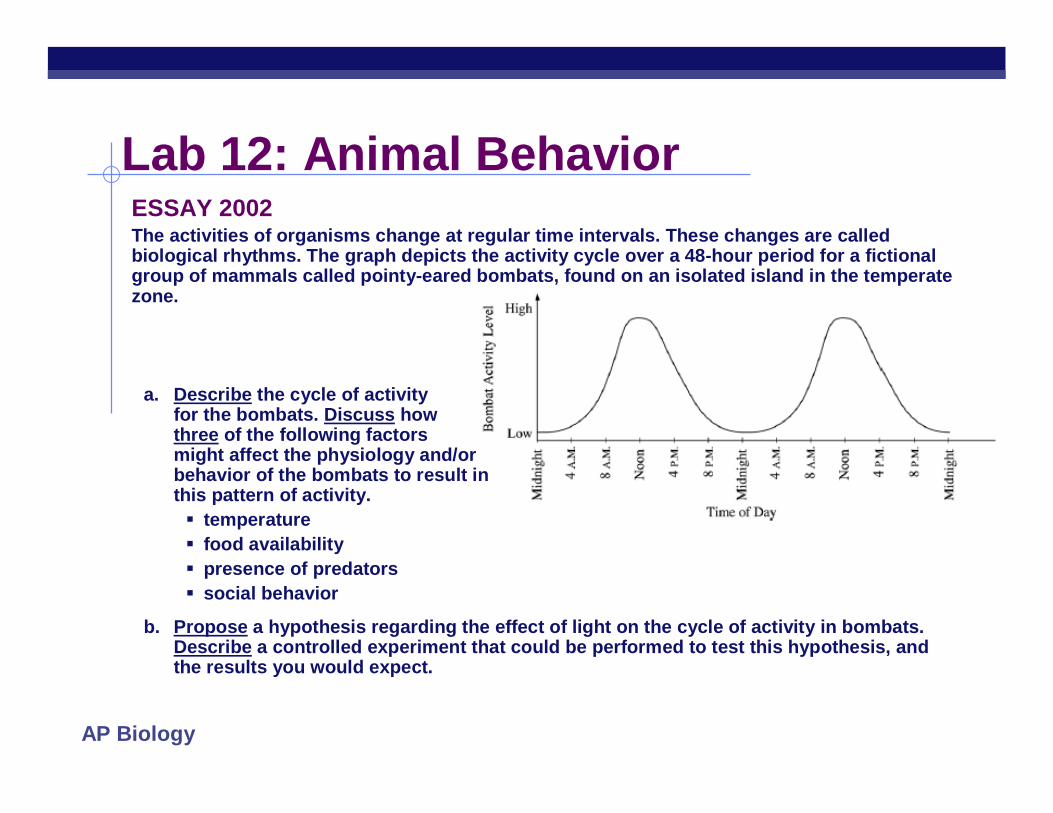
Lab 12: Animal BehaviorESSAY 2002The activities of organisms change at regular time intervals. These changes are called biological rhythms. The graph depicts the activity cycle over a 48-hour period for a fictional group of mammals called pointy-eared bombats, found on an isolated island in the temperate zone.
a. Describe the cycle of activity for the bombats. Discuss how three of the following factors might affect the physiology and/or behavior of the bombats to result in this pattern of activity. temperature food availability presence of predators social behavior
b. Propose a hypothesis regarding the effect of light on the cycle of activity in bombats. Describe a controlled experiment that could be performed to test this hypothesis, and the results you would expect.
AP Biology
Lab : Circulatory Physiology

AP Biology
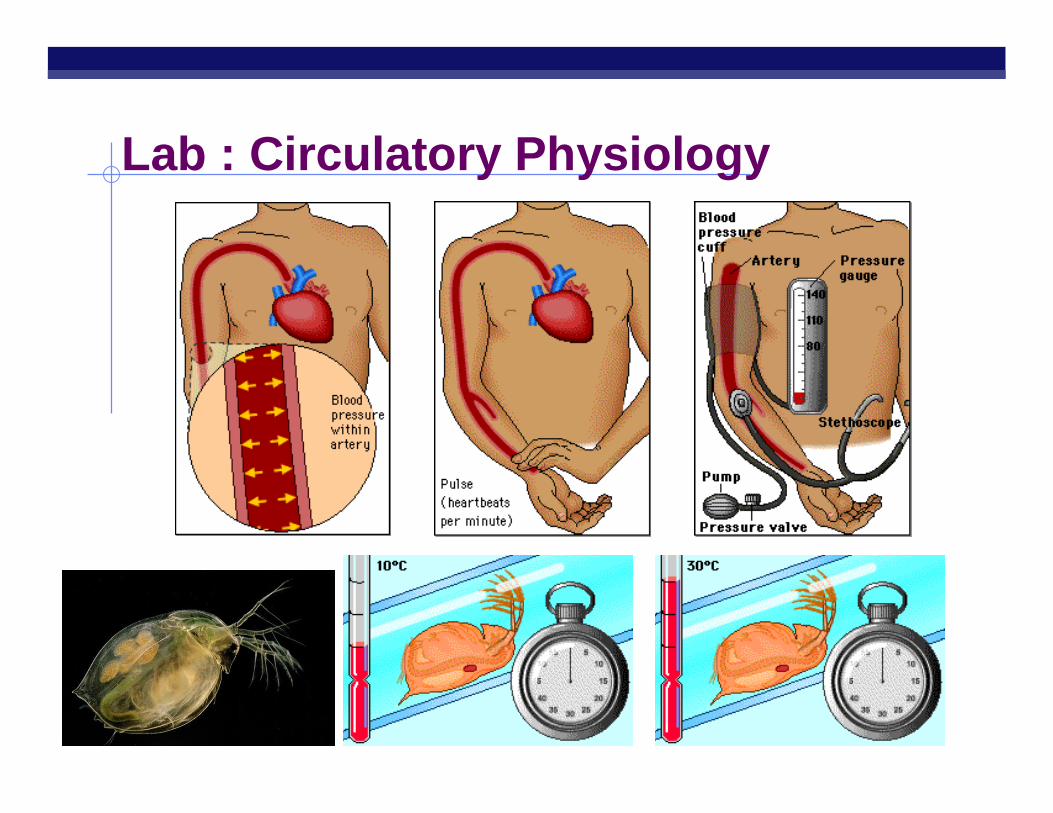
Lab : Circulatory Physiology Description
study factors that affect heart rate body position level of activity
determine whether an organism is an endotherm or an ectotherm by measuring change in pulse rate as temperature changes Daphnia
AP Biology
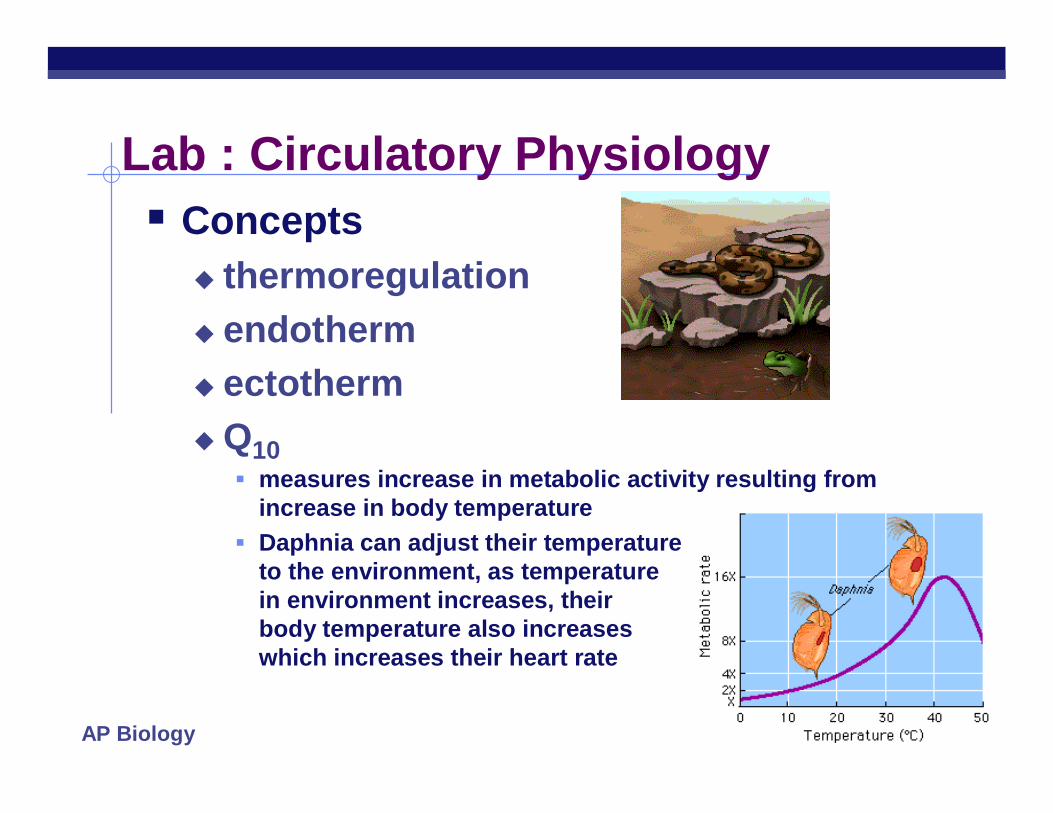
Lab : Circulatory Physiology Concepts
thermoregulation endotherm ectothermQ10
measures increase in metabolic activity resulting from increase in body temperature
Daphnia can adjust their temperature to the environment, as temperature in environment increases, their body temperature also increases which increases their heart rate
AP Biology
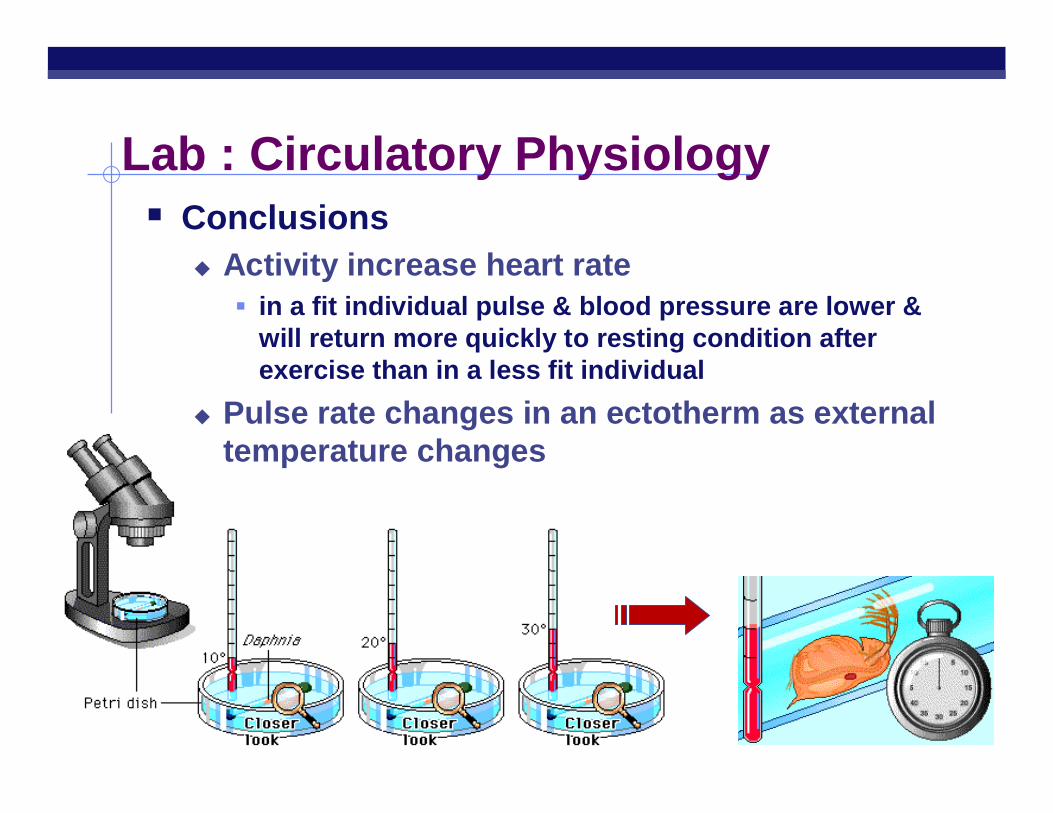
Lab : Circulatory Physiology Conclusions
Activity increase heart rate in a fit individual pulse & blood pressure are lower &
will return more quickly to resting condition after exercise than in a less fit individual
Pulse rate changes in an ectotherm as external temperature changes
AP Biology
Lab 13: Enzyme Catalysis
AP Biology
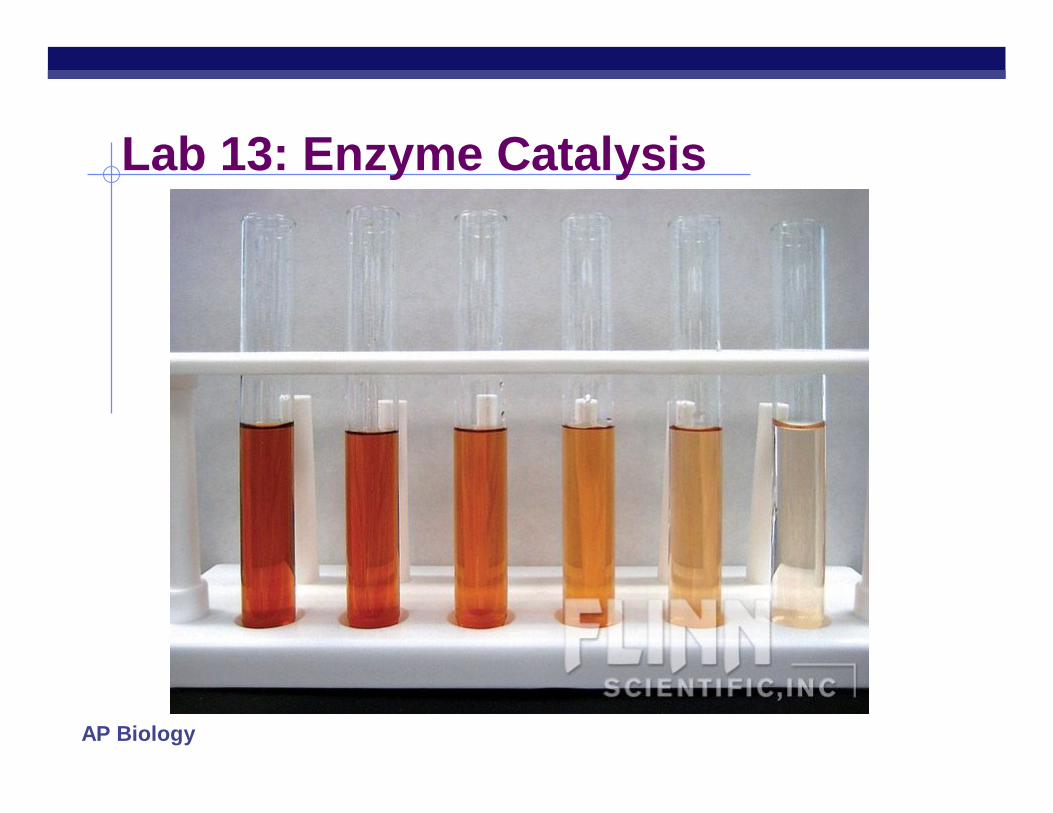
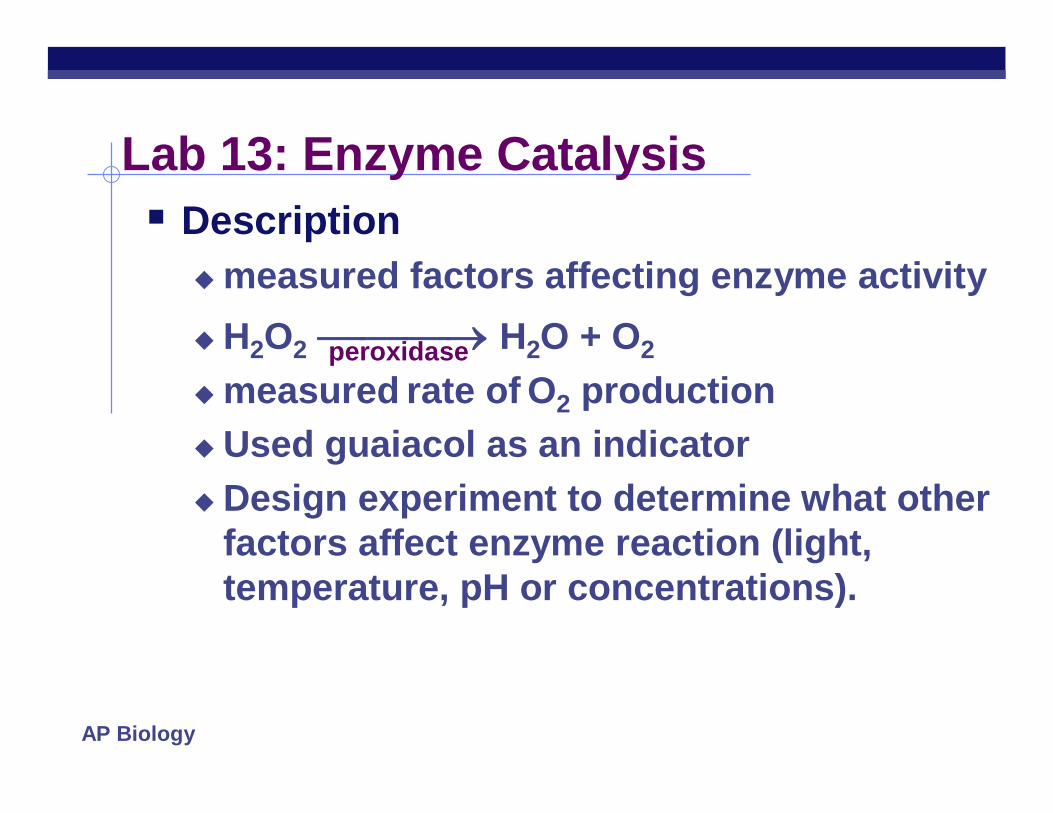
Lab 13: Enzyme Catalysis Description
measured factors affecting enzyme activityH2O2 H2O + O2
measured rate of O2 productionUsed guaiacol as an indicatorDesign experiment to determine what other
factors affect enzyme reaction (light, temperature, pH or concentrations).
peroxidase
AP Biology
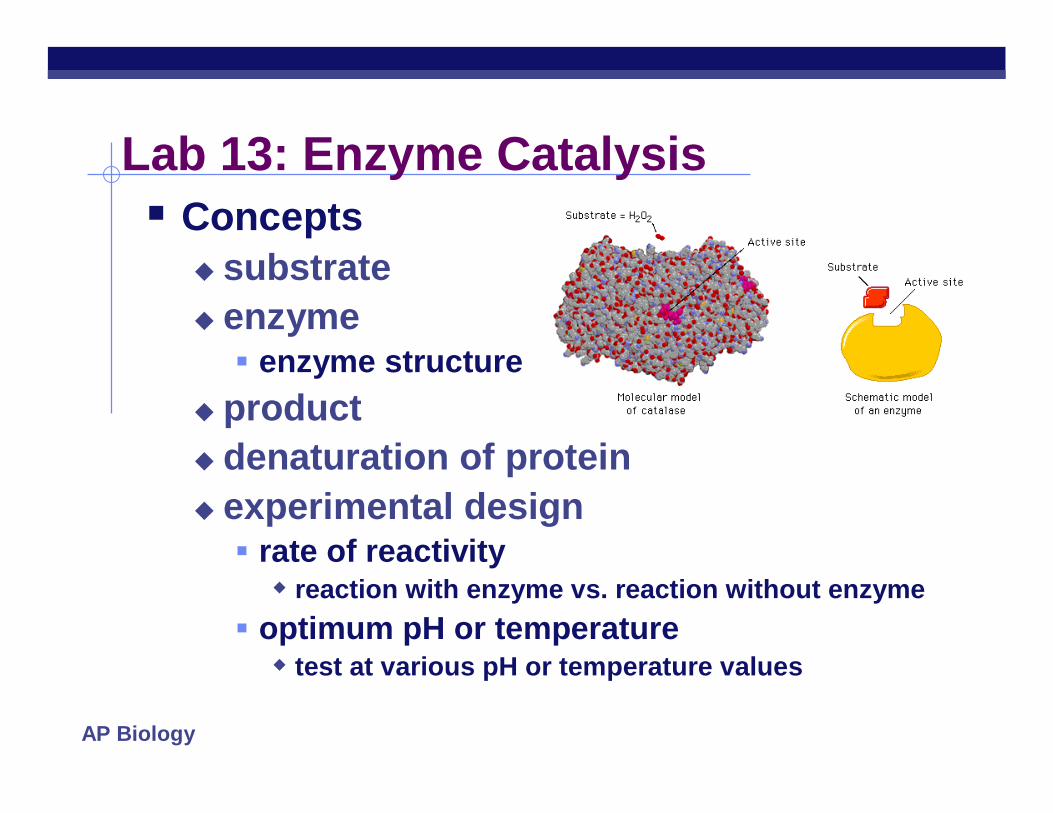
Lab 13: Enzyme Catalysis Concepts
substrate enzyme enzyme structure
product denaturation of protein experimental design rate of reactivity reaction with enzyme vs. reaction without enzyme
optimum pH or temperature test at various pH or temperature values
AP Biology
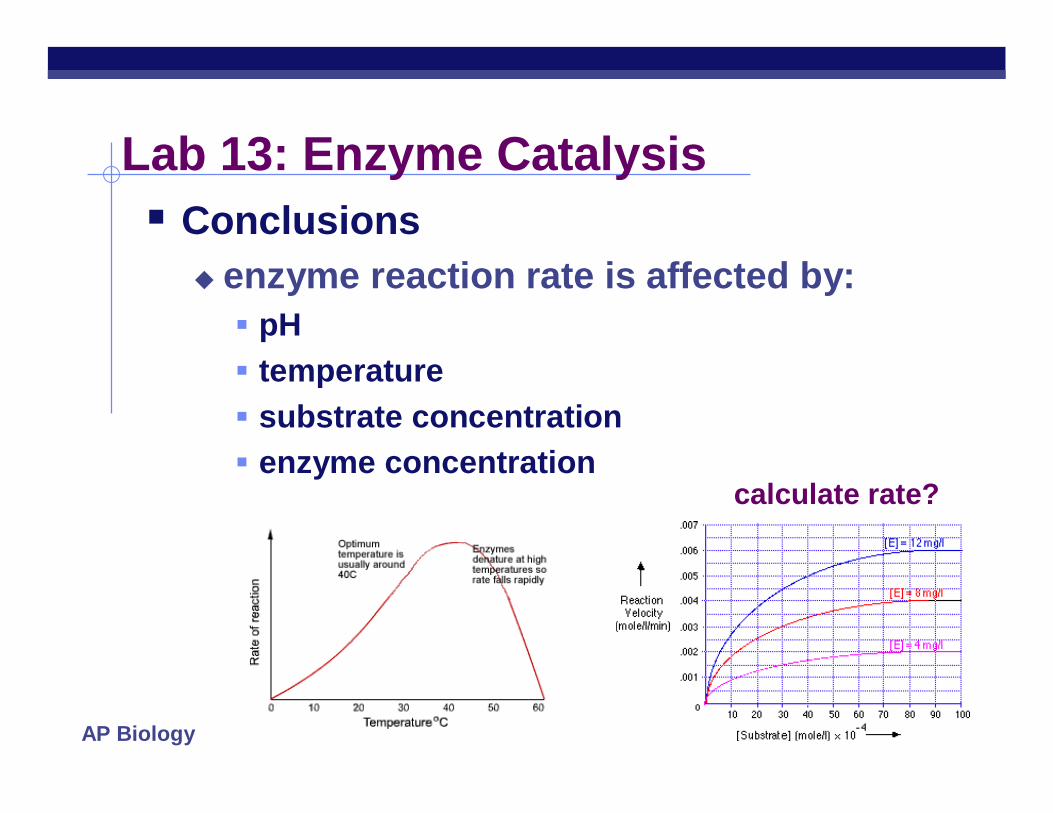
Lab 13: Enzyme Catalysis Conclusions
enzyme reaction rate is affected by: pH temperature substrate concentration enzyme concentration
calculate rate?
AP Biology
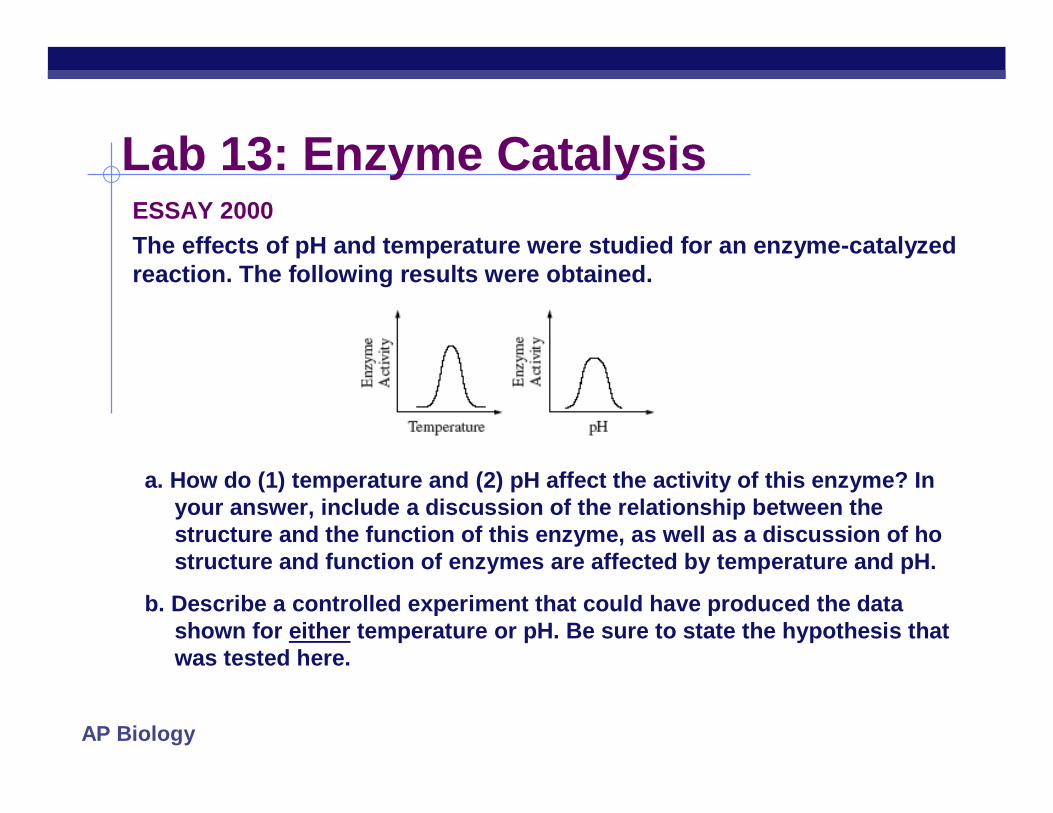
ESSAY 2000The effects of pH and temperature were studied for an enzyme-catalyzed reaction. The following results were obtained.
a. How do (1) temperature and (2) pH affect the activity of this enzyme? In your answer, include a discussion of the relationship between the structure and the function of this enzyme, as well as a discussion of ho structure and function of enzymes are affected by temperature and pH.
b. Describe a controlled experiment that could have produced the data shown for either temperature or pH. Be sure to state the hypothesis that was tested here.
Lab 13: Enzyme Catalysis
AP Biology
Lab : (Not AP) Genetics (Fly Lab)
AP Biology
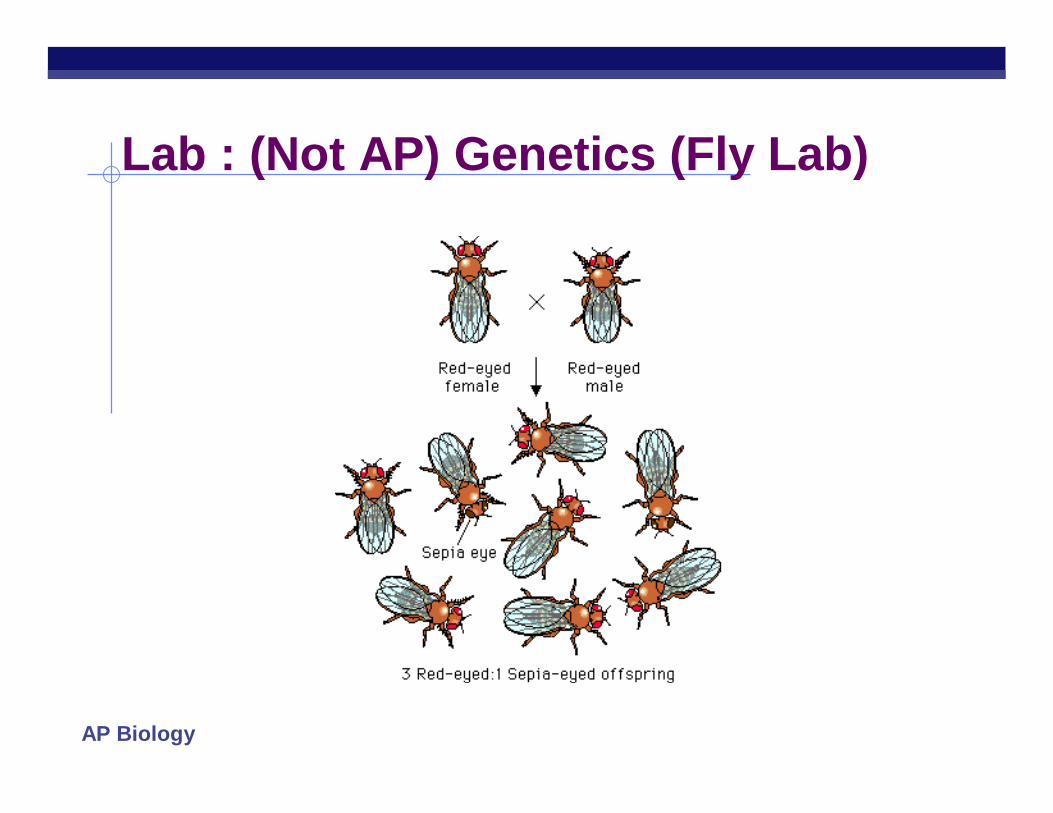
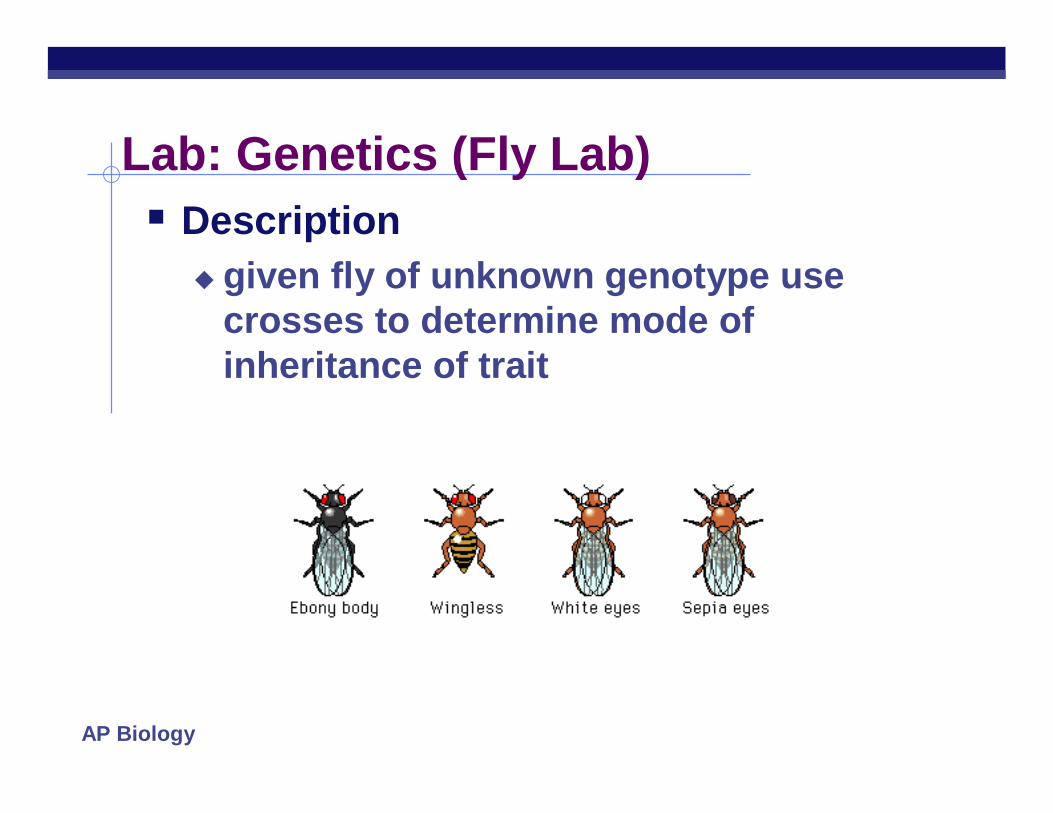
Lab: Genetics (Fly Lab) Description
given fly of unknown genotype use crosses to determine mode of inheritance of trait
AP Biology
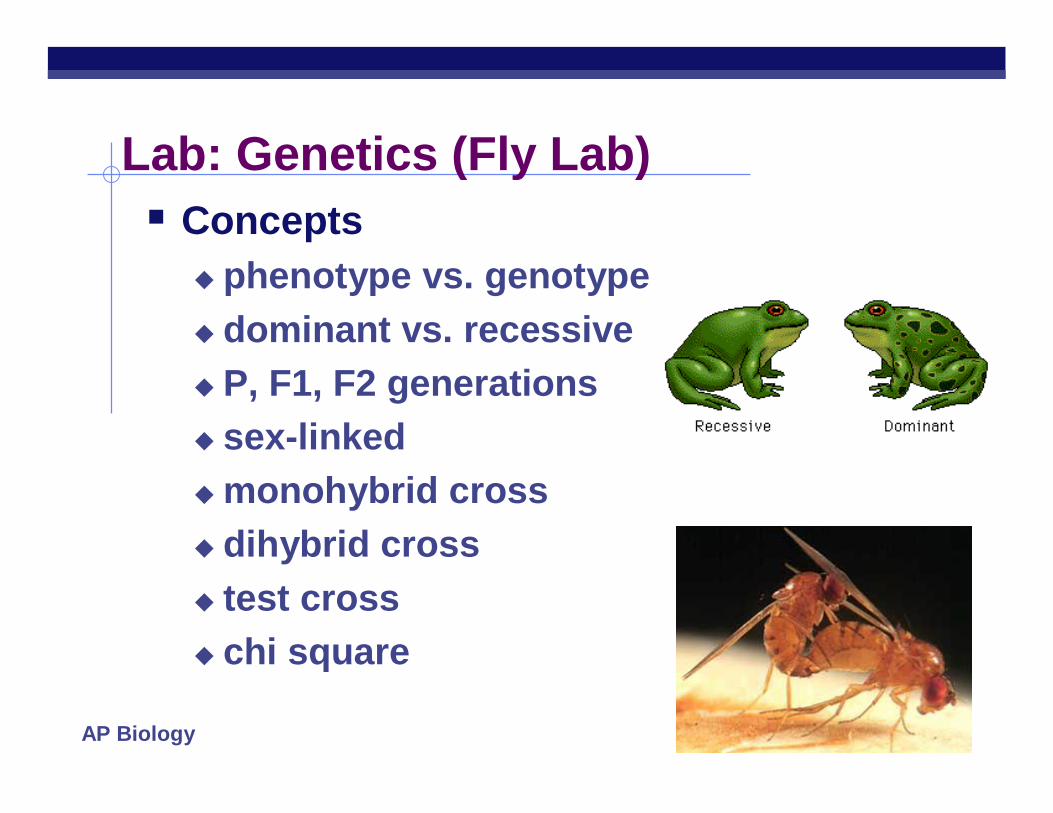
Lab: Genetics (Fly Lab) Concepts
phenotype vs. genotype dominant vs. recessive P, F1, F2 generations sex-linkedmonohybrid cross dihybrid cross test cross chi square
AP Biology
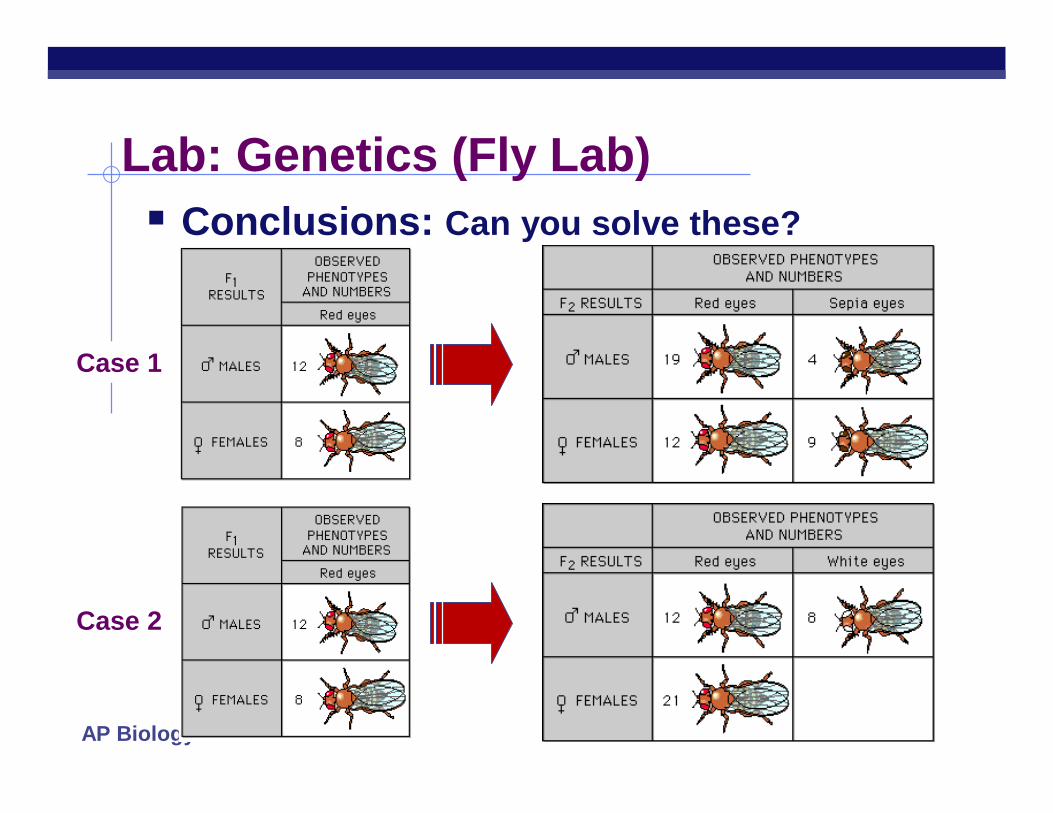
Lab: Genetics (Fly Lab) Conclusions: Can you solve these?
Case 1
Case 2

AP Biology
Lab: Genetics (Fly Lab)ESSAY 2003 (part 1)In fruit flies, the phenotype for eye color is determined by a certain locus. E indicates the dominant allele and e indicates the recessive allele. The cross between a male wild type fruit fly and a female white eyed fruit fly produced the following offspring
The wild-type and white-eyed individuals from the F1 generation were then crossed to produce the following offspring.
a. Determine the genotypes of the original parents (P generation) and explain your reasoning. You may use Punnett squares to enhance your description, but the results from the Punnett squares must be discussed in your answer.
b. Use a Chi-squared test on the F2 generation data to analyze your prediction of the parental genotypes. Show all your work and explain the importance of your final answer.
c. The brown-eyed female of the F1 generation resulted from a mutational change. Explain what a mutation is, and discuss two types of mutations that might have produced the brown-eyed female in the F1 generation.
Wild-Type Male
Wild-Type Female
White-eyed Male
White-Eyed Female
Brown-Eyed Female
F-1 0 45 55 0 1
Wild-Type Male
Wild-Type Female
White-eyed Male
White-Eyed Female
Brown-Eyed Female
F-2 23 31 22 24 0
AP Biology
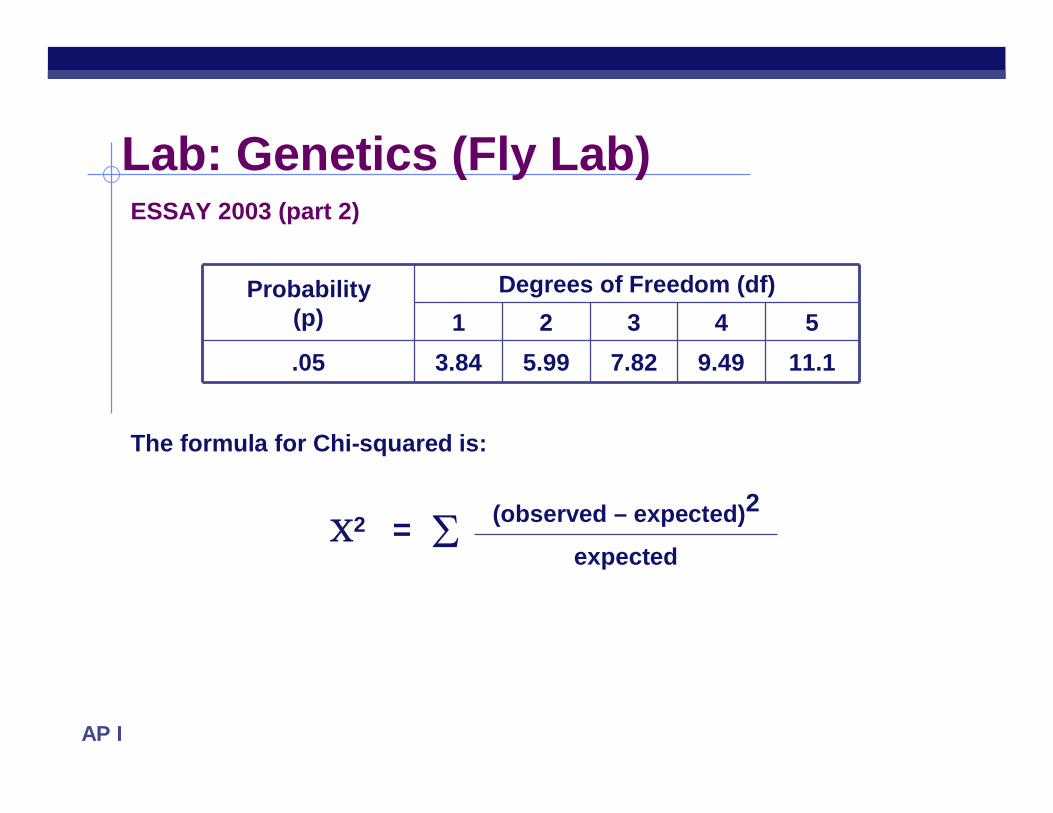
Lab: Genetics (Fly Lab)ESSAY 2003 (part 2)
The formula for Chi-squared is:
Probability (p)
Degrees of Freedom (df)1 2 3 4 5
.05 3.84 5.99 7.82 9.49 11.1
2 = (observed – expected)2
expected

AP Biology
Any Questions??
AP Biology
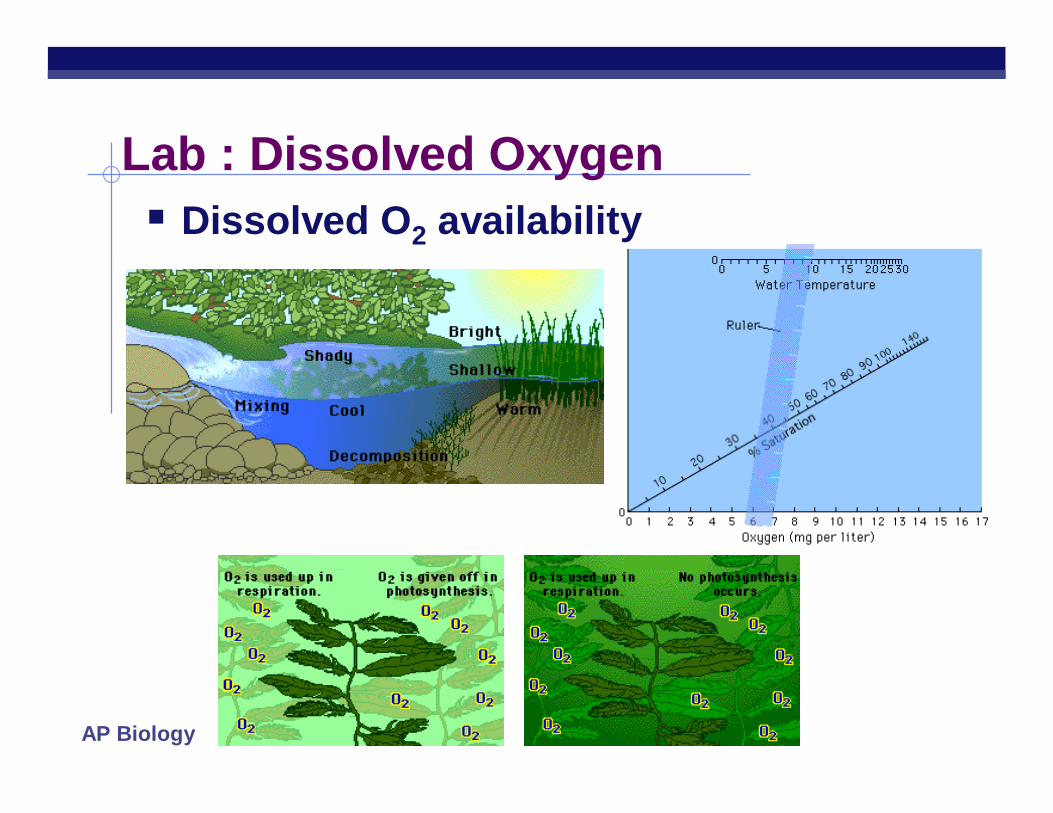
Lab : Dissolved Oxygen Dissolved O2 availability
AP Biology
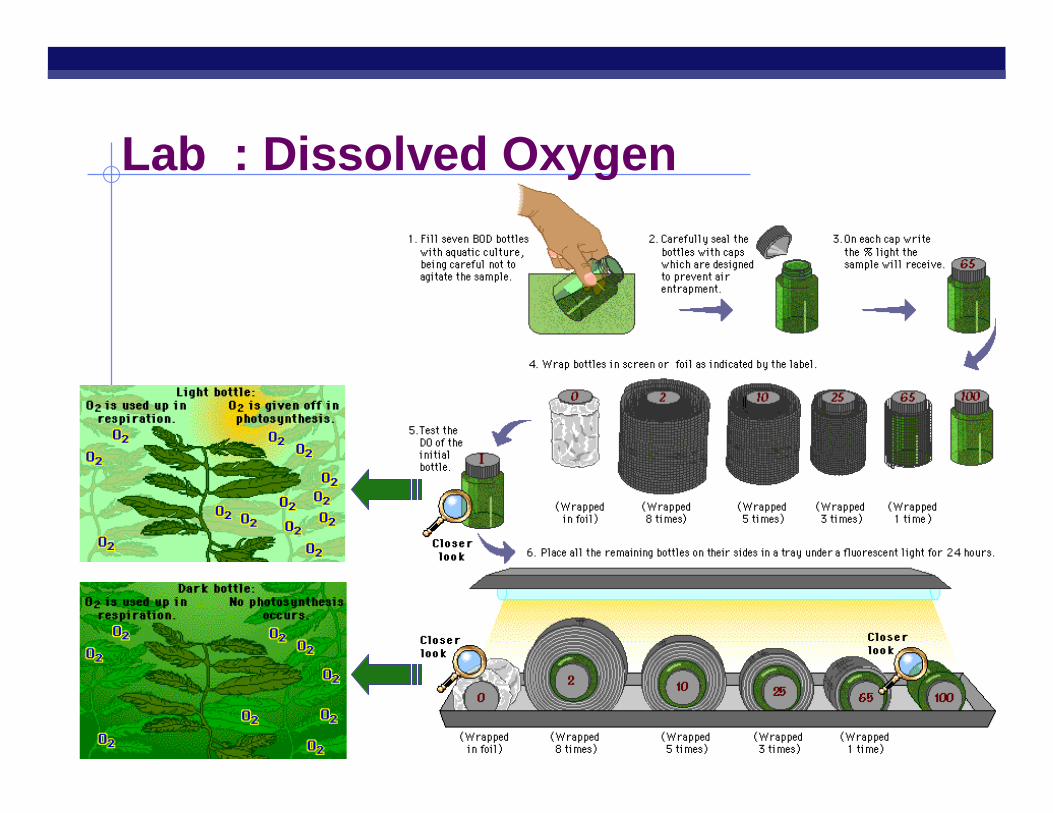
Lab : Dissolved Oxygen
AP Biology
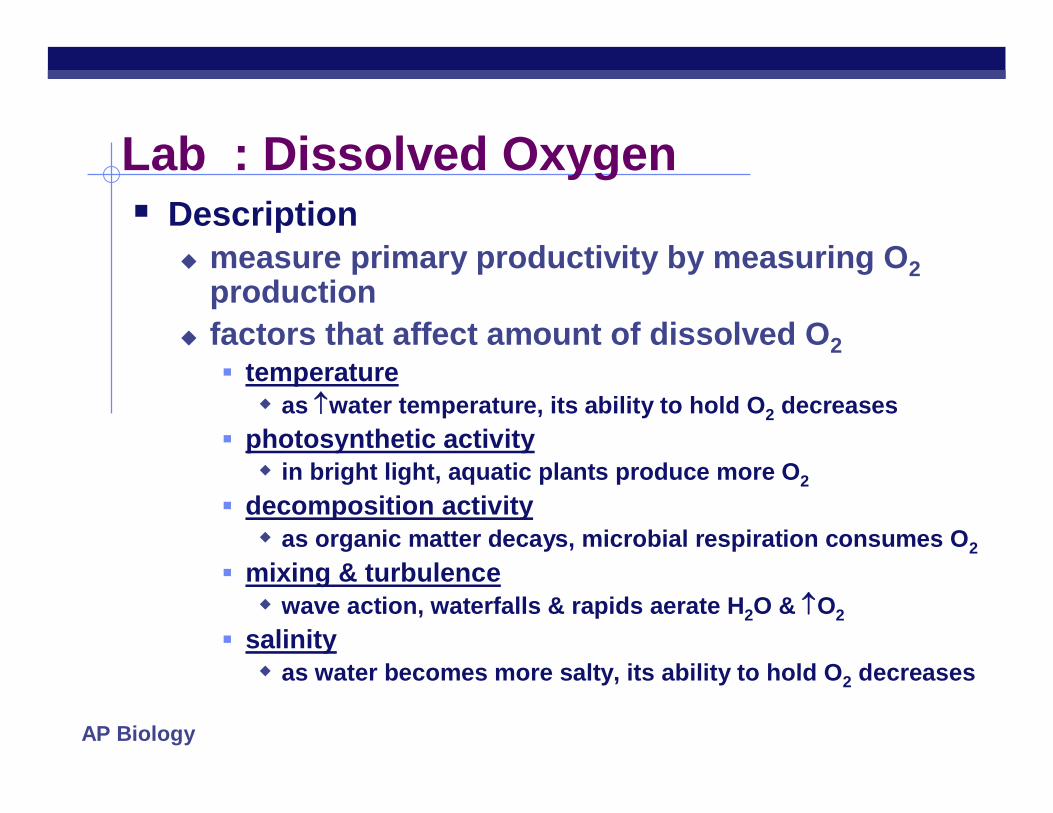
Lab : Dissolved Oxygen Description
measure primary productivity by measuring O2production
factors that affect amount of dissolved O2 temperature as water temperature, its ability to hold O2 decreases
photosynthetic activity in bright light, aquatic plants produce more O2
decomposition activity as organic matter decays, microbial respiration consumes O2
mixing & turbulence wave action, waterfalls & rapids aerate H2O & O2
salinity as water becomes more salty, its ability to hold O2 decreases
AP Biology
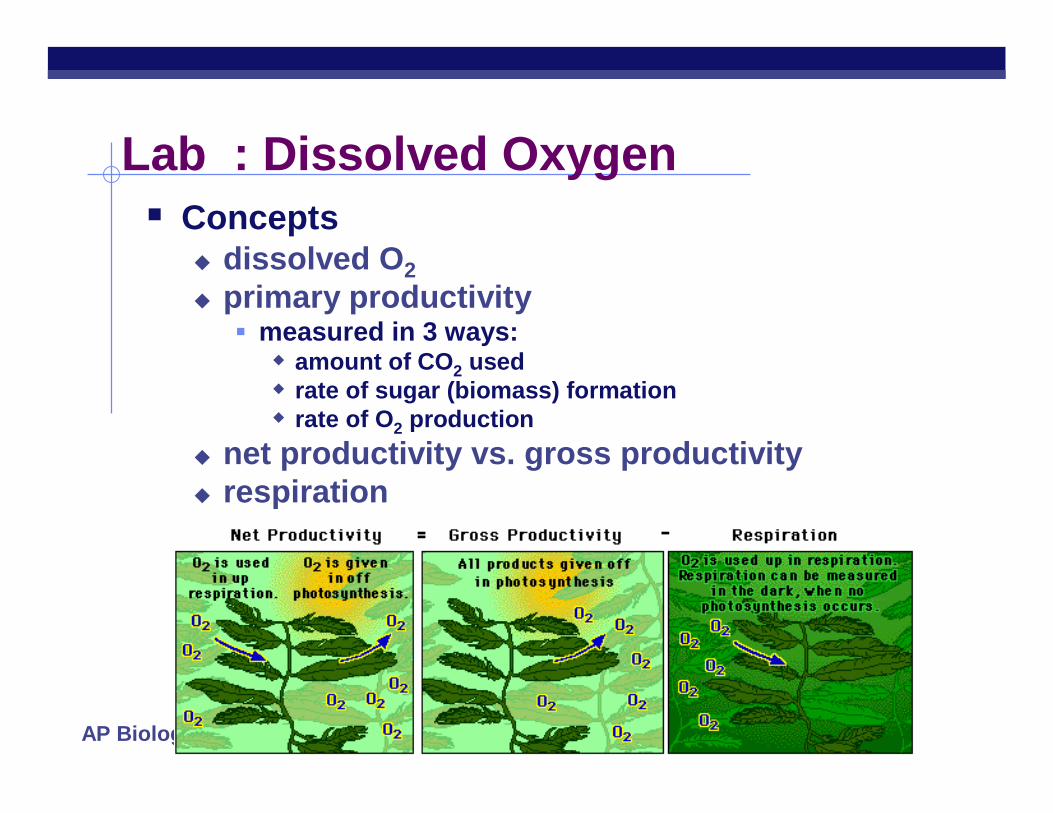
Lab : Dissolved Oxygen Concepts
dissolved O2 primary productivity measured in 3 ways: amount of CO2 used rate of sugar (biomass) formation rate of O2 production
net productivity vs. gross productivity respiration

AP Biology
Lab : Dissolved Oxygen Conclusions
temperature = dissolved O2
light = photosynthesis = O2 productionO2 loss from respiration respiration = dissolved O2
(consumption of O2)
AP Biology
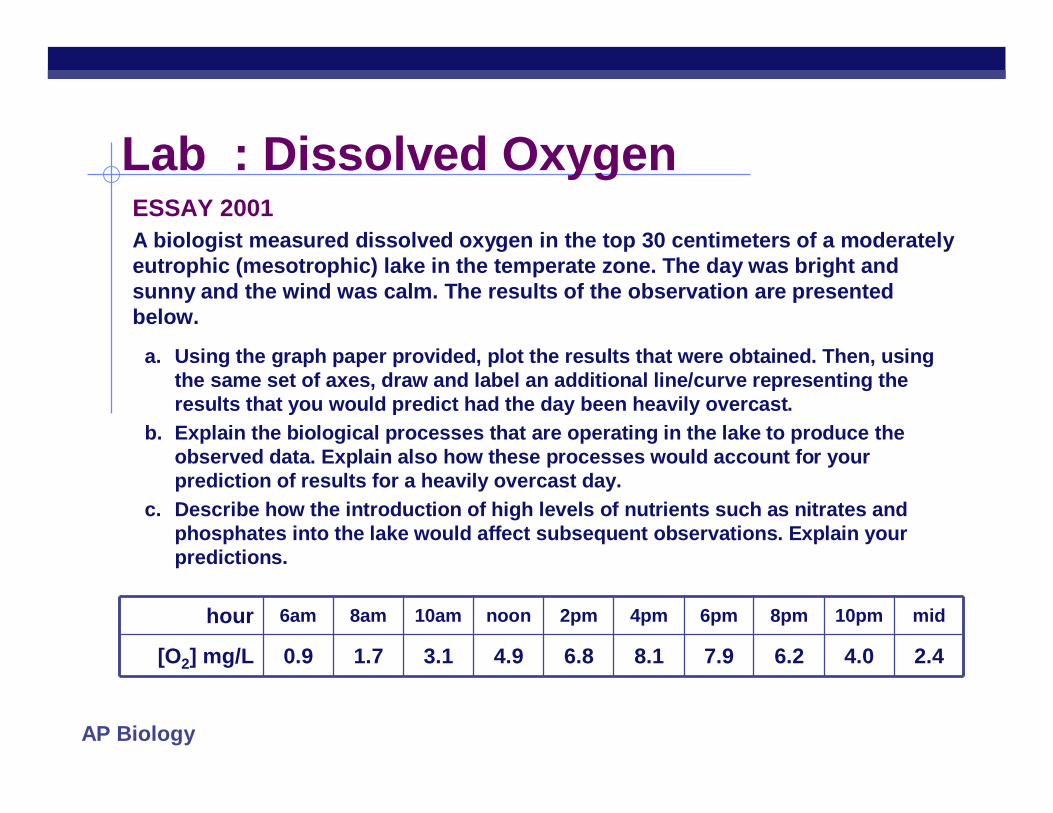
Lab : Dissolved OxygenESSAY 2001A biologist measured dissolved oxygen in the top 30 centimeters of a moderately eutrophic (mesotrophic) lake in the temperate zone. The day was bright and sunny and the wind was calm. The results of the observation are presented below.
a. Using the graph paper provided, plot the results that were obtained. Then, using the same set of axes, draw and label an additional line/curve representing the results that you would predict had the day been heavily overcast.
b. Explain the biological processes that are operating in the lake to produce the observed data. Explain also how these processes would account for your prediction of results for a heavily overcast day.
c. Describe how the introduction of high levels of nutrients such as nitrates and phosphates into the lake would affect subsequent observations. Explain your predictions.
hour 6am 8am 10am noon 2pm 4pm 6pm 8pm 10pm mid
[O2] mg/L 0.9 1.7 3.1 4.9 6.8 8.1 7.9 6.2 4.0 2.4
AP Biology
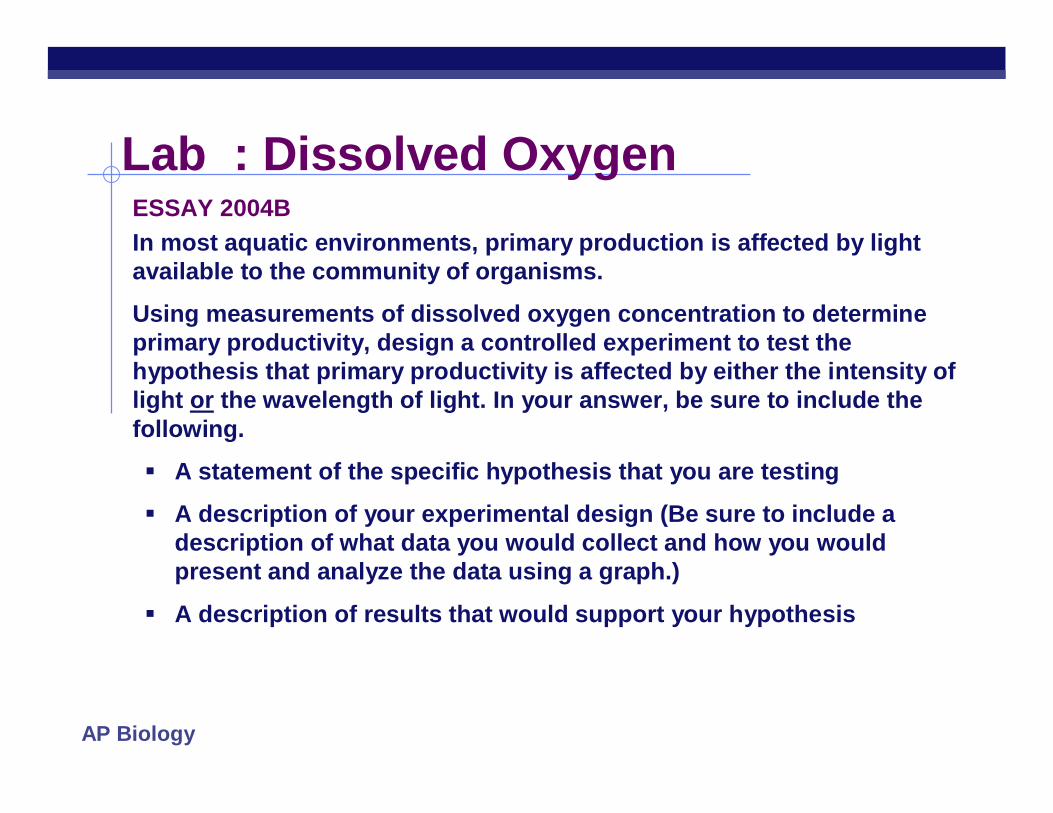
Lab : Dissolved OxygenESSAY 2004BIn most aquatic environments, primary production is affected by light available to the community of organisms.
Using measurements of dissolved oxygen concentration to determine primary productivity, design a controlled experiment to test thehypothesis that primary productivity is affected by either the intensity of light or the wavelength of light. In your answer, be sure to include thefollowing.
A statement of the specific hypothesis that you are testing
A description of your experimental design (Be sure to include a description of what data you would collect and how you would present and analyze the data using a graph.)
A description of results that would support your hypothesis
AP Biology
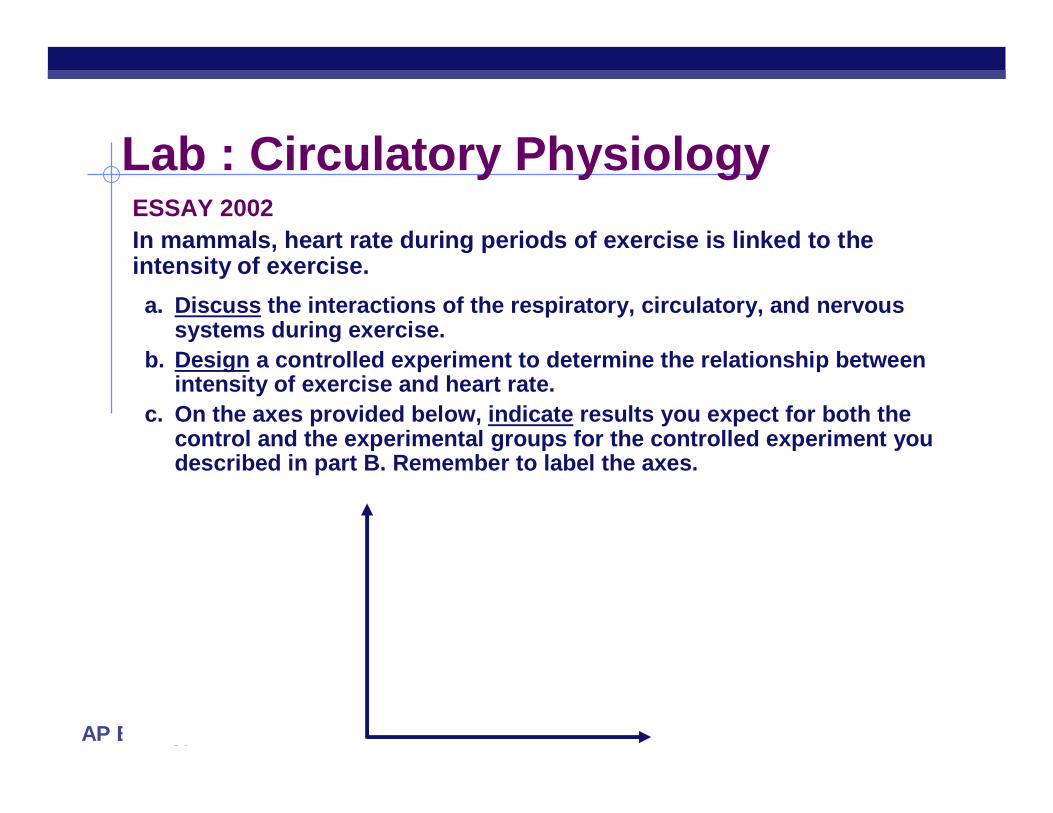
Lab : Circulatory PhysiologyESSAY 2002In mammals, heart rate during periods of exercise is linked to the intensity of exercise.a. Discuss the interactions of the respiratory, circulatory, and nervous
systems during exercise.b. Design a controlled experiment to determine the relationship between
intensity of exercise and heart rate.c. On the axes provided below, indicate results you expect for both the
control and the experimental groups for the controlled experiment you described in part B. Remember to label the axes.