ap report to the nation district of lumbia - college...
TRANSCRIPT

Dis
tric
t of
C
o lu
mb
ia
THE 10TH ANNUAL
AP® Report to the NationSTATE SUPPLEMENT FEBRUARY 11, 2014

2
T H E 1 0 T H A N N U A L A P R E P O R T T O T H E N A T I O N · D I S T R I C T O F C O L U M B I A S U P P L E M E N T
About This Report
This report provides educators and policymakers with information
they can use to celebrate their successes, understand their unique
challenges, and set meaningful goals to increase opportunity for all
students. It’s important to note that while AP® Exams are valid
measures of students’ content mastery of college-level studies in
specific academic disciplines, AP results should never be used as
the sole measure for gauging educational excellence and equity.
Because reliable demographic data for nonpublic schools are not
available for all states, this report represents public school students
only. Additionally, this report looks at students’ entire experience
with AP — tracking exams taken by graduates throughout their high
school careers — as opposed to reporting exam results from a
particular calendar year.
Additional data are available at apreport.collegeboard.org.
Table of Contents
3 State Strategies
6 Fostering AP® Participation and Success
8 A Closer Look at Equity Gaps in AP Participation and Success
Note: Throughout this report, public high school graduates represent projections supplied in Knocking at the College Door (Western Interstate Commission for Higher Education, 2012).
The redesigned courses, Biology, Latin, and Spanish Literature and Culture, began in fall 2012, and the first AP Exam based on those redesigned courses was administered in May 2013. As a result, the data in this report reflect a blend of the old and redesigned exam results.

3
T H E 1 0 T H A N N U A L A P R E P O R T T O T H E N A T I O N · D I S T R I C T O F C O L U M B I A S U P P L E M E N T
STATE STRATEG IESSTATE STRATEG IES
The District of Columbia has made progress in recent years in improving student access and supporting student performance in AP®. Just as we do in the national report, we wanted to take an opportunity to applaud your efforts and offer additional strategies for your consideration.
Current Picture
Congratulations. You are already using these strategies to build a robust AP Program. You:
Include AP in the accountability system. • Establish AP participation and performance indicators. • Set clear, measurable statewide goals toward improvement.
Encourage your educators to participate in the development of the AP Program, such as by becoming AP Exam Readers or participating in course and exam development committees. See page 5 for more details.

4
T H E 1 0 T H A N N U A L A P R E P O R T T O T H E N A T I O N · D I S T R I C T O F C O L U M B I A S U P P L E M E N T
STATE STRATEG IESSTATE STRATEG IES
The following strategies have been proven effective. To build an even stronger AP program, you could:
¨ Ensure that public colleges and universities develop AP Exam credit and placement policies based on institutional goals, alignment with corresponding courses, and objective outcomes research. Partner with College Board Higher Ed staff to coordinate interaction between OSSE, DCPS, and higher education institutions in and around the District of Columbia.
¨ Formalize and invest in a professional development schedule to build capacity for infusing Pre-AP® strategies into course work and to bolster current AP teachers.
¨ Enhance existing policies that allow AP course work and exam scores for sophomores and juniors to substitute for statewide graduation requirements and/or end-of-course assessments.
¨ Provide resources to schools and districts to support research-based programs, like SpringBoard®, that build content knowledge and skills — particularly in literacy and math — to prepare students for success in AP course work, and in college and careers.
Opportunities

5
T H E 1 0 T H A N N U A L A P R E P O R T T O T H E N A T I O N · D I S T R I C T O F C O L U M B I A S U P P L E M E N T
STATE STRATEG IESSTATE STRATEG IES
The following information dives a little deeper into the details of your efforts.
Participation in the Development of AP
2013 Reading participants — Total: 45 District of Columbia represents 0.4% of all Readers • AP High School Teachers: 22 • College and University Faculty: 23
2013 AP Professional Development Leaders — Total: 3
2013 AP Development Committee Members — Total: 8
Statistics Benjamin Banneker Academic High SchoolChinese Language and Culture Friends SchoolHuman Geography George Washington UniversityPhysics C Georgetown UniversityPhysics 2 George Washington UniversityJapanese Language and Culture Georgetown UniversityPhysics 1 St. Albans SchoolPhysics B Woodrow Wilson High School
Highlights

6
T H E 1 0 T H A N N U A L A P R E P O R T T O T H E N A T I O N · D I S T R I C T O F C O L U M B I A S U P P L E M E N T
FOSTER ING AP PART IC IPAT ION AND SUCCESS
More graduatesare succeeding on AP Exams today than ever before
English had the greatest number of students achieving a score of 3 or higher
F I G U R E 1 Growth in AP® Participation and Success
F I G U R E 2 Participation in and Success on AP Exams in the Class of 2013
Number of graduates leaving high school having taken an AP Exam Number of graduates scoring 3+ on an AP Exam during high school
2003 2008 2012 2013
1,392605 1,512 1,774
295243 389 445
60%30%0%
Percentage of District of Columbia Graduating Class
Arts
English
WorldLanguages
Mathematics andComputer Science
Sciences
History andSocial Sciences
AnyDiscipline
Total Number of Graduates: 3,185
3.5%
37.6%
31.6%
10.8%
15.7%
6.7%
55.7%
2.1%
7.1%
6.8%
3.0%
3.3%
4.4%
14.0%
60%30%0%
Percentage of graduates leaving high school having taken an AP Exam Percentage of graduates scoring 3+ on an AP Exam during high school
* AP Italian Language and Culture was discontinued after the 2008-09 school year, and was reinstated in 2011-12.
Art History, Music Theory, Studio Art: Drawing, Studio Art: 2-D Design, and Studio Art: 3-D Design
English Language and Composition, and English Literature and Composition
Comparative Government and Politics, European History, Human Geography, Macroeconomics, Microeconomics, Psychology, United States Government and Politics, United States History, and World History
Calculus AB, Calculus BC, Computer Science A, and Statistics
Biology, Chemistry, Environmental Science, Physics B, Physics C: Electricity and Magnetism, and Physics C: Mechanics
Chinese Language and Culture, French Language and Culture, German Language and Culture, Italian Language and Culture*, Japanese Language and Culture, Latin, Spanish Language, and Spanish Literature and Culture

7
T H E 1 0 T H A N N U A L A P R E P O R T T O T H E N A T I O N · D I S T R I C T O F C O L U M B I A S U P P L E M E N T
FOSTER ING AP PART IC IPAT ION AND SUCCESS
+ Due to rounding, percentages do not always add up to 100.0.* AP Italian Language and Culture was discontinued after the 2008-09 school year, and was reinstated in 2011-12.
Subjects with fewer than five AP Exam takers were omitted from this figure.
F I G U R E 3 Score Distributions of AP Exams Taken by the Class of 2013 During High School
Rank
100% 80% 60% 40% 20% 0% 20% 40% 60% 80% 100%
Subject No. of Exams % of Exam Scores+
Chinese Language and Culture 15
Calculus BC 18
French Language and Culture 35
10 Spanish Language 137
Music Theory 27
Macroeconomics 20
Art History 52
Studio Art: 2-D Design 23
Microeconomics 19
Latin 14
Studio Art: Drawing 18
Physics C: Mechanics 32
Psychology 47
Statistics 108
8 Human Geography 178
Spanish Literature and Culture 58
Comparative Government and Politics 83
4 World History 427
European History 7
Physics C: Electricity and Magnetism 31
Physics B 35
9 Environmental Science 170
Computer Science A 18
6 Calculus AB 247
Chemistry 117
1 English Language and Composition 921
5 United States Government and Politics 375
3 United States History 551
7 Biology 211
2 English Literature and Composition 888
German Language and Culture 0
Italian Language and Culture* 1
Japanese Language and Culture 0
Studio Art: 3-D Design 3
6.7
22.2
5.7
15.3
14.8
20.0
19.2
26.1
26.3
21.4
22.2
31.3
38.3
37.0
52.2
48.3
55.4
41.0
57.1
45.2
45.7
58.2
72.2
72.9
71.8
51.5
60.3
58.4
58.8
56.9
26.7
38.9
42.9
30.7
33.3
35.0
28.8
13.0
15.8
42.9
11.1
21.9
17.0
13.9
11.8
27.6
18.1
18.3
14.3
3.2
20.0
11.2
5.6
11.7
12.0
11.6
12.8
9.1
8.1
10.6
20.0
16.7
22.9
19.7
18.5
10.0
28.8
43.5
15.8
14.3
38.9
15.6
21.3
13.9
16.3
6.9
8.4
8.7
16.1
2.9
11.8
16.7
5.3
5.1
5.4
3.7
7.4
7.1
5.4
13.3
22.9
16.1
18.5
15.0
17.3
13.0
15.8
21.4
22.2
21.9
17.0
21.3
9.0
17.2
10.8
26.0
14.3
29.0
28.6
16.5
5.6
5.3
6.8
28.2
19.5
22.0
22.7
25.9
33.3
22.2
5.7
18.2
14.8
20.0
5.8
4.3
26.3
5.6
9.4
6.4
13.9
10.7
7.2
6.1
14.3
6.5
2.9
2.4
4.9
4.3
3.3
3.7
3.1
3.3
1.2
8
T H E 1 0 T H A N N U A L A P R E P O R T T O T H E N A T I O N · D I S T R I C T O F C O L U M B I A S U P P L E M E N T
A CLOSER LOOK AT EQUITY GAPS IN AP PART IC IPAT ION AND SUCCESS
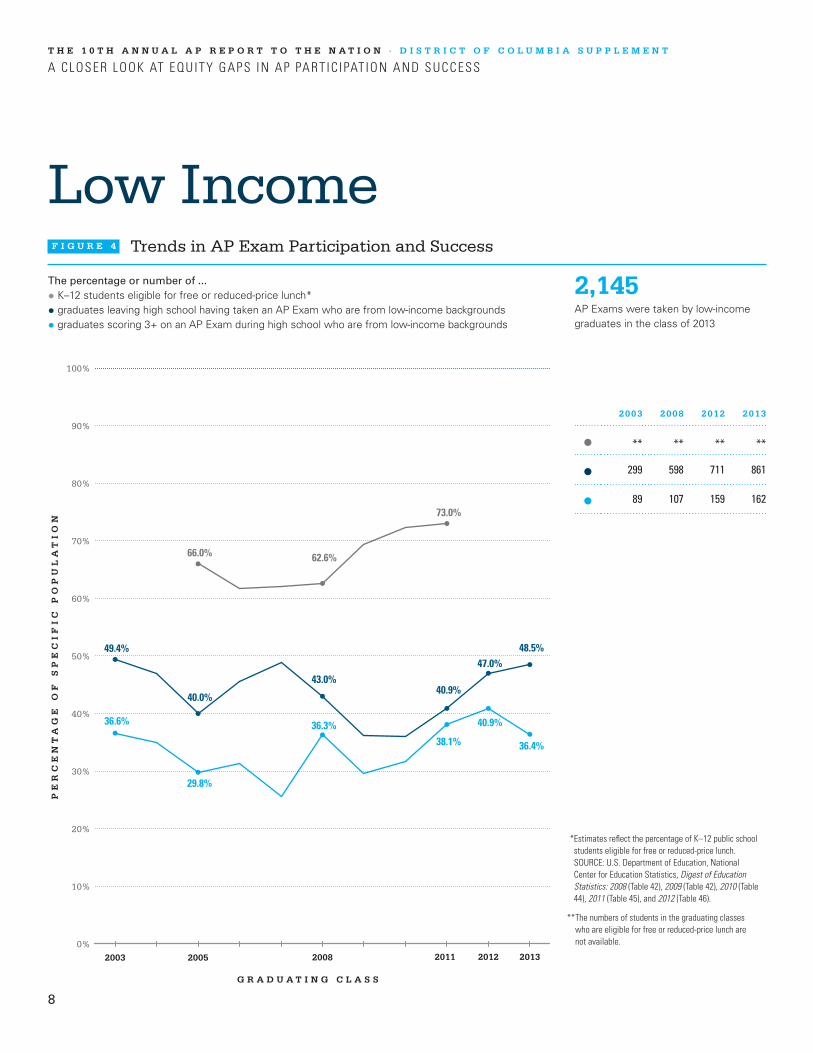
Low IncomeF I G U R E 4 Trends in AP Exam Participation and Success
2,145AP Exams were taken by low-income graduates in the class of 2013
The percentage or number of ...
• K–12 students eligible for free or reduced-price lunch*
• graduates leaving high school having taken an AP Exam who are from low-income backgrounds
• graduates scoring 3+ on an AP Exam during high school who are from low-income backgrounds
2003 2008 2012 2013
** ** ** **
299 598 711 861
89 107 159 162
2003 2008 20122011 2013
PE
RC
EN
TA
GE
OF
SP
EC
IF
IC
PO
PU
LA
TI
ON
G R A D U A T I N G C L A S S
10%
20%
0%
30%
40%
50%
60%
70%
80%
90%
100%
66.0% 62.6%
73.0%
49.4%
43.0%40.9%
40.0%
47.0%48.5%
36.6% 36.3%
29.8%
40.9%
38.1% 36.4%
2005
* Estimates reflect the percentage of K–12 public school students eligible for free or reduced-price lunch. SOURCE: U.S. Department of Education, National Center for Education Statistics, Digest of Education Statistics: 2008 (Table 42), 2009 (Table 42), 2010 (Table 44), 2011 (Table 45), and 2012 (Table 46).
** The numbers of students in the graduating classes who are eligible for free or reduced-price lunch are not available.

9
T H E 1 0 T H A N N U A L A P R E P O R T T O T H E N A T I O N · D I S T R I C T O F C O L U M B I A S U P P L E M E N T
A CLOSER LOOK AT EQUITY GAPS IN AP PART IC IPAT ION AND SUCCESS
Black/African AmericanF I G U R E 5 Trends in AP Exam Participation and Success
1,189black/African American graduates in the class of 2013 took an AP Exam during high school
The percentage or number of ...
• students in the graduating class
• graduates leaving high school having taken an AP Exam
• graduates scoring 3+ on an AP Exam during high school... who are black/African American
2003 2008 2012 2013
2,339 2,871 2,689 2,605
353 952 997 1,189
77 98 163 150
2003 2008 2012 2013
PE
RC
EN
TA
GE
OF
SP
EC
IF
IC
PO
PU
LA
TI
ON
G R A D U A T I N G C L A S S
10%
20%
0%
30%
40%
50%
60%
70%
80%
90%
100%
85.8%85.7%
84.2%81.8%
58.3%
68.4%
65.9% 67.0%
31.7%33.2%
41.9%
33.7%
10
T H E 1 0 T H A N N U A L A P R E P O R T T O T H E N A T I O N · D I S T R I C T O F C O L U M B I A S U P P L E M E N T
A CLOSER LOOK AT EQUITY GAPS IN AP PART IC IPAT ION AND SUCCESS
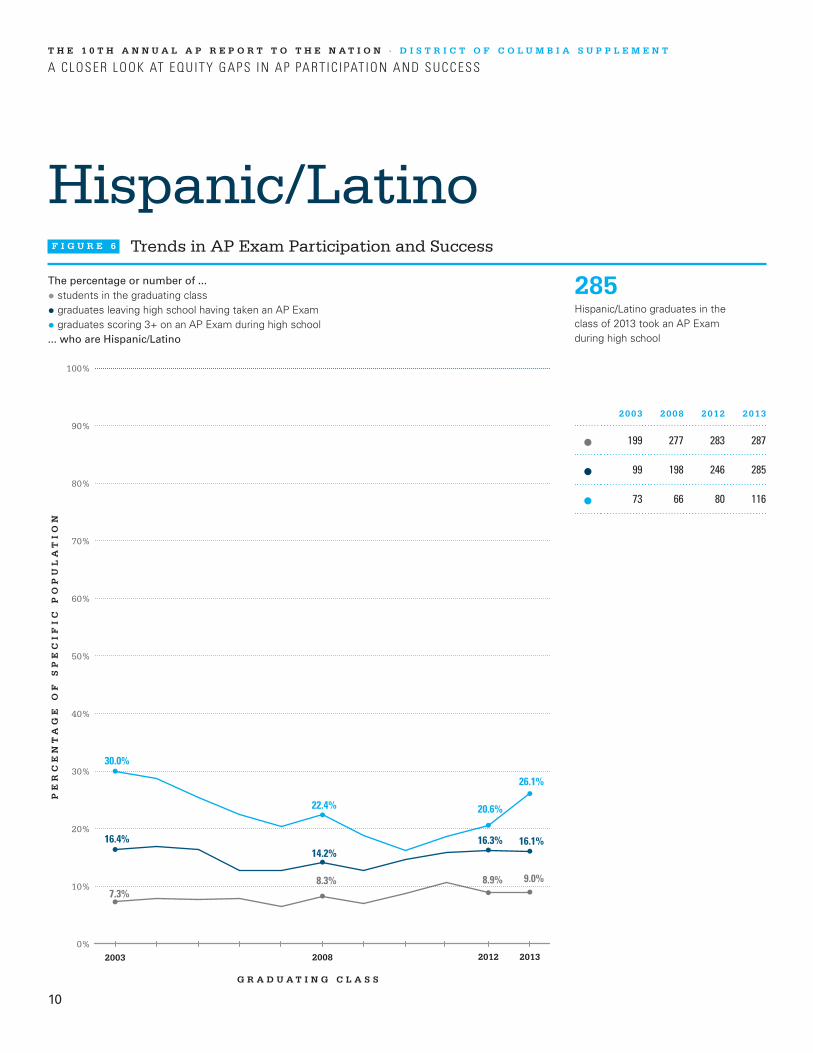
Hispanic/LatinoF I G U R E 6 Trends in AP Exam Participation and Success
285Hispanic/Latino graduates in the class of 2013 took an AP Exam during high school
The percentage or number of ...
• students in the graduating class
• graduates leaving high school having taken an AP Exam
• graduates scoring 3+ on an AP Exam during high school... who are Hispanic/Latino
2003 2008 2012 2013
199 277 283 287
99 198 246 285
73 66 80 116
2003 2008 2012 2013
PE
RC
EN
TA
GE
OF
SP
EC
IF
IC
PO
PU
LA
TI
ON
G R A D U A T I N G C L A S S
10%
20%
0%
30%
40%
50%
60%
70%
80%
90%
100%
7.3%8.3% 8.9% 9.0%
16.4%14.2%
16.3% 16.1%
30.0%
22.4% 20.6%
26.1%

11
T H E 1 0 T H A N N U A L A P R E P O R T T O T H E N A T I O N · D I S T R I C T O F C O L U M B I A S U P P L E M E N T
A CLOSER LOOK AT EQUITY GAPS IN AP PART IC IPAT ION AND SUCCESS
American Indian/ Alaska Native*
F I G U R E 7 Trends in AP Exam Participation and Success
9American Indian/Alaska Native graduates in the class of 2013 took an AP Exam during high school
The percentage or number of ...
• students in the graduating class
• graduates leaving high school having taken an AP Exam
• graduates scoring 3+ on an AP Exam during high school... who are American Indian/Alaska Native
2003 2008 2012 2013
2 3 N/A N/A
1 6 2 9
** 1 ** 3
2003 2008 2012 2013
PE
RC
EN
TA
GE
OF
SP
EC
IF
IC
PO
PU
LA
TI
ON
G R A D U A T I N G C L A S S
10%
20%
0%
30%
40%
50%
60%
70%
80%
90%
100%
0.1%0.1% * *
0.2% 0.4% 0.1%0.5%
0.0%0.3% 0.0%
0.7%
* Precise numbers of American Indian/Alaska Native graduates for the classes of 2010 through 2013 for the District of Columbia are not available from the Western Interstate Commission for Higher Education.
** Success data omitted when fewer than five graduates took an AP Exam.
12
T H E 1 0 T H A N N U A L A P R E P O R T T O T H E N A T I O N · D I S T R I C T O F C O L U M B I A S U P P L E M E N T
A CLOSER LOOK AT EQUITY GAPS IN AP PART IC IPAT ION AND SUCCESS
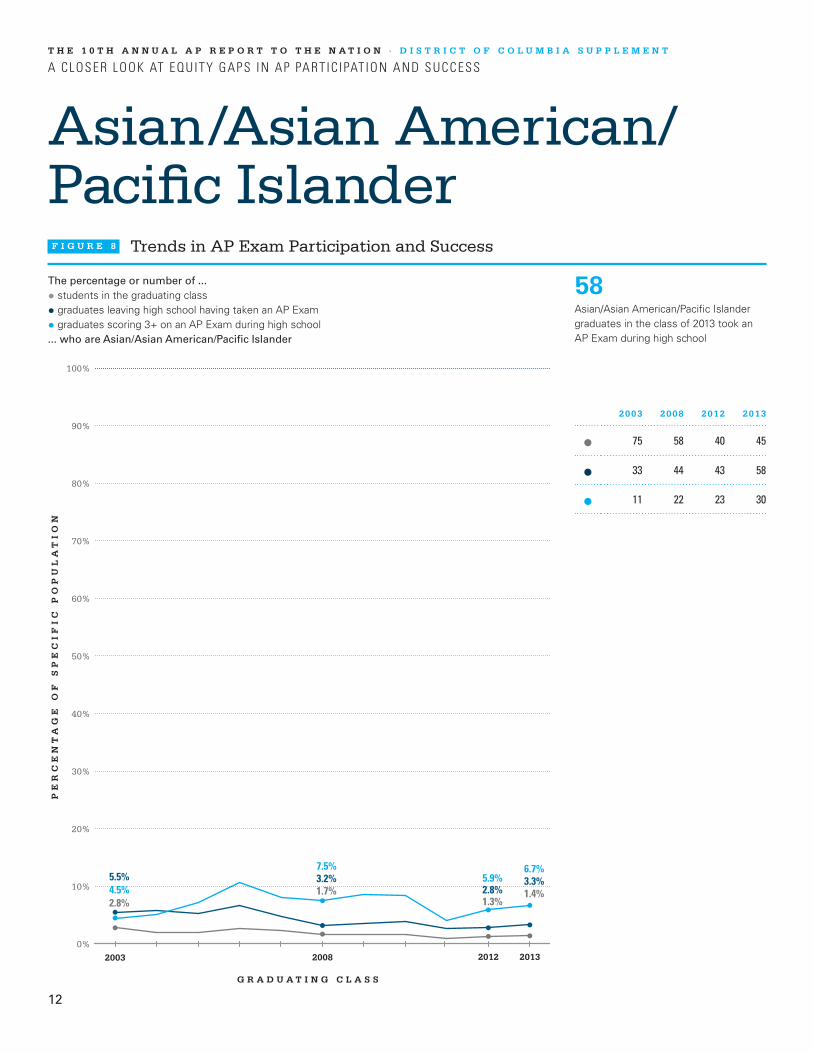
Asian/Asian American/ Pacific IslanderF I G U R E 8 Trends in AP Exam Participation and Success
58Asian/Asian American/Pacific Islander graduates in the class of 2013 took an AP Exam during high school
The percentage or number of ...
• students in the graduating class
• graduates leaving high school having taken an AP Exam
• graduates scoring 3+ on an AP Exam during high school... who are Asian/Asian American/Pacific Islander
2003 2008 2012 2013
75 58 40 45
33 44 43 58
11 22 23 30
2003 2008 2012 2013
PE
RC
EN
TA
GE
OF
SP
EC
IF
IC
PO
PU
LA
TI
ON
G R A D U A T I N G C L A S S
10%
20%
0%
30%
40%
50%
60%
70%
80%
90%
100%
2.8%1.7%
1.3%1.4%
5.5% 3.2%2.8%
3.3%4.5%
7.5%5.9%
6.7%

13
T H E 1 0 T H A N N U A L A P R E P O R T T O T H E N A T I O N · D I S T R I C T O F C O L U M B I A S U P P L E M E N T
A CLOSER LOOK AT EQUITY GAPS IN AP PART IC IPAT ION AND SUCCESS
WhiteF I G U R E 9 Trends in AP Exam Participation and Success
142white graduates in the class of 2013 took an AP Exam during high school
The percentage or number of ...
• students in the graduating class
• graduates leaving high school having taken an AP Exam
• graduates scoring 3+ on an AP Exam during high school... who are white
2003 2008 2012 2013
110 144 129 142
78 111 119 142
65 84 93 119
2003 2008 2012 2013
PE
RC
EN
TA
GE
OF
SP
EC
IF
IC
PO
PU
LA
TI
ON
G R A D U A T I N G C L A S S
10%
20%
0%
30%
40%
50%
60%
70%
80%
90%
100%
4.0% 4.3% 4.0% 4.5%
12.9%
8.0% 7.9% 8.0%
26.7%28.5%
23.9%26.7%

14
ABOUT THE COLLEGE BOARD
The College Board is a mission-driven not-for-profit
organization that connects students to college success
and opportunity. Founded in 1900, the College Board
was created to expand access to higher education.
Today, the membership association is made up of over
6,000 of the world’s leading educational institutions
and is dedicated to promoting excellence and equity in
education. Each year, the College Board helps more
than seven million students prepare for a successful
transition to college through programs and services in
college readiness and college success — including
the SAT®, and the Advanced Placement Program®. The
organization also serves the education community through
research and advocacy on behalf of students, educators,
and schools.
For further information, visit www.collegeboard.org.
© 2014 The College Board. College Board, Advanced Placement, Advanced Placement Program, AP, Pre-AP, SAT, SpringBoard, and the acorn logo are registered trademarks of the College Board. All other products and services may be trademarks of their respective owners. Visit the College Board on the Web: www.collegeboard.org.
apreport.collegeboard.org