a.p. state council of higher education -...
TRANSCRIPT
Statistics 1 of 45
Syllabus STATISTICS
Admitted Batch 2008 -2009 (UG courses)
May 2008 A.P. State Council of Higher Education
Statistics 2 of 45
SUBJECT COMMITTEE APSCHE UNDERGRADUATE MODEL CURRICULUM
OF STATISTICS
SUBMITTED TO THE ANDHRA PRADESH STATE COUNCIL OF HIGHER EDUCATION
IN MAY 2008
In March, 2008 the APSCHE constituted a new Curriculum Development Committee in Statistics. The committee consists of:
S.No Name & Address 1. Prof. M.Gopala Rao Department of Statistics
Osmania University, Hyderabad Coordinator
2. Prof. M. Krishna Reddy Department of Statistics Osmania University, Hyderabad
Member
3. Prof. K.V.S.Sarma Department of Statistics Sri Venkateswara University, Tirupati
Member
4. Prof. M. Chitti Babu Department of Statistics Andhra University, Visakhapatnam
Member
5. Prof. K.L.A.P.Sarma Department of Statistics Sri Krihsnadevaraya University, Anantapur
Member
6. Prof. G.V.S.R. Anjaneyulu Department of Statistics Nagarjuna University, Nagarjuna Nagar, Guntur
Member
7. Dr. Papaiah Sastry Lecturer in Statistics Govt. Degree College Rajahmundry
Member
8. Dr. K. Padmavathi Lecturer in Statistics Govt. Degree College for Women Begumpet, Secunderabad
Member
Statistics 3 of 45
B.A/B.Sc STATISTICS WITH
MATHEMATICS COMBINATION
Statistics 4 of 45
PRPERATION OF MODEL CURRICULAM IN STATISTICS AT UG LEVEL The Following are the salient points. 1. Model syllabus is prepared for two streams; i) Statistics course with Mathematics
combination and ii) Statistics course without Mathematics.
2. There will be 4 theory papers in B.A/B.Sc. with Mathematics stream of which the first three papers shall be compulsory and the fourth paper shall be one of the electives given below.
B.A./B.Sc. Statistics course structure with Mathematics combination: Paper Title Status 1. Descriptive Statistics & Probability Distributions Compulsory 2. Statistical Methods and Inference Compulsory 3. Applied Statistics Compulsory 4.a) Quality, Reliability and Operations Research Elective-I b) Biostatistics Elective-II c) Actuarial Statistics Elective-III d) Programming in C Elective-IV 3. Each theory paper is divided into 4 units.
4. Each of the first two paper are prepared for 120 hours of teaching and each of papers
III & IV for 90 (30 sessions) as directed by the APSCHE. 5. For each theory paper there is a corresponding practical paper for 90 hours (30
Sessions) 6. The existing common core syllabi are thoroughly revised and all the gaps are filled
unambiguously. 7. While designing the model curriculum the syllabi of B. Stat of Indian Statistical
Institute, UGC model curriculum and statistics syllabus of other universities in India and some universities from abroad have been taken into consideration.
8. The model curriculum is designed with focus on computer oriented statistical skills
using software like Excel and TORA. This helps in training graduate students in a more professional way in statistics and makes them fit for IT related jobs and to purse higher education within or outside India.
Statistics 5 of 45
9. The model syllabi re prepared so as to cater tot eh statistical needs of industry and society. Sufficient focus is given to Biostatistics and Actuarial Statistics.
10. In the earlier common core syllabus, papers I and II were compulsory and papers III
and IV were designed by the respective Universities. Now paper IV is designed as an elective which can be chosen by the university/college, keeping in view of the interest of the students.
11. For Mathematics combinations, stress is given on theoretical strength, software skills
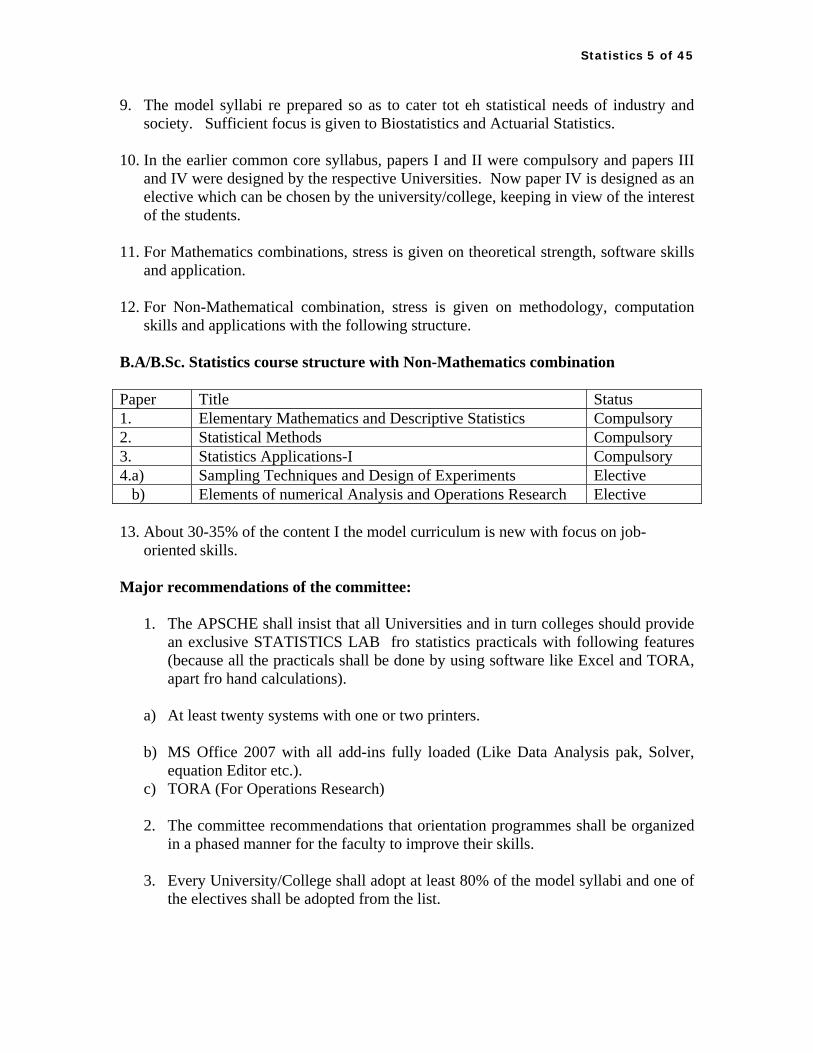
and application. 12. For Non-Mathematical combination, stress is given on methodology, computation
skills and applications with the following structure. B.A/B.Sc. Statistics course structure with Non-Mathematics combination Paper Title Status 1. Elementary Mathematics and Descriptive Statistics Compulsory 2. Statistical Methods Compulsory 3. Statistics Applications-I Compulsory 4.a) Sampling Techniques and Design of Experiments Elective b) Elements of numerical Analysis and Operations Research Elective 13. About 30-35% of the content I the model curriculum is new with focus on job-
oriented skills. Major recommendations of the committee:
1. The APSCHE shall insist that all Universities and in turn colleges should provide an exclusive STATISTICS LAB fro statistics practicals with following features (because all the practicals shall be done by using software like Excel and TORA, apart fro hand calculations).
a) At least twenty systems with one or two printers. b) MS Office 2007 with all add-ins fully loaded (Like Data Analysis pak, Solver,
equation Editor etc.). c) TORA (For Operations Research) 2. The committee recommendations that orientation programmes shall be organized
in a phased manner for the faculty to improve their skills. 3. Every University/College shall adopt at least 80% of the model syllabi and one of
the electives shall be adopted from the list.
Statistics 6 of 45
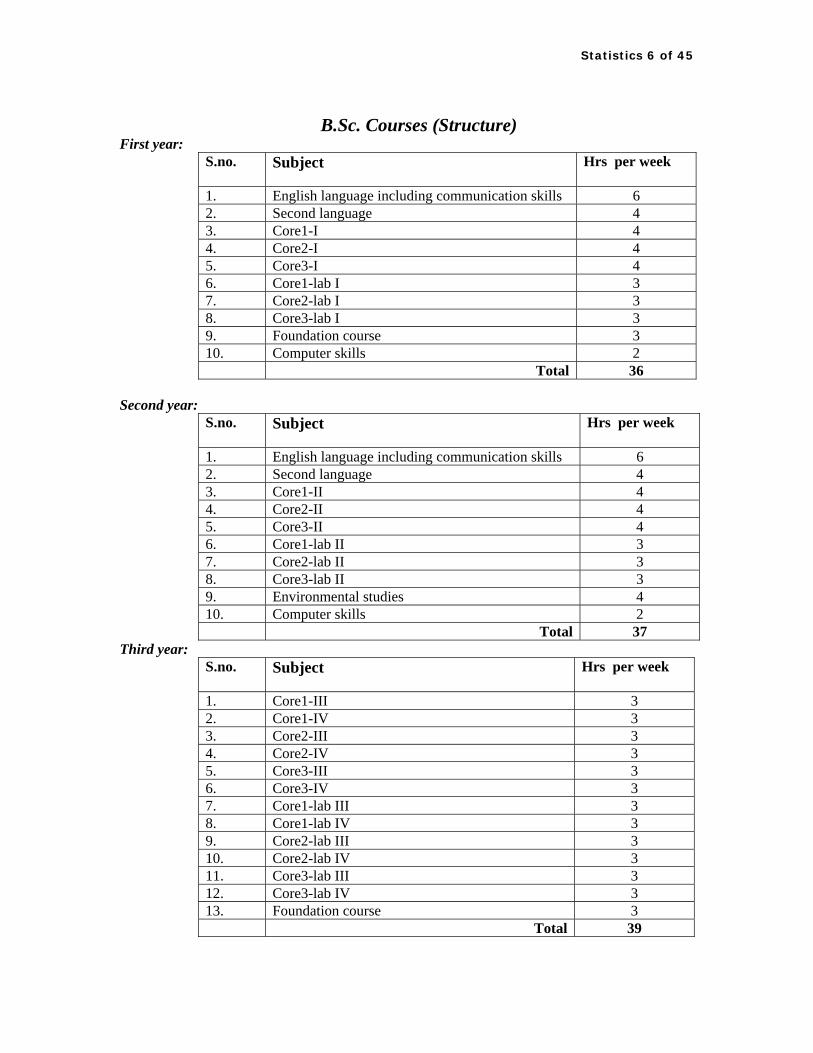
B.Sc. Courses (Structure)
First year: S.no. Subject Hrs per week
1. English language including communication skills 6 2. Second language 4 3. Core1-I 4 4. Core2-I 4 5. Core3-I 4 6. Core1-lab I 3 7. Core2-lab I 3 8. Core3-lab I 3 9. Foundation course 3 10. Computer skills 2 Total 36
Second year:
S.no. Subject Hrs per week
1. English language including communication skills 6 2. Second language 4 3. Core1-II 4 4. Core2-II 4 5. Core3-II 4 6. Core1-lab II 3 7. Core2-lab II 3 8. Core3-lab II 3 9. Environmental studies 4 10. Computer skills 2 Total 37
Third year: S.no. Subject Hrs per week
1. Core1-III 3 2. Core1-IV 3 3. Core2-III 3 4. Core2-IV 3 5. Core3-III 3 6. Core3-IV 3 7. Core1-lab III 3 8. Core1-lab IV 3 9. Core2-lab III 3 10. Core2-lab IV 3 11. Core3-lab III 3 12. Core3-lab IV 3 13. Foundation course 3 Total 39
Statistics 7 of 45
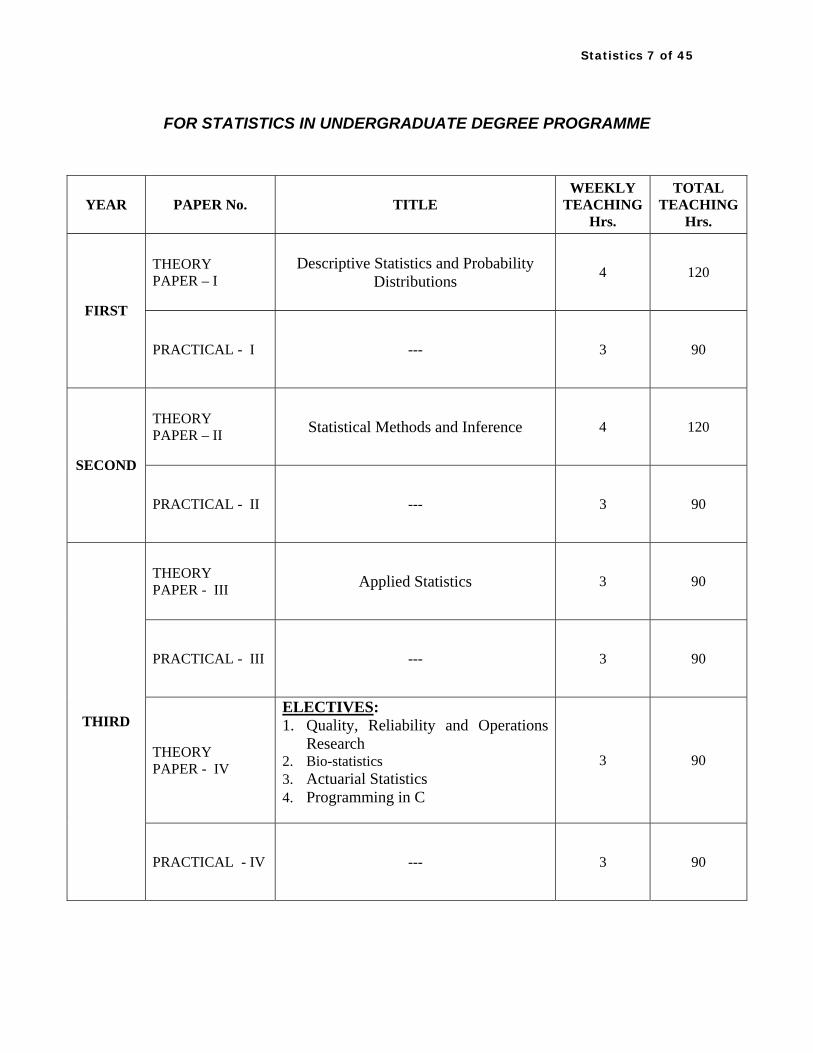
FOR STATISTICS IN UNDERGRADUATE DEGREE PROGRAMME
YEAR PAPER No. TITLE WEEKLY
TEACHING Hrs.
TOTAL TEACHING
Hrs.
THEORY PAPER – I
Descriptive Statistics and Probability Distributions
4 120
FIRST
PRACTICAL - I --- 3 90
THEORY PAPER – II Statistical Methods and Inference 4 120
SECOND
PRACTICAL - II --- 3 90
THEORY PAPER - III Applied Statistics 3 90
PRACTICAL - III --- 3 90
THEORY PAPER - IV
ELECTIVES: 1. Quality, Reliability and Operations
Research 2. Bio-statistics 3. Actuarial Statistics 4. Programming in C
3 90
THIRD
PRACTICAL - IV --- 3 90
Statistics 8 of 45
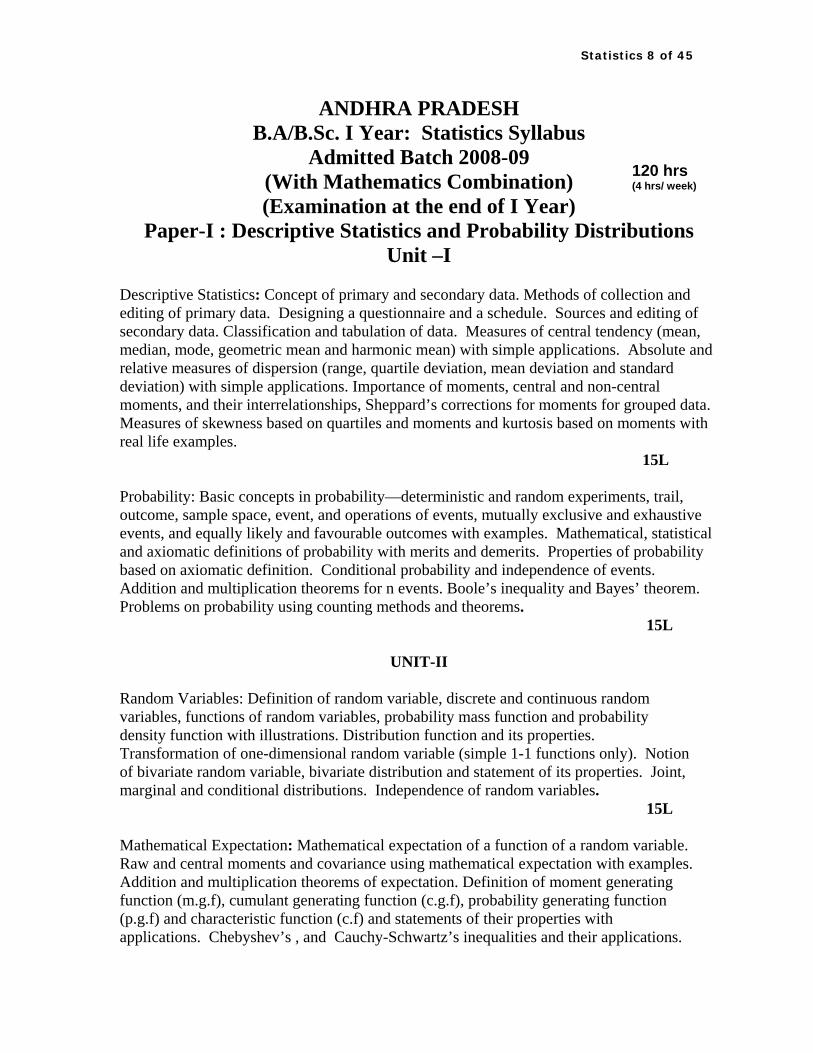
ANDHRA PRADESH B.A/B.Sc. I Year: Statistics Syllabus
Admitted Batch 2008-09 120 hrs (4 hrs/ week) (With Mathematics Combination)
(Examination at the end of I Year) Paper-I : Descriptive Statistics and Probability Distributions
Unit –I Descriptive Statistics: Concept of primary and secondary data. Methods of collection and editing of primary data. Designing a questionnaire and a schedule. Sources and editing of secondary data. Classification and tabulation of data. Measures of central tendency (mean, median, mode, geometric mean and harmonic mean) with simple applications. Absolute and relative measures of dispersion (range, quartile deviation, mean deviation and standard deviation) with simple applications. Importance of moments, central and non-central moments, and their interrelationships, Sheppard’s corrections for moments for grouped data. Measures of skewness based on quartiles and moments and kurtosis based on moments with real life examples. 15L Probability: Basic concepts in probability—deterministic and random experiments, trail, outcome, sample space, event, and operations of events, mutually exclusive and exhaustive events, and equally likely and favourable outcomes with examples. Mathematical, statistical and axiomatic definitions of probability with merits and demerits. Properties of probability based on axiomatic definition. Conditional probability and independence of events. Addition and multiplication theorems for n events. Boole’s inequality and Bayes’ theorem. Problems on probability using counting methods and theorems.
15L
UNIT-II Random Variables: Definition of random variable, discrete and continuous random variables, functions of random variables, probability mass function and probability density function with illustrations. Distribution function and its properties. Transformation of one-dimensional random variable (simple 1-1 functions only). Notion of bivariate random variable, bivariate distribution and statement of its properties. Joint, marginal and conditional distributions. Independence of random variables.
15L Mathematical Expectation: Mathematical expectation of a function of a random variable. Raw and central moments and covariance using mathematical expectation with examples. Addition and multiplication theorems of expectation. Definition of moment generating function (m.g.f), cumulant generating function (c.g.f), probability generating function (p.g.f) and characteristic function (c.f) and statements of their properties with applications. Chebyshev’s , and Cauchy-Schwartz’s inequalities and their applications.
Statistics 9 of 45
Statement and applications of weak law of large numbers and central limit theorem for identically and independently distributed (i.i.d) random variables with finite variance.
15L UNIT-III
Discrete distributions: Uniform, Bernoulli, Binomial, Poisson, Negative binomial, Geometric and Hyper-geometric(mean and variance only) distributions. Properties of these distributions such as m.g.f ,c.g.f., p.g.f., c.f., and moments up to fourth order and their real life applications. Reproductive property wherever exists. Binomial approximation to Hyper-geometric, Poisson approximation to Binomial and Negative binomial distributions. 30L
UNIT – IV Continuous distributions: Rectangular and Normal distributions. Normal distribution as a limiting case of Binomial and Poisson distributions. Exponential, Gamma, Beta of two kinds (mean and variance only) and Cauchy (definition and c.f. only) distributions. Properties of these distributions such as m.g.f., c.g.f., c.f., and moments up to fourth order, their real life applications and reproductive productive property wherever exists. 30L
List of reference books: 1. Willam Feller : Introduction to Probability theory and its applications. Volume –I, Wiley 2. V.K.Kapoor and S.C.Gupta: Fundamentals of Mathematical Statistics, Sultan Chand&Sons, New Delhi 3. GoonAM,Gupta MK,Das Gupta B : Fundamentals of Statistics , Vol-I, the World Press Pvt.Ltd., Kolakota. 4. Hoel P.G: Introduction to mathematical statistics, Asia Publishing house. 5. M.JaganMohan Rao and Papa Rao: A Text book of Statistics Paper-I. 6. Sanjay Arora and Bansi Lal:.New Mathematical Statistics : Satya Prakashan , New Delhi 7. Hogg.Tanis.Rao: Probability and Statistical Inference. 7th edition. Pearson 8. Sambhavyata Avadhi Siddantalu—Telugu Academy 9. Sahasambandham-Vibhajana Siddantamulu – Telugu Academy 10. K.V.S. Sarma: statistics Made Simple:do it yourself on PC. PHI 11. Gerald Keller :Applied Statisticswith Microsoft excel . Duxbury, Thomson Learning. 12. Levine, Stephen, Krehbiel, Berenson: Statistics for Managers using Microsoft Excel 4th edition. Pearson Publication.
Statistics 10 of 45
B.A/B.Sc. I Year: Statistics Syllabus (With Mathematics Combination) (Examination at the end of I Year)
90 hrs (3 hrs/ week) Practical Paper - I
1. Basics of Excel- data entry, editing and saving, establishing and copying a formulae, built in functions in excel, copy and paste and exporting to MS word document. 2.Graphical presentation of data (Histogram, frequency polygon, Ogives). 3. Graphical presentation of data (Histogram, frequency polygon, Ogives) using MS Excel 4. Diagrammatic presentation of data (Bar and Pie). 5. Diagrammatic presentation of data (Bar and Pie) using MS Excel 6.computation of non-central and central moments – Sheppard’s corrections for grouped data. 7. Computation of coefficients of Skewness and Kurtosis – Karl Pearson’s and Bowley’s β1 and β2. 8.Computation of measures of central tendency, dispersion and coefficients of Skew -ness, Kurtosis using MS Excel. 9.Fitting of Binomial distribution – Direct method. 10 Fitting of Binomial distribution – Direct method using MS Excel. 11. Fitting of binomial distribution – Recurrence relation Method. 12.Fitting of Poisson distribution – Direct method. 13. Fitting of Poisson Distribution – Direct method using MS Excel. 14. Fitting of Poisson distribution - Recurrence relation Method. 15. Fitting of Negative Binomial distribution. 16.Fitting of Geometric distribution. 17.Fitting of Normal distribution – Areas method. 18. Fitting of Normal distribution – Ordinates method. 19.Fitting of Exponential distribution. 20. Fitting of Exponential distribution using MS Excel. 21.Fitting of a Cauchy distribution. 22. Fitting of a Cauchy distribution using MS Excel. Note: Training shall be on establishing formulae in Excel cells and derive the results. The excel output shall be exported to MS word for writing inference. -
Statistics 11 of 45
ANDHRA UNIVERSITY B .A/B.Sc. I I Year: Statistics Syllabus
120 hrs (4 hrs/ week) (With Mathematics Combination)
(Examination at the end of II Year) Paper - II: Statistical Methods and Inference
Unit – I
Population correlation coefficient and its properties. Bivariate data, scattered diagram, sample correlation coefficient, computation of correlation coefficient for grouped data. Correlation ratio, Spearman’s rank correlation coefficient and its properties. Principle of least squares, simple linear regression, correlation verses regression, properties of regression coefficients. Fitting of quadratic and power curves. Concepts of partial and multiple correlation coefficients (only for three variables). Analysis of categorical data, independence and association and partial association of attributes, various measures of association (Yule’s) for two way data and coefficient of contingency (Pearson and Tcherprow), coefficient of colligation. (30 L)
Unit – II
Concepts of population, parameter, random sample, statistic, sampling distribution and standard error. Standard error of sample mean(s) and sample proportion(s). Exact sampling distributions- Statement and properties of χ2, t and F distributions and their interrelationships. Independence of sample mean and variance in random sampling from normal distributions. Point estimation of a parameter, concept of bias and mean square error of an estimate. Criteria of good estimator- consistency, unbiasedness, efficiency and sufficiency with examples. Statement of Neyman’s Factorization theorem, derivations of sufficient statistics in case of Binomial, Poisson, Normal and Exponential (one parameter only) distributions. Estimation by method of moments, Maximum likelihood (ML), statements of asymptotic properties of MLE. Concept of interval estimation. Confidence intervals of the parameters of normal population by Pivot method.
(30 L)
Unit –III Concepts of statistical hypotheses, null and alternative hypothesis, critical region, two types of errors, level of significance and power of a test. One and two tailed tests, test function (non-randomized and randomized). Neyman-Pearson’s fundamental lemma for Randomized tests. Examples in case of Binomial, Poisson, Exponential and Normal distributions and their powers. Use of central limit theorem in testing. Large sample tests and confidence intervals for mean(s), proportion(s), standard deviation(s) and correlation coefficient(s). (30 L)
Statistics 12 of 45
Unit – IV Tests of significance based on χ2, t and F. χ2-test for goodness of fit and test for independence of attributes. Definition of order statistics and statement of their distributions. Non-parametric tests- their advantages and disadvantages, comparison with parametric tests. Measurement scale- nominal, ordinal, interval and ratio. One sample runs test, sign test and Wilcoxon-signed rank tests (single and paired samples). Two independent sample tests: Median test, Wilcoxon –Mann-Whitney U test, Wald Wolfowitz’s runs test. (30 L) List of Reference Books: 1. V.K.Kapoor and S.C.Gupta: Fundamentals of Mathematical Statistics, Sultan Chand&Sons, New Delhi 2. Goon AM, Gupta MK,Das Gupta B : Outlines of Statistics , Vol-II, the World Press Pvt.Ltd., Kolakota. 3. Hoel P.G: Introduction to matehematical statistics, Asia Publiushing house. 4.Sanjay Arora and Bansi Lal:.New Mathematical Statistics Satya Prakashan , New Delhi 5.Hogg and Craig :Introduction to Mathematical statistics. Printis Hall 6.Siegal,S.,and Sidney: Non-param etric statistics for Behavioral Science. McGraw Hill. 7GibbonsJ.D and Subhabrata Chakraborti: Nonparametric Statistical Inference. Marcel Dekker. 8.Parimal Mukhopadhyay: Mathematical Statistics. New Central Book agency. 9.Conover : Practical Nonparametric Statistics. Wiley series. 10.V.K.Rohatgi and A.K.Md.Ehsanes Saleh: An introduction to probability and statistics. Wiley series. 11.Mood AM,Graybill FA,Boe’s DC. Introduction to theory of statistics. TMH 12. Paramiteya mariyu aparameteya parikshalu. Telugu Academy. 13.K.V.S. Sarma: Statistics Made simple do it yourself on PC. PHI 14.Gerald Keller: Applied Statistics with Microsoft excel. Duxbury. Thomson Learning 15.Levin, Stephan, Krehbiel, Berenson: Statistics for Managers using Microsoft Excel.4th edition. Pearson Publication. 16.Hogg, Tanis, Rao. Probability and Statistical Inference. 7th edition. Pearson Publication.
Statistics 13 of 45
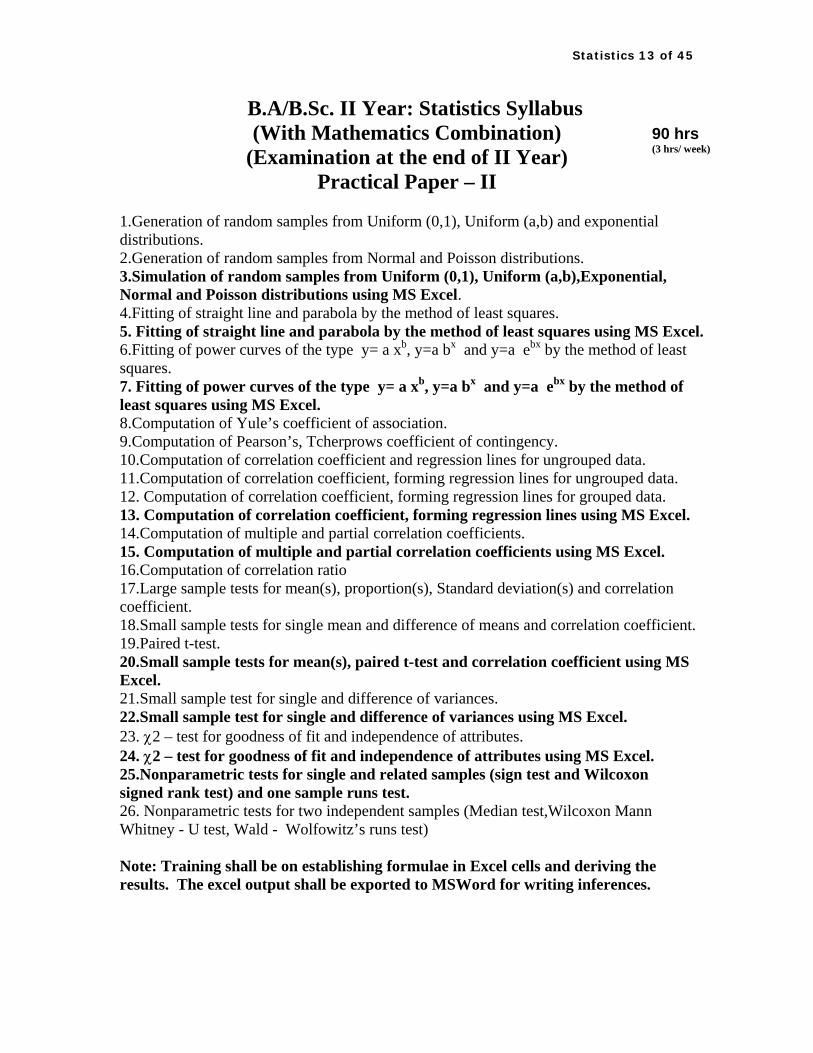
B.A/B.Sc. II Year: Statistics Syllabus (With Mathematics Combination) 90 hrs
(3 hrs/ week) (Examination at the end of II Year) Practical Paper – II
1.Generation of random samples from Uniform (0,1), Uniform (a,b) and exponential distributions. 2.Generation of random samples from Normal and Poisson distributions. 3.Simulation of random samples from Uniform (0,1), Uniform (a,b),Exponential, Normal and Poisson distributions using MS Excel. 4.Fitting of straight line and parabola by the method of least squares. 5. Fitting of straight line and parabola by the method of least squares using MS Excel. 6.Fitting of power curves of the type y= a xb, y=a bx and y=a ebx by the method of least squares. 7. Fitting of power curves of the type y= a xb, y=a bx and y=a ebx by the method of least squares using MS Excel. 8.Computation of Yule’s coefficient of association. 9.Computation of Pearson’s, Tcherprows coefficient of contingency. 10.Computation of correlation coefficient and regression lines for ungrouped data. 11.Computation of correlation coefficient, forming regression lines for ungrouped data. 12. Computation of correlation coefficient, forming regression lines for grouped data. 13. Computation of correlation coefficient, forming regression lines using MS Excel. 14.Computation of multiple and partial correlation coefficients. 15. Computation of multiple and partial correlation coefficients using MS Excel. 16.Computation of correlation ratio 17.Large sample tests for mean(s), proportion(s), Standard deviation(s) and correlation coefficient. 18.Small sample tests for single mean and difference of means and correlation coefficient. 19.Paired t-test. 20.Small sample tests for mean(s), paired t-test and correlation coefficient using MS Excel. 21.Small sample test for single and difference of variances. 22.Small sample test for single and difference of variances using MS Excel. 23. χ2 – test for goodness of fit and independence of attributes. 24. χ2 – test for goodness of fit and independence of attributes using MS Excel. 25.Nonparametric tests for single and related samples (sign test and Wilcoxon signed rank test) and one sample runs test. 26. Nonparametric tests for two independent samples (Median test,Wilcoxon Mann Whitney - U test, Wald - Wolfowitz’s runs test) Note: Training shall be on establishing formulae in Excel cells and deriving the results. The excel output shall be exported to MSWord for writing inferences.
Statistics 14 of 45
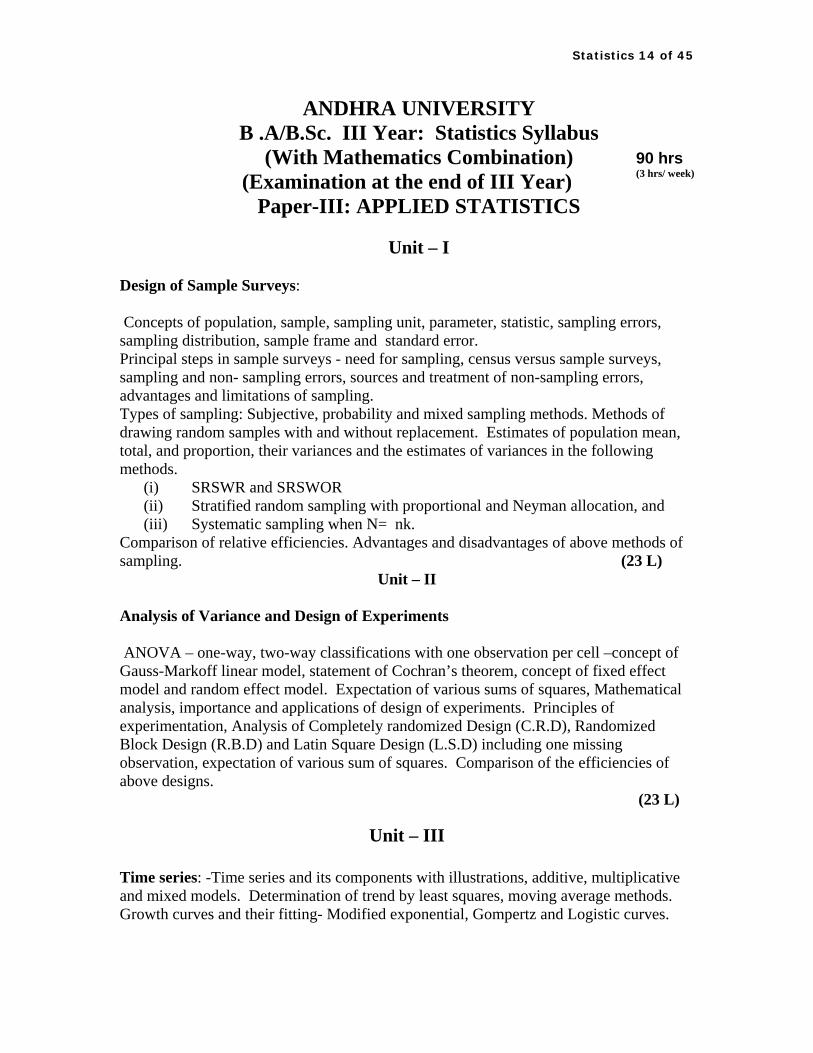
ANDHRA UNIVERSITY B .A/B.Sc. III Year: Statistics Syllabus
(With Mathematics Combination) 90 hrs (3 hrs/ week) (Examination at the end of III Year)
Paper-III: APPLIED STATISTICS
Unit – I Design of Sample Surveys: Concepts of population, sample, sampling unit, parameter, statistic, sampling errors, sampling distribution, sample frame and standard error. Principal steps in sample surveys - need for sampling, census versus sample surveys, sampling and non- sampling errors, sources and treatment of non-sampling errors, advantages and limitations of sampling. Types of sampling: Subjective, probability and mixed sampling methods. Methods of drawing random samples with and without replacement. Estimates of population mean, total, and proportion, their variances and the estimates of variances in the following methods.
(i) SRSWR and SRSWOR (ii) Stratified random sampling with proportional and Neyman allocation, and (iii) Systematic sampling when N= nk.
Comparison of relative efficiencies. Advantages and disadvantages of above methods of sampling. (23 L)
Unit – II Analysis of Variance and Design of Experiments
ANOVA – one-way, two-way classifications with one observation per cell –concept of Gauss-Markoff linear model, statement of Cochran’s theorem, concept of fixed effect model and random effect model. Expectation of various sums of squares, Mathematical analysis, importance and applications of design of experiments. Principles of experimentation, Analysis of Completely randomized Design (C.R.D), Randomized Block Design (R.B.D) and Latin Square Design (L.S.D) including one missing observation, expectation of various sum of squares. Comparison of the efficiencies of above designs. (23 L)
Unit – III Time series: -Time series and its components with illustrations, additive, multiplicative and mixed models. Determination of trend by least squares, moving average methods. Growth curves and their fitting- Modified exponential, Gompertz and Logistic curves.
Statistics 15 of 45
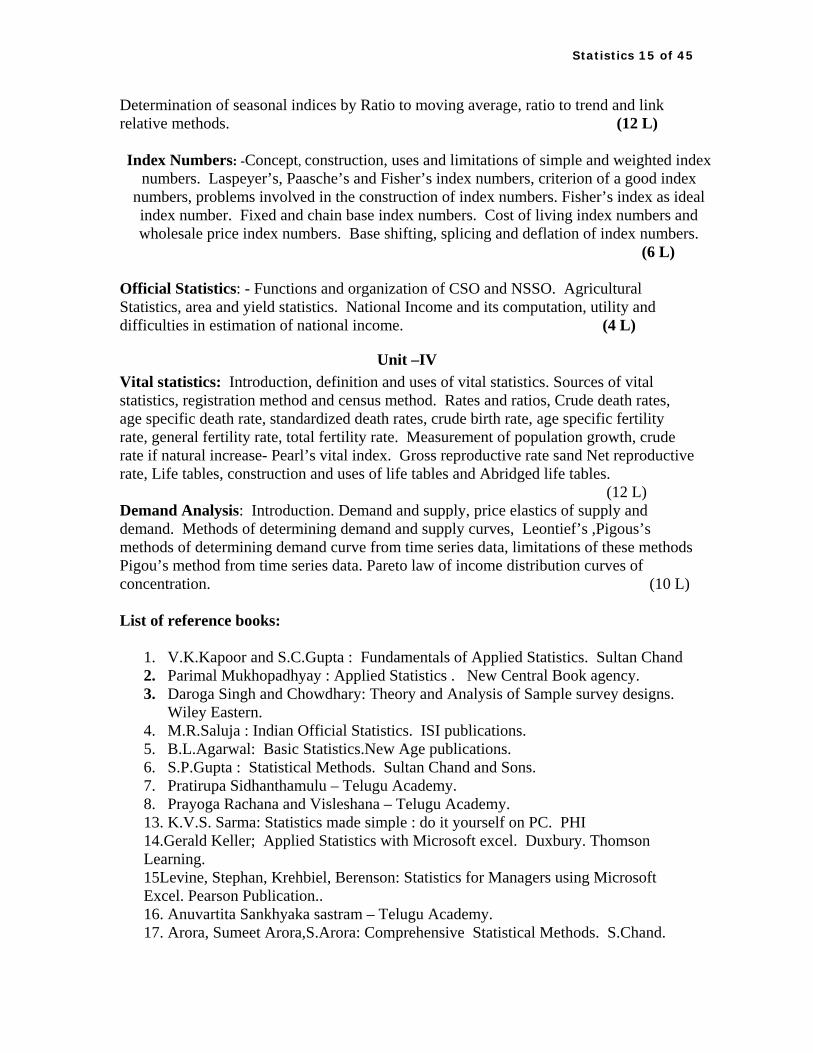
Determination of seasonal indices by Ratio to moving average, ratio to trend and link relative methods. (12 L) Index Numbers: -Concept, construction, uses and limitations of simple and weighted index
numbers. Laspeyer’s, Paasche’s and Fisher’s index numbers, criterion of a good index numbers, problems involved in the construction of index numbers. Fisher’s index as ideal index number. Fixed and chain base index numbers. Cost of living index numbers and wholesale price index numbers. Base shifting, splicing and deflation of index numbers.
(6 L) Official Statistics: - Functions and organization of CSO and NSSO. Agricultural Statistics, area and yield statistics. National Income and its computation, utility and difficulties in estimation of national income. (4 L)
Unit –IV Vital statistics: Introduction, definition and uses of vital statistics. Sources of vital statistics, registration method and census method. Rates and ratios, Crude death rates, age specific death rate, standardized death rates, crude birth rate, age specific fertility rate, general fertility rate, total fertility rate. Measurement of population growth, crude rate if natural increase- Pearl’s vital index. Gross reproductive rate sand Net reproductive rate, Life tables, construction and uses of life tables and Abridged life tables. (12 L) Demand Analysis: Introduction. Demand and supply, price elastics of supply and demand. Methods of determining demand and supply curves, Leontief’s ,Pigous’s methods of determining demand curve from time series data, limitations of these methods Pigou’s method from time series data. Pareto law of income distribution curves of concentration. (10 L) List of reference books:
1. V.K.Kapoor and S.C.Gupta : Fundamentals of Applied Statistics. Sultan Chand 2. Parimal Mukhopadhyay : Applied Statistics . New Central Book agency. 3. Daroga Singh and Chowdhary: Theory and Analysis of Sample survey designs.
Wiley Eastern. 4. M.R.Saluja : Indian Official Statistics. ISI publications. 5. B.L.Agarwal: Basic Statistics.New Age publications. 6. S.P.Gupta : Statistical Methods. Sultan Chand and Sons. 7. Pratirupa Sidhanthamulu – Telugu Academy. 8. Prayoga Rachana and Visleshana – Telugu Academy.
13. K.V.S. Sarma: Statistics made simple : do it yourself on PC. PHI 14.Gerald Keller; Applied Statistics with Microsoft excel. Duxbury. Thomson Learning. 15Levine, Stephan, Krehbiel, Berenson: Statistics for Managers using Microsoft Excel. Pearson Publication.. 16. Anuvartita Sankhyaka sastram – Telugu Academy. 17. Arora, Sumeet Arora,S.Arora: Comprehensive Statistical Methods. S.Chand.
Statistics 16 of 45
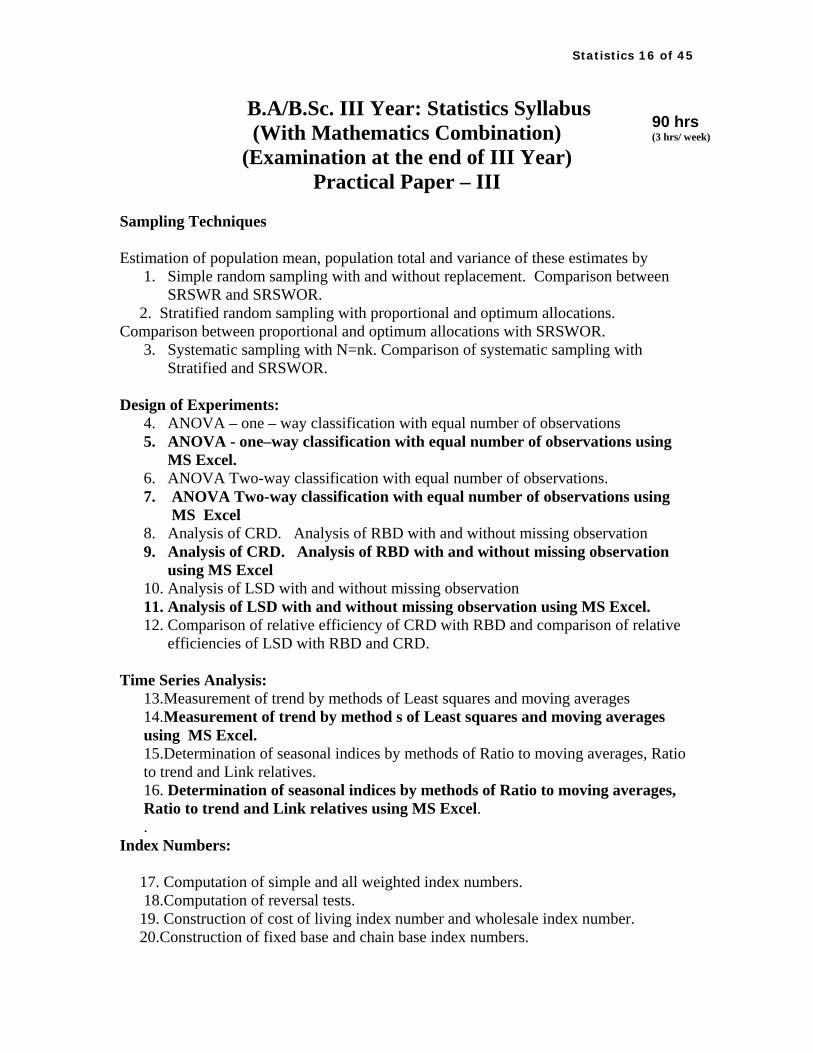
B.A/B.Sc. III Year: Statistics Syllabus 90 hrs (3 hrs/ week) (With Mathematics Combination)
(Examination at the end of III Year) Practical Paper – III
Sampling Techniques Estimation of population mean, population total and variance of these estimates by
1. Simple random sampling with and without replacement. Comparison between SRSWR and SRSWOR.
2. Stratified random sampling with proportional and optimum allocations. Comparison between proportional and optimum allocations with SRSWOR.
3. Systematic sampling with N=nk. Comparison of systematic sampling with Stratified and SRSWOR.
Design of Experiments:
4. ANOVA – one – way classification with equal number of observations 5. ANOVA - one–way classification with equal number of observations using
MS Excel. 6. ANOVA Two-way classification with equal number of observations. 7. ANOVA Two-way classification with equal number of observations using MS Excel 8. Analysis of CRD. Analysis of RBD with and without missing observation 9. Analysis of CRD. Analysis of RBD with and without missing observation
using MS Excel 10. Analysis of LSD with and without missing observation 11. Analysis of LSD with and without missing observation using MS Excel. 12. Comparison of relative efficiency of CRD with RBD and comparison of relative
efficiencies of LSD with RBD and CRD. Time Series Analysis: 13.Measurement of trend by methods of Least squares and moving averages
14.Measurement of trend by method s of Least squares and moving averages using MS Excel. 15.Determination of seasonal indices by methods of Ratio to moving averages, Ratio to trend and Link relatives. 16. Determination of seasonal indices by methods of Ratio to moving averages, Ratio to trend and Link relatives using MS Excel. .
Index Numbers: 17. Computation of simple and all weighted index numbers. 18.Computation of reversal tests. 19. Construction of cost of living index number and wholesale index number. 20.Construction of fixed base and chain base index numbers.
Statistics 17 of 45
21. Base shifting, Splicing and Deflation. 21(a). Computation of all weighted indices, cost of living index number, Base shifting, splicing and deflation using MS Excel.
Vital Statistics: 22.Computation of various Mortality rates, Fertility rates and Reproduction rates. 23. Construction of Life Tables and Abridged life tables. 24. Construction of various rates, life tables and abridged life tables using MS
Excel
Demand Analysis: 25. Construction of Lorenz curve.
26. Fitting of Pareto law to an income data.
27. Construction of Lorenz curve using MS Excel.
Note: Training shall be on establishing formulae in Excel cells and deriving the results. The excel output shall be exported to MSWord for writing inferences.
Statistics 18 of 45
ANDHRA UNIVERSITY B .A/B.Sc. III Year: Statistics Syllabus
90 hrs (3 hrs/ week) (With Mathematics Combination)
(Examination at the end of III Year) Paper-IV: QUALITY, RELIABILITY AND OPERATIONS
RESEARCH
(Elective – I) Unit – I
Statistical Process Control
Importance of SQC in industry. Statistical basis of Shewart control charts. Construction of control charts for variables (mean, range and standard deviation) and attributes ( p , np, and c- charts with fixed and varying sample sizes). Interpretation of control charts. Natural tolerance limits and specification limits, process capability index. Concept of Six sigma and its importance. ( 20 L )
Unit – II Acceptance sampling plans: Producers risk and consumer’s risk. Concept of AQL and LTPD. Single and Double sampling plans for attributes and derivation of their OC and ASN functions. Design of single and double sampling plans for attributes using Binomial. Reliability: Introduction. Hazard function, Exponential distribution as life model, its memory- less property. Reliability function and its estimation. Concepts of censoring and truncation. System reliability - series, parallel and k out of N systems and their reliabilities. (20 L)
Unit – III Linear Programming: Meaning and scope of OR. Convex sets and their properties. Definition of general LPP. Formulation of LPP. Solution of LPP by graphical method. Fundamental theorem of LPP. Simplex algorithm. Concept of artificial variables. Big –M /Penalty method and two-phase simplex methods. Concept of degeneracy and resolving it, Concept of duality, duality as LPP. Dual Primal relationship. Statement of Fundamental theorem of duality. Dual simplex method. (25 L)
Unit - IV
Transportation, Assignment and Sequencing Problems: Definition of transportation problem, TPP as a special case of LPP, feasible solutions by North-West and Matrix minimum methods and VAM. Optimal solution through MODI tableau and stepping stone method for balanced and unbalanced transportation problem. Degeneracy in TP and resolving it. Transshipment problem.
Statistics 19 of 45
Formulation and description of Assignment problem and its variations. Assignment problem as special case of TP and LPP. Unbalanced assignment problem, traveling salesman problem. Optimal solution using Hungarian method. Problem of Sequencing. Optimal sequence of N jobs on two and three machines without passing. (25 L)
List of reference books 1. Kanti Swaroop,P.K.Gupta and ManMohan: Operations Research. Sultan Chand. 2. D.C.Montgomary: Introduction to Statistical Quality Control. Wiley
3. V.K.Kapoor and S.C.Gupta L Fundamentals of Applied Statistics. Sultan Chand 4. S.K.Sinha: Reliability and life testing. Wiley Eastern 5 L.S.Srinath: Reliability Engineering. Affiliated East-West Press. 6. Gass: Linear Programming. Mc Graw Hill. 7. Hadly : Linrar programming. Addison-Wesley. 8.Wayne L. Winston : Operations Research. Thomson, India edition. 4th edition. 9. S.M.Ross: Probability Models. Harcourt India PVT.Ltd., 10. Parimal Mukhopadhyay : Applied Statistics . New Central Book agency
11. Anuvartita Sankhyaka sastram – Telugu Academy. 12. R.C.Gupta: Statistical Quality Control. 13. Taha : Operations Research: An Introduction : Mac Millan. 14. Parikriya Parishodhana - Telugu Academy.
Statistics 20 of 45
B.A/B.Sc. III Year: Statistics Syllabus 90 hrs (3 hrs/ week) (With Mathematics Combination)
(Examination at the end of III Year) Practical Paper –IV
(Elective – I) Statistical Quality Control 1.Construction of mean, range and standard deviation charts. 2. Construction of mean, range and standard deviation charts using MS Excel 3.Construction of p, np and c- charts with fixed and varying sample sizes. 4.Construction of p, np and c- charts with fixed and varying sample sizes using MS Excel. 5.Designing of Single sampling plan and Double sampling plan for attributes and construction of their OC and ASN curves 6. Designing of Single sampling plan and Double sampling plan for attributes and construction of their OC and ASN curves using MS Excel. Reliability 7.Computation of reliability for series, parallel and k out of n systems. 8Computation of reliability for series, parallel and k out of n systems using MS Excel.
Operations Research: 9.Formulation and graphical solutions of LPP (using different inequality type constraints) 10.Solution of LPP by simplex method. 11.Solution of LPP by simplex method using TORA 12.Solution of an LPP using Big-M and two phase simplex methods 13.Solution of an LPP using Big-M method and two phase simplex method using TORA 14.Solution of an LPP using principal of duality and dual simplex methods. 15.Solution of an LPP using principal of duality and dual simplex methods using TORA. 16.Formulation and solution of transportation problem using North-West corner rule, Matrix minimum methods and VAM and to test their optimality. 17.Formulation and solution of transportation problem using North-West corner rule,
Matrix minimum methods and VAM and to test their optimality using TORA
Statistics 21 of 45
18.Optimum solution to balanced and unbalanced transportation problems by MODI method (both maximization and minimization cases). 19.Formulation and solution of Assignment problem using Hungarian method (both maximization and minimization cases), 20.Formulation and solution of Assignment problem using Hungarian method (both
maximization and minimization cases using TORA
21.Solution of unbalanced Assignment problem. 22. Solution of traveling salesman problem. 23. Solution of sequencing problem—processing of n jobs through two machines and processing of n jobs through three machines. Note: Training shall be on establishing formulae in Excel cells and deriving the results. The excel output shall be exported to MSWord for writing inferences.
Statistics 22 of 45
ANDHRA UNIVERSITY
B .A/B.Sc. III Year : Statistics Syllabus 90 hrs (3 hrs/ week) (With Mathematics Combination)
(Examination at the end of III Year) Paper-IV: BIO-STATISTICS
(Elective – II) Unit – I
Bioassay The purpose and structure of biological assay. Types of biological assays, Direct assays, Ratio estimates, asymptotic distributions: Feller’s theorem. Regression approach to estimating dose-response, relationships, Logit and Probit approaches when dose-response curve for standard preparation is unknown, quantal responses, methods of estimation of parameters, estimation of extreme quantiles, dose allocation schemes, polychotomous quantal response, estimation of points on the quantal response function. (23 L)
Unit – II Statistical Genetics Basic terminology of genetics.Frequencies of genes and genotypes, Mendal’s law, Hardy-Weinberg equilibrium. Mating Frequencies, estimation of allele frequency (dominant /co dominant cases). Multiple alleles. Approach to equilibrium for X-linked gene, natural selection, mutation, genetic drift, equilibrium when both natural selection and mutation are operative. (22 L)
Unit – III Survival Analysis Survival functions and hazard rates. Types of censoring and likelihood in these cases. Life distributions- Exponential, Gamma, Weibull, Lognormal, Pareto. Linear failure rate. Point estimation, confidence intervals, scores, likelihood ratio, MLE, tests for these distributions. Life tables, failure rates, mean residual life and their elementary properties, Ageing classes and their properties, Bathtub failure rate. Estimation of survival function. Acturial estimator, Kaplan-Meier estimator, estimation under the assumption of IFR/ DFR. Tests of exponentiality against nonparametric classes, total time on test. (23 L)
Unit – IV Quantitative Epidemiology Introduction to modern epidemiology, principles of epidemiological investigation, serveillance and disease monitoring in populations. Epidemiologic measures: Organizing and presenting epidemiologic data, measures of disease frequency, measures of effect and association, causation and casual inference.
Statistics 23 of 45
Design and analysis of epidemiologic studies. Types of studies, case-control studies, cohort studies, cross over design, regression models for the estimation of relative risk. Meta –analysis, quantitative methods in screening. (22 L) List of reference books: 1.D.J.Finney (1970): Statistical methods in Biological Assay. Charles Griffin. 2.Z.Govindarajulu (2000): Statistical Techniques in Bioassay. Karger Publishers/Panther Publishers. 3.C.C.Li (1976): First course in population genetics. Boxwood press, California. 4. Falcon and Mackay (1998) : Introduction to quantitative genetics. Longman 5.Cox.D.R. and Oakes.D (1984): analysis of survival data. Chapman and Hall. 6.Miller, R.G. (12981): Survival analysis. John wiley. 7. Anil gore and S.A.Paranjpe (2000). A course in mathematical and statistical ecology. Kulwer Academic Publishers. 8. Rielon E.C (1977): An introduction to Mathematical Ecology. Wiley. 9. J.F.Lawless: Statistical models and methods of life data. Wiley. 10. James F Crow and Motoo Kimura: An Introduction to Population Genetics Theory. Alpha edition. 11.Abraham M.Lilienfeld : Foundations of Epidemiology. Oxford University Press.
Statistics 24 of 45
B.A/B.Sc.IIIYEAR : Statistics Syllabus 90 hrs (3 hrs/ week) (With Mathematics Combination)
(Examination at the end of III year) Practical Paper IV
(Elective – II)
1. Estimation of relative potency and its standard error. 2.Fitting exponential growth model to data by linearization method. 3. Fitting logistic growth model. 4. Dose response relation and its estimation by least squares method. 5. Dose response relation and estimation by MLE method. 6. Estimation of extreme quantiles. 7. Estimation of points on the quantal response. 8. Hardy –Weinberg equilibrium frequencies. 9. Estimation of allele frequencies. 10. Effects of mutation and selection. 11. Equilibrium—Balance between selection and mutation. 12. Selection and the Hardy -Weinberg test. 13. Genetic drift. 14. Parameter estimation in exponential and Weibull distributions—Type-I, Type-II censoring. 15. LR tests for exponential and Weibull distribution. 16. Actuarial method of estimation. 17. Kaplan-Meier estimator. 18. Total time on test. 19. Fitting bathtub shaped hazard function. 20. Measures of mortality. 21. Risk difference, risk ratio and odd ratio. 22. Cox Regression.
The above practicals are to be carried out using MS Excel Note: Training shall be in establishing formulae in Excel cells and derive the results. The excel output shall be exported to MS Word for writing inference.
Statistics 25 of 45
ANDHRA UNIVERSITY B.A/B.Sc. III YEAR: Statistics Syllabus
(With Mathematics Combination) 90 hrs (3 hrs/ week) (Examination at the end of III year)
Paper IV: ACTUARIAL STATISTICS (Elective – III)
Unit –I.
Utility theory, insurance and utility theory, models for individual claims and their sums, survival function, curate future lifetime, force of mortality. Life table and its relation with survival function examples, assumptions of fractional ages, some analytical laws of mortality select and ultimate tables. (20 L)
Unit – II Multiple life functions, joint life and last survivor status, insurance and annuity benefits through multiple life functions, evaluation for special mortality laws. Multiple decrement models, deterministic and random survivorship groups, associated single decrement tables, central rates of multiple decrement, net single premiums and their numerical evaluations. Distribution of aggregate claims, compound Poisson distribution and its applications. (25 L)
Unit -III Elements of compound interest(nominal and effective rate of interest) Life annuities: single payment, continuous life annuities, discrete life annuities, life annuities with monthly payments, communication functions, varying annuities, recursions and complete annuities- immediate and apportioable annuities –due. (25 L)
Unit - IV Net premiums: Continuous and discrete premiums, true monthly payment premiums, apportionate premiums, commutation functions, and accumulation type benefits. Net premium reserves: continuous and discrete net premium reserve, reserves on a semi continuous basis, reserves based on true monthly premiums, reserves on an apportionable or accounted continuous basis reserves at fractional durations. (20 L)
Statistics 26 of 45
List of Reference books: 1. N.L.Bowers, H.U.Gerber, J.C.Hickman, D.A.Jones and C.J.Nesbitt (1986): Actuarial Mathematics, Society of Actuaries, Ithaca, Illinois,USA . 2. Neill,A.(1977): Life contingencies, Heineman. 3. Spurgeon E.T.(1972): Life contingencies, Cambridge University Press 4. Benjamin,B and Pollard,J.H(1980): Analysis of Mortality and other Actuarial Statistics. 5. Federation of Insurance Institutes study courses: mathematical basis of Life Assurance F.I.21 (Published by Federation if Insurance Institutes, Bombay).
Statistics 27 of 45
B.A/B.Sc.IIIYEAR: Statistics Syllabus 90 hrs (3 hrs/ week) (With Mathematics Combination)
(Examination at the end of III year) Practical Paper IV
(Elective – III)
1. Computation of values of utility function. 2. Computation of various components of life tables. 3. Construction of multiple decrement table for deterministic survival group. 4. Determination of distribution function, survival function and force of mortality. 5. Construction of multiple decrement table for random survivorship group. 6. Construction of select, ultimate and aggregate mortality. 7. Calculation of p.d.f. and distribution function of aggregate claims. 8. Computation of compound interest (nominal and effective rate of interests). 9. Annuities and annuity dues. 10. Computation of discrete and continuous net premiums. 11. Annuities payable more frequently than one year. 12. Complete and special annuities. 13. Office premium a. 14. Assurances payable at the moment of death.
Statistics 28 of 45
ANDHRA UNIVERSITY
B.A/B.Sc. III YEAR: Statistics Syllabus 90 hrs (3 hrs/ week) (With Mathematics Combination)
(Examination at the end of III year) Paper IV: PROGRAMMING IN C
(Elective – IV)
Unit – I History and features of C language. Components of C language, Structure of a C program. Data type; Basic data types, Enumerated data types, Derived data types. Variable declaration; Local, Global, Parametric variables, Assignment of variables. Numeric. Character, real and string constants. Arithmetic, relation and logical operators. Assignment operators. Increment and Decrement operators, conditional operators, Bitwise operators. Type modifiers and expressions, writing and interpreting expressions, using expressions in statements. Basic input/output. Control statements, conditional statements, if..else, Nesting of if..else, elseif ladder, switch statements, loops in C: for, while, do.., while loops.Break, continue, exit( ), goto and label declarations (23 L) Unit - II One dimensional, two dimensional and multidimensional arrays. Functions, classification of functions, functions definition and declaration, assessing a function, return statement. Storage classes: Automatic variables, External variables, static variables, register variables, Scope and lifetime declarations. Parameter passing in functions, recursion in functions. Pointers: Pointer notation: and *operators. Pointer declaration and Initialization, assessing a variable le through pointer, pointer expressions, pointer arithmetic, pointer comparison, pointer increment/decrement and scale factor. Pointer and Array: Pointers and one dimensional arrays, dynamic memory allocation functions malloc and calloc, pointers and multidimensional arrays, arrays of pointers. Pointers and functions: Pointers to pointers, pointers and functions, pointers to functions, Function returning pointers, functions with variable number of arguments. (23 L) Unit – III
Structure: Definition and declaration, structure (initialization, comparison of structure variables, array of structures; array within structures, structures within structures. Passing structures to functions; structure pointers. Unions- definition and declaration, Accessing a union member, union of structure, initialization of a union variable, uses of union. Introduction to linked list, linear linked list insertion of a node on list, removal of anode from list. (22 L)
Statistics 29 of 45
Unit - IV Files in C: Defining and opening a file, closing a file, input-output operation on file, Creating a file, reading a file. Preprocessors: Introduction to preprocessors, Macro Substitution, simple Macro Substitution, Macro with arguments Nesting of Macros, Undefining a Macro, File inclusion, Conditional Compilation Directives. Standard header files, Library functions. String functions, Mathematical functions, Date and time functions, Variables argument list function, utility functions, character class test functions. (22 L) List of Reference Books: 1. Balagurusamy, E: Programming in ANSI C . Tata McGraw Hill. 2. Kanetkar, Y.P.: Working with C. BPB Publications. 3. Gottfried, Byron S: Theory and problems of programming with C, TMH 4. Schildt, Herbert: C : the complete reference . 3rd edition. TMH 5. Schildt, Herbert: C Made easy. McGraw Hill.
Statistics 30 of 45
B.A/B.Sc. III Year: Statistics Syllabus (With Mathematics Combination)
(Examination at the end of III Year) 90 hrs (3 hrs/ week) Practical Paper –IV
(Elective – IV) C – Programming - List of Practical
1. Reading and writing a line of text 2. Averaging student’s examination Scores 3. Calculating standard deviation 4. Finding the median 5. Roots of a quadratic equation 6. Finding whether a given number is a prime or not 7. Searching for palindromes 8. Calculating factorial 9. Reading and writing the name Character by Character 10. Finding longest of a given set values 11. Generating Fibonacci numbers 12. Calculating the correlation coefficient 13. Printing a line of text backwards 14. Encoding a string of Characters 15. Concatenation of two strings 16. Transpose of a given matrix 17. Addition of two matrices 18. Multiplication of two matrices 19. Check whether the given matrix is an identity matrix 20. Creating a data file 21. Reading a data file 22. Creating an co unformatted file 23. Processing student’s exam score defining a structure 24. Writing the output into a new data file 25. Appending a new record
Statistics 31 of 45
B.A/B.Sc STATISTICS WITH
NON-MATHEMATICS COMBINATION
Statistics 32 of 45
B.A/B.Sc. I Year: Statistics Syllabus (For Non-Mathematics Combination) 120 hrs
(4 hrs/ week) (Examination at the end of I Year) Paper-I: Elementary Mathematics and Descriptive Statistics
Unit-I
Concept of sequences and series, fundamentals of sets and functions, types of functions; solution of simultaneous linear equations, quadratic equation; progressions- AP, GP, HP; permutations and combinations, Binomial theorem. Definition and types of matrices, addition, subtraction, scalar multiplication and multiplication of matrices, determinant of matrix, transpose of a matrix, inverse and rank of matrix (3 X 3 case only) solution of simultaneous linear equations by matrix methods- Cramer’s Rule, Gauss Jordan Method, Matrix Inversion. 30L
Unit-II Elements of differentiation, differential coefficient of algebraic and exponential functions only. Maxima and minima of a function, partial derivatives. Elements of integration, Integration by parts and by substitutions. 30L
Unit-III Definition of statistics, its applications to various disciplines, scope, limitation and distrust of statistics, primary and secondary data, methods of collection of primary data, sources of secondary data, conduct of statistical inquiry, preparation of questionnaire and schedule, editing of primary and secondary data. Classification and tabulation. Characteristics of ideal classification of data, Frequency distribution, Bivariate table, rules of tabulation, simple and complex tables, single, double, and manifold tables. Data Presentation: diagrams:- Bar diagrams, two dimensional diagrams, square, rectangle and pie chart. Graphs- Histogram, frequency polygon, frequency curve, ogive, semilog and double log graphs. 30L
Unit-IV Measures of Central tendency: Characteristics of good average, AM, GM, HM, Median and Mode- their merits and demerits, graphical location of median and mode, weighted averages, quartiles, deciles, percentiles. Measures of dispersion: Characteristics of good measures of dispersion, range, Q.D., SD, M.D, Measures of relative variation, coefficient of variation, Lorenz Curve. 30L
Statistics 33 of 45
Reference Books: 1)S.P.Gupta: Statistical Methods. Sultan Chand 2)S.C.Gupta and V.K.Kapur: fundamentals of Mathematical Statistics. Sultan Chand. 3.Moulika Ganithamu Sambavyata - Telugu Academy. 4.Arora ,Sumeet Arora,S.Arora: Comprehensive Statistical Methods. S.Chand 5.Shantinarayana: Differential Calculus. S.Chand. 6.H.s.HALL AND S.R.knight: HIGHER Algebra. HM. Publications. 7.Schaum’s Outlines of College Algebra. McGraw Hill. 8.Schaum;s Outlines of Matrices. McGraw Hill 9.schaum;s Out lines of calculus. McGraw Hill.
Statistics 34 of 45
B.A/B.Sc. I Year: Statistics Syllabus 90 hrs (3 hrs/ week) (For Non-Mathematics Combination)
(Examination at the end of I Year) Practical Paper-I
(Elementary Mathematics and Descriptive Statistics)
1. Basics of Excel- data entry, editing and saving, establishing and copying a formulae, built in functions in excel, copy and paste and exporting to MS word document.
2. Solution of Linear equations by Using: Matrix Inversion, Cramer and Gauss-Jordon Methods.
3. Diagrammatic representation of data: Bar diagrams, Pie diagrams 4. Diagrammatic representation of data: Bar diagrams, Pie diagrams using MS EXCEL 5. Construction of Frequency Distribution with Equal and Unequal class intervals 6. Graphical representation of Frequency Distribution with Equal and Unequal class
intervals. 7. Computation of mean, median and mode of a frequency distribution with Equal and
Unequal class intervals. 8. Computation of median by Graphical method. 9. Computation of mean, median and mode of a frequency distribution Using MS
EXCEL 10.Computation of HM, GM of frequency distribution with Equal and Unequal class
intervals. 11. Computation of mean deviation. 12. Computation of mean deviation using MS Excel 13. Computation of Standard deviation. 14. Computation of Standard deviation Using MS Excel 15. Computation of Quartile deviation. 16. Computation of Coefficient of variation. Note: Training shall be on establishing formulae in Excel cells and deriving the results. The excel output shall be exported to MSWord for writing inferences.
Statistics 35 of 45
B.A/B.Sc. II Year: Statistics Syllabus 120 hrs (4 hrs/ week) (For Non-Mathematics Combination)
(Examination at the end of II Year) Paper-II: Statistical Methods
Unit- I
Attributes- Classification of data- double and manifold class, class frequencies and ultimate class frequencies- Contingency tables-Concept of Association and Independence- Types of association – Consistency of data- Various Measures of Association- Yule’s Coefficient of Colligation. Importance of moments, central and non-central moments, and their interrelationships, Sheppard’s corrections for moments for grouped data. Measures of skewness based on quartiles and moments and kurtosis based on moments with real life examples. 30 L
Unit- II
Probability: Basic concepts in probability—deterministic and random experiments, trail, outcome, sample space, event, and operations of events, mutually exclusive and exhaustive events, and equally likely and favourable outcomes with examples– Classical, statistical and axiomatic definitions – addition and multiplication theorems – conditional probability – Statement of Baye’s theorem – simple examples of their direct applications. Definitions of random variable – discrete random variable, probability function of a discrete random variable – probability mass function (p.m.f) – continuous random variable – probability density function (p.d.f ) – definition of a distribution function for both discrete and continuous random variable – Concept of mathematical expectation statements of its basic results and some simple problems. 30L
Unit- III Definition, properties and applications of Bernoulli, Binomial, Poisson, Negative
binomial, geometric, Hyper Geometric, Rectangular, Normal, Exponential distributions – Simple problems relating to the above distributions.
Statistics 36 of 45
Need and meaning of Interpolation, Methods of Interpolation – Graphic method – Finite difference – Binomial expression method – Newton’s and Lagrange’s formula for Interpolation. 30 L
Unit – IV Curve fitting: Principles of lease squares-fitting of straight line, parabola,
exponential and logarithmic curves- concept of correlation- Types of correlation- Scatter Diagrams – Karl Pearson’s Correlation Coefficient – Spearman’s rank correlation with repeated ranks – Simple Linear regression – Lines of Regression – Regression Coefficients and their properties. 30L
Reference Books: 1. Saha Sambandham – Vibhajana Siddhantamu Vol.- I & Vol. – II .Telugu Academy
2. V.K.Kapoor and S.C.Gupta: Fundamentals of Mathematical Statistics. Sultan Chand.
3. Sambavyata - Telugu Academy
4. Sankyka Vislashanamu – Telugu Academy
5. S.P.Gupta: Statistical Methods . Sultan Chand
6. Arora ,Sumeet Arora,S.Arora: Comprehensive Statistical Methods. S.Chand
7. Levine Stephan, Krehbiel, Berenson.Statistics for Managers Using Microsoft Excel. Pearson publication.
8.Goon, Gupta and Das Gupta: Fundamentals of Statistics . Volume I .World Press. 9. K.V.S. Sarma: statistics Made Simple: do it yourself on PC. PHI 10. Gerald Keller :Applied Statistics with Microsoft excel . Duxbury, Thomson Learning.
Statistics 37 of 45
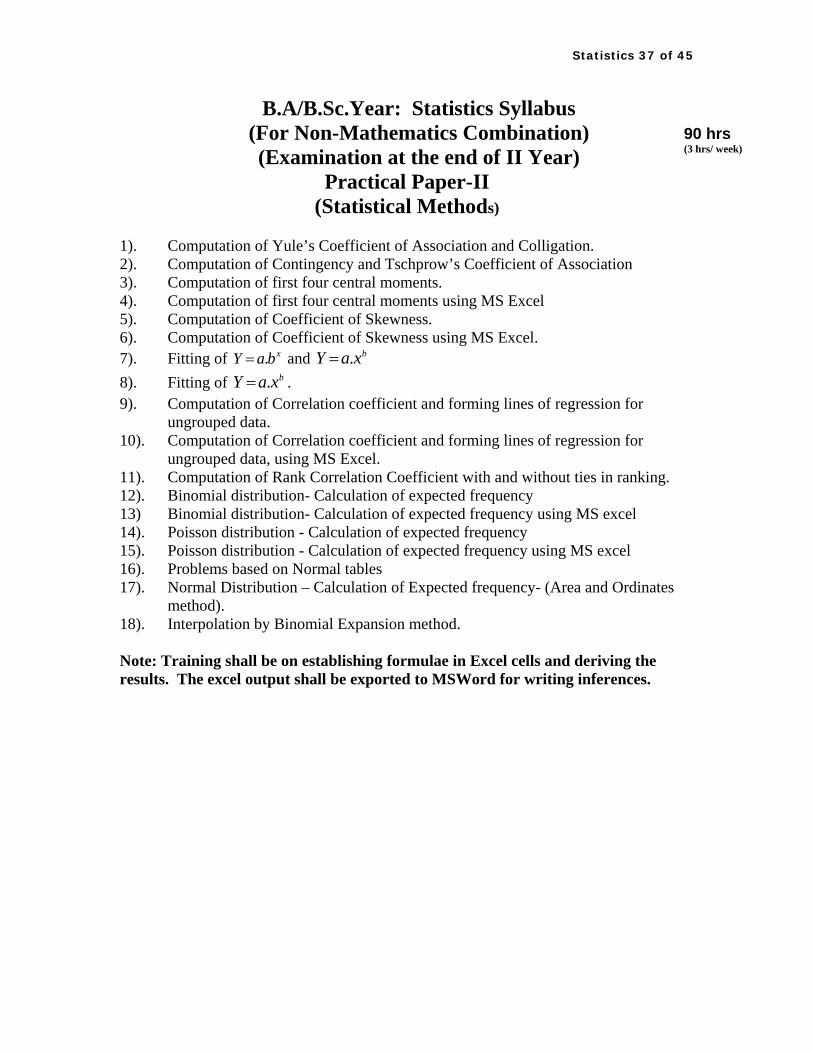
B.A/B.Sc.Year: Statistics Syllabus (For Non-Mathematics Combination) 90 hrs
(3 hrs/ week) (Examination at the end of II Year) Practical Paper-II
(Statistical Methods) 1). Computation of Yule’s Coefficient of Association and Colligation. 2). Computation of Contingency and Tschprow’s Coefficient of Association 3). Computation of first four central moments. 4). Computation of first four central moments using MS Excel 5). Computation of Coefficient of Skewness. 6). Computation of Coefficient of Skewness using MS Excel. 7). Fitting of and . xY a b= . bY a x= 8). Fitting of . . bY a x=9). Computation of Correlation coefficient and forming lines of regression for
ungrouped data. 10). Computation of Correlation coefficient and forming lines of regression for
ungrouped data, using MS Excel. 11). Computation of Rank Correlation Coefficient with and without ties in ranking. 12). Binomial distribution- Calculation of expected frequency 13) Binomial distribution- Calculation of expected frequency using MS excel 14). Poisson distribution - Calculation of expected frequency 15). Poisson distribution - Calculation of expected frequency using MS excel 16). Problems based on Normal tables 17). Normal Distribution – Calculation of Expected frequency- (Area and Ordinates
method). 18). Interpolation by Binomial Expansion method. Note: Training shall be on establishing formulae in Excel cells and deriving the results. The excel output shall be exported to MSWord for writing inferences.
Statistics 38 of 45
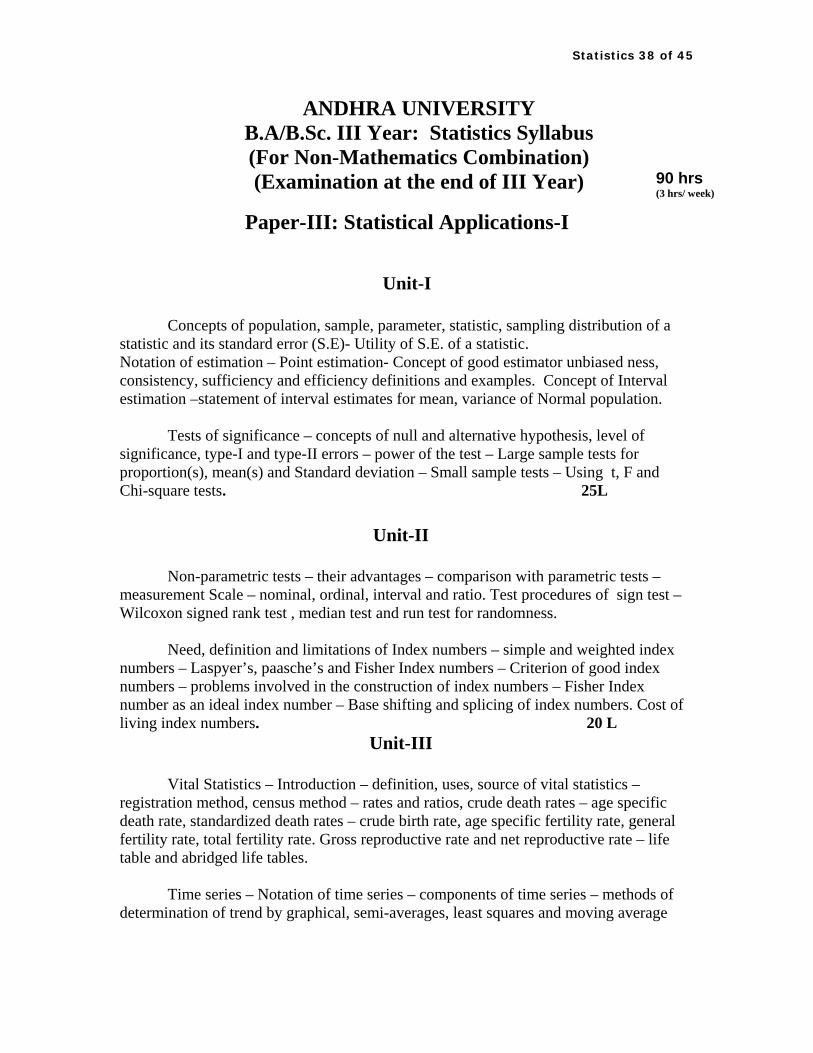
ANDHRA UNIVERSITY B.A/B.Sc. III Year: Statistics Syllabus (For Non-Mathematics Combination)
90 hrs (3 hrs/ week)
(Examination at the end of III Year)
Paper-III: Statistical Applications-I
Unit-I Concepts of population, sample, parameter, statistic, sampling distribution of a statistic and its standard error (S.E)- Utility of S.E. of a statistic. Notation of estimation – Point estimation- Concept of good estimator unbiased ness, consistency, sufficiency and efficiency definitions and examples. Concept of Interval estimation –statement of interval estimates for mean, variance of Normal population. Tests of significance – concepts of null and alternative hypothesis, level of significance, type-I and type-II errors – power of the test – Large sample tests for proportion(s), mean(s) and Standard deviation – Small sample tests – Using t, F and Chi-square tests. 25L
Unit-II
Non-parametric tests – their advantages – comparison with parametric tests – measurement Scale – nominal, ordinal, interval and ratio. Test procedures of sign test – Wilcoxon signed rank test , median test and run test for randomness. Need, definition and limitations of Index numbers – simple and weighted index numbers – Laspyer’s, paasche’s and Fisher Index numbers – Criterion of good index numbers – problems involved in the construction of index numbers – Fisher Index number as an ideal index number – Base shifting and splicing of index numbers. Cost of living index numbers. 20 L
Unit-III
Vital Statistics – Introduction – definition, uses, source of vital statistics – registration method, census method – rates and ratios, crude death rates – age specific death rate, standardized death rates – crude birth rate, age specific fertility rate, general fertility rate, total fertility rate. Gross reproductive rate and net reproductive rate – life table and abridged life tables.
Time series – Notation of time series – components of time series – methods of determination of trend by graphical, semi-averages, least squares and moving average
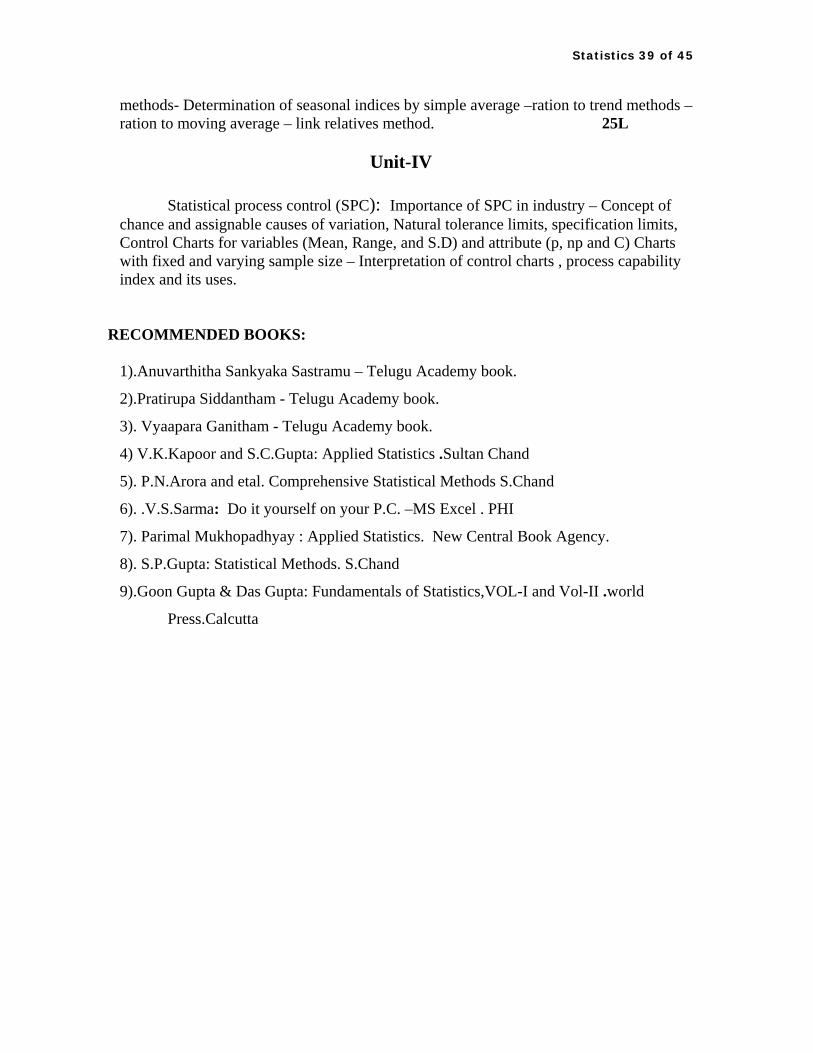
Statistics 39 of 45
methods- Determination of seasonal indices by simple average –ration to trend methods – ration to moving average – link relatives method. 25L
Unit-IV Statistical process control (SPC): Importance of SPC in industry – Concept of
chance and assignable causes of variation, Natural tolerance limits, specification limits, Control Charts for variables (Mean, Range, and S.D) and attribute (p, np and C) Charts with fixed and varying sample size – Interpretation of control charts , process capability index and its uses.
RECOMMENDED BOOKS: 1).Anuvarthitha Sankyaka Sastramu – Telugu Academy book.
2).Pratirupa Siddantham - Telugu Academy book.
3). Vyaapara Ganitham - Telugu Academy book.
4) V.K.Kapoor and S.C.Gupta: Applied Statistics .Sultan Chand
5). P.N.Arora and etal. Comprehensive Statistical Methods S.Chand
6). .V.S.Sarma: Do it yourself on your P.C. –MS Excel . PHI
7). Parimal Mukhopadhyay : Applied Statistics. New Central Book Agency.
8). S.P.Gupta: Statistical Methods. S.Chand
9).Goon Gupta & Das Gupta: Fundamentals of Statistics,VOL-I and Vol-II .world
Press.Calcutta
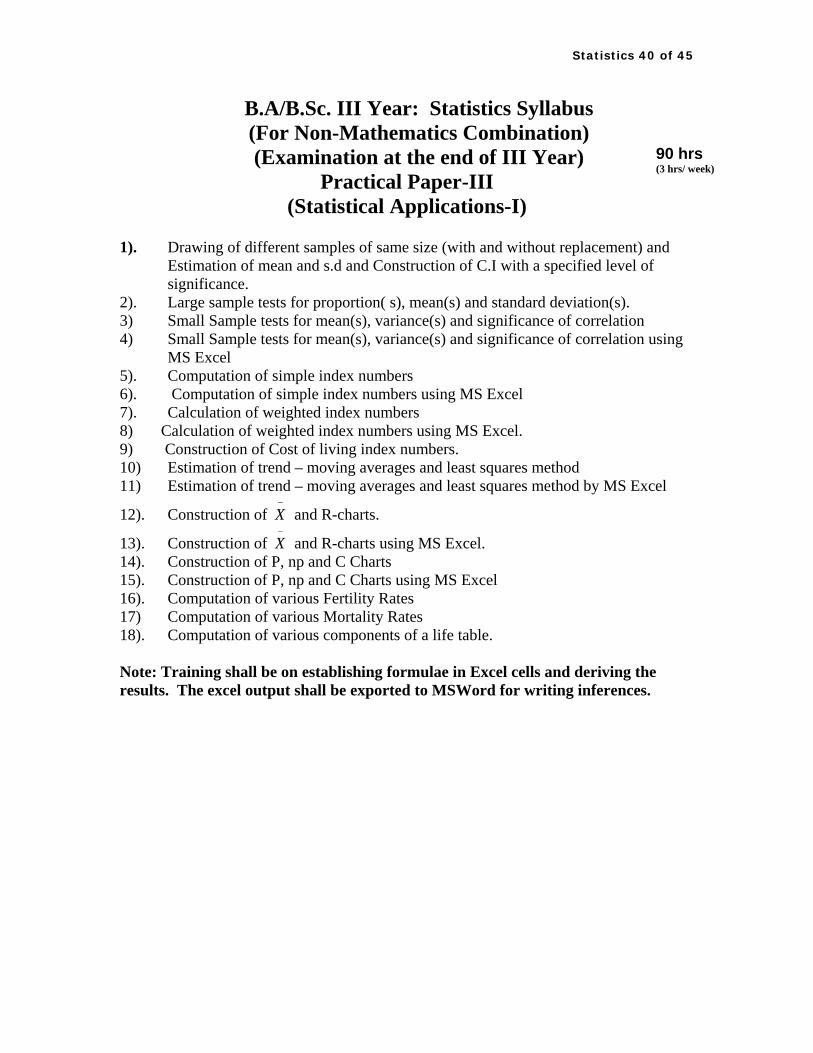
Statistics 40 of 45
B.A/B.Sc. III Year: Statistics Syllabus (For Non-Mathematics Combination)
90 hrs (3 hrs/ week)
(Examination at the end of III Year) Practical Paper-III
(Statistical Applications-I) 1). Drawing of different samples of same size (with and without replacement) and
Estimation of mean and s.d and Construction of C.I with a specified level of significance.
2). Large sample tests for proportion( s), mean(s) and standard deviation(s). 3) Small Sample tests for mean(s), variance(s) and significance of correlation 4) Small Sample tests for mean(s), variance(s) and significance of correlation using
MS Excel 5). Computation of simple index numbers 6). Computation of simple index numbers using MS Excel 7). Calculation of weighted index numbers 8) Calculation of weighted index numbers using MS Excel. 9) Construction of Cost of living index numbers. 10) Estimation of trend – moving averages and least squares method 11) Estimation of trend – moving averages and least squares method by MS Excel
12). Construction of X−
and R-charts.
13). Construction of X−
and R-charts using MS Excel. 14). Construction of P, np and C Charts 15). Construction of P, np and C Charts using MS Excel 16). Computation of various Fertility Rates 17) Computation of various Mortality Rates 18). Computation of various components of a life table. Note: Training shall be on establishing formulae in Excel cells and deriving the results. The excel output shall be exported to MSWord for writing inferences.
Statistics 41 of 45
ANDHRA UNIVERSITY B.A/B.Sc. III Year: Statistics Syllabus
90 hrs (3 hrs/ week) (For Non-Mathematics Combination)
(Examination at the end of III Year) Paper-IV (a): Sampling Techniques and Design of Experiments
Unit-I
Sampling versus Census, planning organization and execution of sample surveys, pilot surveys, sampling and non-sampling errors, some large-scale surveys conducted in India, limitations of sampling. 20L
Unit-II Probability and non-probability sampling Schemes, Random number tables and drawing of random samples, Simple random sampling (with and without replacement) Stratified random sampling, allocation of sample size under proportional and optimum allocation, systematic sampling – linear and circular. 25L
Unit-III
Cluster sampling, two stage with equal number of clusters. National income statistics- concept of National Income, methods of estimation of national income. Functions and organization of CSO and NSSO. 20 L
Unit-IV Concept of analysis of variance, one- way and two-way classification. Principles of design of experiments, Randomization, Replication and Local Control, description of Completely Randomized Design, Randomized Block Design, and Latin square Design.
and Factorial experiments and their relative merits. 25L 22 32 Suggested Books:
1.Sample Survey Siddanthalu – Telugu academy 2.Prayoga Rachana Visleshana- Telugu academy 3.Anuvarthitha Sankyaka Sastramu- Telugu academy 4.V.K.Kapoor and S.C.Gupta: Applied Statistics Sultan Chand 5.Goon, Gupta and Das Gupta: Fundamentals of Statistics ,VOL-II . World Press, Calcutta. 6.Daroga Singh and Choudary: Sample Survey Design Wiley Eastern. 7.Parimal Mukhopadyaya: Applied Statistics. New Central Book Agenc 8.S.P.Gupta: Statistical Methods. S.Chand 9. P.N.Arora and etal. Comprehensive Statistical Methods S.Chand
Statistics 42 of 45
B.A/B.Sc. III Year: Statistics Syllabus (For Non-Mathematics Combination) 90 hrs
(3 hrs/ week) (Examination at the end of III Year)
Practical Paper - IV (a) (Sampling Techniques and Design of Experiments)
1. Drawing of Simple random sampling with replacement and simple random
sampling without replacement.
2. Simple random Sampling
3. Stratified sampling
4. Systematic sampling
5. Estimation of National Income
6. Analysis of CRD
7. Analysis of CRD using MS EXCEL
8. Analysis of RBD
9. Analysis of RBD using MS EXCEL
10. Analysis of LSD
11. Analysis of experiments 22
12. Analysis of experiments. 32
Note: Training shall be on establishing formulae in Excel cells and deriving the results. The excel output shall be exported to MSWord for writing inferences
Statistics 43 of 45
ANDHRA UNIVERSITY B.A/B.Sc. III Year: Statistics Syllabus (For Non-Mathematics Combination) (Examination at the end of III Year)
Paper-IV (b): Elements of Numerical Analysis and Operations Research
90 hrs (3 hrs/ week)
Unit-I
Numerical differentiation- finding dydx
and 2
2
d ydx
using Newton’s forward and backward
Methods. Numerical Integration- Trapezoidal Rule, Simpson’s 1/3 rule, Simpson’s 3/8
rule and Weddlers rules. 20L
Unit-II.
Definition and Scope of Operations research and different types of models. Definition
and formulation of linear programming problem (LPP) solution of LPP using graphical
and simplex methods. 20L
Unit-III
Transportation Problem (TP) – Finding Initial Basic Feasible Solution (IBFS) to TP
using North West Corner rule, Row minima, Column minima, Matrix minima and
Vogel’s Approximation method and Optimum solution to TP using Stepping Stone and
MODI methods. 25L
Unit-IV
Game theory – Rectangular games, Rectangular games with saddle point, solution by
graphical method, solving 2 x m and n x 2 games. Problem of job sequencing –
sequencing of n jobs through two machines and ‘n’ jobs through ‘K’ machines. 25L
List of reference Books:
1. Numerical Analysis – Telugu Academy books
2. Vyapara ganitham – Telugu Academy books
3. Kanti Swaroop, Gupta and Manmohan: Operations Research-Sultan chand.
4. Goel and Mittal: Operations Research.
5. Maurica Sasieni: Operations Research Methods and Problems.
6. Winston : Operations Research.
7. Parikriya Parishodhana – Telugu Academy.
8. Taha : Operations Research. PHI
9. S.S.Sastry; Introduction to Numerical Analysis. PHI
Statistics 44 of 45
B.A/B.Sc. III Year : Statistics Syllabus
90 hrs (3 hrs/ week) (For Non-Mathematics Combination)
(Examination at the end of III Year) Practical Paper-IV (b)
(Elements of Numerical Analysis and Operations Research)
1. Numerical Differentiation
2. Numerical Integration
3. Solution of LPP by graphical method
4. LPP graphical method- Exceptional cases
5. Solution of LPP by simplex method.
6. Transportation Problem: IBFS by North West Corner Rule, Matrix Minima
7. Transportation Problem – IBFS by Vogel’s approximation method
8. Transportation Problem: optimum solution by stepping stone method
9. Game theory: Saddle point problems
10. Game theory: solution of the game by graphical method
11. Solving 2 x m and n x 2 games
12. Optimum sequence of n Jobs through 2 machines
13. Optimum sequence of n Jobs through K machines
Note: 3 – 13 practicals should be carried out using TORA software also.
Statistics 45 of 45
Resolutions: 1. It is resolved to adopt the Model curriculum given by
A.P.S.C.H.E., for B.Sc.,/B.A., Statistics with Mathematics and without Mathematics combinations into to from the academic year 2008-09.
2. It is resolved to request the Andhra University authorities to insist an enclusive statistics Labouratory for statistics practicals with atleast 20 (twenty) systems one printer, licensed nearsion of M.S. Office 2007 with solver, equation editor and TORA practice for each college having statistics course.
3. It is resolved that the Chairman, B.O.S. (U.G.) to formulate for Model Question papers in accordance with the unit systems and University pattern before 30th September 2008 and request to the concerned affiliated the model papers.
4. It is resolved that regarding practical examinations the examiners are to be appointed according to the list of examiners in the District instead of regions since in many regions the colleges are having only part-time faculty.
5. It is resolved to organize a workshop for college teachers to refresh their knowledge in the new topics included by the University.