ap statistics final project.pdf
TRANSCRIPT
AP Statistics Final Project!!Group Members: Austin Lubetkin! !Topic: In this project I intend to test the association between the proportion of colors in dark a chocolate versus regular M&Ms through a chi-squared 2 way test of independence. I chose to compare those two varieties because they are the closest in shape and colors among the varieties.!!Method of Data Collection: To begin I purchased a party sized bag of regular M&Ms and I also purchased two regular size bags of dark chocolate M&Ms which is equivalent in ounces of chocolate. To begin I sorted the M&Ms into 5 bowls which were:!
1. Milk chocolate red, green, and blue pieces!2. Milk chocolate orange, yellow, and brown pieces!3. Dark Chocolate red, green, and blue pieces!4. Dark Chocolate orange, yellow, and brown pieces!5. Anomalies!
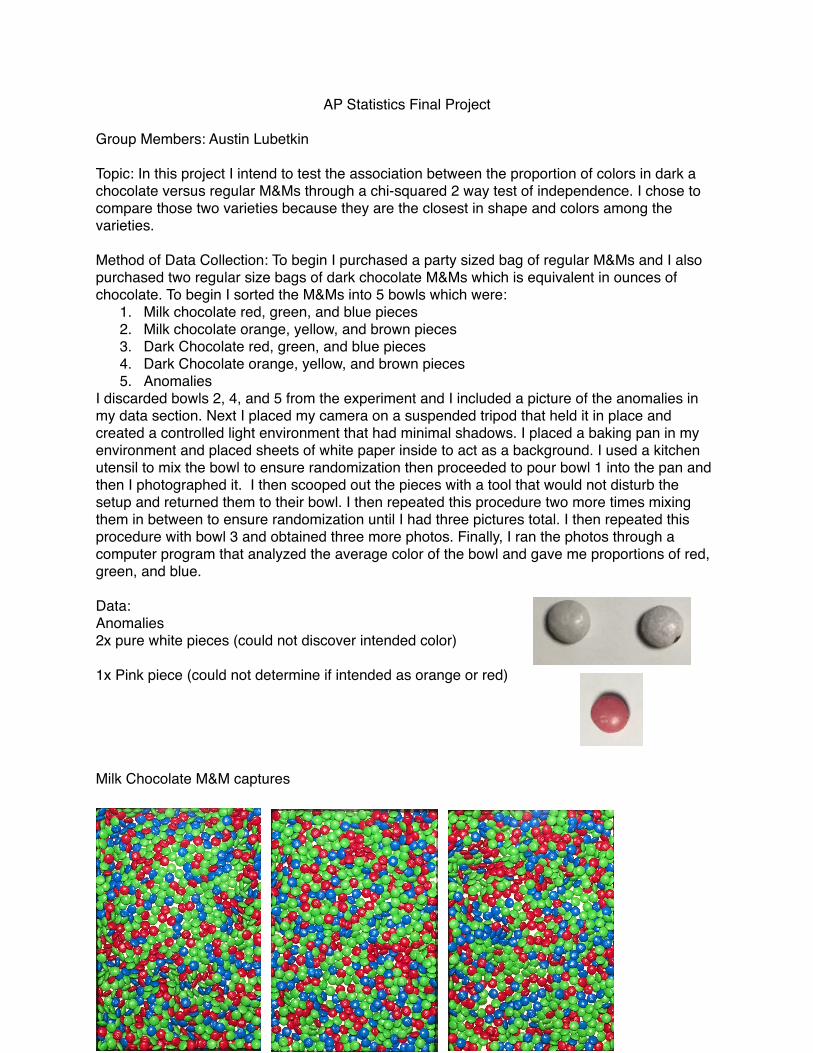
I discarded bowls 2, 4, and 5 from the experiment and I included a picture of the anomalies in my data section. Next I placed my camera on a suspended tripod that held it in place and created a controlled light environment that had minimal shadows. I placed a baking pan in my environment and placed sheets of white paper inside to act as a background. I used a kitchen utensil to mix the bowl to ensure randomization then proceeded to pour bowl 1 into the pan and then I photographed it. I then scooped out the pieces with a tool that would not disturb the setup and returned them to their bowl. I then repeated this procedure two more times mixing them in between to ensure randomization until I had three pictures total. I then repeated this procedure with bowl 3 and obtained three more photos. Finally, I ran the photos through a computer program that analyzed the average color of the bowl and gave me proportions of red, green, and blue.!!Data:!Anomalies !2x pure white pieces (could not discover intended color)!!1x Pink piece (could not determine if intended as orange or red)!!!!!!Milk Chocolate M&M captures! !!!!!!!!!
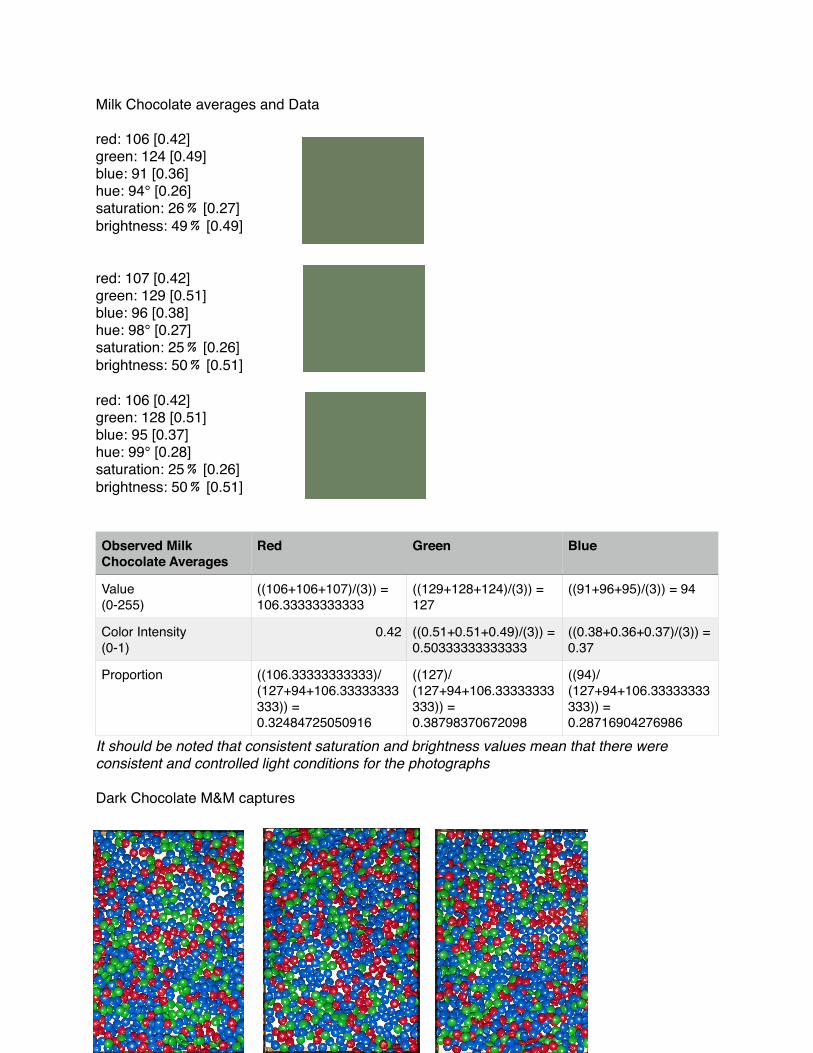
Milk Chocolate averages and Data!!red: 106 [0.42]!green: 124 [0.49]!blue: 91 [0.36]!hue: 94° [0.26]!saturation: 26﹪ [0.27]!brightness: 49﹪ [0.49]!!!red: 107 [0.42]!green: 129 [0.51]!blue: 96 [0.38]!hue: 98° [0.27]!saturation: 25﹪ [0.26]!brightness: 50﹪ [0.51]!!red: 106 [0.42]!green: 128 [0.51]!blue: 95 [0.37]!hue: 99° [0.28]!saturation: 25﹪ [0.26]!brightness: 50﹪ [0.51]!!!
It should be noted that consistent saturation and brightness values mean that there were consistent and controlled light conditions for the photographs!!Dark Chocolate M&M captures! !!!!!!!!
Observed Milk Chocolate Averages
Red Green Blue
Value!(0-255)
((106+106+107)/(3)) = 106.33333333333
((129+128+124)/(3)) = 127
((91+96+95)/(3)) = 94
Color Intensity!(0-1)
0.42 ((0.51+0.51+0.49)/(3)) = 0.50333333333333
((0.38+0.36+0.37)/(3)) = 0.37
Proportion ((106.33333333333)/(127+94+106.33333333333)) = 0.32484725050916
((127)/(127+94+106.33333333333)) = 0.38798370672098
((94)/(127+94+106.33333333333)) = 0.28716904276986
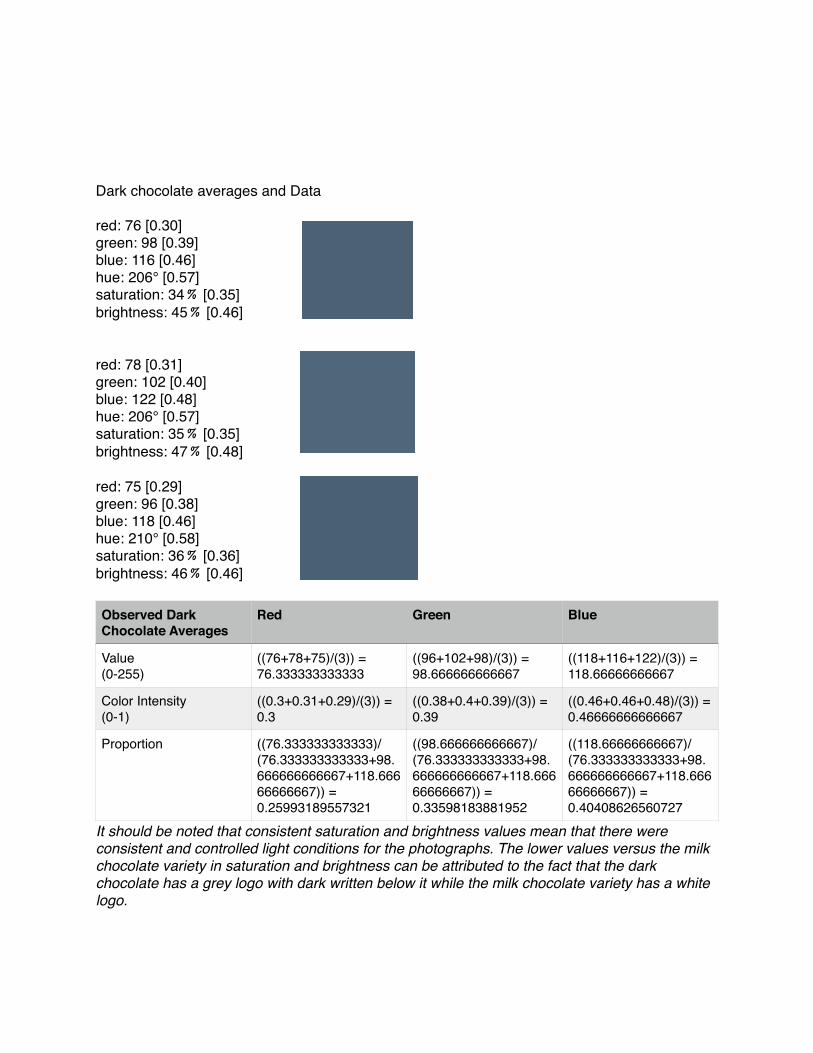
!!!!!Dark chocolate averages and Data!!red: 76 [0.30]!green: 98 [0.39]!blue: 116 [0.46]!hue: 206° [0.57]!saturation: 34﹪ [0.35]!brightness: 45﹪ [0.46]!!!red: 78 [0.31]!green: 102 [0.40]!blue: 122 [0.48]!hue: 206° [0.57]!saturation: 35﹪ [0.35]!brightness: 47﹪ [0.48]!!red: 75 [0.29]!green: 96 [0.38]!blue: 118 [0.46]!hue: 210° [0.58]!saturation: 36﹪ [0.36]!brightness: 46﹪ [0.46]!!
It should be noted that consistent saturation and brightness values mean that there were consistent and controlled light conditions for the photographs. The lower values versus the milk chocolate variety in saturation and brightness can be attributed to the fact that the dark chocolate has a grey logo with dark written below it while the milk chocolate variety has a white logo.!!!
Observed Dark Chocolate Averages
Red Green Blue
Value!(0-255)
((76+78+75)/(3)) = 76.333333333333
((96+102+98)/(3)) = 98.666666666667
((118+116+122)/(3)) =!118.66666666667
Color Intensity!(0-1)
((0.3+0.31+0.29)/(3)) = 0.3
((0.38+0.4+0.39)/(3)) = 0.39
((0.46+0.46+0.48)/(3)) = 0.46666666666667
Proportion ((76.333333333333)/(76.333333333333+98.666666666667+118.66666666667)) = 0.25993189557321
((98.666666666667)/(76.333333333333+98.666666666667+118.66666666667)) = 0.33598183881952
((118.66666666667)/(76.333333333333+98.666666666667+118.66666666667)) = 0.40408626560727
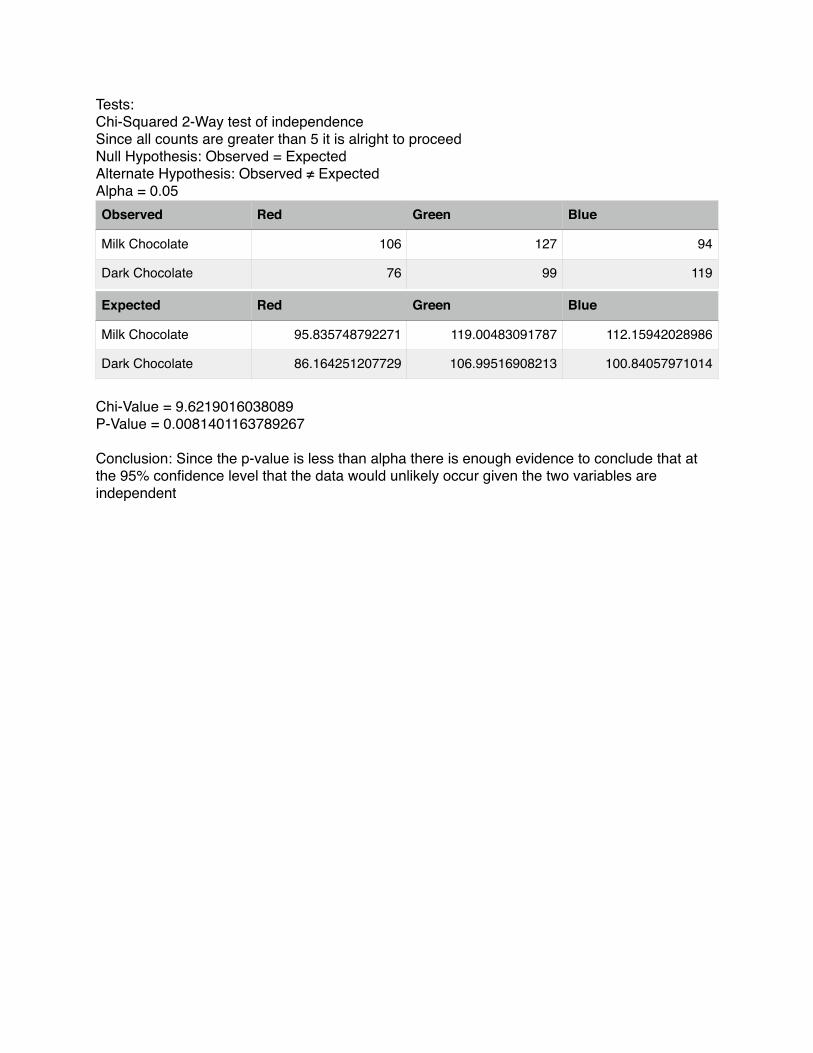
Tests:!Chi-Squared 2-Way test of independence!Since all counts are greater than 5 it is alright to proceed!Null Hypothesis: Observed = Expected!Alternate Hypothesis: Observed ≠ Expected!Alpha = 0.05!
!Chi-Value = 9.6219016038089!P-Value = 0.0081401163789267!!Conclusion: Since the p-value is less than alpha there is enough evidence to conclude that at the 95% confidence level that the data would unlikely occur given the two variables are independent
Observed Red Green Blue
Milk Chocolate 106 127 94
Dark Chocolate 76 99 119
Expected Red Green Blue
Milk Chocolate 95.835748792271 119.00483091787 112.15942028986
Dark Chocolate 86.164251207729 106.99516908213 100.84057971014