apca a market directed inventory system (mdis) national farmers union annual convention omaha,...
TRANSCRIPT

AP CA
A Market Directed Inventory System
(MDIS)
National Farmers Union Annual ConventionOmaha, Nebraska
March 5, 2012
Daryll E. Ray and Harwood D. SchafferAgricultural Policy Analysis Center
University of Tennessee Institute of Agriculture

AP CA
Policy Description
Objectives of MDIS – Bulk of revenue from market receipts– Reduce government payments while
maintaining farm income– Reduce price volatility that otherwise would
cause “viable and profitable” agricultural firms to go out of business including:• Crop farmers• Livestock producers• Ethanol producers• Agricultural processors

AP CA
Policy Description
Two Parts to the MDIS Analysis–Historical• Rerun of history from 1998 to 2010• Except the commodity programs are replaced
with MDIS–Ten Years into Future• Analysis covers 2012 to 2021 using the ten-year
USDA baseline released in February of 2012• The baseline is shocked to mimic the variability
experienced during 1998 thru 2021• Compare MDIS with current program variations

AP CA
Policy Description
MDIS Specifications for Historical Study Period, 1998 thru 2010– Initial corn loan rate set at midpoint between
variable and full cost of production– Indexed with a prices paid by farmers index–Other crop loan rates set to historic loan rate
ratios with corn– Release prices are set at 160% of loan rates

AP CA
Policy Description
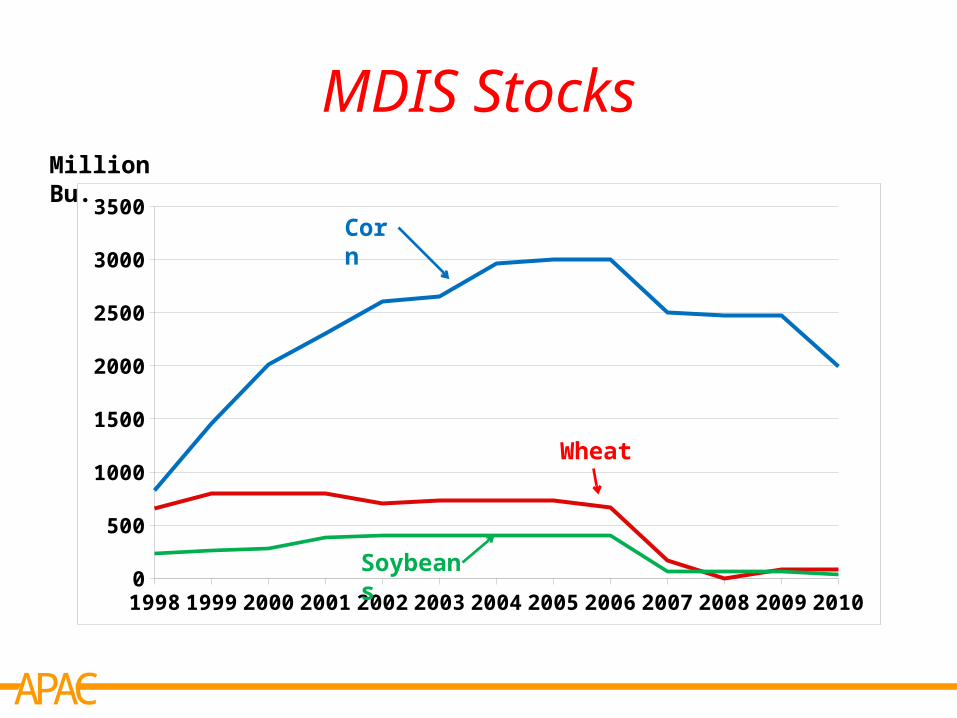
MDIS Specifications for 1998-2010 Study Period–MDIS maximums• Corn – 3 billion bushels• Wheat – 800 million bushels• Soybeans – 400 million bushels
– Farmer storage payment rate 40¢/bu./yr– Set-aside available if needed– Eliminate Direct Payments, LDPs, & CCPs

AP CA
Corn Prices
$0.00
$1.00
$2.00
$3.00
$4.00
$5.00
$6.00
1998 1999 2000 2001 2002 2003 2004 2005 2006 2007 2008 2009 2010
Historic Baseline
Release Price
Loan Rate

AP CA
Corn Prices
$0.00
$1.00
$2.00
$3.00
$4.00
$5.00
$6.00
1998 1999 2000 2001 2002 2003 2004 2005 2006 2007 2008 2009 2010
Historic Baseline
MDIS
Release Price
Loan Rate

AP CA
Corn PricesAverage Per Year Over Each Period
$0.00
$0.50
$1.00
$1.50
$2.00
$2.50
$3.00
$3.50
$4.00
$4.50
1998-2005 2006-2010 1998-2010
Historic Baseline
MDIS
$2.05
$2.68
$4.02$3.71
$2.81$3.07

AP CA
8 Crops - Government Payments
$0
$5
$10
$15
$20
1998 1999 2000 2001 2002 2003 2004 2005 2006 2007 2008 2009 2010
Historic Baseline
MDIS
$ Billion

AP CA
8 Crops – Government PaymentsAverage Per Year Over Each Period
$0
$2
$4
$6
$8
$10
$12
$14
$16
1998-2005 2006-2010 1998-2010
Historic Baseline
MDIS
$ Billion
$14.8
$4.8
$6.8
$3.6
$11.7
$4.3

AP CA
Corn Exports - Quantity
0
500
1000
1500
2000
2500
1998 1999 2000 2001 2002 2003 2004 2005 2006 2007 2008 2009 2010
Historic Baseline
MDIS
Million Bu.

AP CA
Corn Value of ExportsAverage Per Year Over Each Period
$0
$1
$2
$3
$4
$5
$6
$7
$8
$9
1998-2005 2006-2010 1998-2010
Historic Baseline
MDIS
$ Billion
$3.9
$4.8
$8.3$7.7
$5.6 $5.9

AP CA
8 Crops Value of Exports
1998 1999 2000 2001 2002 2003 2004 2005 2006 2007 2008 2009 2010$0
$5
$10
$15
$20
$25
$30
$35
$40
$45
Historic Baseline
MDIS
$ Billion

AP CA
8 Crops - Value of Exports
1998-2005 2006-2010 1998-2010$0
$5
$10
$15
$20
$25
$30
$35
Historic Baseline
MDIS
$ Billion
$15.6
$19.1
$32.8$31.2
$22.2$23.7
AP CA
MDIS Stocks
1998 1999 2000 2001 2002 2003 2004 2005 2006 2007 2008 2009 20100
500
1000
1500
2000
2500
3000
3500Corn
Wheat
Million Bu.
Soybeans

AP CA
Corn – Value of Production plus Government Payments
Average Per Year Over Each Period
$0
$10
$20
$30
$40
$50
$60
1998-2005 2006-2010 1998-2010
Historic Baseline
MDIS
$ Billion
$26.4$28.2
$51.5$46.5
$36.1 $35.2
AP CA
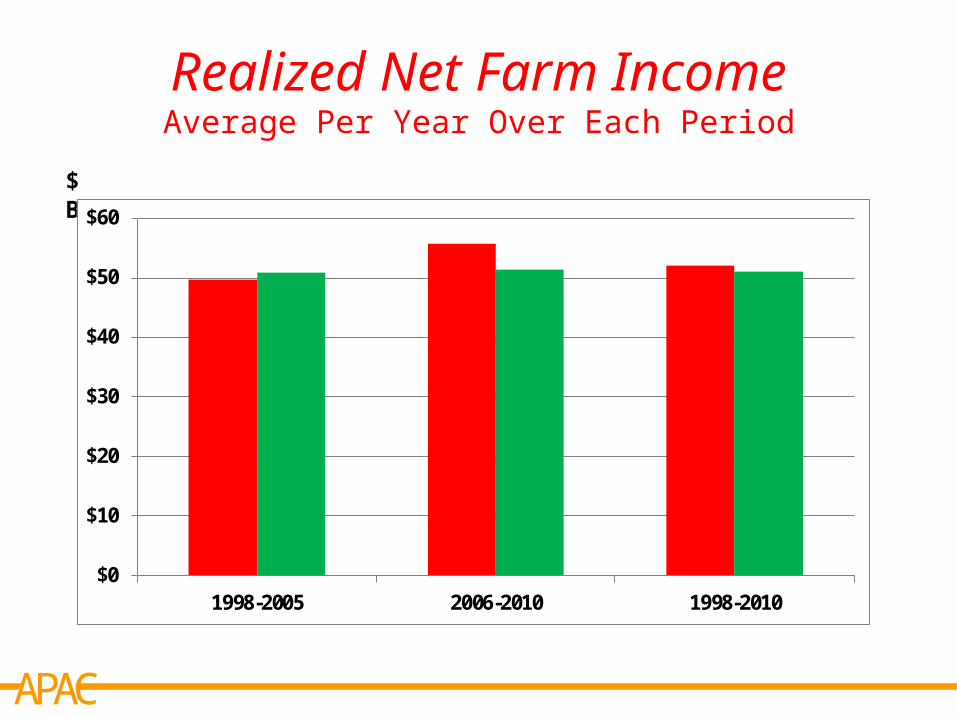
Realized Net Farm IncomeAverage Per Year Over Each Period
$0
$10
$20
$30
$40
$50
$60
1998-2005 2006-2010 1998-2010
Historic Baseline MDIS
$ Billion
$49.8 $50.8$55.8
$51.5 $52.1 $51.1

AP CA
Summary Historical Analysis
Over the Study Period, 1998-2010, with MDIS in Place: – Government payments 60% lower– Increased crop prices and increased reliance
on market receipts– Value of exports $20 billion higher– Lower price volatility benefitting:• Crop farmers• Livestock producers and industrial users• Consumers and agricultural processors

APCA
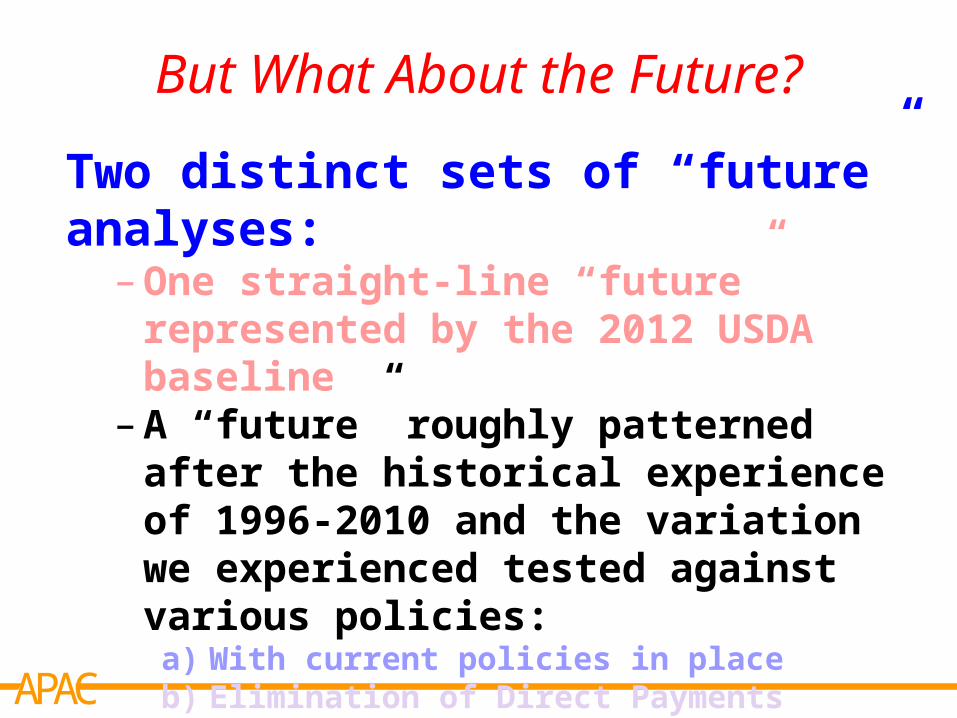
But What About the Future?
Two distinct sets of “future” analyses: – One straight-line “future” represented
by the 2012 USDA baseline– A “future” roughly patterned after the
historical experience of 1996-2010 and the variation we experienced tested against various policies:
a) With current policies in placeb) Elimination of Direct Paymentsc) Raise Loan Rates with no DPsd) MDIS

AP CA
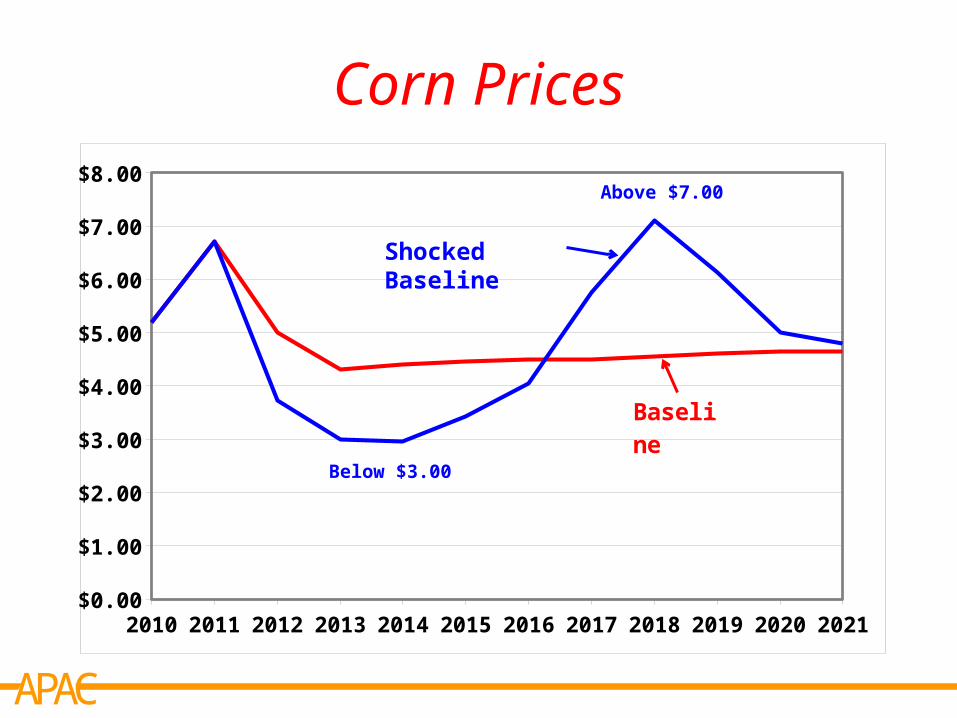
Corn Prices
2010 2011 2012 2013 2014 2015 2016 2017 2018 2019 2020 2021$0.00
$1.00
$2.00
$3.00
$4.00
$5.00
$6.00
$7.00
$8.00
Baseline

AP CA
8 Crops – Value of Production
2010 2011 2012 2013 2014 2015 2016 2017 2018 2019 2020 2021$0
$50,000
$100,000
$150,000
$200,000
Baseline
Million $

AP CA
8 Crops – Value of Exports
2010 2011 2012 2013 2014 2015 2016 2017 2018 2019 2020 2021$0
$10,000
$20,000
$30,000
$40,000
$50,000
$60,000
Baseline
Million $

AP CA
8 Crops – Government Payments
2010 2011 2012 2013 2014 2015 2016 2017 2018 2019 2020 2021$0
$5,000
$10,000
$15,000
$20,000
$25,000
$30,000
Baseline
Million $

AP CA
Value of Production + Government Payments - Cash Expenses: 8 Crops
2010 2011 2012 2013 2014 2015 2016 2017 2018 2019 2020 2021$0
$25,000
$50,000
$75,000
$100,000
$125,000
Baseline
Million $

AP CA
Realized Net Farm Income
2010 2011 2012 2013 2014 2015 2016 2017 2018 2019 2020 2021$0
$25,000
$50,000
$75,000
$100,000
$125,000
Baseline
Million $

AP CA
But What About the Future?
Two distinct sets of “future” analyses: –One straight-line “future” represented by the
2012 USDA baseline– A “future” roughly patterned after the
historical experience of 1996-2010 and the variation we experienced tested against various policies:
a) With current policies in placeb) Elimination of Direct Paymentsc) Raise Loan Rates with no DPsd) MDIS

AP CA
Corn Yield Shock
2010 2011 2012 2013 2014 2015 2016 2017 2018 2019 2020 20210
20
40
60
80
100
120
140
160
180
200
Baseline
Yield Shock
Bu/Ac.
AP CA
Corn Prices
2010 2011 2012 2013 2014 2015 2016 2017 2018 2019 2020 2021$0.00
$1.00
$2.00
$3.00
$4.00
$5.00
$6.00
$7.00
$8.00
Baseline
Shocked Baseline
Below $3.00
Above $7.00

AP CA
8 Crops - Government Payments
2010 2011 2012 2013 2014 2015 2016 2017 2018 2019 2020 2021$0
$5,000
$10,000
$15,000
$20,000
$25,000
$30,000
Baseline and Shocked Baseline
Million $

AP CA
Value of Production + Government Payments - Cash Expenses: 8 Crops
2010 2011 2012 2013 2014 2015 2016 2017 2018 2019 2020 2021$0
$25,000
$50,000
$75,000
$100,000
$125,000
Baseline
Million $
Shocked Baseline

AP CA
Realized Net Farm Income
2010 2011 2012 2013 2014 2015 2016 2017 2018 2019 2020 2021$0
$25,000
$50,000
$75,000
$100,000
$125,000
Baseline
Shocked Baseline
Million $

AP CA
But What About the Future?
Two distinct sets of “future” analyses: –One straight-line “future” represented by the
2012 USDA baseline– A “future” roughly patterned after the
historical experience of 1996-2010 and the variation we experienced tested against various policies:
a) With current policies in placeb) Elimination of Direct Paymentsc) Raise Loan Rates with no DPsd) MDIS

AP CA
8 Crops - Government Payments
2010 2011 2012 2013 2014 2015 2016 2017 2018 2019 2020 2021$0
$5,000
$10,000
$15,000
$20,000
$25,000
$30,000
BaselineShocked No DP
Million $

AP CA
Value of Production + Government Payments - Cash Expenses: 8 Crops
2010 2011 2012 2013 2014 2015 2016 2017 2018 2019 2020 2021$0
$20,000
$40,000
$60,000
$80,000
$100,000
Baseline
Shocked Baseline
Shocked No DP
Million $

AP CA
Realized Net Farm Income
2010 2011 2012 2013 2014 2015 2016 2017 2018 2019 2020 2021$0
$25,000
$50,000
$75,000
$100,000
$125,000
Baseline
Shocked Baseline
Shocked No DP
Million $
AP CA
But What About the Future?
Two distinct sets of “future” analyses: –One straight-line “future” represented by the
2012 USDA baseline– A “future” roughly patterned after the
historical experience of 1996-2010 and the variation we experienced tested against various policies:
a) With current policies in placeb) Elimination of Direct Paymentsc) Raise Loan Rates ($3.50 for corn, etc.) with no DPs d) MDIS

AP CA
8 Crops - Government Payments
2010 2011 2012 2013 2014 2015 2016 2017 2018 2019 2020 2021$0
$5,000
$10,000
$15,000
$20,000
$25,000
$30,000
Baseline
Shocked New LR No DP
Million $

AP CA
Realized Net Farm Income
2010 2011 2012 2013 2014 2015 2016 2017 2018 2019 2020 2021$0
$25,000
$50,000
$75,000
$100,000
$125,000
Baseline Shocked New LR No DP
Shocked Baseline
Million $

AP CA
But What About the Future?
Two distinct sets of “future” analyses: –One straight-line “future” represented by the
2012 USDA baseline– A “future” roughly patterned after the
historical experience of 1996-2010 and the variation we experienced tested against various policies:
a) With current policies in placeb) Elimination of Direct Paymentsc) Raise Loan Rates ($3.50 for corn, etc.) with no DPs d) MDIS

APCA
Policy Description
MDIS Specifications for 2012-2021 Study Period
– MDIS corn loan rate set at $3.50– Other crop loan rates set to historic
ratios with corn – Minimize distortion– Release price is set at 160% of loan rate

APCA
Policy Description
MDIS Specifications for 2012-2021 Study Period
– MDIS maximums• Corn – 3 billion bushels• Wheat – 800 million bushels• Soybeans – 400 million bushels
– Farmer storage payment rate 40¢/bu./yr– Eliminate Direct Payments, LDPs, & CCPs
except for rice and cotton

AP CA
Corn PriceLoan Rate and Release Price
2010 2011 2012 2013 2014 2015 2016 2017 2018 2019 2020 2021$0.00
$1.00
$2.00
$3.00
$4.00
$5.00
$6.00
$7.00
$8.00Release Price
Loan Rate

AP CA
Corn PriceLoan Rate and Release Price with Baseline
2010 2011 2012 2013 2014 2015 2016 2017 2018 2019 2020 2021$0.00
$1.00
$2.00
$3.00
$4.00
$5.00
$6.00
$7.00
$8.00
Baseline
Release Price
Loan Rate
AP CA
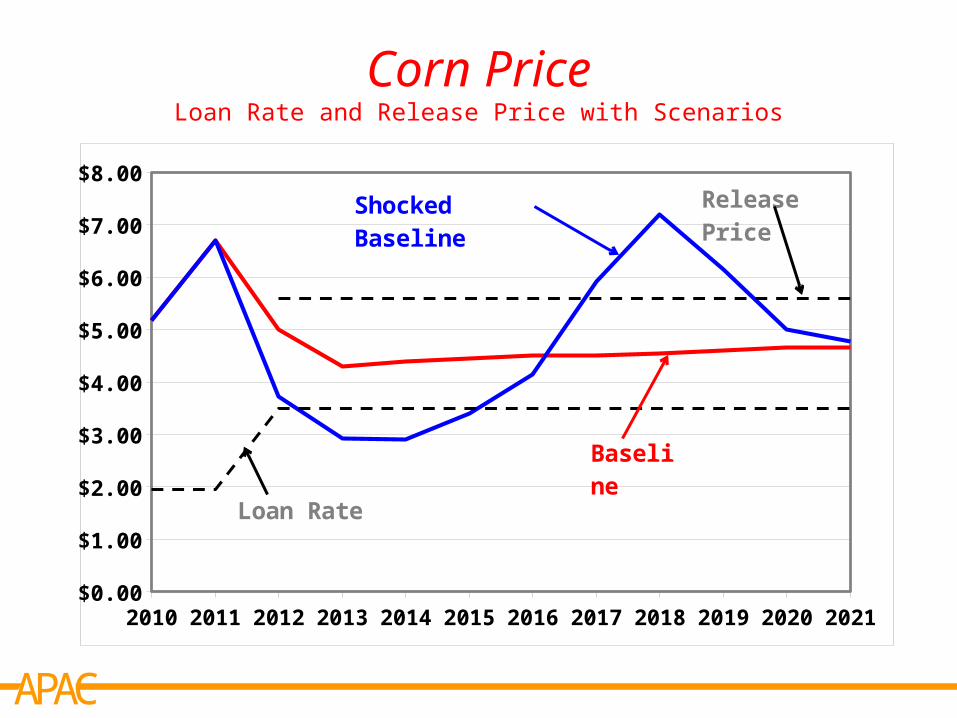
Corn PriceLoan Rate and Release Price with Scenarios
2010 2011 2012 2013 2014 2015 2016 2017 2018 2019 2020 2021$0.00
$1.00
$2.00
$3.00
$4.00
$5.00
$6.00
$7.00
$8.00
Baseline
Shocked Baseline Release Price
Loan Rate

AP CA
Corn PriceLoan Rate and Release Price with Scenarios
2010 2011 2012 2013 2014 2015 2016 2017 2018 2019 2020 2021$0.00
$1.00
$2.00
$3.00
$4.00
$5.00
$6.00
$7.00
$8.00
Baseline
Shocked Baseline
MDIS
Release Price
Loan Rate

AP CA
Corn PricesAverage Per Year Over Each Period
2012-2016 2017-2021 2012-2021$0.00
$1.00
$2.00
$3.00
$4.00
$5.00
$6.00
$7.00
Shocked Baseline
MDIS
$3.43
$4.07
$5.75$5.29
$4.59$4.68

AP CA
MDIS Stocks
2010 2011 2012 2013 2014 2015 2016 2017 2018 2019 20200
250
500
750
1000
1250
1500
1750
2000
2250
2500
Corn
Wheat
Million Bu.
Soybeans

AP CA
8 Crops – Value of Exports
2010 2011 2012 2013 2014 2015 2016 2017 2018 2019 2020 2021$0
$10,000
$20,000
$30,000
$40,000
$50,000
$60,000
Baseline
Shocked Baseline
MDIS
Million $
AP CA
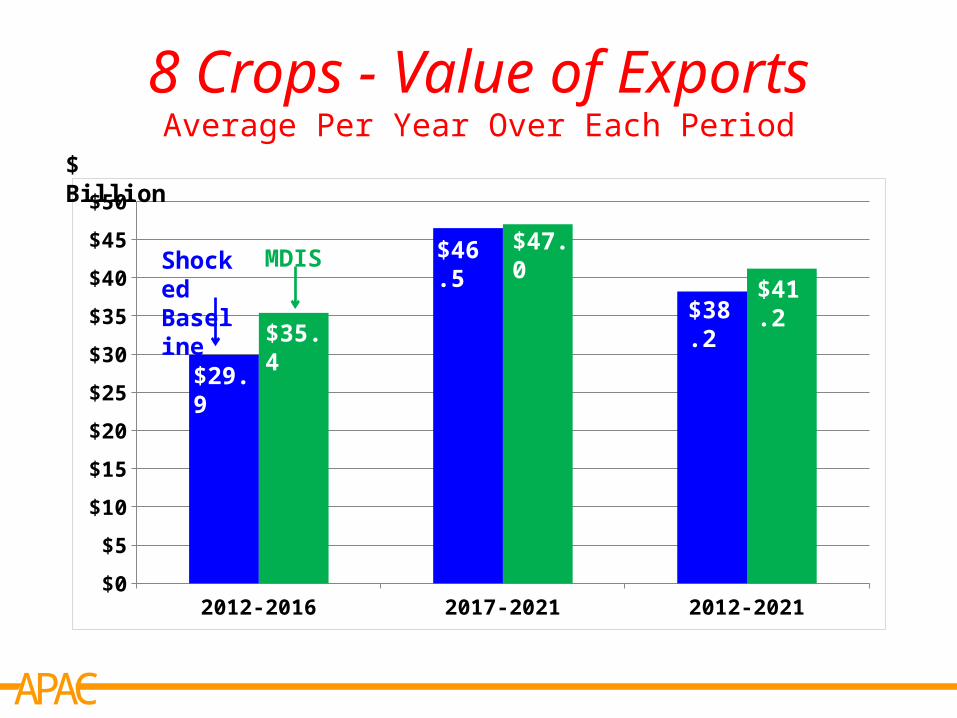
8 Crops - Value of ExportsAverage Per Year Over Each Period
2012-2016 2017-2021 2012-2021$0
$5
$10
$15
$20
$25
$30
$35
$40
$45
$50
Shocked Baseline
MDIS
$ Billion
$29.9
$35.4
$46.5 $47.0
$38.2$41.2

AP CA
8 Crops - Government Payments
2010 2011 2012 2013 2014 2015 2016 2017 2018 2019 2020 2021$0
$5,000
$10,000
$15,000
$20,000
$25,000
$30,000
Shocked
Shocked New LR No DP
MDIS
Million $

AP CA
8 Crops – Government PaymentsAverage Per Year Over Each Period
2012-2016 2017-2021 2012-2021$0
$2
$4
$6
$8
$10
$12
$14
$16
Shocked
MDIS
$ Billion
$4.9 $3.0$2.3
$4.9
$2.6$4.9

AP CA
8 Crops – Government PaymentsAverage Per Year Over Each Period
2012-2016 2017-2021 2012-2021$0
$2
$4
$6
$8
$10
$12
$14
$16
Shocked New LR No DP
MDIS
$ Billion
$14.8
$3.0$0.2 $2.3
$6.5
$2.6

AP CA
Value of Production + Government Payments - Cash Expenses: 8 Crops
2010 2011 2012 2013 2014 2015 2016 2017 2018 2019 2020 2021$0
$20,000
$40,000
$60,000
$80,000
$100,000
Baseline
Shocked Baseline
MDIS
Million $

AP CA
Value of Production + Government Payments - Cash Expenses: 8 Crops
Average Per Year Over Each Period
2012-2016 2017-2021 2012-2021$0
$10
$20
$30
$40
$50
$60
$70
Shocked
MDIS
$ Billion
$16.0
$33.8
$66.7
$59.5
$41.4$46.6

AP CA
Realized Net Farm Income
2010 2011 2012 2013 2014 2015 2016 2017 2018 2019 2020 2021$0
$25,000
$50,000
$75,000
$100,000
$125,000
Baseline
MDIS
Shocked Baseline
Million $

AP CA
Realized Net Farm IncomeAverage Per Year Over Each Period
2012-2016 2017-2021 2012-2021$0
$10
$20
$30
$40
$50
$60
$70
$80
$90
$100
Shocked MDIS
$ Billion
$59.2
$70.6
$92.4$88.5
$75.8$79.5

Conclusions and Policy Implications
–MDIS allows market forces to work• Wide price band• Reduces erroneous/exaggerated market signals
that lead to inefficient resource allocation and non-optimal investment decisions
–MDIS provides important trade benefits• Helps ensure grain is available for export even in
the “tight” times so U.S. remains a dependable supplier• Eliminates “dumping” charges by export
competitors and enhances value of exports, improves balance of trade

Conclusions and Policy Implications
– MDIS helps stabilize grain prices internationally• Benefits producers and consumers for which grain is a
staple– MDIS could save tens of billions of dollars in:
• Existing commodity payment programs• Emergency payments that inevitably would come with
a market crash• Government subsidies to exploding revenue insurance
liabilities– Above all, crops farmers get their
income from market and grain demanders are not subsidized or “overcharged.”

Agricultural Policy Analysis Center The University of Tennessee 310 Morgan Hall 2621 Morgan Circle Knoxville, TN 37996-4519
www.agpolicy.org
Thank You