apec regional trends analysis, may 2017mddb.apec.org/documents/2017/som/som2/17_som2_008.pdf ·...
TRANSCRIPT

___________________________________________________________________________ 2017/SOM2/008 Agenda Item: 8
APEC Regional Trends Analysis, May 2017
Purpose: Information Submitted by: Policy Support Unit, APEC Secretariat
Second Senior Officials’ MeetingHa Noi, Viet Nam
17-18 May 2017

1
APEC Regional Trends Analysis
Globalisation: The Good, the Bad, and the Role of Policy
APEC Policy Support Unit May 2017

Prepared by:
Asia-Pacific Economic Cooperation Policy Support Unit
Asia-Pacific Economic Cooperation Secretariat
35 Heng Mui Keng Terrace
Singapore 119616
Tel: (65) 6891-9600 │ Fax: (65) 6891-9690
Email: [email protected] Website: www.apec.org
Produced for:
APEC Ministers Responsible for Trade Meeting
Asia-Pacific Economic Cooperation
APEC#217-SE-01.16
This work is licensed under the Creative Commons Attribution-
NonCommercial-ShareAlike 3.0 Singapore License. To view a copy of
this license, visit http://creativecommons.org/licenses/by-nc-sa/3.0/sg/.
The views expressed in this paper are those of the authors and do not necessarily represent
those of the APEC Member Economies.

TABLE OF CONTENTS
List of Figures iii
List of Tables iii Key Abbreviations iv Key Messages v
1 Globalisation: The Good, the Bad, and the Role of Policy ................................. 1
1.1 Introduction 1 1.2 The Good 1 1.3 The Bad 8
1.4 The Role of Policy 13 1.5 The Role of APEC 15 1.6 Conclusion 16
2 Global Economic Momentum and Optimism Fuelling Near-term Growth .... 17
2.1 APEC GDP Growth 17
2.2 Trade Performance 21 2.3 Investment Trends 25 2.4 Trade and Investment Measures 26
2.5 Near-term Outlook, Risks and Opportunities 29 2.6 Conclusion 32

iii
LIST OF FIGURES
Figure 1.1 World GDP (in constant 2011 USD, trillions), 1 AD – 2015 ........................................................ 2 Figure 1.2 Share of APEC in world GDP, 1950–2013 ................................................................................... 3 Figure 1.3 Average tariffs, .............................................................................................................................. 4 Figure 1.4 FTA/RTAs signed and enforced by APEC economies .................................................................. 4 Figure 1.5 People living under extreme poverty conditions (million) ............................................................ 5 Figure 1.6 Transport and communication costs (index 1930 = 100) .............................................................. 6 Figure 1.7 Worldwide trade in vaccines for human use (USD million) ......................................................... 7 Figure 1.8 Elasticity of employment (by skill level) with respect to trade ................................................... 11 Figure 2.1 Global manufacturing PMI and world trade values (year-on-year, %), 2016 ............................. 19 Figure 2.2 Real GDP growth (year-on-year, %), 2015–2016 ....................................................................... 19 Figure 2.3 Growth in components of GDP, 2016 ......................................................................................... 20 Figure 2.4 Industrial production (year-on-year, %), December 2016 ........................................................... 21 Figure 2.5 Growth in the value of merchandise exports and imports (in nominal terms, year-on-year,
%), 2016 ....................................................................................................................................................... 22 Figure 2.6 Growth in commodity prices (year-on-year, %), 2016 ................................................................ 23 Figure 2.7 Quarterly (year-on-year) growth in volume and value of trade ................................................... 24 Figure 2.8 Top APEC FDI host economies (USD billion), 2016 ................................................................. 25 Figure 2.9 Trade and investment measures in APEC (as % of total) mid-May 2015 to mid-October
2016 .............................................................................................................................................................. 28 Figure 2.10 Forecast of GDP growth for APEC and the world, 2017–2019 ................................................ 29
LIST OF TABLES
Table 1.1 Selected papers examining the relationship between trade and inclusive growth .......................... 9 Table 2.1 Value and growth in merchandise trade (in nominal terms), 2015–2016 ..................................... 22 Table 2.2 Trade and trade-related measures, mid-May 2016 to mid-October 2016 ..................................... 27 Table 2.3 Investment measures, mid-May 2016 to mid-October 2016 ......................................................... 27

iv
KEY ABBREVIATIONS
ADB Asian Development Bank
FDI foreign direct investment
FTA free trade agreement
GDP gross domestic product
IMF International Monetary Fund
OECD Organisation for Economic Co-operation and Development
PMI Purchasing Manager’s Index
PPP purchasing power parity
PSU Policy Support Unit (APEC)
RTA regional trade agreement
UNCTAD United Nations Conference on Trade and Development
WTO World Trade Organization

v
KEY MESSAGES
I. Globalisation: The Good, the Bad, and the Role of Policy
Globalisation and international trade have contributed to unprecedented growth in
human prosperity and welfare, especially in the last 50 years. The material,
technological and information exchanges enabled by globalisation have vastly
improved living standards and reduced poverty around the world.
One of the more tangible ways globalisation has helped improve human well-being
is in the trade in vaccines. Between 1988 and 2015, tariffs on vaccines were reduced
and trade in vaccines grew an average of 24 percent per year. Trade has helped
make life-saving vaccines widely available, enabling public health systems to
reduce infant and child mortality and practically eliminate debilitating diseases
such as polio.
However, globalisation has not brought benefits to everyone. While trade
liberalisation improves overall welfare in the long-run, the process entails difficult
adjustments for firms and workers in the short- and medium-run. Trade has indeed
increased overall prosperity and employment in economies that open up, but it also
brings with it structural unemployment as internationally uncompetitive firms or
industries fold up and lay off workers.
Unfortunately, low- and medium-skilled workers – who are among the least able
to cope with structural unemployment – are more likely to be adversely affected by
globalisation. In an analysis of trade and employment data from 125 economies
over 2000–2014, we find that every 10 percent increase in exports correlates with
a reduction in employment among low- and medium-skilled workers of 1.1 to 2.1
percent.
However, the same data also show that protectionism is not the answer to structural
unemployment. There is no evidence that import growth is directly correlated with
reduction in employment. Rather, the data seem to point to a positive association
between imports and employment.
Unlike capital, which can seamlessly shift from sector to sector, it takes time and
resources for workers to shift from an uncompetitive sector to one offering
opportunities. Thus, trade-related adjustments are needed to ameliorate the plight
of workers disadvantaged by globalisation. At the economy level, these
adjustments include lifelong access to skills training (and retraining), temporary
support for households affected by structural unemployment, as well as access to
credit to enable entrepreneurial activity.
At the international level, trade-related adjustment could be facilitated through
rules-based trade-related policies that promote greater openness in international
markets, as secure access to open global markets will aid in local adjustment due
vi
to fewer trade distortions. Trade could also be made more inclusive through soft
laws (i.e., non-legally binding guidelines or policy declarations) in areas such as
labour or environmental standards to ensure fair competition.
Although the concept of inclusiveness in globalisation has been mentioned in
APEC declarations as early as the 1994 Bogor Goals, in recent years APEC Leaders
have placed ever greater emphasis on ensuring inclusive and sustainable growth in
the region. Continuing efforts on quality growth, structural reform, the
internationalisation of micro-, small- and medium-sized enterprises (MSMEs), and
human capital development are aimed at widely sharing the opportunities and
benefits from globalisation among all sectors of society.
Globalisation is no panacea for society’s inequities; but the prosperity, information,
and people exchange associated with globalisation could be harnessed to achieve a
more equitable distribution of opportunities and benefits. Globalisation alone will
not lead to a fairer or more equal society. Maximising the benefits from
globalisation requires complementary policies that will ensure inclusiveness and
sustainability. It will require the hard work of policymakers and the strength of will
of politicians to turn opportunities into reality.
II. Global Economic Momentum and Optimism Fuelling Near-term Growth
The APEC region expanded by 3.5 percent in 2016, just slightly lower than the
year-ago gross domestic product (GDP) growth of 3.6 percent.
The sustained strength in domestic private and government consumption remained
the main fuel of APEC’s growth, which, in turn, was boosted by below-peak
interest rates and commodity prices as well as government action to pump-prime
the economy via fiscal stimulus measures and infrastructure-related expenditures.
Trade performance in the APEC region started to improve in the second half of
2016. For the whole year of 2016, the aggregate value of APEC’s merchandise
exports contracted by 4.1 percent, which compares favourably to the 8.7 percent
contraction in 2015. The same trend could be observed in imports. This
improvement follows world trade which also performed better in 2016 compared
to a year ago.
The improvement in trade growth toward the latter half of 2016 could be traced to
stronger global demand, a recovery in commodity prices, and idiosyncratic factors
relating to individual economies’ pursuit of diversified markets, products and trade
partners.
APEC member economies constituted half of the top 10 foreign direct investment
(FDI) recipient economies in 2016. Taken together, FDI inflows to those five
APEC economies reached USD 710 billion, equivalent to 46.7 percent of global
FDI flows in 2016.
The entry of FDI into the APEC region was facilitated by investment-friendly
measures, which continued to outweigh investment-restrictive measures in the
vii
period mid-May to mid-October 2016. Trade-facilitating measures also
outnumbered trade-restrictive measures during the period.
Near-term GDP projections point to a higher APEC growth of 3.8 percent for 2017–
2018, above expected world GDP growth. The APEC region is anticipated to
converge with the world economy at 3.7 percent in 2019.
Forecasts of a higher growth trajectory for both the APEC region and the world in
the near term are supported by expectations of more buoyant trade and investment
activity; the implementation of fiscal stimulus measures, particularly from the US
and China; and the gradual recovery of commodity prices. However, there is also
significant uncertainty about trade, monetary and fiscal policies which could give
pause to trade and investment activity, adversely affecting economic growth.
The clarity, transparency and consistency of economic policies could determine the
magnitude and direction of economic growth in the near term. In the medium term,
macroeconomic management needs to be supported by structural reforms that
promote innovation, lead to more competitive markets, facilitate the participation
of all segments of society and enhance economic resilience, to contribute to
APEC’s aim of achieving sustainable, equitable and inclusive growth.

1
1 GLOBALISATION: THE GOOD, THE BAD,
AND THE ROLE OF POLICY 1
1.1 INTRODUCTION
Globalisation is increasingly unpopular these days. After decades of trade liberalisation
and global interconnectedness, many constituencies are rethinking whether globalisation
is working for them, and whether it is in their interest to continue down the globalisation
path or to find an alternative one. While there are no serious calls for a return to closed-
door autarky (yet), the discourse has shifted, from globalisation as a source of prosperity
for all, to one that is more zero-sum and winner-take-all.
This presents a challenge to APEC, which was founded on the principles of free and open
trade and a multilateral approach to regional integration. Since its inception, APEC has
advocated a unilateral reduction in tariffs and trade barriers, convinced that this would be
beneficial for the economy implementing it as well as its trading partners. It prides itself
on building consensus among a diverse group of economies, tackling problems and
proposing solutions multilaterally. Its meetings and fora are a crucible of ideas for
promoting free and open trade, and more recently inclusive and sustainable growth. The
questions on globalisation, on whether it has been a force for good for humanity, is a
question for APEC itself. Has APEC’s work in the past quarter century been beneficial for
its constituents? Should APEC do more of the same or start doing things differently?
In their 2016 Lima declaration, APEC Leaders issued a call ‘to reach out to all sectors of
our societies to better explain the benefits of trade, investment and open markets, and to
ensure that those benefits are widely distributed’. This theme chapter is but a humble
response to the call. It will show some of the benefits of globalisation, in terms of its impact
on economic growth and poverty reduction. But that is just half of the Leaders’ call. It will
also attempt to shine a light on those who have lost out from trade openness; and perhaps
begin to understand the sources of discontent. It will end with a brief discussion of
possibilities: what has been done and what can be done to ensure that the benefits of trade
and globalisation are widely distributed.
1.2 THE GOOD
Historically, the global economy experienced very slow growth until the second half of the
nineteenth century, when a combination of factors such as technological development (the
invention of the steam engine and the utilisation of electricity) and industrialisation, as well
as the opening of the Suez Canal, helped to increase productivity and reduce transaction
costs.
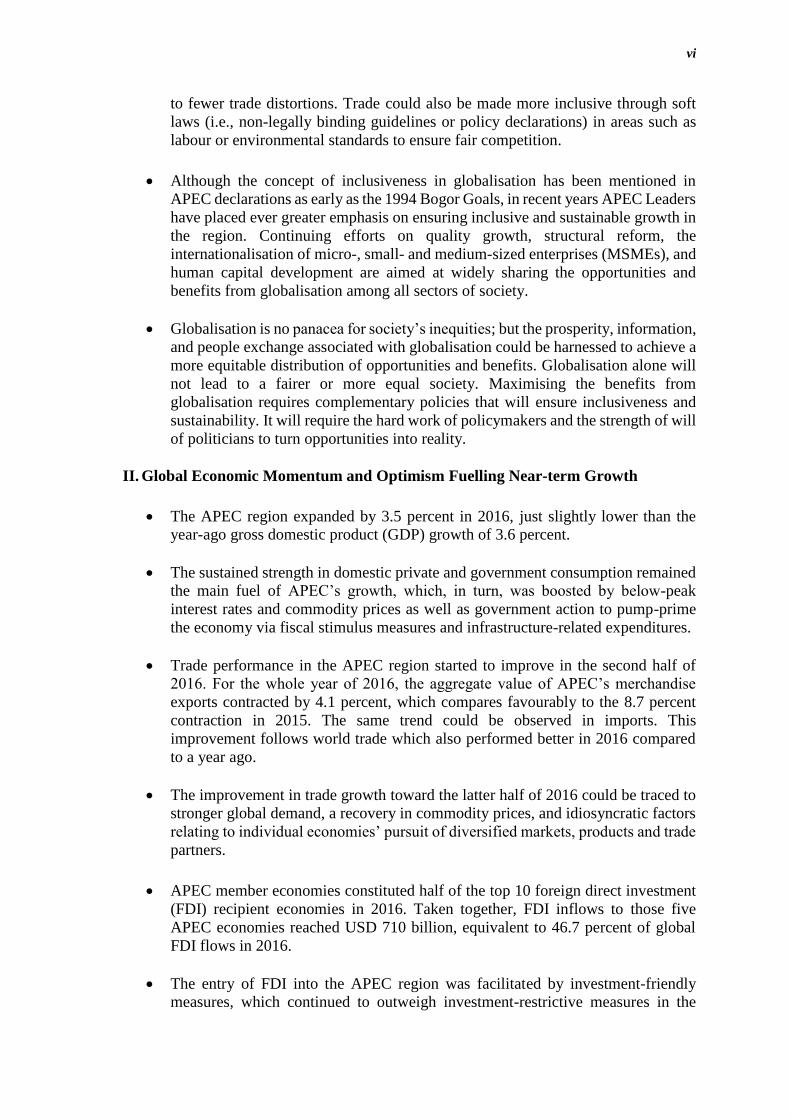
However, it is only after World War II that the world witnessed rapid progress in terms of
economic growth and poverty reduction. Figure 1.1 shows the historic evolution of the
global gross domestic product (GDP), whose sharp increase coincided with the times that
1 Prepared by Carlos Kuriyama, Emmanuel A. San Andres and Satvinderjit Kaur Singh, who are Senior
Analyst, Analyst and Intern at the APEC Policy Support Unit (PSU), respectively. Research assistance from
Kathrina G. Gonzales is gratefully acknowledged.
2
economies started to open up and seek ways to economically integrate with others. At the
same time, technological developments helped to enhance economic growth through faster
and cheaper transportation and access to information technology. Between 1950 and 2015,
the world’s output grew at an annual average rate of 3.8 percent, much higher than the rates
achieved during the periods 1900–1950 (2%), 1820–1900 (1.3%) and 1700-1820 (0.5%).
Figure 1.1 World GDP (in constant 2011 USD, trillions), 1 AD – 2015
Source: Our World in Data, based on World Bank and the New Maddison
Project Database.
Part of this rapid economic growth could be attributed to trade. Trade increases demand
from overseas, which spurs domestic economic activity by encouraging the production of
goods and services for export. At the same time, imports are not necessarily bad for the
economy. They could facilitate technological transfers, increase productivity and improve
export competitiveness. Companies could benefit from a wider range of suppliers, and
customers from a wider range of products. Long-term foreign investment could also help
to increase the productive capacity of economies and assist in the creation of jobs.2
2 See: Kuriyama, C. and E. San Andres, ‘Trade and economic growth: 25 years of a stronger relationship
within APEC’ (policy brief, Singapore: APEC Secretariat, 2014), 2.

3
The creation of APEC in 1989 spurred its members to encourage business facilitation and
promote economic openness, which in turn contributed to economic growth in the APEC
region. Figure 1.2 shows that the share of APEC in world GDP increased from 48.9 percent
to 53.9 percent between 1989 and 2015. In fact, the historical data show that the upward
trend in the contribution of APEC economies in world GDP became more apparent after
APEC’s inception.3
Figure 1.2 Share of APEC in world GDP, 1950–2013
Source: Penn World Tables; Stats APEC; APEC PSU calculations.
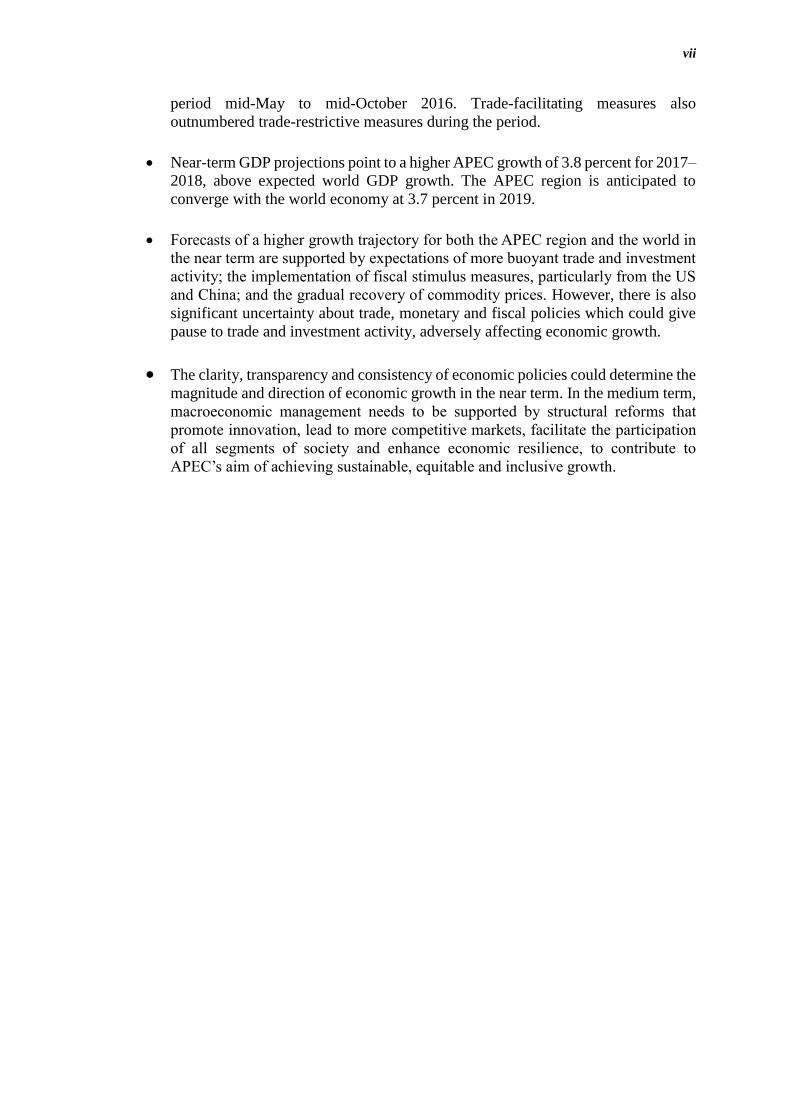
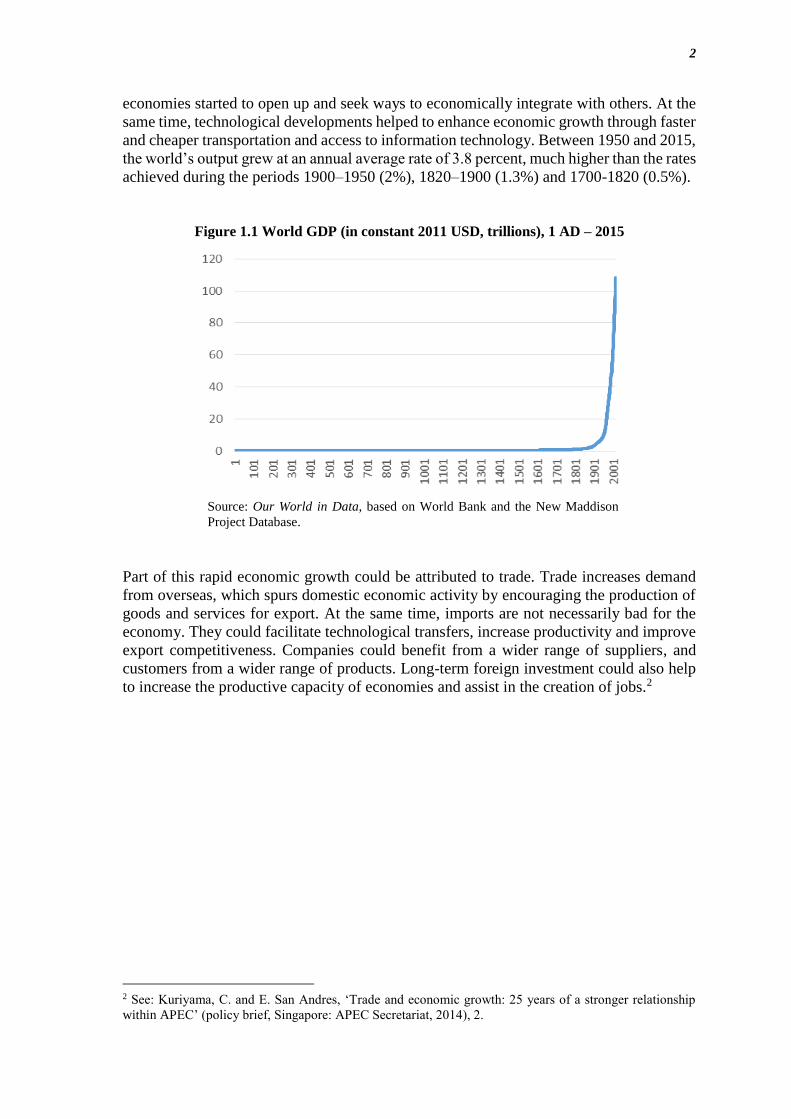
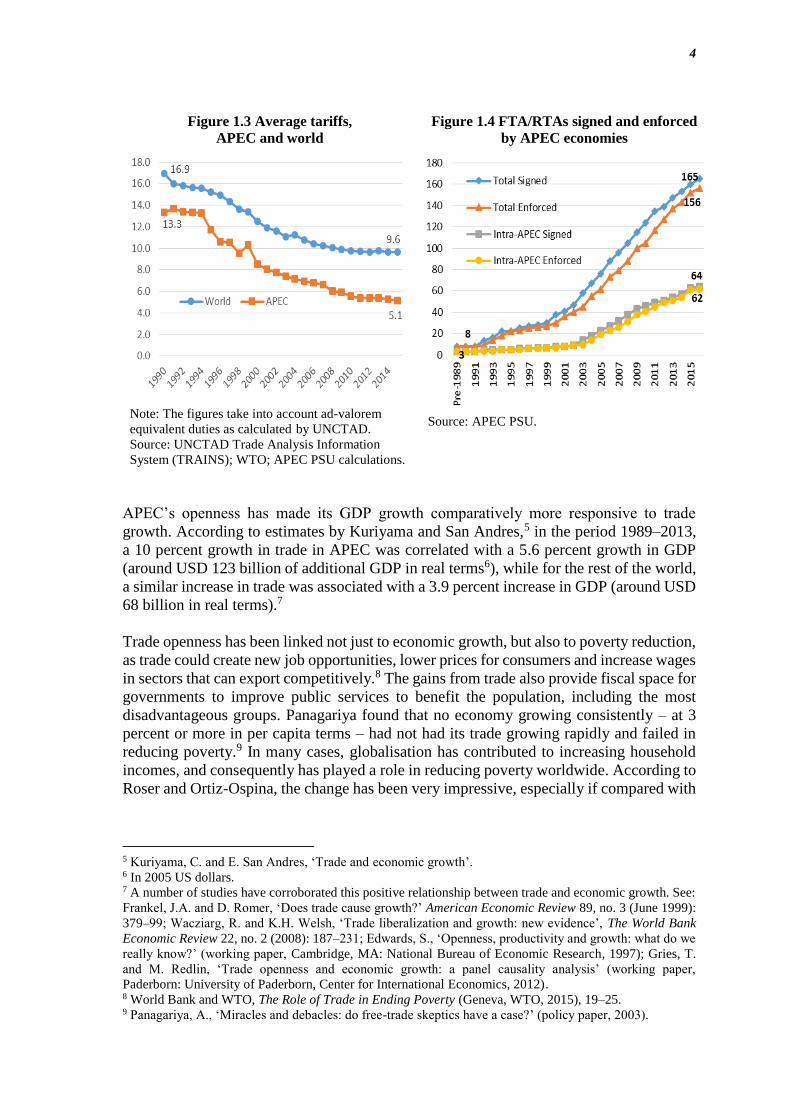
Trade has played an important role in the APEC region’s economic growth, with APEC
economies being particularly active in implementing open trade and investment policies.
APEC economies have substantially reduced their average tariffs and have been very active
in pursuing free trade agreements (Figure 1.3 and Figure 1.4). These factors played an
important role in expanding APEC’s trade and prosperity.4
3 APEC GDP per capita growth rates have also increased since its inception. During the period 1989–2015,
it was equivalent to 2.8 percent per year, greater than that of the period 1950–1989 (2.5 percent per year). 4 When APEC was founded in 1989, its share in world merchandise trade was equivalent to 40.2 percent. By
2015, APEC’s participation had increased to 50.1 percent of the world merchandise trade.
4
Figure 1.3 Average tariffs,
APEC and world
Note: The figures take into account ad-valorem
equivalent duties as calculated by UNCTAD.
Source: UNCTAD Trade Analysis Information
System (TRAINS); WTO; APEC PSU calculations.
Figure 1.4 FTA/RTAs signed and enforced
by APEC economies
Source: APEC PSU.
APEC’s openness has made its GDP growth comparatively more responsive to trade
growth. According to estimates by Kuriyama and San Andres,5 in the period 1989–2013,
a 10 percent growth in trade in APEC was correlated with a 5.6 percent growth in GDP
(around USD 123 billion of additional GDP in real terms6), while for the rest of the world,
a similar increase in trade was associated with a 3.9 percent increase in GDP (around USD
68 billion in real terms).7
Trade openness has been linked not just to economic growth, but also to poverty reduction,
as trade could create new job opportunities, lower prices for consumers and increase wages
in sectors that can export competitively.8 The gains from trade also provide fiscal space for
governments to improve public services to benefit the population, including the most
disadvantageous groups. Panagariya found that no economy growing consistently – at 3
percent or more in per capita terms – had not had its trade growing rapidly and failed in
reducing poverty.9 In many cases, globalisation has contributed to increasing household
incomes, and consequently has played a role in reducing poverty worldwide. According to
Roser and Ortiz-Ospina, the change has been very impressive, especially if compared with
5 Kuriyama, C. and E. San Andres, ‘Trade and economic growth’. 6 In 2005 US dollars. 7 A number of studies have corroborated this positive relationship between trade and economic growth. See:
Frankel, J.A. and D. Romer, ‘Does trade cause growth?’ American Economic Review 89, no. 3 (June 1999):
379–99; Wacziarg, R. and K.H. Welsh, ‘Trade liberalization and growth: new evidence’, The World Bank
Economic Review 22, no. 2 (2008): 187–231; Edwards, S., ‘Openness, productivity and growth: what do we
really know?’ (working paper, Cambridge, MA: National Bureau of Economic Research, 1997); Gries, T.
and M. Redlin, ‘Trade openness and economic growth: a panel causality analysis’ (working paper,
Paderborn: University of Paderborn, Center for International Economics, 2012). 8 World Bank and WTO, The Role of Trade in Ending Poverty (Geneva, WTO, 2015), 19–25. 9 Panagariya, A., ‘Miracles and debacles: do free-trade skeptics have a case?’ (policy paper, 2003).
5
historical estimates;10 in 1820, 84 percent of the population lived under extreme poverty
conditions, subsisting on less than USD 1 per day.
However, to take full advantage of trade, it is critical that trade policies go hand-in-hand
with other policies that help the poor to benefit from the opportunities that openness could
provide. In this regard, a study by Le Goff and Singh noted that more openness results in
a reduction of poverty when the access to private credit is deeper, education levels are
higher and the quality of institutions is strong.11
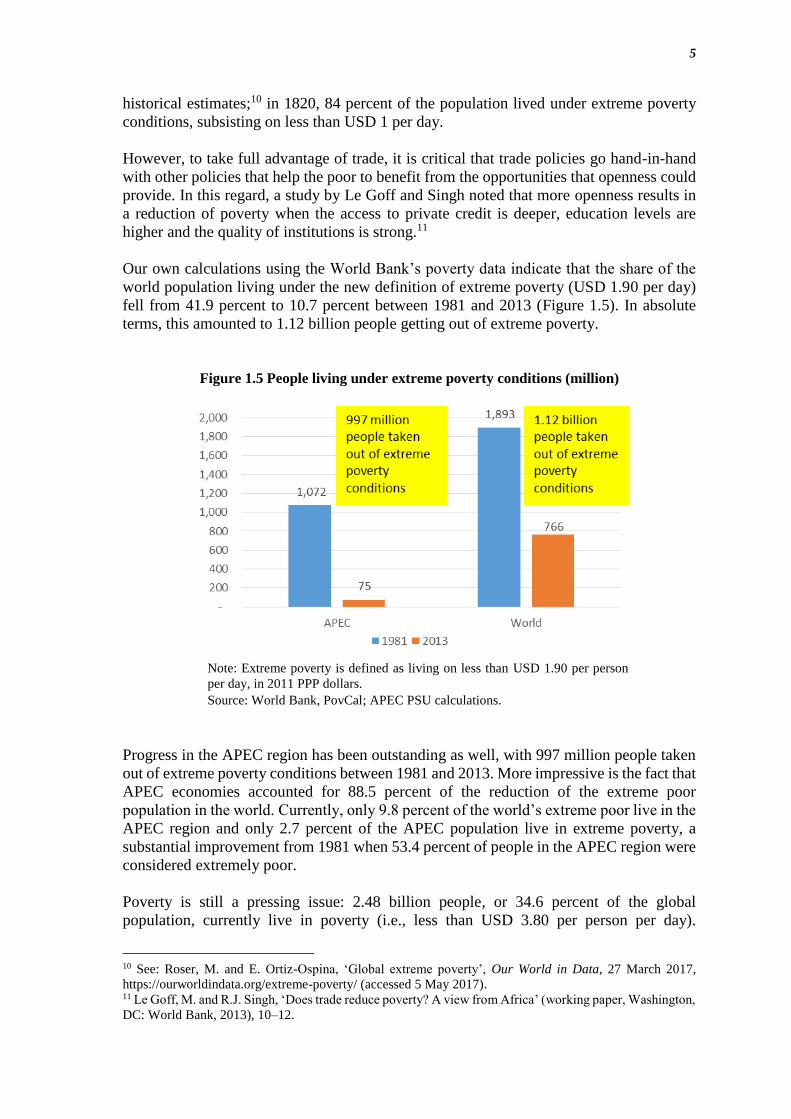
Our own calculations using the World Bank’s poverty data indicate that the share of the
world population living under the new definition of extreme poverty (USD 1.90 per day)
fell from 41.9 percent to 10.7 percent between 1981 and 2013 (Figure 1.5). In absolute
terms, this amounted to 1.12 billion people getting out of extreme poverty.
Figure 1.5 People living under extreme poverty conditions (million)
Note: Extreme poverty is defined as living on less than USD 1.90 per person
per day, in 2011 PPP dollars.
Source: World Bank, PovCal; APEC PSU calculations.
Progress in the APEC region has been outstanding as well, with 997 million people taken
out of extreme poverty conditions between 1981 and 2013. More impressive is the fact that
APEC economies accounted for 88.5 percent of the reduction of the extreme poor
population in the world. Currently, only 9.8 percent of the world’s extreme poor live in the
APEC region and only 2.7 percent of the APEC population live in extreme poverty, a
substantial improvement from 1981 when 53.4 percent of people in the APEC region were
considered extremely poor.
Poverty is still a pressing issue: 2.48 billion people, or 34.6 percent of the global
population, currently live in poverty (i.e., less than USD 3.80 per person per day).
10 See: Roser, M. and E. Ortiz-Ospina, ‘Global extreme poverty’, Our World in Data, 27 March 2017,
https://ourworldindata.org/extreme-poverty/ (accessed 5 May 2017). 11 Le Goff, M. and R.J. Singh, ‘Does trade reduce poverty? A view from Africa’ (working paper, Washington,
DC: World Bank, 2013), 10–12.

6
However, it is also important to acknowledge the massive reduction in poverty in the last
three decades, coinciding with the period when economies implemented important
economic reforms and gradually opened their markets. In 1981, 2.71 billion people were
poor; there are 227 million fewer poor people now.
Globalisation is making life easier, cheaper and faster for firms and households alike.
Transportation and telecommunication costs have fallen significantly in recent decades
(see Figure 1.6). Investments in infrastructure and new inventions have allowed goods to
be shipped faster and at a lower cost and they have opened the door to global value chains.
Travel has become more affordable, while advanced technologies in telecommunications
are making it possible to have access to information faster than ever. It is easier to
coordinate business and agree on (and enforce) contracts regardless of geographic distance.
Firms and customers are closer and have more access to a myriad of services and products.
In general, globalisation has been very positive: more information is flowing across
borders and people have more opportunities to learn from other cultures and places around
the world.
Figure 1.6 Transport and communication costs (index 1930 = 100)
Source: Our World in Data; based on OECD Economic Outlook 2007.
Living conditions have significantly improved since the end of the World War II. Between
1960 and 2015, the average life expectancy worldwide at birth went up from 52.5 to 71.7
years.12 Progress in the medical sciences and increased affordability of medicines are
allowing people to live longer. For example, in the nineteenth century, even the richest
people could die of an infection that could be treated nowadays with cheap antibiotics.13
In the twentieth century, the development of vaccines and their accessibility helped reduce
infant and child mortality rates and contributed to the eradication of smallpox and the near
eradication of polio.
12 Based on data from the World Bank’s World Development Indicators. 13 Roser and Ortiz-Ospina, ‘Global extreme poverty’.

7
Trade liberalisation has been a key component in the accessibility of vaccines for human
use worldwide. In the 1990s, vaccines were charged most favoured nation (MFN) tariffs
of at least 5 percent in at least 73 economies and at least 10 percent in 30 economies. By
2015, only 16 economies imposed tariffs of 5 percent or more and only one economy
imposed tariffs on vaccines of above 10 percent. Figure 1.7 shows an exponential growth
in the worldwide trade in vaccines for human use. During the period 1988–2015, their
global trade multiplied 353 times, from USD 73 million to USD 25.6 billion (i.e., 24.3
percent growth per year).
Figure 1.7 Worldwide trade in vaccines for human use (USD million)
Source: World Integrated Trade Solution (WITS), UN Comtrade; APEC
PSU calculations.
On the environment, while it is true that greenhouse gas emissions have escalated
substantially since the Industrial Revolution, globalisation also provides an opportunity to
protect the environment. Environmental awareness is rising and there have been efforts to
implement global actions. For example, the Montreal Protocol, a multilateral agreement,
has been effective in phasing out substances affecting the ozone layer and restricting their
trade. Furthermore, governments are trying to tackle the emission of sulphur dioxide (SO2).
It is a promising sign that SO2 levels worldwide fell by 36 percent and death rates from air
pollution fell from 132 to 104 per 100,000 people between 1980 and 2010.14
Pro-globalisation policies could also help to reduce child labour and increase school
attendance. A study on child labour in Viet Nam found that the implementation of export
quotas in 1989 had suppressed domestic rice prices. The subsequent relaxation and
removal of rice export quotas in the mid-1990s helped to increase farmers’ incomes, as
they were able to take advantage of the higher international price of rice. Higher incomes
then motivated rice farmers to send their children to school and contributed to 1 million
fewer working children in Viet Nam.15 Expanding on this finding, Edmonds and Pavcnik
conducted a cross-economy study on child labour and trade, and reported that a 10 percent
14 Ritchie, H. and M. Roser, ‘Air pollution’, Our World in Data, 2017, https://ourworldindata.org/air-
pollution/ (accessed 5 May 2017). 15 Edmonds, E., ‘Globalization and the economics of child labor’ (Dartmouth College, 2002), 4.

8
increase in the share of trade in GDP was associated with a 7 percent decline in child
labour.16
1.3 THE BAD
While trade and globalisation have indeed resulted in increased prosperity and rapid
poverty reduction especially in the long-run, these gains can come with difficult and costly
adjustments for some workers and industrial sectors. Even the devoted trade liberaliser
would agree that the competition and specialisation from trade will result in uncompetitive
sectors dwindling and associated jobs disappearing.
Name any theory in international economics – Ricardo, Heckscher-Ohlin, Stolper-
Samuelson, Krugman – and you will not find one that says international trade will always
be painless for everyone. This is because the benefits of trade – which come from
specialisation in the production of goods and services in which an economy has a
comparative advantage – necessarily mean a reduction in the production of goods and
services in which the economy does not have a comparative advantage. While this may
improve efficiency in the economy and raise overall welfare levels, it does mean that the
firms in non-competitive industries will not survive, and their workers will become
structurally unemployed. The displacement of some workers due to international trade,
predicted in theory, and cautioned against before the advent of globalisation in the 1990s,
has been taking place in recent decades.
When firms in non-competitive sectors close, factor and production reallocation do not
automatically occur; and workers who are laid off may not easily find alternative
employment. At a time when APEC Leaders are focusing on inclusive growth, a valid
question is whether trade growth is conducive to inclusive growth. Empirically, the
relationship between international trade and inequality is complicated. While many
economists have studied this issue, there is no clear scientific consensus on whether trade
ameliorates or worsens inequality (Table 1.1). This may be because many of the factors
that affect inequality – like ex-ante wealth distribution, access to social services and
insurance, institutions, or human capital investment – have nothing to do with trade.
16 Edmonds, E. and N. Pavcnik. ‘International trade and child labor: cross-country evidence’ (working paper,
Cambridge, MA: National Bureau of Economic Research, 2004), 22–3.

9
Table 1.1 Selected papers examining the relationship between trade and inclusive growth
No. Paper Type of analysis Measures of
trade openness
Measures of
inclusive growth
Relationship
between trade
openness and
inclusive growth
1 Aoyagi and
Ganelli (2015)
Cross-country Sum of export
and import
divided by
GDP
Measure of growth in
average income
corrected for the
equity impact
Positive and
significant
2 IMF (2007) Cross-country - Export-to-
GDP ratio
- 100 minus
tariff rate
Income distribution as
measured by Gini
coefficienta
Reduction in Gini
coefficient
(i.e., positive and
significant)
3 Perry and
Olarreaga
(2006)
Cross-country Adjusted trade
volume divided
by GDP
Gini coefficient Increase in Gini
coefficient
(i.e., negative and
significant)
4 Lundberg and
Squire (2003)
Cross-country Sachs-Warner
indexb
Measurement-adjusted
Gini from augmented
Deininger-Squire
dataset
Increase in Gini
coefficient
(i.e., negative and
significant)
5 Dollar and
Kraay (2002)
Cross-country Sum of export
and import
divided by
GDP
Income of the poorest
20 percent of the
population
Trade does not
reduce the income of
the poor
(i.e., insignificant)
6 Razzaque and
Raihan (Vols I
and II, 2008)
Review of
individual
economy
experiences
Various
Various
Economy- and
sector-specific
(i.e., inconclusive)
7 Goldberg and
Pavcnik (2007)
Review of
individual
economy
experiences
Various Various Economy-, case- and
time-specific
(i.e., inconclusive)
8 Topalova
(2007)
Individual
economy
Tariff data - Proportion of
population below
poverty line
- Normalised
aggregate shortfall of
poor people’s
consumption from the
poverty line
Increase in poverty
rate and gap in rural
districts
(i.e., negative and
significant)
9 Wei and Wu
(2007)
Individual
economy
Export-to-GDP
ratio
Ratio of per capita
incomes in urban to
rural areas
Decline in urban–
rural inequality
(i.e., positive and
significant)
Notes: a. The Gini coefficient is a measure of income inequality which ranges from 0 (perfect equality) to
100 (complete inequality); b. Sachs-Warner index: An economy is deemed to be open to trade if it satisfies
four tests: (1) average tariff rates below 40 percent; (2) average quota and licensing coverage of imports
of less than 40 percent; (3) a black market exchange rate premium that averaged less than 20 percent during
the decade of the 1970s and 1980s; (4) no extreme controls (taxes, quotas, state monopolies) on exports.
Source: Hernando, R.C., E. San Andres and A. Wirjo, Trade, Inclusive Growth, and the Role of Policy
(Singapore: APEC Secretariat, 2015), Table 1.
One argument is that while trade cannot be blamed for inequality, it does not contribute to
reducing it either. A study by San Andres and Wirjo found that the relationship between
trade growth and inclusive growth (defined as growth in mean household incomes coupled

10
with reductions in inequality) ranges from insignificant to significantly negative.17 They
hypothesise that this could be due to the skill bias of APEC trade. Practically all of the top
10 most traded products in the region are skill-intensive, hence trade growth is most likely
to directly benefit skilled workers (who are more likely to be well-off) than non-skilled
workers (who are more likely to be poor).
For a deeper understanding of the issue, we analyse skill-disaggregated employment data
from 125 economies over the period 2000–2014, looking at the relationship between
increases in exports and imports and increases (or decreases) in employment of workers of
various skill levels. This involves estimating the percentage change in employment that is
correlated with a 10 percent increase in imports or exports while controlling for changes
in other variables such as GDP or population growth as well as reverse causality.18 Skill
levels are based on International Labour Organization (ILO) definitions; and are classified
into three categories: low skill (elementary occupations with simple and routine tasks),
medium skill (clerical, service and sales workers; skilled agricultural and trades workers;
plant and machine operators and assemblers) and high skill (managers, professionals and
technicians). We also do separate analyses for high-, middle- and low-income economies
based on the International Monetary Fund (IMF) classification.19
Elasticity estimates are shown in Figure 1.8. The first observation is that the majority of
the elasticity estimates of employment with respect to trade, after controlling for indirect
effects coursed through GDP, are statistically insignificant. This implies that trade per se
has varying impacts on employment at most skill levels; it can increase it or decrease it
depending on the industry and economy so at the aggregate the results are inconclusive.
17 E. San Andres and A. Wirjo, ‘Trade, inclusive growth, and the role of policy’, in Hernando, R.C., E. San
Andres and A. Wirjo, Trade, Inclusive Growth, and the Role of Policy (Singapore: APEC Secretariat, 2015),
1–10. 18 Technically, we estimate elasticities of employment by skill level with respect to trade (i.e., imports and
exports) separately. To control for reverse causality, we use the Arellano-Bond estimation method using lags
of employment as the instrument. We use robust standard errors and control for GDP, population, structural
transformation (i.e., proportion of agriculture value-added in GDP), WTO membership and year-specific
idiosyncrasies. 19 Among APEC economies, the low-income economy based on the IMF classification is Viet Nam. Middle-
income economies are Chile; China; Indonesia; Malaysia; Mexico; Peru; the Philippines; Russia; and
Thailand. High-income economies are Australia; Canada; Hong Kong, China; Japan; Korea; New Zealand;
Singapore; Chinese Taipei; and the United States. Brunei Darussalam and Papua New Guinea are not
included in the econometric analysis due to data constraints.

11
Figure 1.8 Elasticity of employment (by skill level) with respect to trade
Notes: *** = significant at 95% confidence level; ** = significant at 90% confidence
level; * = significant at 85% confidence level.
Source: ILO; IMF; World Bank; Directorate-General for Budget, Accounting, and
Statistics (Chinese Taipei) data; APEC PSU calculations.
There are nevertheless a few significant findings. With respect to exports, two groups seem
to be adversely affected: low-skilled workers in low-income economies and low- to
middle-skilled workers in high-income economies. For these workers, every 10 percent
increase in exports is significantly correlated with a contemporaneous reduction in their
employment by 1.1 to 2.1 percent. While these findings are preliminary, these could be a
clear identification of the ‘losers’ from globalisation, those whose jobs disappeared
because the economy has reallocated resources away from their sectors. Unfortunately,
these low- to medium-skilled workers are also more likely to be from poorer households,
so structural unemployment will have a serious impact. They would also likely have less
access to skills training or entrepreneurial capital, making structural unemployment a
persistent situation if their skills are not transferrable to another sector. Hence, these
workers could be the constituencies that would demand more protection for their jobs and
livelihoods, no matter how uncompetitive their industries are.
Yet, despite conventional knowledge, the findings in Figure 1.8 indicate that protectionism
is not necessarily the answer to trade-related shifts in labour demand. Only two elasticities
from the imports perspective are statistically significant – for low-skilled workers in low-
income economies and middle-skilled workers in high-income economies – and they are
-0.110* -0.099
-0.214***
0.030 0.032
-0.192***
-0.148
-0.013-0.034
-0.250
-0.200
-0.150
-0.100
-0.050
0.000
0.050
Low income Middle income High income
Exports

12
both on the positive side. This shows that imports are not the bogeyman of domestic
employment they are portrayed to be. They either have no significant impact on
employment, or have a significantly positive impact. Note that this is a pure imports effect;
the effects through value chains and imported inputs are already controlled for. Rather,
these could be pointing to the impacts of imports on employment in import-heavy services
such as tourism, retail or transportation, many of which hire low- to medium-skilled
workers.20
Workers lose out from globalisation mainly due to two reasons: changes in demand for
labour and changes in demand for skills.21 Changes in demand for labour come about due
to differences in the export competitiveness of various sectors, which lead to the expansion
of some sectors and contraction of others.22 Demand for labour hence changes in a
particular economy as different industries expand and compete in the globalised economy.
The demand for skilled workers increases when there are shifts in technology or when the
high-skilled sector becomes competitive after trade liberalisation and starts to draw in
factors of production. Skilled workers also become more sought after when the low-skilled
sector flourishes, as this creates opportunities and incentives for the low-skilled sector to
invest in technology in order to stay competitive. Skill-biased technological change results
in some workers losing out to globalisation as the more technologically advanced sector
demands more skilled labour and raises the relative return to skills.23 This also widens
wage disparities between skilled and unskilled workers, and could render some skilled
workers unemployed or underemployed if their skills become obsolete or automated. This
issue of skills mismatch is a problem for APEC economies, where many workers remain
unemployed while a large number of firms are constrained by the lack of an adequately
skilled workforce.24
As a result of labour market frictions and skill mismatches, many people are left
structurally unemployed and firms forced to shut down. Firms may move their operations
offshore or outsource their activities abroad to remain competitive, leaving former
domestic employees without jobs.25 Moreover, workers who are adversely impacted by
globalisation enter into a vicious cycle of poor health and financial conditions.26 Hence,
without any mitigating measures to ameliorate the pain of structural unemployment and to
open new doors of opportunity, negatively affected workers will see globalisation as a bane
and gravitate toward policy directions that can promise relief.
20 Cf. study on the linkages between tourism, inclusive growth, and trade in: San Andres, E., D. Cheok and
L. Othman, ‘Tourist arrivals and inclusive growth’ (issues paper, Singapore: APEC Secretariat, 2016). 21 IMF, World Bank and WTO, Making Trade an Engine of Growth for All: The Case for Trade and for
Policies to Facilitate Adjustment (policy paper, Washington, DC: IMF, 2017). 22 Harrison, A., J. McLaren and M.S. McMillan, ‘Recent findings on trade and inequality’ (working paper,
Cambridge, MA: National Bureau of Economic Research, 2010). 23 Goldberg, P.K. and N. Pavcnik, ‘Distributional effects of globalisation in developing countries’ (working
paper, Cambridge, MA: National Bureau of Economic Research, 2007). 24 APEC, ‘Mismatch in Asia-Pacific labour markets’ (submission by Australia at the Roundtable Conference
on Building Human Resource Development Partnerships for Innovative Growth and Sustainable
Development, Medan, Indonesia, 22–25 June 2013),
http://mddb.apec.org/Documents/2013/HRDWG/FOR/13_hrdwg_for_014.pdf (accessed 5 May 2017) 25 Levine, L., ‘Unemployment through layoffs and offshore outsourcing’ (Washington, DC: Congressional
Research Service, 2010). 26 Davis, S.J. and T. von Wachter, ‘Recessions and the costs of job loss’ (Washington, DC: Brookings, 2011),
1–72.
13
1.4 THE ROLE OF POLICY
Unlike capital, which can seamlessly shift from sector to sector, it takes time and resources
for workers to shift from an uncompetitive sector to one offering opportunities. An
automotive mechanic today will not suddenly be an app developer tomorrow. Thus, trade-
related adjustments are needed to ameliorate the plight of workers disadvantaged by trade
liberalisation. These include investments in activities that facilitate switching of jobs and
industries, and implementation of social safety nets to reduce the insecurities related to
frictions in the labour market.27 These adjustments are costly, time-consuming and involve
a reallocation of resources toward the activities.
Longer-term adjustment policies to ameliorate structural unemployment include
investments in retraining programmes. An example is the Trade Adjustment Assistance
(TAA) programme in the United States that provides retraining and job search assistance,
which has been found to increase the employment rates of the participants.28 Another is
the retraining and placement services provided by Mexico’s labour retraining programme
(PROBECAT),29 which has been successful in increasing employment and wages in the
medium term.30 Likewise, China’s ‘Three Year 10 Million Program’, which aims to retrain
10 million laid off workers within three years, was able to achieve a re-employment rate
of 65 percent (i.e., 8.82 million workers) after its first implementation between 1998 and
2000.31
At the same time, shorter-term measures like income support and unemployment insurance
are necessary to alleviate the immediate effects of structural unemployment and enable
participation in job search and retraining activities. Canada introduced Employment
Benefits and Support Measures (EBSM) in 1996 to get unemployed people back into the
labour market quickly with the help of wage subsidies, earnings supplements and loan
grants. An analysis of the programme found 293,000 participants returning to the labour
market during the period 1999 to 2000.32 The European Globalisation Adjustment Fund
(EGF) was set up by the European Union (EU) in 2007 to help those affected by mass
redundancies resulting from structural changes. The programme’s training, relocation and
subsistence allowances supported 27,610 people during 2013 to 2014, achieving a 50
percent re-employment rate.33
Complementary policies like providing access to credit and housing and better
infrastructure and education have also been shown to stabilise the economy and facilitate
the adjustment process. Aid for Trade, led by the WTO, has helped developing economies
27 IMF et al., Making Trade an Engine of Growth for All. 28 Rosen, H.F., ‘Reforming trade adjustment assistance: keeping a 40-year promise’ (paper presented at Trade
Policy in 2002, Peterson Institute for International Economics, Washington, DC, USA, 26 February 2002). 29 PROBECAT = Programa de Becas de Capacitacion para Trabajadores (Worker Training Scholarship
Programme). 30 Baker, J.L., ‘Evaluating the impact of development projects on poverty’ (Washington, DC: World Bank,
2000). 31 Liu, Y., ‘Massive retraining programs in China’, World Bank, 2004,
http://siteresources.worldbank.org/EDUCATION/Resources/278200-1126210664195/1636971-
1126210694253/Retraining_Programs.pdf (accessed 5 May 2017). 32 OECD, OECD Reviews of Regulatory Reform: Canada 2002 – Maintaining Leadership through
Innovation (Paris: OECD Publishing, 2002). 33 European Commission, ‘Employment: almost 30 000 workers supported by the European Globalisation
Adjustment Fund during 2013 and 2014’, press release, 22 July 2015, http://europa.eu/rapid/press-
release_IP-15-5412_en.htm (accessed 5 May 2017).

14
build the capacity and infrastructure required to exploit free trade opportunities. A study
found that a 10 percent increase in trade-related infrastructure investment through the
initiative led to a 2.3 percent increase in an economy’s exports-to-GDP ratio.34 Another
example is Viet Nam’s investment in education, infrastructure and welfare, which along
with rapid growth in trade and GDP, has enabled the economy to reduce poverty by half
in a span of 10 years.35 Easier access to credit also supports adjustment by empowering the
unemployed to start their own businesses and pursue education or training. Schemes
providing greater access to credit have enabled small- and medium-sized enterprises
(SMEs) to flourish in Brunei Darussalam. The SMEs have in turn contributed 92 percent
of the private-sector employment opportunities.36
On a global level, trade-related adjustment can be facilitated through rules-based trade-
related policies that promote greater openness in international markets, as secure access to
open global markets will aid in local adjustment due to fewer trade distortions.37
Customised policies to ease the local adjustment process are desirable as well. For
example, policies that facilitate gradual opening of markets can prevent labour market
congestion resulting from layoffs.38 Trade can also be made more inclusive through soft
laws.39 For example, greater enforcement of ILO labour standards will assure fair treatment
of domestic workers despite foreign competition. Likewise, mutual efforts toward
maintaining environmental standards will prevent situations where some economies are
disadvantaged by exclusively incurring the cost of investments in environment-friendly
equipment and practices.40
In order to maximise the benefits of globalisation, these domestic and international policies
need to be implemented along with efforts to liberalise markets. Trade openness needs to
go hand-in-hand with complementary structural and social reforms to generate a growth
path that is inclusive and sustainable, and avoid sluggish or sputtering growth which could
slow down future efforts toward further liberalisation and create scepticism about
globalisation and its benefits.
34 Negin, J., ‘Understanding Aid for Trade part one: a dummy’s guide’, blog, DevPolicyBlog, 28 February
2014, http://devpolicy.org/understanding-aid-for-trade-part-one-a-dummys-guide-20140228/ (accessed 5
May 2017). 35 Dollar, D., ‘Making globalisation work for the poor’, discussion transcript, World Bank, 2 February 2004,
http://live.worldbank.org/making-globalisation-work-poor (accessed 5 May 2017). 36 APEC, ‘Women and SMEs in Brunei Darussalam’ (submission by Brunei Darussalam to the 1st Joint
Ministerial Meeting on Small and Medium Enterprises and Women, Bali, Indonesia, 7 September 2013). 37 IMF et al., Making Trade an Engine of Growth for All. 38 Bacchetta, M. and M. Jansen, Making Globalisation Socially Sustainable by 2011 (Geneva: ILO and WTO,
2011). 39 Soft laws are quasi-legal instruments that are not legally binding. In the context of international law, these
could refer to resolutions, guidelines, declarations or codes of conduct. 40 IMF et al., Making Trade an Engine of Growth for All.

15
1.5 THE ROLE OF APEC
While APEC has historically focused on cross-border economic issues such as trade and
investment liberalisation, it has been promoting inclusive growth among its members albeit
in a limited capacity. Inclusiveness has been discussed as early as 1994 as part of the Bogor
Goals Declaration, when Leaders stated their goal to ‘attain sustainable growth and
equitable development of APEC economies, while reducing economic disparities among
them, and improving the economic and social well-being of our people’.41
Inclusiveness as a goal was explicitly mentioned in the 2010 APEC Leaders’ Growth
Strategy,42 where it is stated that ‘APEC members cannot continue with “growth as usual”
and “the quality of growth” needs to be improved, so that it will be more balanced,
inclusive, sustainable, innovative, and secure’. This is also expounded in the APEC
Strategy for Strengthening Quality Growth initiated in 2015, part of which aims to pursue
job creation, entrepreneurship development and social welfare in a sustainable manner.
The Boracay Action Agenda 2015 aims to increase inclusivity by improving opportunities
for micro-, small- and medium-sized enterprises (MSMEs) to participate in global trade.
To do so, the agenda prioritises strengthening institutional support for MSMEs, giving
greater focus to those led by women, streamlining custom-based rules and regulations,
providing accurate procedural information, and increasing financing options and
infrastructure. These objectives will create a more desirable trade environment for
MSMEs.
On training and skills development, the APEC Education Strategy 2016 aims to have a
cohesive education community that supports sustainable economic growth by 2030 by
increasing employability, accelerating innovation and aligning competencies to the needs
of the economy. The aim is for APEC economies to be better equipped to provide human
resources with the skills needed by labour markets.
APEC’s work on structural reform – the Leaders’ Agenda to Implement Structural Reform,
or LAISR (2004); the APEC New Strategy on Structural Reform, or ANSSR (2010); and
the Renewed APEC Agenda on Structural Reform, or RAASR (2015) – also addresses the
issues related to the distribution of benefits from globalisation. These initiatives focus on
making markets more open, improving labour market opportunities through training and
education, and initiating programmes to empower vulnerable groups through capacity
building and training. More open and competitive markets will help reduce economic
distortions, facilitating local trade-related adjustment. Moreover, structural reform in
human capital development can contribute to making education and labour markets more
efficient, reducing frictions in the movement of workers from one sector to another.
41 APEC, 1994 Leaders’ Declaration, Bogor, Indonesia, 15 November 1994, para. 8,
http://www.apec.org/Meeting-Papers/Leaders-Declarations/1994/1994_aelm.aspx (accessed 5 May 2017). 42 APEC, The APEC Leaders’ Growth Strategy, Yokohama, Japan, 14 November 2010,
http://www.apec.org/Meeting-Papers/Leaders-Declarations/2010/2010_aelm/growth-strategy (accessed 5
May 2017).
16
1.6 CONCLUSION
Globalisation is not a panacea for society’s inequalities. Globalisation has always been a
way to induce efficiency in trading economies through competition and specialisation; it
was never meant as a tool to reduce inequality or create a fairer society. But globalisation
does affect distribution and, in the absence of equity-inducing policies and institutions,
could exacerbate an already inequitable distribution of wealth and opportunities.
At the same time, globalisation also brings with it opportunities to create a more equitable
society. The benefits from trade and investment liberalisation could be used to invest in
social services and trade-adjustment measures in order to reduce existing gaps and take
full advantage of globalisation. The prosperity, information, and people exchange
globalisation brings could be used to invest in suitable infrastructure; provide access to
education, skills retraining, and health care; as well as give relief for workers and
households affected by economic shocks or structural unemployment. It can open up
opportunities for enterprise and innovation, as well as open minds to different cultures and
ideas.
But the key word is ‘opportunity’. Globalisation alone will not lead to a fairer or more
equal society. Globalisation alone will not reduce bigotry or hate. It will require the hard
work of policymakers and the strength of will of politicians to turn opportunity into reality.

17
2 GLOBAL ECONOMIC MOMENTUM AND OPTIMISM
FUELLING NEAR-TERM GROWTH 43
2.1 APEC GDP GROWTH
The world economy was shaped by three major events in 2016: (1) the United Kingdom’s
withdrawal from the European Union via a referendum in June 2016, more commonly
known as Brexit; (2) the United States’ elections in November 2016; and (3) the decision
by the Organization of the Petroleum Exporting Countries
(OPEC) to cut production levels in November 2016. These
key developments gave rise to policy changes and associated
uncertainty, which have affected both the speed and direction
of world economic growth, either directly via trade and
investments, or indirectly via consumer and business
confidence.
The initial impact of Brexit was manageable, but there remains some uncertainty regarding
the magnitude of its effects in the medium term given that the formal withdrawal process
commenced only on 29 March 2017 and is expected to be completed by April 2019.
The anticipated shift in economic policies with the new US administration, including trade
and fiscal policies, could have implications not only for the US economy, but also for the
overall output of its trade partners and the pace of global economic activity as a whole.
The OPEC decision in November 2016 to significantly reduce output by about 1.2 million
barrels a day starting in January 2017 had an immediate impact. The stock prices of energy
companies surged, movements in the currencies of large oil exporters were observed, and
benchmark oil prices recorded an increase of as much as 10 percent in New York. More
importantly, the OPEC agreement helped nudge the oil market toward a level of
rebalancing where the supply of oil aligns with demand, translating to higher prices. Higher
oil prices should provide relief to commodity exporters by easing fiscal constraints, thereby
allowing economies to spend on infrastructure and social initiatives that will augment
households’ purchasing power, resulting in increased economic activity.
43 Prepared by Rhea C. Hernando, Researcher, APEC PSU.
Major external events
in 2016:
(1) Brexit
(2) US elections
(3) OPEC output cut.
18
Parallel to these key external developments is the economic
momentum, which started halfway through 2016 as part of
the global cyclical recovery from the 2008–2009 global
financial crisis. This synchronized global upswing is
supported by a turnaround in manufacturing and trade
during the second half of 2016.
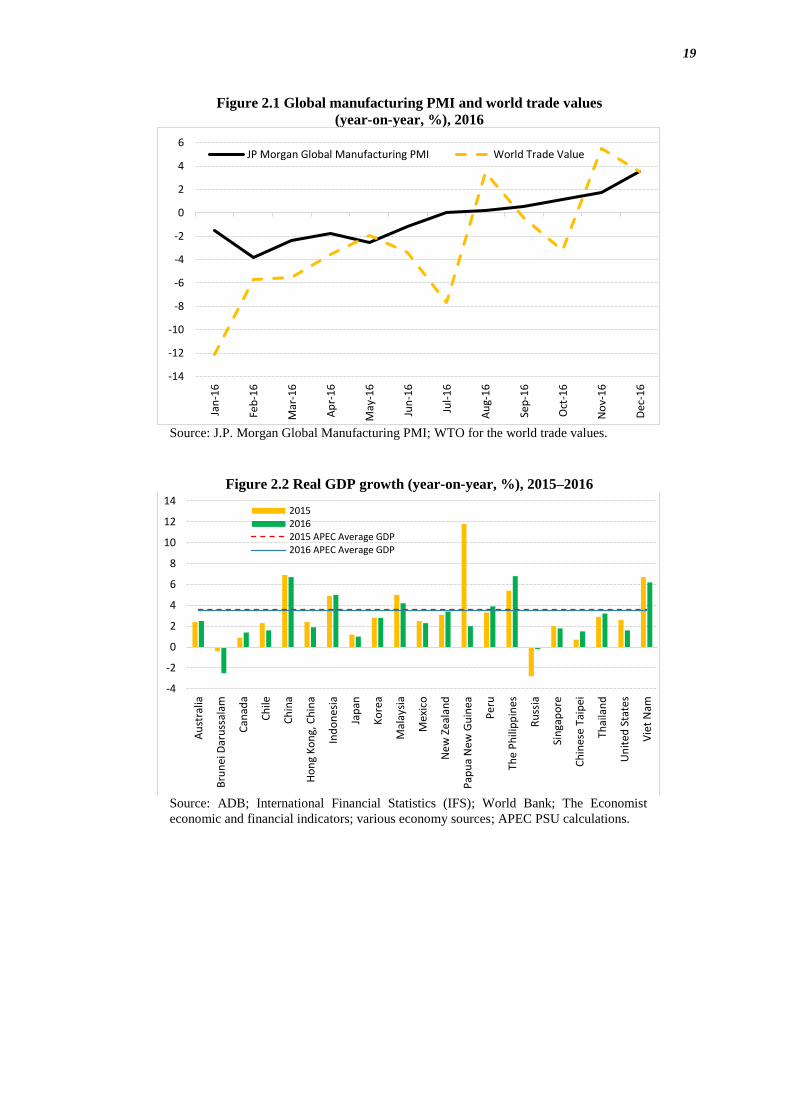
Global manufacturing, as measured by the J.P. Morgan Global Manufacturing Purchasing
Manager’s Index (PMI),44 started to firm up its increase in July 2016, ending the year with
a 34-month-high index score of 52.7 in December 2016, above the long-run average of
51.4. In terms of world trade, the value of aggregate merchandise exports and imports grew
by 3.5 percent in August 2016 after being in negative territory during the first seven months
of the year, dipping in September–October 2016, and posting stronger gains in November–
December 2016 (Figure 2.1).
The manageable initial impact of major developments worldwide amid
firmer signs of a global cyclical recovery, together with China’s
ongoing economic transformation that is supported by fiscal measures,
were factors behind APEC’s 3.5 percent GDP growth in 2016 (albeit
slightly lower than the year-ago level of 3.6 percent).45
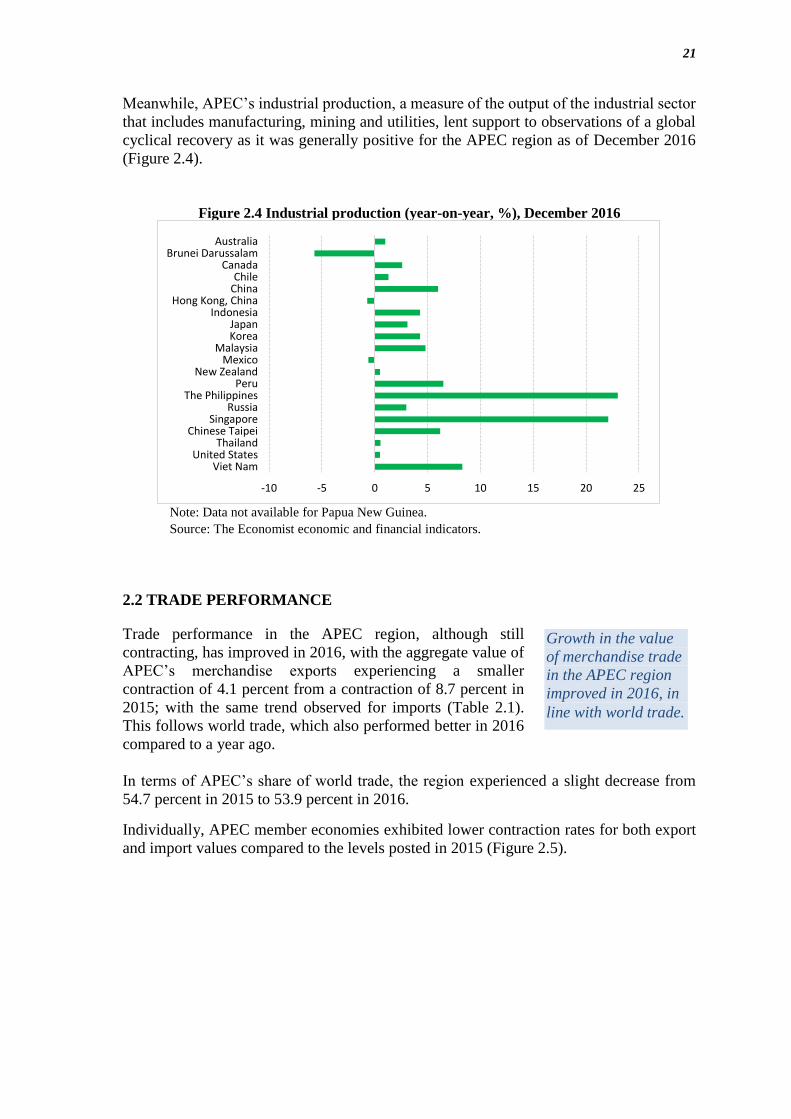
APEC member economies recorded growth in GDP in 2016 ranging from 1.0 to 6.7 percent
(Figure 2.2) with two exceptions, namely, Brunei Darussalam and Russia, both of which
are commodity exporters that posted contractions in GDP growth in 2016 due to the
prolonged downturn in oil prices.
Brunei Darussalam contracted by 2.5 percent in 2016, a further downward adjustment from
the 2015 contraction of 0.4 percent even as Russia’s economy turned for the better with a
smaller contraction of 0.2 percent in 2016 following a 2.8 percent contraction in the
previous year.
44 The J.P. Morgan Global Manufacturing PMI is produced monthly by J.P. Morgan and IHS Markit in
association with the Institute for Supply Management (ISM) and the International Federation of Purchasing
and Supply Management (IFPSM). This global indicator is derived from data produced using internationally
comparable methodologies covering around 10,000 survey respondents in over 20 economies, which
collectively represent 76 percent of global economic output. 45 The GDP growth rate for the APEC region is a weighted average of the growth rates of all 21 member
economies.
APEC GDP
grew by
3.5 percent
in 2016.
A global cyclical
recovery is underway,
supported by a
turnaround in trade and
manufacturing.
19
Figure 2.1 Global manufacturing PMI and world trade values
(year-on-year, %), 2016
Source: J.P. Morgan Global Manufacturing PMI; WTO for the world trade values.
Figure 2.2 Real GDP growth (year-on-year, %), 2015–2016
Source: ADB; International Financial Statistics (IFS); World Bank; The Economist
economic and financial indicators; various economy sources; APEC PSU calculations.
-14
-12
-10
-8
-6
-4
-2
0
2
4
6
Jan
-16
Feb
-16
Mar
-16
Ap
r-1
6
May
-16
Jun
-16
Jul-
16
Au
g-1
6
Sep
-16
Oct
-16
No
v-1
6
Dec
-16
JP Morgan Global Manufacturing PMI World Trade Value
-4
-2
0
2
4
6
8
10
12
14
Au
stra
lia
Bru
nei
Dar
uss
alam
Can
ada
Ch
ile
Ch
ina
Ho
ng
Ko
ng,
Ch
ina
Ind
on
esia
Jap
an
Ko
rea
Mal
aysi
a
Mex
ico
Ne
w Z
eal
and
Pap
ua
New
Gu
inea
Per
u
The
Ph
ilip
pin
es
Ru
ssia
Sin
gap
ore
Ch
ines
e Ta
ipei
Thai
lan
d
Un
ited
Sta
tes
Vie
t N
am
201520162015 APEC Average GDP2016 APEC Average GDP

20
Figure 2.3 Growth in components of GDP, 2016
Notes: PCE = private consumption expenditure; GCE = government
consumption expenditure; GFCF = gross fixed capital formation. Data not
available for Papua New Guinea. Missing bars denote either nil growth or
unavailable data.
Source: ADB; various economy sources; APEC PSU calculations.
The sustained strength in domestic private and government consumption remained the
main fuel for APEC’s growth amid persistent uncertainty associated with policy shifts and
economic transitions occurring worldwide (Figure 2.3). Domestic consumption was
boosted by still-low interest rates and commodity prices as
well as government action to pump-prime the economy via
fiscal stimulus measures and infrastructure-related
expenditures. The generally accommodative environment
encouraged continued spending, mitigating the adverse effect
of uncertainty on consumer and business confidence.
Growth in gross fixed capital formation was mixed across the APEC region, with more
emerging market economies in APEC notably opting to invest in durable equipment and
construction compared to other member economies.
In real terms, the contribution of exports to APEC GDP growth was generally stronger in
2016. More economies registered growth in exports, while other members saw smaller
contractions.
-60
-40
-20
0
20
40
60
Au
stra
lia
Bru
nei
Dar
uss
alam
Can
ada
Ch
ile
Ch
ina
Ho
ng
Ko
ng,
Ch
ina
Ind
on
esia
Jap
an
Ko
rea
Mal
aysi
a
Mex
ico
Ne
w Z
eal
and
Per
u
The
Ph
ilip
pin
es
Ru
ssia
Sin
gap
ore
Ch
ines
e Ta
ipei
Thai
lan
d
Un
ited
Sta
tes
Vie
t N
am
PCE GCE GFCF Exports Imports
Private and
government
consumption remained
the main fuel for
APEC’s growth.
21
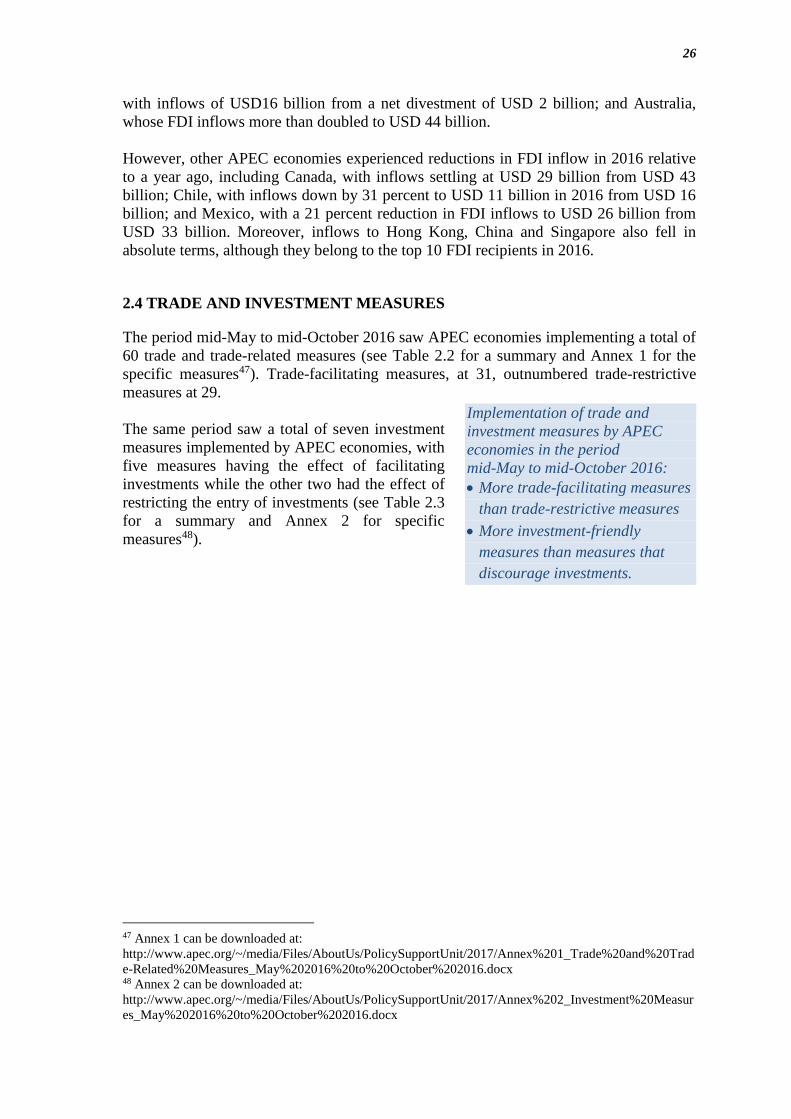
Meanwhile, APEC’s industrial production, a measure of the output of the industrial sector
that includes manufacturing, mining and utilities, lent support to observations of a global
cyclical recovery as it was generally positive for the APEC region as of December 2016
(Figure 2.4).
Figure 2.4 Industrial production (year-on-year, %), December 2016
Note: Data not available for Papua New Guinea.
Source: The Economist economic and financial indicators.
2.2 TRADE PERFORMANCE
Trade performance in the APEC region, although still
contracting, has improved in 2016, with the aggregate value of
APEC’s merchandise exports experiencing a smaller
contraction of 4.1 percent from a contraction of 8.7 percent in
2015; with the same trend observed for imports (Table 2.1).
This follows world trade, which also performed better in 2016
compared to a year ago.
In terms of APEC’s share of world trade, the region experienced a slight decrease from
54.7 percent in 2015 to 53.9 percent in 2016.
Individually, APEC member economies exhibited lower contraction rates for both export
and import values compared to the levels posted in 2015 (Figure 2.5).
-10 -5 0 5 10 15 20 25
AustraliaBrunei Darussalam
CanadaChile
ChinaHong Kong, China
IndonesiaJapanKorea
MalaysiaMexico
New ZealandPeru
The PhilippinesRussia
SingaporeChinese Taipei
ThailandUnited States
Viet Nam
Growth in the value
of merchandise trade
in the APEC region
improved in 2016, in
line with world trade.

22
Table 2.1 Value and growth in merchandise trade (in nominal terms), 2015–2016
Note: Data not available for Papua New Guinea.
Source: WTO; Brunei Darussalam Economic Planning and
Development Office; APEC PSU calculations.
Figure 2.5 Growth in the value of merchandise exports and imports
(in nominal terms, year-on-year, %), 2016
Note: Data not available for Papua New Guinea.
Source: WTO; Brunei Darussalam Economic Planning
and Development Office; APEC PSU calculations.
Merchandise Trade
Value in million USD; Growth rate (y-o-y) and share in percent
Value Growth rate
2014 2015 2016 2015 2016
APEC
Exports 9,105,213.0 8,311,448.6 7,974,488.9 -8.7 -4.1
Imports 9,361,369.6 8,293,332.1 7,987,199.1 -11.4 -3.7
Total Trade 18,466,582.7 16,604,780.7 15,961,688.0 -10.1 -3.9
World
Exports 17,083,000.0 15,202,000.0 14,806,000.0 -11.0 -2.6
Imports 17,560,000.0 15,353,000.0 14,947,000.0 -12.6 -2.6
Total Trade 34,643,000.0 30,555,000.0 29,753,000.0 -11.8 -2.6
APEC's share of the world
Exports 53.3 54.7 53.9
Imports 53.3 54.0 53.4
Total Trade 53.3 54.3 53.6
-50
-40
-30
-20
-10
0
10
20
Au
stra
liaB
run
ei D
aru
ssal
amC
anad
aC
hile
Ch
ina
Ho
ng
Ko
ng,
Ch
ina
Ind
on
esia
Jap
anK
ore
aM
alay
sia
Mex
ico
Ne
w Z
eal
and
Per
uTh
e P
hili
pp
ines
Ru
ssia
Sin
gap
ore
Ch
ines
e Ta
ipei
Thai
lan
dU
nit
ed S
tate
sV
iet
Nam
2015 exports
2016 exports
2015 average exports
2016 average exports
-40
-30
-20
-10
0
10
20
Au
stra
liaB
run
ei D
aru
ssal
amC
anad
aC
hile
Ch
ina
Ho
ng
Ko
ng,
Ch
ina
Ind
on
esia
Jap
anK
ore
aM
alay
sia
Mex
ico
Ne
w Z
eal
and
Per
uTh
e P
hili
pp
ines
Ru
ssia
Sin
gap
ore
Ch
ines
e Ta
ipei
Thai
lan
dU
nit
ed S
tate
sV
iet
Nam
2015 imports
2016 imports
2015 average imports
2016 average imports

23
The enhanced trade in 2016 could be attributed to a
confluence of factors. First, stronger global demand in
light of the cyclical recovery supported trade. Second,
higher commodity prices encouraged production and
trade activity while also boosting investments and
strengthening the case for higher future demand and
inventories. In particular, prices for both oil and non-
oil commodity products had gone up in December 2016 compared to the year-ago level.
The All Commodities index grew by 26.4 percent in December 2016 from −30.7 percent
in December 2015, while crude oil prices jumped by 44.2 percent from −39.8 percent
during the same comparable period (Figure 2.6). Third, idiosyncratic factors relating to
individual economies’ pursuit of more diversified markets, products and partners as well
as trade agreements have also contributed to improved trade in the APEC region.
Figure 2.6 Growth in commodity prices (year-on-year, %), 2016
Source: IMF Primary Commodities.
-50
-40
-30
-20
-10
0
10
20
30
40
50
All
com
mo
dit
ies
Foo
d
Bev
erag
e
Ind
ust
rial
inp
uts
Agr
i raw
mat
eria
ls
Met
als
Ener
gy
Cru
de
oil
Dec-15 Dec-16
The improvement in APEC
trade could be traced to
stronger global demand,
higher commodity prices, and
other trade-related factors.

24
Trade activity in the APEC region largely mirrored
movements in world trade. Available quarterly data covering
the period 2005–2016 show that the trade values of the world
and the APEC region generally moved together, marked by
the following highlights: reached double-digit levels in the
pre-2008 global financial crisis; plunged into negative
territory during the 2008–2009 crisis period; recovered strongly in 2010–2011 as monetary
authorities worldwide launched coordinated quantitative easing measures to ease credit
conditions; weakened significantly in 2012–2014 due to the lingering impact of the crisis;
and contracted since the fourth quarter of 2014 up to the third quarter of 2016, with
noticeable improvements.
Meanwhile, the volume of world trade has shown consecutive growth since the first quarter
of 2010, although a slight dip toward negative territory was seen in the first and third
quarters of 2016 (Figure 2.7).
Figure 2.7 Quarterly (year-on-year) growth in volume and value of trade
Source: WTO short-term trade statistics.
-40
-30
-20
-10
0
10
20
30
40
06
Q1
06
Q3
07
Q1
07
Q3
08
Q1
08
Q3
09
Q1
09
Q3
10
Q1
10
Q3
11
Q1
11
Q3
12
Q1
12
Q3
13
Q1
13
Q3
14
Q1
14
Q3
15
Q1
15
Q3
16
Q1
16
Q3
World trade volume World trade value APEC trade value
Trade activity in
APEC largely
mirrored movements in
world trade.

25
2.3 INVESTMENT TRENDS
Preliminary data from the United Nations Conference on Trade and Development
(UNCTAD) show that global FDI flows declined by 13 percent to USD 1.52 trillion in
2016 from USD 1.75 trillion in 2015, owing to weak global economic growth and the
marginal year-on-year increase in world trade volume for the whole year of 2016.46
Nonetheless, this decline does not tell the whole story. There exist variations in FDI
movements across the globe. For example, while the estimated FDI flows to developed
economies dropped by 9 percent to USD 872 billion, led by Europe which fell by 29
percent, a significant increase was noted in other developed economies, particularly
Australia and Japan. Also, FDI inflows to developing economies were lower by 20 percent,
while transition economies attracted 38 percent more FDI in 2016 at USD 52 billion
compared to a year ago.
APEC member economies constituted half of the top 10 FDI
recipient economies in 2016. The United States took the
largest share of FDI at USD 385 billion with 11 percent
growth, maintaining its position as the top FDI host
economy. The other APEC economies in the top 10 in 2016
were: China (USD 139 billion); Hong Kong, China (USD 92
billion); Singapore (USD 50 billion); and Australia (USD 44 billion). Taken together, FDI
inflows to these APEC host economies reached USD 710 billion, equivalent to 46.7 percent
of global FDI flows in 2016 (Figure 2.8).
Figure 2.8 Top APEC FDI host economies (USD billion), 2016
.
Source: UNCTAD.
The other upward movers in the APEC region in 2016 relative to 2015 FDI levels were:
Korea, which posted FDI inflows at USD 9.4 billion from USD 4.0 billion; Russia, which
recorded a 62 percent rise in FDI inflows to USD 19 billion from USD 12 billion; Japan,
46 UNCTAD, Global Investment Trends Monitor no. 25 (1 February 2017).
385
139
92
50
44
United States
China
Hong Kong, China
Singapore
Australia
The top five APEC FDI
hosts accounted for
46.7 percent of global
FDI flows in 2016.
26
with inflows of USD16 billion from a net divestment of USD 2 billion; and Australia,
whose FDI inflows more than doubled to USD 44 billion.
However, other APEC economies experienced reductions in FDI inflow in 2016 relative
to a year ago, including Canada, with inflows settling at USD 29 billion from USD 43
billion; Chile, with inflows down by 31 percent to USD 11 billion in 2016 from USD 16
billion; and Mexico, with a 21 percent reduction in FDI inflows to USD 26 billion from
USD 33 billion. Moreover, inflows to Hong Kong, China and Singapore also fell in
absolute terms, although they belong to the top 10 FDI recipients in 2016.
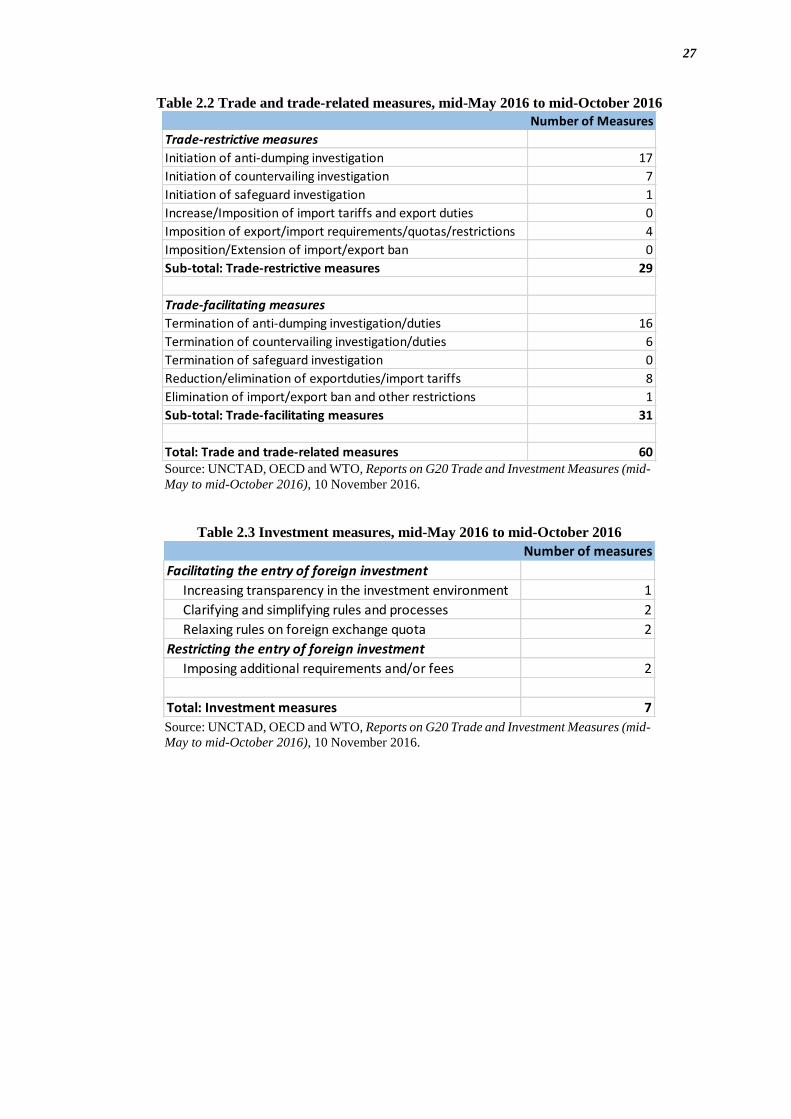
2.4 TRADE AND INVESTMENT MEASURES
The period mid-May to mid-October 2016 saw APEC economies implementing a total of
60 trade and trade-related measures (see Table 2.2 for a summary and Annex 1 for the
specific measures47). Trade-facilitating measures, at 31, outnumbered trade-restrictive
measures at 29.
The same period saw a total of seven investment
measures implemented by APEC economies, with
five measures having the effect of facilitating
investments while the other two had the effect of
restricting the entry of investments (see Table 2.3
for a summary and Annex 2 for specific
measures48).
47 Annex 1 can be downloaded at:
http://www.apec.org/~/media/Files/AboutUs/PolicySupportUnit/2017/Annex%201_Trade%20and%20Trad
e-Related%20Measures_May%202016%20to%20October%202016.docx 48 Annex 2 can be downloaded at:
http://www.apec.org/~/media/Files/AboutUs/PolicySupportUnit/2017/Annex%202_Investment%20Measur
es_May%202016%20to%20October%202016.docx
Implementation of trade and
investment measures by APEC
economies in the period
mid-May to mid-October 2016:
More trade-facilitating measures
than trade-restrictive measures
More investment-friendly
measures than measures that
discourage investments.
27
Table 2.2 Trade and trade-related measures, mid-May 2016 to mid-October 2016
Source: UNCTAD, OECD and WTO, Reports on G20 Trade and Investment Measures (mid-
May to mid-October 2016), 10 November 2016.
Table 2.3 Investment measures, mid-May 2016 to mid-October 2016
Source: UNCTAD, OECD and WTO, Reports on G20 Trade and Investment Measures (mid-
May to mid-October 2016), 10 November 2016.
Number of Measures
Trade-restrictive measures
Initiation of anti-dumping investigation 17
Initiation of countervailing investigation 7
Initiation of safeguard investigation 1
Increase/Imposition of import tariffs and export duties 0
Imposition of export/import requirements/quotas/restrictions 4
Imposition/Extension of import/export ban 0
Sub-total: Trade-restrictive measures 29
Trade-facilitating measures
Termination of anti-dumping investigation/duties 16
Termination of countervailing investigation/duties 6
Termination of safeguard investigation 0
Reduction/elimination of exportduties/import tariffs 8
Elimination of import/export ban and other restrictions 1
Sub-total: Trade-facilitating measures 31
Total: Trade and trade-related measures 60
Number of measures
Facilitating the entry of foreign investment
Increasing transparency in the investment environment 1
Clarifying and simplifying rules and processes 2
Relaxing rules on foreign exchange quota 2
Restricting the entry of foreign investment
Imposing additional requirements and/or fees 2
Total: Investment measures 7

28
As a percentage of the total, trade-facilitating measures outweighed trade-restrictive
measures for the reporting period mid-May to mid-October 2016. This development was a
turnaround from the mid-October 2015 to mid-May 2016 period wherein the trade
measures implemented by APEC economies leaned toward trade-restrictive measures at
69 percent of the total compared to 31 percent of trade-facilitating measures (Figure 2.9).49
Meanwhile, APEC economies have been consistent
in implementing more investment-friendly measures
compared to investment-restrictive measures across
reporting periods. However, although measures that
facilitate investments remained significant, they
have been declining as a percentage of total measures
implemented. In contrast, investment-restrictive measures are on an uptrend, from 16.7
percent of the total in mid-May to mid-October 2015 to 21.4 percent in mid-October 2015
to mid-May 2016, and 28.6 percent as of the latest reporting period covering mid-May to
mid-October 2016 (Figure 2.9).
Figure 2.9 Trade and investment measures in APEC (as % of total)
mid-May 2015 to mid-October 2016
Source: UNCTAD, OECD and WTO, Reports on G20 Trade and Investment
Measures (mid-May 2015 to mid-October 2016).
49 It is instructive to note that only 9 of the 21 APEC member economies belong to the G20, namely:
Australia; Canada; China; Indonesia; Japan; Korea; Mexico; Russia; and the United States.
0102030405060708090
Trad
e-f
acili
tati
ng
mea
sure
s
Trad
e-r
est
rict
ive
mea
sure
s
Inve
stm
ent-
faci
litat
ing
me
asu
res
Inve
stm
ent-
rest
rict
ive
mea
sure
s
mid-May 2015 to mid-Oct 2015
mid-Oct 2015 to mid-May 2016
mid-May 2016 to mid-Oct 2016
Although investment-friendly
measures remained significant,
investment-restrictive measures
are on an uptrend.

29
The latest available data from the WTO up to October 2016 covering all WTO members
show that APEC member economies who are not G20 members have also implemented
trade-facilitating measures, including the elimination of import and export licensing
requirements on certain products; the termination of anti-dumping duties on selected
imports; and the reduction of import tariffs and port charges. However, the same period
also saw other APEC economies implementing trade-restrictive measures such as anti-
dumping investigations and safeguard investigations on certain imports.
2.5 NEAR-TERM OUTLOOK, RISKS AND OPPORTUNITIES
Near-term GDP projections point to higher APEC growth
for the period 2017–2019, generally apace with world
economic activity.
Following a GDP growth rate of 3.5 percent in 2016,
which was higher than the estimated world GDP of 3.0–
3.1 percent, the APEC region is expected to accelerate to
a growth of 3.8 percent for the period 2017–2018, before
tapering to 3.7 percent by 2019. The upward trend in APEC’s GDP growth mirrors the
expected trajectory of world growth, at 3.5 percent in 2017; 3.6–3.7 percent in 2018; and
settling at around 3.7 percent in 2019 (Figure 2.10).
Figure 2.10 Forecast of GDP growth for APEC and the world, 2017–2019
Notes: IMF GDP figures in PPP, constant 2011 international dollar; World Bank
GDP figures in constant 2010 PPP weights.
Source: IMF, World Economic Outlook Database, April 2017; World Bank,
Global Economic Prospects, January 2017 – Weak Investment in Uncertain
Times (Washington, DC: World Bank, 2017); APEC PSU calculations.
2.9
3.0
3.1
3.2
3.3
3.4
3.5
3.6
3.7
3.8
3.9
2015 (actual) 2016 (actual) 2017(f) 2018(f) 2019(f)
APEC World (IMF) World (WB)
The APEC region is
expected to post a higher
GDP growth rate in the
near term, generally
apace with world
economic activity.
30
Trade and investment activity will continue to have an impact on economic growth. In its
April 2017 trade outlook, the WTO expects trade to recover via a 2.4 percent growth in
world merchandise trade volume in 2017 from a lacklustre increase of 1.3 percent in
2016.50 This optimistic projection rests primarily on a
near-term global expansion that is expected to create
positive effects on global demand and overall trade.
However, uncertainty looms. The lack of clarity on
near-term policy directions encompassing trade,
monetary and fiscal policies translates to higher risks.
Thus, the forecast range for world trade volume in 2017 is wider at 1.8–3.6 percent. For
2018, the WTO forecasts higher trade growth as world merchandise trade volume is
expected to increase to a range of 2.1–4.0 percent.
IMF projections of world trade volume track the WTO forecasts as the IMF also expects a
higher growth of 3.8 percent in 2017 and 3.9 percent in 2018.51 The IMF’s forecast is
supported by expectations of increased demand and capital spending, bolstered by the
observed synchronised upswing of economies across the globe and the gradual recovery in
commodity prices.
Trade and trade-related measures, particularly relating to the movement of goods and
supply of services across borders, continue to be a key factor in determining the level of
trade activity and resulting gains.
Pressures to turn inward and implement policies that lean toward protectionism amid
discussions on income inequality and low productivity, combined with anti-globalisation
sentiments, could affect the free flow of trade and investments across economies,
threatening not only the global recovery in the short term, but also the move toward greater
economic integration that has the potential to significantly benefit economies in the
medium term.
Clear and consistent policy directions could
help create an environment conducive to trade
activity, which, at the same time, could
encourage greater investments. Unclear and
conflicting policies, conversely, could hold
back trade and investments.
50 WTO, ‘Trade recovery expected in 2017 and 2018, amid policy uncertainty’, press release, World Trade
Organization, 12 April 2017, https://www.wto.org/english/news_e/pres17_e/pr791_e.htm (accessed 5 May
2017) 51 IMF, World Economic Outlook April 2017: Gaining Momentum? (Washington, DC: IMF, 2017).
Trade volume and FDI are
expected to grow stronger in
the near term, in line with the
global cyclical recovery.
Clear and consistent trade, monetary
and fiscal policies could determine
the magnitude and direction of
global growth in the short term.
31
Along with prevailing uncertainties, particularly relating to trade policy and its
consequence for trade and investment, short-term monetary and fiscal policies could also
affect economic growth.
Monetary surprises could generate volatility and affect economies via capital flows and
capital costs. A larger-than-expected mark-up in US interest rates could trigger capital
flight from economies that are perceived as fundamentally weak, further raising foreign
debt burdens and potentially introducing credit constraints. In addition, an increase in US
interest rates leads to a stronger US dollar, which could create currency mismatches that
could weigh down foreign debt borrowers. Furthermore, higher interest rates translate to
higher capital costs, which could deter investment opportunities.
On the other hand, fiscal stimulus measures, especially from the US and China as they
support their economies’ growth requirements amid economic transitions, could have
positive spillover effects for the global economy via increased demand, which, in turn,
could boost trade and investments across the globe, realising projections of higher world
growth in the near term.
Aside from expectations of fiscal support, another factor that could lead to accelerated
global growth is a projected 10 percent increase in FDI in 2017 on the back of a stronger
global economic recovery as well as a rosier trade picture in the short term. However,
UNCTAD is also mindful about the role that uncertainty plays in a global setting,
particularly relating to the magnitude and frequency of changes in US monetary policy
rates as well as near-term economic policy directions which could influence the path of
investments going forward.52
There is substantial upside potential for increased growth as trade and investment are
expected to gather pace in tandem with the global recovery. However, there is also
significant uncertainty on near-term trade, monetary and fiscal policies; and this could
pause trade and investment activity, weighing down overall economic growth. Therefore,
the clarity, transparency and consistency of economic policies could determine the
magnitude and direction of economic growth in the near term.
52 UNCTAD, Global Investment Trends Monitor no. 25.

32
2.6 CONCLUSION
The cyclical global recovery affords economies a level of optimism not seen since the 2008
global financial crisis. This optimism is supported by improvements in trade growth along
with manufacturing observed in the second half of 2016. In the near-term period covering
2017–2019, the economic picture points to higher global growth, marked by more buoyant
trade and investment activity. In the APEC region, economic growth is expected to surpass
world GDP in 2017–2018, converging in 2019.
It is important to sustain the global upswing and benefit from
stronger consumer and business confidence by implementing
macroeconomic measures that continue to prop up demand.
At the same time, economies need to be mindful that the risks
are substantial, and uncertainty, particularly on the direction
of economic policies, remains a significant downside risk that
could put a brake on the economic momentum if not addressed
in an appropriate and timely manner.
Macroeconomic management differs across economies, depending on domestic conditions
and vulnerabilities. The aim is to continue to support growth requirements via the demand
channel to be able to derive the full benefits from the ongoing global economic momentum.
Economies with enough elbow room to apply fiscal support measures could consider
building infrastructure; supporting the labour market with programmes for those displaced
by globalisation and technological change; and implementing social safety nets and other
initiatives to help the vulnerable and marginalized, including women, the young and the
disabled. Economies with fiscal constraints could lean toward easing interest rates as well
as streamlining requirements and procedures to boost credit growth, and thereby,
encourage consumer and business consumption.
Macroeconomic management needs to be supported by structural
reforms that promote innovation, lead to more competitive
markets, facilitate participation of all segments of society, and
enhance economic resilience, allowing for a significant
contribution toward the goal of sustainable and inclusive growth.
In concrete terms, these reforms entail reducing the cost of doing
business, unlocking productivity gains, increasing labour force participation across gender
and skill levels, and ensuring that a wider set of opportunities is available and accessible
to all.
APEC continues to push forward its structural reform agenda. APEC’s work on this front
began in earnest in 2004 with the Leaders’ Agenda to Implement Structural Reform
(LAISR). It forged on with the APEC New Strategy for Structural Reform (ANSSR) in
2010; and strengthened the agenda anew through the Renewed APEC Agenda on Structural
Reform (RAASR) which has a 5-year implementation period covering 2015–2020. APEC
member economies have come up with individual action plans to implement the RAASR
It is important to
sustain, and benefit
from, the global
upswing by
implementing
measures that continue
to fuel demand.
Macroeconomic
management needs
to be supported by
structural reforms.
33
and have agreed on 17 APEC-wide external indicators to monitor their progress.53 A mid-
term review is due in 2018, with a final review in 2020.
Parallel to these efforts to respond to structural transformations through reforms,
economies could also allocate resources for infrastructure to improve connectivity and help
facilitate trade and investment flows. Also, investing in human capital could bridge gaps
in skills and education while also addressing vulnerabilities.
The APEC region envisions free and open trade and investment in the Asia-Pacific; by
2010 for industrialised economies, and by 2020 for developing economies.54 Commitments
and subsequent actions toward achieving the APEC vision by member economies are
voluntary as APEC operates on the basis of non-binding commitments, open dialogue, and
equal respect for the views of all participants.
In 2015, the APEC region accounted for around 59 percent of the world’s nominal GDP
and almost half of the world’s total trade at 48 percent.55 This combination of a non-
binding, consensus-based process and significant influence puts APEC in a unique position
to move forward policy discussions to respond to prevailing issues that pose challenges to
its vision. As such, APEC needs to refocus so that its members collectively work toward
the goal of a free flow of trade and investment across the Asia-Pacific region, while, at the
same time, being mindful of the impact of its actions on
vulnerable groups by instituting social programmes to
ensure that the benefits are shared by all members of
society. APEC’s decisions and actions, both in the short
term and the medium term, could help cement the path
toward higher, more sustainable, more equitable and
more inclusive growth, both for the region and the
world.
53 The APEC-wide external indicators are discussed at length in: A. Wirjo, Exploring Quantitative Indicators
for Effective Monitoring of APEC-wide Progress on Structural Reform under RAASR 2016–2020 (APEC
PSU, Singapore: APEC Secretariat, 2016). 54 These goals for APEC member economies, known as the Bogor Goals, were agreed on by the APEC
Economic Leaders in Bogor, Indonesia in 1994. 55 APEC PSU, APEC in Charts 2016 (Singapore: APEC Secretariat, 2016).
APEC’s short- and medium-
term actions could help
cement the path toward
higher, more sustainable and
more inclusive growth, both
for the region and the world.