apett engineering professional engineers of magazine...
TRANSCRIPT

APETT Engineering
Magazine June 2017
June 2016 Edition
June 2017
Edition
The Association of Professional Engineers of
Trinidad and Tobago
APETT’s Mission: The Association of Professional Engi-neers of Trinidad and Tobago is a learned society of profession-al engineers dedicat-ed to the develop-ment of engineers and the engineering profession. The asso-ciation promotes the highest standards of professional practice and stimulates awareness of tech-nology and the role of the engineer in
society.
ISSUE 3 June 2017 Edition

Page 2 APETT Engineering Magazine June 2017
TABLE OF CONTENTS
Common Considerations for Pressure Safety Valve (PSV) Selection and Operation Page 8 By: Danny Ramoutar and Rajendra Ramlochan
CO2 Removal using Lo - Heat Benfield Process Page 6 By: Tenille Neptune
Thoughts on Root Cause and Corrective action Page 15 By: Michael Merritt
Restricted Earth Fault Protection: Safeguarding Your Power Transformer By: Anim Adrian Amarsingh, Carlos Francois, Rawle Arneaud, Wayne Ramkissoon Page 19
Can the boom of the crane touch the structure in front of it? Page 26 By: Oscar Morillo
Key Issues in the Future Development of our Transportation System Page 33 By: Dr. Trevor Townsend
Subsea Pipelines For Crude Oil Production Activities: A Typical On-Shore Fabrication
Process By: Randell Mahabir Page 12
Article References Page 36

Editor’s Message Page 3
Eng. Julio Bissessar is cur-rently a Graduate Trainee Pro-cess Engineer at Atlantic LNG. Julio has over two years work experience between Atlantic LNG and Petrotrin. He holds a Masters of Engineering (M.Eng) in Process Engineering from the University of Trinidad and Tobago (UTT) and has topped his year in Engineering. Julio has also participated in a number of engineering related competitions. These include winning with his group (Eng. Laura Lewis and Eng. Shameal Ali) the BP's Ultimate Field Trip (UFT) International Engi-neering Competition of 2014 , winning a special prize for the senior category of the NI-HERST's Prime Minister's Awards for Scientific Ingenuity of 2015 and a runner up for the IET's Present Around The World (PATW) Engineering Competition of 2014/2015. Julio has also won the best design project at the Bachelor's level (2013) and the M.Eng level (2015) at UTT. He has also presented at the Oil and Gas Technical Conference of
Trinidad and Tobago 2014.
A warm welcome everyone to the June 2017 Edition of APETT’s Engineering Magazine! This edition makes it the third of the publication of the bi-annual mag-
azine which incorporates all Engineering disciplines.
On the Process Engineering side, we have two informative articles both from in-dustry; the first being by Eng. Tenille Neptune, the removal of carbon dioxide us-ing the Lo-Heat Benfield process, which is analogous to the typical amine process-es utilized by gas industries today. The second written by Eng. Danny Ramoutar and Eng. Rajendra Ramlochan involves some common practices and considera-tions when analyzing Pressure Safety Valves (PSVs), written from the perspectives
of some very experienced process engineers.
To enlighten us on the fabrication process of subsea pipelines, Eng. Randell Maha-bir speaks of the detailed fabrication processes and the considerations associated at each stage of the design. This is deeply relevant due to the nature of Trinidad and Tobago’s economy and the quantity of offshore platforms we have. Also, Eng. Michael Merritt discusses his thoughts on root causes and stresses on its im-
portance as well as the corrective actions and management of control factors.
A group of Electrical Engineers wrote an article detailing an inherent issue that they faced in their company associated with electrical transformers. A great deal of work was done by Eng. Anim Adrian Amarsingh, Eng. Rawle Arneaud, Eng. Car-los Francois and Mr. Wayne Ramkissoon and I hope everyone can appreciate that
sometimes the smallest of adjustments can make a big difference.
Moving onto the Civil Engineering frontier, Eng. Oscar Morillo conducted an analysis of the possibility of the boom of a crane touching the structure in front of it. I personally love this article because it explores the possibility with a practical example worked out for the readers. Key issues in the future development of our local transportation system written by Eng. Dr. Trevor Townsend speaks of the
issues in the development of the transportation system in Trinidad and Tobago.
In conclusion, I hope that you, the Readers and Members of APETT enjoy reading the articles. I would like to thank all of the Authors for their dedication and com-mitment to the provision of articles for the team and I would especially like to thank Eng. Anna Warner, Eng. Krisshala Sinanan and Eng. Suzette Baptiste who assisted a great deal with editing. I would also like to thank other members such as Eng. Farah Hyatali and Eng. Fazir Khan for further assistance with editing. I would also like to thank our tech savvy Eng. Jonathan Chang (Webmaster) for his
continued support.
APETT graciously welcomes its regular readers as well as its new readers. To con-tribute in discussions, join our LinkedIn group or keep updated with activities by visiting our website at www.apett.org. Engineers across all Disciplines, both with-in the Industry and Academia, are invited to contribute to our Magazine. To submit
articles or for further queries, please contact us at: [email protected] or [email protected]
Message from APETT’s President
Page 4
The Energy Industries in Trinidad and Tobago continue to face a number of issues-in particular, natural gas shortage and suppressed Oil and Gas prices. Engineers and other Industry Professionals are investing time, effort and resources to find better means of improving efficiency, reliability and productivity with ongoing operations as well as capital projects. Continuous Improvement, Innovation and Creativity are now the watchwords to enable profit as well as sustain a competitive and low cost operation for most organizations in what is considered a difficult and
challenging economy.
I would like to express a heartfelt thanks to our Magazine Editor Eng. Julio Bis-sessar and the rest of his hardworking team for their outstanding commitment and dedication in ensuring that deadlines were met for our first of two publications for 2017. The Engineering content as well as the design are most impressive- thanks
to the Authors for their submissions of these Technical articles.
I would like to remind all members as well as inform the rest of the readership that APETT will be hosting our annual Honors and Awards function in September this year- we hope that you can support us as we recognize outstanding contributions from Engineers. Additionally, in 2018 we would be hosting a Technical Confer-ence entitled “Engineering for Competitiveness: Re-Booting Our Economy”. This will provide the opportunity for the stakeholders to present solutions to en-hance the competitiveness of all sectors/pillars of our economy through engineer-
ing, towards the global arena.
Finally, I would like to encourage us all to continue to support the APETT Maga-zine by submitting articles for publication. This has been a key initiative of the as-sociation for promoting engineering work as we continue to build our local engi-
neering capability.
May we continue to aspire to be students of the Engineering Profession as we ride
this economic wave to keep our industries afloat!
Imtiaz.
Eng. Imtiaz Easahak has over
20 years’ experience in the
Chemical and Gas processing
industries. He has a B.Sc.
Degree in Chemical and Pro-
cess Engineering, Masters in
Production Management and
an MBA from Heriot- Watt
University. He is currently the
President of APETT and a
Registered Engineer
(BOETT) in Trinidad and
Tobago. Prior to joining At-
lantic, he worked at Nu Iron,
International Steel Group,
Cliffs and Associates Limited,
IPSL and Mittal Steel in En-
gineering and Managerial
positions. Imtiaz joined At-
lantic LNG in 2007 and is
currently functioning in the
capacity of Process Engineer-
ing Manager. aaaa

Page 5 APETT Engineering Magazine June 2017
CO2 Removal using Lo - Heat Benfield
Process
Page 6 APETT Engineering Magazine June 2017
By Tenille Neptune, Eng. B. A. Sc.
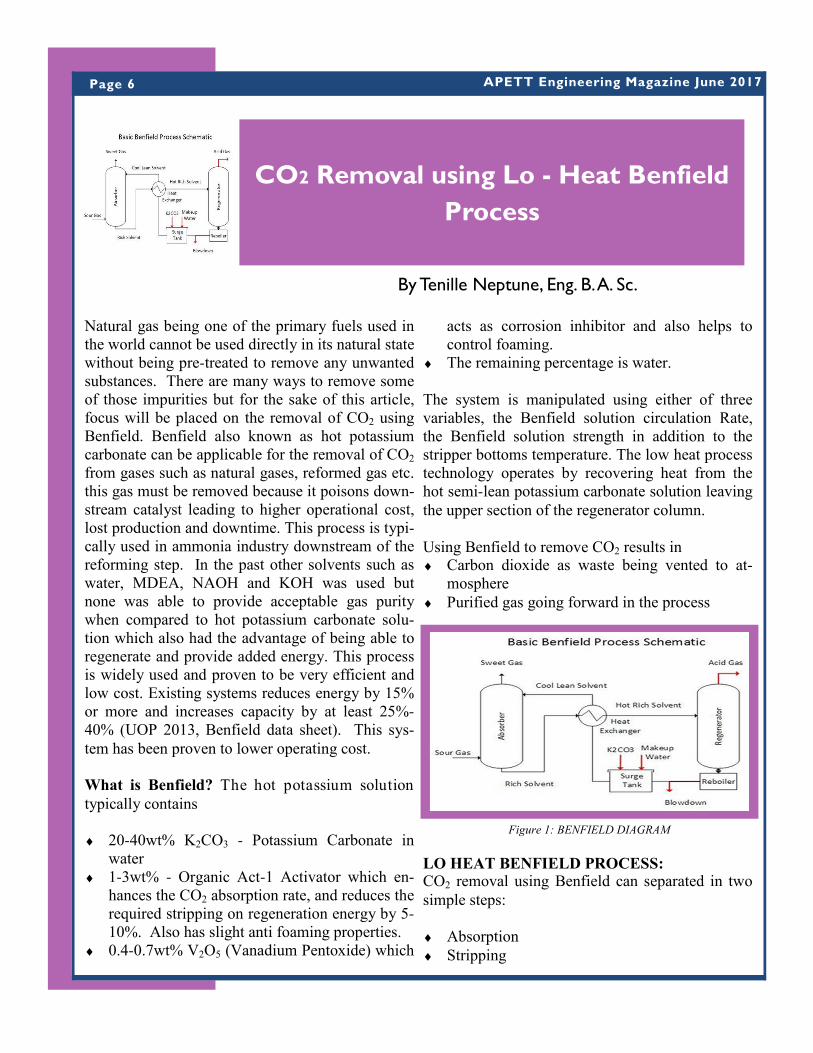
Figure 1: BENFIELD DIAGRAM
Natural gas being one of the primary fuels used in the world cannot be used directly in its natural state without being pre-treated to remove any unwanted substances. There are many ways to remove some of those impurities but for the sake of this article, focus will be placed on the removal of CO2 using Benfield. Benfield also known as hot potassium carbonate can be applicable for the removal of CO2 from gases such as natural gases, reformed gas etc. this gas must be removed because it poisons down-stream catalyst leading to higher operational cost, lost production and downtime. This process is typi-cally used in ammonia industry downstream of the reforming step. In the past other solvents such as water, MDEA, NAOH and KOH was used but none was able to provide acceptable gas purity when compared to hot potassium carbonate solu-tion which also had the advantage of being able to regenerate and provide added energy. This process is widely used and proven to be very efficient and low cost. Existing systems reduces energy by 15% or more and increases capacity by at least 25%-
40% (UOP 2013, Benfield data sheet). This sys-
tem has been proven to lower operating cost.
What is Benfield? The hot potassium solution
typically contains
♦ 20-40wt% K2CO3 - Potassium Carbonate in water
♦ 1-3wt% - Organic Act-1 Activator which en-hances the CO2 absorption rate, and reduces the required stripping on regeneration energy by 5-
10%. Also has slight anti foaming properties. ♦ 0.4-0.7wt% V2O5 (Vanadium Pentoxide) which
acts as corrosion inhibitor and also helps to control foaming.
♦ The remaining percentage is water.
The system is manipulated using either of three variables, the Benfield solution circulation Rate, the Benfield solution strength in addition to the stripper bottoms temperature. The low heat process technology operates by recovering heat from the hot semi-lean potassium carbonate solution leaving
the upper section of the regenerator column.
Using Benfield to remove CO2 results in
♦ Carbon dioxide as waste being vented to at-mosphere
♦ Purified gas going forward in the process
LO HEAT BENFIELD PROCESS: CO2 removal using Benfield can separated in two
simple steps: ♦ Absorption
♦ Stripping

Page 7
In the absorption step the gas to be treated is fed to the bottom of the absorber and flows counter cur-rent to the lean Benfield liquid which is supplied from the top. The CO2 is now absorbed by the ab-sorbing liquid flowing downward. The dry gas leaving the top of the absorber should be contain-ing as little CO2 as possible or as requested by the client. Rich Benfield solution which is now satu-rated with CO2 leaves the bottom of the absorber to
be preheated and regenerated in the next step.
In the stripping step the CO2 is removed from the rich Benfield by counter current flow yet again, only this time with steam on the opposing end as the stripping agent flowing upwards and the Ben-field solution flowing downwards. This heat is de-rived from process gas waste heat, heat generated from a lean solution flash tank and steam generat-
ed in a stripper ejector steam generator.
Some of the semi lean solution taken from the mid-
section of the stripper is sent to the solution flash drum where the solution flows through four inter-nal compartments in series via vapour tight under-flow/overflow baffling. The multi-stage reduction in pressure flash regenerates CO2 from the semi-lean solution due to its absorption capacity in the Absorber column. The liberated CO2 and steam from the semi-lean solution is sent back to the mid-dle of the regenerator column, in place of reboiler steam. The now lean Benfield is cooled and recir-culated to the absorber top after energy recovery in
heat exchangers to start the process over again. The reactions take place in the vessels as follows:
The above reactions are reversible and proceed form left to right in the absorber and vice versa in the stripper. As this cycle is continuous the solu-tion becomes degraded after a period of time and needs to be reactivated. The Benfield Solution re-duces to V+4, which decreases the effectiveness of the corrosion inhibitor. To keep Benfield in its op-timum state where it can do the most work, other chemicals are added to it. This is done by the addi-
tion of Potassium Nitrite (KNO2) to the circulating solution. What this does is re-establish the V+5 in the solution. The V+5 form is more active as far as corrosion resistance is concerned. It is principally the V+5 that is responsible for the protective film that protects the iron against bicarbonate and CO2
corrosion.
Advantages of using Benfield.
♦ If the CO2 content of the purified process gas goes up, increasing the Benfield solution flow rate will help the absorption of CO2.
♦ Increase the concentration of the solution. A stronger solution will absorb more CO2.
♦ If the CO2 content of the lean Benfield Solu-tion stream increases, one can increase the heat duty to the CO2 Stripper, which would improve the stripping rate of the CO2 from the Benfield solution. Removal of more CO2 from the solu-tion would also help to reduce the corrosive-ness of the solution. The lower the CO2 con-tent of the circulating Lean Benfield solution, the greater its ability to absorb CO2.
Disadvantages of using Benfield.
♦ If the inhibitor content of the circulating Ben-field solution decreases below specification, the solution becomes more corrosive and foam-ing will also occur.
♦ Foaming ♦ A stronger solution will absorb more CO2 but
it will also increase the corrosion rate of equip-ment. Corrosion can also occur if the system is
not vanadate properly.
Eng. Tenille Neptune is a passion-ate Process Plant Operator at Point Lisas Nitrogen Limited (PLNL). She studied at the University of Trinidad and Tobago (UTT) and earned her Diploma in Chemical Engineering in addition to her B.A.Sc. in Process Engineering. She has over 5 years operations experience in power plants and ammonia processing. Te-nille enjoys cooking, travelling and
meeting new people.
Page 8 APETT Engineering Magazine June 2017
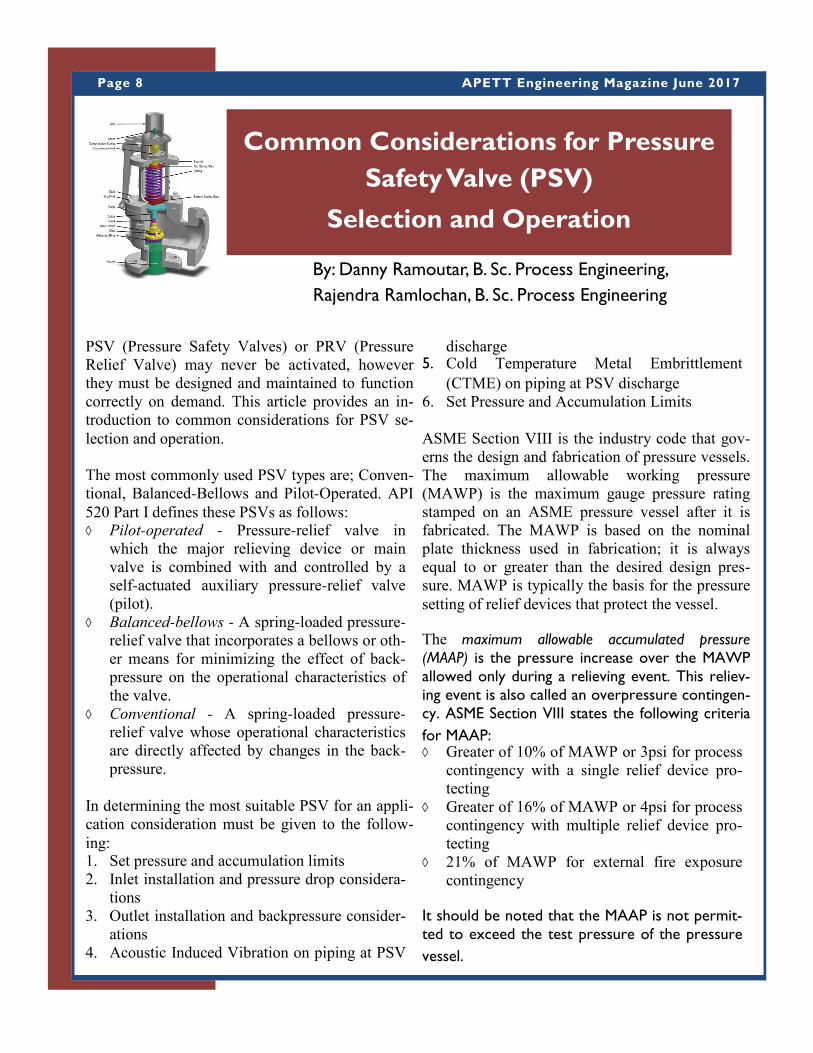
Common Considerations for Pressure
Safety Valve (PSV)
Selection and Operation
By: Danny Ramoutar, B. Sc. Process Engineering,
Rajendra Ramlochan, B. Sc. Process Engineering
PSV (Pressure Safety Valves) or PRV (Pressure Relief Valve) may never be activated, however they must be designed and maintained to function correctly on demand. This article provides an in-troduction to common considerations for PSV se-
lection and operation.
The most commonly used PSV types are; Conven-tional, Balanced-Bellows and Pilot-Operated. API
520 Part I defines these PSVs as follows: ◊ Pilot-operated - Pressure-relief valve in
which the major relieving device or main valve is combined with and controlled by a self-actuated auxiliary pressure-relief valve (pilot).
◊ Balanced-bellows - A spring-loaded pressure-
relief valve that incorporates a bellows or oth-er means for minimizing the effect of back-pressure on the operational characteristics of the valve.
◊ Conventional - A spring-loaded pressure-
relief valve whose operational characteristics are directly affected by changes in the back-pressure.
In determining the most suitable PSV for an appli-cation consideration must be given to the follow-
ing: 1. Set pressure and accumulation limits 2. Inlet installation and pressure drop considera-
tions 3. Outlet installation and backpressure consider-
ations 4. Acoustic Induced Vibration on piping at PSV
discharge
5. Cold Temperature Metal Embrittlement
(CTME) on piping at PSV discharge 6. Set Pressure and Accumulation Limits
ASME Section VIII is the industry code that gov-erns the design and fabrication of pressure vessels. The maximum allowable working pressure (MAWP) is the maximum gauge pressure rating stamped on an ASME pressure vessel after it is fabricated. The MAWP is based on the nominal plate thickness used in fabrication; it is always equal to or greater than the desired design pres-sure. MAWP is typically the basis for the pressure
setting of relief devices that protect the vessel.
The maximum allowable accumulated pressure (MAAP) is the pressure increase over the MAWP allowed only during a relieving event. This reliev-ing event is also called an overpressure contingen-cy. ASME Section VIII states the following criteria
for MAAP: ◊ Greater of 10% of MAWP or 3psi for process
contingency with a single relief device pro-tecting
◊ Greater of 16% of MAWP or 4psi for process contingency with multiple relief device pro-tecting
◊ 21% of MAWP for external fire exposure contingency
It should be noted that the MAAP is not permit-ted to exceed the test pressure of the pressure
vessel.
Page 9
1. Set Pressure is the pressure at which the pres-sure-relief device is set to open under service conditions. Overpressure is the pressure in-crease over the set pressure of the relieving device. Overpressure is the same as accumu-lated pressure (accumulation) only when the relieving device is set to open at the MAWP of the vessel.
2. Inlet Installation and Pressure Drop Con-
siderations
When designing inlet piping to a relief valve, the following should be considered: ◊ Inlet line pressure drop or non-recoverable
losses should be limited to 3% of the set pres-sure for all overpressure contingencies. High inlet pressure drop may result in (i) chattering of the PSV leading to premature failure (ii) reduced relieving capacity leading to higher accumulated pressure. If inlet line losses are greater than 3% , consideration should given to remote sensing pilot operated relief valves. API 520 Part II Section 4 provides more de-tails.
◊ PSV should be mounted vertically. Gravity acts on (i) the disc and seat while closing, al-lowing potential issues with re-seating and (ii) the stem causing extra drag and wear.
◊ Gate valves must be configured such that the stem is in the horizontal position or upside down to prevent the possibility of the gate becoming detached and blocking the relief path.
◊ If two or more relief devices are on the same line, the common inlet piping internal cross sectional area must be equal to or greater than the combined inlet area of the individual relief devices.
◊ Proper support piping for stresses. ◊ Piping should be free-draining to vessel. ◊ Isolation valves should be full port and locked
or carsealed open. ◊ All pipe and fittings should have a cross-
sectional area equal to or greater than that of the relief device inlet.
3. Outlet Installation and Backpressure Con-
siderations
Superimposed backpressure is the pressure at the
outlet of the PSV before it opens i.e. pressure in the discharge system coming from other sources. Built-up backpressure is the increase in pressure at the PSV outlet that develops due to flow after the valve opens. Backpressure is the sum of the superimposed and built-up backpressures. High backpressure will tend to produce a closing force on the PSV disc (conventional and balanced-bellows) which may result in a reduction in lift (reduction in flow ca-pacity), variation in opening pressure and insta-bility.
API 520 Part 1 recommends the following: ◊ Conventional – Built up backpressure should
not exceed the allowable overpressure e.g. when the allowable overpressure is 10 %, the built-up backpressure should not exceed 10 % of the set pressure.
◊ Balanced-bellows – Total backpressure (superimposed plus built-up) does not exceed approximately 50 % of the set pressure. The PSV manufacturer should be consulted for backpressure limitations (mechanical integrity of the bellows) and capacity correction factors (backpressure correction factors). API 520 Part I Section 5.3 provides additional details.
◊ Pilot-operated - the valve lift is not typically affected by backpressure.
The PSV discharge piping system should be de-signed so that the backpressure does not exceed an acceptable value for any pressure-relief device in the system. Additionally the PSV discharge piping design pressure and test pressure should cater for the maximum possible backpressure. When designing outlet piping from a relief valve, the following should also be considered: ◊ Maximum fluid velocity should be limited to
75% of sonic speed (General rule of thumb). Higher velocities can generate noise and high vibration resulting in failure of the piping. Re-fer to Section 4 below for further details.
◊ The rated (or actual) capacity of relief valve is used to size discharge lateral (piping) from valve to main relief header for all overpressure contingencies.

Page 10 APETT Engineering Magazine June 2017
Eng. Danny Ramoutar graduated from the University of the West Indies in 2009 with a B.Sc. in Chemical and Process Engineering. He started his professional career at Atlantic LNG in 2010 where he currently holds the position of Process Engineer II. At Atlantic, Danny has worked as a
Process Optimization Engineer where he supported major Train activities inclusive of shutdowns. He has also contributed to various Cost Management and Asset Integrity initiatives that have helped Atlantic in maintaining its safe and reliable opera-
tion.
◊ Proper support piping for stresses. ◊ Piping should be as short as possible. ◊ Piping should be free-draining such that there
is no pocketing or have a low drain point when discharging to the flare header.
◊ For PSVs relieving to atmosphere, the piping should be elevated approximately 3m (10ft) above any structure and weep holes must be present. API 521 Section 7.3.4 provides addi-tional details.
◊ Isolation valves should be full port and locked or carsealed open.
4. Acoustic Induced Vibration (AIV) on Pip-
ing at PSV discharge
Acoustic energy in high capacity gas pressure re-ducing systems can cause severe piping vibra-tions. Excess vibration may cause fatigue and premature failure of piping. The maximum rec-ommended sound power levels to prevent AIV may vary based on proprietary information from Design Firms or operating experience. Carucci and Muller(1982) published a paper ”Acoustically induced piping vibration in high capacity pressure reducing systems” which recommends the sound power level design limit based on piping diame-ter.
Piping designers should be consulted and a more detailed analysis be performed to determine what, if anything, should be done to mitigate high vi-bration concern.
The internal sound power level (PWL) generated by the Pressure Reducing Device (PRD) is calcu-lated as:
Where: W = mass flow rate through the PRD (kg/s) ∆P = pressure drop across the PRD (bar) P1 = PRD upstream pressure (Bara) T = Upstream temperature (K) MW = molecular weight SFF = Sonic Flow Factor. If sonic conditions ex-ist then SFF = 6; otherwise SFF = 0
Note: Credit may be taken for attenuation of acoustically induced vibration due to pipe length
downstream of the valve.
For further information on AIV refer the Energy Institute 2008 publication “Guidelines for the avoid-ance of vibration induced fatigue failure in process
pipework”.
5. Cold Temperature Metal Embrittlement
(CTME) on piping at PSV discharge
Auto-refrigeration (or the J-T effect) of relieving fluids during a relief scenario can potentially cool the outlet of the PSV and its discharge piping to the point where brittle fracture can occur. PSV discharge piping material selection must consider the relief scenario which results in the lowest PSV discharge temperature. Dynamic simulation software can be used to predict the lowest pipe wall temperature in relation to the fluid tempera-ture for the duration of the relief scenario. How-ever in the absence of an elaborate simulation model a quick simulation check can be done by flashing the fluid across a valve, from the up-stream relieving condition to the flare header su-perimposed pressure (or worst case atmospheric pressure). The assumption for this check is that the pipe wall temperature and fluid temperature
are in equilibrium.
Eng. Rajendra Ramlochan is a Senior Process Engineer for Atlantic LNG. He holds a B.Sc. in Chemical and Process Engineering from the Uni-versity of the West Indies. At Atlantic, Rajendra spent most of his time in the Process Engineering Department, where, in addition to daily plant
optimization and troubleshooting, he guides and advises others in technical/operational aspects of overpressure protection and pressure relief sys-tems. He has also contributed the development of a Maintenance Philosophy for ensuring pressure relief devices are adequately maintained while
minimizing the impact to plant availability.

Page 11 APETT Engineering Magazine June 2017

Figure 2: Simultaneous Wrapping and Asphalt Coating
Page 12 APETT Engineering Magazine June 2017
Subsea Pipelines For Crude Oil Production Activities: A Typical On-Shore
Fabrication Process
By Randell Mahabir, Eng. B. Sc.
1.0 Overview
As oil production and refining companies seek to increase output, fabrication of sub-marine pipe-lines becomes essential. The integrity of these pipelines are threatened by failure modes such as vortex shedding, wear, corrosion and abrasion (Castanier & Rausand, 2006).This article outlines a conventional fabrication process used by a local engineering services company for sea-bed laid and platform elevated lines (Risers). These lines are subsequently launched for offshore installa-tion via a pipe-laying barge.
2.0 Preparation Process
2.1 Surface Preparation
The pipelines are usually made of carbon steel material with internal diameters ranging from 2” to 36”, wall thicknesses are of Schedules 40 and 80 and they come in 40 foot lengths. Oil, grease and deleterious materials are removed from their surfaces before shot blasting to SPCC-SP 10 re-quirements to eliminate mill slag and other sur-face impurities, as well as to advance coating ad-hesion (Friske & Page, 1979).
The shot-blasting machine is loaded with the abrasive blast media (grit sand) which is expelled at a high velocity unto the rotating pipe`s surface beneath (Figure 1). A blast profile can be obtained using a surface profile gauge to determine if the anchor pattern is suitable for coating to begin.
2.2 Asphalt and Concrete Coating
The blast-cleaned pipes are coated with a primer (asphalt thinned with gasoline) to a thickness of 2-
3 mils and allowed to dry before asphalt coating. Pipelines with internal diameters of 2 to 8 inches are coated in alternating layers of fusion bonded epoxy or polyethylene wrap and asphalt, where the final thickness of the coating layer is at least 5/32 inches (154 -156 mils) throughout. The as-phalt is heated to 240 oC (465 degrees Fahrenheit) and applied together with the wrap unto the rotat-ing pipe (Figure 2), ensuring that the wrap has the appropriate tension and is spirally applied with a minimum lap of 0.5 inches.
Holiday Detection Testing is performed on the finished pipes to locate any coating discontinuities or breaks and its procedure is guided by the ASTM D-478, ASTM D-5162 and NACE RPO 188-88 Standards.
Figure 1: Shot-Blasting Of Pipeline
Page 13
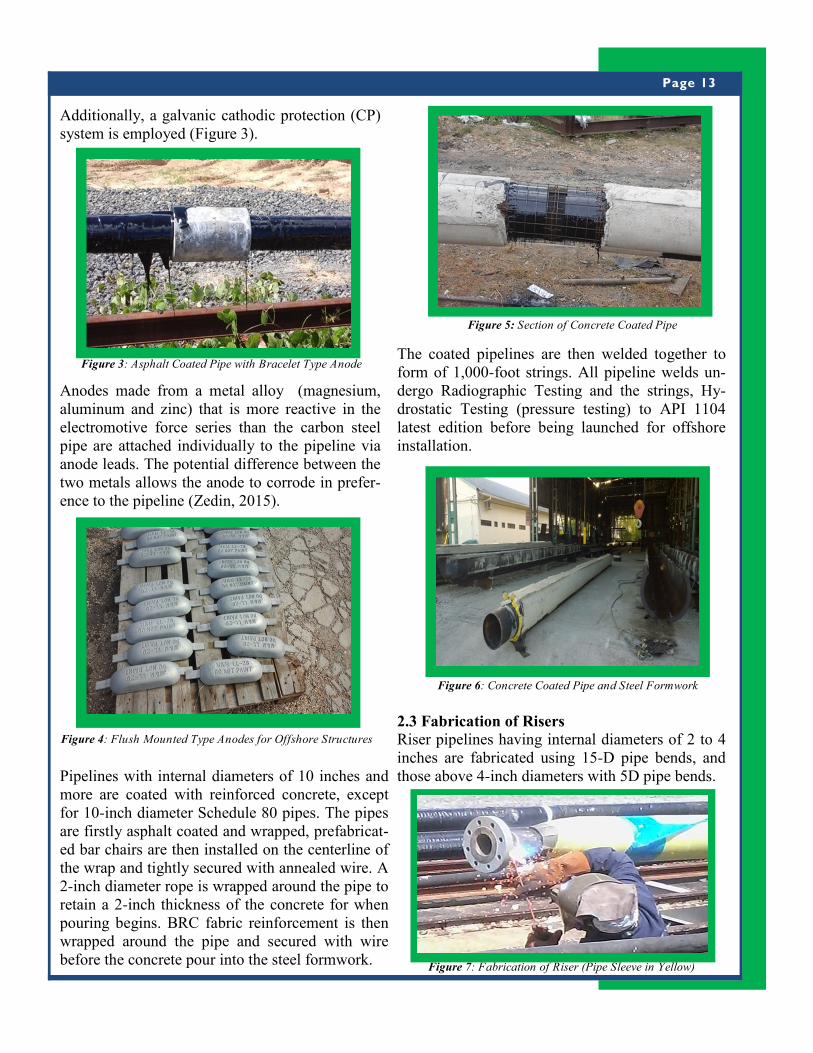
Additionally, a galvanic cathodic protection (CP) system is employed (Figure 3).
Anodes made from a metal alloy (magnesium, aluminum and zinc) that is more reactive in the electromotive force series than the carbon steel pipe are attached individually to the pipeline via anode leads. The potential difference between the two metals allows the anode to corrode in prefer-ence to the pipeline (Zedin, 2015).
Pipelines with internal diameters of 10 inches and more are coated with reinforced concrete, except for 10-inch diameter Schedule 80 pipes. The pipes are firstly asphalt coated and wrapped, prefabricat-ed bar chairs are then installed on the centerline of the wrap and tightly secured with annealed wire. A 2-inch diameter rope is wrapped around the pipe to retain a 2-inch thickness of the concrete for when pouring begins. BRC fabric reinforcement is then wrapped around the pipe and secured with wire before the concrete pour into the steel formwork.
The coated pipelines are then welded together to form of 1,000-foot strings. All pipeline welds un-dergo Radiographic Testing and the strings, Hy-drostatic Testing (pressure testing) to API 1104 latest edition before being launched for offshore installation.
2.3 Fabrication of Risers
Riser pipelines having internal diameters of 2 to 4 inches are fabricated using 15-D pipe bends, and those above 4-inch diameters with 5D pipe bends.
Figure 4: Flush Mounted Type Anodes for Offshore Structures
Figure 3: Asphalt Coated Pipe with Bracelet Type Anode
Figure 5: Section of Concrete Coated Pipe
Figure 6: Concrete Coated Pipe and Steel Formwork
Figure 7: Fabrication of Riser (Pipe Sleeve in Yellow)

Page 14
Figure 10: Railway Carriage for Pipe Launching
To increase robustness, the Riser pipeline is housed in a Riser Jacket which is made from a larger diameter pipe, the hollow space between the pipeline and the jacket is grouted with cement or an appropriate material (Figure 8).
Risers are inspected by radiographic inspection and pressure tested to the same pressure as the cor-responding sea-bed lines for 4 hours according to API 1110 latest edition, before it is grouted in place and before it is jacketed. The Riser Jacket is wrapped in a sleeve (NRI Epoxy or Armor Plate Wrap) from the Riser flange neck to 6 feet below the lowest water tide line.
2.4 Pipeline Launching
The completed lines are placed on railway carriag-es (Figure 10) and with the aid of a side-boom tractor; they are launched into the sea where an
awaiting pirogue tows the line to an offshore
mooring to be collected by a pipe-laying barge.
Barrels are attached to heavier pipeline strings to
advance buoyancy.
Figure 8: Temporary Opening on Riser Jacket for Grouting
Figure 9: Typical Riser Elevation and Cross-Sectional Area
Figure 11: Pipeline Being Launched Into the Sea
Eng. Randell
Mahabir holds a B.Sc. (Hons.) Mechanical Engineering (2013) and is currently pursuing an M.Sc.in Production Engineering & Management at the University of the West Indies. His professional
experience ranges from serving as a maintenance technician on several plant turnaround/shutdown projects, tutoring at the U.W.I Department of Mechanical Engineering to currently working as part of the Project Management Support Office at Damus Limited as a Project Engineer. He is an Associate Member of APETT and his research interests include industrial maintenance management and manufacturing
engineering.

Page 15 APETT Engineering Magazine June 2017
Thoughts on Root Cause and Corrective
Action
By Michael Merritt Eng. B. Sc. M.Eng. MBA MAPET BOETT
Failure whether due to incidents (equipment failure, an accident or failure event) contributes significantly to the cost of an organiza-tion. The cost is not due only to the equipment and manpower costs, potential damage to ancillary systems, downtime but also to the financial losses due to lost sales, inability to provide services and insurance claims.
We need to investigate incidents not only to correct the immediate cause but to correct the not obvious underlying cause to prevent a reoccurrence of the failure.
Stephen R. Covey the late American author postulated a Time Management Matrix where he recommends that we do the im-portant things first; Quadrant I issues, which are Urgent & Im-portant and Quadrant II issues, which are Not Urgent but Im-portant.
Unfortunately, for most companies finding the root cause of an issue tends to fall in neither quadrant and issues are merely ‘resolved’ to get things up and running. Operational issues tend to dominate. Lack of resources and proper analysis often result in the reoccurrence of the issue.
Continuous improvement can only be achieved if the cause(s) of the problems is corrected, and risk re-duced only if potential problems are anticipated and managed. James J. Rooney et al (2004) identified four (4) types of root causes.
Definition of Root Causes 1. Root causes are specific underlying causes. 2. Root causes are those that can reasonably be identified. 3. Root causes are those management has control to fix. 4. Root causes are those for which effective recommendations for preventing recurrences can be gener-
ated. Understanding why an event occurred is the key to developing effective recommendations.
Analysis requires an accurate description of what happened and how it happened. If the analysis stops at that point, it is likely that there is insufficient information to understand the reasons for the issue and what to do to prevent it from reoccurring.
We need to understand ‘What’ happened, ‘How’ it happened and ‘Why’ it happened.
Figure 1 Macondo-1 well blowout on the Deep-
water Horizon rig - Wikimedia (“This work is
licensed under the Creative Commons [CC BY
4.0] License. To view a copy of the license, visit
http://creativecommons.org/licenses/by/4.0/
Page 16
If not it could result in recommendations such as ‘retraining necessary’ or ‘operator need to be alert’ or ‘services should be terminated’. Recommendations which do little to prevent future occurrences.
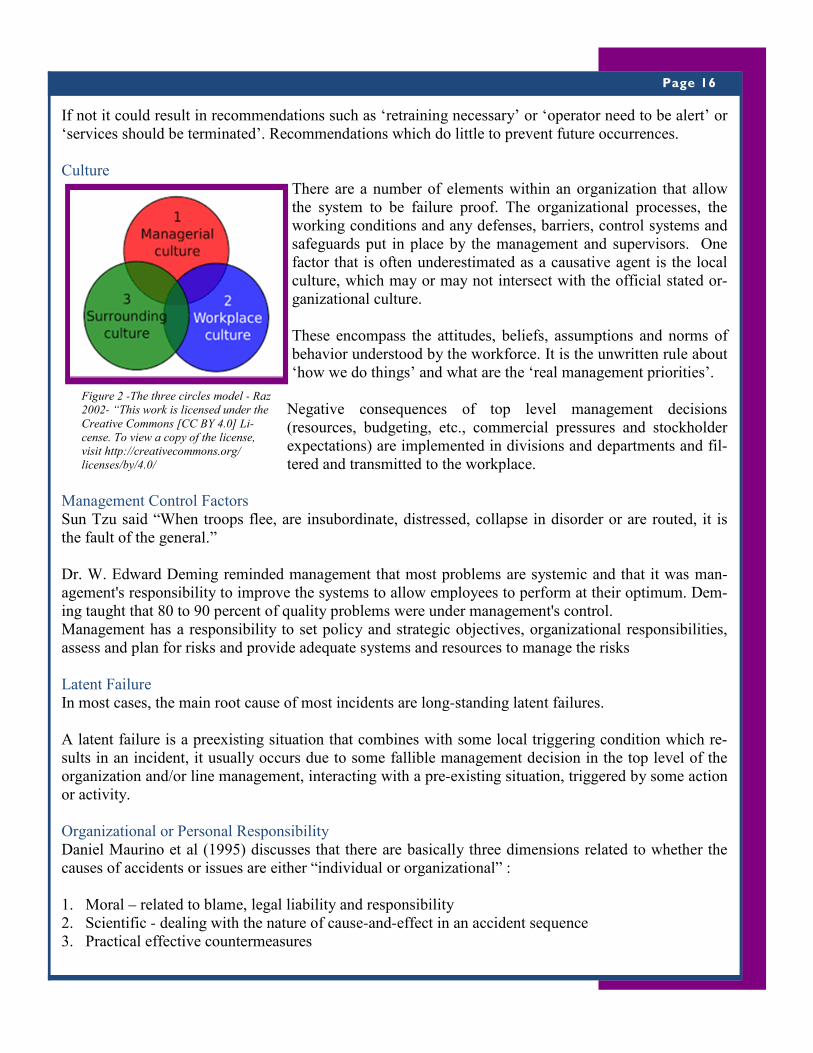
Culture
There are a number of elements within an organization that allow the system to be failure proof. The organizational processes, the working conditions and any defenses, barriers, control systems and safeguards put in place by the management and supervisors. One factor that is often underestimated as a causative agent is the local culture, which may or may not intersect with the official stated or-ganizational culture.
These encompass the attitudes, beliefs, assumptions and norms of behavior understood by the workforce. It is the unwritten rule about ‘how we do things’ and what are the ‘real management priorities’.
Negative consequences of top level management decisions (resources, budgeting, etc., commercial pressures and stockholder expectations) are implemented in divisions and departments and fil-tered and transmitted to the workplace.
Management Control Factors Sun Tzu said “When troops flee, are insubordinate, distressed, collapse in disorder or are routed, it is the fault of the general.”
Dr. W. Edward Deming reminded management that most problems are systemic and that it was man-agement's responsibility to improve the systems to allow employees to perform at their optimum. Dem-ing taught that 80 to 90 percent of quality problems were under management's control. Management has a responsibility to set policy and strategic objectives, organizational responsibilities, assess and plan for risks and provide adequate systems and resources to manage the risks
Latent Failure
In most cases, the main root cause of most incidents are long-standing latent failures.
A latent failure is a preexisting situation that combines with some local triggering condition which re-sults in an incident, it usually occurs due to some fallible management decision in the top level of the organization and/or line management, interacting with a pre-existing situation, triggered by some action or activity.
Organizational or Personal Responsibility
Daniel Maurino et al (1995) discusses that there are basically three dimensions related to whether the causes of accidents or issues are either “individual or organizational” :
1. Moral – related to blame, legal liability and responsibility
2. Scientific - dealing with the nature of cause-and-effect in an accident sequence
3. Practical effective countermeasures
Figure 2 -The three circles model - Raz
2002- “This work is licensed under the
Creative Commons [CC BY 4.0] Li-
cense. To view a copy of the license,
visit http://creativecommons.org/
licenses/by/4.0/
Page 17
Safety, Quality and Reliability are everyone’s responsibility, but from a moral or legal perspective, it is more ‘effective’ to put the legal responsibility on an individual for incident and accident causation. Finding the links between a prior management decision and an accident or issue requires deeper investi-gation and more time than most companies are willing to allocate.
It may be a holdover from the Taylor system of management, that businesses assume that individuals chose to do something other than the ‘sensible thing’. We automatically assume that if something bad occurred, that the intention of the person involved had to be bad.
In business, we tend to blame the lowest common denominator. When things get messed up, employ-ees screw up, sales lost or production is down, many organizations chose a path of least resistance with regard to processes that need to be addressed, corrective action and tend to blame the employee. Human nature prefers to have a person to blame rather than the system, to have a convenient scapegoat. No one is willing to accept that the ‘system’ is to blame, because usually it means that no further investigation
will be done.
It is important to note that human error, mistakes, omissions occur within the context of business poli-cies and procedures. The procedures and policies that are put in place either restrict or encourage the
events; performance could never be better than the system that constrains them.
Linking it together Everything has a prior cause and it is possible to spend much time and re-sources to go backwards to the very design of a process to identify the root cause, however there is a point at which further corrective action is
not practicable, where the costs outweigh the benefits.
There is need for an internal classification system to determine the level of investigation needed. The investigation should proceed to the point where causal factors can be identified, which if corrected would insulate and im-munize the system to further failures, and ultimately to the point where
the organization no longer has operational control.
The use of a structured scientific method is important, since prior knowledge of the preceding events tend to cloud our perception and ob-
jectivity. Simple things suddenly become ominous.
Recommendations should primarily focus on ways to correct the failed
barriers and strengthen the latent system weaknesses.
Figure 3 -The Hopf Link - Jim Belk
2010- “This work is licensed under
the Creative Commons [CC BY
4.0] License. To view a copy of the
license, visit http://
creativecommons.org/licenses/
by/4.0/
Michael Merritt is a Consultant - Downstream Technical Support and owner of Siparis Solu-tions. He is a Mechanical Engineer who holds an MBA in International Business, provides coaching and leadership support and is certified as a e-Tutor/Course facilitator for MGMT3038 - Cross National Management with The University Of The West Indies. Over Michael’s 26 years working experience, he has been qualified as an ASQ Certified Quality Engineer, STLE Certified Lubrication Specialist (CLS) and Oil Monitoring Analyst (OMA II); has administered technical support services, quality assurance and condition monitoring programs, and provided troubleshooting and maintenance/service value solutions. He is also an HSE professional, providing specialist advice and support on HSE implementation and
auditing, Risk Assessments and Tripod Incident Analysis.
Page 18 APETT Engineering Magazine June 2017

Page 19 APETT Engineering Magazine June 2017
Restricted Earth Fault Protection:
Safeguarding Your Power Transformer
By Anim Adrian Amarsingh, Carlos Francois, Rawle Arneaud, Wayne Ramkissoon
Figure 1: Transformer Substation Layout
Introduction
Power Transformers are critical to a safe and reliable supply of Electricity to both Industrial and Resi-dential consumers. Well protected and well maintained Power Transformers can last decades. Since there is significant capital expenditure during the assembly, testing and commissioning of Power Trans-formers, it is vital that Power Transformers have multiple levels of protection in the event of a Fault. The level of protection provided for transformers vary worldwide. In this article, we will examine the theory and operation of a specific type of Power Transformer protection. This protection scheme is known globally as Restricted Earth Fault protection. This paper will summarize the key points of Re-stricted Earth Fault Protection.
Dyn11 Transformer A common vector group used for distribution transformers is the Dyn11 winding configuration. The first letter “D” represents the configuration of the High Voltage winding on the transformer. Thus in Dyn11, “D” represents Delta. “y” represents the Low Voltage winding on the transformer which in this case is a wye connection or star connection. “n” represents a neutral point brought out to a dedicated terminal. 11 represents a phase shift of 30 degrees leading [1]. In our restricted Earth Fault Protection setup, we will be protecting a 6 MVA 33000V to 6600 V Dyn11 transformer.
Transformer Substation Layout Consider Figure 1 which shows a possible setup in a Transformer Substation. From the Low Voltage side of the Transformer we have Low Voltage Cables that are buried. These cables are connected to a switchgear from which Protec-tive Relays monitor the distribution of Power. In the event of an earthquake these cables may become damaged [2]. If there is insulation fail-ure and the bare conductors come into contact with the earth, an earth fault will occur. De-pending on the impedance, the earth fault cur-rent can be in excess of what the Transformer was designed to carry. This exceptionally high current can cause unrepairable damage to the transformer. Restricted Earth Fault Protection is intended to safeguard the transformer in the event of insulation fail-ure in this “restricted” zone. Therefore, Restricted Earth Fault Protection protects not only the Trans-former Load, but also the Transformer Low Voltage windings.

Page 20
Figure 2: Under Ideal Conditions cur-
rent will not flow in any of the CTs
Restricted Earth Fault- Current Transformer Arrangement There are different Current Transformer (CT) arrangements for Restricted Earth Fault Protection. A popular method is the Holmgreen connection which involves the residual connection of three phase CTs (at the back of the switchgear) to measure the earth fault current. Instead of the three phase CTs (at the back of the switch gear) a single Zero Sequence CT can be used. This Zero Sequence CT provides more
sensitive protection [3].
Restricted Earth Fault- Theory of Operation
The Restricted Earth Fault Protection is only intended to activate for an Earth Fault in a specified zone. This zone is inclusive of the Low Voltage Winding of the Transformer and the load cable to the Switch-gear. Other protective relays will be set to detect earth faults occurring outside of the zone. The Re-stricted Earth Fault Protection Setup consists of two CTs and a Differential Protective Relay. This Dif-ferential Protective Relay is usually identified by the device number 87 according to the American Na-tional Standards Institute [4]. The two CTs are connected to the differential protective relay. Under nor-mal conditions or for a fault outside of the zone, the secondary current from each CT is equal but oppo-site in polarity and the Differential Protective relay does not activate any lockout device. Under an Earth fault condition inside the zone, the CT polarity of the Zero Sequence CT is reversed and the secondary CT currents now sum therefore activating the Differential Protective Relay and the Lockout device. Figures 2, 3 and 4 consider the different scenarios and the actu-al connections of the Current Trans-former. Also, it is important that the CTs have the same CT ratio, as the secondary currents in each CT must match. If there is a CT mismatch
there will be nuisance trips.
Current Transformers, Grounding and Protection Set-
tings
Current Transformers The Current Transformers used, must meet certain specifica-tions. For instance the 600:1 Neutral CT used on the Trans-former end is classified as “Class X” according to British Standards. “Class X” Transformers are utilized in high cur-rent applications where saturation is not acceptable [5]. The “Class PX” specification has since superseded the “Class X”
specification [6].
Figure 3 showcases a Neutral CT installation.
Figure 3: Close up view of 600:1 Neutral
CT on the Transformer end
Page 21 APETT Engineering Magazine June 2017
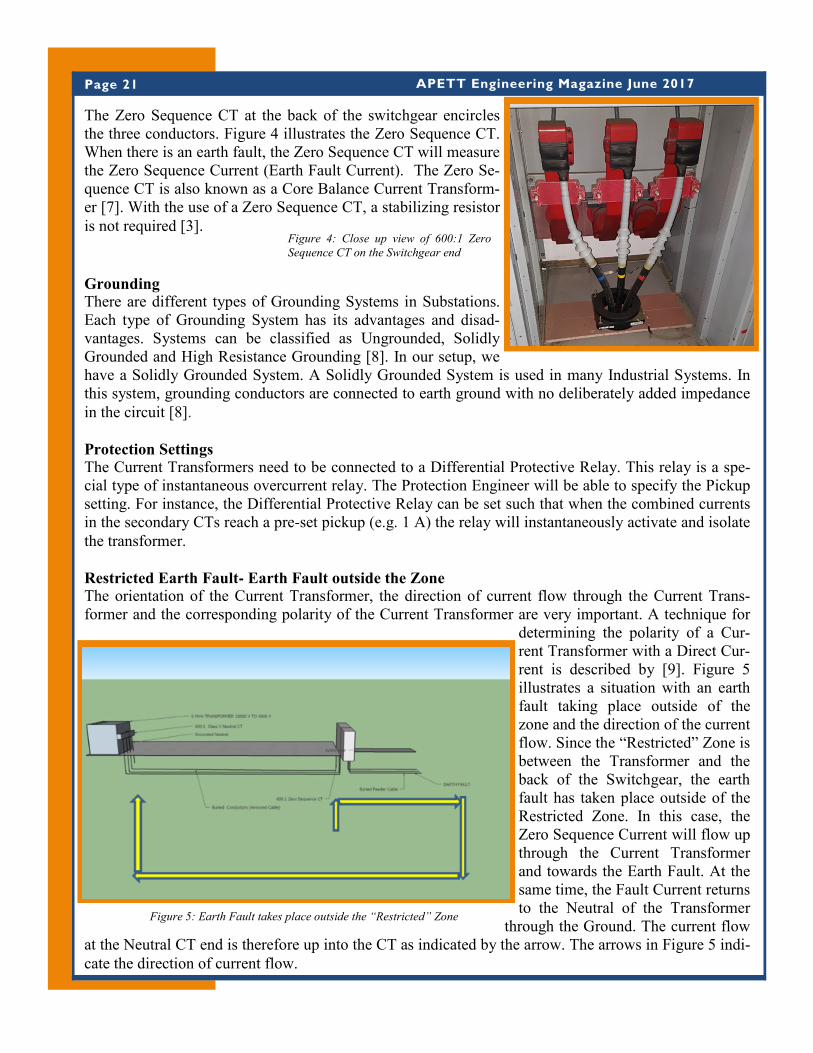
The Zero Sequence CT at the back of the switchgear encircles the three conductors. Figure 4 illustrates the Zero Sequence CT. When there is an earth fault, the Zero Sequence CT will measure the Zero Sequence Current (Earth Fault Current). The Zero Se-quence CT is also known as a Core Balance Current Transform-er [7]. With the use of a Zero Sequence CT, a stabilizing resistor
is not required [3].
Grounding
There are different types of Grounding Systems in Substations. Each type of Grounding System has its advantages and disad-vantages. Systems can be classified as Ungrounded, Solidly Grounded and High Resistance Grounding [8]. In our setup, we have a Solidly Grounded System. A Solidly Grounded System is used in many Industrial Systems. In this system, grounding conductors are connected to earth ground with no deliberately added impedance
in the circuit [8].
Protection Settings The Current Transformers need to be connected to a Differential Protective Relay. This relay is a spe-cial type of instantaneous overcurrent relay. The Protection Engineer will be able to specify the Pickup setting. For instance, the Differential Protective Relay can be set such that when the combined currents in the secondary CTs reach a pre-set pickup (e.g. 1 A) the relay will instantaneously activate and isolate
the transformer.
Restricted Earth Fault- Earth Fault outside the Zone The orientation of the Current Transformer, the direction of current flow through the Current Trans-former and the corresponding polarity of the Current Transformer are very important. A technique for
determining the polarity of a Cur-rent Transformer with a Direct Cur-rent is described by [9]. Figure 5 illustrates a situation with an earth fault taking place outside of the zone and the direction of the current flow. Since the “Restricted” Zone is between the Transformer and the back of the Switchgear, the earth fault has taken place outside of the Restricted Zone. In this case, the Zero Sequence Current will flow up through the Current Transformer and towards the Earth Fault. At the same time, the Fault Current returns to the Neutral of the Transformer
through the Ground. The current flow at the Neutral CT end is therefore up into the CT as indicated by the arrow. The arrows in Figure 5 indi-
cate the direction of current flow.
Figure 4: Close up view of 600:1 Zero
Sequence CT on the Switchgear end
Figure 5: Earth Fault takes place outside the “Restricted” Zone

Page 22
Since the Earth Fault takes place outside the zone, ideally, the Restricted Earth Fault Protection should not activate. An independent means of detecting this Earth Fault should isolate the Feeder in this situa-
tion.
Figure 6: Polarity connections for Current Transformers
(Under normal conditions-Earth Fault outside Restricted Zone)
Both CT’s should be connected as shown in Figure 6. Figure 6 shows the current flow during an Earth Fault outside the “Restricted” Zone. Figures 7 and 8 illustrate the waveforms on the secondary of each CT. The waveforms from each Current Transformer will be opposite in polarity and will cancel one an-
other. As a result, the 87 relay will not pickup.
Figure 7: Secondary
Output from Neutral
CT
Figure 8: Secondary
Output from Zero
Sequence CT
Figure 9: Com-
bined Output from
both CTs

Page 23 APETT Engineering Magazine June 2017
Figure 10: Earth Fault takes place inside the “Restricted” Zone
Figure 11: Polarity connections for Current Transformers
(Under abnormal conditions-Earth Fault inside Restricted Zone)
Restricted Earth Fault- Earth Fault in-
side the Zone For an Earth Fault inside the “Restricted” Zone the direction of the current flow in the Zero Sequence changes. In this situation the polarity of the Zero Sequence CT is re-versed. At the same time the current returns to the Neutral via the Earth. Thus the direc-tion of current flow in the Neutral remains the same and the polarity of this CT remains the same. Figure 10 illustrates this situation. The arrows in Figure 10, illustrate the flow
of current in this situation.
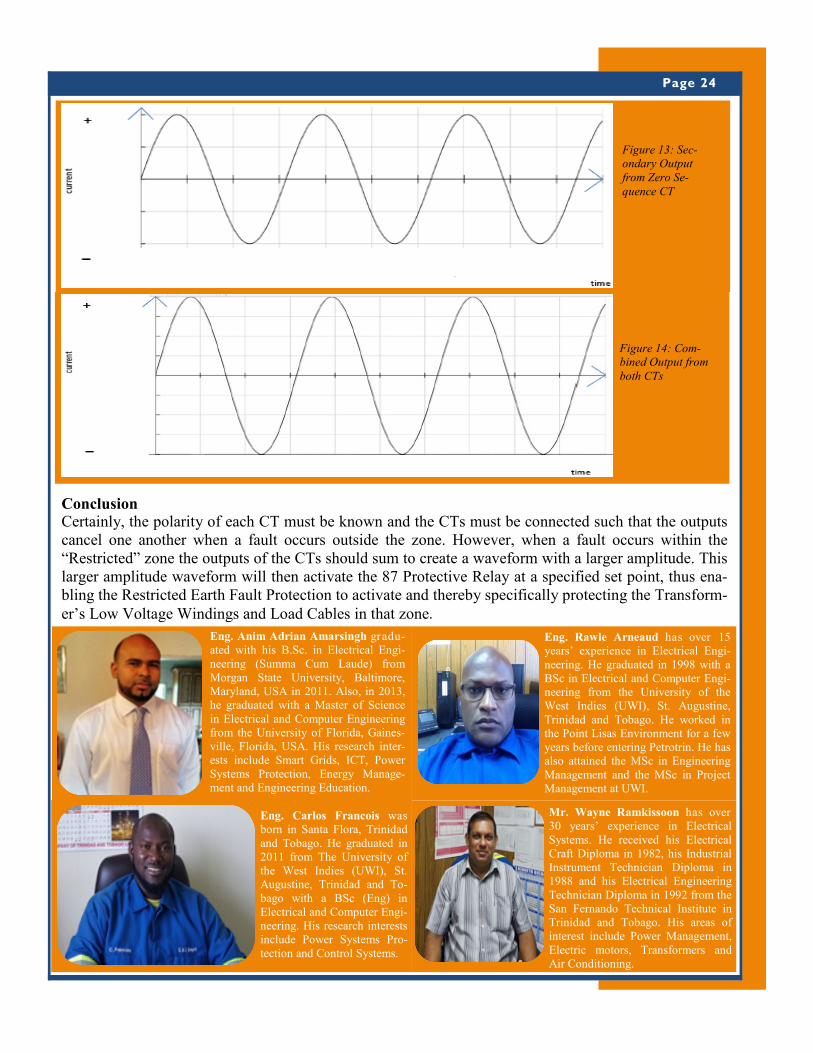
The CT connections remain unchanged with Terminal 1 of the Neutral CT connected to Terminal 2 of the Zero Sequence CT and Terminal 2 of the Neutral CT connected to Terminal 1 of the Zero Sequence CT. However, since the current flow in the Zero Sequence CT is now in the opposite direction the po-larity of this CT has now been reversed. The direction of current flow in the Neutral CT remains con-sistent. Figures 12 and 13 illustrate the waveforms on the secondary of each CT. Figure 14 represents the combined input in the 87 relay. The waveforms from each Current Transformer will have the same
polarity and will sum. If the sum meets or exceeds the pickup setting the 87 relay will activate.
Figure 12: Second-
ary Output from
Neutral CT
Page 24
Conclusion
Certainly, the polarity of each CT must be known and the CTs must be connected such that the outputs cancel one another when a fault occurs outside the zone. However, when a fault occurs within the “Restricted” zone the outputs of the CTs should sum to create a waveform with a larger amplitude. This larger amplitude waveform will then activate the 87 Protective Relay at a specified set point, thus ena-bling the Restricted Earth Fault Protection to activate and thereby specifically protecting the Transform-
er’s Low Voltage Windings and Load Cables in that zone.
Eng. Carlos Francois was born in Santa Flora, Trinidad and Tobago. He graduated in 2011 from The University of the West Indies (UWI), St. Augustine, Trinidad and To-bago with a BSc (Eng) in Electrical and Computer Engi-neering. His research interests include Power Systems Pro-tection and Control Systems.
Eng. Rawle Arneaud has over 15 years’ experience in Electrical Engi-neering. He graduated in 1998 with a BSc in Electrical and Computer Engi-neering from the University of the West Indies (UWI), St. Augustine, Trinidad and Tobago. He worked in the Point Lisas Environment for a few years before entering Petrotrin. He has also attained the MSc in Engineering Management and the MSc in Project Management at UWI.
Mr. Wayne Ramkissoon has over 30 years’ experience in Electrical Systems. He received his Electrical Craft Diploma in 1982, his Industrial Instrument Technician Diploma in 1988 and his Electrical Engineering Technician Diploma in 1992 from the San Fernando Technical Institute in Trinidad and Tobago. His areas of interest include Power Management, Electric motors, Transformers and Air Conditioning.
Figure 13: Sec-
ondary Output
from Zero Se-
quence CT
Figure 14: Com-
bined Output from
both CTs
Eng. Anim Adrian Amarsingh gradu-ated with his B.Sc. in Electrical Engi-neering (Summa Cum Laude) from Morgan State University, Baltimore, Maryland, USA in 2011. Also, in 2013, he graduated with a Master of Science in Electrical and Computer Engineering from the University of Florida, Gaines-ville, Florida, USA. His research inter-ests include Smart Grids, ICT, Power Systems Protection, Energy Manage-ment and Engineering Education.

Page 25 APETT Engineering Magazine June 2017

Page 26 APETT Engineering Magazine June 2017
Can the Boom of the Crane Touch the
Structure in Front of It?
Practical Ideas for the Design Professional
By Oscar Morillo, Structural and Lifting Engineer, MSc., PE
This value can change ac-
cording to the types of tires.
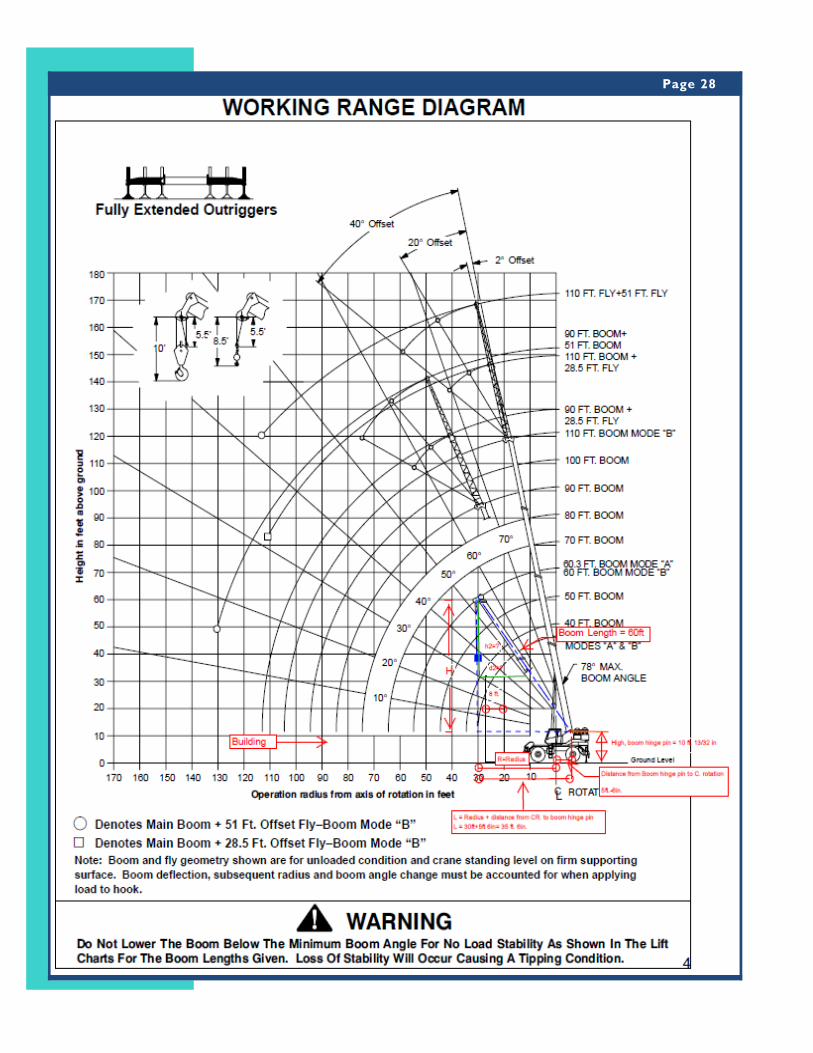
Sometimes we want to lift objects above structures and we do not know if the boom of the crane will touch or be close to it. Here is a simple and practical Trigonometric method that allows us to resolve this doubt:
LET’S USE THE CRANE RT 50 TON AS AN EXAMPLE:
In this analysis we are assuming all the other lifting parameters were checked and they are in line with the safety codes
Step 1. Height from the boom
hinge pin to the main boom head
(Vertical distance=H)
Using Pythagorean Theorem
Step 2. Find the height from “Top of Building to the Main boom head ” .
⇒ Total height from ground level to Main boom head = H + height boom hinge pin
= 48.37 ft. + 10.0339 ft. = 58.4039 ft.
⇒ h2 = Distance between “Top of Building to the Main boom head” = Total high from ground level to
Main boom head-high of building = 58.4039 ft – 32 ft. = 26.4039 ft.
h2 = 26.4039 ft.

Page 27
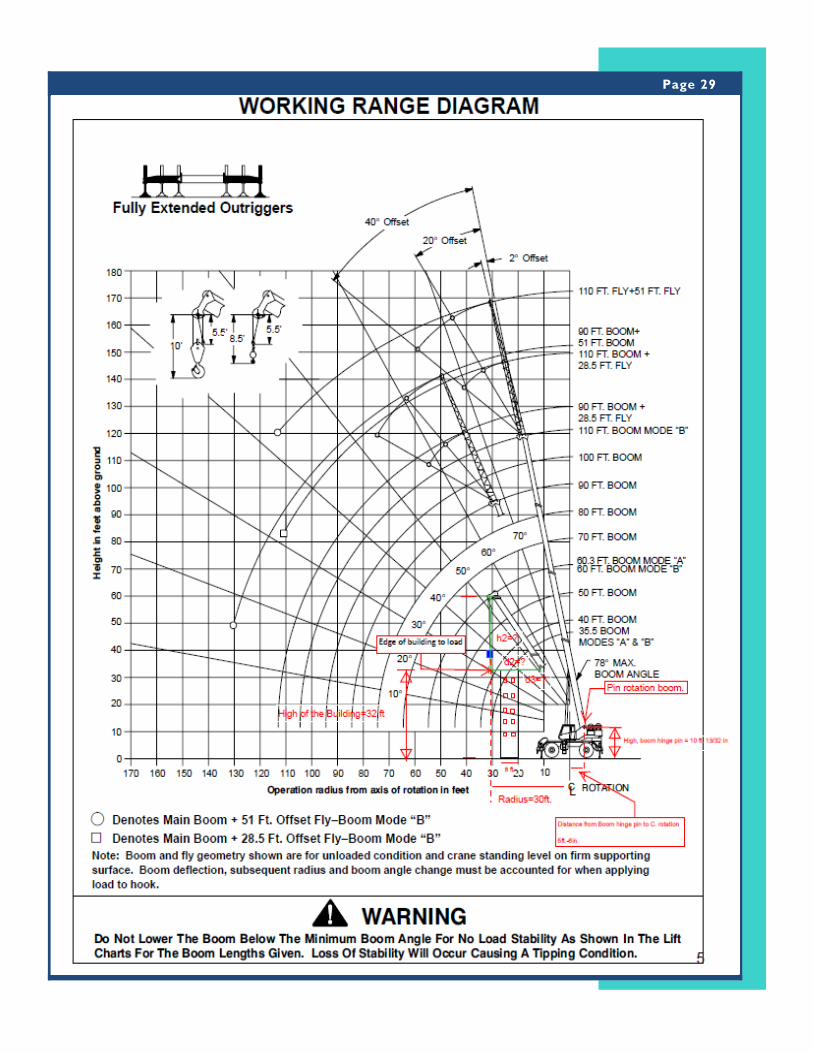
Step 3. Distance from cg load to Center line of boom
Relationship between Green and Blue triangle:
(H/h2) = (L/d2) >>>>> (48.37 ft./ 26.4039)=(35.5ft./d)
d2= (35.5*26.4039/48.37)ft = 19.38 ft. >>>> d2=19.38 ft.
Step 4. Distance between building and Center line of the boom.
Distance from Building to Boom crane <Center line> =
D3 - (Distance between edge of building to load)-length of building = 19.38 ft.-2ft. - 8ft. = 9.38 ft
(In other words, the centerline of the boom is far away at 9.38ft, from the building.
For safety reasons, the width of the boom (~3.5ft) must be deducted in order to know how far away is the boom from the obstruction, 9.38 ft -3.5 ft =5.88 ft. ), The boom will not touch the building.
Eng. Oscar Morillo is a Spe-cialist in Safety Health,
and Fire & Structur-al Engineer, Lecturer, Facilita-tor and Lifting Engineer (OPITO Level III and NSL Technical Support Level III). He has 30 years of experience in the national and transnation-al oil industry onshore/offshore related with design, engineer-ing, planning, construction, maintenance and HSE.
Also if you want to know the distance from the top of the building to the Center line of the boom crane, you just have to do another triangles rela-tionship:
Relationship between new triangle and Blue trian-gle: H/h3 = L/9.38 >>>>> 48.37 ft/h3 = 35.5 ft/9.38 ft H3 = 48.37 ft*9.38 ft/35.5 ft = 12.78 ft
(In another words, the centerline of the boom is far
away at 12.78ft from the top of the building.
For safety reasons the width of the boom (~3.5ft),
must be deducted in order to know how far away
the boom is from the obstruction 12.7ft-3.5ft= 9.2
ft.). The boom will not touch the building.
Conclusion:
Is important to know: ◊ 90% of crane accidents occur due to human
error. ◊ 45% of all mobile crane accidents involve elec-
trocution that results from the crane contact-
ing a power source during operation
TECHNICAL EXAMPLE
Installation of tank on the other side of the pipe
rack
♦ The distance between the crane boom and the
“pipe rack”
♦ The distance between the crane boom and the
lifting bar Refer to pages 30 to 32 for details
Page 28
Page 29

Page 30

Page 31

Page 32
Page 33 APETT Engineering Magazine June 2017
Key Issues in the Future Development of
our Transportation System
By Dr. Trevor Townsend, B.Sc. M.Sc. Ph.D.
Introduction
Objective
The purpose of this paper is to identify the key is-sues affecting development of the Transportation System in Trinidad & Tobago. It will also high-light some of the Policy items which need to be addressed going forward. Firstly I’ll give a brief overview of the current state of the transportation system.
Highway System Trinidad has a relatively well-developed Highway and Main Road System linking major urban areas in the northern regions from Diego Martin in the west to Sangre Grande in the East. Similarly there are good road linkages in the Southern region from San Fernando to Mayaro. Major north- south link-ages exist along the west coast from St Joseph to San Fernando. The ongoing extension of the Solo-mon Hochoy Highway from Debe to Point Fortin will further enhance this linkage. Tobago is served by the Claude Noel highway, Windward & Rox-borough Palatuvier Rds. The country has a high per capita vehicle ownership of 500 veh./1000 peo-ple.
Public Transportation System. The State Owned bus company, PTSC, operates 200 buses per day carries 11Mn. pass/year with a $300Mn. annual subsidy. A key infrastructure is the Priority Bus Route (PBR) from Arima to Port of Spain. The luxury Water –taxi from San Fernan-do to Port of Spain carries 0.5Mn. pass. /year with an annual subsidy of $50Mn. The bulk of the pub-lic transportation (95%) is supplied by 13,000 pri-vately –owned 4-7 passenger sedans and 5,000 pri-vately-owned 9-25 seater para-transit (maxi-taxi)
vehicles. These operations receive no special sub-sidy, have assets of over $4.5Bn, carry 275Mn. passengers/year and provide some 25,000 jobs. Additionally an unknown number of illegal “PH” taxis operate on rural routes and unsociable hours but also affect the livelihood of legitimate taxis. Both Bus and taxi services operate without pub-lished schedules and rates and there is no overall planning, administration or co-ordination of the sector.
Key Policy Issues
There is ample evidence that the road transporta-tion system is currently in crisis. During peak peri-ods both highways and urban arterials are congest-ed; car ownership levels are high and car occupan-cy levels are low; public transportation systems are under-managed, disorganized and not user friend-ly, parking in major urban areas is inadequate and uncontrolled and pedestrians and persons with dis-abilities are frequently left to fend for themselves. In times of crisis, the first response should be a plan. Plans should be based on data and analysis. The Key policy issues which should inform these plans are (a) Mobility of People not Movement of Vehicles (b ) Institutional Strengthening, (c) Sus-tainable Transportation Development (d) Increased Role for The Private Sector and (e) Sustainable Funding for Services.
Mobility of People Not Movement of Vehicles
We cannot Build Enough Highways to Solve Traf-fic Congestion Problems. If mobility of people is the focus then what is required are policies which encourage high occupancy vehicle usage. This would include incentives for company or agency vanpools, HOV lanes or streets.

Page 34
The use of the PBR to move cars in emergencies is counter-productive. We need to recognize the need to move people put of the danger area and not focus on moving the cars. Cars can’t die – people can.
Institutional Strengthening. We need to collect and analyse data and make de-cisions on a continuous basis regarding (a) Trans-portation demand management - Immediate & Short-term decision making, including traffic man-agement. The current arrangement where the Traf-fic management Branch is a branch of the High-ways Division is an anachronistic throwback to the 1970’s. (b)Transportation Planning - Medium and long-term decision making regarding the entire transport sector & intersecting with land use plan-ning. No agency is currently organized and staffed to carry out this function; (c) Transit planning and regulation: Coordination and oversight of the en-tire public transportation sector. This is a major sector of the economy yet there is no agency orga-nized and staffed to carry out this function. The following needs to be done: - (a) The establish-ment of a Transportation and Traffic Planning unit, reporting directly to the Permanent Secretary of the Ministry responsible for Transport planning and administration. (b) The establishment of a Transit Authority with responsibility for the planning, ad-ministration and management of the public trans-portation sector.
Sustainable Transport Development.
Sustainable Development is development that meets the needs of the present without compromis-ing the ability of future generations to meet their own needs.(1) Sustainable transport development is based on six pillars. These are (a) Integrated Land/Use Transportation Planning (b) Develop Clean, Safe, Efficient, Affordable Public Transportation Options (c) Ensure Access to Affordable Rural Transport Services (d) Address the mobility needs of special groups e.g. elderly and disabled (e) Fa-cilitate walking & non-motorized transport in ur-ban centers (f) Reduce Air Pollution & Carbon Emissions. These are elaborated further below:-
♦ Integrated Land Use/Transportation Planning
There has been no approved National Physical De-velopment Plan since 1984 or National Transporta-tion Policy since 1967. Comprehensive urban transportation planning is inexorably linked to land use. We see the effects of poor or non-existent land use/transportation planning around us on a daily basis in the form of (a) Unnecessary Travel, (b) Congestion, (c) Unregulated Development and (e) Unregulated para-transit operations, (d) wasteful subsidies that encourage in-efficiency. The govern-ment needs to develop and approve an integrated land use/transportation plan based on over-arching development policies to guide decisions over the next 10 – 20 years.
♦ Develop Clean, Safe, Efficient, Affordable Public Transportation Options
Postponement of rapid rail should not mean delay in the implementation of a mass transit system. A mass transit system is one that (a) Is available to all paying passengers, (b) Carries multiple passen-gers with different origins, destinations and pur-poses and (c) Coordinates services creating relia-bility and predictability in the system of opera-tions. Mass Transit Systems include (a) Commuter Trains, (b) Rapid rail, (c) Light rail, (d) Trams, (e) Bus Rapid Transit and (f) Guided Buses. Each technology has its own characteristics, costs and operating efficiencies. The only way to determine the most optimal Mass Transit system is by doing the necessary transportation planning study. This study will include travel demand analysis, an analysis of the capital and recurrent costs of build-ing and operating the system and a quantification of major user and non-user benefits and costs. The figure below gives an example of the comparative costs of various mass transit options.

Page 35 APETT Engineering Magazine June 2017
Ensure Access to Affordable Rural Transport Ser-vices. PTSC has put 99 buses on 66 new rural routes over the last six years. While this may appear to imply a wide coverage, the service is too limited to be real-ly effective and would not inspire confidence for any commute who has a choice of mode. With the establishment of a Transit Authority here will be an agency whose remit would be to determine and ensure delivery of minimum standards of transpor-tation services to all communities.
Address the mobility needs of special groups e.g. elderly and disabled. A Universal Design Approach to Meeting The Needs of People With Disabilities…will benefit many people without Disabilities.(2) We need to establish Minimum Standards for provision of ser-vices and facilities for persons with disabilities moving away from the “welfare model” to the con-cept of universal design.
Facilitate walking & non-motorized transport in urban centers. There has been no planning or infrastructure devel-opment in this area. The streets of major urban centers are not pedestrian friendly. Bicycles, scoot-ers and motorcycles are underrepresented as a transport mode. Specific objectives must be set in these areas and the necessary regulations & infra-structure put in place.
Reduce Air Pollution & Carbon Emissions. The government has set up a high level Task Force mandated to implement measures required to max-imize the use of Natural Gas in Trinidad and Toba-go. Some work has been done in this area and there are tax incentives for the purchases of conversion kits for cars. Given the rapid growth of Electric Vehicles (EV) developed by major auto manufac-turers the question is should we be investing in CNG infrastructure or EV infrastructure or both?
Increased Role For the Private Sector.
A major question to be addressed is the role of government versus the private sector. Given the performance of the PTSC versus the maxi-taxi in-
dustry the question arises should Government con-tinue to operate public transport vehicles? We need to examine critically and developed policy guide-lines concerning the following issues (a) Deregu-lating ownership restrictions for public transporta-tion vehicles, (b) Deregulating seating capacity restrictions, (c) Public Private Partnerships, (d) The Role of “Uber”, “Lyft” & Ridesharing Apps.
Sustainable Funding for Services.
We need to establish a general policy of payment for use. In this way, the government will pay a subsidy for the provision of transport services based only on clearly identified equity and/or effi-ciency or externality concerns. In such cases the subsidies should be user-targeted not producer-targeted subsidies.
Conclusion.
We can solve the transportation crisis by develop-ing and implementing proper policies aimed at en-suring proper service levels for both urban and ru-ral dwellers with a debilitating drain on the state coffers. We need to support these policies by stra-tegic institutions with clear mandates, authority and accountability. Our population is under 1.5million people - that is not high. We have the necessary resources and knowledge, what we need is the will to take decisive action to change the cur-rent course of “laisez-faire” or “uniformed” policy making and replace it by scientific data-driven ap-proaches aimed at attaining measurable objectives.
Dr. Trevor Townsend has worked in both the public and private sectors during his career, in the areas of traffic & transportation engineering, public transportation and public policy with regard to infrastructural develop-ment. He has been engaged as a private con-sultant on a number of transportation policy, transportation planning and traffic impact assessment studies. Dr. Townsend worked for several years as a part-time lecturer. For twelve years prior to this, he worked in manu-facturing as a CEO dealing with the challeng-es of sustaining small and medium sized manufacturing companies in today’s competi-tive global environment. Dr. Townsend has served as a member of the Board of NIPDEC and NIDCO, TTMA and served as Chairman of the Port, Transport & Logistics Commit-tee. He is also a former member of the Exec-utive Council of APETT and is currently chairman of the APETT Transportation Sub-
Committee.
Page 36 APETT Engineering Magazine June 2017
DISCLAIMER: Statements made and information presented by contributors to this Magazine do not necessarily reflect the views of APETT, and no responsibility can be assumed for them by APETT or
its’ Executive Members and Editors.
ARTICLE REFERENCES
CO2 Removal using Lo - Heat Benfield Process
1. Acid Gas Removal (2017). Honeywell UOP. https://www.uop.com/processing-solutions/gas-processing/technologies/acid-gas-
removal/ 2. Bartoo, K. R. (1984). Removing Acid Gas by the Benfield Process. https://
www.researchgate.netpublication/296227171_REMOVING_ACID_GAS_BY_THE_BENFIELD_PROCESS
3. Eisa, O., Shuhaimi, E. (2010). Thermodynamic Study of Hot Potassium Carbonate Solution Using Aspen Plus 4. Patents. (1979). Removal of Hot Gases from Hot Gas Mixtures. https://www.google.com/patents/US4160810
Common Considerations for Pressure Safety Valve (PSV) Selection and Operation
1. American Petroleum Institute, “Sizing, Selection, and Installation of Pressure relieving Devices”, API 520 Part I,9th edition, Washington, DC (2014). 2. American Petroleum Institute, “Sizing, Selection, and Installation of Pressure relieving Devices in Refineries”, API 520 Part II, 5th edition, Washington, DC (2011). 3. American Society of Mechanical Engineers, “Boiler & Pressure Vessel Code”, Section VIII, “Rules for Construction of Pressure Vessels”, New York, NY (2015). 4. V. A. Carucci and R. T. Mueller, “Acoustically Induced Piping Vibration in High Capacity Pressure Reducing Systems”, ASME 82-WA/PVP-8; 1982. 5. Energy Institute, "Guidelines for the Avoidance of Vibration Induced Fatigue in Process Pipework"
Subsea Pipelines For Crude Oil Production Activities: A Typical On-Shore Fabrication Process
1. Castanier, B., & Rausand, M. (2006). Maintenance Optimization For Subsea Oil Pipelines. International Journal of Pressure Vessels
and Piping , 236-243. 2. Friske, W., & Page, G. P. (1979). Shoot Peening To Prevent The Corrosion Cracking Of Austenitic Stainless Steels. Journal Of Ma-
terials For Energy Systems , 1, 20-32. 3. Zedin, N. (2015). Effect Of Cathodic Protection On Coating Steel Pipeline In Saline Environment. Diyala Journal Of Engineering
Sciences , 8 (3), 88-99.
Thoughts on Root Cause and Corrective action
1. Maurino, D., Reason J., Johnston, N. and Lee, R. (1995) Beyond Aviation Human Factors. Ashgate Publishing Limited. 2. Rooney, J.J. and Vanden-Heuvel, L.N. Root Cause Analysis for Beginners. Quality Progress July 2004. ASQ.
Restricted Earth Fault Protection: Safeguarding Your Power Transformer
1. “ANSI Standard Device Numbers & Common Acronyms” URL: http://www.gegridsolutions.com/multilin/notes/ref/ANSi.pdf
[Accessed April 15th 2017]. 2. “BS 3938:1973 “Specification for current transformers” URL: http://shop.bsigroup.com/ProductDetail/?pid=000000000000003978
[Accessed April 15th 2017]. 3. “Checking the Polarity of Current Transformers” URL: http://www.electrotechnik.net/2009/04/checking-polarity-of-current.html
[Accessed April 18th 2017]. 4. “Choice of MV/LV transformer” URL: http://www.electrical-installation.org/enwiki/Choice_of_MV/LV_transformer[Accessed
April 15th 2017]. 5. “Class X Current Transformers” URL: http://www.electrotechnik.net/2009/06/class-x-current-transformers.html[Accessed April
15th 2017]. 6. “Core Balance Current Transformer” URL: http://electricalbaba.com/core-balance-current-transformer/ [Accessed April 15th 2017] 7. I. Kongar.; S Giovinazzi. ; T. Rossetto.,“Seismic performance of buried electrical cables: evidence-based repair rates and fragility
functions” Bulletin of Earthquake Engineering (2016), pp 1-31. URL: https://link.springer.com/article/10.1007/s10518-016-0077-3
8. “Stabilizing Resistor in Motor Earth-Fault Protection Application Note” URL:https://library.e.abb.com/public/1f4988c88d48a7d3c2256feb002dca41/applicationStabil_resistor%20in%20motor%20EFprotENa.pdf [Accessed April 16th
2017]. 9. “The Basics of Grounding Systems” URL: http://ecmweb.com/content/basics-grounding-systems [Accessed April 17th 2017].
Can the boom of the crane touch the structure in front of it?
1. Construction Safety Association of Ontario, Mobile Crane Manual. Chapter 1, pp 1. 2. Headly, J., Mobile Cranes, Operating Practices & Procedure. Chapter 7, page 127. 3. Shapiro, L.K., P.E. and Shapiro, J.P., P.E. Crane & Derricks. Chapter 2, pp 49.
Key Issues in the Future Development of our Transportation System
1. La Fond, A. “A Guide for Persons With Disabilities and The Elderly in Trinidad and Tobago”. Unpublished Book, 2016. 2. World Commission on Environment and Development (1987) – Report to the United Nations.