apidc – venture capital limited -...
TRANSCRIPT

133
4. APIDC – VENTURE CAPITAL LIMITED AND
ENTREPRENEURSHIP DEVELOPMENT OF
ANDHRA PRADESH
4.1 APIDC – VENTURE CAPITAL LIMITED AND
ENTREPRENEURSHIP DEVELOPMENT OF ANDHRA
PRADESH
Andhra Pradesh Industrial Development Corporation (APIDC) promoted
APIDC–Venture Capital Limited (VCL) on 29th
August 1989. The approval of
the Government of India to commence operations was accorded in April 1990.
APIDC-VCL was privatized in 1994 and Dynam ventures (East) Pvt. Ltd, has
been awarded control of APIDC-VCL after a competitive selection process.
Thus it has become a subsidiary of Dynam Venture (East) Pvt. Ltd., a firm
promoted by professionals with a wealth of experience in entrepreneurship,
consulting, equity investments, technology development, etc.
The company acts as manager and trustee to the APIDC Venture Capital
Fund (VCF), 1990. It is the first state level Venture Capital Fund in India to be
managed by owner-managers with strong entrepreneurial skills. The fund
manager’s strength is their understanding of what conceiving and building a
business or enterprise is all about, having gone through the process
themselves.
Initially it was incorporated with an authorized capital of Rs.2 million,
out of which Rs. 0.2755 million was paid-up capital in 1989. The paid up
capital was raised to the level of authorized capital of Rs. 2 million during
1991-92.
The company managers the venture fund of Rs. 135 million. The
authorized corpus capital of the fund is Rs. 135 million out of which Rs.41.35

134
million is paid-up, which forms the corpus of the fund known as ‘ APIDC
Venture Capital Fund – 1990’. The fund resources come from the World
Bank, the Industrial Development Bank of India (IDBI), the Andhra Pradesh
Industrial Development Corporation (APIDC), Small Industrial Development
Bank of India (SIDBI), Andhra Bank, Indian Overseas Bank (IOB) and NRIs
etc.
APIDC-VCL is the first of series of venture capital funds that will invest
in companies in Southern & Western India, with a focus on the state of
Andhra Pradesh. It will invest across several business sectors, with projections
that seek to exploit key differentials (in market potential, technology,
operations, and return on capital) between India and industrialized world.
Generally it will invest in start-up as well as expansion type of projects.
APIDC has been encouraging technology based ventures in the state of
Andhra Pradesh particularly those started by first generation technocrat-
entrepreneurs, through equity participation and by canalizing IDBI’s seed
capital assistance to entrepreneurs. However the main objectives of the fund
are:
1. To promote high technology and assist entrepreneurs to take up
ventures involving high risk.
2. To generate the highest long-term capital gains for its investors,
who view their investments as ‘patience’ money and
3. To make its commitment to the enterprises it assist beyond mere
funding i.e. assisting and adding values to them in every way it
can.
135
4.2 INVESTMENT STRATEGY AND SIZE
APIDC-VCL will invest in companies with the ability to build unique
competitive advantages that others will find difficult to emulate. It will add
value to portfolio companies through support in activities external to the
company, being a responsive facilitator of the entrepreneurial process.
APIDC-VCL is mandated to restrict its investment to Rs. 200 lakhs per
round of investment. However, it has successfully syndicated large
investments with other venture capital/private equity funds. This funding will
be in the form of equity or quasi-equity investment. Hence the company uses
equity shares, redeemable preference shares, convertible debt and conditional
loan as instruments for its venture capital finance.
4.3 DEAL GENERATION AND INVESTMENT DECISION-
MAKING STEPS
VCL deal generation strategy will practice a relatively higher level of
quality deals than a general promotional approach, and will generate sufficient
deals to invest the monies raised by it. Their focused approach to canvassing
entrepreneurs will be more efficient in finding qualified entrepreneurs and
project ideas that meet their criteria of ‘Key differentials’. VCL has set up a
flow of investment opportunities with its existing network in India and with
it’s associated in the USA. VCL also pans to promote through focused
seminars, a public relations campaign to institutions and industry associations,
to heighten the awareness of its activities.

136
VCL has set up a responsive system of receiving the investment proposals,
evaluating them and communication to the promoters/entrepreneurs. This is
basically a four-step process.
1. The submission of a full-fledged business plan with all supporting
evidence
2. A full blown presentation by the management team
3. Final completion of the due diligence
4. Negotiation of the terms of investment
The promoters/entrepreneurs are made fully aware of these steps and at
each stage they are informed whether the process has moved forward or the
proposal is being rejected.
4.4 DUE DILIGENCE AND CRITERIA FOR
INVESTMENT
VCL will evaluate each deal against the started ‘investment strategy’,
and whether the returns meet the target rates, and whether the risks can be
contained and are appropriate, prior to proceeding further. Specifically, VCL
will evaluate:
1. The quality of the management team
2. The match with their strategy of ‘Key differentials’ resulting in a
strong competitive edge for the company;
3. The size and growth rate of the market
4. Potential for high profitability while protecting the downside;
5. Types of risk and their management; and
6. The ability to disinvest with high capital gains and the congruence of
these objectives with the management teams.

137
4.5 MONITORING AND VALUE ADDITION
VCL, in line with its pro-active strategy of value-addition, follows and
active mode of monitoring and value addition. Specifically, VCL in
collaboration with the investee company sets up milestones that lead up to the
eventual disinvestments from the investee company. These milestones are then
monitored actively, and the invested company is urged to adopt a reporting
system that facilitates the monitoring of the progress versus the milestones. At
least one member from VCL will typically serve on the Board of Directors of
the company on the average of once in a week, and will install a reporting
system that evaluates progress of the investee company versus the milestone
every month government connectivity to add value to the process of enterprise
building.
4.6 THRUST AREAS
The new Equity Policy of the company proposes to give a special
impetus to Industrial Development. The company has identified the following
for special focus for investment.
1. Food & Agro processing except traditional industries.
2. Petroleum and Petro-chemicals.
3. Chemicals & Fertilizers.
4. Engineering & Automotives.
5. Minerals based industries.
6. Information Technology.
7. 100% Export Oriented Units.
8. Biotechnology.
9. Renewable sources of Energy.

138
10. Energy Saving Devices, Appliances, etc.
11. Energy Efficient and Waste Reduction Technologies and Processes.
12. Pollution Control Equipment and Devices.
13. Waste Utilization and Recycling.
4.7 BIOTECH INVESTMENT
APIDC-Venture capital has put investments of $1.62 million (Rs.
8.1crore) in three US-Indian biotech companies. In the first batch of
funding from its recent Biotech Venture Fund, it has put in $5,40,000
each in Bioserve Biotechnologies, Genomik Design Pharma and Silico
Insights. The investment through the APIDC-Venture Capital has
attracted tremendous response from several banks and insurance
companies. So, it planned with a corpus of Rs. 150 crore, and has closed
commitments for Rs 40 crore, including contributions from GIC, LIC,
Andhra Bank and the AP Government. The fund has picked start-up and
early-stage businesses such as healthcare, drug discovery, agriculture,
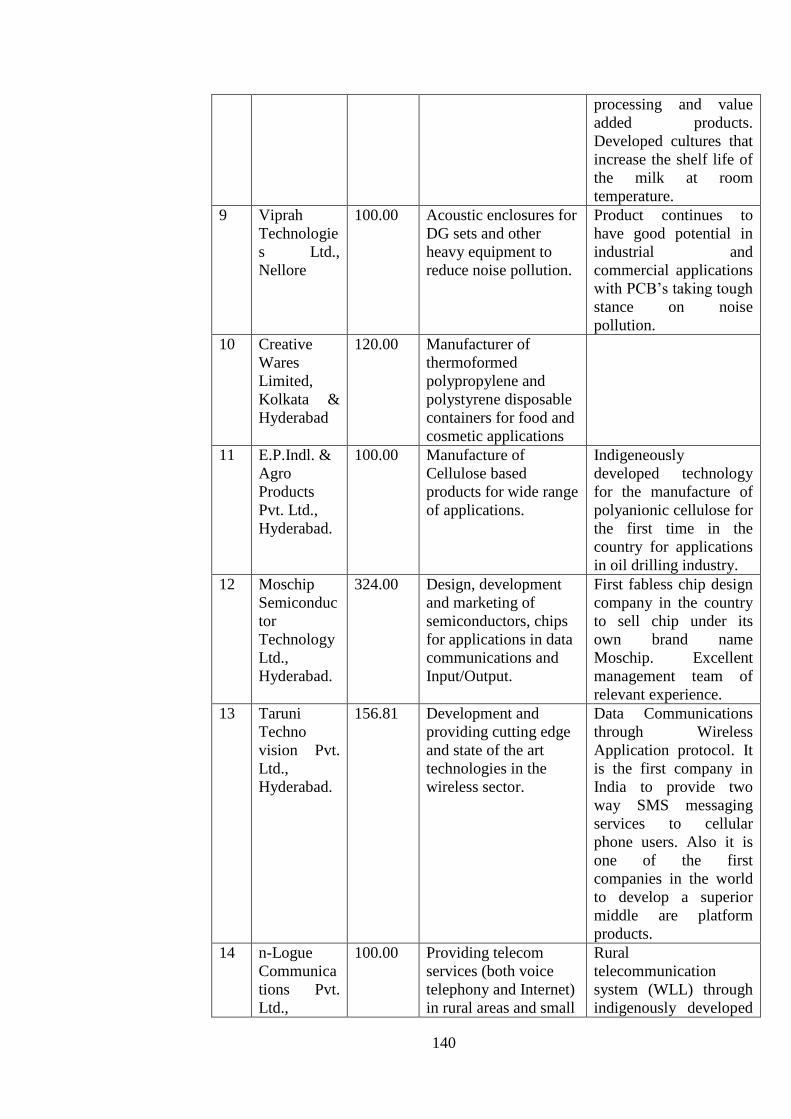
dairy etc. The portfolio of investments made by APIDC Venture Capital
Ltd is clearly demonstrated in table.
Table 4.1
VENTURE UNITS ASSISTED BY APIDC-VCL
Sl.
No
Name of
the
company
Amount
Sanct-
ioned
(Rs.lakh
s)
BUSINESS
COMPETITIVE
STRENGTH
1 Suyog
Chemicals
Pvt. Ltd.,
Nagpur
60.00 Specialty chemicals
with applications in
mining, paper, sugar,
effluent treatment etc.
Xanthates, acrylic
polymers, Phthalates
1. Indigenous developed
continuous process
technology for
Xanthates competitive
batch process, giving
rise to better yields and

139
and other chemicals lower cost of
production.
2. Innovative
management team.
2 Kakatiya
Electronics
Pvt. Ltd.,
Hyderabad
5.90 Provide innovative
products based on
Infrared sensors in
Automotive industry.
Indigeneously
developed Auto dippers
for LCVs & Cars for the
first time in the country.
3 Gland
Pharma
Limited,
Hyderabad.
150.00 Pharma company with
focus on small volume
parenterals
(injectibles). Moving
from a contract
manufacturing
company to direct
marketing capitalizing
its strengths in
institutional sales and
SVPs.
Collaboration from
Vetters Injekt, Germany,
one of the best contract
manufacturing
companies in the World,
for prefilled syringes for
the first time in the
country.
4 Srinisons
Cables
Limited,
Chennai
50.00 Providing wiring
harnesses for
automotive and white
goods industry.
One of the two
integrated wiring
harness manufacturers
in the country and only
Indian company.
5 Trendex
Retail
Informatics
Pvt. Ltd.,
Hyderabad
9.04 Providing information
data base to FMCG
sector.
Development of 100 %
reliable data base of
retail outlets for various
cities.
6 Ocean
Sparkle
Ltd.,
Hyderabad.
250.05 Providing OEM
services for ports, ship
to shore cargo
transport, etc.
Excellent management
team with hands on
shipping experience.
Established virtual
monopoly in managing
private sector corporate
ports and moving into
Govt. managed ports
like Goa, Ennore, etc.
7 Nucon
Zander
(India) Pvt.
Ltd.,
Hyderabad
48.48 Manufacture of high
efficiency, air/gas
filters and dryers
German collaboration
for Manufacture of high
pressure filter elements
in the pneumatic
applications. One of the
top two companies in
the country.
8 Dodla Dairy
Ltd.,
Nellore
170.40 Procuting and
processing milk, and
manufacture of value
added products.
Collaboration with
IMAC USA, one of the
top three dairy
technology companies
in the US, for milk
140
processing and value
added products.
Developed cultures that
increase the shelf life of
the milk at room
temperature.
9 Viprah
Technologie
s Ltd.,
Nellore
100.00 Acoustic enclosures for
DG sets and other
heavy equipment to
reduce noise pollution.
Product continues to
have good potential in
industrial and
commercial applications
with PCB’s taking tough
stance on noise
pollution.
10 Creative
Wares
Limited,
Kolkata &
Hyderabad
120.00 Manufacturer of
thermoformed
polypropylene and
polystyrene disposable
containers for food and
cosmetic applications
11 E.P.Indl. &
Agro
Products
Pvt. Ltd.,
Hyderabad.
100.00 Manufacture of
Cellulose based
products for wide range
of applications.
Indigeneously
developed technology
for the manufacture of
polyanionic cellulose for
the first time in the
country for applications
in oil drilling industry.
12 Moschip
Semiconduc
tor
Technology
Ltd.,
Hyderabad.
324.00 Design, development
and marketing of
semiconductors, chips
for applications in data
communications and
Input/Output.
First fabless chip design
company in the country
to sell chip under its
own brand name
Moschip. Excellent
management team of
relevant experience.
13 Taruni
Techno
vision Pvt.
Ltd.,
Hyderabad.
156.81 Development and
providing cutting edge
and state of the art
technologies in the
wireless sector.
Data Communications
through Wireless
Application protocol. It
is the first company in
India to provide two
way SMS messaging
services to cellular
phone users. Also it is
one of the first
companies in the world
to develop a superior
middle are platform
products.
14 n-Logue
Communica
tions Pvt.
Ltd.,
100.00 Providing telecom
services (both voice
telephony and Internet)
in rural areas and small
Rural
telecommunication
system (WLL) through
indigenously developed

141
Hyderabad. towns based on WILL
technology.
Cordect technology
facilitating usage of
internet and telephony
on the same line at the
same time.
15 CxK
Networks,
Hyderabad.
50.00 Providing researched
content to corporate
sector.
Excellent management
team.
16 Indus
Technology
Pvt. Ltd.,
Chennai &
Singapore
100.00 A Computer Machine
Vision Solutions
company, providing
high-end machine
vision solutions to
customers in the
manufacturing
industry.
Collaboration with IIT,
Madras & TeNet group
and has sound domain
knowledge and expertise
in the technology and
business of machine
vision. It has delivered a
variety of solutions to
several leading
companies in the field of
semiconductor
manufacturing, both in
the front-end and the
back-end areas of
operation.
17 Triad
Fleetcontrol
India Pvt.
Ltd.,
Singapore.
50.00 Providing automated
Fuel and Fleet
Management System
(FMS) (CRM
technology tool) to
fleet managers of large
fleet transport
organizations.
Technical collaboration
with Rose man Engg.,
one of the world leaders
for automated fuel and
fleet management
systems.
18 Vibromech
Engineers &
Services
Ltd.,
Chennai.
125.00 Manufacture of
Vibration Dampers,
Lube Oil Pumps and
Air Cylinders
Assemblies.
Company has significant
advantages in
technology; cost of
manufacture and cost of
design, over the
developed market
vendors, who are the
only current competitors
for the large auto majors
around the world.
19 Foursoft
Ltd.
100.00 Logistics
Source: Annual reports of APIDC-VCL
It is evident from Table 4.1 that the portfolio of investments of APIDC-
Venture Capital Ltd. It has invested Rs.365.85 lakhs in Computers and
Software, Rs.60 lakhs in Chemicals, Rs.329.90 lakhs in Electronics, Rs.150
142
lakhs in Pharma, Rs.425.05 lakhs in Services, Rs.170.40 lakhs in Milk, Rs.100
lakhs in Agro, Rs.150 lakhs in Communications, Rs.50 lakhs in Cables,
Rs.168.48 lakhs in Manufacturing and Rs.100 lakhs in Logistics.
Hence, the major investments of APIDC-Venture Capital Ltd were
attracted by Services, Electronics and IT industry. However, it is very clear
from the table that APIDC-Venture Capital Ltd has invested its money to the
extent of 68.42 percent in Andhra Pradesh.
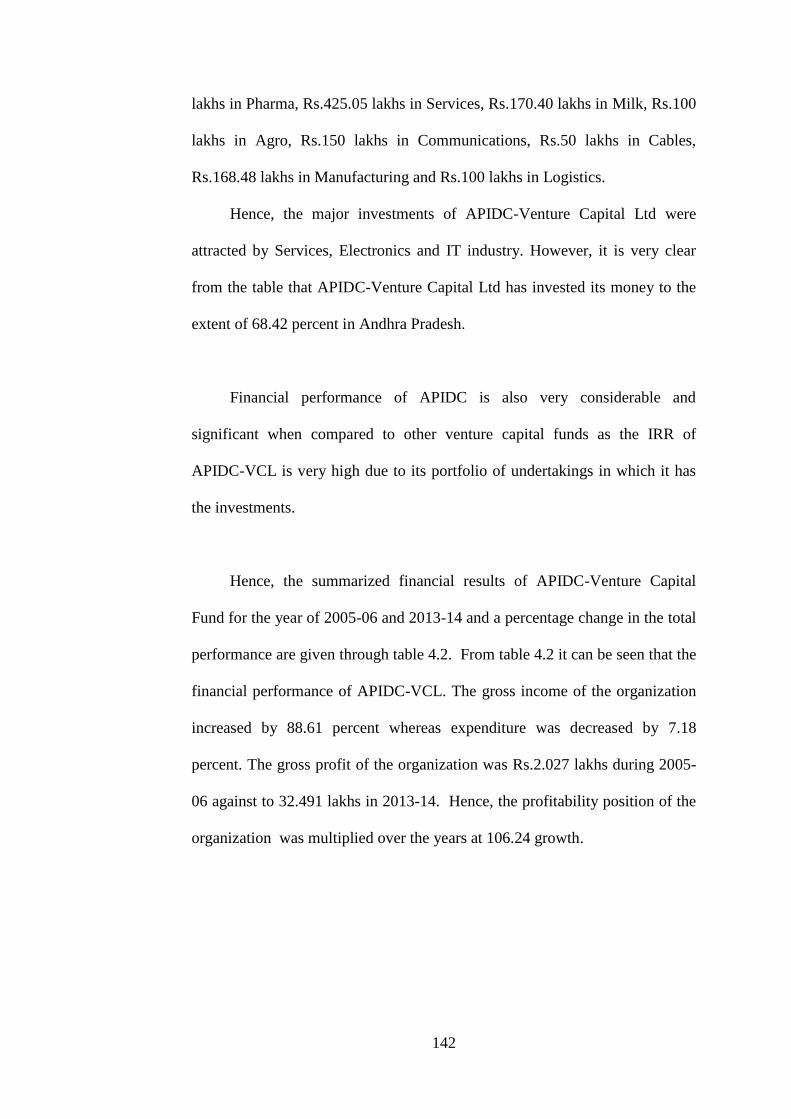
Financial performance of APIDC is also very considerable and
significant when compared to other venture capital funds as the IRR of
APIDC-VCL is very high due to its portfolio of undertakings in which it has
the investments.
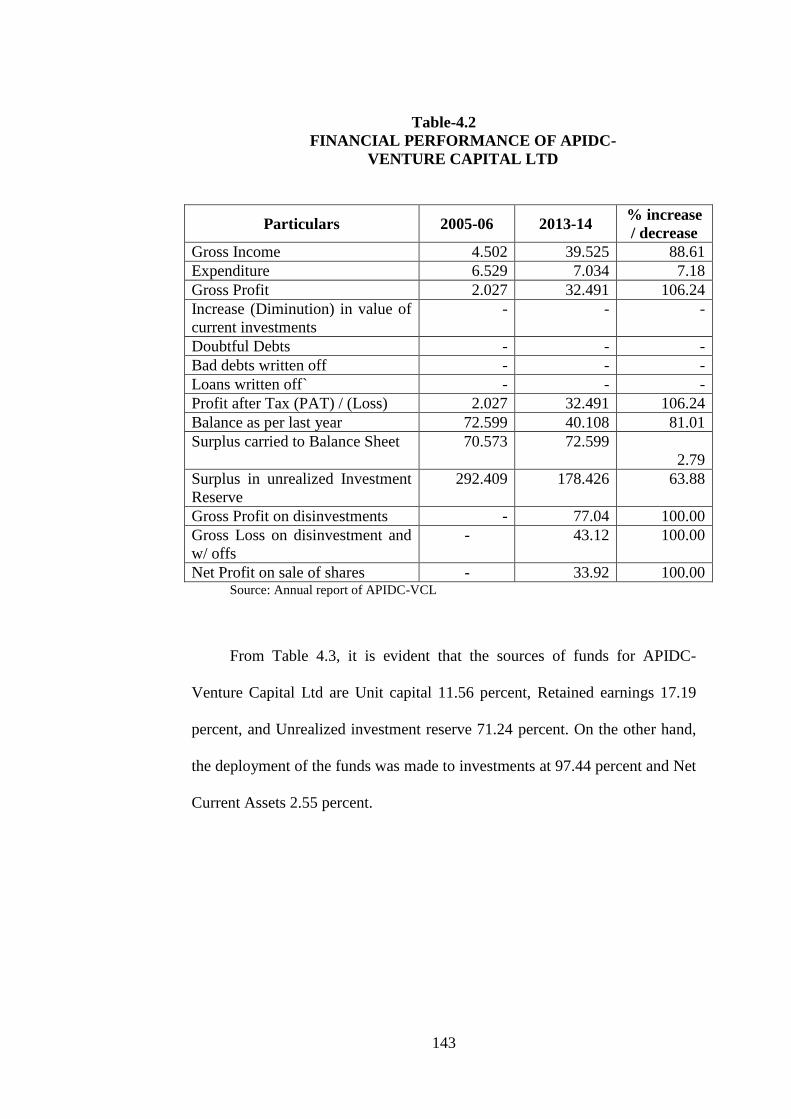
Hence, the summarized financial results of APIDC-Venture Capital
Fund for the year of 2005-06 and 2013-14 and a percentage change in the total
performance are given through table 4.2. From table 4.2 it can be seen that the
financial performance of APIDC-VCL. The gross income of the organization
increased by 88.61 percent whereas expenditure was decreased by 7.18
percent. The gross profit of the organization was Rs.2.027 lakhs during 2005-
06 against to 32.491 lakhs in 2013-14. Hence, the profitability position of the
organization was multiplied over the years at 106.24 growth.
143
Table-4.2
FINANCIAL PERFORMANCE OF APIDC-
VENTURE CAPITAL LTD
Particulars 2005-06 2013-14 % increase
/ decrease
Gross Income 4.502 39.525 88.61
Expenditure 6.529 7.034 7.18
Gross Profit 2.027 32.491 106.24
Increase (Diminution) in value of
current investments
- - -
Doubtful Debts - - -
Bad debts written off - - -
Loans written off` - - -
Profit after Tax (PAT) / (Loss) 2.027 32.491 106.24
Balance as per last year 72.599 40.108 81.01
Surplus carried to Balance Sheet 70.573 72.599
2.79
Surplus in unrealized Investment
Reserve
292.409 178.426 63.88
Gross Profit on disinvestments - 77.04 100.00
Gross Loss on disinvestment and
w/ offs
- 43.12 100.00
Net Profit on sale of shares - 33.92 100.00 Source: Annual report of APIDC-VCL
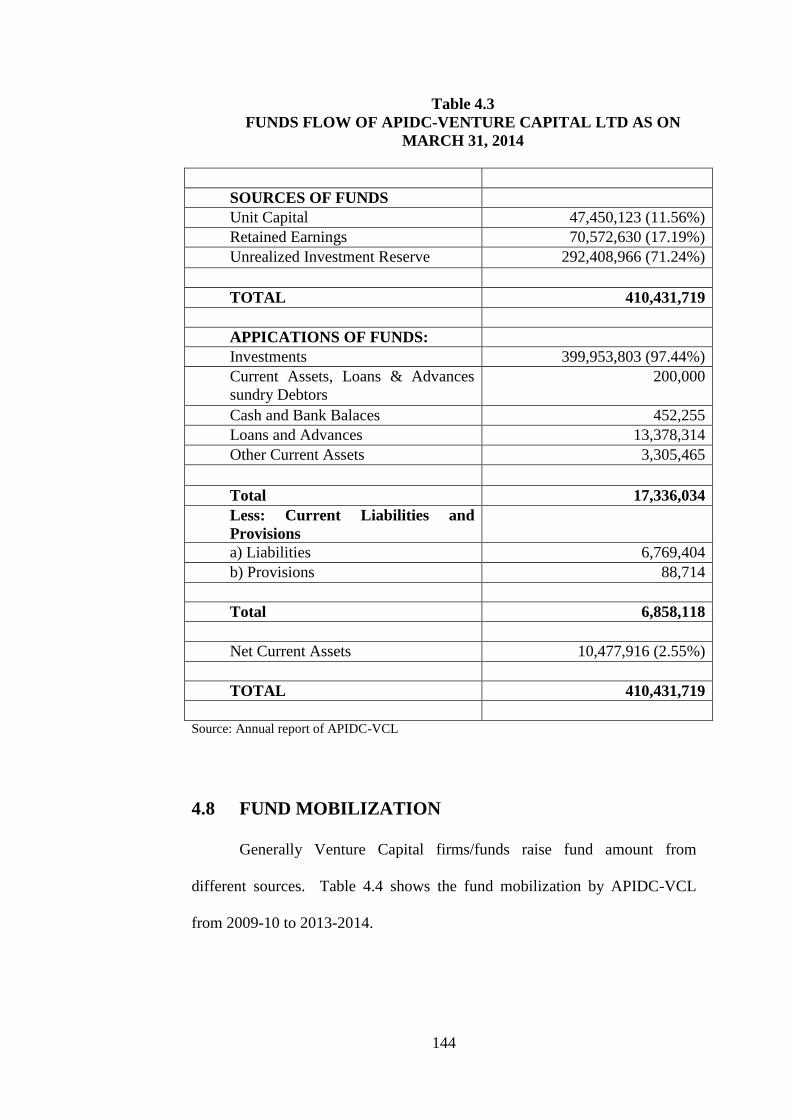
From Table 4.3, it is evident that the sources of funds for APIDC-
Venture Capital Ltd are Unit capital 11.56 percent, Retained earnings 17.19
percent, and Unrealized investment reserve 71.24 percent. On the other hand,
the deployment of the funds was made to investments at 97.44 percent and Net
Current Assets 2.55 percent.
144
Table 4.3
FUNDS FLOW OF APIDC-VENTURE CAPITAL LTD AS ON
MARCH 31, 2014
SOURCES OF FUNDS
Unit Capital 47,450,123 (11.56%)
Retained Earnings 70,572,630 (17.19%)
Unrealized Investment Reserve 292,408,966 (71.24%)
TOTAL 410,431,719
APPICATIONS OF FUNDS:
Investments 399,953,803 (97.44%)
Current Assets, Loans & Advances
sundry Debtors
200,000
Cash and Bank Balaces 452,255
Loans and Advances 13,378,314
Other Current Assets 3,305,465
Total 17,336,034
Less: Current Liabilities and
Provisions
a) Liabilities 6,769,404
b) Provisions 88,714
Total 6,858,118
Net Current Assets 10,477,916 (2.55%)
TOTAL 410,431,719
Source: Annual report of APIDC-VCL
4.8 FUND MOBILIZATION
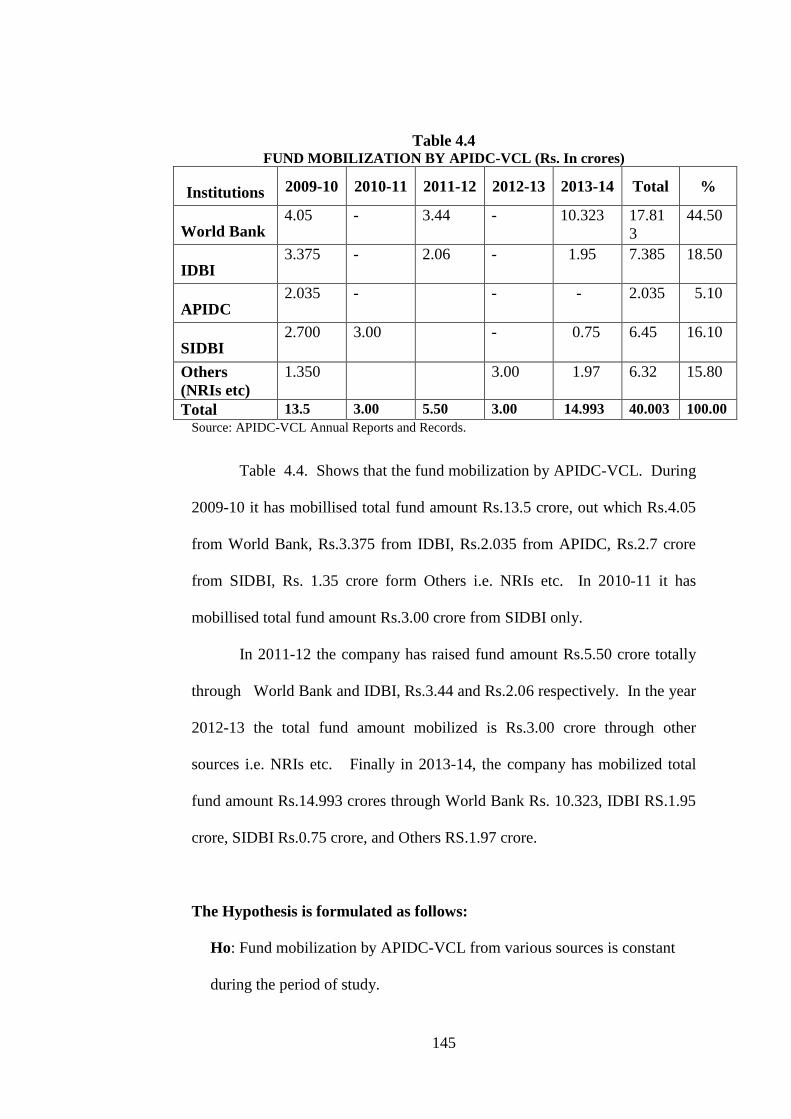
Generally Venture Capital firms/funds raise fund amount from
different sources. Table 4.4 shows the fund mobilization by APIDC-VCL
from 2009-10 to 2013-2014.
145
Table 4.4 FUND MOBILIZATION BY APIDC-VCL (Rs. In crores)
Institutions 2009-10 2010-11 2011-12 2012-13 2013-14 Total %
World Bank 4.05 - 3.44 - 10.323 17.81
3
44.50
IDBI 3.375 - 2.06 - 1.95 7.385 18.50
APIDC 2.035 - - - 2.035 5.10
SIDBI 2.700 3.00 - 0.75 6.45 16.10
Others
(NRIs etc)
1.350 3.00 1.97 6.32 15.80
Total 13.5 3.00 5.50 3.00 14.993 40.003 100.00
Source: APIDC-VCL Annual Reports and Records.
Table 4.4. Shows that the fund mobilization by APIDC-VCL. During
2009-10 it has mobillised total fund amount Rs.13.5 crore, out which Rs.4.05
from World Bank, Rs.3.375 from IDBI, Rs.2.035 from APIDC, Rs.2.7 crore
from SIDBI, Rs. 1.35 crore form Others i.e. NRIs etc. In 2010-11 it has
mobillised total fund amount Rs.3.00 crore from SIDBI only.
In 2011-12 the company has raised fund amount Rs.5.50 crore totally
through World Bank and IDBI, Rs.3.44 and Rs.2.06 respectively. In the year
2012-13 the total fund amount mobilized is Rs.3.00 crore through other
sources i.e. NRIs etc. Finally in 2013-14, the company has mobilized total
fund amount Rs.14.993 crores through World Bank Rs. 10.323, IDBI RS.1.95
crore, SIDBI Rs.0.75 crore, and Others RS.1.97 crore.
The Hypothesis is formulated as follows:
Ho: Fund mobilization by APIDC-VCL from various sources is constant
during the period of study.

146
Test
Used
Degree of
Freedom
Level of
Significance
Calculated
Value
Table
Value
Result
Chi-
square 16 5 35.42 26.296 Rejected
It shows that the fund mobilization by APIDC-VCL from various
sources is not constant over the study period.
4.9 FUND MOBILIZED TO COMMITMENT
APIDC-VCL has the commitment for fund mobilization from World
Bank, Andhra Bank, IDBI, SIDBI, NRIs and others. Table 4.5 shows the
percentage of fund mobilized to commitment.
Table 4.5 PERCENTAGE OF FUND MOBILIZED TO COMMITMENT
(Rs. In crores)
Year Name of
Institution
Fund
Mobilized Commitment
% of
Mobilization
to
commitment
2008-09 Andhra Bank 1.00 1.50 66.66
2009-10 NRIs 1.657 5.00 33.14
2010-11 NRIs 0.313 5.00 6.26
2011-12
World Bank 5.52 11.52 47.93
IDBI 0.65 3.00 21.66
SIDBI 0.75 3.00 25.00
2012-13 World Bank 4.00 11.52 34.72
2013-14 World Bank
Own Funds
0.80
0.45
11.52
2.25
6.94
20.45
Total 15.14 54.31 27.87
Source: APIDC-VCL Annual Reports
From table 4.5 it can be seen that during the year 2010-11 APIDC-
VCL has mobililsed fund amount Rs. 31.3 lacks from NRI”S out of the
committed fund amount of Rs 5 crores. This stands at 6.26%. In the year
‘2007-08’ the firm has mobilized fund amount Rs. 6.92 crore from World
147
Bank(WB), IDBI, SIDBI at 5.52crores, 0.65 crores and .75 crores
respectively. This year it has mobilized the fund amount out of the
commitment at 47.93 %, 21.66% and 25% from WB, IDBI ,SIDBI
respectively.
In the year 2012-13 APIDC_VCL has mobilised Rs 4 crore at 34.72%
from the committed amount of Rs 11.52 crore from World Bank. During the
year 2013-2014 Rs 1.25 crore amount was mobilised from World Bank and
own funds. In this year they received .0.80 crores from World Bank which is
6.91% of its committed amount of Rs 11.52 crore and also received 0.45 crore
from own funds which amount to 20.45 % of their committed amount of Rs
2.25 crores.
It is inferred that the total fund committed is not fully mobilized by the
APSIDC-VCL from the sources so far as it is slowly moving towards taking
up the new ventures to promote with the principles of risk and return and
sustainability with greater success.
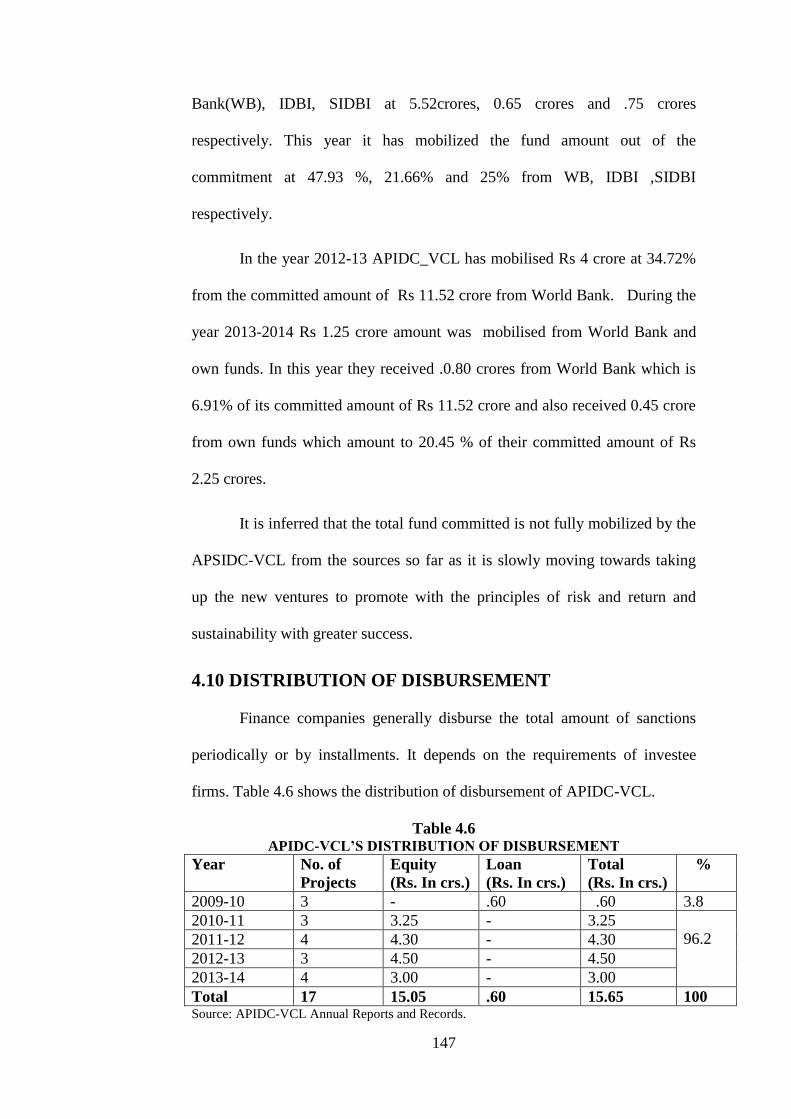
4.10 DISTRIBUTION OF DISBURSEMENT
Finance companies generally disburse the total amount of sanctions
periodically or by installments. It depends on the requirements of investee
firms. Table 4.6 shows the distribution of disbursement of APIDC-VCL.
Table 4.6 APIDC-VCL’S DISTRIBUTION OF DISBURSEMENT
Year No. of
Projects
Equity
(Rs. In crs.)
Loan
(Rs. In crs.)
Total
(Rs. In crs.)
%
2009-10 3 - .60 .60 3.8
2010-11 3 3.25 - 3.25
96.2 2011-12 4 4.30 - 4.30
2012-13 3 4.50 - 4.50
2013-14 4 3.00 - 3.00
Total 17 15.05 .60 15.65 100 Source: APIDC-VCL Annual Reports and Records.
148
Table 4.6 shows that the distribution of disbursement. In 2009-10 it
has distributed Rs. 60 lakhs debt to 3 projects followed by Rs. 3.25 crore
equity capital for 3 projects in 2010-11, Rs.4.30 crore equity for 4 projects in
2011-12, Rs.4.50 crore equity to 3 projects in 2012-13 and Rs.3.00 crore
equity to 4 projects in 2013-2014.
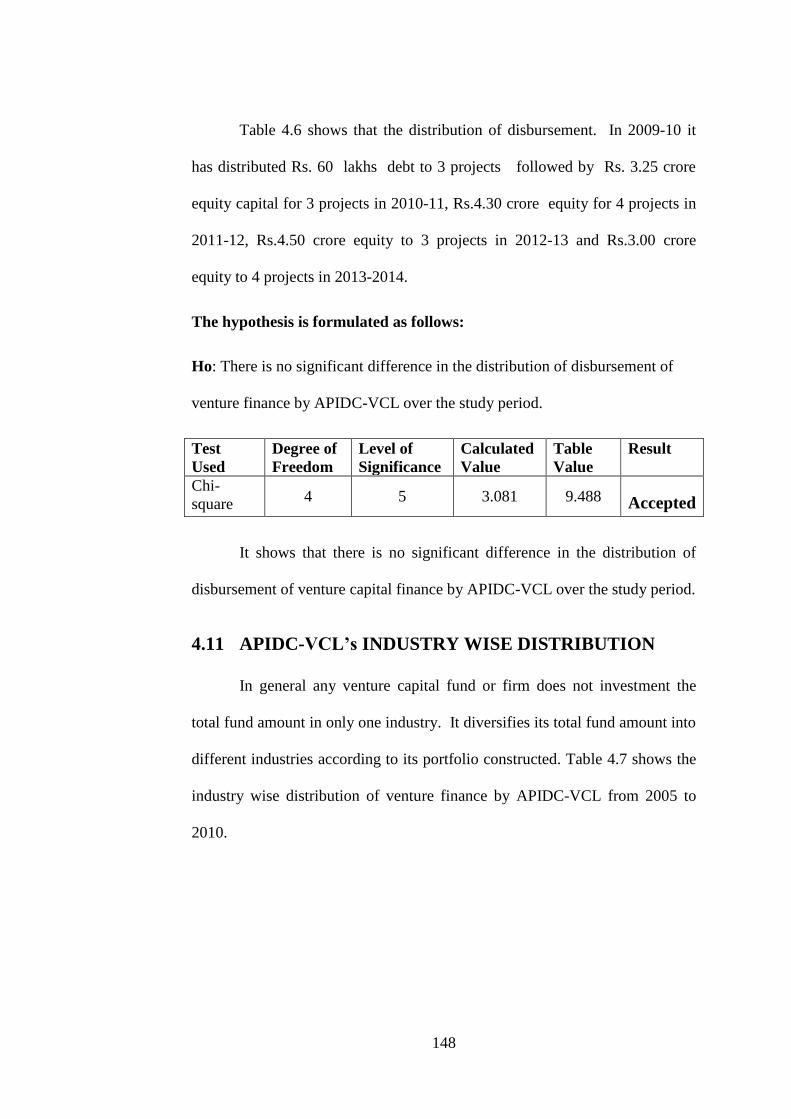
The hypothesis is formulated as follows:
Ho: There is no significant difference in the distribution of disbursement of
venture finance by APIDC-VCL over the study period.
Test
Used
Degree of
Freedom
Level of
Significance
Calculated
Value
Table
Value
Result
Chi-
square 4 5 3.081 9.488 Accepted
It shows that there is no significant difference in the distribution of
disbursement of venture capital finance by APIDC-VCL over the study period.
4.11 APIDC-VCL’s INDUSTRY WISE DISTRIBUTION
In general any venture capital fund or firm does not investment the
total fund amount in only one industry. It diversifies its total fund amount into
different industries according to its portfolio constructed. Table 4.7 shows the
industry wise distribution of venture finance by APIDC-VCL from 2005 to
2010.
149
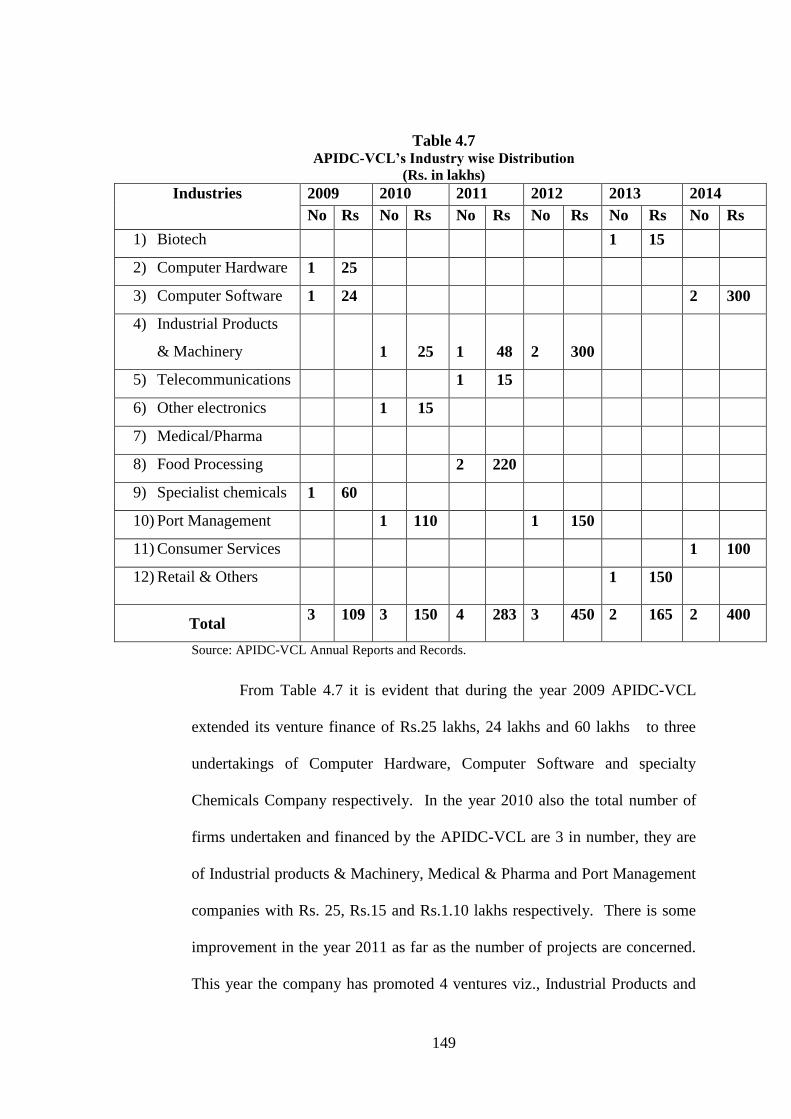
Table 4.7 APIDC-VCL’s Industry wise Distribution
(Rs. in lakhs)
Industries 2009 2010 2011 2012 2013 2014
No Rs No Rs No Rs No Rs No Rs No Rs
1) Biotech 1 15
2) Computer Hardware 1 25
3) Computer Software 1 24 2 300
4) Industrial Products
& Machinery
1
25
1
48
2
300
5) Telecommunications 1 15
6) Other electronics 1 15
7) Medical/Pharma
8) Food Processing 2 220
9) Specialist chemicals 1 60
10) Port Management 1 110 1 150
11) Consumer Services 1 100
12) Retail & Others
1 150
Total 3 109 3 150 4 283 3 450
2 165 2 400
Source: APIDC-VCL Annual Reports and Records.
From Table 4.7 it is evident that during the year 2009 APIDC-VCL
extended its venture finance of Rs.25 lakhs, 24 lakhs and 60 lakhs to three
undertakings of Computer Hardware, Computer Software and specialty
Chemicals Company respectively. In the year 2010 also the total number of
firms undertaken and financed by the APIDC-VCL are 3 in number, they are
of Industrial products & Machinery, Medical & Pharma and Port Management
companies with Rs. 25, Rs.15 and Rs.1.10 lakhs respectively. There is some
improvement in the year 2011 as far as the number of projects are concerned.
This year the company has promoted 4 ventures viz., Industrial Products and

150
machinery, Tele communication and Food Processing with Rs.48, Rs.15, and
Rs.2.20 lakhs respectively.
During 2012 the company has promoted 3 units out of which 2 are
related to Industrial products and machinery and the remaining one is related
to port management with Rs.300 lakhs and 150 lakhs respectively.
In 2013 it has promoted 2 projects of Biotech and retail and other
industries with Rs.15 lakhs and 150 lakhs respectively. Hence during the year
2014 the company has promoted two projects – one in computer software and
the other one in consumer services with Rs.300 lakhs and Rs.100 lakhs
respectively.
During the period of the study APIDC-VCL’s Venture Capital is
attracted by Industraial Product and Manufacturing industry followed by
Computer Software industry, Food processing industry, Port Management to
the maximum extent and followed by other industries as shown.
The hypothesis is framed as follows
Ho: The Industrial distribution of number of projects and venture capital
finance by APIDC-VCL is constant over the study period.
Particulars Test
Used
Degree
of
Freedom
Level of
Significance
Calculated
Value
Table
Value
Result
Projects Chi-
square
55 5 77.09 73.3 Rejected
Finance Chi-
square
55 5 5961.762 73.3 Rejected
It shows that the industrial distribution of number of projects and
venture capital finance by APIDC-VCL is significantly different in all the
years of the study period.

151
4.12 FINANCING BY INVESTMENT STAGE
There are broadly five stages of finance under venture capital financing
unlike in traditional finance as Seed stage, Start-Up stage, Later stage, Other
Early stage and Turnaround Financing. Table 4.8 reveals the financing by
investment stage from 2009 to 2014 financial years
Table 4.8
APIDC-VCL’S FINANCING BY INVESTMENT STAGE
(Rs. in lakhs)
Investment
Stage
2009 2010 2011 2012 2013 2014
Rs. No. Rs. No. Rs. No. Rs. No. Rs. No. Rs. No.
Seed Stage 9.04 1 50.0 1 10 1
Start-Up
Stage
5.0 1 0.90 1 50.0 1 130.5 1 140.27 2
Later Stage 35.0 1 163.48 2 260 3 193.0 4 83.8 2
Other Early
Stage
Turnaround
Financing
60.0 1 50.0 1
TOTAL 65.0 2 94.94 4 263.48 4 270 4 323.5 5 224.08 4 Source: APIDC-VCL Annual Reports and Records.
Table 4.8 shows APIDC-VCL’s financing by investment stage is
covered by 5 different stages namely Seed Stage, Start-Up Stage, Later Stage,
Other Early Stage and Turnaround Financing. During the study period it has
financed 3 ventures at seed stage in 2010, 2011 and 2012 by Rs. 9.04,
Rs.50.00 and 10.00 lakhs respectively.
Ventures financed at Start-Up stage were totally 6 as in 2009, 2010,
2011, 2013 and 2014 with the amount of Rs. 50.00 lakhs, Rs.0.9 lakhs, Rs.50
lakhs, Rs.130.5 lakhs and Rs.140.27 lakhs respectively.
On the other hand ventures financed at Later Stage were totally 12 as
one in 2010, two in 2011, three in 2012, four in 2013 and remaining two in
152
2014 with Rs. 35 lakhs, Rs.163.48 lakhs, Rs.260.00 lakhs, Rs.193.00 lakhs
and Rs.83.8 lakhs respectively.
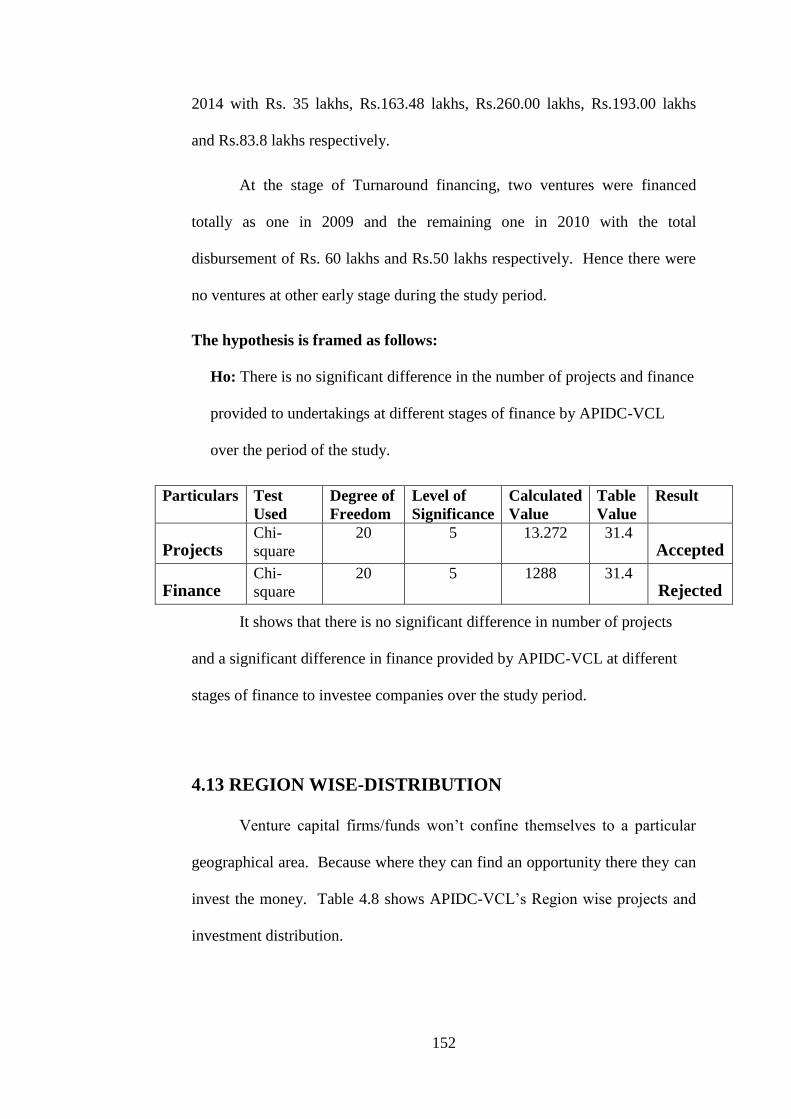
At the stage of Turnaround financing, two ventures were financed
totally as one in 2009 and the remaining one in 2010 with the total
disbursement of Rs. 60 lakhs and Rs.50 lakhs respectively. Hence there were
no ventures at other early stage during the study period.
The hypothesis is framed as follows:
Ho: There is no significant difference in the number of projects and finance
provided to undertakings at different stages of finance by APIDC-VCL
over the period of the study.
Particulars Test
Used
Degree of
Freedom
Level of
Significance
Calculated
Value
Table
Value
Result
Projects Chi-
square
20 5 13.272 31.4 Accepted
Finance Chi-
square
20 5 1288 31.4 Rejected
It shows that there is no significant difference in number of projects
and a significant difference in finance provided by APIDC-VCL at different
stages of finance to investee companies over the study period.
4.13 REGION WISE-DISTRIBUTION
Venture capital firms/funds won’t confine themselves to a particular
geographical area. Because where they can find an opportunity there they can
invest the money. Table 4.8 shows APIDC-VCL’s Region wise projects and
investment distribution.

153
Table 4.9
APIDC-VCL REGION WISE-DISTRIBUTION
(Rs. In millions)
Source: APIDC-VCL Annual Reports and Records.
Table 4.9 shows the region wise distribution of venture capital by
APIDC-VCL during the study period. It has promoted 2 projects with Rs.49
lakhs, 3 projects with Rs.150 lakhs, 4 projects with Rs. 283 lakhs, 2 projects
with Rs.165 lakhs and finally 2 projects with Rs.400 lakhs in 2009, 2010,
2011, 2012.2013 and 2014 respectively in Southern part of India. On the
other hand it has promoted only 1 project in Eastern part of India in 2012 with
Rs.150 lakhs.
In western part of India the company has promoted 1 project with Rs.
60 lakhs in 2009 and 2 projects with Rs.300 lakhs in 2012. However there are
no projects promoted by APIDC-VCL in North India so far.
The Hypothesis is formulated as follows:
Ho: There is no significant difference in the distribution of number of projects
and venture finance provided to investees’ by APIDC-VCL in the four
regions of India.
Region 2009 2010 2011 2012 2013 2014
No. Rs. No. Rs. No. Rs. No. Rs. No. Rs. No. Rs.
South
2
49
3
150
4
283
-
-
2
165
2
400
East - - - - - - 1 150 - - - -
North - - - - - - - - - - - -
West
1
60 -
- -
- 2
300 - - - -
Total 3 109 3 150 4
283 3 450 2 165 2 400

154
Particulars Test
Used
Degree
of
Freedom
Level of
Significance
Calculated
Value
Table
Value
Result
Projects Chi-
square
20 5 13.272 31.4 Accepted
Finance Chi-
square
20 5 1288 31.4 Rejected
This shows that the region wise distribution of projects and finance
provided by APIDC-VCL is very significant in the four regions of India.
4.14 STATUS OF PORTFOLIO COMPANIES
Portfolio is the combination of financial assets, in general all the
venture capital funds maintain a well-designed portfolio with a good balance
of different industries while performing the investment activity, on which the
success of the company depends. Table 6.8 shows status of APIDC-VCL’s
portfolio companies.
Table 4.10 STATUS OF APIDC-VCL’S PORTFOLIO COMPANIES
ON-TRACK MODERATE
BELOW
EXPECTATIONS
U.S VC’s
Experience
10% 50% 40%
Indian VC’s
Experience
33% 33% 34%
APICC-VCL 53% 32% 15%
COMPANIES OF
APSIDC-VCL (
IRR)
1. IT Company
(75%)
1. Pharma Company
(20%)
1. Power Company ((0%)
(Loss of Principal)
2.Service
Company (60%)
2. Specialty
Company (25%)
2. Auto Ancillary (0%)
(Loss of Principal)
3. IT Company
(100%)
3. Packaging
Company
(Return of Principal)
3. Market Research (0%)
(Loss of Principal)
4. Chemical
Company(50%)
4. Industrial
Engineering (15%)
4. Auto Ancillary (0%)
(Loss of Principal)
5. Dairy
Company
(30%)
Source: APIDC-VCL Annual Reports and Records.
155
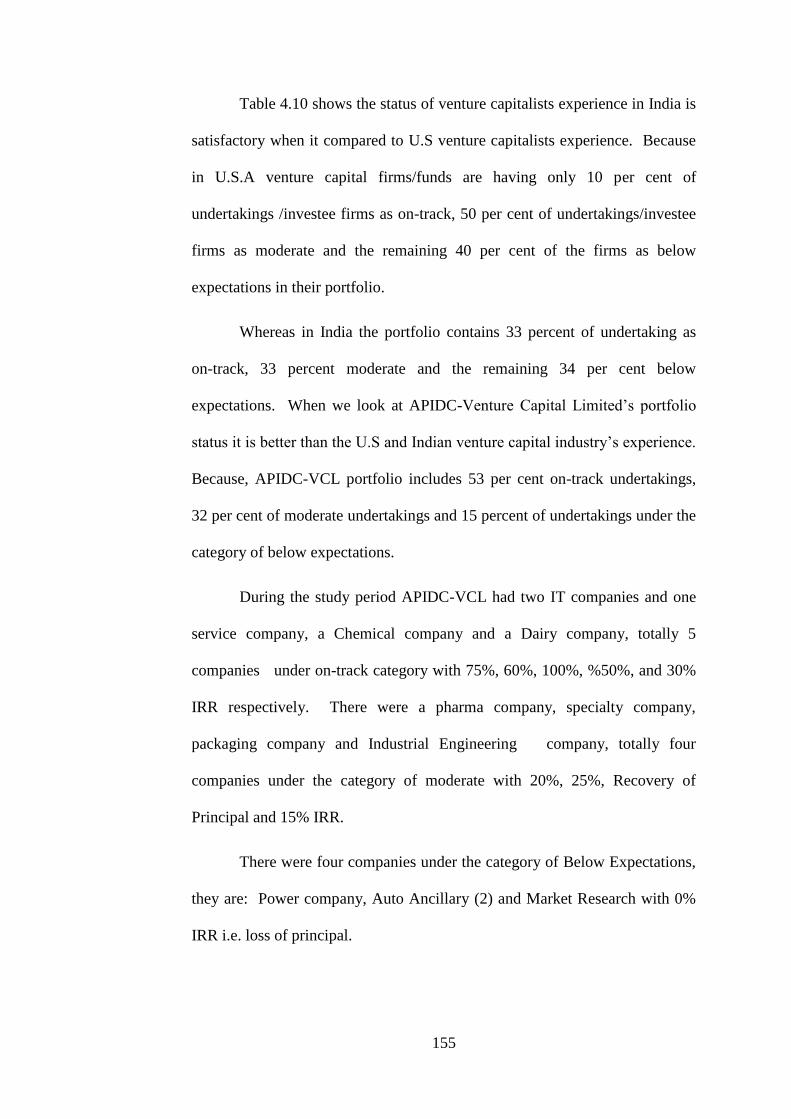
Table 4.10 shows the status of venture capitalists experience in India is
satisfactory when it compared to U.S venture capitalists experience. Because
in U.S.A venture capital firms/funds are having only 10 per cent of
undertakings /investee firms as on-track, 50 per cent of undertakings/investee
firms as moderate and the remaining 40 per cent of the firms as below
expectations in their portfolio.
Whereas in India the portfolio contains 33 percent of undertaking as
on-track, 33 percent moderate and the remaining 34 per cent below
expectations. When we look at APIDC-Venture Capital Limited’s portfolio
status it is better than the U.S and Indian venture capital industry’s experience.
Because, APIDC-VCL portfolio includes 53 per cent on-track undertakings,
32 per cent of moderate undertakings and 15 percent of undertakings under the
category of below expectations.
During the study period APIDC-VCL had two IT companies and one
service company, a Chemical company and a Dairy company, totally 5
companies under on-track category with 75%, 60%, 100%, %50%, and 30%
IRR respectively. There were a pharma company, specialty company,
packaging company and Industrial Engineering company, totally four
companies under the category of moderate with 20%, 25%, Recovery of
Principal and 15% IRR.
There were four companies under the category of Below Expectations,
they are: Power company, Auto Ancillary (2) and Market Research with 0%
IRR i.e. loss of principal.

156
4.15 MANAGEMENT FEE
Unlike the traditional financing the venture financing organizations
collect some amount of money from the investee as in the form of
management fee for their managerial services. In fact which stands a
significant part of the total income. Table 4.10 shows the Management fee
collected by APIDC-VCL
Table 4.11
Management Fee
Source: APIDC-VCL Annual Reports
Table 4.11 shows the Management Fee that is earned by APIDC-VCL
through managerial services provided to its investee firms. During the year
2008-09 the company has earned income through management fee
Rs.7, 39,612, which is 94.6 per cent of the total income. In 2009-10 it is 86
per cent, in 2011-12 it is 91.5 per cent, in 2012-13 it is 62.6 per cent, in 2012-
13 it is 52.9 per cent and in 2013-14 it is 52.6 per cent of total income.
4.16 DIVIDEND ON INVESTMENTS
Dividend on investments is the ultimate returns of the company.
Generally when the investee firms commercially succeeds in the market and
generates some profits then they offer dividend to the venture capitalist.
Year (Rs.) % Total Income
2008-09 7,39,612 94.6
2009-10 12,11,276 86.0
2010-11 12,20,970 91.5
2011-12 39,08,475 62.6
2012-13 51,08,475 52.9
2013-14 47,88,000 52.6

157
Table 4.11 shows the dividend received by APIDC-VCL from its investee
companies from 2008-09 to 2013-14.
Table 4.12 DIVIDEND ON INVESTMENTS
(Rs. in lakhs)
Year Dividend in (Rs.in lakhs)
2008-09 -
2009-10 1,60,970
2010-11 4,20,004
2011-12 3,31,667
2012-13 2,55,898
2013-14 25,83,312
Source: APIDC-VCL Annual Reports
The table 4.12 shows the Dividend received by APIDC-VCL on its
investments during the study period. In 2008-09 there is no dividend received
by the company. In 2009-10 Dividend was Rs. 1,60,970, in 2010-11
Rs. 4,20,004, in 2011-12 Rs. 3,31,667, in 2012-13 Rs. 2,55,898 and in
2013-14 Rs. 25,83,312. It is found that as the business operations and number
of undertakings increased to APIDC-VCL the management fee in totally also
increased very significantly.