apo | asian productivity organization
TRANSCRIPT

Public Policy Innovation for
Human Capital Development
The Asian Productivity Organization (APO) is an intergovernmental organization committed to improving productivity in the Asia-Pacific region. Established in 1961, the APO contributes to the sustainable socioeconomic development of the region through policy advisory services, acting as a think tank, and undertaking smart initiatives in the industry, agriculture, service, and public sectors. The APO is shaping the future of the region by assisting member economies in formulating national strategies for enhanced productivity and through a range of institutional capacity- building efforts, including research and centers of excellence in member countries.
APO members Bangladesh, Cambodia, Republic of China, Fiji, Hong Kong, India, Indonesia, Islamic Republic of Iran, Japan, Republic of Korea, Lao PDR, Malaysia, Mongolia, Nepal, Pakistan, Philippines, Singapore, Sri Lanka, Thailand, Turkey, and Vietnam.
PUBLIC POLICY INNOVATION FOR HUMAN CAPITAL DEVELOPMENT
DECEMBER 2020 | ASIAN PRODUCTIVITY ORGANIZATION

Public Policy Innovation for Human Capital Development
Prof. Yuto Kitamura and Dr. Will Brehm served as the volume editors.
First edition published in Japanby the Asian Productivity Organization1-24-1 Hongo, Bunkyo-kuTokyo 113-0033, Japanwww.apo-tokyo.org
© 2020 Asian Productivity Organization
The views expressed in this publication do not necessarily reflect the official views of the Asian Productivity Organization (APO) or any APO member.
All rights reserved. None of the contents of this publication may be used, reproduced, stored, or transferred in any form or by any means for commercial purposes without prior written permission from the APO.
Designed by BM Nxt

CONTENTS
FOREWORD VII
INTRODUCTION 1What this Report Covers 2The Changing Context of Work and Employment 3Education System’s Organization 4Ways Forward 5References 5
REPUBLIC OF CHINA 7Introduction 7Background 8Methodology 10Findings 10Organizational Structures 11
Executive Yuan 11Ministry of Education 12Ministry of Science and Technology 12Ministry of the Interior 12Ministry of Labor 13Ministry of Economic Affairs 13National Development Council 13Non-governmental Institutions 14
Public Policies, Plans, and Programs 15STEM 15TVET 16Entrepreneurship 16Human Capital Development in General 17
Emerging Needs and Skills 18Discussion 19
Key Challenges 19Local Responses 21Conclusion 22References 23
INDIA 29Introduction 29
Socioeconomic Profile of India 29Role of Private Sector in India 37Role of Public Sector in India 38List of State-owned Enterprises 38Industrial Policies in India 41
Context of Human Resource Development 43National Skills Qualification Framework 43

IV | PUBLIC POLICY INNOVATION FOR HUMAN CAPITAL DEVELOPMENT
Skillset Availability in India 43Role of Industry Sector in Distribution of Income and Wealth 43Role of Government in Changing Economy 47Industrial Safety and Security in India 48Role of Civil Society in Economic Development 49Role of Government in Economic Development 49
Higher Education and Research and Development 49Universities and Research Institutes 49Student Enrollments across Subsectors 50Strengthening Higher-education Faculty 53Allocation for Higher Education in India 53Cost of Higher Education in Universities 53Employment of University Graduates in India 54Higher-education Policies Related to STEM: Skillsets for Future 54Industry–university Interface in Higher Education 56
Technical and Vocational Education and Training (TVET) 56TVET System in India 56Student Enrollments in TVETs across Subsectors 60Higher and Technical Education 60Expenditure on Higher Education in TVET by Government 64Fees and Scholarships 64TVET Employment Patterns 65Industry Involvement in TVET 65Summary and Conclusions 65Comprehensive Vision and Strategy for India 68
References 69
INDONESIA 71Introduction 71Context 72
Education System 73Educational Issues 74
Higher Education and Research Development 77Technical and Vocational Education and Training 79Conclusion 81References 82
MALAYSIA 84Introduction 84Background 84Methodology 88Findings: Organizational Structure for Human Capital Development 90
Systems and Mechanisms for Human Capital Development 90The Approach for Human Capital Development 92Tools and Methodologies for Human Capital Development 92Economic Landscape and Labor Market 93Wages and Productivity 97
Findings: Public Policy, Plans, and Programs 98

PUBLIC POLICY INNOVATION FOR HUMAN CAPITAL DEVELOPMENT | V
National Development Policies and Plans 98Development of Human Capital Policies and Plans 101STEM and TVET Policies, Plans, and Strategies 101
Discussion 105Labor Market Efficiency 105Meeting Supply and Demand 106Supply Quality 109Supply and Demand, Job Creation, and Unemployment 112Governance and Delivery of Human Capital Development Plan 114
Conclusion 117References 118
PHILIPPINES 123Introduction 123Background 124
Population and Demographics 124Philippine Economy 125Labor Market Overview 126Philippine Education System 126
Methodology 127Findings 128
Educational Investment 128STEM Education 132Technical and Livelihood Training and Education (TVET) 135
Discussion 139Philippines and Industry 4.0 139Access 140Quality 141Governance 141
Conclusion and Policy Implications 142References 143
SRI LANKA 145Introduction 145Background 146
The Economy 146Education System 146
Methodology 147Findings 149
Present Education System 149Education Financing 150Competition in Higher Education 152Mainstreaming Vocational Education 153Labor Market Outcomes 156STEM and Future Plans of Education 156
Discussion 158Conclusion 159References 159

VI | PUBLIC POLICY INNOVATION FOR HUMAN CAPITAL DEVELOPMENT
LIST OF TABLES 163
LIST OF FIGURES 164
LIST OF CONTRIBUTORS 166

PUBLIC POLICY INNOVATION FOR HUMAN CAPITAL DEVELOPMENT | VII
FOREWORD
Technological advances today are changing the ways people work in addition to the nature of work itself. Work adjustments in the previous Industrial
Revolution were mostly associated with improvements leading to efficiency gains as well as job creation. However, the current fast-changing disruptive technologies could negatively affect employment opportunities if skill upgrading is not provided to support the evolving demands of the labor market. This could create market failure in the form of technology-driven unemployment, which would require appropriate policy interventions.
Public policy is at the front line in preventing such market failures. It should preempt and avoid future failure and include strategies to mitigate negative impacts on society. Such mitigation efforts require the concerted efforts of all actors in addition to policymakers. In the case of managing the impact of technological disruption, policy interventions in the form of a national reskilling strategy ensuring that workers have opportunities to broaden or deepen existing skill sets to match demand in the emerging labor market are critical. Strategies must also be dynamic to adjust easily to changing labor and training needs. While governments may play the main coordinating and regulatory role, policy must also harness the potential of education and training providers, employers, and unions in the supply of skills. Education and training are central in ensuring all workers to have the basic literacy, numeracy, and generic or foundational technical know-how.
This report examines public policies on human capital development, with special focus on higher education and technical and vocational education and training (TVET) of selected APO member countries. It assesses current public policies on education and human capital at a time of rapid transformation of global industries and offers a basis for rethinking policies on human capital development in line with the changing external environment. Innovative approaches to public investment in human capital development using the science, technology, engineering, and mathematics (STEM) framework are described, and finally recommendations are proposed for future skill management and workforce development in response to technology-driven changes and ongoing structural adjustments.
This compilation contributes to a greater understanding of how public policy on education and employment is oriented in a select group of Asian economies currently. That understanding will be critical for redesigning human capital development policies to cope with rapid global transformations while sustaining productivity growth.
Dr. AKP MochtanSecretary-General

VIII | PUBLIC POLICY INNOVATION FOR HUMAN CAPITAL DEVELOPMENT

PUBLIC POLICY INNOVATION FOR HUMAN CAPITAL DEVELOPMENT | 1
Prof. Yuto Kitamura and Dr. Will Brehm
Disruptive changes to business models will have a profound impact on the employment landscape over the coming years. Many of the major drivers of transformation currently affecting global industries are expected to impact employment, ranging from significant job creation to job displacement, and from heightened labor productivity to widening skill gaps. The changes will be unequally felt both across and within countries, mainly along intersectional lines of race, class, and gender.
There have been a number of global challenges, which the human society needs to overcome. One of the most significant and important challenges is climate change. This is because climate change is perhaps the largest disruption facing the global economy. The World Bank estimates that by 2030, climate change could force an additional 100 million people into poverty; and by 2050, result in 140 million ‘climate migrants,’ i.e., people who are forced to move because of climate change [6, 7]. These numbers are likely to be far higher, given the problems with the World Bank’s absolute poverty line and the narrative on decreasing inequality [2, 3].
One question is whether economic growth is compatible with combating climate change. In recent years, some economists have advanced the theory of ‘green growth,’ which asserts that it is possible to decouple GDP growth from resource use and carbon emissions [8]. This theory purports that it is possible to stall climate change while continuing to grow economies. Such thinking continues the long-held assumption that economic growth is the best barometer of national and global socioeconomic health, the reigning idea of development in the aftermath of World War II. Similarly, William Nordhaus [5], the lead economist on ‘Intergovernmental Panel on Climate Change (IPCC) Report,’ argues that a five-degree increase in global temperature would cost the global economy 5% of GDP by 2100. These types of analyses suggest climate change will have little, if any, impact on global economic growth over the next 80 years.
A growing body of research disagrees with such analyses. The green growth theory, for instance, has been criticized for its assumption that nation states can reduce carbon emissions quickly enough to stall global warming at 2°C above pre-industrial levels. This is the threshold beyond which a global consensus of scientists says climate change will be irreversible and is a goal of the 2015 Paris Agreement [1].
The international system of sovereign states is, however, unlikely to agree and work together to reduce emissions, as the missed targets of the 1997 Kyoto Protocol and Paris Agreement attest. Moreover, it may be too late, regardless of an international agreement. The amount of carbon already released into the atmosphere may, by some estimates, result in 2°C of warming, no matter how nation states respond. Nordhaus’ calculations have similarly been criticized both for the high discount rate he used to calculate the value to existing generations of reducing future carbon emissions and his use of a linear quadratic formula to calculate the ‘damage function,’ i.e., the connection between increases in average global temperatures to declines in GDP [4]. He underestimates the economic damage likely to occur in the future. Calls have thus been made for
INTRODUCTION

2 | PUBLIC POLICY INNOVATION FOR HUMAN CAPITAL DEVELOPMENT
post-growth economies and an emphasis on dedevelopment. Universal basic incomes, four-day work weeks, and Green New Deals have been proposed as possible policy options.
In such a rapidly evolving global landscape, the ability to anticipate and prepare for future skills requirements, job content, and the aggregate effect on employment is increasingly critical for businesses, governments, and individuals in order to fully seize the opportunities presented by these trends and to mitigate undesirable outcomes. It is essential to rethink the connection between education and productivity, which is usually explained through the theory of human capital. This theory assumes that more and better-quality education and skills training will improve the productivity of future workers (using salary as a proxy), which will increase a nation’s GDP. What is the meaning of human capital development in an era of climate change? What is the meaning of a nation’s competitive advantage in the knowledge economy as the global employment landscape changes because of a warming planet? It is essential to find answers to these questions.
What this Report CoversThis report does not specifically address climate change. It does, however, explore the public policies on human capital development, with a particular focus on higher education and technical and vocation education and training (TVET), in a sample of Asian countries. Assessing existing public policies is the first step in rethinking the ideas of human capital and education in a time of climate change. For many years, vibrant capacity in science, technology, engineering, and mathematics (STEM) has been assumed as being pivotal to increasing a nation’s productivity.
(There has been a growing trend of integrating ‘arts’ in STEM and calling it STEAM. It is essential to promote more holistic understanding about nature and society today, and people working in STEM fields need to be aware of the importance of broader perspectives provided by arts and humanities. However, in this report, we use the term STEM, because majority of Asian countries still consider STEM as their priority fields and have not yet widely used the term STEAM in their public policies. Thus, in this report, we intentionally use the term STEM, while recognizing the importance of STEAM.)
In many countries, STEM programs are aimed at advancing a broad-based systemic innovation that sustains education programs as part of focus on human capital development. Given the climate crisis, STEM may become more important in developing the needed technologies to mitigate climate change, if at all possible.
In the Asian region, some countries have made investments in STEM disciplines as a means to boost innovation to help economies grow. However, there are many disparities in terms of results and achievements, and they will have implications on the future skills and workforce development within the framework of human capital development of any country. This posits a great challenge for stakeholders, especially for policy makers, to come up with policies for human capital development to complement other investments and policies to address such challenges. These include boosting productivity and economic progress in the long run that account for climate change.
The report brings together a collection of national case studies that look into innovative approaches in public investment for human capital development, analyze their role in determining overall development, and provide recommendations to develop and manage the future skills requirement within the framework of human capital development across APO member countries. The countries
INTRODUCTION

PUBLIC POLICY INNOVATION FOR HUMAN CAPITAL DEVELOPMENT | 3
presented in this report include India, Indonesia, Malaysia, the Philippines, the Republic of China (ROC), and Sri Lanka. National experts were recruited by the APO to undertake each country report while two chief experts, Prof. Yuto Kitamura and Dr. Will Brehm, coordinated the overall project for this report.
A coordination meeting was held in Colombo, Sri Lanka in December 2017, where a common research framework was developed. Country-wise reports were developed as individual chapters of this report. These chapters follow the introduction.
The report aims to look into the innovative approaches in public investment for human capital development using STEM as the framework in the selected APO member countries, and come up with recommendations that will develop and manage the future skills and workforce in response to the technology-induced changes and structural adjustments that are taking place due to global warming. The remaining part of this introductory chapter reviews key themes of the country reports.
The next section looks at the context of work and employment in the selected countries. Reading across the cases, this section highlights issues related to technology, migration, and demographics. Following this section, the organization of education systems is explored across the countries. Issues of higher-education massification and investment characteristics are highlighted. The introduction concludes with brief remarks on the ways forward, including an embrace of progressive policies that both protect and prepare future citizens.
The Changing Context of Work and Employment Countries across Asia are experiencing changes to work and employment. These changes are not uniform, given the diversity of countries in the region. Some countries rely on low-skill employment while others are fully integrated into the knowledge economy where workers demand high-wage jobs.
As the global economy changes, competing pressures on human capital development are felt by countries, which require different responses. Some countries are experiencing low wages and minimal benefits for workers despite a strong focus on preparing youth for the knowledge economy. Pressure comes from the global labor supply. Workers from some countries like PR China flood neighboring labor markets, such as in the ROC, putting a negative pressure on wages. This decreases the wages overall and forces many Taiwanese graduates to pursue jobs overseas. In other countries, such as the Philippines, many students enroll in STEM courses with the belief that they will get a good job after graduation. They are inevitably disappointed since few STEM-related jobs exist. As such, the country has had to embrace and support graduates to move to non-STEM jobs, which creates new pressures for graduates who did not enroll in such courses. These differences demand that countries take different approaches to human capital development.
Social changes also impact economies, altering who is available to work and where. Aging populations with low birth rates mean that people have to work longer, well into what was generally considered the retirement age. It also means that educational institutions have more seats than students. This has consequences for higher-education institutions in particular, which are seeing declining enrollment rates and where closures or mergers will be necessary. On top of these pressures, aging populations demand new public policies on elderly care and state’s responsibility toward citizens who cannot be productive any longer. Unlike youth, support for elderly populations
INTRODUCTION

4 | PUBLIC POLICY INNOVATION FOR HUMAN CAPITAL DEVELOPMENT
requires using a logic beyond economics. Plus, youth must sacrifice more time and money to support ageing populations, thus changing normative assumptions of quality of life.
In young populations, by contrast, there is a pressure to increase educational access while maintaining quality. Can education system grow fast enough to meet demand? And will the education system meet expectations? Addressing these questions requires effective policy and planning. On top of these education-system issues, states with young populations need to develop social-welfare systems to support citizens and produce workers over a life cycle. Urbanization is a common phenomenon in many countries with young populations, as individuals decide to abandon agrarian lifestyles for better-paid city jobs. How this process unfolds will directly impact social justice and equity, along with massive changes to national economies.
The impact of demographics and economic changes require, to a large extent, an effective state capacity. States where corruption is rife will be unable to manage the changes well. States starved of effective systems and capable personnel will similarly be unable to oversee the public policies needed for their specific contexts. In particularly large countries, such as India, the state has a difficult task of managing a diverse population spread across different environments, climates, and lifestyles. One public policy may not work for the entire population. Focusing on social justice and equity in these environments is paramount.
Education System’s Organization The specific organization of the education system will be vital to manage the current and future changes to society and economies. Cultivating creativity through schools will enable people to manage the changes. Investing resources in targeted areas will construct national societies capable of mitigating the negative consequences of climate change. Finding the right balance between higher education and technical and vocational education and training (TVET) will maximize human capital development.
One of the biggest issues impacting the education systems in Asia is the massification of higher education. As a natural outcome of ‘Education for All’ (EFA) and the international focus on increasing access to education, enrollments in higher education have grown over the past few decades across Asia. Significant increase in educational access across Asian countries has been realized because of continuous economic growth in the region as well as international goals such as EFA and Millennium Development Goals (MDGs), which have encouraged donor countries and multilateral agencies to provide the required assistance to developing countries.
Based on the logic of human capital, students act rationally when they enroll in higher education. More education is believed to provide access to better jobs with higher salaries. However, as everyone in a country obtains higher-education degrees, the value of a credential decreases. Jobs never requiring a tertiary degree all of a sudden do. This pressure further contributes to the massification of higher education and puts downward pressure on wages. A degree in higher education no longer guarantees entry into the middle class.
The massification of higher education is both an opportunity and a problem. In Sri Lanka and the ROC, it is seen as a problem because peer-pressure pushes students away from TVET and other life choices. Families struggle to pay for tertiary education, much of which is of low quality and does not guarantee a good job. In other countries, it is perceived as an opportunity, with public policy
INTRODUCTION
PUBLIC POLICY INNOVATION FOR HUMAN CAPITAL DEVELOPMENT | 5
providing more state funding. Most of the contemporary landscape of higher education is a result of each nation’s history, which further dictates public policy.
Investment in education systems is a good indicator of a nation state’s human capital priority. Some countries in Asia have done high investments in TVET while others have low investments. Some prioritize higher education, while others use limited funds to support lower levels of education. Whatever the public-policy calculation, there are some similarities. Although most countries understand the value of TVET, it is common that TVET suffers from a poor reputation. Students, generally speaking, prefer to go to a university than to a TVET institute. TVET is seen as a lower-class or lower-quality type of education. This is certainly not true, but ministry officials and post-secondary educators struggle with these commonplace perceptions.
Ways Forward This report makes a contribution to understanding the ways in which public policies towards education and employment are currently oriented in a select group of Asian nation states. Such insights set up policy makers to learn from one another as they begin the difficult process of addressing climate change. Based on the country reports presented in the next chapters, it is clear that the concept of human capital must be rethought in terms of postgrowth and dedevelopment. Perpetual economic growth will not be possible in our finite world. Continuing to grow the global economy will have negative effects on both, the climate and the people. In a carbon-neutral world, what would human capital look like?
Although this report does not address these limits to growth explicitly, it does detail some interesting public policies that could be considered as starting points. Some countries have developed systems of free higher education. This is an important step away from the commonplace assumption that the cost of higher education should be shouldered by individuals and not the state. If human capital development is not only for economic growth, then perhaps the state does want to invest in its citizens to be critical thinkers. Similar arguments could be made for free TVET programs. This rethinking of the value of higher education forces policy makers to utilize logic beyond cost-benefit analyses.
Other innovative policies found in the country chapters are actually quite old. Developing systems of universal healthcare and minimum wages could actually promote human capital development. Ensuring quality life through welfare benefits will be an essential element in the changing global economy. Protecting workers through labor laws will be essential for equitable growth. Moreover, beginning to think through concepts like universal basic incomes, which none of the chapters ahead mention, could be another innovative public policy that a country should consider. Doing so frees people from the pressure of finding employment, thereby cultivating a sense of creativity and freedom. This may be exactly what the global economy needs as it begins to come to terms with climate change.
References [1] Hickel J., Kallis G. Is Green Growth Possible? New Political Economy; 2019.
10.1080/13563467.2019.1598964.
[2] Hickel J. Is global inequality getting better or worse? A critique of the World Bank’s convergence narrative. Third World Quarterly 2017; 38(10), 2209–22.
INTRODUCTION

6 | PUBLIC POLICY INNOVATION FOR HUMAN CAPITAL DEVELOPMENT
[3] Hickel J. Global Inequality may be much worse than we think. The Guardian; 2016. https://www.theguardian.com/global-development-professionals-network/2016/apr/08/global-inequality-may-be-much-worse-than-we-think.
[4] Keen S. The Cost of Climate Change: A Nobel Economist’s Model Dismantled. Evonomics; 2019. https://evonomics.com/steve-keen-nordhaus-climate-change-economics/.
[5] Nordhaus W.D. Climate change: The ultimate Challenge for Economics. Nobel Lecture in Economic Sciences, presented at Stockholm University, 2018. https://www.nobelprize.org/uploads/2018/10/nordhaus-slides.pdf
[6] The World Bank. Groundswell: Preparing for internal climate migration. Washington, D.C.: The World Bank; 2018.
[7] The World Bank. Shock Waves: Managing the impacts of climate change on poverty. Washington, D.C.: The World Bank; 2016.
[8] The World Bank. Inclusive green growth: The Pathway to sustainable development. Washington, DC: The World Bank; 2012.
INTRODUCTION

PUBLIC POLICY INNOVATION FOR HUMAN CAPITAL DEVELOPMENT | 7
Prof. Chuing Prudence ChouProfessor
National Chengchi University (NCCU)
Phillip L. HendersonNational Chengchi University
Jonathan SpanglerAsia-Pacific Policy Research Association, Taipei
Introduction Investment in the development of human capital is one of the most effective ways to promote a country’s continued economic growth and social equity. For the Republic of China (ROC), this is especially true as it faces new challenges such as slowed economic growth, an aging population, human capital flight, shifting economic and industrial priorities, and other issues as addressed in this country report.
The broad focus of this chapter is public policy innovation for human capital development in the ROC. In particular, it investigates key issues related to the promotion and implementation of science, technology, engineering, and mathematics (STEM) education and technical and vocational education and training (TVET) for the purposes of cultivating human capital. It begins with an overview of the relevant historical context; the demographic changes affecting the society; and the economic, educational, and public policy landscape in terms of developing human capital. Official government statistics and relevant industry and economic indicators are used to shed light on wide-ranging public policy and human capital issues affecting the ROC’s economy, institutions, and people. These are synthesized to address the following research questions: Which institutions and programs exist to promote STEM education, TVET, human capital development, and productivity in the ROC? Which key challenges do these initiatives try to address? How successful have these initiatives been at promoting human capital development and productivity?
The findings presented in this study address three major themes: organizational structures tasked with human capital development; related public policies, plans, and programs, especially for promoting STEM and TVET education; and the emerging human capital needs and skills prioritized by the government, industry, and civil society. Based on the findings, the report then discusses the key challenges faced and the local responses to these challenges. Broadly speaking, the responses have aimed to foster interest in STEM, improve existing TVET programs and implement new ones, facilitate twenty-first century skills in education, and attract and retain highly skilled domestic and foreign talent. The report concludes by highlighting important lessons learned and offering recommendations for policy makers and industry leaders.
REPUBLIC OF CHINA

8 | PUBLIC POLICY INNOVATION FOR HUMAN CAPITAL DEVELOPMENT
Background Human capital plays an important role in the economic development of countries around the world [1]. The ROC, for its part, has long placed a heavy emphasis on education, which has been a key aspect of its rapid social and economic progress for over half a century [2]. This focus has persisted through several different historical eras and continues to this day through government policies and other programs for promoting STEM education, TVET, and human capital development more broadly. To effectively engage with issues related to human capital development and productivity in the ROC and serve as a foundation for the subsequent sections in this report, this section provides an overview of the relevant historical context; the demographic changes affecting the society; and the economic, educational, and public policy landscape related to human capital development in the ROC.
Recent history has brought about a series of major political upheavals in the ROC. At the end of the Japanese colonial era from 1895 to 1945, the island was ceded to the ROC, which was embroiled in a struggle for the Chinese mainland. Following defeat by communist forces in the late 1940s, the ROC government and about two million nationalist supporters, soldiers, and others fled the mainland to the ROC. The ROC remained under Kuomintang (KMT) single-party rule through the end of the martial law era in 1987. The 1990s were a pivotal era for the ROC as it liberalized and democratized, developing an active civil society, which continues to play an important role in the ROC’s political context today. Throughout this history of momentous political changes, education and human capital development have remained a key focus for the Taiwanese society and its various governing authorities. Education has contributed in a major way to its national economic development, helping it to be recognized as one of the four Asian tigers, along with Hong Kong, Singapore, and the Republic of Korea (ROK) [3]. Rapid industrialization led to the ROC’s emergence as an advanced economy between the 1960s and the 1990s, and today it grapples with many of the same challenges facing other highly developed countries in Asia, Europe, and North America.
Having seen three peaceful transitions of power between democratically elected leaders, the ROC is now widely recognized as a mature democracy [4]. Moreover, its thriving civil society has come to play an influential role in the formulation of policy related to political, economic, and social issues. In all democratic societies, there can be friction between what the people want and what the government thinks is good for development. Taiwanese policy makers have to contend with the will of the Taiwanese people, which does not always neatly coincide with the policies intended to foster human capital development and spur economic growth.
The rapid economic growth that the ROC has enjoyed since the late 1970s gradually transformed the island’s manufacturing-based economy into an increasingly high-tech and knowledge-based economy. Having previously been concerned mainly with industrial manufacturing, the ROC, like the other three Asian Tigers, followed Japan’s economic leadership during this period. During that time and later, the ROC gained a reputation for highly efficient investment, a trend that was explored by many scholars in the 1990s [5]. For this reason, high expectations are placed on return of investments of any kind on the island. Legislation related to public spending and investment is, as a result, often highly scrutinized for accountability and expected to produce results quickly. The ROC, Singapore, the ROK, and Hong Kong invested heavily in human capital over these decades through public, private, and household spending on various forms of education and training. That said, public spending on education was significantly lower in the ROC than the other three Asian Tigers, though it was still successful in terms of economic development [5].
REPUBLIC OF CHINA

PUBLIC POLICY INNOVATION FOR HUMAN CAPITAL DEVELOPMENT | 9
However, this rapid and unprecedented rate of economic growth could not last. The Asian financial crisis of the 1990s coincided with the slowing of the Taiwanese economy, which has since stabilized at a rate consistent with other countries at a similar level of development. The subsequent global financial crisis of 2008 may have reinforced this relative slowdown and encouraged a number of austere business practices that persist to this day. Wages, for example, have stagnated for many years in most of the ROC’s key industries, especially for young professionals in nascent careers.
Low wages in the ROC are also coinciding with a high demand for labor of almost every kind. Unskilled labor requirement is often filled by migrant workers, but the slow drain of its most talented young graduates to Chinese firms in tech centers such as Shenzhen and to enterprises in other foreign countries around the world, coupled with an alarmingly low birth rate, is exacerbating an already severe shortage of young and capable human capital. Overseas companies in PR China, the USA, and elsewhere tend to offer better pay and benefits to new graduates than do Taiwanese firms, and many of these businesses covet well-educated Taiwanese graduates.
Over the course of the ROC’s recent history, through the Japanese colonial era to this day, education has been prioritized by governments and Taiwanese citizens. The imperial Japanese government, during the first half of the twentieth century, tried to promote education at primary and secondary levels and established Taihoku Imperial University (known today as National Taiwan University) in 1928. After the island was ceded to the ROC in 1945 and the Taiwanese government relocated from PR China to the ROC in 1949, education continued to be a primary consideration, particularly because of its importance in promoting national economic development. Yet by 1950, there were still only seven higher education institutions (HEIs) in the country with a total enrollment of 6,665 students [6]. In the years that followed, Taiwanese education continued to expand under the authoritarian rule of the KMT, which focused heavily on the economic development of the island. In 1968, the Taiwanese government instituted nine-year compulsory education [7], which was extended to twelve years of guaranteed education in 2014 [8]. The 1990s saw an explosion in the number of HEIs in the ROC. This was largely influenced by demands of civil society for universal access to higher education. There are over 150 HEIs today for a population of 23.34 million.
The four democratically elected administrations of Lee Teng-hui with the KMT, Chen Shui-bian with the Democratic Progressive Party (DPP), Ma Ying-jeou with the KMT, and Tsai Ing-wen with the DPP have all made education and human capital development a top priority. Today, the government continues to do so and has enacted legislations and reforms to improve Taiwanese human capital and improve productivity in various ways. Since 2014, the expressed goals of the Ministry of Education (MOE) through 2023 have been to reorient the education system to address the changing needs of contemporary Taiwanese and global societies. Specifically, reforms target four domains: preparing more outstanding and dedicated professional teaching personnel, narrowing discrepancies between schooling and the job market, strengthening students’ international competitiveness, and empowering students’ future productivity [6].
Today, the ROC hosts an active civil society and an engaged electorate. For this reason, policymakers must respond to the demands of their constituents, which at times can give the appearance of a volatile and haphazard policy agenda. Policymaking related to education and human capital development is no exception. Economic development still takes priority in national policy making, but there is an increasing focus on social, cultural, and other issues. Policies such as the New Southbound Policy initiated by the Tsai administration are characteristic of DPP attempts to liberate the ROC’s economic destiny from the sphere of the PR China’s influence. The two principal parties
REPUBLIC OF CHINA

10 | PUBLIC POLICY INNOVATION FOR HUMAN CAPITAL DEVELOPMENT
have competing priorities, particularly with regard to PR China. Whereas the KMT tends to see China as an economic partner, DPP supporters typically view closer relations with the PRC as a serious threat to the ROC’s economic and national security in the future. This is not uniformly true, but the division is enough to prompt opposing and often confrontational policy decisions, leading to inconsistency in the policies implemented during different administrations. PR China and cross-strait relations remain a serious consideration when making policy decisions of any kind, as does the fact that the ROC is still barred from participating in most international organizations due to the Chinese pressure on those institutions.
Methodology Official government statistics and relevant indicators from both academic and media sources are used to shed light on public-policy and human-capital issues affecting the ROC. Primary government sources include official publications such as The Republic of China Yearbook 2017, an annual publication released by the Executive Yuan (executive branch of government) that covers a wide variety of demographic issues related to the ROC’s domestic society and relations with other countries [9]. Other publicly available government sources, including policy documents, statistical indicators, and relevant whitepapers, are also used to provide empirical evidence supporting the findings and discussions in the following sections. Given the ROC’s commitment to make government data open and accessible to the public [10], documents released by government agencies and programs related to public policy innovation and human capital development are updated regularly and contain detailed information about organizational structures, funding, and procedures. All of these sources are used to illuminate the extent of the Taiwanese government’s involvement in human capital development.
Academic and media sources are then used to evaluate the impact of these public policies aiming to promote STEM education, TVET, and the development of human capital more broadly in the ROC. Scholars have been involved in this endeavor since the ROC’s rapid economic growth began. Where needed, insights are drawn from studies going back to the late 1990s, regarding educational reform policies and investments in human capital development. Media sources, which have compiled data and conducted interviews with industry representatives, are used to gain insights where otherwise unavailable.
All sources are synthesized in the discussion section, where the key challenges facing human capital development in the ROC are identified, and local responses to these challenges and policies are evaluated. Lessons learned from the history of human capital development are highlighted, and policy recommendations are then offered related to domestic policy innovation to address relevant challenges. Although the findings of this report are not comprehensive, they are intended to illuminate the larger picture of human capital development in the ROC. The most influential organizational structures, policies, plans, and programs have been considered and evaluated, based on the above sources; and challenges, responses, and recommendations that are identified are based on them.
Findings The ROC has placed great emphasis on human capital development through various means, including STEM education and TVET. Its economic development over the years is the evidence that the country has been remarkably successful in this regard, suggesting that there are important
REPUBLIC OF CHINA

PUBLIC POLICY INNOVATION FOR HUMAN CAPITAL DEVELOPMENT | 11
lessons to be learned from the Taiwanese experience. Even so, given the wide range of relevant policy options, optimizing human capital development based on the context of a society and the resources available to it is no simple task. The findings presented in the following subsections address three major themes: organizational structures tasked with human capital development; related public policies, plans, and programs, especially for promoting STEM and TVET education; and the emerging human capital needs and skills prioritized by the government, industry, and civil society.
Organizational Structures The ROC has a democratic but relatively centralized political structure, and government agencies are the most influential actors involved in promoting human capital development. The most prominent governmental actors include the Executive Yuan, Ministry of Education, Ministry of Science and Technology, Ministry of the Interior, Ministry of Labor, Ministry of Economic Affairs, and National Development Council. These agencies, either independently or in collaboration with relevant partners, are each responsible for managing programs related to different aspects of human capital development in line with their institutional aims. Figure 1 shows the relationships among the agencies discussed in the following subsections.
Executive Yuan The Executive Yuan wields the authority to set the policy agenda for many of the governmental organizations concerned with human capital development. The current Tsai administration generally falls in line with the policy platform of the DPP, which gravitates toward a few general predispositions, including a shift of focus away from PR China (sometimes coupled with the rhetoric of independence), a domestic policy that appeals to Taiwanese sense of cultural and social identity, and social issues such as equality and workers’ rights. The Tsai administration, however, was elected on less divisive, more centrist attitudes toward many of these issues [11]. Regarding human capital development, the Tsai administration and its predecessors, including both KMT- and DPP-led administrations, have set up myriad programs, investment funds, and policies (both long- and short-term) to address the need for developing human capital in the ROC. This remains one of the key concerns of the Executive Yuan, as improving human capital development through education and training, and strengthening productivity in key sectors of the economy is a major demand of Taiwanese voters, industry, and workers [12].
AGENCIES AND INSTITUTIONS INVOLVED IN HUMAN CAPITAL DEVELOPMENT.
FIGURE 1
Ministry of Education
Ministry of Science and Technology
Ministry of the Interior
Ministry of Labor
Ministry of Economic A�airs
Ministry of Health and Welfare
National Development Council
Executive Yuan
Department of TVE
K-12 Administration
National Immigration Agency
Workforce Development Agency
Department of Human Resources Development
Source: Adapted from Executive Yuan (2016).
REPUBLIC OF CHINA

12 | PUBLIC POLICY INNOVATION FOR HUMAN CAPITAL DEVELOPMENT
Ministry of Education The Ministry of Education (MOE) is responsible for a wide range of policies and institutions related to academic education at all levels, professional training, and human resource development. Like all ministry-level government agencies in the ROC, it is under the Executive Yuan and its minister is appointed by and reports to the President. In terms of promoting STEM and TVET education specifically, it has enacted or been tasked with implementing various policies and programs. The most notable of these include the comprehensive primary and secondary education system; TVET programs in high schools, middle schools, and junior colleges; programs for strengthening Taiwanese universities and institutions of higher education; and initiatives like the Forward-Looking Infrastructure Development Program. These are either directly managed by MOE or under the auspices of the Department of Technological and Vocational Education, the K-12 Administration, or other subordinate agencies.
Legislation and activities for which human capital and productivity is a primary focus include the Youth Employment Program, the Intelligent the ROC Manpower Cultivation Project, and the Taiwanese education system in general. Although human capital is a priority, the education system for any country also serves the less tangible purpose of nurturing the intellectual and social wellbeing of young citizens, and even when a given policy or program does not specifically mention STEM, TVET education, or human capital development, it may serve to benefit these in indirect but nevertheless important ways [13].
Ministry of Science and Technology The Ministry of Science and Technology (MOST) is responsible for the promotion of science and technology development by linking industrial development more closely with scientific research. In the realm of STEM and TVET investment, MOST is primarily concerned with the facilitation of research and development with programs such as the National Science and Technology Development Fund and the Taiwan Silicon Valley Tech Fund (which it manages in cooperation with the National Development Council). Activities specifically devoted to the promotion of science education include the “Sci-Tech Vista” website, Science Development magazine, and programs such as the High Scope Project (HSP). More generally related to human capital development, MOST provides scholarships to foreign university students interested in an education in the ROC. Overseas students have the potential to contribute to human capital development domestically by strengthening and diversifying the local academic environment as well as becoming employed in the ROC after graduation [14].
Ministry of the Interior The Ministry of the Interior (MOI) is responsible for a range of different tasks related to infrastructure, law enforcement, immigration, and civil services. Of these, the regulation of immigration is the one most related to STEM education and TVET. The National Immigration Agency (NIA) under MOI is authorized by the Nationality Act to allow foreign professionals in certain fields to obtain temporary or permanent resident status or even become naturalized citizens of the ROC [15]. The NIA has also submitted an amendment to the Immigration Act with the aim of retaining more foreign talent. The NIA is also involved in policymaking and other programs more generally related to the development and acquisition of human capital. Through the NIA, the Taiwanese government assists in the integration of recent immigrants, through programs such as the Overseas Empowerment Program for Children of New Immigrants, which encourages children of immigrants to the ROC to connect with the extended families in their parents’ (usually the mother’s) home country. Other policies are in line with the goals of the New Southbound Policy, such as the recent amendment of the Online Application for ROC Travel Authorization Certificate
REPUBLIC OF CHINA

PUBLIC POLICY INNOVATION FOR HUMAN CAPITAL DEVELOPMENT | 13
of Southeast Asian Countries, which makes it easier for nationals of Cambodia, India, Indonesia, Lao PDR, Myanmar, and Vietnam to apply for a travel authorization certificate from the ROC [16].
Ministry of Labor The Ministry of Labor (MOL) performs a large number of government functions related to the Taiwanese workforce. As with all ministerial agencies in the ROC, the expressed goals of MOL are tied to the policy agenda of the incumbent administration, currently led by President Tsai and the DPP. As of now, these goals are centered on labor interests such as employment services, safety, and pensions, but the first goal stated on the MOL website is to “promote and implement diverse vocational training programs, and encourage industries to apply occupational competency standards” [17]. Principal among the agencies associated with these goals is the Workforce Development Agency (WDA), which offers vocational training for the unemployed and regulates numerous skill certification trainings.
The MOL also participates in international organizations related to labor and labor development as much as it is able to, given the obstacles presented by the context of cross-strait relations. Due to Chinese pressure on the UN and other international organizations to not allow Taiwanese involvement, however, the ROC and MOL have limited capacity to do so. Four organizations that the ROC works with in some capacity are the International Labor Organization (ILO), the World Trade Organization (WTO), the Asia Pacific Economic Cooperation (APEC), and the Organization for Economic Cooperation and Development (OECD) [18]. Participation in each of these organizations must be done on an informal, observer, or other limited basis, as anything more is seen by Beijing as a violation of the Chinese claim to sovereignty over the ROC.
Ministry of Economic Affairs The Ministry of Economic Affairs (MOEA) is responsible for promoting sustainable and innovative economic development in the ROC through a number of programs and agencies as well as a few national corporations. As for those related to human capital development on the island, MOEA engages in many initiatives including the Contact Taiwan Program, Youth Entrepreneurship Program, International Entrepreneur Initiative Taiwan, and Taiwan Productivity 4.0 Initiative. These and other programs are typically handled through the ministry’s Industrial Development Bureau, the Department of Investment Services, and other administrative entities. Although the MOEA itself does not engage specifically in the promotion of TVET and STEM, it is one of the most influential top-level agencies engaged with human capital development in general, and its programs and policies effect STEM and TVET indirectly [19].
National Development Council The National Development Council (NDC) serves mainly as “the chief of staff for the Executive Yuan for policy coordination and implementation” [20]. In 2014, the NDC superseded the Council for Economic Planning and Development (CEPD), which had previously been responsible for equivalent aspects of the policy process. More recently, the Tsai administration has made ten explicit priorities for the NDC, most of which focus on the evaluation of existing policies for maximum efficiency and facilitating further growth in the industries comprising the 5+2 Industrial Innovation Plan in the ROC. The priorities include the internet of things, biomedical, green energy, smart machinery, and defense; high-value agriculture; and the circular economy. Regarding STEM and TVET development in the ROC, the NDC oversees programs and agencies such as Contact Taiwan, the Head Start Taiwan Project, and the Asian Silicon Valley Development Plan. More generally, the NDC promotes human capital development through its subordinate agency, the
REPUBLIC OF CHINA

14 | PUBLIC POLICY INNOVATION FOR HUMAN CAPITAL DEVELOPMENT
Department of Human Resources Development, which projects population and employment trends and coordinates a variety of policies related to “population, education, vocational training, employment, international talent, and elderly economic security” [20].
Other government-funded or operated organizations involved in the productivity and human capital are the Ministry of Health and Welfare, the Science and Technology Advisory Group, the Ministry of Culture, the Ministry of National Defense, and Academia Sinica. The various government organizations, agencies, and ministries mentioned in the subsections above do not constitute an exhaustive list, but they do highlight the key government actors involved in human capital development and offer a foundation for researchers interested in further understanding the roles of these various institutions.
Non-governmental Institutions While government agencies remain the most influential and most highly funded actors in the Taiwanese system, there are some non-governmental institutions that play important roles in promoting human capital development through STEM education, TVET, or other means. Although an exhaustive list of such institutions is beyond the scope of this chapter, two that are worth highlighting include the Industrial Technology Research Institute (ITRI), and the Epoch Foundation. ITRI is a non-governmental research and development institution in the ROC from which over 270 companies have emerged. Generally, ITRI focuses its research in the areas of “Smart Living, Quality Health, and Sustainable Environment” [21]. The Epoch Foundation is a strategic partnership between industry, research institutions, academia, and government; with the express goals of promoting the industrial development of the ROC and the economic prosperity of the Asia-Pacific region more broadly. The foundation is engaged in a number of projects related to entrepreneurship and innovation education, including Young Entrepreneurs of the Future, the Epoch Internship Program, the Search for Talent Program, and Entrepreneurial Training for Mainland Returnees [22].
Private investment is also an important contributor to overall human capital development in the ROC. Through the promotion of STEM education, TVET, and education more broadly, private investment by individuals and households as well as investment in various programs by local and foreign companies and others in the business community all contribute to the creation and strengthening of human capital in the country.
The ROC is particularly unique in that household spending on education is one of the world’s highest. Taiwanese parents spend more on their children’s education than all but four of the world’s nations according to a report by HSBC. The report, titled The Value of Education, claims that an average of USD56,424 is spent on every Taiwanese child, a figure behind only Hong Kong, the UAE, Singapore, and the USA [23]. The high amount of spending can be attributed to several factors, including private primary and secondary school tuition and fees, after-school programs called buxiban, and college expenses such as tuition, fees, books, and accommodation.
Taiwanese businesses are also spending more money on training and coaching employees, but many outsource such activities to specialty training and certification firms [24]. Several foreign companies have also made major contributions to human capital development in the ROC. A prime example of this is Google, for which the ROC is its “largest R&D center in Asia” [25]. The company has contributed large amounts of financial resources to relevant programs over the years, including committing in 2018 to “train 50,000 Taiwanese businesses and students in digital marketing over the next year through a combination of online and offline initiatives” and “holding a train-the-
REPUBLIC OF CHINA

PUBLIC POLICY INNOVATION FOR HUMAN CAPITAL DEVELOPMENT | 15
trainers program for teachers in locations across the ROC … to educate a new generation of Taiwanese students in AI” and machine learning [26]. Other prominent foreign businesses that have invested in human capital development in the ROC include Microsoft, which has launched an AI R&D center; and Amazon, through its investment in a “joint innovative center” [25].
Public Policies, Plans, and Programs In recent years, many public policies, plans, and programs with the aim of encouraging human capital development in the ROC have been proposed and implemented. These are managed by various government agencies and institutions, as highlighted above, and have varying timeframes. Some have been completed while others are ongoing. Although the overall agenda of the Taiwanese government is set by the current administration, many individual programs and policies that remain in effect were put in place by previous administrations. For the purpose of coherent discussion, this report sorts them into four categories: policies, plans, and programs for promoting the STEM fields in Taiwanese businesses and education; those facilitating the development of TVET; those concerned with developing entrepreneurial skills and opportunities; and those that support human capital development in general.
STEM Universities are responsible for the bulk of STEM developments in the ROC, both in terms of human capital development and R&D. According to the statistical yearbook released each year, 1,309,670 individuals were enrolled in higher education programs in the ROC in 2016–17, 545,601 of whom were in STEM-related fields [9]. Problematically, STEM programs in Taiwanese HEIs struggle to gain international recognition, and the Taiwanese government has initiated the Aim for the Top University Project with the intended result of elevating at least one institution into the top 100 universities in the world. Many of the universities targeted by this program, which involves five-year plans for institutions receiving funding, have created offices specifically related to using that funding to improve their institutions [27]. Another plan, the Multi-Star Project gives students the opportunity to apply for admission to STEM university programs through means other than the examination. It has been seen as a successful program in spite of initial backlash, and ‘Star’ students, as they are sometimes called, tend to reach high levels of achievement [28]. However, alarmingly low birthrates in the ROC have become an existential threat to many HEIs, a problem that is discussed further below.
The current National Science and Technology Development Plan (S&T Plan 2017–20), which occurs every four years, focuses on four major goals, one of which specifically targets human capital development, aiming to “foster and recruit talent with diverse career paths.” To address this goal, the plan references the digital economy as its major focus, while also aiming to support the highlighted “5+2 industries,” and explicates the following four specific strategies:
1. Foster interdisciplinary talent in the digital economy.
2. Reinforce technical expert training mechanisms for industries.
3. Diversify career paths to invigorate the cultivation of high-caliber scientific research professionals.
4. Recruit and retain international top talent [29].
REPUBLIC OF CHINA

16 | PUBLIC POLICY INNOVATION FOR HUMAN CAPITAL DEVELOPMENT
The Taiwan Productivity 4.0 Initiative results from the same policy motivations, and targets eight sectors in Taiwanese industry, including agriculture, food manufacturing, information technology, logistics, machinery equipment, retailing, textile, and transportation [30]. The program promotes human capital development by cultivating experience and talent through cooperation between domestic industries and academic institutes, interdisciplinary learning, and international linkages [31].
TVET As mentioned previously, the promotion of TVET in the ROC is largely managed by MOE through the implementation of relevant programs in middle schools, high schools, and junior colleges. Students seeking a vocational education have a number of pathways available to them, and specific opportunities may depend on what educational resources are available in their community. One option is a comprehensive junior-senior high school, which combines middle school and high school and contains both vocational and academic tracks. Students attending these schools have the choice of having either of the two tracks or pursuing a combination track mixing academics and vocational training. Typically, though, students opt for only one of the two tracks. Upon graduation from middle school, students in the vocational track are presented with the option of going for a three-year vocational secondary school, where they choose a specialty such as engineering, business, or fine arts; or advance immediately to a junior college offering a five-year program, after which they can obtain the equivalent of an associate’s degree. The other option, a three-year vocational secondary school, also enables students to go to junior college, where they can enter a two-year program resulting in the same associate-level degree.
It should be noted that none of the above options lock a student into a particular track for the entirety of their education. After completion of the junior college track, for example, students can go to a two-year technical institute, or even decide to transfer to a four-year university. Although attention has been focused more on expanding access to four-year programs in recent decades, especially in STEM fields, some attention has begun to shift back toward TVET in the ROC, as can be seen by projects such as the Forward-Looking Infrastructure Development Program [8]. Broadly, the program’s goals are to increase government investments in “green energy, digital infrastructure, water environments, rail systems, and urban and rural development,” [12] but the program also includes a special section related to human capital development, which includes investment in childcare, food safety, and “development of human resources to create jobs” [12]. Part of the investment (NT$8 billion between 2017 and 2021) attached to this program is bound for the MOE, which will allocate it to vocational colleges and universities to “optimize environments for Job Ready Skills Programs” [32].
Entrepreneurship Skills and opportunities associated with entrepreneurship are among the top priorities in terms of developing human capital in the ROC. A few of the most important initiatives associated with these goals are the Innovation and Startups Taskforce, the Taiwan Innovation and Entrepreneurship Center, and the HeadStart Taiwan Program. The Innovation and Startups Taskforce is an organization under the Executive Yuan and administered through the NDC, which works in collaboration with the HeadStart Taiwan Project and the Asia Silicon Valley Development Agency to promote entrepreneurial ventures in the ROC, especially those related to STEM. By the beginning of 2016 (two years after its establishment), the task force had overseen the allocation of over USD303 million in investment of Taiwanese businesses [12]. The Taiwan Innovation and Entrepreneurship Center was established by MOST in partnership with well-known ‘accelerators’ in Silicon Valley and venture capital groups. The center’s three stated purposes are to link Taiwanese startups to the
REPUBLIC OF CHINA

PUBLIC POLICY INNOVATION FOR HUMAN CAPITAL DEVELOPMENT | 17
global market, set up the Tai Si investment fund, and establish the Taiwan Rapid Innovation Prototyping League for Entrepreneurs (TRIPLE). The HeadStart Taiwan Project, created in 2014, employs a three-fold strategy of deregulation, building of support structures for startups and entrepreneurs, and attracting foreign investment [33].
Human Capital Development in General Investment in human capital development is recognized as a vital activity for national competitiveness and prosperity in the ROC, both by individuals and the society at large. Investment in education and training is as much a priority across the rest of the society as it is for sectors related to STEM, vocational, and technical fields. These programs are typically well funded and tend to enjoy enthusiastic participation from their participants. Since 2014, twelve years of education has been available to all by law [34], but students enjoy a significant degree of choice within that period of compulsory education during which resources are available. As mentioned above, there are two tracks, vocational and comprehensive, that students can choose to take. Each of these tracks lead students to careers or additional educational opportunities and allows enough flexibility for students to change tracks at certain points. Students at comprehensive schools receive a broad, liberal arts-style education that prepares them for a four-year bachelor’s program in the university [35].
Beyond the national primary and secondary education system, other programs and policies, such as the Youth Education and Employment Programs, were initiated to promote young Taiwanese people’s opportunities to broaden their education. One program, in particular, allows students interested in pursuing a trade skill before entering higher education to apply for an education and employment savings account. Accepted applicants receive NT$5,000 per month from the MOE and the MOL each for up to three years while they learn a trade [36]. Another program, the Intelligent Taiwan Manpower Cultivation Project was implemented between 2009 and 2016 to improve equity in literacy and IT education, ensure quality and access to vocational education, and cultivate a “world-class” higher education system [37].
In order to attract and retain more talent, the NDC created the Contact Taiwan Program in 2015. The program created a recruitment services center with both a physical office and virtual platform, which connects foreign experts to employment in the ROC and vice versa. The program also works to improve conditions for foreign talent working in the ROC by advocating for easing of some restrictions on foreigners and providing services to facilitate the transition to a long-term stay in the ROC [38]. Focusing primarily on highly qualified talent, the program mainly serves the biomedicine, tech, and defense industries [39]. The Taiwanese government also offers international higher education scholarship programs that attract students from all over the world to conduct their undergraduate and graduate studies in Taiwanese universities. These scholarships often include all university expenses as well as a generous monthly living stipend. Scholarships offered include the Huayu Mandarin Enrichment Scholarship, the MOFA Taiwan Scholarship, the MOE Taiwan Scholarship, the Academia Sinica Taiwan International Graduate Program, and Taiwan ICDF international scholarships. Each program has its own goals and standards, but generally, all of them aim to improve cultural understanding and economic cooperation between the ROC and partner countries [40] and contribute to human capital development in the ROC through education in STEM and other fields.
The training and education of civil servants is also a priority in the ROC. Rather than being managed by a national administration, departments of civil service development (DCSDs) are
REPUBLIC OF CHINA

18 | PUBLIC POLICY INNOVATION FOR HUMAN CAPITAL DEVELOPMENT
primarily on the municipal level. The Taipei city government, for example, began training civil servants through a temporary program in the late 1960s, and this has since become a permanent feature of the municipality in its efforts to develop human capital responsible for managing all aspects of the services and infrastructure provided by the city government. Like other DCSDs, Taipei focuses on advancing the skills necessary for efficient management and execution of government policies [41].
Starting in 1990, experimental education began gaining ground in the ROC in order to promote twenty-first-century skills, growing to include a total of almost 5,000 students in 61 institutions across the island today [42]. In recent years, the MOE has proposed a number of different laws to expand experimental education and give parents and students more choices. The cornerstones of the current paradigm on experimental education are three government acts, namely, the Enforcement Act for Non-school-based Experimental Education Across Levels Below Senior High School [43]; the Enforcement Act for School-based Experimental Education [44]; and the Act Governing the Commissioning of the Operation of Public Elementary and Junior Secondary Schools to the Private Sector [45], all of which were promulgated in 2014. The most recent laws have raised the ratio of students allowed to be in experimental programs and extended experimental education opportunities to higher education. Most experimental education schools are small, private institutions, but demand for these types of programs is growing quickly, and legislators are adjusting laws accordingly [46].
Emerging Needs and Skills Recent and ongoing economic changes stemming from industry 4.0, globalization, and other global and domestic forces are prompting governments all over the world, including that of the ROC, to prioritize a particular set of skills and competencies in their national workforces. Taiwanese labor is especially vulnerable due to demographic changes, cross-strait economic and political pressure, and international competition in industries where the ROC had previously excelled. The “5+2” industries identified by the Tsai administration are officially prioritized in public policy, but other industries, both white- and blue-collar, also have human capital development needs. The seven industries in the 5+2 Major Innovative Industries policy specified by the Tsai administration are intelligent machinery, Asia Silicon Valley, green energy, biomedicine, national defense and aerospace, new agriculture, and the circular economy [47]. These industries all require a shift in the skills and knowledge that are taught in educational and professional training institutions across the ROC to be more technical, creative, and entrepreneurial.
Chief among the needs of the key industries in the ROC is talent, with knowledge and skills applicable to artificial intelligence, internet of things, and information technology. In order to facilitate the growth of these fields, government policy in the ROC has a multi-billion-dollar budget in investment funds to target specific industries. These include the “NT$100 billion (USD3.3 billion) Industrial Innovation and Transformation Fund to be used for investment in new technologies, with another NT$10 billion (USD300 million) from the newly established National Investment Corporation” [48]. Much of this money is directed at educational and training programs, as well as structural support for small- and medium-sized enterprises, which are often referred to as the backbone of the Taiwanese economy. The need for these kinds of skills, however, is recognized by more than just the government and the business community. Parents and young professionals are very much aware of the skillsets required for success in the ROC today. Of the total 1,309,670 students enrolled in Taiwanese universities in 2016–17, 545,601 were studying
REPUBLIC OF CHINA

PUBLIC POLICY INNOVATION FOR HUMAN CAPITAL DEVELOPMENT | 19
fields related to STEM, accounting for nearly 42% of the total student body, and thousands more were enrolled in business programs [9].
The general trends in the Taiwanese labor force have been changing for decades as the economy has shifted from the one based on manufacturing to one based on the higher-tech industries mentioned above. Recent indicators have shown some changes in the sectors targeted by major policies. As percentage of the total structure of employment, blue-collar craft-and-machine workers still accounted for just over 31% of the total labor force, while white-collar workers, defined as professionals, technicians, clerical workers, managers, and officials, accounted for nearly 45%. The ROC enjoys a low unemployment rate of 3.64% as of April 2018 [49], but the changing demographics associated with an aging population and declining birth rates are cause for alarm for Taiwanese industries struggling to recruit young talent [9].
Discussion Taiwanese efforts to develop the human capital resources necessary for greater productivity and sustainable, equitable growth have had mixed results. There are a number of factors at play that work in the ROC’s favor, but equally influential are the forces that confound the efforts of policy makers and business leaders on the island. The ROC enjoys many advantages through its close economic ties with large markets like PR China and the USA and the economic development it achieved in the 1970s and 1980s. However, the limits of these advantages without significant changes in the way human capital is developed have become apparent since the slowing of economic growth beginning in the 1990s. A chief concerns of the ROC at this point is to capitalize on its existing advantages and facilitate the growth of talent in other areas so as to compete in an ever-globalizing world [50].
Key Challenges In terms of human capital needs and strategies to increase productivity, the ROC is in a unique situation globally because of a host of factors that are both international and domestic, e.g., the changes in economic conditions affecting the ROC’s human capital development. Since the Asian financial crisis in the 1990s, capital investment has shown slowed returns in the ROC, and many argue that the best prospect for continued economic growth will come from increased development of human capital [51]. Many Taiwanese businesses and policy makers agree, as is evident from the many plans and programs discussed above, but recent graduates often still find it difficult to obtain quality employment despite the investments and initiatives [52]. When jobs are available to young professionals, they are typically offered low wages and minimal benefits. There is some sign that wages are beginning to rise slowly [53], but they have a long way to go if they are to compete with the wages drawn at many Chinese and other overseas firms.
These changes in economic conditions are generally recognized by the Taiwanese society, and measures are being taken by government agencies, educational institutions, non-governmental organizations, domestic and foreign enterprises, and households to improve the quality of human capital in the ROC. TVET programs at secondary and tertiary levels, for example, remain well-funded and prolific across the island, but in recent years, emphasis has shifted in favor of liberal arts and STEM education, sometimes at the expense of TVET. The 2017 MOE report broke down educational spending, saying, “In [school year] 2015, the total education budget was NT$719.0 billion, of which preschool education accounted for 7.94%, elementary and junior high education accounted for 42.14%, senior secondary education accounted for 15.17%, higher education
REPUBLIC OF CHINA
20 | PUBLIC POLICY INNOVATION FOR HUMAN CAPITAL DEVELOPMENT
accounted for 34.15% (junior colleges 0.78%, universities and colleges 33.37%), and 0.61% went to other institutions” [35].
In the years since the ROC’s rapid growth in the 1970s and 1980s, the island has been undergoing considerable demographic changes, including rising immigration, especially from southeast Asia and the Pacific, and a rapidly aging population associated with a sharply declining birthrate. The ROC now has the third-lowest birthrate in the world, behind only Singapore and Macao [54]. In terms of productivity, this has a number of alarming implications. Because of the movement toward massification of higher education in the 1990s, the ROC now has an overwhelming surplus of colleges and universities, thus leading to a higher-than-average proportion of high-school graduates continuing on to higher education, a college acceptance rate that reveals the level of desperation experienced by some universities failing to attract enough applicants, and a resulting decrease in the overall quality of higher education provided by these institutions. Since many schools struggle to maintain sufficient student enrollments, they are considering mergers with other institutions or even facing the threat of complete closure if they are unable to meet government-imposed standards for continued operation.
HEIs have been steadily decreasing their standards for acceptance and academic performance over the last several decades. The general acceptance rate for university across the country has increased from “around 20% before the 1970s to 49% in 1996 and over 90% since 2006, among the highest in Asia” [6]. The ROC also actively recruits foreign students to strengthen and diversify its universities, improve their standings in international rankings, and make up for the dwindling numbers of domestic students attending its numerous universities [13]. The number of foreign students in Taiwanese universities increased from about 45,000 in 2010 to over 111,000 by 2015 [55]. According to a survey conducted by the MOI in 2016, more than 5 million Taiwanese hold a college degree or higher, accounting for 45% of the population between the ages of 25 and 64. That figure is significantly higher than the Organisation for Economic Cooperation and Development (OECD) average of about 33% [56]. Although it is promising as a sign of the level of access to higher education in Taiwanese society, the reality is that the Taiwanese economy is not prepared to absorb such a large number of college graduates. Government responses to popular demand in the 1990s and early 2000s to increase that accessibility were largely successful, but Taiwanese businesses lament the decreasing number of vocationally trained workers that resulted from that expanded access [57].
One of the most significant problems facing the ROC’s ability to develop its human capital is the draw of overseas career opportunities for young graduates. Wages are low for graduates in the ROC, which leads them to seek opportunities elsewhere. PR China actively courts young Taiwanese professionals to work in its burgeoning tech firms or pursue graduate studies in Beijing, Shenzhen, and other cities in the mainland. These incentives manifested themselves in public policy in the first half of 2018 when PR China announced 31 preferential policies that it would extend to the people of the ROC. These policies allow Taiwanese to take certification exams for a host of professions, gain preferential access to Chinese HEIs, and even become members of ‘grassroots’ industry and trade groups in PR China. The policy also includes a wide variety of benefits for Taiwanese businesses, including, “…permitting Taiwanese firms to invest in Chinese businesses, receive tax breaks, participate in the ‘Made in China 2025’ initiative and National Key Research and Development Programs, bid for government procurement contracts, and manage semi-public enterprises” [58]. The political fear expressed by some is that this is one of many policies initiated by Beijing to seduce the ROC into trading political recognition for economic opportunity [59], but
REPUBLIC OF CHINA

PUBLIC POLICY INNOVATION FOR HUMAN CAPITAL DEVELOPMENT | 21
many have rejected this as a viable strategy, even if it is Beijing’s intention. As a result, many in the ROC still view the new policies as an “opportunity, not a threat” [60].
PR China stands looming in another major issue facing Taiwanese productivity and human capital development. The “One China Policy” has, since even before the 1970s when the ROC lost its diplomatic recognition by the USA and other countries, slowly eroded the ROC’s ability to participate in the international community. MOL has outlined the organizations with which the ROC is able to participate to some extent. It should be noted, however, that with few exceptions, the ROC is only able to engage with these organizations in an unofficial capacity, sometimes being reduced to working only with retired administrators and experts. This is a recurring motif in Taiwanese policy making which frequently stands in the way of the ROC’s national goals and divides popular opinion. Nonetheless, the international organizations related to human capital development that the ROC actively tries to engage with include the ILO, International Trade Union Confederation (ITUC), the International Organization of Employers (IOE), the WTO, the Asia Pacific Economic Cooperation’s (APEC) Human Resources Development Ministerial Meeting and Human Resources Development Working Group (HRDWG), and the OECD [61].
Local Responses As is evident from the discussions above, Taiwanese engagement in the development of its human capital resources has invariably been direct and active. Government agencies, private enterprises, and individuals invest heavily in education and training with an eye on trends shaping the global economy. As of 2016, public expenditure per student is at the highest level it has ever been [9]. Results from these activities have been varied though, and new approaches will be needed if the ROC is to remain competitive.
Seen as a means to maintain and improve national competitiveness, the ROC has promoted human capital development by fostering interest in STEM. As detailed above, some of these programs include STEM programs in Taiwanese HEIs, such as the National Science and Technology Development Plan, and the Taiwan Productivity 4.0 Initiative. Although difficult to evaluate, these programs have shown mixed results in terms of their effect on productivity. STEM programs in universities tend to receive a high level of funding and enjoy relatively high enrollments at Taiwanese institutions, compared with humanities, social sciences, and other fields. However, as mentioned above, graduates from Taiwanese schools often seek employment abroad, which diminishes the returns on this important investment [62]. STEM in primary and secondary schools has been reformed numerous times in recent years with the intention of improving student engagement and critical thinking skills, but as of now, little progress has been documented on that front in terms of students’ performances in international tests such as TIMSS and PISA. As a top priority for Taiwanese society, STEM education will likely continue to be a primary concern for policymakers and private enterprises alike, but unless conditions improve for motivated graduates of four-year STEM programs, the ROC will continue to lose its most capable talent to more promising markets in PR China.
The ROC has gone to great lengths to develop and support TVET opportunities for its citizens. As discussed in this report, examples of those initiatives include TVET programs in secondary and tertiary education and the Forward-Looking Infrastructure Development Program. TVET education in the ROC has been strong for decades, but since public demand for more access to the highest levels of educational attainment grew in the late 1990s and early 2000s, some focus has shifted away from junior colleges, vocational secondary schools, and technical programs in favor
REPUBLIC OF CHINA

22 | PUBLIC POLICY INNOVATION FOR HUMAN CAPITAL DEVELOPMENT
of academic programs. Per student spending on education in 2016 was highest at academic HEIs at NT$187,271 (USD6,287), while spending at junior colleges was NT$105,393 (USD3,538) [9]. The emphasis on four-year degree programs produces an endless supply of quality graduates, but many firms in the ROC complain of a lack of technically skilled labor produced by vocational programs [58]. The ROC produces plenty of graduates from quality four-year programs, but low pay and sparse opportunity means they often seek work abroad or end up getting employed in positions that are not relevant to their university studies. In the meantime, the ROC should not let its standard for TVET deteriorate.
Taiwanese policymakers have shown an awareness of the need to develop twenty-first-century skills among the ROC’s workforce, and have taken strides to address that need. Some of the policies and programs directed towards that objective, as discussed above, include the Innovation and Startups Taskforce, the HeadStart Taiwan Program, and experimental and alternative education programs across the country. Although many recent reforms in the Taiwanese education system have focused on massification of secondary and tertiary education, considerable effort has also been directed at the development of knowledge and skills associated with the 5+2 industries, entrepreneurship, and other innovative fields. In terms of productivity, these efforts have produced mixed results. As mentioned above, many of the ROC’s most talented graduates and innovators opt for better opportunities available in PR China and elsewhere. Beyond that, even as these reforms are going into effect, Taiwanese education still suffers from a lack of creative problem-solving skills despite the prolific availability of technical knowledge. Some have attributed this to a test-driven educational culture, wherein students are well prepared to pass tests but unable to apply much of that knowledge to practical situations [63]. If the ROC is to foster a more innovative and engaged workforce, more emphasis will need to be placed on higher-level critical and entrepreneurial thinking skills that are difficult to assess through standardized tests.
Taiwanese policymakers and businesses have been trying to bolster the country’s capacity to recruit and retain quality talent in recent years. Among these efforts are the Contact Taiwan Program, scholarship programs such as the Taiwan Scholarship offered by MOE and MOFA, and the International Cooperation and Development Fund. Other legislations such as the Act for the Recruitment and Employment of Foreign Professionals [64], and special programs designed to facilitate foreigners’ transition to the ROC make immigration to the island easier and more desirable. Currently, the total number of foreign residents in the ROC is 715,080, most of whom come from southeast Asian countries, with a significant number also coming from Japan, ROK, the USA, Canada, the UK, India, and France [65]. Although Taiwanese wages are relatively low, some foreign talent is won over by the low cost and high quality of living compared with many other potential destinations globally. Even so, it remains inevitable in the current context that some of the most desirable talent is likely to seek more lucrative compensation and opportunities available elsewhere. Policymakers and businesses need to focus at home as well. The flood of talented young graduates leaving the ROC for better opportunities across the continent could be slowed, but only if young people feel that they have a comparable future at home. If Taiwanese firms do not offer graduates better wages, more benefits, and a clear path for career advancement, the country will continue to lose its most promising talent to foreign markets.
Conclusion The cultivation of quality human capital is a top priority for the ROC. Ever since the economic miracles of the 1970s and 1980s, a strong, well-trained workforce has been an essential part of
REPUBLIC OF CHINA
PUBLIC POLICY INNOVATION FOR HUMAN CAPITAL DEVELOPMENT | 23
continued success. Specifically, STEM education and TVET continue to be prioritized by policymakers, enterprises, and individuals as a means to ensure that Taiwanese human capital resources can contribute to the realization of continued economic growth and higher productivity. Government agencies, non-governmental institutions, and private interests all contribute to this endeavor in important ways, when it comes to meeting the difficult challenges facing the Taiwanese society today. However, an aging, highly educated population facing slowed economic growth in a globally changing industrial and technological landscape must work harder than ever to maintain a healthy economy that guarantees equitable opportunities for its population.
If the ROC is to succeed, significant effort is needed to give Taiwanese scientists, engineers, machinists, and professionals of all kinds the tools they need for the ROC’s society in the twenty-first century. Specifically, Taiwanese businesses, institutions, and the government need to work together to make the country more attractive to the talented young professionals produced by its universities and colleges. In terms of TVET, Taiwanese society cannot overlook the importance of innovative and accessible vocational and technical training. The ROC’s highly educated population will be squandered if it runs short of qualified people. The education system in the ROC also needs to continue to shift away from a traditional rote-learning style towards a methodology that promotes critical thinking and skills that are relevant now as well as in future. Overemphasis on testing will continue to undermine those efforts until major changes are made. Beyond that, Taiwanese businesses and policymakers need to devise new ways to attract more top minds from abroad, and to retain them as well as the native talent, longer.
The ROC has made immense progress in terms of human capital development and has served as a model for others in the region, and indeed, the world. That said, the ROC is faced with new demographic, economic, educational, and policy-related challenges that continue to stand in the way of progress and growth. Many initiatives have aimed to address these, but more must be done if the ROC is to optimize its development of human capital and to continue competing globally with the world’s most advanced economies.
References [1] Becker G.S., Murphy K.M., Tamura R. Human Capital, Fertility, and Economic Growth. In:
Becker G.S., ed. Human Capital: A Theoretical and Empirical Analysis with Special Reference to Education (3rd Edition). Chicago, IL: The University of Chicago Press; 1994, pp. 323–50.
[2] Lin T.-C. The Role of Higher Education in Economic Development: an Empirical Study of Taiwan Case. Journal of Asian Economics 2004; 355–71.
[3] Castells M. Four Asian Tigers with a Dragon Head: A Comparative Analysis of the State, Economy and Society in the Asian Pacific Rim. Instituto Universitario de Sociología de Nuevas Tecnologías, Universidad Autónoma; 1991.
[4] Public Diplomacy Coordination Council. Ministry of Foreign Affairs, Republic of China. Toronto TECO hosts reception in celebration of the ROC’s 105th National Day. https://www.mofa.gov.tw/en/News_Content.aspx?n=1190C61E1C8A01A9&sms=1BC1E5C3DD8E7C26&s=8EB46DEBF5DF578D. Accessed on 3 April 2018.
REPUBLIC OF CHINA

24 | PUBLIC POLICY INNOVATION FOR HUMAN CAPITAL DEVELOPMENT
[5] Tsiang G.R.-j. Human Capital Creation and Utilization in Taiwan. In: Thorbecke E., Wan Jr. H., eds. Taiwan’s Development Experience: Lessons on Roles of Government and Market. Boston, MA: Springer; 1999, pp. 249–67.
[6] Chou C.P. The SSCI Syndrome in Higher Education: A Local or Global Phenomenon. Rotterdam, NL: Sense Publishers; 2014.
[7] Clark N. Education in Taiwan. World Education Services; 2010. https://wenr.wes.org/2010/05/wenr-may-2010-feature. Accessed on 5 April 2018.
[8] Magaziner J. Education in Taiwan. World Education Services; 2016. https://wenr.wes.org/2016/06/education-in-taiwan. Accessed on 5 April 2018.
[9] National Development Council (NDC), Republic of China. Taiwan Statistical Data Book; 2017. https://www.ndc.gov.tw/en/News_Content.aspx?n=607ED34345641980&sms=B8A915763E3684AC&s=1897C8025B0899A0. Accessed on 7 April 2018.
[10] Jennings R. How Taiwan Fostered The World's Most Open Government. Forbes; 15 December 2015. https://www.forbes.com/sites/ralphjennings/2015/12/15/how-taiwan-rose-to-world-no-1-in-government-transparency/#2bbe008f5c04. Accessed on 12 April 2018.
[11] The Economist. Sizing Tsai up. The Economist; 2016.
[12] Executive Yuan. Republic of China; 2018. https://english.ey.gov.tw/. Accessed on 12 April 2018.
[13] Ministry of Education (MOE), Republic of China. https://english.moe.gov.tw/cp-2-15739-91D3B-1.html. Accessed on 12 April 2018.
[14] Ministry of Science and Technology (MOST), Republic of China. https://www.most.gov.tw/?l=en. Accessed on 4 April 2018.
[15] Ministry of the Interior (MOI), Republic of China. Outline of the Ministry of the Interior https://www.moi.gov.tw/outline/download/2017ebook_en.pdf. Accessed on 8 April 2018.
[16] Ministry of the Interior (MOI), Republic of China. https://www.moi.gov.tw/english/. Accessed on 16 April 2018.
[17] Ministry of Labor (MOL), Republic of China. Policy Objectives and Priorities of the Ministry of Labor for 2017. https://english.mol.gov.tw/6385/25787/. Accessed on 5 April 2018.
[18] Ministry of Labor (MOL), Republic of China Participation in international organizations. https://english.mol.gov.tw/6386/6438/6530/. Accessed on 12 April 2018.
[19] Ministry of Economic Affairs (MOEA), Republic of China. https://www.moea.gov.tw/MNS/english/home/English.aspx. Accessed on 24 April 2018.
[20] National Development Council (NDC), Republic of China. https://www.ndc.gov.tw/en/cp.aspx?n=F387BD4E6F6FA6BA&s=9E4814823D6D141D. Accessed on 26 April 2018.
REPUBLIC OF CHINA

PUBLIC POLICY INNOVATION FOR HUMAN CAPITAL DEVELOPMENT | 25
[21] Industrial Technology Research Institute. ITRI Overview. https://www.itri.org.tw/eng/Content/Messagess/contents.aspx?SiteID=1&MmmID=617731521661672477. Accessed on 26 April 2018.
[22] Epoch Foundation. http://www.epoch.org.tw/en/about. Accessed on 27 April 2018.
[23] Everington K. Taiwanese parents spend 5th most in world on education. Taiwan News 2017, 07:03. https://www.taiwannews.com.tw/en/news/3202190. Accessed on 28 April 2018.
[24] Sui C. Staff training programs seen as key to improving business performance. Taiwan Today 2008. 12:12. https://taiwantoday.tw/news.php?unit=10,23,45,10&post=15102. Accessed on 12 May 2018.
[25] Li L. Google to invest in Taiwan's AI talent evolution. Taipei Times, 22 March 2018. http://www.taipeitimes.com/News/front/archives/2018/03/22/2003689779. Accessed on 12 May 2018.
[26] Chien L.-F. Supporting the Growth of an Intelligent Taiwan. The Keyword, 21 March 2018. https://www.blog.google/topics/google-asia/intelligent-taiwan/. Accessed on 5 May 2018.
[27] Lawson C. Taiwan’s Aim for the Top University Program. Australian Education International (AEI), an arm of the Australian Department of Education, Employment and Workplace Relations (DEEWR); 2007. https://internationaleducation.gov.au/research/Publications/Documents/Taiwans_Aim_Top.pdf. Accessed on 4 May 2018.
[28] Lin R., Cheng J. Finding talent where tests cannot. Taiwan Today, 23 September 2016. URL: http://www.taipeitimes.com/News/taiwan/archives/2018/01/21/2003686165. Accessed on 8 May 2018.
[29] Ministry of Science and Technology (MOST), Republic of China. National Science and Technology Development Plan (2017–2020); 2017. https://www.most.gov.tw/most/attachments/2abb3ec5-78f0-4c00-80c4-063294ec76ab. Accessed on 8 May 2018.
[30] MOFA. ROC Cabinet gears up for Productivity 4.0. Taiwan Today, 10 August 2015. https://taiwantoday.tw/news.php?unit=6&post=12366. Accessed on 9 May 2018.
[31] Lin K., Chung S., Joseph Z. et al. A Cross-Strait Comparison of Innovation Policy under Industry 4.0 and Sustainability Development Transition; 2017. 10.3390/su9050786. Accessed on 8 May 2018.
[32] Ministry of Education (MOE), Republic of China. Forward-looking Infrastructure Development Program: Human Resources Infrastructure to Nurture Talent and Boost Employment & Subsidies for Technological and Vocational Colleges and Universities to Optimize Environments for Job Ready Skills Programs; 2017. http://english.moe.gov.tw/public/Attachment/712191844371.pdf. Accessed on 9 May 2018.
[33] National Development Council (NDC). Headstart Taiwan Project; 2014. http://ws.ndc.gov.tw/001/administrator/25/ckfile/14305ab9-48c0-4251-9d26-9410f5fc4fab.pdf. Accessed on 10 May 2018.
REPUBLIC OF CHINA

26 | PUBLIC POLICY INNOVATION FOR HUMAN CAPITAL DEVELOPMENT
[34] Chen H., Fan H.-H. Education in Taiwan: The Vision and Goals of the 12-Year Curriculum. Brookings, 11 November 2014. https://www.brookings.edu/opinions/education-in-taiwan-the-vision-and-goals-of-the-12-year-curriculum/. Accessed on 10 May 2018.
[35] Ministry of Education (MOE), Republic of China. Education in Taiwan; 2017. https://english.moe.gov.tw/public/Attachment/791117355371.pdf. Accessed on 10 May 2018.
[36] Lin S. Minister unveils youth subsidy program. Taipei Times, 2016. http://www.taipeitimes.com/News/taiwan/archives/2016/10/14/2003657132. Accessed on 4 June 2018.
[37] Ministry of Education (MOE), Republic of China. The Intelligent Taiwan - Manpower Cultivation Project (Forming Part of the "i-Taiwan 12 Projects"); 2018. https://english.moe.gov.tw/cp-32-14541-6CF3A-1.html. Accessed on 12 May 2018.
[38] National Development Council (NDC), Republic of China. Contact Taiwan Program; 2015. https://investtaiwan.nat.gov.tw/eng/doc/Contact%20Taiwan%20Program.pdf. Accessed on 12 May 2018.
[39] Ministry of Economic Affairs (MOEA), Republic of China. Contact Taiwan; 2016. https://www.contacttaiwan.tw/main/index.aspx?lang=2#. Accessed on 12 May 2018.
[40] Ministry of Foreign Affairs (MOFA), Republic of China. Taiwan Fellowships and Scholarships (TAFS). http://tafs.mofa.gov.tw/Default.aspx?loc=en. Accessed on 15 May 2018.
[41] Department of Civil Service Development (DCSD), Taipei City Government. https://english.dcsd.gov.taipei/Default.aspx. Accessed on 15 May 2018.
[42] Lin R., Chin J. New law widens scope of experimental education. Taipei Times, 2018. http://www.taipeitimes.com/News/taiwan/archives/2018/01/21/2003686165. Accessed on 16 May 2018.
[43] Ministry of Education (MOE), Republic of China. Enforcement Act for Non-school-Based Experimental Education across Education Levels below Senior High School; 2014. http://edu.law.moe.gov.tw/EngLawContent.aspx?lan=E&id=217&KW=. Accessed on 16 May 2018.
[44] Ministry of Education (MOE), Republic of China. Enforcement Act for School-Based Experimental Education; 2014. http://edu.law.moe.gov.tw/EngLawContent.aspx?Type=E&id=218. Accessed on 16 May 2018.
[45] Ministry of Education (MOE), Republic of China. Act Governing the Commissioning of the Operation of Public Elementary and Junior Secondary Schools to the Private Sector; 2014. http://edu.law.moe.gov.tw/EngLawContent.aspx?Type=E&id=219. Accessed on 16 May 2018.
[46] Lin S. Students at experimental schools gain recognition. Taipei Times, 31 December 2017. http://www.taipeitimes.com/News/taiwan/archives/2017/12/31/2003684953. Accessed on 18 May 2018.
REPUBLIC OF CHINA

PUBLIC POLICY INNOVATION FOR HUMAN CAPITAL DEVELOPMENT | 27
[47] Executive Yuan, Republic of China. “Five plus two” innovative industries plan; 2018. https://english.ey.gov.tw/News_Hot_Topic.aspx?n=0899B3FCC4B38357&sms=8BCD9CBBA95A001D. Accessed on 1 June 2018.
[48] Ferry T. The 5+2 Industrial Innovation Plan. Taiwan Business Topics, 8 May 2017. https://topics.amcham.com.tw/2017/05/52-industrial-innovation-plan/. Accessed on 24 April 2018.
[49] Directorate General of Budget, Accounting and Statistics. Latest Indicators. Executive Yuan, Republic of China; 2018. https://eng.stat.gov.tw/point.asp?index=3. Accessed on 3 June 2018.
[50] Gao Y. Consultant Report, Securing Australia’s Future, STEM: Country Comparisons, Report of Taiwan: STEM (Science, Technology, Engineering and Mathematics). Australian Council of Learned Academies; 2012. https://acola.org.au/wp/PDF/SAF02Consultants/Consultant%20Report%20-%20Taiwan.pdf. Accessed on 3 June 2018.
[51] Chou M.-H. Labour quality in Taiwan: measurement and contribution to economic growth. Applied Economics 2015, pp. 4,653–69. 10.1080/00036846.2015.1034837. Accessed on 3 June 2018.
[52] Lin C.-n., Yang M.-c. More than nine out of 10 graduates to look for jobs: poll. Taipei Times, 5 June 2017. http://www.taipeitimes.com/News/taiwan/archives/2017/06/05/2003671953. Accessed on 8 June 2018.
[53] Taipei Times. Wages for new graduates highest since 2008: survey. Taipei Times 6 June 2016. http://www.taipeitimes.com/News/biz/archives/2016/06/06/2003647960. Accessed on 8 June 2018.
[54] Salmonsen R. Taiwan’s birthrate now world’s 3rd lowest. Taiwan News. 4 December 2017. https://www.taiwannews.com.tw/en/news/3312276. Accessed on 8 June 2018.
[55] Ministry of Education (MOE), Republic of China. Non-citizen Students in Universities, Colleges and Junior Colleges; 2017. https://english.moe.gov.tw/cp-26-16422-974D2-1.html. Accessed on 9 June 2018.
[56] China Post. 5 mil. Taiwanese hold degrees from higher education institutions. China Post, 13 March 2016. https://chinapost.nownews.com/20160313-28397. Accessed on 9 June 2018.
[57] Weise E. Taiwan’s problem? Too many college graduates, too few machinists. USA Today, 7 May 2015. https://www.usatoday.com/story/tech/2015/05/07/taiwan-too-many-college-graduates/26945515/. Accessed on 9 June 2018.
[58] Tu A., Chin J., Chung J. China extends ‘unprecedented’ benefits to Taiwanese. Taipei Times, 1 March 2018. http://www.taipeitimes.com/News/front/archives/2018/03/01/2003688463. Accessed on 10 June 2018.
[59] Smith N. Taiwan Is Suffering From a Massive Brain Drain and the Main Beneficiary is China. Time, 21 August 2017. http://time.com/4906162/taiwan-brain-drain-youth-china-jobs-economy/. Accessed on 10 June 2018.
REPUBLIC OF CHINA

28 | PUBLIC POLICY INNOVATION FOR HUMAN CAPITAL DEVELOPMENT
[60] Schubert G. China’s 31 Preferential Policies for Taiwan: An Opportunity, Not a Threat. Taiwan Sentinel, 23 March 2018. https://sentinel.tw/china-31pp-taiwan-no-threat/. Accessed on 12 June 2018.
[61] Ministry of Labor (MOL), Republic of China. Participation in international organizations; 2018. https://english.mol.gov.tw/6386/6438/6530/. Accessed on 12 June 2018.
[62] Jennings R. Taiwan’s Once Mighty High-Tech Sector Is Falling Behind Because Of Low Pay. Forbes. 23 April 2017. https://www.forbes.com/sites/ralphjennings/2017/04/23/taiwans-once-mighty-high-tech-sector-is-falling-behind-because-of-low-pay/#2b4f4217b431. Accessed on 13 June 2018.
[63] Chen H.-L.S., Huang H.-Y., NTNU. Advancing 21st Century Competencies in Taiwan. Asia Society: Center for Global Education; 2017. https://asiasociety.org/files/21st-century-competencies-taiwan.pdf. Accessed on 13 June 2018.
[64] National Development Council (NDC), Republic of China. Act for the Recruitment and Employment of Foreign Professionals Approved; 2017. https://www.ndc.gov.tw/en/News_Content.aspx?n=0E2DCBAA6CB72F12&sms=B079565EECDD8520&s=225ABA2660D863FE. Accessed on 13 June 2018.
[65] National Immigration Agency (NIA), Republic of China. Foreign Residents by Nationality; 2018. https://www.immigration.gov.tw/ct.asp?xItem=1346322&ctNode=29986&mp=2. Accessed on 14 June 2018.
REPUBLIC OF CHINA

PUBLIC POLICY INNOVATION FOR HUMAN CAPITAL DEVELOPMENT | 29
Prof. Vedulla Venkata Ramana Vice Chairman, Telangana State Council of Higher Education
Professor and former Dean, School of Management StudiesUniversity of Hyderabad
Introduction Socioeconomic Profile of IndiaIndia is the fastest developing country with a population of 1.3 billion, of which almost half is under the age of 25. India has an enormous potential to benefit from the fourth industrial revolution, and has been continuously working on the infrastructure, higher education, and training to be on par with the leading economies by making the upcoming generation future-ready. Many national-level policies and plans are being implemented to attract the global investment opportunities.
Global Interests and PositioningIndia has always been compared with its neighboring country, PR China. There has been a tremendous rise in the country’s status from being a developing country to becoming a nation with the potential to influence global economic and geopolitical efforts. India has evolved to an extent where it plays a leadership role in global geopolitics and participates in geoeconomic discussions.
Quest for TalentThe major challenge for any economy is to find the right pool of talent for existing jobs. Drastic changes in technology have made markets riskier and the need for skilled workforce greater. The government is facing a major problem in attracting workforce with better talent and expertise, as the people possessing it tend to work for the private sector. This problem can be solved by improving the education system and covering the skill gaps. However, innovation in education takes a long time and the evaluation of its effects is also time consuming.
Nevertheless, the education sector is ripe for innovation, both in terms of governance and technology.
Education and SkillsInnovation through technology in education is required for transforming the sector and updating the skills for the contemporary job market. Building a market-ready education system requires designing the curricula to meet the changing needs of the business and prepare the students to adapt to competitive and advancing changes. This approach helps cover the gap between the employer’s requirement and the existing workforce.
Employment and EmployabilityThe ratio between employment-ready individuals and employability has been off balance. Indian economy has been sluggish in accommodating the workforce as there is a mismatch between the employment generation and the requirement. According to a report by The Wall Street Journal in
INDIA

30 | PUBLIC POLICY INNOVATION FOR HUMAN CAPITAL DEVELOPMENT
2015, India was able to create only 5.5 million new jobs annually whereas the requirement was of 12 million workers every year.
Fourth Industrial RevolutionThe fourth industrial revolution overcomes the drawbacks of the earlier three industrial revolutions. It enables a strong human capital development with a changed perspective to work together, by leveraging extraordinary technologies. The main focus of this revolution is to create a value-driven economy and human-centric future involving great minds, policy makers, technology developers, and people from other paths of life. Importance is given to people than to technology for creating an impact on the society as a whole.
Workforce and EmploymentThe world of work is changing fast. Recognizing and planning new work models will be vital for channelizing that change into the formation of sturdier labor markets. Job creation is a continuous process in the global agenda, as are policies intended to protect interests of both workers and their employers. The most successful tactics will utilize a steady understanding of workforce demographics, shifting job roles, and growing demand for skills, and will influence disruption as a means to design the ideal workplace of the 21st century.
Job Creation and EntrepreneurshipThe global economy is sluggish in generating new jobs, thus stressing the need for new approaches because of poor quality of job creation. Every nation should provide safe and quality employment for its people to lead quality life. For the younger generations to be free from unemployment, rapid technological changes and job creation strategies should be complemented by new models encouraging entrepreneurship in the nation. Startups create more jobs than small- and medium-scale industries as they grow.
Disruption of Jobs and SkillsSkill gaps and innovation lags across fiscal systems are key factors behind the sluggishness in labor markets. Due to increasing job disruption, these trends are set to become worse. An ability to anticipate and prepare for future skills requirements, job content, and employment is critical for businesses, governments, and individuals that want to capitalize new opportunities and new markets. Data sharing and mapping of skills demand should be key components of related approaches.
Elements of Human CapitalThe theory of human capital emphasizes that improvement of labor productivity and intellectual skills at the individual level, with the support of education, creates a potential labor market participant. Human capital is well defined as the stock of knowledge, capability, motivation, and ability that facilitates human productivity. It not only represents the knowledge and capacity that is personified in an individual but also reflects the ‘acquired’ knowledge and skills that contribute to labor productivity (see Figure 1).
An Overview of Indian EconomyThe Indian economy has attracted international investments since liberalization in 1990s. Indians have been practical and proactive in adopting a global approach and acquiring skills. While villagers proudly take up farming, advanced agriculture, and unique handicrafts as professions, modern industries and professional services sectors are also coming up in a big way.
INDIA

PUBLIC POLICY INNOVATION FOR HUMAN CAPITAL DEVELOPMENT | 31
The license raj (regime), restrictions on foreign investments, lack of measures to promote the private industry, and import of cheap manufactured goods have all contributed to the lack of substantial growth in the manufacturing sector. Today, the service sector contributes around 60% of the GDP but employs only 24% of the workforce. In recent years, there has been a renewed emphasis on manufacturing through programs like ‘Make in India,’ which aim to correct this anomaly and raise employment in proportion with the GDP growth. The country is attracting many global majors for strategic investments owing to the presence of a vast range of industries, growth avenues, and a supportive government. The country’s large population, mostly comprising the youth, is a strong driver for demand as well as an ample source of manpower.
TABLE 1
INDIA VS WORLD BY AREA AND GDP [1].
Area GDP in billion USD
(Sq km) 2010 2010 2011 2012 2013 2014 2015
India 3,287,590 1,708.5 1,843.0 1,835.8 1,875.2 2,051.2 2,181.6
World 510,072,000 66,338.9 72,422.5 73,777.3 75,467.1 77,269.2 73,506.8
As shown in Table 1, India’s GDP increased by approximately 22% within a span of six years during the period 2010–15. This shows the rapid pace of development in the economy.
As shown in Figure 2, India’s population rose by 15% during 2001–11. In the rural setting, male population increased by 10.78% while female population rose by 11.10%. In the urban setting, there was an increase of 25% in female population and 23% in male population during the same period. Thus, the population increase was comparatively higher in urban areas.
ELEMENTS OF HUMAN CAPITAL.
FIGURE 1
Elements of human
capital
CapacityLevel of formal education of
younger and older generations as a result of
past educational investment
DevelopmentFormal education of the
next-generation workforce and continued upskilling and
reskilling of the current workforce
DeploymentSkills application and
accumulation among the adult population
Know-howBreadth and depth of specialized skills
used at work
INDIA

32 | PUBLIC POLICY INNOVATION FOR HUMAN CAPITAL DEVELOPMENT
The total literacy rate increased around 12% during 2001–11 (see Figure 3). The overall female literacy rate increased by 17% while male literacy rate increased by 6%. From this graph, we can interpret that female education has been encouraged, leading to better human capital.
As is seen in Table 2 and Figure 4, the percentage distribution of population among the age groups 15–19 and 20–24 is higher compared to other age groups. The overall male population is higher than the female population. However, the working age groups of 20–24 and 25–29 have more female population than male population.
MALE AND FEMALE POPULATIONS IN RURAL AND URBAN AREAS.
FIGURE 2
Population size
Total1,400,000,000
1,200,000,000
1,000,000,000
800,000,000
600,000,000
400,000,000
200,000,000
0
1,02
8,61
8,82
1
532,
161,
079
496,
457,
742
1,21
0,85
4,97
7
623,
270,
258
587,
584,
719
2001 2011
Num
ber
Rural 1,000,000,000
8,00,000,000
600,000,000
400,000,000
200,000,000
0
742,
490,
639
381,
602,
674
360,
887,
965
833,
748,
852
427,
781,
058
405,
967,
794
2001 2011
Num
ber
Urban400,000,000
300,000,000
200,000,000
100,000,000
0
286,
128,
182
150,
558,
405
135,
569,
777
377,
106,
125
195,
489,
200
181,
616,
925
2001
Persons
2011
Num
ber
Males Females
INDIA

PUBLIC POLICY INNOVATION FOR HUMAN CAPITAL DEVELOPMENT | 33
Table 3 and Figure 5 depict the rural and urban literacy rates for the period 1951–2011. Notably, from 2001 to 2011, there was a tremendous increase in the literacy rate of females belonging to rural areas. Overall, there was 13% increase in literacy rate from 2001 to 2011.
Table 4 and Figure 6 depict the total male and female workers in India. It is evident that the percentage of male working population is more than the female working population. A comparison of the urban and rural working populations shows that the percentage of people working in rural areas is much higher.
LITERACY RATES IN RURAL AND URBAN AREAS (2001 AND 2011).
FIGURE 3
Literacy rate, 7+yrs
Total100.00
80.00
60.00
40.00
20.00
0.00
64.8
0
75.3
0
53.7
0
73.0
0
80.9
0
64.6
0
2001 2011
Perc
ent
100.00
80.00
60.00
40.00
20.00
0.00
58.7
0
70.7
0
46.1
0
67.8
0
77.1
0
57.9
0
2001 2011
Perc
ent
100.00
80.00
60.00
40.00
20.00
0.00
79.9
0
86.3
0
72.9
0
84.1
0
88.8
0
79.1
0
2001 2011
Perc
ent
Rural
Urban
Persons Males Females
INDIA

34 | PUBLIC POLICY INNOVATION FOR HUMAN CAPITAL DEVELOPMENT
TABLE 2
PERCENTAGE DISTRIBUTION OF POPULATION BY AGE GROUP AND GENDER.
Age group2011 2012 2013 2014 2015
Female Male Female Male Female Male Female Male Female Male
0–4 9.5 9.9 9.4 9.9 9.2 9.7 8.7 9.1 8.4 8.8
5–9 9.0 9.4 8.9 9.3 9.0 9.3 8.9 9.2 8.8 9.2
10–14 10.3 10.7 10.1 10.6 9.5 10.0 9.5 9.9 9.5 9.9
15–19 9.8 10.7 9.6 10.3 9.7 10.5 9.8 10.4 9.9 10.5
20–24 10.2 9.4 10.5 9.9 10.4 9.7 10.6 10.0 10.7 10.1
25–29 9.0 9.0 8.9 8.8 9.3 9.2 9.6 9.3 9.8 9.5
30–34 7.5 7.4 7.8 7.8 7.7 7.8 7.8 7.9 7.9 8.0
35–39 7.2 6.9 6.9 6.7 7.2 7.0 7.2 6.9 7.1 6.9
40–44 5.8 5.9 6.2 6.2 6.0 6.0 6.0 6.2 6.0 6.1
45–49 5.4 5.4 5.2 5.1 5.5 5.4 5.3 5.3 5.3 5.3
50–54 3.6 4.0 3.9 4.3 3.9 4.3 4.2 4.4 4.2 4.3
55–59 4.2 3.4 4.0 3.2 3.8 3.2 3.8 3.4 3.8 3.4
60–64 2.7 2.7 3.0 3.0 3.1 2.9 3.1 3.0 3.1 3.0
65–69 2.4 2.1 2.3 2.1 2.3 2.1 2.2 2.1 2.2 2.1
70+ 3.3 2.9 2.9 2.4 3.4 2.8 3.3 2.9 3.2 2.8
PERCENTAGE DISTRIBUTION OF POPULATION BY AGE GROUP AND GENDER.
FIGURE 4
12.0
10.0
8.0
6.0
4.0
2.0
0.0
Female Male
Perc
enta
ge
Age group
0–4 5–9 10–14 15–19 20–24 25–29 30–34 35–39 40–44 45–49 50–54 55–59 60–64 65–69 70+
Source: Sample Registration System, Office of the Registrar General, India.Note: Total may not add up to 100 due to rounding off.
INDIA
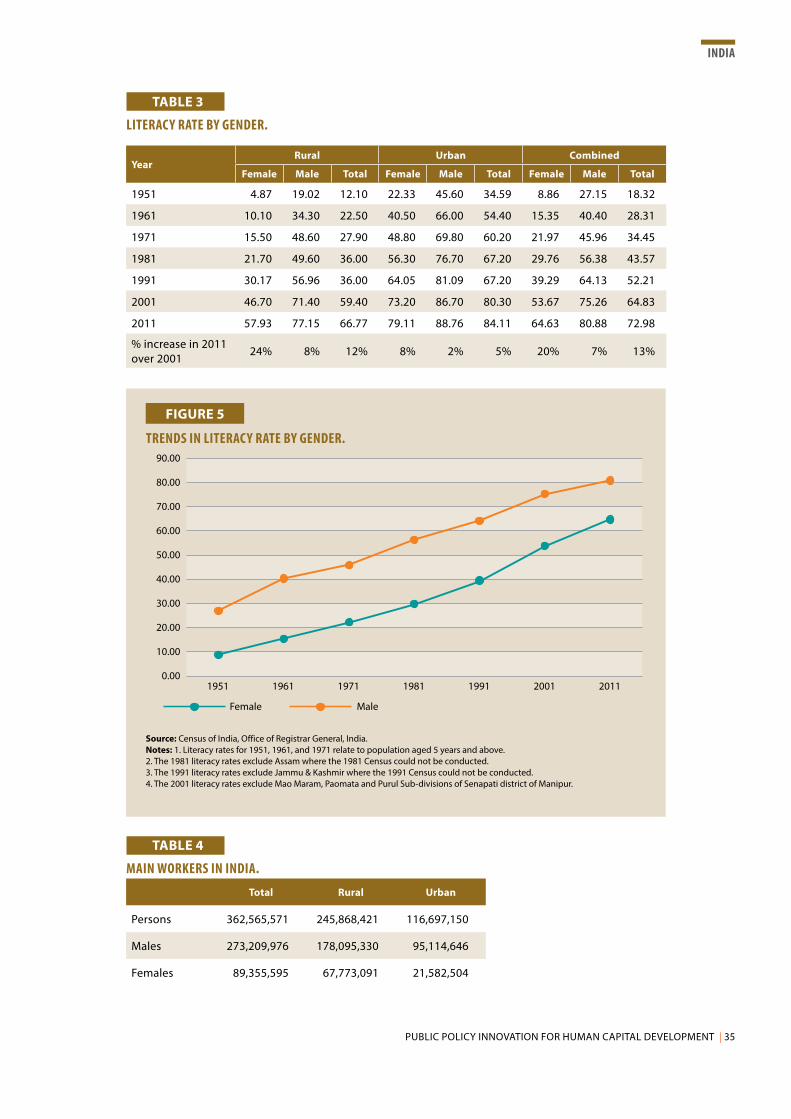
PUBLIC POLICY INNOVATION FOR HUMAN CAPITAL DEVELOPMENT | 35
TABLE 3
LITERACY RATE BY GENDER.
YearRural Urban Combined
Female Male Total Female Male Total Female Male Total
1951 4.87 19.02 12.10 22.33 45.60 34.59 8.86 27.15 18.32
1961 10.10 34.30 22.50 40.50 66.00 54.40 15.35 40.40 28.31
1971 15.50 48.60 27.90 48.80 69.80 60.20 21.97 45.96 34.45
1981 21.70 49.60 36.00 56.30 76.70 67.20 29.76 56.38 43.57
1991 30.17 56.96 36.00 64.05 81.09 67.20 39.29 64.13 52.21
2001 46.70 71.40 59.40 73.20 86.70 80.30 53.67 75.26 64.83
2011 57.93 77.15 66.77 79.11 88.76 84.11 64.63 80.88 72.98
% increase in 2011 over 2001
24% 8% 12% 8% 2% 5% 20% 7% 13%
TABLE 4
MAIN WORKERS IN INDIA.
Total Rural Urban
Persons 362,565,571 245,868,421 116,697,150
Males 273,209,976 178,095,330 95,114,646
Females 89,355,595 67,773,091 21,582,504
TRENDS IN LITERACY RATE BY GENDER.
FIGURE 5
0.00
10.00
20.00
30.00
40.00
50.00
60.00
70.00
80.00
90.00
1951 1961 1971 1981 1991 2001 2011
Female Male
Source: Census of India, Office of Registrar General, India.Notes: 1. Literacy rates for 1951, 1961, and 1971 relate to population aged 5 years and above. 2. The 1981 literacy rates exclude Assam where the 1981 Census could not be conducted.3. The 1991 literacy rates exclude Jammu & Kashmir where the 1991 Census could not be conducted.4. The 2001 literacy rates exclude Mao Maram, Paomata and Purul Sub-divisions of Senapati district of Manipur.
INDIA

36 | PUBLIC POLICY INNOVATION FOR HUMAN CAPITAL DEVELOPMENT
TABLE 5
LABOR FORCE PARTICIPATION RATES FOR PERSONS ABOVE 15 YEARS OF AGE, 2015–16.
CountryRural Urban Total
Female Male Person Female Male Person Female Male Person
India 30.2% 75.7% 53.9% 14.8% 67.1% 41.8% 25.8% 73.3% 50.5%
Table 5 provides details of the labor force participation rate for persons aged 15 years and above for the period 2015–16. Overall, only 50% of labor force is employed. As also stated in the table, the labor force participation rate in rural areas is comparatively higher than in urban areas.
MAIN WORKERS IN RURAL AND URBAN AREAS (2001 VS 2011).
FIGURE 6
Main workers
Total400,000,000
300,000,000
200,000,000
100,000,000
0
313,
007,
641
240,
149,
974
72,8
57,6
67
362,
565,
571
273,
209,
976
89,3
55,5
95
2001 2011
Num
ber
Rural300,000,000
250,000,000
200,000,000
150,000,000
100,000,000
50,000,000
0
229,
186,
552
169,
101,
251
60,0
85,3
01
245,
868,
421
178,
095,
330
67,7
73,0
91
2001 2011
Num
ber
Urban140,000,000
120,000,000
100,000,000
80,000,000
60,000,000
40,000,000
20,000,000
0
83,8
21,0
89
71,0
48,7
23
12,7
72,3
66
116,
697,
150
95,1
14,6
46
21,5
82,5
04
2001
Persons
2011
Num
ber
Males Females
INDIA

PUBLIC POLICY INNOVATION FOR HUMAN CAPITAL DEVELOPMENT | 37
TABLE 6
PROPORTION OF UNEMPLOYED FOR PERSONS AGED 15 YEARS AND ABOVE, 2015–16.
CountryRural Urban Total
Female Male Person Female Male Person Female Male Person
India 1.5 2.3 1.9 1.8 2.1 1.9 1.6 2.2 1.9
Note: 1. The rate is according to Usual Principal & Subsidiary Status Approach (ps+ss)2. Total includes ‘transgenders’ also. [2].
Table 6 shows that the proportion of unemployed males is higher than the proportion of unemployed females in both urban and rural areas as well as for the population as a whole.
Core Industry Sectors in IndiaCore industry sectors are those major sectors that act as the backbone for all other industry sectors. Eight core sectors have been identified. These are coal, crude oil, natural gas, petroleum refinery products, fertilizers, steel, cement, and electricity, which together constitute 40.27% of the total weight of items included in Index of Industrial Production (IPP). The weights assigned to individual core sectors are, petroleum refinery production (28.04%), electricity generation (19.85%), steel production (17.92%), coal production (10.33%), crude oil production (8.98%), natural gas production (6.88%), cement production (5.37%), and fertilizers production (2.63%).
Industry accounts for 26% of the GDP and employs 22% of the total workforce in India. According to The World Bank, India’s industrial manufacturing GDP output in 2015 was sixth-largest in the world on current USD basis (USD559 billion), and ninth-largest on inflation-adjusted constant 2005 USD basis (USD197.1 billion).
Role of Private Sector in IndiaIndia being a mixed economy, major importance is given to private sector for attaining rapid economic development.
The major areas where private sector is involved in Indian economy are
1. industrial development;
2. agriculture;
3. trading;
4. infrastructure;
5. services sector; and
6. small-scale and cottage industries.
Based on the roles and responsibilities of the private sector, the government has been encouraging private sector by implementing various supporting measures for promotion and development of this sector.
INDIA

38 | PUBLIC POLICY INNOVATION FOR HUMAN CAPITAL DEVELOPMENT
Role of Public Sector in IndiaFor the greater development of the economy, it is imperative that the public sector is strengthened. These companies are defined as public sector units (PSUs). Initially, nine PSUs were given autonomy and accorded the Navratna status in 1997. In 2010, the government recognized a higher, Maharatna category, which advances a company’s outlay ceiling from INR10,000 million to INR50,000 million. Further, two categories of Miniratnas were created, wherein companies are accorded less extensive financial autonomy (see Table 7).
TABLE 7
PSUS IN INDIA.Maharatna Miniratna Category-I Miniratna Category-II
Eligibility Three years with an average annual net profit of over INR5,000 crore, or
Average annual net worth of INR10,000 crore for three years, or average annual turnover of INR20,000 crore for 3 years (against INR25,000 crore prescribed earlier)
Has made profits continuously for the last three years or earned a net profit of INR30 crore or more in one of the three years
Has made profits continuously for the last three years and has a positive net worth
Benefits for investment
INR1,000–5,000 crore, or free to decide on investments up to 15% of net worth in a project
Up to INR500 crore or equal to net worth, whichever is lower
Up to INR300 crore or up to 50% of net worth, whichever is lower
List of State-owned EnterprisesPSUs in India are also categorized based on their distinct nonfinancial aims and enumerated under Section 8 of Companies Act, 2013 (erstwhile Section 25 of Companies Act, 1956).
As on 13 September 2017, there were eight Maharatnas, 16 Navratnas, and 74 Miniratnas. There were nearly 300 central public-sector enterprises (CPSEs) in total.
The Maharatnas are
1. National Thermal Power Corporation (NTPC);
2. Oil and Natural Gas Corporation (ONGC);
3. Steel Authority of India Limited (SAIL);
4. Bharat Heavy Electricals Limited (BHEL);
INDIA

PUBLIC POLICY INNOVATION FOR HUMAN CAPITAL DEVELOPMENT | 39
5. Indian Oil Corporation Limited (IOCL);
6. Coal India Limited (CIL);
7. Gas Authority of India Limited (GAIL); and
8. Bharat Petroleum Corporation Limited (BPCL).
The Navratnas are
1. Bharat Electronics Limited (BEL);
2. Container Corporation of India (CONCOR);
3. Engineers India Limited (EIL);
4. Hindustan Aeronautics Limited (HAL);
5. Hindustan Petroleum (HPCL);
6. Mahanagar Telephone Nigam Limited (MTNL);
7. National Aluminium Company (NALCO);
8. National Buildings Construction Corporation (NBCC);
9. National Mineral Development Corporation (NMDC);
10. Neyveli Lignite Corporation Limited (NLCIL);
11. Oil India Limited (OIL);
12. Power Finance Corporation;
13. Power Grid Corporation of India Limited;
14. Rashtriya Ispat Nigam Limited;
15. Rural Electrification Corporation; and
16. Shipping Corporation of India (SCI).
Some of the significant roles of the public sector in the economic development of a country like India are
• promoting economic development at a rapid pace by filling gaps in the industrial structure;
• promoting suitable infrastructural facilities for the growth of the economy;
INDIA

40 | PUBLIC POLICY INNOVATION FOR HUMAN CAPITAL DEVELOPMENT
• carrying out activities of economic importance to the economy in the strategically significant development areas;
• protecting the economy from monopoly and concentration of power;
• maintaining balanced regional development and diversifying scarce resources for the development of underdeveloped areas of the country;
• reducing the income disparities by bridging the gap;
• creating better and secure employment opportunities by making heavy investments in diversified sectors;
• attaining autonomy in different technologies as per requirement;
• removing dependence on foreign aid and foreign technology;
• exercising social control and regulation using various public finance institutions;
• monitoring the sensitive sectors such as delivery system, assigning the scarce imported goods rationally etc.; and
• reducing the burden of balance of payments by encouraging export and reducing imports.
Policy for Micro, Small, and Medium Enterprises The government had enacted the Micro, Small and Medium Enterprises Development (MSMED) Act, 2006. It stepped up the investment limit in plants and machinery to INR50 million for small enterprises and INR100 million for medium enterprises, thus reducing the regulatory interface with the majority of the industrial units. Over a period of time, government has pruned the list of items reserved for exclusive manufacturing by the micro and small enterprises (MSE), vide Notification No. 998(E) dated 10 April 2015, when 20 items which were earlier reserved for exclusive manufacturing by the MSE sector have been dereserved. At present, no item is reserved for exclusive manufacturing by the MSE sector.
Industries Reserved for Public SectorConsistent with the policy of liberalization of the domestic industry, the number of industries reserved for the public sector has also been reduced. In 2014, private investment in rail infrastructure was permitted. Consequently, at present only two industrial sectors and their segments are reserved for public sector. These are
1. atomic energy; and
2. railway operations other than construction, operation, and maintenance of
• suburban corridor projects through public-private partnership (PPP);
• high-speed train project;
INDIA

PUBLIC POLICY INNOVATION FOR HUMAN CAPITAL DEVELOPMENT | 41
• dedicated freight lines;
• rolling stock including train sets, and locomotives/ coaches manufacturing and maintenance facilities;
• railway electrification;
• signaling systems;
• freight terminals;
• passenger terminals;
• infrastructure in industrial park pertaining to railway line/sidings including electrified railway lines and connectivity to main railway line; and
• mass rapid transport systems.
Accordingly, now private investment (domestic as well as foreign) in construction, operation, and maintenance of the above segments has been allowed.
Industrial Policies in IndiaIndian economy has had severe problems of illiteracy, poverty, low per capita income, industrial backwardness, and unemployment. Since the country’s Independence in 1947, drastic steps were taken to begin an era of industrial development, which involved framing rules and regulations for various industries.
The main aim of the government through the industrial policies was to free the Indian industry from the constraints of licensing. The regulatory roles of the Indian government refer to the policies towards industries and their establishment, functioning, expansion, growth, and management.
The industrial policies of India in a chronological order are
1. Industrial Policy of 1948;
2. Industrial policy of 1956;
3. Industrial policy of 1969;
4. Industrial policy of 1973;
5. Industrial policy of 1977;
6. Industrial policy of 1980;
7. Industrial policy of 1985–86; and
8. Industrial Policy 1991.
INDIA

42 | PUBLIC POLICY INNOVATION FOR HUMAN CAPITAL DEVELOPMENT
Economic Reform Policy of India, 1991 The thrust of this new economic policy was to create a more competitive environment in the economy and improve the productivity and efficiency of the system. This could be achieved by removing the barriers to entry and the restrictions on the growth of firms.
Foreign Direct Investment since 1991During 1992–93, several supplementary measures were taken by Government of India to boost investment flows through direct foreign investment, portfolio investment, NRI investment and deposits, and investment in global depository receipts.
Data shows that approvals for FDI in 1991 were only USD325 million, which progressively increased to USD3.56 billion in 1993, USD11.14 billion in 1996, USD15.7 billion in 1997, and USD55.1 billion in 1998. Again, the real inflows of FDI gradually increased from USD154,5 million (INR351.4 crore) in 1991 to USD573.8 million (INR1,786.0 crore) in 1993; USD2,383 million (INR8,431 crore) in 1996; and USD$ 3.3 billion (INR12,085 crore) in 1997.
National Design Policy 2007The strategy to achieve the vision would focus on solidification of quality design education at different levels, promoting use of designs by small-scale and cottage industries and crafts, enabling active involvement of industry and creators in the development of the design profession, branding, and positioning of Indian design within India and overseas, enhancing design and design-service exports, and creating an enabling environment that recognizes and rewards original designs.
National Manufacturing Policy 2011The main motto is to enhance the manufacturing sector to increase its share of GDP to 25% and create job opportunities. The policy is framed on the basis of industrial growth, in partnership with the states. The central government will create the enabling policy framework and provide incentives for infrastructure development on a PPP basis through suitable financing instruments, while state governments will be stimulated to adopt the instrumentalities provided in the policy.
National investment and manufacturing zones (NIMZs) are significant instruments of the policy. These zones are large integrated industrial townships with state-of-art-infrastructure, and are designed to provide a favorable environment for manufacturing industries. So far, 14 NIMZs have been granted in-principle approval outside the DMIC region, out of which the NIMZs at Prakasam in Andhra Pradesh, Medak in Telangana, and Kalinganagar (Jajpur district) in Odisha have been granted final approval.
National IPR Policy, 2016The policy recognizes the abundance of creative and innovative dynamisms that flow in India, and the necessity to tap into and channelize these energies towards a healthier and brighter future for all. The National IPR Policy is a vision document that involves and brings to a single platform all IPRs.
Major Industrial Promotion Instruments [3]As India gears up for increased industrial promotion, listed below are some of the instruments that have contributed to the overall industrial growth and development of India:
1. Federation of Indian Export Organisations is a trade promotion organization in India, jointly established in 1965 by the Ministry of Commerce, Government of India, and the
INDIA
PUBLIC POLICY INNOVATION FOR HUMAN CAPITAL DEVELOPMENT | 43
private trade and industry. The organization is responsible for representing and assisting Indian entrepreneurs and exporters in foreign markets.
2. Software Technology Parks of India is a society established in 1991 by the Indian Ministry of Electronics and Information Technology with the objective of encouraging, promoting, and boosting the export of software from India.
3. Make in India initiative is a brainchild of Prime Minister Narendra Modi, who aims to make India a manufacturing hub to create self-reliance and increased employment and economic activity, by encouraging both multinational and domestic companies to manufacture their products within the country.
Context of Human Resource DevelopmentAccording to South Pacific Commission, “Human Resource Development is equipping people with relevant skills to have a healthy and satisfying life.” The American Society for Training and Development says, “Human resource development is the process of increasing the capacity of the human resource through development. It is thus the process of adding value to individuals, teams or an organization as a human system.”
National Skills Qualification FrameworkThe National Skills Qualification Framework (NSQF) classifies qualifications by levels of knowledge, skills, and talent. These levels are distinct in terms of learning outcomes, which the learner must possess, irrespective of whether they were learnt through formal, nonformal or informal learning. In that sense, the NSQF is a quality assurance framework.
Skillset Availability in IndiaTable 8 lists availability of skillsets in the country and ranks the states for each skillset while Figure 7 provides a snapshot of the training need in view of the growing skills gap.
Role of Industry Sector in Distribution of Income and WealthThe industry acts as a means to achieve more equitable distribution of national income (See Tables 9 and 10).
The growth of cottage and small-scale industries safeguards equitable distribution of income and wealth. The presence of small and cottage industries is much more diversified and spread across millions of people, while the large-scale industries are parented by only a few big industrial houses.
Figure 8 shows an increasing trend in the employment rates of the country. There was 5% increase in employability in the year 2018 compared to 2017. There was approximately 12% increase in employment rate in the span of five years ranging from 2013 to 2018.
From Figure 9, we observe that in 2018, there was a slight decrease in employment in the engineering domain, compared with 2017. However, the overall rate remained higher compared with other domains. Polytechnic and B.Pharmacy domains had significant increases in employability. B.Com and MBA domain students had less probability of getting placed unless equipped with additional skills.
INDIA

44 | PUBLIC POLICY INNOVATION FOR HUMAN CAPITAL DEVELOPMENT
TABLE 8
STATE-WISE SKILLSETS AVAILABLE IN THE COUNTRY.
Ranking Learning agility
Adaptability Interpersonal skills
Emotional intelligence
Conflict resolution
Self determination
1 Karnataka Gujarat Delhi Kerala Tamil Nadu Kerala
2 Delhi Maharashtra Karnataka GujaratAndhra Pradesh
Karnataka
3 Punjab Kerala Maharashtra Karnataka Karnataka Maharashtra
4 Maharashtra KarnatakaMadhya Pradesh
Andhra Pradesh
GujaratMadhya Pradesh
5 Uttar Pradesh Delhi KeralaMadhya Pradesh
Madhya Pradesh
Delhi
6 KeralaMadhya Pradesh
Uttar Pradesh Maharashtra Maharashtra Uttar Pradesh
7Madhya Pradesh
Uttar Pradesh Gujarat Tamil Nadu Punjab Gujarat
8Andhra Pradesh
Punjab Punjab Uttar Pradesh Uttar Pradesh Punjab
9 Gujarat Andhra Pradesh
Andhra Pradesh
Delhi Kerala Tamil Nadu
10 Tamil Nadu Tamil Nadu Tamil Nadu Punjab DelhiAndhra Pradesh
Location-wise EmployabilityTable 11 shows the cities with high employability.
Gender-wise EmployabilityAs seen in Figure 10, there was a decline in the female employability rate in 2018, compared to 2017. It dropped from an all-time high of 41% in 2017 to 40% in 2018. On the other hand, male employability score grew significantly from 40% in 2017 to 47% in 2018. [5]
ESTIMATED TRAINING NEED FOR THE PERIOD 2017–22 [4].
FIGURE 7
Automotive,auto componentsand capital goods
41 lakh
Logistics42.9 lakh
Tourism andhospitality
49 lakh
Furniture and �ttings52.6 lakh
Textile handloomand handicraft
60 lakh
Construction320 lakh
Retail107 lakh
Beauty and wellness82 lakh
Electronics andIT/ITeS
69 lakh
Road transportand highways
62.2 lakh
akh
INDIA
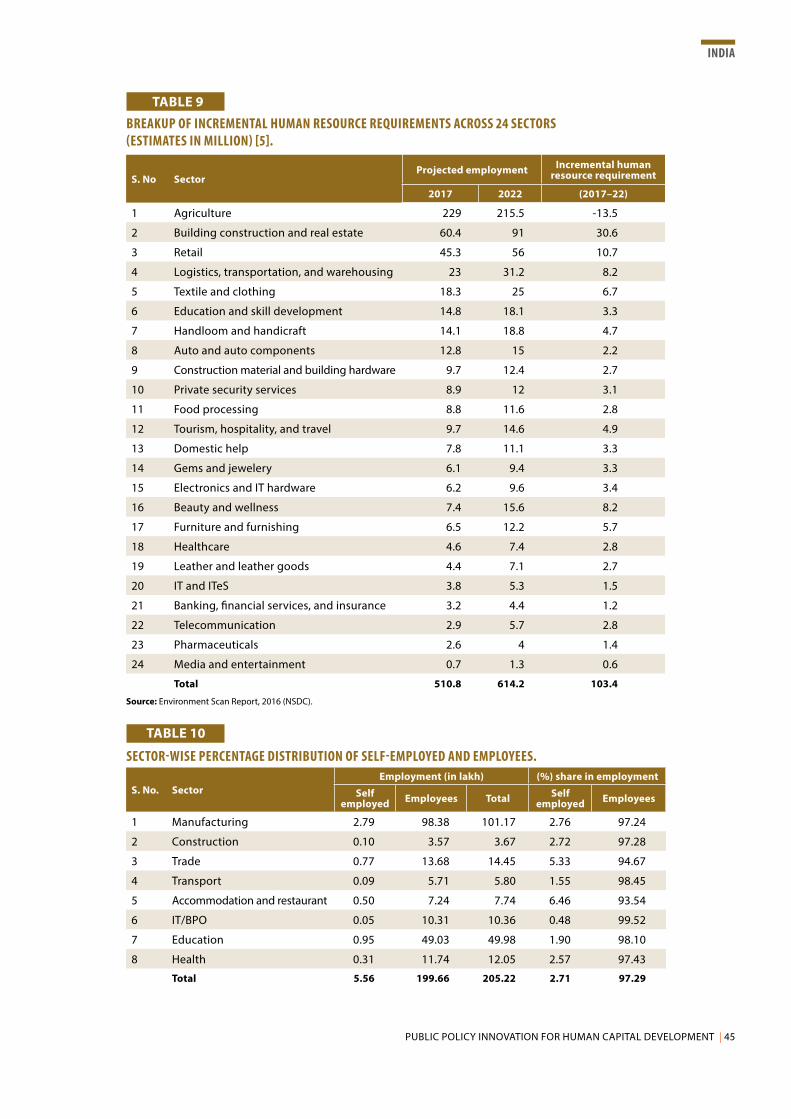
PUBLIC POLICY INNOVATION FOR HUMAN CAPITAL DEVELOPMENT | 45
TABLE 9
BREAKUP OF INCREMENTAL HUMAN RESOURCE REQUIREMENTS ACROSS 24 SECTORS (ESTIMATES IN MILLION) [5].
S. No SectorProjected employment Incremental human
resource requirement
2017 2022 (2017–22)
1 Agriculture 229 215.5 -13.5
2 Building construction and real estate 60.4 91 30.6
3 Retail 45.3 56 10.7
4 Logistics, transportation, and warehousing 23 31.2 8.2
5 Textile and clothing 18.3 25 6.7
6 Education and skill development 14.8 18.1 3.3
7 Handloom and handicraft 14.1 18.8 4.7
8 Auto and auto components 12.8 15 2.2
9 Construction material and building hardware 9.7 12.4 2.7
10 Private security services 8.9 12 3.1
11 Food processing 8.8 11.6 2.8
12 Tourism, hospitality, and travel 9.7 14.6 4.9
13 Domestic help 7.8 11.1 3.3
14 Gems and jewelery 6.1 9.4 3.3
15 Electronics and IT hardware 6.2 9.6 3.4
16 Beauty and wellness 7.4 15.6 8.2
17 Furniture and furnishing 6.5 12.2 5.7
18 Healthcare 4.6 7.4 2.8
19 Leather and leather goods 4.4 7.1 2.7
20 IT and ITeS 3.8 5.3 1.5
21 Banking, financial services, and insurance 3.2 4.4 1.2
22 Telecommunication 2.9 5.7 2.8
23 Pharmaceuticals 2.6 4 1.4
24 Media and entertainment 0.7 1.3 0.6
Total 510.8 614.2 103.4
Source: Environment Scan Report, 2016 (NSDC).
TABLE 10
SECTOR-WISE PERCENTAGE DISTRIBUTION OF SELF-EMPLOYED AND EMPLOYEES.
S. No. SectorEmployment (in lakh) (%) share in employment
Self employed Employees Total Self
employed Employees
1 Manufacturing 2.79 98.38 101.17 2.76 97.24
2 Construction 0.10 3.57 3.67 2.72 97.28
3 Trade 0.77 13.68 14.45 5.33 94.67
4 Transport 0.09 5.71 5.80 1.55 98.45
5 Accommodation and restaurant 0.50 7.24 7.74 6.46 93.54
6 IT/BPO 0.05 10.31 10.36 0.48 99.52
7 Education 0.95 49.03 49.98 1.90 98.10
8 Health 0.31 11.74 12.05 2.57 97.43
Total 5.56 199.66 205.22 2.71 97.29
INDIA

46 | PUBLIC POLICY INNOVATION FOR HUMAN CAPITAL DEVELOPMENT
EMPLOYABILITY TREND RATES.
FIGURE 8
2014
33.95%
37.22%38.12%
40.44%
45.60%
2015 2016 2017 2018
50
40
30
DOMAIN-WISE EMPLOYABILITY.
FIGURE 9
MBA
Engineering
BA
B.Com
B.Sc
MCA
ITI
Polytechnic
B.Pharma
0 10 20 30 40 50 60
2017 2018
INDIA
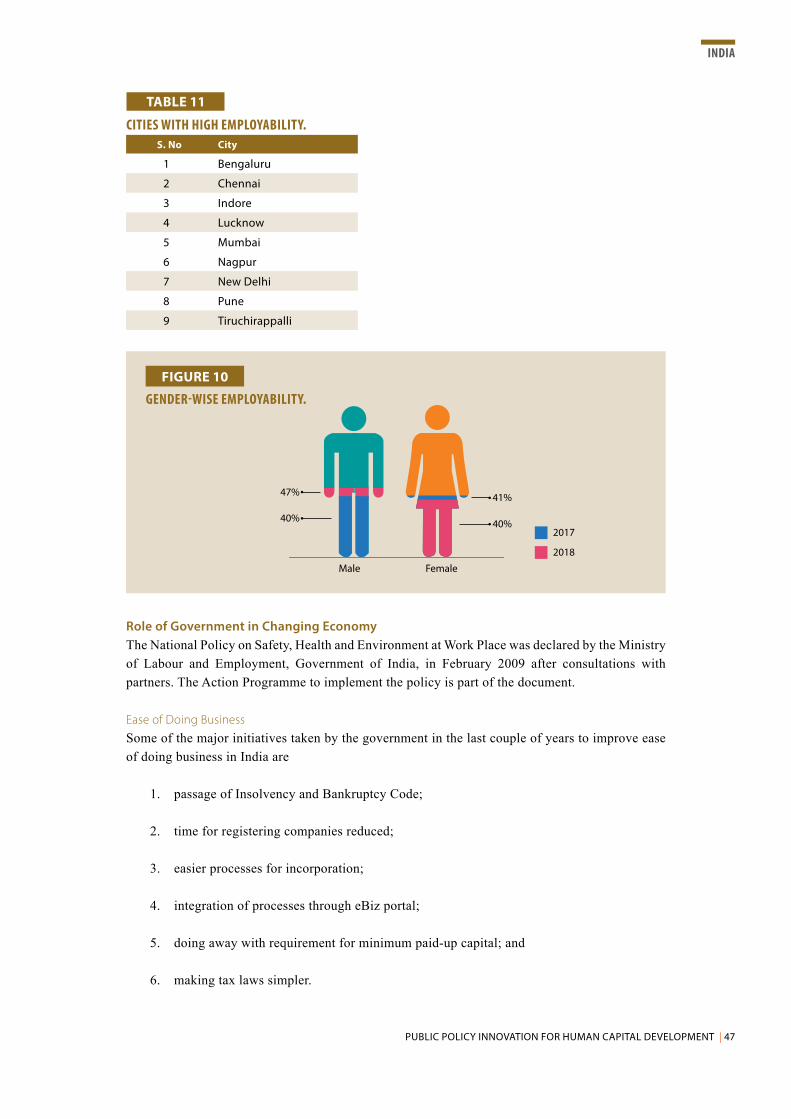
PUBLIC POLICY INNOVATION FOR HUMAN CAPITAL DEVELOPMENT | 47
TABLE 11
CITIES WITH HIGH EMPLOYABILITY.S. No City
1 Bengaluru
2 Chennai
3 Indore
4 Lucknow
5 Mumbai
6 Nagpur
7 New Delhi
8 Pune
9 Tiruchirappalli
Role of Government in Changing EconomyThe National Policy on Safety, Health and Environment at Work Place was declared by the Ministry of Labour and Employment, Government of India, in February 2009 after consultations with partners. The Action Programme to implement the policy is part of the document.
Ease of Doing BusinessSome of the major initiatives taken by the government in the last couple of years to improve ease of doing business in India are
1. passage of Insolvency and Bankruptcy Code;
2. time for registering companies reduced;
3. easier processes for incorporation;
4. integration of processes through eBiz portal;
5. doing away with requirement for minimum paid-up capital; and
6. making tax laws simpler.
INDIA
GENDER-WISE EMPLOYABILITY.
FIGURE 10
2018
201740%
47%
Male
41%
40%
Female

48 | PUBLIC POLICY INNOVATION FOR HUMAN CAPITAL DEVELOPMENT
Industrial Safety and Security in IndiaAs per Ministry of Labour and Employment data, a number of acts were implemented for employment safety and security of the workers. These include acts in the areas of industrial safety and health (4 acts); child and women labor (16); social security (18); payment of wages, bonus, and minimum wages (20); labor welfare (25); and employment and training (2).
Mahatma Gandhi National Rural Employment Guarantee Act The Mahatma Gandhi National Rural Employment Guarantee Act (MGNREGA), also known as Mahatma Gandhi National Rural Employment Guarantee Scheme (MNREGS), is the Indian legislation enacted on 25 August 2005.
The objective of the Act is to enhance livelihood security in rural areas by providing at least 100 days of guaranteed wage employment in a financial year to every household whose adult members volunteer to do unskilled manual work. See Table 12 and Figure 11 for MGNREGA statistics.
TABLE 12
MGNREGA STATISTICS OF THE BENEFITTED.National
1. Total no. of districts 685
2. Total no. of blocks 6,887
3. Total no. of GPs 262,380
Job card
4. Total no. of job cards issued (in crore) 12.67
5. Total no. of workers (in crore) 24.93
6. Total no. of active job cards (in crore) 7.11
7. Total no. of active workers (in crore) 10.97
8. (i) SC workers against active workers (%) 19.96
9. (ii) ST workers against active workers (%) 16.4
ACTIVE WORKERS BY STATE, 2018–19.
FIGURE 11
100
75
50
25
0TR NL SK CH MN MP AS WB KN PB KL HR PC OR MH BH DN
MZ TN JK MG UT AR TS AP HP UP RJ AN JH GJ GO LK
Percentage of workers
Active workers 2018–19
States (short names)
INDIA

PUBLIC POLICY INNOVATION FOR HUMAN CAPITAL DEVELOPMENT | 49
MGNREGA’s performance since its inception has been impressive. Person days generated up to the period under consideration amounted to 25,806.6 million, while total expenditure was INR4,631,562.1 million. As of 14 June 2018, a total of 11,622,903 workers were expected on 1,017,401 worksites, as per e-MustRoll.
Role of Civil Society in Economic DevelopmentCivil societies have a major role to play in sustainable economic development. When there is a gap between country’s resources and citizens’ necessities, civil societies can have a closer view of the problems and resolve them at a minor level. The collaboration between the government and the civil society could help address the problems in a better way.
Role of Government in Economic DevelopmentThe government has both direct and indirect roles in economic development. The direct role includes the protection of agricultural and industrial sectors by implementing policies and reforms to improve the outputs. Increased investment in socioeconomic infrastructure like energy, power, transport, communications, education, health, and housing is aimed to develop the agriculture and industrial sectors.
Higher Education and Research and DevelopmentIndia, since its independence, has strived hard to be at par with the changing global economy. Toward that end, the country has invested in building a system of higher education, keeping in view the intra- and inter-regional imbalances. Determined efforts were made to build a network of universities, and their affiliated colleges, which provided great exposure to a country of vast diversities in language as also in prevailing standards of education at the lower levels. Indian education system has evolved to a level where it is now ranked well in terms of number of higher-education institutions. Table 13 provides a view of the universities existing in the country in December 2018.
TABLE 13
NO. OF UNIVERSITIES IN THE COUNTRY AS ON 20 DECEMBER 2018 [7].
Type No of Universities
Central universities 48
State universities 394
Private universities 325
Institutions established through state legislation
Deemed universities 125
Total 892
Universities and Research InstitutesAcademic InformationThe welfare of a nation has a direct relation with industrialization and the effort and resources applied in the pursuit of science. India, having abundant workforce with proper education in science and training in technical skills, can open up possibilities for the industry. It involves huge investment in importing science and technology, i.e., plant and machinery, knowledge, and
INDIA

50 | PUBLIC POLICY INNOVATION FOR HUMAN CAPITAL DEVELOPMENT
technical consultants. The pace of industrialization differs from country to country, based on the capital availability. There is a gap between developed and developing nations, which can be bridged by adopting vigorous measures and putting in the best efforts.
Student Enrollments across SubsectorsCourse levels include diploma, undergraduate, and postgraduate.
Courses include applied arts and crafts, architecture and town planning, architecture, town planning, engineering and technology, management, master’s in computer application, pharmacy, and hotel management and catering.
Institution types encompass unaided-private; private-aided; university managed-private; university managed; university managed (government); government aided; government; central university; deemed university (private); and deemed university (government).
From Figure 12, we interpret that the number of students placed has always been less than the students passed. It is necessary to make the students employment-ready to face the industry requirements and earn their livelihoods.
STUDENT ENROLLMENTS ACROSS SUBSECTORS [8].
FIGURE 12
0M
1M
2M
3M
4M
5M
2012–13 2013–14 2014–15 2015–16 2016–17 2017–18
Placement Students passed Enrollments Intake
App
rove
d in
take
/enr
ollm
ents
INDIA
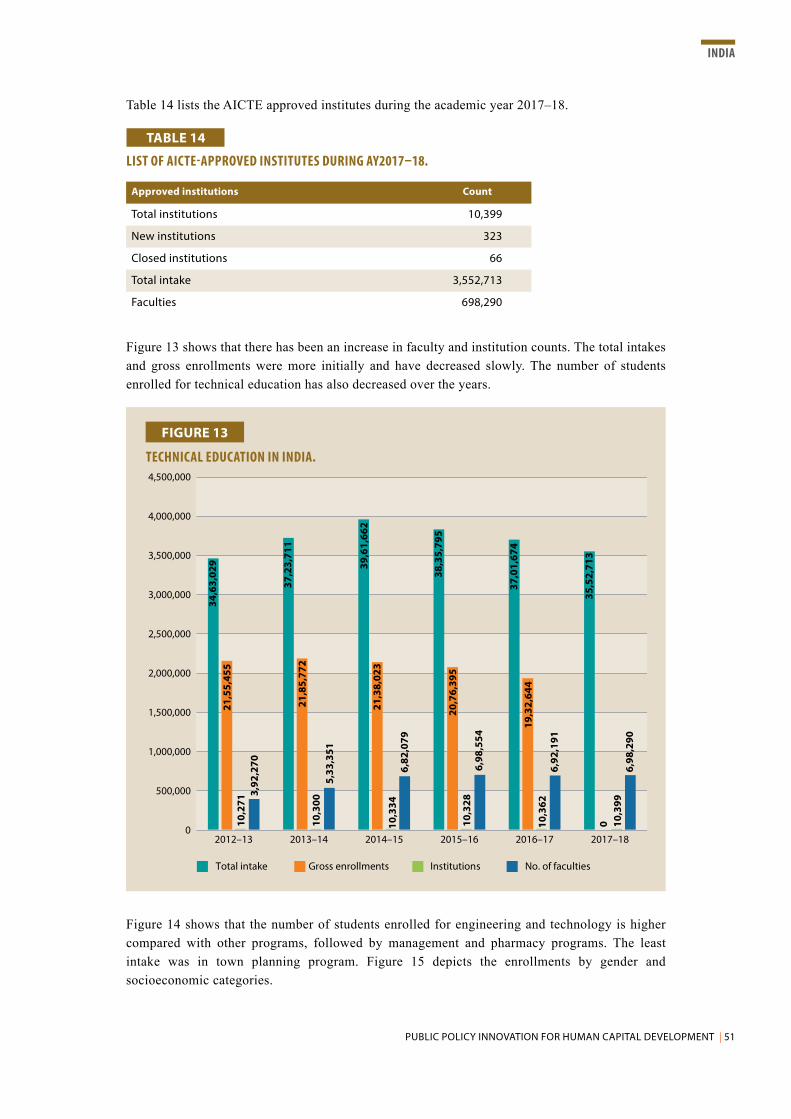
PUBLIC POLICY INNOVATION FOR HUMAN CAPITAL DEVELOPMENT | 51
Table 14 lists the AICTE approved institutes during the academic year 2017–18.
TABLE 14
LIST OF AICTE-APPROVED INSTITUTES DURING AY2017–18.
Approved institutions Count
Total institutions 10,399
New institutions 323
Closed institutions 66
Total intake 3,552,713
Faculties 698,290
Figure 13 shows that there has been an increase in faculty and institution counts. The total intakes and gross enrollments were more initially and have decreased slowly. The number of students enrolled for technical education has also decreased over the years.
Figure 14 shows that the number of students enrolled for engineering and technology is higher compared with other programs, followed by management and pharmacy programs. The least intake was in town planning program. Figure 15 depicts the enrollments by gender and socioeconomic categories.
INDIA
TECHNICAL EDUCATION IN INDIA.
FIGURE 13
0
500,000
1,000,000
1,500,000
2,000,000
2,500,000
3,000,000
3,500,000
4,000,000
4,500,000
2012–13 2013–14 2014–15 2015–16 2016–17 2017–18
Total intake Gross enrollments Institutions No. of faculties
34,6
3,02
921
,55,
455
10,2
713,
92,2
70
37,2
3,71
121
,85,
772
10,3
005,
33,3
51
39,6
1,66
221
,38,
023
10,3
346,
82,0
79
38,3
5,79
520
,76,
395
10,3
286,
98,5
54
37,0
1,67
419
,32,
644
10,3
626,
92,1
91
35,5
2,71
30 10
,399
6,98
,290

52 | PUBLIC POLICY INNOVATION FOR HUMAN CAPITAL DEVELOPMENT
GENDER AND CATEGORY-WISE INTAKE/ENROLLMENTS FOR FIVE YEARS [7].
FIGURE 15
0
200,000
400,000
600,000
800,000
1,000,000
1,200,000
1,400,000
1,600,000
Male Female Male Female Male Female Male Female Male Female
2012–13 2013–14 2014–15 2015–16 2016–17
SC 215,413 68,945 240,255 75,813 274,349 83,388 264,365 87,672 239,603 83,604
ST 45,476 13,727 51,250 15,387 52,061 15,584 53,144 17,061 51,966 17,477
OBC 413,756 362,328 573,193 205,628 545,225 193,648 527,495 191,171 491,189 183,562
OPEN 654,306 246,705 646,331 239,613 606,203 228,402 575,853 221,990 521,954 205,936
1,328,951
691,705
1,511,029
536,441
1,477,838
521,022
1,420,857
517,894
1,304,712
490,579
INDIA
ENROLLMENTS BY PROGRAMS FOR ACADEMIC YEAR 2016–17.
FIGURE 14
0
250K
500K
750K
1,000K
1,250K
1,500K
1,750K
Appliedarts and
crafts
Architecture Engineeringand
technology
Hotelmanagementand catering
Management MCA Pharmacy Townplanning
2,640 6,977
1,543,214
4,844
232,679
32,338109,862
90
Program
Programs vs enrollments for the academic year 2016–17

PUBLIC POLICY INNOVATION FOR HUMAN CAPITAL DEVELOPMENT | 53
Strengthening Higher-education FacultyIndia’s higher-education system has around 45,000 colleges and around 850 universities in the form of central, state, and deemed universities. A large number of faculty is working in private colleges (around 275,000) and technical institutions (around 200,000). In universities, there are nearly 40,000 regular faculty members while a few others are in the form of temporary faculty.
Allocation for Higher Education in IndiaFrom Tables 15 and 16, we can say that a lot of emphasis is given to higher education in India.
TABLE 15
BUDGET ALLOCATION FOR HIGHER EDUCATION [9].
Ministry/department/scheme name 2017–18(in INR million)
2018–19(in INR million)
Higher education 333,300 350,100
CS+CSS of which 55,260 85,120
Rashtriya Uchchatar Shiksha Abhiyan (RUSA) 13,000 14,000
Interest subsidy and contribution for guarantee fund 19,500 21,500
Higher Education Financing Agency (HEFA) 2,500 27,500
e-Shodh Sindu 2,400 1,800
Technical Education Quality Improvement Programme 2,600 2,750
Scholarships for college and university students 3,200 3,400Programme for Apprenticeship Training (scholarships and sti-pends)
1,100 1,250
World-class institutions 500 2,500
Setting up of virtual classrooms 750 900
Madan Mohan Malviya National Mission on Teachers and Teaching 1,200 1,200
ABs of which 268,960 253,390
IIT 78,560 63,260
IIM 10,300 10,360
Cost of Higher Education in UniversitiesThere has been increase in investment from different sources into higher education and the eminent institutes to maintain the quality of education, which in turn leads to the development of the nation. Better higher education helps in nurturing the youth to be industry-ready.
TABLE 16
ALLOCATION OF GRANTS AND SCHOLARSHIPS FOR THE UNIVERSITIES [10]. Revised 2017–18 Budget 2018–19
Revenue Capital Total Revenue Capital Total
Gross 410,159.60 2,500.00 412,659.60 467,780.80 27,520.00 495,300.80
Recoveries -64,035.00 – -64,035.00 -1,45,197.90 – -145,197.90
Receipts – – – – – –
Net 346,124.60 2,500.00 348,624.60 322,582.90 27,520.00 350,102.90
University Grants Commission (UGC)
Support from Gross Budgetary Support
49,227.40 – 49,227.40 30,222.30 – 30,222.30
INDIA
(Continued on next page)

54 | PUBLIC POLICY INNOVATION FOR HUMAN CAPITAL DEVELOPMENT
Revised 2017–18 Budget 2018–19
Revenue Capital Total Revenue Capital Total
Support from Madhyamik and Uchhatar Shiksha Kosh
– – – 17,005.20 – 17,005.20
Total University Grants Commission (UGC)
49,227.40 – 49,227.40 47,227.50 – 47,227.50
Student Financial Aid
Interest Subsidy and contribution for Guarantee Funds
Support from Gross Budgetary Support
19,500.00 – 19,500.00 300.00 – 300.00
Support from Madhyamik and Uchhatar Shiksha Kosh
– – – 21,200.00 – 21,200.00
Total interest subsidy and contribution for guarantee funds
19,500.00 – 19,500.00 21,500.00 – 21,500.00
Scholarship for college and university students
Support from Gross Budgetary Support
2,940.00 – 2,940.00 400.00 – 400.00
Support from Madhyamik and Uchhatar Shiksha Kosh
– – – 3,000.00 – 3,000.00
Total (scholarship for college and university students)
2,940.00 – 2,940.00 3,400.00 – 3,400.00
PM Research Fellowship – – – 750.00 – 750.00
MTech Programme Teaching Assistantship
– – – 350.00 – 350.00
Total student financial aid 22,440.00 – 22,440.00 26,000.00 – 26,000.00
Employment of University Graduates in IndiaThe International Monetary Fund (IMF) has said that India’s young population has the potential to produce an additional 2% per capita GDP growth each year for the next two decades. Although there are no structured studies about the employment of graduates in India, many industrial organizations like Federation of Indian Chambers of Commerce & Industry (FICCI), Confederation of Indian Industry (CII), and The Associated Chambers of Commerce and Industry of India (ASSOCHAM) have done pilot studies and opined that the employability is hardly 18–20%.
Higher-education Policies Related to STEM: Skillsets for Future The four policies for development of science and technology [11] in the country are
1. Science Policy Resolution of 1958;
2. Technology Policy Statement of 1983;
3. Science and Technology Policy of 2003; and
4. Science, Technology and Innovation Policy 2013.
INDIA
(Continued from previous page)

PUBLIC POLICY INNOVATION FOR HUMAN CAPITAL DEVELOPMENT | 55
Science Policy Resolution of 1958: Government of India has decided to pursue and accomplish these aims by offering good conditions of service to scientists and awarding them with honored positions, by associating scientists with the formulation of policies, and by taking such other measures as may be deemed necessary from time to time.
Technology Policy Statement of 1983: The basic objectives of the Technology Policy were stated to be the development of indigenous technology and efficient absorption and adaptation of imported technology appropriate to national priorities and resources. Emphasis was placed on the development of indigenous technology through focus on the aspects of
• inventions;
• enhancing traditional skills and capabilities;
• ensuring timely availability;
• upgradation to prevent obsolescence;
• increasing the demand for indigenous technology;
• preferential treatment;
• Fiscal incentives;
• design engineering;
• engineering consultancy;
• in-house R&D;
• technology acquisition; and
• technology transfer.
Science and Technology Policy 2003: Recognizing the changing context of the scientific enterprise, and to meet present national needs in the new era of globalization, the government enunciated the key objectives of its Science and Technology Policy in 2003.
The Science and Technology Policy 2003 was implemented so as to be in harmony with the world view of the larger human family all around. It ensured that science and technology truly uplifted the Indian people and indeed all of humanity.
Science, Technology and Innovation Policy 2013: India has declared 2010–20 as the ‘Decade of Innovation.’ The government has stressed the need to enunciate a policy to synergize science, technology, and innovation, and has also established the National Innovation Council (NInC).
Global investments in science, technology and innovation were estimated at USD1.2 trillion as of 2009. India’s R&D investment was less than 2.5% of that and under 1% of the country’s GDP.
INDIA

56 | PUBLIC POLICY INNOVATION FOR HUMAN CAPITAL DEVELOPMENT
Increasing gross expenditure in research and development (GERD) to 2% of the GDP has been a national goal for some time. As such, the need has been recognized for
• seeding science and technology (S&T)-based high-risk innovations through new mechanisms;
• fostering resource-optimized, cost-effective innovations across science and technology domains;
• triggering changes in the mindsets and value systems to recognize, respect, and reward performances that create wealth from S&T derived knowledge; and
• creating a robust national innovation system.
The key facilitating institutions are
• Department of Biotechnology (DBT);
• Department of Science & Technology (DST);
• National Science & Technology Entrepreneurship Development Board (NSTEDB);
• Indian Innovation Foundation; and
• Technology Business Incubators (TBI).
Industry–university Interface in Higher EducationThe aspect of rate of return of higher education [12] is equally important. As such, collaboration between universities and industries is very important for skill development (education and training), improvement, acquisition, adoption of knowledge (innovation and technology transfer), and promotion of entrepreneurship (startups and spinoffs). This can help coordinate and encourage R&D agendas, evade duplications, and explore interactions and complementarities of scientific and technological capabilities. University–industry collaborations can help in application of research work and commercialization (see Table 17).
Both, firms and universities, are being benefitted through such arrangements. The universities are able to know the pulse of industry requirements to cater to their needs and provide market-ready human capital. On the other hand, industries are opening up for external sources of knowledge with better insights to innovation strategies. Figure 16 outlines the best practices for industry–university collaborations while Table 18 lists out the priorities to be considered for such collaborations.
Technical and Vocational Education and Training (TVET)TVET System in IndiaIndia has one of the largest technical manpower in the world. However, compared to its population, it is not significant and there is tremendous scope of improvement in this area. The emphasis has been on general education, with vocational education being at the receiving end. This has resulted in large number of educated people remaining unemployed. The phenomenon has now been recognized by the planners and hence there is a greater thrust on vocationalization of education.
INDIA

PUBLIC POLICY INNOVATION FOR HUMAN CAPITAL DEVELOPMENT | 57
INDIA
TABLE 17
INDUSTRY–UNIVERSITY LINKAGE ACTIVITIES [13].
High (relationships)
Research partnerships Interorganizational arrangements for pursuing collaborative R&D, including research consortia and joint projects
Research services
Research-related activities commissioned to universities by industrial clients, including contract research, consulting, quality control, testing, certification, and prototype development
Shared infrastructureUse of university labs and equipment by firms, business incubators, and technology parks located within universities
Medium (mobility)
Academic entrepreneurship
Development and commercial exploitation of technologies pursued by academic inventors through a company they partly own (spinoff companies)
Human resource training and transfer
Training of industry employees, internship programs, postgraduate training in industry, and recommendations to industry of university faculty, research staff, and adjunct faculty of industry participants
Low (transfer)
Commercialization of intellectual property
Transfer of university-generated IP (such as patents) to firms (e.g., via licensing)
Scientific publications Use of codified scientific knowledge within industry
Informal interactionFormation of social relationships, e.g., conferences, meetings, and social networks
SEVEN BEST PRACTICES FOR INDUSTRY–UNIVERSITY COLLABORATION.
FIGURE 16
De�ne the project’s strategic context
Select boundary-spanning project managers
Share the vision with the university’s research team
Invest in long-term relationships
Establish strong communication linkage with the university team
Build broad awareness for the project within the company
Support the work internally both during the contract and after

58 | PUBLIC POLICY INNOVATION FOR HUMAN CAPITAL DEVELOPMENT
Another shortcoming in the area of technical and vocational education is that till now, the number of engineers graduating is more than the diploma holders. [15]
The growth of TVET institutions in India is presented in Figure 17.
The five Acts of Parliament at the central government level that address TVET are
1. The Industrial Training Institutes Act 1961;
2. The Apprentices Act 1961;
3. The Architects Act 1972;
4. The All India Council for Technical Education Act No. 2, 1987; and
5. National Institutes of Technology Act 2007.
Some of the technical education institutions [16] in India are
• All India Council of Technical Education (AICTE);
• 18 Indian Institutes of Technology (IITs), including BHU, Varanasi;
• Indian Institute of Science, Bangalore;
• 19 Indian Institutes of Management (IIMs);
• 31 National Institutes of Technology (NITs);
• Indian Institutes of Information Technology (IIITs);
• Four National Institutes of Technical Teachers’ Training & Research (NITTTRs);
• Four Regional Boards of Apprenticeship/ Practical Training;
INDIA
TABLE 18
PRIORITIES FOR INDUSTRY–ACADEMIA PARTNERSHIPS.University orientation Most developed countries Least developed countries
Teaching university
• Private participation in graduate programs
• Curricula development to improve undergraduate studies
• Joint supervision of PhD studies • Student internships
Research university
• Research consortia and long-term research partnerships to conduct frontier research
• Building absorptive capacity to adopt and diffuse already existing technologies
• Focus on appropriate technologies to respond to local needs
Entrepreneurial university
• Spinoff companies, patent licensing • Business incubation services
• Entrepreneurship education • Entrepreneurship education

PUBLIC POLICY INNOVATION FOR HUMAN CAPITAL DEVELOPMENT | 59
• Six Indian Institutes of Science Education and Research;
• Indian School of Mines, Dhanbad;
• National Institute of Industrial Engineering, Mumbai;
• Three Schools of Planning and Architecture;
• Sant Longowal Institute of Engineering & Technology, Punjab;
GROWTH OF ITIs [14].
FIGURE 17
0
2
4
6
8
10
12
14
16
18
No.
of I
ITs
Seat
ing
capa
city
in la
khs
Year
Year
Increase in seating capacity
59
167
283
298
35
6
354
35
2
357
35
7
357
35
6
356
7
40
83
1
9
70
1
,080
1,2
68
1,4
47
1,7
24
1
,887
2,0
70
2,13
7
2,4
47
2,
651
2,72
1
3,08
3
3
,665
4,
086
4
,172
4
,274
4,46
5
4
,700
4,
877
5
,068
5
,114
5,46
5
6,0
79
7,8
86
8,
085
9,
404
10,
344
1
0,75
0
1
1,96
4
1962
1992
1993
1994
1995
1996
1997
1998
1999
2000
2001
2002
2003
2004
2005
2007
2008
2009
2010
2011
2012
2013
2014
3.8
8
3.9
7
4.0
7
4.2
3
4
.73
5
.73
6
.40
6.7
7
6
.28
6
.51
6.8
6
7.1
0
7
.30
7
.42
7
.49
8
.29
10
.94
11
.20
13
.21
14
.68
1
5.2
3
16
.92
1964
1967
1970
1973
1978
1980
1982
1985
1987
1990
1993
1996
1998
2000
2002
2004
2007
2009
2011
2013
1956
1963
1965
1969
1972
1975
1979
1981
1984
1986
1989
1992
1994
1997
1999
2001
2003
2005
2008
2010
2012
2014
0
2,000
4,000
6,000
8,000
10,000
12,000
14,000
INDIA

60 | PUBLIC POLICY INNOVATION FOR HUMAN CAPITAL DEVELOPMENT
• National Institute of Foundry & Forge Technology, Ranchi;
• North Eastern Regional Institute of Science & Technology, Itanagar;
• Central Institute of Technology, Kokrajhar;
• Indian Institute of Engineering, Science & Technology, Shibpur (West Bengal); and
• 19 IIITs in PPP mode.
Student Enrollments in TVETs across SubsectorsFigures 17 through 20 illustrate the status of student enrollments in TVETs by various categories.
Higher and Technical EducationThe improvement in higher education is being brought through restructuring of academic programs to ensure their relevance for current requirements of the society, broadening the content of science and engineering programs to strengthen fundamental concepts, improving learning opportunities and conditions by updating textbooks and learning material, and improving self-directed learning with modern aids and development of IT network.
Several initiatives aimed at restructuring the higher-education system (both general and technical) and making it relevant to the present needs have also been taken up by the government. The details of such steps are given below. [17]
GENDER AND CATEGORY-WISE ENROLLMENTS IN DIPLOMA, 2012–18.
FIGURE 18
Male Female Male Female Male Female Male Female Male Female Male Female2012–13 2013–14 2014–15 2015–16 2016–17 2017–18
SC 99,286 22,010 115,665 24,560 140,639 28,788 140,643 30,007 134,112 29,519 129,437 30,430ST 21,408 7,178 25,944 6,226 27,805 6,028 28,641 7,690 30,757 8,490 28,450 8,037OBC 141,237 135,256 238,193 46,447 231,116 43,741 227,501 45,621 223,413 45,251 214,358 43,101OPEN 207,392 42,476 219,997 43,112 212,835 41,641 205,060 42,082 190,072 39,201 177,460 38,692
469,323
206,920
599,799
120,345
612,395
120,198
601,845
125,400
578,354
122,461
549,705
120,260
0
100,000
200,000
300,000
400,000
500,000
600,000
700,000
INDIA

PUBLIC POLICY INNOVATION FOR HUMAN CAPITAL DEVELOPMENT | 61
Consultation Process for Formulating New Education Policy (NEP)Ministry of Human Resource Development (MHRD), Government of India has undertaken an unprecedented collaborative, multi-stakeholder, and multi-pronged consultation process for formulating the New Education Policy (NEP). The efforts are aimed at bringing out a new education policy to meet the changing dynamics of the population’s requirement with regard to quality education, innovation, and research. The goal is to make India a knowledge superpower by equipping its students with the necessary skills and knowledge and to eliminate the shortage of
PROGRAMS VS INSTITUTES IN DIPLOMA FOR AY2017–18.
FIGURE 19
0
1,000
2,000
3,000
4,000
5,000
6,000
7,000
Appliedarts and
crafts
Architecture Engineeringand
technology
Hotelmanagementand catering
Management MCA Pharmacy Townplanning
66 171
6,446
106
3,265
1,159
1,633
6
Program
INDIA
CATEGORY-WISE ENROLLMENTS IN DIPLOMA FOR AY2017–18.
FIGURE 20
Minority
OPEN
OBC
ST
SC

62 | PUBLIC POLICY INNOVATION FOR HUMAN CAPITAL DEVELOPMENT
manpower in science, technology, academics, and industry. The three-pronged consultation process included online, grassroots, and national-level systematic deliberations. The draft National Education Policy 2019 is ready and awaiting final approval.
National Institutional Ranking Framework (NIRF)NIRF was launched by the Ministry of Human Resource Development on 29 September 2015. The ranking framework evaluates each higher-education institution on five broad parameters, namely, teaching/learning resources, research, graduation outcomes, outreach/inclusive nature, and the public perception.
Global Initiative of Academic Networks (GIAN) Global Initiative for Academics Network (GIAN) in higher education was launched on 30 November 2015 by the Ministry of Human Resource Development. The program seeks to invite distinguished academicians, entrepreneurs, scientists, and experts from premier institutions across the world, to teach in higher-education institutions in India. The scheme envisages garnering the best international experience for our system of education and enabling interaction of students and faculty with the best academic and industry experts from all over the world.
Study Webs of Active-Learning for Young Aspiring Minds (SWAYAM)This is a web portal where massive open online courses (MOOCs) will be available for various subjects. SWAYAM is an e-education platform that proposes to offer courses from high-school to post-graduate stages in an interactive manner. The IT platform for SWAYAM was built with a capacity to host nearly 2,000 courses. This would provide quality education to more than 30 million students across the country.
Unnat Bharat AbhiyaanUnnat Bharat Abhiyan has been launched for connecting higher education and society to enable technology and its use for development of rural areas. Under this, all technical and higher-education institutions will adopt five villages each, identify the technology gaps, and prepare plans for innovations that could substantially increase the skills, incomes, and growth in rural areas.
Ucchtar Aavishkar AbhiyaanFor promotion of innovation, all IITs have been encouraged to work with the industry to identify areas where innovation is required and come up with solutions that could be brought up to the commercialization level. For this purpose, the Ucchtar Aavishkar Abhiyan was launched in 2018.
Pandit Madan Mohan Malaviya National Mission on Teachers and TeachingIt was launched on 25 December 2014. With the fast-paced expansion of the education system in the country, improving quality has come to occupy center stage in educational development. It is recognized that teachers hold the key to success of efforts made in this direction.
Impacting Research Innovation & Technology (IMPRINT)With a view to define the research agenda for higher-education institutions, the IMPRINT India initiative was launched in 2015. This initiative ensures that the higher-education institutions conduct research that is socially relevant, thereby contributing to the economic growth of the society as a whole. Under this initiative, 10 domains have been identified that could substantially impact the living standards of the rural areas. These are, healthcare technology, energy security, rural–urban housing design, nanotechnology, water/river system, advanced materials, computer science and ICT, manufacturing technology, advanced security, and environment/climate change.
INDIA

PUBLIC POLICY INNOVATION FOR HUMAN CAPITAL DEVELOPMENT | 63
Promoting StartupsStartup and research parks were proposed to be set up on a 50:50 fund sharing basis, covering all IITs, NITs, and some IIITs and central universities. These parks would incubate the startups and handhold them until they reached the stage of commercialization, normally for a period of five years. IIT Madras Research Park was among the first to become fully functional.
Technical Education for Unemployed YouthWith a view to ensure that the existing infrastructure in engineering and polytechnic colleges is used for spreading engineering skills among the unemployed youth, a program called Technical Skills to Unemployed Youth was planned under the overall framework of Pradhan Mantri Kaushal Vikas Yojna (PMKVY). It was proposed to involve all engineering and polytechnic institutions in this effort and thereby aim to train one million youth in engineering skills over a period of three years.
Campus ConnectUnder the Campus Connect program, all central universities in the country are to be connected through Wi-Fi network at a cost of around INR3,200 million. Under this, all the classrooms, libraries, laboratories, hostels, and places frequented by the students would be connected through secured Wi-Fi hotspots, providing the students access to educational and information resources on a 24x7 basis. This project was to be implemented by Education and Research Network (ERNET).
National Digital LibraryThe Government has envisaged the creation of a Nation Digital Library (NDL) with the objective to provide access to the knowledge repository in terms of e-books and other e-learning material.
e-Shodh SindhuThis scheme will provide funding for subscription of electronic resources in the country through Department of Higher Education. It will provide for nearly 26,500 journals to 215 universities, 5,000 colleges, and 68 institutes of national importance, among other institutes.
Vidya Lakshmi PortalVidya Lakshmi Portal was set up on 15 August 2015. The portal has been developed by National Securities Depository Limited (NSDL) e-Governance Infrastructure Ltd. The principal purpose of the portal is to enable access to facilities of education loan, scholarships, and other student friendly facilities in one place.
Ishan VikasIshan Vikas is an initiative of the Ministry of Human Resource Development, Government of India. It is a comprehensive program to introduce school children from the northeastern states to high-quality academia. A separate program also provides summer internships for college students.
Higher Education Financing Agency (HEFA)The Higher Education Financing Agency (HEFA) was proposed to be set up with an initial capital base of INR10,000 million. A digital depository of school leaving certificates, college degrees, academic awards, and marks sheets was proposed to be set up and an enabling regulatory architecture was to be provided to 10 public and private institutions to emerge as world-class teaching and research institutions. HEFA was incorporated on 31 May 2017.
INDIA

64 | PUBLIC POLICY INNOVATION FOR HUMAN CAPITAL DEVELOPMENT
Expenditure on Higher Education in TVET by GovernmentTable 19 provides a snapshot of expenditure on higher education in TVET by the government during the period 2017–19 (in INR million).
TABLE 19
EXPENDITURE ON HIGHER EDUCATION IN TVET BY GOVERNMENT (INR MILLION).
Ministry/department/scheme name 2017–18 2018–19
Higher education 33,330 35,010
Technical Education Quality Improvement Programme 260 275
Scholarships for college and university students 320 340
Programme for Apprenticeship Training (scholarships and stipends) 110 125
Fees and ScholarshipsThe fee structure varies from university to university. There are different universities with different sources of funding. The universities are categorized as
1. public universities;
2. private universities;
3. deemed universities;
4. autonomous universities; and
5. technical and nontechnical universities.
Table 20 shows the budget allocation for scholarships for college and university students in the period 2017–19 (in INR million).
TABLE 20
SCHOLARSHIP BUDGET IN UNION BUDGET 2018–19.
Revised 2017–18 Budget 2018–19
Revenue Capital Total Revenue Capital Total
Scholarships for college and university students (in INR million)
1Gross budgetary
support294 294 40 40
2
Support from
Madhyamik and
Uchhatar Shiksha Kosh
300 300
Total scholarship for college and university
students294 294 340 340
INDIA

PUBLIC POLICY INNOVATION FOR HUMAN CAPITAL DEVELOPMENT | 65
TVET Employment PatternsThe overall pattern reveals that while TVET institutions have been fairly successful in providing the requisite vocational skills, the mobility of these graduates towards productive employment has not been on the expected lines.
Industry Involvement in TVETConfederation of Indian Industry (CII)The Confederation of Indian Industry (CII) is a non-government, not-for-profit, and industry-led and managed organization founded around 125 years ago. CII works closely with government on policy issues, to try and enhance efficiency and competitiveness, including on TVET [18].
Federation of Indian Chambers of Commerce & Industry (FICCI)Set up in 1927, on the advice of Mahatma Gandhi, FICCI’s history is closely interwoven with the freedom movement. It has a nationwide membership of about 1,500 corporations and 500 chambers of commerce and business associations. Its expanding direct membership of enterprises is drawn from large, medium, small, and micro segments of manufacturing, distributive trade, and services [19].
Vocational Guidance and Employment CounsellingVocational guidance units in employment exchanges and University Employment Information and Guidance Bureau (UEIGB) functioning within the University Campus render vocational guidance and employment counselling services to jobseekers. The vocational guidance units and the UEIGB Collect and compile occupational information for dissemination to the students, teachers, parents, and jobseekers (both individually and in groups) through career talks, individual counselling sessions, group discussions, career exhibitions, and film shows [20].
Summary and ConclusionsOver the years, India has transformed from an agricultural economy to a major player in the service and industrial sectors. This is because of the liberalization and globalization policies adopted by the government from time to time.
A growing number of people are entering the workforce, which has been a major challenge for the governments, both at the state and central level.
The key challenges being faced by governments are
1. job creation and employment;
2. changing nature and scope of jobs;
3. improvement of labor productivity; and
4. preparing frameworks for improved human capital development.
Keeping in view the above, Government of India has been encouraging private-sector participation in development of the industrial sector, in addition to giving fillip to the small- and medium-scale industries. The following is a broad summary:
1. It is found that there is a huge skill gap at every level, both in developed and developing economies. The efforts of Government of India and regulatory and advisory institutions like
INDIA

66 | PUBLIC POLICY INNOVATION FOR HUMAN CAPITAL DEVELOPMENT
AICTE, UGC, Bar Council of India, and Pharmacy Council of India (PCI) have been quite useful in bridging the skills gap. The major incremental human resource requirements as projected by National Skill Development Corporation (NSDC) in 2016 are given in Table 21.
TABLE 21
INCREMENTAL HR REQUIREMENTS IN 2016.
1 Building construction and real estate 30.6
2 Retail 10.7
3 Logistics, transportation, and warehousing 8.2
4 Beauty and wellness 8.2
5 Furniture and furnishing 5.7
6 Tourism, hospitality, and travel 4.9
From Table 21, it is evident that sectors like IT, pharmaceuticals, and auto components may not be providing as much employment as sectors like real estate, infrastructure, and tourism.
2. In view of the above, policy makers and other stakeholders must ensure that the needed workforce for the high-growth sectors must be planned on a priority basis. The employment policies must be evolved to build and maintain high levels of safety, healthcare, and conducive workplace environments. It must be ensured that avenues for proper skill development and growth are ensured for every employee in the organizations.
3. The government must ensure efficient resource utilization and governance for proper functioning of the activities and equal income distribution by implementing progressive taxation and providing subsidies for the needy population. For a better human capital development, the government needs to deploy more resources towards socioeconomic infrastructure needs like energy, power, transport, communication, education, healthcare, and housing, in addition to development of the agriculture and industry sectors. This will ensure an overall development of the country and reduce imbalances in the societal framework.
4. India has witnessed a massification of education at all levels of primary, secondary, higher, and university education. This is due to the fact that a large number of younger people are entering the education system with diverse requirements of skills, knowledge, and cultures. India’s education system is characterized by a growing enrollment in the private sector at all levels. This is due to the fact that although there has been a huge investment in the educational sector by the government, the desired results have not been achieved.
5. One of the major issues facing the education system is the inadequacy of grants and scholarships for educational institutions. The higher-education policies and programs should be more focused toward developing a talented pool of youth in all sectors who possess the right skills and knowledge to meet the contemporary skill requirements not only in India but around the globe. Higher-education institutions must therefore place greater thrust on innovation, nurture talent in science, stimulate resources in universities, and raise gross expenditure on research and development (R&D). Further, an ecosystem for nurturing
INDIA

PUBLIC POLICY INNOVATION FOR HUMAN CAPITAL DEVELOPMENT | 67
innovation and entrepreneurship should be developed by leveraging regular dialogues among stakeholders and by encouraging and facilitating enterprises to invest in innovations.
6. The collaboration between universities and industries is very important for India’s higher-education system to attain global standards. Some of the examples of university linkages are research partnerships, shared infrastructure, human resource trainings, publications, conferences, and commercialization of intellectual property.
7. Technical and vocational education training system in India needs a tremendous thrust. It has been noticed that while general education has received substantial attention, vocational education has been lagging behind. This is creating a huge unemployable workforce, thereby creating a social imbalance. Further, with few employment opportunities available in the society, a renewed thrust and importance must be provided immediately to create more employment and open up the entrepreneurial ecosystem.
According to a 2018 WEF report, top 10 emerging jobs in India are
1. data analysts and scientists;
2. AI and machine-learning specialists;
3. general and operations managers;
4. software and applications developers and analysts;
5. sales and marketing professionals;
6. big-data specialists;
7. digital transformation specialists;
8. new technology specialists;
9. organizational development specialists; and
10. information technology services.
Also, top 10 declining jobs in India are
1. data entry clerks;
2. accounting, bookkeeping, and payroll clerks;
3. administrative and executive secretaries;
4. assembly and factory workers;
5. client information and customer service workers;
INDIA

68 | PUBLIC POLICY INNOVATION FOR HUMAN CAPITAL DEVELOPMENT
6. business services and administration managers;
7. accountants and auditors;
8. material-recording and stock-keeping clerks;
9. general and operations managers; and
10. postal service clerks.
This clearly indicates that there is a gradual shift from traditional jobs to more specialized and IT/skills-based jobs and careers. Policymakers therefore must ensure that all development efforts and programs are drawn up keeping in view this shift and trends in the employment market.
Some key drivers of change are following:
1. Globalization: This is triggered by factors such as increased exports by India-based companies, adoption of exponential technology in advanced markets and its impact of offshoring, changes in the overseas job market for Indian workforce, and increase in foreign direct investment (FDI) flow in India.
2. Demographic changes: A rising middle class, a high proportion of the young population, and an increase in urbanization are taking place.
3. Adoption of exponential technologies by Indian industries: The launch of smart and connected products and services, creation of highly optimized supply chains, business innovations, demand for a resourceful planet and sustainability, and new work arrangements will be essential.
Comprehensive Vision and Strategy for IndiaVisions should include enhancing human capital through skill development; creating sufficient number of decent quality jobs in both formal and informal sectors, to absorb those who are available and willing to work; strengthening social cohesion and equity in the labor market; and coherence and convergence in various initiatives taken by the government. An effective and integrated role of industry-academia-government is critical in implementing polices and strategies regarding employment.
The industry should
• create a ‘vision for exponential technologies’ for industry or company;
• create collaborative learning ecosystems for each industry; and
• develop workforce retraining programs across organization levels.
The academia needs to
• focus on judgment-driven skills; and
• introduce tailored courses with flexible completion timings to enhance students’ inclination towards learning.
INDIA

PUBLIC POLICY INNOVATION FOR HUMAN CAPITAL DEVELOPMENT | 69
The government should develop policies and programs to
• encourage startups to transform unorganized sectors into organized ones using technology;
• transform public healthcare, education, and other development sectors through use of technology-assisted outreach; and
• expand and upgrade the technology tool rooms across the country to enable the MSME sector to adopt exponential technologies.
References[1] Office of the Registrar General & Census Commissioner, India, Ministry of Home Affairs,
Government of India. Census of India 2011. https://censusindia.gov.in/2011-common/censusdata2011.html.
[2] Labour Bureau, Ministry of Labour & Employment, Government of India. Fifth Annual Employment-Unemployment Survey (2015-16). http://labourbureaunew.gov.in/UserContent/EUS_5th_1.pdf.
[3] Department for Promotion of Industry and Internal Trade, Ministry of Commerce and Industry, Government of India.
[4] Ministry of Skill Development and Entrepreneurship, Government of India.
[5] National Skill Development Corporation. Environmental Scan report 2016.
[6] India Skills Report 2018. https://wheebox.com/static/wheebox_pdf/india-skills-report -2018.pdf.
[7] University Grants Commission. Consolidated university list.
[8] All India Council of Technical Education (AICTE). https://facilities.aicte-india.org/dashboard/pages/dashboardaicte.php.
[9] Union Budget website. https://www.indiabudget.gov.in/ub2018-19/bs/bs.pdf
[10] Open Budgets India. https://openbudgetsindia.org/dataset/department-of-higher-education-2018-19
[11] Ministry of Science and Technology
[12] International Association for Research in Income and Wealth. http://www.iariw.org/India/jacob.pdf.
[13] The Innovation Policy Platform. www.innovationpolicyplatform.org
[14] Directorate General of Training (DGT), Ministry of Skill Development and Entrepreneurship.
INDIA

70 | PUBLIC POLICY INNOVATION FOR HUMAN CAPITAL DEVELOPMENT
[15] Ministry of Human Resource Development. History of Technical Education in India. Via www.education.nic.in. Accessed on 21 July 2008.
[16] Ministry of Education. MHRD Outcome Budget 2016–17. https://www.mhrd.gov.in/outcome-budget-2016-17.
[17] Department of Higher Education, Ministry of Education. Demand no: 58.
[18] Confederation of Indian Industries. https://www.cii.in/.
[19] Federation of Indian Chambers of Commerce and Industry (FICCI). http://ficci.in/.
[20] Ministry of Labour & Employment, Government of India. https://labour.gov.in/.
INDIA

PUBLIC POLICY INNOVATION FOR HUMAN CAPITAL DEVELOPMENT | 71
INDONESIA
Dr. Irwan Endarayanto AluiciusHead, Division of Academic Policy Studies, Gadjah Mada University, Yogyakarta
Wirastuti Widyatmanti, Ph.D Faculty of Geography, Gadjah Mada University, Yogyakarta
IntroductionAs the world’s largest island country, with more than 13,000 islands and 300 ethnic groups, Indonesia has charted impressive economic growth since overcoming the Asian financial crisis of the late 1990s. Indonesia’s GDP per capita has steadily risen, from USD857 in the year 2000 to USD3,847 in 2017 [1].
Indonesia has been able to maintain its economic growth at 6% on an average. As per The World Bank data, Indonesia is the world’s tenth-largest economy in terms of purchasing power parity. As a member of G-20 and an emerging middle-income country, Indonesia has made enormous gains in poverty reduction since 1999, having halved the poverty rate to 9.8% by 2018 [2]. However, with a population more than 260 million, more than 25.9 million Indonesians still live below the poverty line. According to The World Bank [2], approximately 20.78% of the entire population remains vulnerable to falling into poverty, as their incomes hover marginally above the national poverty line. Moreover, Indonesia’s economic and social development still lags those of its east Asian neighbors, including Singapore, Malaysia, and Thailand.
To resolve such disparity, Indonesia must heavily invest in developing its human resources for increasing equity and economic growth among its people [2]. The human resource can be transformed into human capital with effective inputs of education, health, and moral values. The transformation of raw human resource into highly productive resources with these inputs is the process of human capital formation.
Human capital has strong implications for economic growth. A crisis of low human capital will widen the economic gaps between high-, middle-, and low-income societies, thus making it difficult to achieve equity in access to education and health or realization of positive economic growth. Therefore, government investment must include providing people with enough nutrition, healthcare, quality education, jobs, and skills to develop their human capital.
There are several approaches to assess a country’s level of human capital. The Human Development Report Office releases five composite indices each year: the Human Development Index (HDI), the

72 | PUBLIC POLICY INNOVATION FOR HUMAN CAPITAL DEVELOPMENT
Inequality-Adjusted Human Development Index (IHDI), the Gender Development Index (GDI), the Gender Inequality Index (GII), and the Multidimensional Poverty Index (MPI) [3]. However, the variables used in those indices are too specific and complex. This study needs to see boarder variables that influence the human capital. Other indices published by the World Bank Group in 2018, and by United Nations Development Programme (UNDP), are Human Capital Index (HCI) and Human Development Index (HDI), respectively.
HCI assesses the quality of future life of people in a country, based on education and health facilities and assurances. HDI assesses three variables (long and healthy life, using Life Expectancy Index; knowledge, using Education Index; and decent standard of living, using GNI Index) as key dimensions of human development. Both these indices refer to two common education and health variables that influence the human capital and development. In addition, their variables have simple yet comprehensive approaches to measuring human capital. Therefore, we utilize HCI and HDI as another approach. Since the quality of health really depends on the education level of people [4, 5], this paper focuses first on identifying an appropriate approach for recognizing the life quality of Indonesian people in terms of human capital, its disparity compared to the ideal criteria, and recommendations for its improvement from education perspective.
The World Bank Group published first HCI in October 2018. The index value ranges from 0 to 1, where 1 indicates that a child born today will expect to achieve complete education and full health. HDI measures the quality of human resources in a country based on three components, namely, education, health, and income per capita.
According to the HDI [3], Indonesia’s score was 0.707 in 2019. The 2019 HDI report ranked Indonesia 111 out of 189 countries and territories. If we refer to the HDI, Indonesia’s human resources rank relatively lower compared to other countries with the same level of income per capita [4]. However, between 1990 and 2019, Indonesia’s HDI value had increased from 0.528 to 0.707, which marked an increase of 33.9% [3]. This means that on an average, an Indonesian worker would only be around 71% as productive as she or he could be with complete education and full health (i.e., with benchmark HDI score of 1). In order to assess the current state of human capital development in Indonesia, in this study, we will focus particularly on the education sector, given the era of Industry 4.0 and digitalization of economy. We have analyzed the national labor force survey data to examine some indicators of human capital in Indonesia, including the education profile of the workforce, inequality in education, and unemployment rate.
ContextAccording to UNDP, two-thirds of Indonesia’s population will be in the productive age during the period 2020–30. Population census data of 2018 shows that people in the productive age group of 15–64 years numbered 179.13 million, which accounted for 67.6% of Indonesia’s total population. This means that the productive age of Indonesia’s population is more than its nonproductive population, which is known as ‘demographic bonus.’ In other words, Indonesia will have a large potential workforce to support the economy.
Indonesian government needs to put a greater effort to improve the country’s human development programs if it wants to maximize the benefit from its demographic bonus [7]. Therefore, in this digital-economy era, Indonesia needs to prepare its workforce to be ready for entering a highly competitive labor market. This young workforce needs to have good health, good education, useful
INDONESIA

PUBLIC POLICY INNOVATION FOR HUMAN CAPITAL DEVELOPMENT | 73
skills, and a conducive environment to nurture one’s potential and develop the capacity. This is the reason why Indonesia needs to emphasize its human resources development agenda and prepare its education system to respond to global changes. Education is one of the most important means for reducing poverty and sustaining economic growth.
Education SystemIn order to understand the human capital development in Indonesia, first, we will put the context of the educational system in Indonesia. Indonesia’s education system consists of several types of education [8] (see Figure 1).
As shown in Figure 1, there are three types of education in Indonesia [8], namely, general education, vocational school education, and nonformal education. In each type, there are three levels of education, i.e, basic, secondary, and higher education. The length of basic education is usually six years in elementary school (grade 1–6), followed by three years in lower secondary school (grade 7–9). Then, in secondary education, the length of education is three years. In higher education, the length of education is four years for bachelor’s degree, two years for master’s degree, and 3–5 years for doctorate. In vocational education, the length of Diploma III (D3) is three years, Diploma IV (D4) is four years, Master of Applied Science is two years, and doctorate is 3–5 years.
General education focuses on the expansion of general knowledge and improvement of the student’s skills. Vocational education prepares students for mastering a number of specific vocational skills needed for employment, while special education provides important skills and abilities for students with physical and/or mental disabilities. Moreover, nonformal education and in-service education aim at increasing abilities required for job preparation as an official or a candidate for a government department or a nondepartmental government agency. Further, religious education prepares students to play roles that demand a mastery of religious knowledge and related subjects; academic
EDUCATION SYSTEM IN INDONESIA.
FIGURE 1
Level
Higher education
Secondary education
Basic education
Pre-school
General education
Doctor (3)
Master (S2)
Bachelor (S1)
Lower-secondary school
Elementary school
General educationSecondary Education
Vocational education
Doctor applied science
Master applied science
Applied science (D3/D4)
Vacational educationSecondary education
Nonformal education
Open university
Package C/training
Package B
Package A
INDONESIA

74 | PUBLIC POLICY INNOVATION FOR HUMAN CAPITAL DEVELOPMENT
education focuses primarily on improving the mastery of sciences; and professional education prepares students primarily for specialized or job-related knowledge and skills. The nonformal education system covers Package-A (equivalent to primary school), Package-B (equivalent to junior secondary school) and Package-C (equivalent to senior secondary school), with emphasis on the acquisition of knowledge and functional skills.
However, in the frame of education system in Indonesia, there are still many problems. First, related to enrollment rate, only 55% of children from low-income families are enrolled in lower (junior) secondary schools [1]. This is a critical issue that need to be tackled in order to move forward and achieve higher goals in education, that is, to keep school-age children at school. Indonesia has almost universal enrollment at the primary level but at the junior secondary level, improvements are slower. The second issue pertains to ensuring that in poorer and disadvantaged regions, including remote and isolated regions, children have full and equal access to schools that provide a conducive learning environment and effective instruction. The third issue is about providing education that is of acceptable quality and relevant to the economy and the society. More issues will be explained in the next discussion.
Educational IssuesThe complexity of the Indonesian school system is due to the size and the diversity. There are more than 50 million students and 2.6 million teachers spread across more than 250,000 schools. This means that Indonesia is the third-largest education system in the Asian region and the fourth-largest in the world, after PR China, India, and the USA. There are two ministries responsible for managing the education system: 84% of the schools are under the Ministry of National Education, while the remaining 16% are under the Ministry of Religious Affairs [3].
There are three main issues that we will focus in this study: enrollment rate, student performance, and expenditure on education. We will discuss in detail each issue in the next paragraphs.
Enrollment rate: Although the enrollment rate in Indonesia has risen in the last decade even as the population has grown, these rates are still low compared to other countries in the ASEAN region [2]. For basic education, net enrollment rates are below 60%, though net enrollment rates for secondary education have experienced a steady climb, currently being 66% in junior secondary schools and 45% in senior secondary schools. This problem needs to be tackled by the government in order to push enrollment rates upward in higher education.
Student performance: Although education is central to the government’s development agenda, Indonesia continues to rank low in international standardized tests of student performance, such as the Programme for International Student Assessment (PISA), which is organized by the OECD [10]. PISA test is conducted every three years for 15-year-old students from all over the world and assesses the extent to which they have acquired the key knowledge and skills essential for full participation in the society. The assessment focuses on proficiency in reading, mathematics, science, and an innovative domain. Figure 2 shows the PISA scores of Indonesia for four tests in the years 2009, 2012, 2015, and 2018.
In the results of 2018 PISA test [10], out of 79 assessed countries and economies, Indonesia ranked 73rd in mathematics, 74th in reading, and 71st in science. On an average, Indonesian students scored among the lowest in science, reading, and mathematics compared to their peers living in 79 countries and economies. Indonesian students scored higher only than their peers in the Philippines,
INDONESIA

PUBLIC POLICY INNOVATION FOR HUMAN CAPITAL DEVELOPMENT | 75
which scored the lowest among the 79 countries surveyed in reading and second-lowest in mathematics and science.
Nevertheless, in science (see Figure 2), between 2012 and 2015 alone, the performance among 15-year-old students rose by 21 score points. This makes Indonesia the fifth-fastest improving education system among the 72 that took part in this comparison. However, the science score decreased slightly to 396 points in 2018 from 403 points in 2015. Also, Indonesia’s score was far below the OECD average of 489.
In reading, Indonesian students’ mean reading performance score of 371 in 2018 marks a 21-point decrease from the 2015 score. This score is far below the OECD average of 487.
In mathematics, meanwhile, after having prior trends of increasing scores several times, in 2018, Indonesian students had a score of 379, which was a 7-point decrease from 2015. This is also significantly below the OECD average of 489.
While the trend of the results was either stagnant or downward, the OECD in its PISA 2018 country note for Indonesia said, “These results must be seen in the context of the vast strides that Indonesia has made in increasing enrollment [10].” When Indonesia first participated in PISA in 2001, the sample covered only 46% of the 15-year-old persons, while in the 2018 report, the PISA sample covered 85% of 15-year-old persons in the country. Hence, it is normal to have a lower mean performance due to the inclusion of more students. The government of Indonesia, via Minister of Education and Culture, Nadiem Makarim, has responded that the PISA score of Indonesia was a valuable input for evaluating and improving the quality of education in Indonesia [11].
Expenditure on education: Education in Indonesia is implemented in accordance with the educational policies that regulate the national education system. An allocation of 20% education funding is obtained from the state budget. Indonesia’s expenditure on education is 20.63% of the total expenditures (see Figure 3).
INDONESIA’S PISA SCORE.
FIGURE 2
383
402
371
382
396
375
403
397
386
396
371
379
Science Reading Mathematics
2009 2012 2015 2018
INDONESIA

76 | PUBLIC POLICY INNOVATION FOR HUMAN CAPITAL DEVELOPMENT
The budget allocation system for education in Indonesia is heavily influenced by government policies [12]. Education financing depends on the management of educational institutions, but budget allocations must conform to national financing standards. As shown in Figure 4, most of the budget for education [13] is allocated for basic education (56%). For secondary education, the share of budget allocation is 29%, of which vocational secondary education gets 16%.
Although education spending has increased significantly in the years after the economic crisis, the increase in budget is not proportionately matched by better educational achievement [13]. This indicates that the public fund has not been used effectively. The increase in spending goes mainly
INDONESIA’S EXPENDITURE ON EDUCATION, HEALTH, AND SOCIAL SECURITIES.
FIGURE 3
Health
2014 2015 2016 2017 2018
Education Social securities
400
350
300
250
200
150
100
50
0
Billi
on R
upia
h
COMPOSITION OF INDONESIA’S EDUCATIONAL BUDGET.
FIGURE 4
All- leveleducation11%
Specialeducation 4%
Totalsecondary29%
Vocational 16%
Regularsecondary13%
Basic education56%
INDONESIA

PUBLIC POLICY INNOVATION FOR HUMAN CAPITAL DEVELOPMENT | 77
into increasing teachers’ salaries, particularly in basic and secondary education. While the Indonesian government had mandated allocation of 20% of the state budget to education [12], it remains to be seen whether this will have a meaningful impact on the country’s ambition to ride the fourth industrial revolution.
In the next section, we will further discuss the human capital development in Indonesia, especially in the current contexts of higher education and vocational education.
Higher Education and Research DevelopmentHigher education is important for the expansion of a highly skilled workforce and building a strong foundation for the development of a knowledge-based economy. Indonesia’s higher education system is divided into three main categories: general higher education (universities); vocational education (institutions, academies, polytechnics, and advanced tertiary schools); and nonformal education (open universities). In this section, we will focus on higher education in the general education category. With the percentage of college-age population (19–23 years age group) being around 22%, higher education is one of the elements that can play an important role in human resource development [14].
One of the key factors constraining higher education enrollments in Indonesia is the difficult transition from senior high school to university. Government intervention through scholarships for poor students has not been quite successful due to difficulties in targeting the poor and the high criteria set for scholarship recipients (e.g., maintaining high GPA), which are often the main weaknesses of poor students [13, 14, 15].
Disparities in higher education still pose a big problem in Indonesia. There are more than 4,000 higher-education institutions, of which more than 90% are privately run [2]. Public schools are considered to be of higher quality than the private institutions. Almost 40% of the 6.9 million students are in public institutions. Over half of students, who attend a private university, go there because of a lack of seats in public universities [2]. However, according to Times Higher Education (THE) [17], only five public universities had rankings higher than 350 in the Asian University Ranking 2019. These are Universitas Indonesia (rank 113), Bandung Institute of Technology (rank 201–250), Bogor Agriculture Technology (rank 301–350), Universitas Indonesia (rank 301–350), and Sepuluh Nopember Institute of Technology (rank 301–350). Moreover, many higher-education institutions are unaccredited. Thus, the quality of higher education in Indonesia still needs a lot of improvement.
Moreover, the higher-education institutions have not established strong linkages with business and industry networks [18]. Their curriculum is too rigid and incompatible with industry needs. As a result, higher education produces graduates who are less able to meet the growing needs for more broad-based and flexible skills that the industry currently requires [19, 20]. These conclusions are confirmed by the data from Indonesia’s Central Bureau of Statistics [21], which show that worker profiles are dominated by those with elementary school backgrounds (40.69%). The ‘general higher education’ profiles contributed only 9.40% of the total workforce in the year 2018 (see Figure 5).
Moreover, from open unemployment rate data [21] (see Figure 6), it is evident that unemployment rates are highest for secondary education levels. Put together, general and vocational secondary educations constitute almost 20% of the open unemployment rate. Higher education contributes less than 6% to the open unemployment rate.
INDONESIA

78 | PUBLIC POLICY INNOVATION FOR HUMAN CAPITAL DEVELOPMENT
In the era of Industry 4.0, the demand for skills in Indonesia is expected to increase rapidly as the country embarks on a higher development journey [22]. The country is trying to shift from a resource-based economy to a knowledge-based economy. In order to meet the increasing demand for skills, Indonesia’s education system must be able to produce not only a higher number of skilled workers (i.e., workers with a certain level of education and training), but also relevant and useful skills (i.e., thinking, communication, learning, and adaptation skills) [23]. The education system will, therefore, need to provide graduates with complex competencies (i.e., the ability to use knowledge, skills, and other abilities at work) and lifelong learning, beyond technical skills.
Despite having over 4,000 universities of varying quality, Indonesia’s research output of an international standard has been disproportionate. According to the Scimago Institution Ranking (SIR) of Indonesia [24], Indonesia produces less than 3% of the total documents in the Asian
WORKFORCE PROFILE IN 2018.
FIGURE 5
40.69%
18.09% 18.01%
11.03%9.40%
2.78%
0.00%
10.00%
20.00%
30.00%
40.00%
50.00%
<= Elementaryschool
Lowersecondary
school
Generalsecondaryeducation
Vocationalsecondaryeducation
Generalhigher
education
Vocationalhigher
education
OPEN UNEMPLOYMENT RATE IN 2018.
FIGURE 6
0.00%
2.00%
4.00%
6.00%
8.00%
12.00%
10.00%
<= Elementaryschool
Lowersecondary
school
Generalsecondaryeducation
Vocationalsecondaryeducation
Generalhigher
education
Vocationalhigher
education
2.41%
4.76%
7.29%
10.42%
5.67% 5.59%
INDONESIA
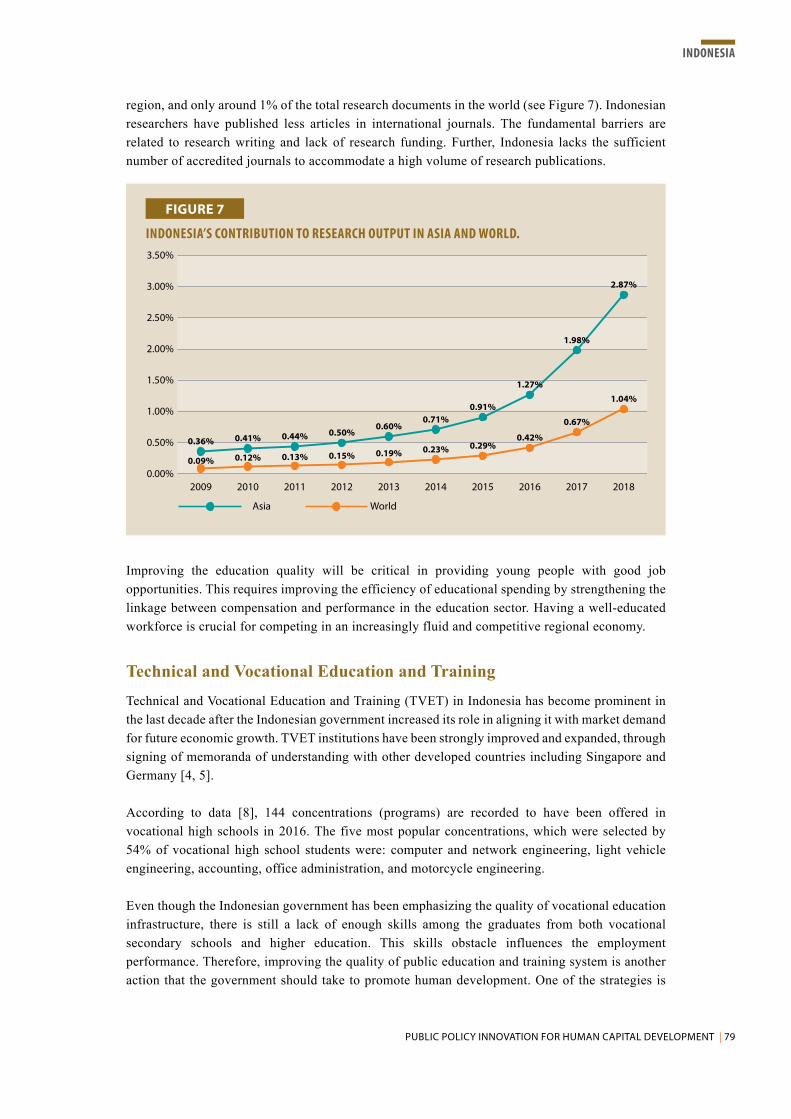
PUBLIC POLICY INNOVATION FOR HUMAN CAPITAL DEVELOPMENT | 79
region, and only around 1% of the total research documents in the world (see Figure 7). Indonesian researchers have published less articles in international journals. The fundamental barriers are related to research writing and lack of research funding. Further, Indonesia lacks the sufficient number of accredited journals to accommodate a high volume of research publications.
Improving the education quality will be critical in providing young people with good job opportunities. This requires improving the efficiency of educational spending by strengthening the linkage between compensation and performance in the education sector. Having a well-educated workforce is crucial for competing in an increasingly fluid and competitive regional economy.
Technical and Vocational Education and TrainingTechnical and Vocational Education and Training (TVET) in Indonesia has become prominent in the last decade after the Indonesian government increased its role in aligning it with market demand for future economic growth. TVET institutions have been strongly improved and expanded, through signing of memoranda of understanding with other developed countries including Singapore and Germany [4, 5].
According to data [8], 144 concentrations (programs) are recorded to have been offered in vocational high schools in 2016. The five most popular concentrations, which were selected by 54% of vocational high school students were: computer and network engineering, light vehicle engineering, accounting, office administration, and motorcycle engineering.
Even though the Indonesian government has been emphasizing the quality of vocational education infrastructure, there is still a lack of enough skills among the graduates from both vocational secondary schools and higher education. This skills obstacle influences the employment performance. Therefore, improving the quality of public education and training system is another action that the government should take to promote human development. One of the strategies is
INDONESIA’S CONTRIBUTION TO RESEARCH OUTPUT IN ASIA AND WORLD.
FIGURE 7
Asia World
0.00%
0.50%
1.00%
1.50%
2.00%
2.50%
3.00%
3.50%
2009 2010 2011 2012 2013 2014 2015 2016 2017 2018
0.36% 0.41% 0.44% 0.50%0.60%
0.71%0.91%
1.27%
1.98%
2.87%
0.09% 0.12% 0.13% 0.15% 0.19% 0.23% 0.29%0.42%
0.67%
1.04%
INDONESIA

80 | PUBLIC POLICY INNOVATION FOR HUMAN CAPITAL DEVELOPMENT
exploring alternative modes of delivering vocational education and increasing practical training and linkages with the private sector. More investment is required to increase corporate training and demand-driven and practice-oriented programs into the curriculum, to close the gaps in graduate competence and competitiveness. In order to produce twenty-first-century graduates through vocational education, there are four recommendations [9]:
First, the twenty-first-century skills are demanding more multiskills than previous generations. The graduates of vocational education in the twenty-first century should be elastic and lifelong learners. They should be eager to learn new things, think critically to solve problems, and possess high social skills with respect to communications with others [9]. The graduates should have strong leadership characters to equip themselves against disruptions. Innovative knowledge development initiative has to become the basis of performance achievement, since technology develops rapidly and the needed skills keep changing. In addition, graduates should also have entrepreneurship skills and the readiness to be global citizens. Therefore, there is a paradigm shift toward twenty-first-century education to develop more future-market-oriented graduates.
Second, digital literacy should be included not only in the curriculum, but also in the cocurricular and extracurricular activities. Several learning methodologies that are taking benefit of the digital technology should also be used. Examples are, blended learning, project-based learning, and inquiry-based learning. Utilizing the potential of digital and e-learning technologies in teaching and learning activities increase the skills and learning outcomes [8, 9].
Third, to improve the teacher’s quality, several crash programs are conducted to address a shortage of productive subject teachers in vocational schools. This is done by giving additional subject skills to the normative subject teachers. Currently, there are 15,000 teachers following such courses. It is aimed to have more than 40,000 productive subject teachers [9]. In addition, since new skills needed by targeted industry sectors are always changing, adjustment programs and anticipated
EDUCATIONAL BACKGROUND OF SECTORAL LABOR [18].
FIGURE 8
0.0%
25.0%
50.0%
75.0%
100.0%
70.2%
39.8%28.7%
16.0%
23.2%
16.7%
9.0%
17.8%
22.1%
3.5%
14.2%
12.0%
1.3%4.7%
19.2%
1.3%
Agriculture labor Manufacturing labor Services labor
Elementary school and lower Junior high school Senior high schoolVocational Diploma/bachelor Postgraduale
0.1%
INDONESIA
PUBLIC POLICY INNOVATION FOR HUMAN CAPITAL DEVELOPMENT | 81
future-oriented skills education programs are needed. This would ensure that teachers’ and students’ competencies are always in line with the demand of the labor market.
Fourth, to ensure the successful implementation of human capital development across Indonesia, the Indonesian government should have a strong commitment to synchronize the development of the six economic corridors of Indonesia, i.e., Sumatra, Java, Kalimantan, Sulawesi, Bali-Nusa Tenggara, and Papua-Maluku [19]. The development of these areas should include a focus on education and research activities. This suggests that the expansion of secondary and tertiary education, including vocational, should be based on the criteria of human capital required to promote economic activities in each corridor. In other words, the expansion of education system should be linked and matched to the development priorities of the six economic corridors. It is therefore recommended that demand-driven principles should be the main foundations to develop the educational system, in order to boost job creation, productivity, competitiveness, and economic growth [23].
Finally, by improving the basic, secondary, and higher vocational education systems in Indonesia, we can make sure that Indonesia’s graduates have the right sets of skills for Industry 4.0 and stand a better chance to compete for good jobs. These would be key to Indonesia’s future growth and development. To achieve this, the focus needs to be on improving student learning. A National Education Quality Initiative could link to a strengthened assessment system of student learning, and include education spending data at all government levels to promote transparency, effectiveness, and efficiency in the sector [23].
Conclusion Education is considered to have a very important role in developing human resources. Education is considered to have a particularly important role in a society and in developing human resources. Even though the effort to promote both education and health for the community should be in balance, Human Capital Index (HCI) and Human Development Index (HDI) scores indicate that Indonesian education provides a significant platform for developing the human capital. Through the national education system, the government should be able to ensure equal distribution of educational opportunities and improve the relevance and efficiency of education management. This would help develop human resources that are able to face challenges in line with the changing demands at local, national, and global levels. The transformation of raw human resource into highly productive human resource capital could be achieved through effective inputs of education, health, and moral values.
Although there is a relatively open and easy access to educational facilities, the quality of teaching has not yet been improved. Indonesians generally have poor performance compared with other countries in standardized tests, such as the PISA test. This performance continues up to the higher-education level, where the system continues to produce graduates who lack the skills demanded by today’s workplace. Indonesian universities are lacking in terms of the quality of research and teaching needed to produce graduates with adequate skills to fill professional and managerial roles.
From this discussion, it becomes apparent that the Indonesian government needs to reconsider its approach in formulating the educational curriculum, which should equip students to face the challenges posed by the global economy in future. The government needs to reform the education
INDONESIA

82 | PUBLIC POLICY INNOVATION FOR HUMAN CAPITAL DEVELOPMENT
system so that it encourages students to master skills linked to creativity, critical thinking, and problem solving. The government also needs to consider ditching the old chalk-and-talk method in the classroom and encourage students to explore their surroundings more. By allowing these changes to happen, the Indonesian government could prepare its workforce to reap the maximum benefits of the emerging creative industries and to answer the challenges of automation in the era of fourth industrial revolution.
Indonesia government is addressing the impact of new technologies on labor markets through education policies to accelerate education and skill levels of individuals, with regard to both cognitive skills (science, technology, engineering, and mathematics) and noncognitive soft skills. Also, it would enhance job creation through public investments as well as by leveraging private investments, improve the social safety nets, and extend the existing social protection schemes. The report indicates that poor quality of human capital in Indonesia can cost the country its growth potential. Without clear focus and strategies to reform its education system, Indonesia may fail to benefit from its demographic bonus. Closing the human capital gap will mean that more Indonesian children are born healthy, ready to learn once they start school, maximize what they learn, get better jobs, and remain healthy throughout their lives. Altogether, these achievements will give all Indonesians a chance to improve the quality of life for themselves, their families, their communities, and of those in the future generations to come.
References[1] Jokowi’s 4-Year Report. BPS-Statistics Indonesia 2018. http://presidenri.go.id/kerjakita.
[2] The World Bank. The World Bank in Indonesia, Overview. https://www.worldbank.org/en/country/ indonesia/overview. Accessed on 25 November 2019.
[3] UNDP. http://hdr.undp.org/en/countries/profiles/IDN. Accessed on 25 November 2019.
[4] Zimmerman E.B., Woolf S.H., Haley A. Understanding the relationship between education and health: a review of the evidence and an examination of community perspectives. In: Population health: behavioral and social science insights. AHRQ Publication 2015; 15–0002: 347–84.
[5] Edwards M., Wood F., Davies M., et al. ‘Distributed health literacy’: longitudinal qualitative analysis of the roles of health literacy mediators and social networks of people living with a long‐term health condition. Health Expectations 2015; 18(5): 1180–93.
[6] Adam L., Negara S.D. Improving Human Capital through Better Education to Support Indonesia’s Economic Development 2018; Indonesian Institute of Sciences: Indonesia Economics and Finance in Indonesia, vol. 61, no. 2.
[7] Bappenas–BPS–UNPF. Proyeksi Penduduk Indonesia (Indonesia Population Projection) 2010–35. https://www.bappenas.go.id /files /5413 /9148 /4109/ Proyeksi_Penduduk_Indonesia_2010-2035.pdf. Accessed on 25 November 2019.
[8] Policy on TVET in Indonesia. Country Report Indonesia. 3rd High Official Meeting on SEA-TVET, Kuala Lumpur, 23–25 May 2017.
INDONESIA

PUBLIC POLICY INNOVATION FOR HUMAN CAPITAL DEVELOPMENT | 83
[9] World TVET Database Indonesia. Compiled by: UNESCO-UNEVOC International Centre for Technical and Vocational Education and Training July 2013 https://unevoc.unesco.org/wtdb/worldtvetdatabase_idn_en.pdf. Accessed on 25 November 2019.
[10] https://www.oecd.org/pisa/publications/PISA2018_CN_IDN.pdf. Accessed on 29 November 2019.
[11] https://www.thejakartapost.com/news/2019/12/04/not-even-mediocre-indonesian-students-score-low-in-math-reading-science-pisa-report.html. Accessed on 29 November 2019.
[12] Government of the Republic of Indonesia. Law on National Education System. National Gazette, Republic of Indonesia; 2003.
[13] http://www.gbgindonesia.com/en/education/sectoroverview.php. Accessed on 20 November 2019.
[14] The World Bank. Indonesia Skills Report. Washington: World Bank; 2010.
[15] Di Gropello E. Putting Higher Education to Work: Skills and Research for Growth in East Asia, World Bank East Asia and Pacific Regional Report. Washington, DC: The World Bank; 2011.
[16] UNESCO-IBE. World Data on Education; VII Ed. 2010/11. Indonesia. Geneva: UNESCO-IBE; 2003.
[17] https://www.timeshighereducation.com/world-university-rankings/2019/. Accessed on 29 November 2019.
[18] Di Gropello E., Kruse A., Tandon P. Skills for the Labor Market in Indonesia: Trends in Demand, Gaps, and Supply. Washington DC: World Bank; 2011.
[19] https://wenr.wes.org/2019/03/education-in-indonesia-2. Accessed on 29 November 2019.
[20] https://www.worldbank.org/en/country/indonesia/brief/world-bank-and-education-in-indonesia. Accessed on 29 November 2019.
[21] https://www.bps.go.id/website/images/Tenaga-Kerja-Agustus-2018-eng.jpg. Accessed on 29 November 2019.
[22] http://www.oecd.org/indonesia/. Accessed on 29 November 2019.
[23] http://www.gbgindonesia.com/en/education/article/2015/making_research_and _development_part_of_indonesia_s_vision_for_growth_11164.php. Accessed on 29 November 2019.
[24] https://www.scimagojr.com/countrysearch.php?country=id. Accessed on 29 November 2019.
INDONESIA

84 | PUBLIC POLICY INNOVATION FOR HUMAN CAPITAL DEVELOPMENT
Dr. Habibah Abdul RahimDirector, Educational Planning and Research Division
Ministry of Education
IntroductionMalaysia aspires to become an advanced economy and inclusive nation by 2020 and be among the top 20 global economies by 2050. Despite the challenges and uncertainties in the global economic and geopolitical environment, Malaysia has maintained a strong economic growth record, which is among the fastest in the region, over the last five decades [1]. Malaysia rose from a low-income economy in the 1970s to a high-middle-income economy by 1992 and has targeted to achieve the threshold of a high-income economy by 2020 [2]. Moving forward, the country recognizes that it has to boost its economic growth, shifting from a predominantly input-driven to a productivity-driven model [3, 4]. In doing so, Malaysia will need to make improvements to its human capital base and transform from a low-skilled, low-productivity workforce to a high-skilled, high-productivity workforce and a knowledge-based industry.
Fulfilling Malaysia’s human capital requirements will entail making drastic improvements in terms of quantity and quality of education and training. The key requirements are in the areas of science, technology, engineering, and mathematics (STEM) and technical and vocational education and training (TVET), in order to increase the technical skills, creativity, and innovation in the knowledge-based economy. The government aims to create 3.3 million jobs by 2020, of which 70% are related to science, technology, technical, and vocational sectors to meet the challenges and demands of industrial clusters [5, 6]. Meeting this demand will require Malaysia to increase human capital in the STEM and TVET pathways and address the challenges in its ecosystem.
This report examines and identifies innovative public policies and approaches related to public investment for human capital development, particularly in promoting STEM education and TVET in Malaysia. For this purpose, the report is anchored around three themes, namely organizational structure; public policy, plans and programs; and labor market efficiency. For each theme, the report looks at the overall approach and innovative and good practices, as well as challenges and ways forward in human capital development. The report provides recommendations that will help develop and manage future skills requirements within the framework of human capital development, especially for STEM and TVET.
Background Malaysia is a multiethnic society with a population of 32.1 million in 2017 (see Figure 1) [7]. Population growth is slowing and has fallen from 2.3% in 2000 to 1.3% in 2017. This decrease is due to the rapid decrease in total fertility rate since 2000. The population size and demographic
MALAYSIA

PUBLIC POLICY INNOVATION FOR HUMAN CAPITAL DEVELOPMENT | 85
transitions, with increasing working-age population, were expected to increase the labor supply over a period of two decades (see Figure 2).
POPULATION SIZE AND GROWTH RATE, 1970–2040.
FIGURE 1
0
5,000.0
10,000.0
15,000.0
20,000.0
25,000.0
30,000.0
35,000.0
40,000.0
1970
10,8
81.8
13,
879.
2
1
8,10
2.4
2
3,49
4.9
2
8,58
8.6
32,
441.
0
3
5,96
6.0
3
8,55
8.0
1980 1990 2000 2010 2020 2030 2040
Total population
Popu
latio
n (’0
00)
+2.5%
+2.7%
+2.6%
+2.0%
+1.3%
+1.0%
+0.7%
70 millionpopulation
Policy(MTR 4thMP)
Reaching 32.1 millionpopulation in 2017
Source: DOSM population data.
AGE DISTRIBUTION, 1970–2020.
FIGURE 2
10.8% 13.8% 18.1% 23.5% 28.6% 32.4%
4540 37 34
28 24
5257 59 62
6769
3 4 4 4 5 7
0
10
20
30
40
50
60
70
80
90
100
1970 1980 1990 2000 2010 2020
Towards ageing population (>65)Demographic dividend: increasing working-age population (15–64)Proportion of children declined (0–14)
Source: Department of Statistics, Malaysia.
MALAYSIA

86 | PUBLIC POLICY INNOVATION FOR HUMAN CAPITAL DEVELOPMENT
Malaysia’s workforce is 14.9 million and growing, albeit slowly. The total employment rate is 68.0% while the employment rate is 80.1% for males and 54.7% for females [8]. Unemployment rate is low at 3.4%. Sustained economic growth, coupled with slow population growth, has contributed to low unemployment (Figure 3) [9]. The unemployment rate remained stable despite a sharp decrease in gross domestic product (GDP) during the global and regional financial crises, largely due to the policies and incentive packages put in place by the government. For example, during the financial crisis of the mid-1980s, the government diversified the economy from being agriculture-based to manufacturing, which helped ease Malaysia out of the recession and consequently, the manufacturing sector contributed immensely to its economic growth. However, the manufacturing sector also faced a massive impact during the financial crisis of the late 1990s. Many manufacturing businesses had to exercise retrenchment. The government ensured that, when retrenchment was carried out by organizations or companies, it complied with section 60N of the Employment Act 1955. The Act says that an employer must “not terminate the services of a local employee unless he has first terminated the services of all foreign employees employed by him in a capacity similar to that of the local employee.” While this affected the manufacturing sector, where majority of those employed were foreigners, it kept the unemployment rate of Malaysians at a low level. The government also introduced a retraining scheme aimed at those Malaysians who were retrenched as well as for the new graduates. The retraining scheme allowed those affected to ease back into employment or venture into entrepreneurship by leveraging the skills learnt.
At the time of its independence, Malaysia was a low-income agrarian economy, mainly relying on rubber and tin production, entrepôt trade, and small-scale, predominantly localized businesses. The economy was transformed to manufacturing in the mid-1980s and to modern services in the 1990s. The services and manufacturing sectors together account for a large share of the GDP. In 2017, the share of the two sectors was 54.4% and 23.0%, respectively, of real GDP [10]. Malaysia achieved a stable real GDP growth of 6.2% per annum in 1970 and moved from a low-income economy to a high-middle-income economy by 1992 [11].
GDP GROWTH AND UNEMPLOYMENT RATE, 1990–2017.
FIGURE 3
%
10.0
8.0
6.0
4.0
2.0
0.0
-2.0
-4.0
-6.0
-8.0
-0.9
9.9
6.9
8.3
3.12.4
3.7 3.72.9 3.1 3.4
8.1
9.58.9
9.99.2
10.0
7.3
-7.4
8.7
0.5
6.8
5.06.3
-1.5
7.5
4.7
6.05.0
4.2
5.9
Economicstimuluspackage
ProductivityE&E drop 2001
East Asian �nancialcrisis 1997/98
Global �nancialcrisis and
recession 2008/09
1985
Unemployment period: average rate
GDP growth rate Unemployment rate
High - 6% Low - 3%
1990 1995 2000 2005 2010 2015
Source: World Data Atlas.
MALAYSIA

PUBLIC POLICY INNOVATION FOR HUMAN CAPITAL DEVELOPMENT | 87
The quality of life of the people also improved, as reflected by the increase in per capita income and average household income. Between 1970 and 2017, the national per capita income expanded 25-fold from USD402 to USD9,552 and is projected to meet the USD15,000 threshold of a high-income economy by 2020 [12]. The mean household monthly income increased more than 20-fold from RM264 in 1970 to RM6,958 in 2016, while median income increased from RM166 to RM5,228 [13]. Over the same period, Malaysia reduced incidences of high overall poverty, from 49.3% to 0.4% while hard-core poverty was eradicated. Income inequality narrowed, with Gini coefficient decreasing from 0.513 to 0.399. With the curtailing of extreme poverty, the focus has shifted towards addressing the well-being of the bottom 40% of the population, which remains the most economically vulnerable.
Today, Malaysians are also better educated, with more than 76% of the population of those 15 years and above having at least secondary and tertiary education (see Figure 4) [14]. This is a huge transformation compared to the time of independence when more than half of the population had no formal schooling, 6% had secondary-level schooling and only 1% had post-secondary education [15]. Since then, the education system has made tremendous progress. In 2017, the participation rate was 97.9% at the primary level, 96.6% at the lower-secondary level, 84.1% at the upper-secondary level, and 44.1% at the tertiary level [16]. Improved access to education has resulted in 28.1% of the labor force having a tertiary-level qualification, which marks a four-fold increase since 1980 [17].
Many factors have attributed to this progress, including the government’s early and sustained high levels of investment in education to ensure access and inclusion to all children, the political will to have the institutional and policy framework in place, and the commitment of the stakeholders. The spending on education in Malaysia is relatively high, compared with other economies in the region
HIGHEST EDUCATIONAL ATTAINMENT OF POPULATION AGED 15 YEARS AND ABOVE, 1950–2010.
FIGURE 4
3335
3841
4341
38
34
34
2622
1815
6 8 10 1318
2431
3943
5256
5961
1 1 2 2 2 2 3 6 8 9 10 13 15
0
10
20
30
40
50
60
70
80
90
100
%
1950 1955 1960 1965 1970 1975 1980 1985 1990 1995 2000 2005 2010
No schooling Primary Secondary Tertiary
Source: Barro and Lee, 201 (Eurostat, UN).
MALAYSIA

88 | PUBLIC POLICY INNOVATION FOR HUMAN CAPITAL DEVELOPMENT
and globally, demonstrating the commitment to education as a national priority. In 2016, the federal government’s spending on education was 4.8% of the GDP or 20.6% of total government spending, and was the largest proportion of its budget (see Figure 5).
Malaysia has made great strides in terms of performance at the international level, particularly in human capital development [18–23]. For instance, Malaysia ranked 33rd out of 130 countries in The Global Human Capital Report 2017 by the World Economic Forum, with strong scores in capacity, development, and know-how. The human capital development progress corresponds with Malaysia’s economic competitiveness, productivity, and innovation performances at the global level. The International Institute for Management Development rated Malaysia the 22nd most competitive country among 63 countries in the World Competitiveness Yearbook 2018. Malaysia sees productivity, innovation, and people economy as key to furthering growth into an advanced economy.
Methodology The purpose of this report is to examine and identify innovative public policies and approaches in public investment for human capital development in Malaysia. The focus is on public policies and investments for developing human capital in STEM education and TVET.
STEM education is defined by Malaysia’s Ministry of Science, Technology and Innovation, as lifelong learning that encompasses the integrated learning of science, technology, engineering, and mathematics in formal, nonformal, and informal settings [24]. Formal education is based on the curriculum, nonformal education is through coacademic and cocurricular activities, and informal education is through indirect learning out of the academic environment. For this report, the definition of STEM is limited to the science, technology, engineering, and mathematics fields; courses of study; occupations; and related economic sectors. Where indicated, technical and vocational fields may also be included in the STEM analysis. In some instances, the term science,
TOTAL PUBLIC EXPENDITURE ON EDUCATION (% OF GDP), 2016.
FIGURE 5
Malaysia OECD ASEANmenbers
Best-in-class• Saudi Arabia• Iceland• South Africa
Comparable GDP/capita• Mexico• Turkey• Poland• Argentina
10
9
8
7
6
5
4
3
2
1
0
% o
f GD
P
4.5
7.2
1.6x
5.2
3.4 3.3
Source: UIS (based on recent year available).
MALAYSIA

PUBLIC POLICY INNOVATION FOR HUMAN CAPITAL DEVELOPMENT | 89
technology, and innovation (STI) will be referred together with STEM, as it was the contemporary term used at the time of specific policy implementation and documentation, and the data available could not be segregated according to the STEM definition.
The definition for TVET is taken from the Malaysia Education Blueprint 2015–25 [25], which adopts UNESCO’s definition as “those aspects of the educational process involving, in addition to general education, the study of technologies and related sciences, and the acquisition of practical skills, attitudes, understanding, and knowledge relating to occupations in economic sectors and social life.” The definition is also used in the Economic Planning Unit’s (EPU) Study on the Demand and Supply of Human Capital Requirements on TVET [26] and its previous Public TVET Institutions report. To accurately assess supply and estimate the skills gap, this report assumes TVET providers as institutions that subscribe to the Malaysian Qualification Framework (MQF) levels 1 to 5. These levels correspond to skills certificate (level 1 to 3), diploma (level 4), and advanced diploma (level 5). Institutions focusing predominantly on MQF Level 6 qualifications, which denote bachelor’s degrees or above may be excluded (with exemptions), as graduates of these programs are typically not considered the primary labor market for TVET-related occupations.
The framework for this report is anchored around three themes, namely, organizational structure; public policies, plans, and programs; and emerging needs and skills prioritized in Malaysia (see Table 1). Each theme indicates the overall approach and topics to examine, as well as the challenges and the way forward in analyzing the human capital ecosystem, particularly for STEM education and TVET. The first theme provides an overview of the organizational structure of human capital development in Malaysia, particularly the planning system, mechanism, approach, and tools. The second theme discusses the policies, plans, and programs on human capital development, highlighting the delivery challenges, innovative approaches, and good practices. The third theme offers a view of labor market efficiency, emerging needs, and skills prioritized in Malaysia; challenges in meeting labor supply and demand; and impact on wages and productivity. Based on the analysis, this report suggests some policy options in addressing issues and challenges for human capital development and highlights cases of innovative approaches and good practices in Malaysia.
This report reviews the literature on human capital development and national development found in policy and planning publications and reports from government, nongovernment, and international agencies; strategic papers, journals, and articles; and internet sources. These documents are critically reviewed, based on the themes, to assess and conduct a descriptive analysis of policy and planning directions as far ago as the 1950s till present. The analysis focuses on Malaysia’s efforts in promoting STEM education and TVET over different stages of economic growth, as well as the issues and challenges faced in meeting the human capital needs.
The report also analyzes publicly available secondary data to provide statistics and evidence for as-sessing the efficiency and outcomes of policies and plans implemented. These include census data, labor force survey, international comparative data, statistics on human capital in various Malaysia Plans, Malaysia Productivity Blueprint, Malaysia Education Blueprint (Preschool to Post-second-ary Education), Malaysia Education Blueprint (Higher Education), and studies on the supply and demand of human capital in STEM and TVET. Sources of national data are from the Economic Planning Unit, Department of Statistics Malaysia, and Ministry of Education’s database. Sources of data are also compared to those at the international level, which include the UNESCO Institute of Statistics, the APO, and The World Bank, in order to benchmark Malaysia internationally.
MALAYSIA

90 | PUBLIC POLICY INNOVATION FOR HUMAN CAPITAL DEVELOPMENT
TABLE 1
FRAMEWORK OF THE STUDY.
Organizational structure and labor market landscape
Public policy, plans, and programs
Labor market efficiency, emerging needs, and skills prioritized
Themes • What are the systems and mechanisms tasked with human capital development (HCD)?
• How has the economic and labor market landscape evolved?
• What is the projected growth for wages and productivity?
• What are the public policies and plans to develop HCD?
• What are the key innovations and interventions (STEM, TVET) used to develop HCD?
• What are the strategies and how effective are they?
• Is the labor market efficient?
• Are there gaps between skills needed by industry with those supplied by providers (STEM and TVET)?
• What are the prioritized emerging skills: the challenge and strategies involved?
Approach • Systems and mechanisms for HCD
• The approach for HCD • Tools and methodologies for HCD
• Economic landscape and labor market
• Wages and productivity
• HCD policies and plans ◦Long-term plans and policies ◦Five-year Malaysia Plans ◦STI and TVET policies and plans
• Key innovations and interventions (STEM, TVET)
• STEM and TVET strategies
• Labor market efficiency • Meeting supply and demand
• STEM and TVET landscape, ecosystem challenges, and strategies
• Emerging skills prioritized • Supply and demand, job creation, and unemployment
Challenges and way forward
• Are the systems and mechanisms well governed, coordinated and monitored?
• Is delivery well-coordinated (any fragmentation)?
• How far is the aspiration and action aligned (STEM, TVET)?
• Are there any gaps between actual and projected scenario?
• Are there any skills mismatch?
• Are there gaps between demand and supply?
• What is the impact on productivity?
• Are we meeting the target to become a high-income nation by 2020?
Innovative approaches/good prac-tices
• Are there particular innovative approaches and good practices in HCD to highlight?
• Are there particular innovative approaches and good practices in policy, plans and programs to highlight?
• Are there particular innovative approaches and good practices in meeting emerging needs and skills to highlight?
The report makes certain assumptions about the STEM and TVET landscapes. The analysis is highly dependent on the nature and quality of secondary data available. It attempts to separate out the STEM and TVET fields, courses of study, occupations, and related economic sectors. However, in some instances, STEM is limited to science or science and technology, and where indicated, it has been aggregated to also include TVET. The report is unable to calculate the productivity of STEM and TVET labor force and as such, uses overall labor productivity to demonstrate the improvement in labor productivity, assuming progress made in STEM and TVET also contributes to improvements in productivity.
Findings: Organizational Structure for Human Capital Development Systems and Mechanisms for Human Capital Development Human capital development is a key component of Malaysia’s national development. The Economic Planning Unit (EPU), established in 1961, engineers the long-term and medium-term development plans for Malaysia. The EPU is mandated to formulate policies and strategies for socioeconomic
MALAYSIA

PUBLIC POLICY INNOVATION FOR HUMAN CAPITAL DEVELOPMENT | 91
development, and monitor and evaluate the implementation of Malaysia’s outline perspective plans and five-year development plans. The EPU is also responsible for determining the national annual budget allocation for national development as well as for approving central programs and projects.
The EPU comprises 19 sections. The Human Resource Section oversees the formulation of human resource development policies and strategies; and coordinates, monitors, and evaluates various aspects of the national education and training delivery systems to ensure quality and cost-effectiveness of skills development. This section is also tasked with analyzing, evaluating, and identifying Malaysia’s human capital needs, issues, and challenges. It helps prepare for medium- and long-term projections of population growth, labor force, and employment to ensure a matching of supply and demand. The section works closely with the private and public sectors, especially the ministries and agencies supplying Malaysia’s human capital. These include Ministry of Education, Ministry of Higher Education, Ministry of Human Resource, Ministry of Youth and Sports, and the Ministry of Trade and Industry. Figure 6 describes the role of the EPU and relevant agencies in human capital development (HCD).
Malaysia applies both top-down and bottom-up approaches in its HCD planning (see Figure 7). Parliament is the highest level in the top-down approach of HCD planning. For instance, before development plans are tabled in the Parliament, they are deliberated upon at the Cabinet level. The National Development Planning Committee, chaired by the Chief Secretary is the highest governing body in the formulation and coordination of national policies, with the EPU as the governing and coordinating agency. These approaches ensure that policies and strategies can be realized through optimization of resources and integration of regional development with national development.
ROLE OF EPU AND OTHER AGENCIES IN HUMAN CAPITAL DEVELOPMENT PLANNING.
FIGURE 6
Coordination Planning Monitoring• Coordinate planning
function at national level
• Coordinate HCD policies
• Coordinate programs for human capital supply
• Identify labor supply and manpower requirements
• Provide information on HCD policy formulation at national level
• Monitor HCD policies and project/program implementation
• Monitor HCD policy implementation
Private sector• Monitor labor market
operation in private sector
• Provide skills training to ful�ll industry requirements
Ministry of Human Resource
Public sector• HCD public sector
planning
• Coordinate and monitor HCD at agencies level
• Provide training to ful�ll public-sector requirements
Public Service Department
Ministries/agencies supply HC• Provide skills training
• Provide input and information regarding education and training
Ministry of Education
Ministry of Youth & Sport
Ministry of Agriculture
Main supporting agencies• Supporting data and
information for HCD planning
Ministry of International Trade & Industry
Department of Statistics Malaysia
EPU’s role
Ministry’s/agency’s role
MALAYSIA
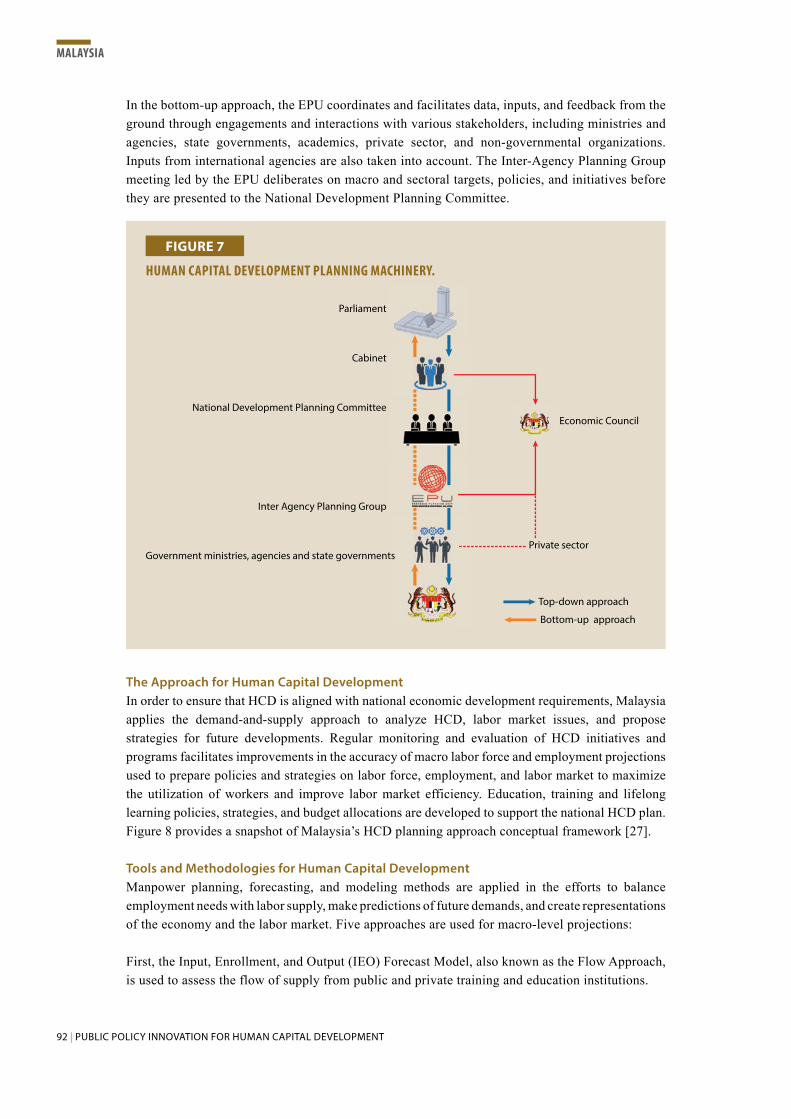
92 | PUBLIC POLICY INNOVATION FOR HUMAN CAPITAL DEVELOPMENT
In the bottom-up approach, the EPU coordinates and facilitates data, inputs, and feedback from the ground through engagements and interactions with various stakeholders, including ministries and agencies, state governments, academics, private sector, and non-governmental organizations. Inputs from international agencies are also taken into account. The Inter-Agency Planning Group meeting led by the EPU deliberates on macro and sectoral targets, policies, and initiatives before they are presented to the National Development Planning Committee.
The Approach for Human Capital Development In order to ensure that HCD is aligned with national economic development requirements, Malaysia applies the demand-and-supply approach to analyze HCD, labor market issues, and propose strategies for future developments. Regular monitoring and evaluation of HCD initiatives and programs facilitates improvements in the accuracy of macro labor force and employment projections used to prepare policies and strategies on labor force, employment, and labor market to maximize the utilization of workers and improve labor market efficiency. Education, training and lifelong learning policies, strategies, and budget allocations are developed to support the national HCD plan. Figure 8 provides a snapshot of Malaysia’s HCD planning approach conceptual framework [27].
Tools and Methodologies for Human Capital Development Manpower planning, forecasting, and modeling methods are applied in the efforts to balance employment needs with labor supply, make predictions of future demands, and create representations of the economy and the labor market. Five approaches are used for macro-level projections:
First, the Input, Enrollment, and Output (IEO) Forecast Model, also known as the Flow Approach, is used to assess the flow of supply from public and private training and education institutions.
HUMAN CAPITAL DEVELOPMENT PLANNING MACHINERY.
FIGURE 7
Parliament
Cabinet
National Development Planning Committee
Inter Agency Planning Group
Government ministries, agencies and state governments
Economic Council
Private sector
Top-down approach
Bottom-up approach
MALAYSIA

PUBLIC POLICY INNOVATION FOR HUMAN CAPITAL DEVELOPMENT | 93
Second, the Labor Force Projection Approach, also referred to as the Stock Approach, is used to forecast labor force by age, gender, citizenship, and so on. The output of labor force projection is used to determine employment and unemployment.
Third, the Manpower Requirement Approach (MRA) is used at sectoral and occupational levels to measure elasticity of employment output to provide employment estimates in supporting the targeted economic development. At the sectoral level, employment-output data is used to estimate employment in supporting the targeted economic developments. The output of labor force projections from the Stock Approach is also used to determine unemployment. At the occupational level, policy targets and employment-by-occupation trends are reviewed for employment forecast by occupational groups.
Fourth, the Labor Market Approach analyzes labor market indicators such as labor turnover, wages, vacancies, and productivity to help determine industry and occupational demands.
Fifth, the human resource modeling or HRD CGE Economy Wide Model is used as an integrated system to prepare medium- and long-term scenarios for employment forecasts by industry and occupation. In addition, detailed industry-level studies are also conducted to facilitate accuracy in broad macro projections [28].
Economic Landscape and Labor Market Structural transformation has changed the economic landscape from agriculture to services and manufacturing (see Figure 9) [29]. In 2017, the services sector accounted for 54.5% of the GDP, with the largest contributor within the sector being wholesale and retail (27.7%), followed by finance and insurance (12.4%), and information and communication (11.1%). Manufacturing made up 23.0% of
HUMAN CAPITAL DEVELOPMENT PLANNING CONCEPTUAL FRAMEWORK.
FIGURE 8
Labor marketoperation
Lifelong learning
Population Labor force
Labor supply Labor demand
Education and training Upskilling
Job creation GDP
Employment Economy
Supply and development of human capital
• Strong pipeline of rlevant workforce in the labor market
• High proportion of skilled workers by upskilling existing workforce
Labor market e�ciency
• Labor market’ s ability to match demand and supply
• E�ective management of alternative sources of labor
• E�ective wage system
Sector driven demand
• Key growth sectors by upgrading within existing sectors or promoting new sources of growth
• Further investment in key growth sectors identi�ed
MALAYSIA

94 | PUBLIC POLICY INNOVATION FOR HUMAN CAPITAL DEVELOPMENT
Successful implementation of the Economic Transformation Program (ETP) requires critical investments in human capital. Disaggregated data and precise information are important to increase accuracy of demand-and-supply forecasting and projections. To make the right trajectory to become a high-income economy by 2020, the Thousand Person Workshop was convened in May 2010 to deliberate and determine the National Key Economic Areas (NKEAs). Participants consist of 800 leaders of industries, non-gov-ernmental organizations, and statutory bodies; and 200 leaders of civil service. This is an example where the government plays a big role in guiding the economy of the nation.
Twenty breakout sessions in groups of 30–70 people worked together to set the goals for each sector, by jointly assessing Malaysia’s past performance and growth potentials over the next decade. Votes were cast to determine the focus of the ETP NKEAs, while reference was made to sector studies and an economic model of sectoral growth. The Cabinet endorsed 11 key sectors and one geography as NKEAs. The 11 sectors were oil, gas and energy; palm oil; financial services; tourism; business services; electronics and electrical; wholesale and retail; education; healthcare; communications content and infrastructure; and agriculture; while the geography was Greater Kuala Lumpur/Klang Valley. The workshop ended with a united call for commitment from the participating private firms and public agencies to dedicate their best personnel to the subsequent NKEA labs.
Twelve NKEA labs assembled the best minds from private and public sectors to chart growth plans commencing in June 2010. This private sector-led effort involved 500 experts, of which 350 were from 200 private corporations and the rest from 60 public institutions, including universities. Between 30 and 50 experts participated in each NKEA lab, guided by a senior private-sector leader to ensure that innovative yet practi-cal and achievable ideas were generated.
Participants were involved in rigorous research, brainstorming, and detailed analysis of ideas for eight weeks, while a central team of experts from the EPU, Ministry of Finance and Department of Statistics was tasked with aligning the lab outputs with the principles of key national strategic plans such as the Malaysia Plan. Over 40 syndications with key stakeholders were conducted and three open days held (in Kuala Lumpur, Kuching, and Kota Kinabalu) to obtain feedback from the public. More than 600 additional syndications were conducted with key government agencies such as the EPU and Bank Negara Malaysia (Malaysia Central Bank), as well as major domestic and foreign corporations.
The lab defined 131 ready-to-execute entry point projects (EPPs) with three-feet level detailed plans and 60 broader business opportunities that would help Malaysia reach its gross national income (GNI) targets by 2020. The cabinet endorsed the NKEA labs consolidated output and EPP plan in a cabinet workshop held in August 2010. Memo-randa of understanding were sighed with private-sector players and public funding was secured to kick start 70 projects in 2011. About 32% of the EPPs, representing RM120
BOTTOM-UP HCD PLANNING APPROACH FOR ECONOMIC TRANSFORMATION PROGRAM
MALAYSIA

PUBLIC POLICY INNOVATION FOR HUMAN CAPITAL DEVELOPMENT | 95
billion of GNI contribution, require direct investments in human capital. In addition, almost all other EPPs require human capital investments indirectly, as the majority of the 3.3 million jobs created are in middle- and high-income categories. The labs also constructed a clear post-lab delivery plan for each sector to ensure the successful launch and monitoring of the Economic Transformation Programme (ETP).
The ETP introduced a new and transformational growth strategy through the Big Fast Results (BFR) Methodology, an eight-step problem-solving approach to produce focused, inclusive, and sustainable initiatives and address problems in order to produce outcomes for transforming Malaysia into a high-income nation by 2020. The ETP also establishes key performance indicators for all initiatives and three-feet programs with
relentless implementation.
JOB CREATION AND SALARY BRACKETS, 2010.
Oil, gas and energy
Palm
Financial Services
Wholesale and retail
Tourism
Business services
Electrical and electronics
Communication content &…
Healthcare
Education
Agriculture
Greater KL/KV
52
42
275
595
497
246
187
43
181
536
75
100
200
700
700
800
700
200
300
700
900
1100
100
New jobs created across 12 NKEAs by 2020 (’000)
Number of jobs created by skill requirements (’000)
Nominal salary bracket of number of jobs created (’000)
Unskilled
Vocational/certi�cate
Diploma
Degree
Masters/professional
PhD
<RM1,000
RM1,000–2,000
RM2,000–4,000
RM4,000–7,000
RM7, 000–10,000
>RM10,000
EIGHT STEPS OF TRANSFORMATION
Ascertainthe strategic
direction required
Establish in detail what needs to be
done
Tell people what we are going to do
Solve problem with
on-the-ground information
Tell people what we have
deliveredShare lab
output with people and get their feedback
External validation on
the results achieved
Set KPIs for monitoring
and tracking
MALAYSIA

96 | PUBLIC POLICY INNOVATION FOR HUMAN CAPITAL DEVELOPMENT
the GDP. Benefitting from strong external demand, the largest contributor within the manufacturing sector was electrical, electronic, and optical products (27.9%), followed by petroleum, chemical, rubber, and plastic products (29.2%). Agriculture contributed 8.2% to the GDP.
Employment increased at an average rate of 2.9% per annum, with 1.8 million new jobs created, during the period 2011–15. The services and manufacturing sectors generated 1,303,900 jobs and 430,700 jobs, respectively. Total employment is projected to register a lower annual average growth of 2.1% during the 2016–20 period, from 13.8 million workers in 2015 to 15.3 million workers in 2020. Sectors that are expected to absorb substantial shares of employment by 2020 are services and manufacturing. Employment in the services sector is projected to increase from 8.4 million workers in 2015 to 9.6 million workers (62.5% of total employment) by 2020. Employment in the manufacturing sector is projected to increase from 2.5 million workers to 2.8 million workers (18.2% of total employment) by 2020. In 2017, the services sector was the largest employer, accounting for 62% of the workforce, followed by manufacturing (17.4%) and agriculture (11.3%), as shown in Figure 10.
The structure of employment by major occupational categories reflects the increased demand for high-skilled human resource. The Malaysia Productivity Blueprint (2016) identified nine priority subsectors that contributed 30% to Malaysia’s GDP and 40% to total employment. The subsectors are retail and food and beverages (F&B); electrical and electronics (E&E); chemicals and chemical products; agro food; professional services; tourism; information, communication, and technology (ICT); machinery and equipment; and private healthcare [30].
A study titled, The Science and Technology Human Capital: A Strategic Planning Towards 2020 [31], projected that Malaysia will need one million science and technology workers by 2020 (see Figure 11). This projection is based on an annual economic growth rate of 6% and the emergence of EPPs under the NKEAs of the ETP and the emergence of new value-added, technology-driven sectors. Of these, Malaysia needs 500,000 high-skilled workers with at least a diploma or university degree, while the remaining 500,000 workers should have completed a technical or vocational
CONTRIBUTION TO GDP BY MAIN ECONOMIC SECTORS, 1970 AND 2017.
FIGURE 9
29.2
54.58.8
23.0
1.9
4.6
24.5
8.431.8
8.2
1970 2017
Services Manufacturing Construction Mining Agriculture
Source: Department of Statistics, Malaysia.
MALAYSIA

PUBLIC POLICY INNOVATION FOR HUMAN CAPITAL DEVELOPMENT | 97
program aimed at providing support services. This has set a target for Malaysia to produce science and non-science related graduates in the ratio of 60:40. In other words, the aim is to have 270,000 students ready to enter tertiary-level science and technology courses by 2020.
Wages and Productivity Labor productivity is targeted to grow at 3.7% per annum in the Eleventh Malaysia Plan period (2016–20), compared with 2.6% in the Tenth Malaysia Plan period (2001–15). Higher labor
EMPLOYED PERSONS BY INDUSTRY, 2017.
FIGURE 10
Services62%
Construction9%
Manufacturing17%
Mining and quarrying
1%Agriculture,forestry, and
�shing11%
Source: Department of Statistics Malaysia.
SCIENCE AND TECHNOLOGY HUMAN CAPITAL PLANNING, 2020.
FIGURE 11
20,000Research
1 million
480,000Implementers
500,000Support services
Scientists
Engineers/technologists
Technician/TVETscience o�cers/
nurses/ICT
Engineers/technologists/
applied scientists
Engineers/doctorsarchitects/ICT
Source: Science Academy; Ministry of Science, Technology and Innovation.
MALAYSIA

98 | PUBLIC POLICY INNOVATION FOR HUMAN CAPITAL DEVELOPMENT
productivity would be achieved through continuous acquisition of skills and knowledge, which contributes to increase in wages. In 2017, the growth rate of wages for skilled workers was 8.4%, compared with 7.2% for semi-skilled workers, thus leading to an increase in the wage gap between different skill categories.
Although the growth rates for median and mean monthly salaries and wages of low-skilled employees were the highest at 13.4% and 14.6%, respectively, the median and mean monthly wages of skilled and semi-skilled employees were still much higher compared to low-skilled employees. In 2017, 60% of wage recipients received salaries of less than RM3,000 per month [32].
To address the issue of wage distortion, the Government established the National Wage Index (NWI) that serves as a guideline and benchmark for employers in determining the right wage levels for employees, in accordance with their qualifications, skills, and productivity. Besides that, the new minimum wage law that came into effect on 1 January 2016, sets the national minimum wage at RM1,000 in Peninsular Malaysia and at RM920 in East Malaysia. The institution of the minimum wage will help reduce poverty and improve incomes of lower-skilled workers.
In the Eleventh Malaysia Plan, the government will further encourage the implementation of performance-related pay schemes by the industry through a wider implementation of the Productivity Linked Wage System (PLWS). PLWS has been introduced to enhance industrial productivity and competitiveness in Malaysia. This is carried out by establishing a closer link between wages and productivity. PLWS can be carried out through several models such as the profitability model in which bonus payment and wage incentives will be given to employees, based on the profit of the company or the organization. Another model that companies or organizations can adopt is the productivity model. In this model, the wage incentives, bonuses, and annual salaries are dependent on the agreed productivity output/outcome determined by the employee and the employer.
As a result of the PLWS implementation, wages are adjusted according to economic performance, which will alleviate the negative impacts on employers and employees. This will encourage job specialization as per the skills and improve employee motivation and job satisfaction. The PLWS will not only benefit employers and employees but also help develop the economy and stabilize the country when industries in Malaysia are able to compete in the international market [33]. By mid-2018, PLWS had shown its effectiveness after 84,249 companies had implemented the system involving 4.1 million workers. The government is targeting 87,000 employers to adopt PLWS by 2020. A study carried out by Goh [34] suggests that labor productivity in Malaysia is positively correlated with real wage in the long run. The study indicates that there is a 1% rise in productivity when associated with approximately 1.22% of real wage increase [34].
Findings: Public Policy, Plans, and Programs National Development Policies and Plans Malaysia has practiced a system of centralized development planning, based on long-term development plans spanning 10–20 years. Referred to as the Outline Perspective Plans (OPP), it provides the broad policy and planning parameters. Embedded within these long-term plans are medium-term or five-year development plans known as the Malaysia Plans. Till date, four long-term plans and 11 medium-term plans have been formulated and implemented since the Draft Development Plan 1950–55. Although the emphasis of these policies and plans are focused on
MALAYSIA

PUBLIC POLICY INNOVATION FOR HUMAN CAPITAL DEVELOPMENT | 99
poverty eradication and economic development, the guiding strategy is equitable growth to benefit all groups and communities in the society. It also seeks to enhance national unity by emphasizing social integration and a more equitable distribution of income and opportunities. This can be achieved through rapid and sustainable economic growth and sharing of benefits with all levels of society. Figure 12 shows Malaysia’s development policies, plans, and selected sectoral plans.
Overall, the focus and scope of these development policies and plans have changed significantly over time, driven by domestic needs and emergent external developments vis-à-vis the different phases of political leadership. The First Outline Prospective Plan (OPP1) (1970–90) provided the platform for the New Economic Policy (NEP) with the objective to strengthen national unity by eradicating poverty, irrespective of ethnicity, and rectifying the unequal distribution of wealth by restructuring society through affirmative action to reduce the identification of ethnicity with economic function and geographic location. The strategy was to diversify production and incomes, moving from an agriculture-based economy to an industrial economy. The recession and financial crises during the plan period led to greater emphasis on private-sector driven new sources of
MALAYSIA’S DEVELOPMENT POLICIES AND PLANS.
FIGURE 12
1960–70
Long-termpolicy and plan
Pre-NewEconomic
Policy
OPP1New
EconomicPolicy
OPP2New
DevelopmentPolicy
OPP3National
VisionPolicy
OPP4New
EconomicModel
Medium-termplan
1st Malaysia Plan
1st Industrial Master Plan (1986–95)
2nd Industrial Master Plan (1996–2005)
3rd Industrial Master Plan (2006–2020)
ETP (2010–2020)GTP (2010–2020)
2nd Malaysia Plan3rd Malaysia Plan4th Malaysia Plan5th Malaysia Plan
OPP2New
DevelopmentPolicy
OPP3National
VisionPolicy
OPP4New
EconomicModel
Science and technology
policy60:40 Policy
NSTP1(1986–95)
NSTP2(2002–10)
NSTP3(2013–20)
Educationplan
EducationDevlopment Plan
(2001–10)Education
Devlopment Masterplan
(2006–2010)
StrategicInterim Plan
(2011–20)Malaysia
EducationBlueprint 2013–25
(preschool topost secondary)
Malaysia EducationBlueprint2015–25(higher
education)
1970–90 1991–2000 2001–10 2011–20
Source: Ministry of Education.
MALAYSIA

100 | PUBLIC POLICY INNOVATION FOR HUMAN CAPITAL DEVELOPMENT
growth, and new projects and regional clusters, to transform the economy. With economic activities much influenced by industrialization, human resources in the industrial sector became the major driving factor for Malaysia’s social and economic growth.
The Second Outline Perspective Plan (OPP2) (1991–2000) introduced the New Development Policy (NDP) and formed the first phase of the nation’s journey to realize Vision 2020 that envisions Malaysia as a fully developed nation in all dimensions (i.e., economically, politically, socially, spiritually, psychologically, and culturally) and achieving a developed nation status in 2020. The NDP focused on ensuring the balanced development of major sectors of the economy and reducing socioeconomic inequalities across communities. The strategy was to shift from an input-driven economy to a productivity-driven economy. A key area of the policy and planning framework was to make science and technology an integral component of socioeconomic planning and development, which entails building competencies in strategic and knowledge-based technologies, as well as promoting a science-and-technology culture in the process of building a modern industrial economy.
The Third Outline Perspective Plan (OPP3) (2001–10) introduced the National Vision Policy (NVP) that focused on building a resilient and competitive nation. It is an extension of the NDP and the second phase of Vision 2020 to continue strengthening and transforming Malaysia into a fully developed nation. This policy was to help Malaysia face the challenges of globalization and liberalization, promote rapid development of technology, enhance competitiveness, and strengthen economic resilience. The strategy was to develop Malaysia into a resilient and competitive nation, sustaining high economic growth, developing a knowledge-based economy through strengthening domestic investment and developing national capabilities, and producing a competent, productive, and knowledgeable workforce.
The fourth long-term national development plan known as the New Economic Model (NEM) (2011–20) has taken further steps towards realizing Vision 2020. The NEM introduced the National Transformation Policy that upholds the people-centric focus in becoming an inclusive and sustainable high-income economy. The transformation is supported by the Government Transformation Program (GTP), which focuses on transforming areas of public service that are of greatest concern to the people, and the Economic Transformation Program (ETP) that focuses on economic areas most critical to the nation’s continued growth. Compared with previous development plans, the NEM places greater emphasis on people for growth, inclusiveness, wellbeing, and human capital. The people economy will enable further development of the people by elevating their lives, dignity, and potentials. To assess the impact of economic growth on people’s wellbeing, the national growth targets include household income and the Malaysian Wellbeing Index, in addition to GDP growth and per capita income.
In addition to the overarching long-term and medium-term national development policies and plans, there are many sectoral plans to provide the framework to operationalize the policies and plans within the different sectors. Key among these sectoral plans is the Industrial Master Plan (IMP) comprising 10 years for IMP1 and IMP2 and 15 years for IMP3. Strategies implemented under the IMP were instrumental in Malaysia’s journey towards industrialization. Since its implementation in 1986, the IMP has become an important and crucial policy master plan for the development of manufacturing industry, especially concerning output increment, employment opportunities, export earnings, and technological advancement. IMP1 (1986–95) laid the foundation for manufacturing to become the leading sector of the economy. The main concern of IMP1 was growth of manufacturing output, along with more employment opportunities and increase in
MALAYSIA

PUBLIC POLICY INNOVATION FOR HUMAN CAPITAL DEVELOPMENT | 101
technological transfer. Unlike IMP1, IMP2 had broader goals and emphasized more on business support services and cluster-based approach. IMP2 also emphasized on deepening industrial linkages, increasing productivity, and improving competitiveness. IMP3 aimed to improve and strengthen economic competitiveness. Manufacturing, services, and agriculture are the focus of IMP3, and by 2020, the manufacturing sector must be more mature, the services sector more innovative and competitive, and the agriculture sector more modern and dynamic.
Development of Human Capital Policies and Plans Malaysia’s development polices and plans reflect the commitment of the government to improve the quality of people’s life. Across all these policies and plans, education, training, and human resource development have played a critical role in developing efficient and talented workforce to increase overall national productivity and growth. This is evidenced by the allocation provided to education in each Malaysia Plan. For instance, the Eleventh Malaysia Plan has six strategic thrusts and six game changers. The thrusts are aimed at addressing the challenges in social, economic, and environmental development as well as accelerating economic growth. Game changers on the other hand refer to the new approaches taken by the government with the aim of changing the existing situations in a significant way. It identifies “Accelerating Human Capital Development for an Advanced Nation” as one of its strategic thrusts to help Malaysia address challenges and take advantage of the changing global economic and geopolitical landscape. Human capital development is seen as an enabler to drive and sustain economic growth and support the transition towards knowledge-intensive activities. It would create an efficient and effective labor market that is necessary to attract foreign investments and enable people to participate in and benefit from the economic growth.
To ensure that Malaysia’s education system continues to progress in tandem with the national development plans and provide the human capital required, the Ministry of Education has developed various education blueprints. These education blueprints support and continue to equip students with knowledge and skills that drive the country’s growth. The Malaysia Education Blueprint 2013–25 (preschool to post-secondary education) and the Malaysia Education Blueprint 2015–25 (higher education), mark the government’s initiative to revamp the education system.
These blueprints supplement the Eleventh Malaysia Plan to push the agenda of producing human capital that is equipped with the right knowledge, skills, and attitudes to thrive in a globalized economy. The blueprints establish the visions and aspirations for the education system and present a roadmap of policies and initiatives to achieve those outcomes. Given the need to improve workforce capabilities, TVET has been identified as a game changer that will boost labor productivity and economic growth, while STEM has been identified as one of the catalysts for transforming the country into a developed nation by 2020. Both of the Malaysia education blueprints set out long-term strategic directions to promote STEM and TVET awareness and participation and strengthen the pathways to produce more experts and high-skilled workforce to fulfil the employment needs of the industries and the economy.
STEM and TVET Policies, Plans, and Strategies The importance of science and technology education in Malaysia can be seen as far back as 1970 with the implementation of the 60:40 policy, which envisioned that 60% of students would be enrolled in the science stream and the remaining 40% in arts. Consistent with the government’s interest to become an active global player, the science, technology, and innovation (STI) policies became prominent in the national development plans since mid-1980s. The policies are to provide
MALAYSIA

102 | PUBLIC POLICY INNOVATION FOR HUMAN CAPITAL DEVELOPMENT
guided governance and strategic framework for STI activities. In 1984, the first National Science and Technology Policy (NSTP) (1988–89) was launched to set the directions and framework to encourage national development based on science, innovation, and creativity. The Fifth Malaysia Plan (1986–90) dedicated the first chapter to science and technology as another critical step toward institutionalization of the STI policy [35]. Vision 2020, implemented in 1991, continued to emphasize the importance and need for Malaysia to establish a scientific and innovative society. Subsequently, the Second NSTP (2002–10) focused STI activities on growth and competitiveness, outlining specific targets and action plans to address issues related to STI activities [36].
The common goal of these policies is to develop a strong scientific and innovative society that would spearhead Malaysia’s agenda to become a competitive global player. To succeed, Malaysia has to innovate based on strong scientific fundamentals. The ever-changing landscape has become a challenge not only for the government but also for the industries, universities, research institutes, and the whole STI ecosystem, including basic education. Efforts to review the previous policies have led to the framing of the current National Policy on Science, Technology and Innovation (NPSTI) (2013–20). Building upon Malaysia’s achievements, challenges, and lessons learnt, the new NPSTI continues the agenda for Malaysia to advance as a competitive and competent nation that is built upon strong STI foundations [37].
TVET has also been identified as a game changer that will bring Malaysia to a developed nation status. Technical and vocational education in Malaysia goes as far back as pre-independence era, with the establishment of trade schools offering training courses in the basics of carpentry, repairing machinery, electrical wiring, and construction. After independence, more focus was given to TVET, which is expressed in the First Malaysia Plan (1965–70) through the current Plan. During the First Malaysia Plan period, a number of vocational schools were established to supply skilled technicians, craftsmen, and artisans urgently needed by the agricultural, industrial, and commercial sectors [38]. TVET was given greater attention under Vision 2020 and strengthened in the successive development plans. Between 2000 and 2010, there were several policy-related developments in TVET [34], including
1. formulation of the Skills Development Act (2006) to strengthen the regulatory framework for TVET;
2. increase in budgetary allocations between the Eighth and Ninth Plans;
3. establishment of the Malaysian Qualification Agency to oversee the Malaysian Qualifications Framework approved in 2005; and
4. establishment of Department of Skills Development, Ministry of Human Resources.
The possibility of Malaysia falling into a ‘middle-income trap’ has initiated a more proactive approach in achieving Vision 2020. The New Economic Model [39] spelt out Malaysia’s human capital deficit, while the Tenth Malaysia Plan laid out specific strategies to strengthen TVET. This was to ensure an adequate supply of multi-skilled workers to meet the country’s development needs. Great emphasis was placed on improving the quality of education and skills-based training, improving awareness and perception of TVET, and strengthening collaboration with industries. To further accelerate human capital development to achieve Vision 2020, the Eleventh Malaysia Plan focused on four key areas, namely,
MALAYSIA

PUBLIC POLICY INNOVATION FOR HUMAN CAPITAL DEVELOPMENT | 103
1. improving labor market efficiency to accelerate economic growth;
2. transforming technical vocational education and training to meet industry demand;
3. improving quality of education for better student outcomes and institutional excellence; and
4. strengthening lifelong learning for skills enhancement.
The Eleventh Malaysia Plan projected that by 2020, 60% of the 1.5 million jobs created will require technical and vocational skills. Meeting this demand requires Malaysia to increase its annual intake gradually to 225,000 in 2020. It is projected that the number of TVET intakes will reach 45% of the total Malaysia Certificate of Examination (certification at the end of secondary school, equivalent to GCE O level) leavers by 2020, compared with 36% in 2013. The increase in access is expected to further reduce school leavers joining the labor market without any skills training.
Around 60% of the 1.5 million jobs created under the Eleventh Malaysia Plan require TVET-related skills. Recognizing human capital with technical and vocational skills as key to achieving a knowledge-based economy, Malaysia has drawn up multiple educa-tion policies and initiatives aimed at strengthening TVET and meeting high demands from industries for high-skilled graduates. The Malaysian Board of Technologists (MBOT) was established to set up training and teaching syllabus to enable 30,000 technicians and technologists to be recognized as professionals. This will serve to increase the number of highly skilled technologists and technicians.
The Ministry of Education Malaysia has embarked on Vocational Education Transforma-tion (VET) as a national agenda to mainstream and broaden access to quality vocational education. The vocational education equips students with skills and qualifications that are required and recognized by the industry and also prepare them to become entre-preneurs. VET, thus, increases the opportunities for students at the upper secondary level to enter vocational pathways and is focused on
1. offering more places at vocational colleges;2. establishing collaborations with public skills training institutes (Institut Latihan
Kemahiran Awam, ILKA) and buying seats at private skills training institutes; and3. offering places for students with special education needs in vocational special
education secondary schools and private skills training institutes.
To meet the growing demand of TVET related skills, the ministry had aimed to increase its annual student intake in TVET at post-lower secondary level from 20,289 (4.6%) in 2013 to about 31,500 (7%) in 2015 and 84,000 (20%) by 2020. To meet the target, 72 existing vocational schools and eight technical schools were upgraded to vocational colleges that offer four-year diploma programs in various fields for post-lower secondary students (as young as 16 years of age). Students take the four-semester pre-diploma program and four-semester diploma program, followed by industrial training (on-the-job training) for three months. These students will be equipped with the knowledge and skills to produce a
VOCATIONAL EDUCATION TRANSFORMATION IN MALAYSIA
MALAYSIA
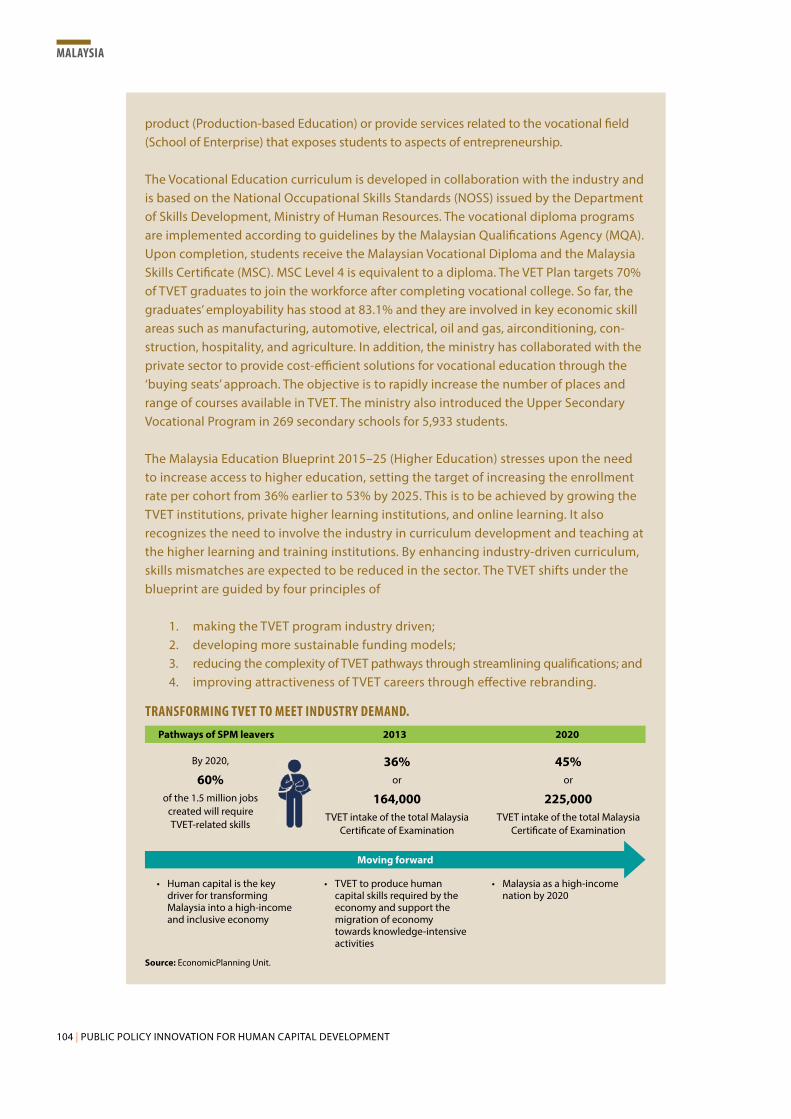
104 | PUBLIC POLICY INNOVATION FOR HUMAN CAPITAL DEVELOPMENT
product (Production-based Education) or provide services related to the vocational field (School of Enterprise) that exposes students to aspects of entrepreneurship.
The Vocational Education curriculum is developed in collaboration with the industry and is based on the National Occupational Skills Standards (NOSS) issued by the Department of Skills Development, Ministry of Human Resources. The vocational diploma programs are implemented according to guidelines by the Malaysian Qualifications Agency (MQA). Upon completion, students receive the Malaysian Vocational Diploma and the Malaysia Skills Certificate (MSC). MSC Level 4 is equivalent to a diploma. The VET Plan targets 70% of TVET graduates to join the workforce after completing vocational college. So far, the graduates’ employability has stood at 83.1% and they are involved in key economic skill areas such as manufacturing, automotive, electrical, oil and gas, airconditioning, con-struction, hospitality, and agriculture. In addition, the ministry has collaborated with the private sector to provide cost-efficient solutions for vocational education through the ‘buying seats’ approach. The objective is to rapidly increase the number of places and range of courses available in TVET. The ministry also introduced the Upper Secondary Vocational Program in 269 secondary schools for 5,933 students.
The Malaysia Education Blueprint 2015–25 (Higher Education) stresses upon the need to increase access to higher education, setting the target of increasing the enrollment rate per cohort from 36% earlier to 53% by 2025. This is to be achieved by growing the TVET institutions, private higher learning institutions, and online learning. It also recognizes the need to involve the industry in curriculum development and teaching at the higher learning and training institutions. By enhancing industry-driven curriculum, skills mismatches are expected to be reduced in the sector. The TVET shifts under the blueprint are guided by four principles of
1. making the TVET program industry driven;2. developing more sustainable funding models;3. reducing the complexity of TVET pathways through streamlining qualifications; and4. improving attractiveness of TVET careers through effective rebranding.
TRANSFORMING TVET TO MEET INDUSTRY DEMAND.
• Human capital is the key driver for transforming Malaysia into a high-income and inclusive economy
• TVET to produce human capital skills required by the economy and support the migration of economy towards knowledge-intensive activities
• Malaysia as a high-income nation by 2020
By 2020,
60% of the 1.5 million jobs
created will require TVET-related skills
36%or
164,000TVET intake of the total Malaysia
Certi�cate of Examination
45%or
225,000TVET intake of the total Malaysia
Certi�cate of Examination
Pathways of SPM leavers 2013 2020
Moving forward
Source: EconomicPlanning Unit.
MALAYSIA

PUBLIC POLICY INNOVATION FOR HUMAN CAPITAL DEVELOPMENT | 105
Discussion Labor Market Efficiency Malaysia aspires to be an advanced economy by 2020, with a national per capita income of more than US15,000. The Eleventh Malaysia Plan aims for all segments of society, irrespective of geography, ethnicity, or income level, to experience an increase in income and wellbeing. During the Plan period, it aims to increase labor productivity from 2.6% to 3.7% per annum, increase compensation of employees from 33.6% of GDP to 40%, with median monthly wage of RM2,500, mean monthly household income of RM5,270, median monthly household income of RM5,701, and a reduced unemployment rate of 2.8% (see Table 2).
Developing an effective employee training program is vital to the long-term success of a business. Many employers find the training costs expensive and employees may miss out on work time. Various policies and strategies have been introduced to encourage firms in Malaysia to train their own employees.
The most prominent is the Human Resource Development Fund (HRDF), an organization under the Human Resources Ministry. Governed by the Pembangunan Sumber Manusia Bhd Act 2001 (PSMB Act 2001), HRDF was mandated by the government to catalyze the development of competent local workforce. Since its inception, HRDF has evolved from managing a sizeable fund to becoming a one-stop center for providing novel human resource development solutions to small and medium enterprises (SMEs). HRDF is well positioned to offer robust and prudent solutions to help Malaysia enhance regional and global competitiveness, and create an effective and efficient Malaysian labor market [40].
HRDF’s new mandate is to ensure the creation and growth of quality local human capital through efficient high-skilled training certification programs and initiatives. This would contribute 35% to a skilled Malaysian workforce and the creation of 1.5 million jobs by 2020. HRDF provides human resource development solutions via funding, assessments, skills enhancement trainings, and education and promotional programs, especially to SMEs. HRDF established its pool fund to assist SME employers who have insufficient levy payment balance to continuously train and upgrade the skills of their employees.
HUMAN RESOURCE DEVELOPMENT FUND (HRDF)
HRDF ANNUAL REPORT.
Approved training Registered Apporved �nancial places employees assistance (MYR)
2012 754,324 13,737 459.76
2013 783,296 13,989 506.14
2014 695,074 15,675 472.25
2015 836,468 16,569 539.77
2016 895,610 17,535 568.77
RM(million
Source: HRDF Annual Report 2012–16.Note: Training places refer to number of employees attending the training.
MALAYSIA

106 | PUBLIC POLICY INNOVATION FOR HUMAN CAPITAL DEVELOPMENT
TABLE 2
SELECTED ECONOMIC INDICATORS, 2017 AND 2020.
Indicators (selected) 2020 2017
National per capita income (USD) 15,000 9,551 (RM41,072)
Labor productivity (%) 3.7 3.6
Compensation of employees to GDP (%) 40 35.2
Median monthly wage (RM) 2,500 2,160
Mean monthly household income (RM) 5,270 6,958
Median monthly household income (RM) 5,701 5,228
Unemployment rate (%) 2.8 3.4
Source: Department of Statistics Malaysia, Salaries and Wages Survey Report 2017; Bank Negara Malaysia Annual Report 2017.
Is Malaysia on target to achieve the aspiration of an advanced economy by 2020? Bank Negara has cautioned that Malaysia may fall short of the target for national per capita income [41]. As per its study, based on the assumption that real GDP will grow by 4.8% up to 2025 (lower compared to the 1990–17 average of 5.9%) and there will be a stable population growth of 1.3% (2017 rate), Malaysia is expected to achieve a per capita income level of about USD11,900 by 2020. This value is below the latest high-income threshold of USD12,236 as defined by The World Bank and much below the earlier projected value of USD15,000. According to Bank Negara, Malaysia’s current level of economic complexity is inadequate for boosting the economy to achieve the high-income status by 2020. Malaysia has to deliver the essential strategies to improve its economic complexity. Given that economic complexity reflects the capabilities embedded in the productive structure of the economy, it is crucial for Malaysia to diversify its product mix and expand its product complexity.
Concurrently, labor market efficiency is vital to accelerate productivity and improve global competitiveness. Efficient labor market means that labor force is matched with jobs that best suit workers’ skillsets. Efficient labor market also means both employees and employers are invested to act in ways that promote the productivity of human capital, labor force works as efficiently as possible, and employers provide incentives appropriate to the skillsets possessed by the employee [42]. Participation in labor force, ability to attract and retain talent, unemployment rate, and flexibility of wage determination are often used as indicators to measure labor market performance. While quality education and training system, institutional good governance, and healthy macroeconomic environments are some of the key factors that contribute to labor market efficiency and economic competitiveness, issues pertaining to supply and demand, skills mismatch, quality of supplies, wages and incentives, and job creations pose challenges to the maintenance and sustainability of a healthy labor market.
Meeting Supply and Demand To achieve Malaysia’s aspirations, it is imperative to develop, attract, and retain a first-world talent base. The talent base and workforce of high-income nations include a number of key characteristics. Specifically, these include higher-education qualifications to promote knowledge generation and innovation, high skill levels in technical and professional fields, and strong levels of productivity. There are significant gaps to close in order to achieve a first-world talent base in Malaysia. Although various policies, initiatives, and investments are placed to boost participation in STEM and TVET, the targets are still not met. An example is the 60:40 STEM to non-STEM target. There
MALAYSIA

PUBLIC POLICY INNOVATION FOR HUMAN CAPITAL DEVELOPMENT | 107
is growing concern that the STEM talent pipeline is not producing sufficient number of talents for growth in 2020 and beyond.
An analysis of the pipeline from lower secondary to tertiary level shows attrition in the cohort of students in STEM education at each level, as shown in Figure 13. From a total of 441,850 students who were in Form 3 (end of lower-secondary level) in 2009, 48.5% opted for STEM education in Form 4 and graduated in STEM Form 5 (end of upper-secondary level). Even though 67.4% of them had a minimum strong credit in pure science subjects, only 20.7% of the cohort pursued STEM education at government post-secondary institutions. At the tertiary level, about 43% continued to further their studies in STEM fields.
The last two decades have recorded a gradual decline in student participation in STEM education. The decline may be attributed to student’s lack of interest and confidence in STEM, an impression that STEM subjects are difficult to learn and too focused on ‘theories,’ the influence of family and peers on choices of subjects, limited and outdated infrastructure, and lack of awareness on STEM careers, with perceived lesser opportunities and returns in STEM careers [43]. Figure 14 shows the enrollment trend at upper secondary level by stream, from 2007 to 2017. Enrollment in STEM streams is lower compared to non-STEM streams and declined from 2015 when the new school-based assessment was introduced at the end of lower secondary for the 2015 cohort.
STEM PIPELINE.
FIGURE 13
2011Form 5198,931 (48.48%) STEM
Science 122,735 (29.91%)
Vocational/technology 52,743 (12.85%)
Vocational 14,968 (3.65%)
Technical 6,098 (1.49%)
NVTC skills 2,387 (0.58%)
2012Post secondary41,189 (20.71%) STEM
Matriculation 21,458 (52.10%)
Asasi UA 6,969 (16.92%)
Form 6 (lower) 11,777 (28.59%)
Diploma 985 (2.39%)
2013Tertiary education(Degree-UA)26,479 (43%) STEM
2016Workforce43% STEM
2009Form 3441,850
16,926(3.83%)
14,554(3.43%)
424,924410,370
2010Form 4206,190 (48.52%) STEM
Science 124,982 (29.41%)
Vocational/technology 56,224 (13.23%)
Vocational 15,867 (3.73%)
Technical 6,295 (1.48%)
NVTC skills 2,822 (0.6%)
Student enrollments in STEM
MALAYSIA

108 | PUBLIC POLICY INNOVATION FOR HUMAN CAPITAL DEVELOPMENT
Similarly, the percentage of science graduates with PhD, master’s and bachelor’s degrees also shows a decreasing trend, from 66.5% in 2014 to 63.3% in 2016 (see Figure 15). The Academy Science Malaysia has raised concerns that there is a potential shortage of STEM labor force necessary to drive economic advancement [44].
STEM AND NON-STEM ENROLLMENTS AT UPPER-SECONDARY LEVEL, 2007–17.
FIGURE 14
2007 2008 2009 2010 2011 2012 2013 2014 2015 2016 2017
Science Arts Vocational Technocal/technology
Less preference in STEM vs arts among students (aged 15)
50.1 50.752.3 51.5 51.3 52.4 53.5 52.6
55.5 55.5 54.6
29.4 29.2 29.4 29.4 29.4 28.9 28.5 29.0
23.6 22.5 22.9
16.6 16.014.3 14.7 14.4 14.0 13.4 13.2
16.0 15.8 15.3
3.9 4.1 4.1 4.4 4.9 4.7 4.6 5.1 5.0 6.2 7.2
PERCENTAGE OF SCIENCE GRADUATES BY HIGHEST QUALIFICATION.FIGURE 15
26.0 25.0 24.5
17.2
15.9 16.1
6.9
12.6 7.6
16.4
14.315.1
2.8
5.220.8
12.3
11.3
11.2
11.7
8.3
7.117.710.5
2.9
0%
10%
20%
30%
40%
50%
60%
70%
80%
90%
100%
2014 2015 2016
Ph.D Masters Post Degree Diploma
Bachelors Advance Diploma Diploma
Certi�cates Professional Post Degree Certi�cates
Perc
enta
ge (%
)
Source: Ministry of Higher Education.
MALAYSIA

PUBLIC POLICY INNOVATION FOR HUMAN CAPITAL DEVELOPMENT | 109
While enrollment in STEM streams is declining, enrollment in vocational streams is increasing during the same period, which may be due to the mainstreaming and expansion of vocational education. Enrollment in TVET programs needs to increase from the annual intake of 164,000 in 2013 to 225,000 in 2020 if Malaysia is to meet the Eleventh Malaysia Plan’s projection that 60% of the 1.5 million jobs created by 2020 require technical and vocational-related skills. Otherwise, the undersupply of skilled workers would persist, especially in 10 out of the 12 National Key Economic Area identified [45]. Skilled workers are projected to comprise 35% of the workforce by 2020, with 58% semi-skilled workers and 7% low-skilled workers. The trend in workforce skill level as given in Figure 16 shows a gap between the current and projected numbers in 2020, indicating a potential shortage of skilled labor in Malaysia.
Supply Quality Although participation in and perception on TVET is improving, the challenge is not merely the quantity but rather the quality of TVET graduates. Industries claim that there is a need to improve the quality of TVET graduates. Feedback from industries reveals the lack of connectedness between a graduate’s knowledge, skills, and work attitudes with what is required at the workplace. The Study on Demand and Supply on Human Capital Requirements on Technical and Vocational Training [49] reported that instructors with limited experience or attachment to industries could be the main reason. About 44% of TVET instructors possess little to no experience in the field before becoming an instructor, 66% have less than one year of experience in the industry, and 83% have had less than one month of industry attachment throughout their career.
Another reason is the lack of industry’s involvement in the TVET curriculum development, teacher/trainer continuous professional development, and attachment programs with industries. The TVET curriculum and training must be in line with manpower skills demand of the industry. Industries
TREND OF WORKFORCE SKILLS, 2015–20.
FIGURE 16
2015 2016 2017
Actual Projected2018 2020
70
60
50
40
30
20
10
0
Low skilled Semiskilled Skilled
Source: Department of Statistics, Malaysia.
MALAYSIA

110 | PUBLIC POLICY INNOVATION FOR HUMAN CAPITAL DEVELOPMENT
have highlighted the need for continuous and impactful engagements. Around 70% of industries engaged have expressed their readiness to collaborate with education and training institutions while 82% of institutions engaged have suggested industry’s involvement in curriculum development. About 59% of industries have suggested internship to improve the quality of TVET graduates. Industries and institutions that participated in the study appear to be aligned and have expressed the need and willingness to collaborate.
Establishing meaningful and sustainable collaboration has been a challenge in Malaysia. At present, the TVET landscape consists of six ministries, 16 public agencies, 521 institutions, and more than 3,000 programs. The fragmented landscape leads to more than 1,000 public and private TVET institutions offering similar programs of varying standards. There is a need to enhance coordination among ministries and agencies in order to improve institutions’ operational efficiencies. However, collaborations between the industry and TVET training providers rarely reach the breadth and depth necessary to develop high-quality programs. Limited coordination across different ministries may also result in potential loss of opportunities to develop high-quality training with less cost. Cross analysis shows that 57% of TVET public institutions, on average, offer less than three programs, some in near vicinity of one another, thus resulting in duplication of programs and resources. For example, in the state of Johor, 19 institutions across six ministries are offering welding-related programs, where 13 out of 22 programs are for certificate levels 1 to 3, while the remaining nine programs are diploma and above [50].
Despite the government’s commitment to align STEM initiatives with the objectives of the New Economic Model, Economic Transformation Program, and the Government Transfor-mation Plan, there still are challenges in implementing these policies. The number of students who have chosen STEM stream at the upper-secondary level has continued to decline in recent years. Currently, only 45% of secondary school students choose to do STEM. The percentage of lower-secondary school students, who met the requirement to study science at upper-secondary level but chose not to do so, increased to approximate-ly 15% [46]. The current demand for STEM-capable workers surpasses the supply of applicants trained for those careers. The Ministry of Science, Technology and Innovation (MOSTI) estimates that there will be a shortfall of 236,000 professionals in STEM-related fields (MOSTI, 2012). Given these shortfalls for a STEM-capable workforce, the nation’s economic future depends on preparing more students to enter these fields [47].
In terms of quality of STEM education, studies show that the teaching and learning approaches are teacher-centered and students lack sufficient opportunities to be critical, creative, and innovative. Some teachers lack the requisite knowledge in science and mathematics subjects. Some teachers invest heavily in preparing students for examinations, at the expense of the practical elements of the curriculum [48]. Students are not doing science experiments because the practical examinations (at upper-sec-ondary level) have been replaced by school-based assessments and pen-and-paper tests for more than 15 years. As such, students had less opportunities and were less likely to explore scientifically and mathematically due to perceived lack of time, resourc-es, tools, support, and lab infrastructure.
STEM EDUCATION CHALLENGES IN MALAYSIA
MALAYSIA

PUBLIC POLICY INNOVATION FOR HUMAN CAPITAL DEVELOPMENT | 111
The Malaysia Productivity Blueprint (2016) identified the challenges and strategies for three emerging skills that are in demand. These are, retail and food and beverages (F&B), chemicals and chemical products, and information and communications technology [51–53].
Strategies to Prioritize Emerging SkillsBased on the findings of competency gaps in the selected subsectors of the economy, the Malaysia Productivity Blueprint forwards several initiatives to prioritize emerging skills needs. Acknowledging the wide variation in challenges for different sectors and industries, additional sector-specific initiatives are critical for productivity improvement.
Strengthening retail and F&B competencies: This initiative focuses on ensuring employers’ commitment to developing talent and competencies as well as providing a strong incentive structure and career development program for employees. It calls for establishing a talent development program, including specific measures to recruit and retain quality human capital [54]. Proactive engagement with successful enterprises to develop better career pathways and incentive structures will encourage graduates to actively seek a long-term career in retail and F&B, motivating them to provide high-quality customer service and improve efficiency. It is vital that enterprises recognize the importance of investing in and developing their human capital, and are prepared to redesign jobs to involve higher-value-added tasks, with lower-value-added tasks eventually replaced by technology adoption.
Deepen collaboration between industry players and educational institutions offering chemical-related courses: A collaboration framework between selected industry players and relevant education and training institutions, with effective tracking mechanisms must be established. This pilot scheme will ensure that educational institutions receive inputs on updated technological advances and trends related to the industry to enable more targeted curriculum planning as well as research funding. The collaboration will also allow industry players to articulate their required skillsets and provide inputs on the feasibility of proposed research, based on experience on the ground. It will also include a comprehen-sive framework that would outline potential collaborations for long apprenticeships, sponsored research, and industry-led workshops to develop soft skills, focusing on developing industry-ready graduates [55]. By providing university students the opportu-nity to experience practical training in the industry, it will also encourage them to develop a career in chemicals in future, thus creating a quality pipeline of talent for the sector.
Enhance the employability of ICT graduates: To enhance the employability of ICT graduates, Malaysia Digital Economy Corporation (MDEC) has implemented several skills development initiatives on industry readiness. For example, the job camp, Gradu-ate Employability Management Scheme, trained 38,377 graduates and 12,363 profes-sionals from 2010 to 2014. The scheme involved the participation of over 1,200 compa-nies and 40 institutes of higher learning, pointing to a closer industry and academia collaboration to manage the skills gap in the ICT industry [56].
CHALLENGES AND STRATEGIES FOR THREE PRIORITIZED EMERGING SKILLS IN MALAYSIA
MALAYSIA

112 | PUBLIC POLICY INNOVATION FOR HUMAN CAPITAL DEVELOPMENT
To address the skills gap, the government established the Critical Skills Committee, jointly led by Talent Corporation and the Institute of Labor Market and Analysis (ILMIA) to assist the Industry Skill Committee and the National Human Capital Development Council (NHCDC) on the labor market condition and critical skill shortages. The committee will inform education and training institutions to supply the right talent. Talent Corporation implemented internship and apprenticeship programs including an upskilling program for fresh graduates that partners training providers and industries.
Supply and Demand, Job Creation, and Unemployment Unemployment statistics from 2007 to 2017 show that the unemployment rate in Malaysia is relatively low and stable at about 3%. Of concern is rising unemployment among youth and graduates in recent years. The Bank Negara Malaysia Annual Report 2016 highlighted that the unemployment rate for youth (10.7%) was three times higher than the national rate (3.1%), with youth making up more than half of the total unemployed workers while representing only a third of the labor force [55].
Youth with tertiary education had a higher unemployment rate (15.3%) compared to those without tertiary education (9.8%). The 2015 Graduate Tracer Study Report by the Ministry of Higher Education tracked the status of graduates from higher-learning institutions six months after graduation. Among all graduates, 59% reported to have started working, 17% pursued further studies, and 24% were unemployed. Science graduates recorded the highest unemployment rate of 27.9% among graduates of all qualifications, as shown in Figure 17. By field of study, graduates
GRADUATE TRACER STUDY REPORT FINDING, 2015.
FIGURE 17
0
10
20
30
Science
Unemployment rate by �eld of study
Distribution of graduates by employment status
Literature and socialsciences
Technical Information technology and communications
Education
24%
17%
59%
Not yet working
Further studiesWorking
Source: Department of Statistics, Malaysia.
MALAYSIA

PUBLIC POLICY INNOVATION FOR HUMAN CAPITAL DEVELOPMENT | 113
from the streams of sciences, literature, and social sciences tend to have higher rates of unemployment. The high youth-and-graduate unemployment rate was mainly due to the moderating economic performance and slow hiring since 2014, labor market mismatches resulting from limited high-skilled job creation, changes in the workforce educational attainment, and inadequate supply of industry-ready graduates. If unchecked, the persistent problem of high youth and graduate unemployment would lead to income inequity, constrained social mobility, and youth alienation.
In 2017, youth unemployment rate hit the highest record at 10.8% [57]. The high youth unemployment is mainly contributed by the graduate unemployment rate, which went up to 9.6% or approximately 204,000 in absolute terms, constituting 40.5% of total unemployment. About 22% of all graduates had not secured employment after graduation [58]. The share of youth employment decreased from 17% in 2014 to 16.2% in 2017. Rising youth unemployment is possibly due to skills mismatch. For instance, out of all job vacancies in 2017, 76% were for elementary occupations and 10.3% for plant-and-machinery operators and assemblers, which were low-skill jobs and very likely not suitable for fresh graduates. Only 4.1% of total job vacancies were for high-skill jobs such as professionals and technicians.
The quality of workforce and creation of high paying jobs are essential to support the realization of an advanced economy. Despite a large number of new jobs created, the quality of jobs remains an issue. In 2013, about 553,000 workers with diploma or higher qualification were employed in semi-skilled category, reflecting insufficient creation of skilled jobs [59]. The growth rate of wages for skilled workers was 8.4% compared with 7.2% for semi-skilled workers in 2017 and 60% of wage recipients received a salary of less than RM3,000 per month [60]. Similarly, TVET graduate salaries remain low, with 31% receiving less than the monthly minimum wage while 41% earning between RM1,000 to RM1,500 per month [61].
This indicates a mismatch in supply and demand of the labor market, inaccuracy of projections, and/or poor planning. Mismatch happens when demand for and supply of skills are not aligned, resulting in oversupply or undersupply in certain sectors [62]. However, it is also important to consider the fact that imposition of vast economic developments brings about changes in a nation’s human capital development plans, labor market, and economic needs. In case of Malaysia, although the human capital development methodologies, approaches, and tools adopted are in line with international approaches and practices, projections are not always accurate or targets always achieved. For example, despite its best efforts, Malaysia is yet to achieve the goal of 60:40 ratio for science to arts (later changed to STEM to non-STEM) set in the 1960s.
MOHE’s Tracer Study in 2015 shows that 27.7% science graduates, 23.6% technology graduates, and 23.3% ICT graduates were unable to secure a job six months after graduation [63]. Even though Malaysia is unable to meet the supply projected for STEM and TVET skillsets, unemployment among TVET and STEM graduates persists. On one hand, this could imply that there are no jobs available, which would mean that the labor market projection was inaccurate; on the other hand, it could also be argued that projections were made based on the country’s vision to become a developed nation with highly skilled human capital, improved GDP, and increased individual income. Does this mean the envisioned jobs were not created? Or, the forecasted labor market did not become a reality? There is a need to examine other components that contribute to labor market efficiency, such as the readiness of the local industries to employ skilled workers, expand and create jobs, and play an active role in simulating the labor market and national economy at large.
MALAYSIA
114 | PUBLIC POLICY INNOVATION FOR HUMAN CAPITAL DEVELOPMENT
Governance and Delivery of Human Capital Development Plan The national development plans since the 1950s reflect the commitment of the government for economic development and social justice. Internal and external factors have influenced the formulation and implementation of these plans. Federal and state bureaucracies played crucial roles in implementing the policies and plans in the 1970s. Economic reforms and restructuring in the 1980s and 1990s brought about greater involvement of corporate technocrats from government investment companies and government-linked companies. Economic policymaking changed further in the last phase of development towards Vision 2020, with a more centralized and flexible but less transparent approach to development planning [64].
Malaysia sees the development of human capital as a key driver of economic growth towards high-income status. A shortage of industry-ready skilled workers will present a huge challenge in realizing the economic vision. Efficiency in human capital development planning, though possible, is challenging, with various interfering variables that evolve over time. In the overall organization and governance of human capital development, there is a tendency for structural issues and policy developments to be heavily influenced by the top-down section in spite of consolidation efforts to integrate and harmonize inputs from the bottom-up section. Efforts to shift from relying heavily on a top-down approach to more of a bottom-up approach needs to be strengthened, especially since many stakeholders are involved and delivery systems are fragmented and compartmentalized on the bottom-up side.
From the human capital development planning perspective, Malaysia’s planning framework focuses more on people development (demand and supply). However, at the macro level, human capital development planning appears to be limited at the aggregate (summary) level and lacks concrete evidence on the dynamics of demand. Macro projection is limited due to the absence of comprehensive industry-level data and information. From the projection and forecasting perspective, limitation of disaggregated data from both demand and supply sides impairs accuracy in projections and forecasting demand. Hence, there is a need to harmonize the integration between the demand and supply models by intensifying regular engagements with industries to understand the demand side better and facilitate improved collection of industry-specific data. Continuous engagements and coordination with agencies on the supply side is equally important not only to obtain data of supply flow but also to ensure implementation of quality and relevant content, and more importantly to reduce gaps between demand and supply projections as well as human capital development planning.
The coordination mechanism between industry and skills development needs to be further strengthened. The EPU, as the central agency overseeing economic development planning and human capital development, needs to organize and facilitate systematic and consistent engagements with both industries and training-and-education institutions so that mismatches are reduced and quality is enhanced. Legislation has to be in place so that designated councils or bodies are empowered to execute the decisions made, and policies are backed by law. For example, the proposed Science Act is yet to be enacted. Although a centralized STI body has been set up (e.g., the National Science Council (NSC) and advisory STI councils), a dedicated centralized STI body to operationalize STI-related decisions is yet to be established. Hence, no monitoring mechanism for STI is in place [65]. Studies also suggest the need to reform the current funding model from a cost-based, government funding model to an outcome-based funding to drive the right behaviors such as institution and delivery efficiency, cost effectiveness, and quality of programs [66].
MALAYSIA

PUBLIC POLICY INNOVATION FOR HUMAN CAPITAL DEVELOPMENT | 115
The Science Outlook 2017 study identified challenges within the STEM ecosystem that are caused by fragmentation of the ecosystem and weak collaborations between stakeholders. The study points out that the STI landscape involves a total of 268 actors: 23 ministries; 157 agencies under respective ministries; 27 STI-related councils (one international, 10 chaired by the Prime Minister, and 16 national councils); 16 agencies under the Prime Minister’s Department; 20 public universities; 14 state governments and federal territories; and six economic corridors. Although STI bodies have been set up (e.g., the NSC and advisory STI councils), a dedicated centralized STI body to operational-ize STI-related decisions is yet to be established. The NSC is chaired by the Prime Minister while 12 STI-related ministers, academicians, and private-sector representative sit in the council. The Science Outlook 2017 reports that although this council has executive power, it has no legislative power to legally bind decisions. A Science Act is yet to be enacted and there is no Parliamentary Select Committee for STI-related matters.
The fragmented landscape of the STI ecosystem causes inefficiency and dysfunction in the service delivery to support a strong innovation ecosystem. The tendency for resources and funds to be spread too thin is higher when too many entities are involved, “The multiple stakeholders and support instruments have led to fragmentation of resources, overlapping competencies, and high risks of redundancy resulting in ineffective wealth creation.” When the landscape is fragmented, implementation of policies and related programs tend to have a weak follow through. There are currently 46 active STI-related national policies but no monitoring mechanism for STI in place. A rationalization exercise of STI actors is fundamental for better coordination, monitoring, and evaluation of the STI agenda [67].
The Study on Demand and Supply on Human Capital Requirements on Technical and Vocational Training (2016) showed that some of the main challenges in the TVET ecosystem are also due to fragmentation of the TVET landscape and lack of systematic and meaningful collaborations between all stakeholders. These challenges are discussed below:
1. Uncoordinated governance: A thriving TVET ecosystem requires both bottom-up and top-down approaches, where the changes driven at an institutional level are supported by ministries and agencies. Although Malaysia practices both top-down and bottom-up approaches, to a large extent, the top-down approach tends to have a bigger influence on the TVET ecosystem, while the bottom-up approach continues to be fragmented and lacks coordination. Malaysia needs to find the means for aligning and strengthening collaborations and cooperation within the TVET landscape, which consists of six ministries, 16 public government agencies, 521 institutions, and more than 3,000 programs. Collaborations between industry and TVET training providers rarely reach the breadth and depth necessary to develop high-quality programs. Strong and regular collaboration and alignment across different TVET ministries and agencies will lead to manageable, realistic, and feasible policies, initiatives, plans, and implementations; and a more accurate monitoring-and-reporting system.
TVET AND STEM ECOSYSTEM CHALLENGES
MALAYSIA

116 | PUBLIC POLICY INNOVATION FOR HUMAN CAPITAL DEVELOPMENT
2. Fragmented TVET delivery: The TVET landscape is fragmented, with more than 1,000 public and private TVET institutions offering similar programs of varying standards. Limited coordination among training institutions impair development of high-quality programs. Competency gaps among instructors and lack of recognition for technologies are due to limited hands-on exposure to industries and developments. The existing funding mechanism is unable to drive the right behaviors and is highly dependent on government funding.
3. Mismatch in skillsets produced across sectors and regions: Industry feedback consistently reveals a disconnect between the knowledge, skills, and attitudes that TVET graduates possess, with what is required in the workplace. Mismatch of curriculum and expected quality is due to limited collaboration between the industries and the TVET training providers. Greater institution-industry collaboration is crucial in order to better align the curriculum and improve instructors’ quality as per industry requirements.
Following are some key changes that need to be done in order to succeed:
1. Significantly improve collaborations between industries and TVET training providers to promote quality curriculum and programs as well as instructor training.
2. Robust quality control mechanisms must be present to ensure that all private and public institutions meet quality standards.
3. Improve student’s and instructor’s access to a variety of innovative, industry-led programs, and attachments that better prepares them for the workplace, thus improving employability.
4. Replace the current cost-based and government-funded model with outcome-based funding to drive institutional efficiency, improve cost effectiveness, and boost the quality of programs.
5. Continue with the promotion of TVET and raising of awareness so that students (and parents) are well informed of the opportunities that TVET can offer, and view TVET as an attractive career pathway.
Good initiatives are in place and need to be scaled up and better coordinated for greater impact. Some of these initiatives are
• the Industry Skills Committee, set up under the Eleventh Malaysia Plan to strengthen collaborations with industries to identify human capital requirement in priority subsectors;
• Ministry of Education Community College and Polytechnic Tracer Graduate Study;
MALAYSIA

PUBLIC POLICY INNOVATION FOR HUMAN CAPITAL DEVELOPMENT | 117
Conclusion Malaysia has adopted new strategies to stimulate rapid growth, moving from primary export bases towards greater reliance on manufactured exports. Global acceleration of scientific and technological changes, with phenomenal explosion in knowledge and its dissemination through rapidly advancing technologies has created a wide spectrum of opportunities for developing countries such as Malaysia. In this context, education and human capital development are seen as important for Malaysia to meet the talent and skilled workforce requirements and accelerate the economic growth. Even though Malaysia has made progress, the nation is struggling to respond to the skills required for competitiveness, productivity, and jobs. Malaysia needs to produce a highly educated population with the right skills to enable the economy to move from upper-middle-income to high-income category.
Malaysia will not only focus on improving the efficiency of the labor market to accelerate economic growth but also on transforming STEM education and TVET to meet industry demand, in which 70% of the jobs created are expected to require STEM and TVET-related skills. STEM and TVET are identified as game changers in how Malaysia produces skilled talent at scale. Collectively, these focus areas will produce the world-class talent base that Malaysia needs in the final leg of its journey towards becoming an advanced nation. It is pivotal to understand the current trends in the industry and the demands of producing a workforce that is more competent and competitive.
The role of the education-and-training system in preparing young people for productive roles in the workforce is becoming even more important because the low-skilled or cheap-labor phase of economic development is over and both skill-intensity and capital-intensity will rise in future. The structure of the economy, in terms of industries and occupational groups, is likely to be very different in 2050 from what it is now. To boost total factor productivity, Malaysia needs to prepare for the inevitable fourth industrial revolution (4IR).
There are several useful conclusions that can be drawn from this report. First, productivity improvements will be most important in the fastest growing sectors of the economy. This translates directly into the kind of education and training that will be in demand for the labor force. If the service sector continues to lead economic growth, the labor demand will be concentrated in this industry. Second, depending on the sectors that dominate economic growth, Malaysia will require
• e-Tracer Study (Employability) Online System (eTOS), an online tracer study by the Ministry of Human Resource (MOHR) to facilitate better data management;
• Centre for Instructor and Advanced Skill Training (CIAST) Instructor e-Profiling, a single database of TVET instructor’s skills sets and experience under the Ministry of Human Resource (MOHR) ;
• Langkawi Tourism Academy, a world-class tourism academy, which is a product of public private partnership (PPP); and
• Kedah Industrial Skills and Management Development Centre (KISMEC), which focusses on enhancing the quality of education and training, raising the graduate employability, and reviewing the effectiveness of programs to meet the needs of the industry [68].
MALAYSIA

118 | PUBLIC POLICY INNOVATION FOR HUMAN CAPITAL DEVELOPMENT
more rapid expansion in educational attainment of its population. The service sector will require a high rate of tertiary graduates. Although a higher rate of tertiary graduates including STEM and TVET is needed, it is important that the labor market policies and growth remain strong to provide them the jobs, as per the projected job creation and economic growth. Third, STEM and TVET must be fully emphasized in anticipating the nation’s future need. Fourth, the economic and labor market policies are important to influence the opportunities for young people in employment. Education policy can and must play a more supportive role, especially in integrating education, manpower planning, and economic planning into a structured plan.
The organizational structure of the STEM and TVET ecosystem need to be further enhanced if Malaysia is to effectively produce and sustain a healthy labor market. Labor market efficiency is key to developing a just society and creating a developed nation. Having first-class policies is a positive step; however, if there is no proper organizational structure to support its effective implementation and monitoring, good policies will remain efficient on paper and may not necessarily lead to the desired outcome. This report has highlighted the gaps in Malaysia’s human capital development planning and organizational structure, the fragmentation of the STEM and TVET ecosystem and its impact on productivity, and some of the strategies in addressing the challenges. It is of utmost importance that Malaysia addresses these gaps and challenges to achieve its vision of an advanced, high-income nation by 2020.
References[1] Economic Planning Unit (EPU). Eleventh Malaysia Plan 2016–2020. Kuala Lumpur:
Percetakan Nasional Malaysia Berhad; 2015.
[2] EPU. The Malaysian Economy in Exhibits 2018. http://epu.gov.my/sites/default/files/MEIF_2018.pdf. Accessed on 21 June 2018.
[3] EPU. Malaysia Productivity Blueprint. http://www.epu.gov.my/. Accessed on 21 June 2018.
[4] OECD. OECD Economic Surveys: Malaysia 2016: Economic Assessment. Paris: OECD Publishing; 2016.
[5] Halimaton H. Towards Strengthening National Science and Technology (Ke Arah Memartabatkan Sains dan Teknologi Negara). Paper presented at the STEM National Congress, 21–22 November 2017.
[6] EPU. Eleventh Malaysia Plan 2016–2020. Kuala Lumpur: Percetakan Nasional Malaysia Berhad; 2015.
[7] Department of Statistics Malaysia (DOSM). Population Statistics.
[8] DOSM. Labour Force Survey Report, Malaysia 2017. https://www.dosm.gov.my. Accessed on 21 June 2018.
[9] Mohd. Dian H.I., Mohd. Zaidi M. Youth Unemployment in Malaysia: Developments and Policy Considerations. In: Bank Negara Malaysia (BNM) Annual Report 2016. http://www.bnm.gov.my/files/publication/ar/en/2016/cp04_003_box.pdf. Accessed on 21 June 2018.
MALAYSIA

PUBLIC POLICY INNOVATION FOR HUMAN CAPITAL DEVELOPMENT | 119
[10] BNM. Bank Negara Malaysia Annual Report 2017. http://www.bnm.gov.my/files/publication/ar/en/2017/ar2017_book.pdf. Accessed on 21 June 2018.
[11] EPU. Eleventh Malaysia Plan 2016–2020. Kuala Lumpur: Percetakan Nasional Malaysia Berhad; 2015.
[12] EPU. The Malaysian Economy in Figures 2018. http://epu.gov.my/sites/default/files/MEIF_2018.pdf. Accessed on 21 June 2018.
[13] DOSM. Report of Household Income and Basic Amenities Survey 2016. https://www.dosm.gov.my/v1/index.php?r=column/cthemeByCat&cat=120&bul_id=RUZ5REwveU1ra1hGL21JWVlPRmU2Zz09&menu_id=amVoWU54UTl0a21NWmdhMjFMMWcyZz09. Accessed on 21 June 2018.
[14] MOE Malaysia. Quick Facts 2018. Putrajaya: Educational Planning and Research Division, MOE Malaysia; 2018.
[15] MOE Malaysia. Malaysia Education Blueprint 2013–2025 (Preschool to Post-Secondary Education). Putrajaya: MOE Malaysia; 2013.
[16] MOE Malaysia. Quick Facts 2018. Putrajaya: Educational Planning and Research Division, MOE Malaysia; 2018.
[17] DOSM. Labour Force Survey Report, Malaysia 2017. https://www.dosm.gov.my. Accessed on 21 June 2018.
[18] WEF. The Global Human Capital Report 2017. http://www3.weforum.org/docs/WEF_Global_Human_Capital_Report_2017.pdf. Accessed on 21 June 2018.
[19] United Nations Development Program (UNDP). Malaysia Human Development Index. http://hdr.undp.org/en/countries/profiles/MYS. Accessed on 21 June 2018.
[20] International Institute for Management Development (IMD). IMD World Competitiveness Ranking 2918. https://www.imd.org/wcc/world-competitiveness-center-rankings/world-competitiveness-ranking-2018/. Accessed on 21 June 2018.
[21] World Economic Forum (WEF). The Global Competitiveness Report 2017–2018. http://www3.weforum.org/docs/GCR2017-2018/05FullReport/TheGlobalCompetitivenessReport2017%E2%80%932018.pdf. Accessed on 21 June 2018.
[22] World Bank. Doing Business 2018. http://russian.doingbusiness.org/~/media/WBG/DoingBusiness/Documents/Annual-Reports/English/DB2018-Full-Report.pdf. Accessed on 21 June 2018.
[23] The Economist Intelligence Unit. Business Environment Rankings: Which country is best to do business in? http://www.iberglobal.com/files/business_climate_eiu.pdf. Accessed on 21 June 2018.
[24] Ministry of Science, Technology and Innovation (MOSTI). National STEM Strategic Action Plan 2018–2025 (Pelan Tindakan Strategik STEM Nasional 2018–2025). Putrajaya: MOSTI; 2018.
MALAYSIA

120 | PUBLIC POLICY INNOVATION FOR HUMAN CAPITAL DEVELOPMENT
[25] MOE Malaysia. Malaysia Education Blueprint 2015-2025 (Higher Education). Putrajaya: MOE Malaysia; 2015.
[26] EPU. Study on the Demand and Supply of Human Capital Requirements on Technical Vocational Education and Training. Main Study. Putrajaya: EPU; 2016.
[27] EPU. Presentation to National Education Advisory Council. Putrajaya; 2015.
[28] EPU. Presentation to National Education Advisory Council. Putrajaya; 2015.
[29] DOSM. National Accounts: Gross Domestic Product; 2018.
[30] EPU. Malaysia Productivity Blueprint. http://www.epu.gov.my/. Accessed on 21 June 2018.
[31] Ministry of Science, Technology and Innovation (MOSTI). Science and Technology Human Capital Roadmap: Towards 2020. Putrajaya: Malaysian Science and Technology Information Centre, MOSTI; 2012.
[32] EPU. Eleventh Malaysia Plan 2016–2020. Kuala Lumpur: Percetakan Nasional Malaysia Berhad; 2015.
[33] Ministry of Human Resources Malaysia. Productivity Linked Wage System (PLWS). Kuala Lumpur: Percetakan Nasional Malaysia Berhad; 2008.
[34] Goh S.K. Is productivity linked to wages? An empirical investigation in Malaysia; 2019. https://www.researchgate.net/publication/38309288_Is_Productivity_Linked_To_Wages_An_Empirical_Investigation_in_Malaysia. Accessed on 3 January 2019.
[35] EPU. Fifth Malaysia Plan 1986–1990. Kuala Lumpur: Percetakan Nasional Malaysia Berhad; 1986.
[36] Ministry of Science, Technology and the Environment (MOSTE). The Second National Science and Technology Policy and Plan of Action. Putrajaya: Ministry of Science, Technology and the Environment; 2003.
[37] Ministry of Science, Technology and Innovation (MOSTI). National Policy on Science, Technology & Innovation (NPSTI) 2013–2020; 2013.
[38] EPU. Tenth Malaysia Plan, 2011-2055. Kuala Lumpur: Percetakan Nasional Malaysia Berhad; 2010.
[39] Mansor N. New Economic for Malaysia, Part 1. Kuala Lumpur: Strategic Policy Directions, National Economic & Advisory Council (NEAC); 2010.
[40] Human Resource Development Fund, Malaysia. http://www.hrdf.com.my/ wps/portal/PSMB/MainEN/Corporate-Profile/About-HRDF. Accessed on 21 June 2018.
[41] BNM. Bank Negara Malaysia Annual Report 2017. http://www.bnm.gov.my/files/publication/ar/en/2017/ar2017_book.pdf. Accessed on 21 June 2018.
MALAYSIA

PUBLIC POLICY INNOVATION FOR HUMAN CAPITAL DEVELOPMENT | 121
[42] World economic Forum. http://reports.weforum.org/global-competitiveness-report-2015-2016/labor-market-efficiency. Accessed on 6 August 2018.
[43] Ministry of Science, Technology and Innovation (MOSTI). Science and Technology Human Capital Roadmap: Towards 2020. Putrajaya: Malaysian Science and Technology Information Centre, MOSTI; 2012.
[44] Akademi Sains Malaysia. Science Outlook 2017. Kuala Lumpur: Akademi Sains Malaysia; 2017.
[45] MOE Malaysia. Malaysia Education Blueprint 2015–2025 (Higher Education). Putrajaya: MOE Malaysia; 2015.
[46] MOE Malaysia. Malaysia Education Blueprint 2013–2025 (Preschool to Post-Secondary Education). Putrajaya: MOE Malaysia; 2013.
[47] Ministry of Science, Technology and Innovation (MOSTI). Malaysian Science and Technology Indicators 2008 Reports. Putrajaya: Malaysian Science and Technology Information Centre, MOSTI; 2008.
[48] Mohd Shahali E.H., Ismail I, Halim L. Science and Technology Trends Policy Trajectories and Initiatives in STEM Education, Asia Research Policy; pp. 122–33. Korea Institute of Science & Technology Evaluation and Planning (KISTEP); 2016.
[49] EPU. Study on the Demand and Supply of Human Capital Requirements on Technical Vocational Education and Training (TVET), Final Report Volume I–Main Report. Putrajaya: Economic Planning Unit; 2016.
[50] EPU. Malaysia Productivity Blueprint. http://www.epu.gov.my/. Accessed on 21 June 2018.
[51] EPU. Malaysia Productivity Blueprint. EPU website. http://www.epu.gov.my/. Accessed on 21 June 2018.
[52] Tan K.S., Tang J.T.H. New skills at work: Managing skills challenges in ASEAN-5. Research Collection School of Economics; 2016
[53] EPU. Malaysia Productivity Blueprint. http://www.epu.gov.my/. Accessed on 21 June 2018.
[54] EPU. Malaysia Productivity Blueprint. http://www.epu.gov.my/. Accessed on 21 June 2018.
[55] EPU. Malaysia Productivity Blueprint. http://www.epu.gov.my/. Accessed on 21 June 2018.
[56] Tan K.S., Tang J.T.H. New skills at work: Managing skills challenges in ASEAN-5. Research Collection School of Economics; 2016
[57] Visioning Malaysia’s Future of Work: A Framework For Action. TalentCorp Report; 2017.
[58] Department of Statistics Malaysia (DOSM). Labor Force Survey; 2017.
MALAYSIA

122 | PUBLIC POLICY INNOVATION FOR HUMAN CAPITAL DEVELOPMENT
[59] EPU. Eleventh Malaysia Plan 2016–2020. Kuala Lumpur: Percetakan Nasional Malaysia Berhad; 2015.
[60] EPU. Eleventh Malaysia Plan 2016–2020. Kuala Lumpur: Percetakan Nasional Malaysia Berhad; 2015.
[61] EPU. Eleventh Malaysia Plan 2016–2020. Kuala Lumpur: Percetakan Nasional Malaysia Berhad; 2015.
[62] EPU. Study on the Demand and Supply of Human Capital Requirements on Technical Vocational Education and Training (TVET), Final Report Volume I–Main Report. Putrajaya: Economic Planning Unit; 2016.
[63] Ramos C. Skills Issues, Sources Of Skills Issues, And Policy Responses In Five Asean-Member Countries. The HEAD Foundation; 2016
[64] Ministry of Higher Education (MOHE). Graduate Tracer Study 2015. Putrajaya; 2016.
[65] The Evolution of Development Planning in Malaysia. https://www.researchgate.net/ publication/322353909_The_Evolution_ of_Development_Planning_in_Malaysia. Accessed on 15 July 2018.
[66] Akademi Sains Malaysia. Science Outlook 2017. Kuala Lumpur: Akademi Sains Malaysia; 2017.
[67] EPU. Study on the Demand and Supply of Human Capital Requirements on Technical Vocational Education and Training (TVET), Final Report Volume I–Main Report. Putrajaya: Economic Planning Unit; 2016.
[68] Akademi Sains Malaysia. Science Outlook 2017. Kuala Lumpur: Akademi Sains Malaysia; 2017.
MALAYSIA

PUBLIC POLICY INNOVATION FOR HUMAN CAPITAL DEVELOPMENT | 123
PHILIPPINES
Emiljohn Columna SentillasEducation Program Specialist II
Policy Research and Development Division, Planning Service Department of Education
IntroductionHuman capital is frequently highlighted as a crucial factor in the development and productivity of an individual, a family, an organization, or a country’s economy. Schulze [1] defined human capital as the skills and knowledge of people who contribute to the growth and development of national and global economic systems. It is the array of qualities and abilities of an individual that enable her or him to be productive. Investing in the development of human capital plays an important role in one’s ability to cope with the needs and demands of dynamic labor markets. With the anticipated arrival of the fourth industrial revolution, a technological revolution described as the ‘marriage of physical and digital technologies’ [2], it is significant for governments to implement policies and programs that can help prepare and provide opportunities for citizens to address the inevitable technological and economic changes.
In discussing human capital, education plays a key role in ensuring that the labor force is well-equipped to adjust to imminent changes. From basic education to lifelong learning, setting up systems to develop the skills of the labor force is a priority for governments. Two major educational and training areas are often emphasized when discussing the future of skills. These are science, technology, engineering, and mathematics (STEM); and education and technical-vocational education and training (TVET).
STEM education has been a focus of education systems to keep up with rapid changes arising from scientific and technological advances in the past decades. STEM education provides an overview of ‘what has been’ and sets the stage for ‘what will be.’ This allows education systems to prepare learners with the skills relevant for the envisioned digital future.
TVET, as in most countries, is geared towards supporting the needs of the labor market and the economy, emphasizing the well-established relationship between skills and productivity [3]. TVET covers a wide range of clientele across genders and backgrounds to train and retrain people according to the needs of the country. However, the advent of the fourth industrial revolution, which could render some jobs obsolete, will also affect the direction of TVET. In addition, there is also a high demand for ‘emerging skills’ such as socioemotional skills, soft skills, and noncognitive skills, which reflect the worker’s personality, attitude, and mindset [4]. Technical skills, while valuable, need to be complemented with the attitude and work ethic required to increase productivity. All of these provide the background for future human-capital investment.
In this specific context, the Philippines, with its recent implementation of a 13-year education system through the ‘K to 12’ basic education curriculum, has been aligning its efforts to address the

124 | PUBLIC POLICY INNOVATION FOR HUMAN CAPITAL DEVELOPMENT
future needs of the country, including the emerging skills needed by its learners. Aside from the major educational reform in 2012, the Philippines has implemented various complementary programs across sectors to develop its human capital and increase the nation’s productivity. In terms of STEM education and TVET, the Philippines has posted gains through policies and programs to capacitate and retool the citizens in these areas. However, it is yet to be seen how these reforms will impact productivity.
To better prepare for the future, it is relevant to recognize the gains and identify the challenges of the past. This report will delve into the gains and the impact of public-policy innovations on human capital development in the Philippines. Specifically, it will focus on the investments and public-policy innovations in STEM education and TVET. Primarily, this study gathered administrative data and documents on the implementation of previous policies and programs in the areas of STEM and TVET and how these relate to the productivity of the current labor force. This report will also provide insights and discuss policy implications of aligning public policy initiatives and innovations as the country moves toward Industry 4.0.
BackgroundPopulation and DemographicsThe sovereign state of the Philippines is an archipelago located in southeast Asia. Composed of 7,641 islands with a land area of approximately 300,000 sq km, it is divided into three major island groups: Luzon, Visayas, and Mindanao.
As per the 2015 Census, the population of the Philippines is 100,981,437, with an average annual growth rate of 1.72% during the period 2010–15 (see Figure 1). The population growth rate in this period is slightly lower than the growth rate of 1.9% during 2000–10 and 2.3% during 1990–2000. 50.6% of the population is male while 49.4% is female, which translates into a sex ratio of 102 males for every 100 females. Classified as a young population, half of the Philippines’ total population is below 24.3 years old. Currently, the total population is estimated to be 104.2 million.
PHILIPPINE POPULATION, 1990–2015.
FIGURE 1
60.768.28
76.51
88.5592.34
100.98
0
20
40
60
80
100
120
1990 1995 200 2007 2010 2015
In m
illio
n
Census years
Source: Philippine Statistics Authority.
PHILIPPINES

PUBLIC POLICY INNOVATION FOR HUMAN CAPITAL DEVELOPMENT | 125
Philippine EconomyThe Philippine economy has steadily grown in the past years. The gross domestic product (GDP) grew by 6.7% in 2017. Albeit slightly lower than the 6.9% growth posted in 2016, it is projected that fast growth rate will continue through 2019 [5]. In terms of per capita GDP, the Philippines posted a growth of 5.0% in 2017, improving from the 4.6% growth in 2016. Just like the GDP growth, the per capita GDP was also projected to steadily increase through 2019 (see Figure 2). The country is touted to be among the fastest-growing economies in southeast Asia [5]. This growth is attributed to intensified investments in infrastructure, manufacturing, and technology.
The Philippine economy is divided into three major sectors: services, industry, and agriculture. Services continues to be the top contributor to the country’s GDP. While industry’s contribution in 2017 slowed compared to 2016, the manufacturing subsector (particularly chemical and chemical products manufacturing) remained the highest contributor to the country’s GDP in 2017 [5].
However, in a recently published study by The World Bank [6], despite the healthy economic growth of the country and the reduction in the national poverty rate over the past decade, the pace
GDP GROWTH AND PER CAPITA GROWTH IN PHILIPPINES.
FIGURE 2
7.1
6.1 6.1
6.9
6.76.8
6.9
5.6
5.8
6.0
6.2
6.4
6.6
6.8
7.0
7.2
2013 2014 2015 2016 2017 2018 2019
0.0
1.0
2.0
3.0
4.0
5.0
6.0
5.2
4.4
4.94.6
5.0 5.1 5.2
2013 2014 2015 2016 2017 2018 2019
GDP growth
Per capita GDP growth
Source: Asian Development Bank (ADB) Outlook 2018.*2018 and 2019 are forecasts.
PHILIPPINES
126 | PUBLIC POLICY INNOVATION FOR HUMAN CAPITAL DEVELOPMENT
of poverty reduction has been slower and less inclusive in comparison with other high-performing east Asian countries.
To sustain these economic gains while addressing the challenges that continue to hound the country, the AmBisyon Natin 2040, a long-term vision for the Philippines, was established. Issued as an Executive Order, this will serve as a basis for development planning of the country across administrations. The AmBisyon, an amalgamation of the Filipino words for ‘ambition’ and ‘vision,’ paints a picture of the life for all Filipinos by 2040. The long-term vision sees Filipinos enjoying a “strongly rooted, comfortable, and secure life” by 2040 [7]. Realizing this vision is the foundation of policies and programs in all dimensions of development, including human capital, in the Philippines.
Labor Market OverviewAccording to the January 2018 Labor Force Survey, 62.2% of the 70.9 million population of 15 years and above are part of the labor force. The employment rate had slightly grown from 94.3% in 2017 to 94.7% in January 2018, translating into 41.8 million employed persons. Three out of every five of those employed were males. Those in the age group 25–34 years composed the largest share of employed persons, followed by those in the 35–44 age group. Further, 55.9% of employed persons worked in the services sector. It is notable that there was a slight uptick of employed persons working in the industry and agriculture sectors in the year.
The unemployment rate is 5.3%. 45.8% of those unemployed are in the 15–24 age group. The largest share of the unemployed, 40.9%, have reached junior high school (JHS). Of this, 12.0% are undergraduates while 28.9% have completed JHS.
Underemployment is still one of the challenges of the labor force. It is notable that underemployment increased from 16.1% to 17.0% in the period. 47.1% of the underemployed work in the service sectors, while 62.7% of the underemployed are males. Skills-and-jobs mismatch is cited as one of the causes of consistently high rates of underemployment.
Philippine Education SystemThe Philippines has a trifocal education system. Three separate agencies manage basic education, higher education, and technical-vocational education. In 2012, the Philippines, through the Department of Education (DepEd), established the ‘K to 12’ basic education system, adding two additional years in high school and making kindergarten mandatory (see Figure 3). The two additional years are collectively called the senior high school (SHS), where JHS graduates can choose their respective specialized tracks. Learners can take specialized subjects and undergo work immersion.
Currently, there are almost 26 million learners enrolled from kindergarten to SHS, in both public and private schools. As of school year (SY) 2016–17, the country had 50,525 elementary schools and 14,375 secondary schools. 23.1% of the elementary schools and 41.3% of the secondary schools were private schools. For SY2016–17, 52.1% of enrollees in elementary education were males. However, there were more female enrollees in JHS and SHS, with females composing 50.5% and 52.5%, respectively. 91.1% of those in elementary education were enrolled in public schools. For JHS and SHS, 82.3% and 54.2% were enrolled in public schools, respectively.
Higher education is under the purview of the Commission on Higher Education (CHED). There are presently 233 state and local universities and colleges (S/LUCs) and 1,710 private higher-education
PHILIPPINES

PUBLIC POLICY INNOVATION FOR HUMAN CAPITAL DEVELOPMENT | 127
institutions in the Philippines. 3.6 million college students were enrolled in SUCs and private institutions as of SY2016–17. For academic year (AY) 2016–17, the total enrollment in public and private higher education institutions (HEIs) was 3,589,484. Of this enrollment, 45.7% were in public HEIs while 54.3% were in private HEIs. More females were enrolled in tertiary education, composing 55.5% of the total enrollment for AY2016–17.
The Technical Education and Skills Development Authority (TESDA) provides national directions for the Philippines’ TVET system. Currently, there are 3,966 TVET providers in the country. For the year 2016, there were a total of 2,269,665 enrollees and 95% of them completed the programs. 53.3% of the total enrollments was composed of females. For the year 2016, 1,521,530 students were assessed by TESDA for national certifications. It posted 91.9% certification rate.
MethodologyThe study seeks to find out the impact of STEM or STEM-related education and TVET on productivity of the Philippines by identifying the implementation of public policy and other public investment innovations. To answer this, the study looked at the administrative data of the three educational institutions (basic, tertiary, and technical-vocational education) in the Philippines in relation to the two major focus areas of the study, i.e., STEM education and TVET. This study chose to focus on the education systems as these are the foundations of human capital. However, agencies with policies and programs complementing the education institutions, were also included. These include labor and employment, and science and technology, among others. The study was conducted using the framework shown in Figure 4.
The first part will look at the data in relation with educational investments to understand the context in terms of prioritizing education. This will discuss the gains and hurdles in implementing new
THE K TO 12 BASIC EDUCATION SYSTEM.
FIGURE 3
Source: Department of Education, Philippines.
Elementary
Kindergarten
Grade 1–6
Junior high school
Grade 7–10
Grade 7–8 (Exploratory TLE) Grade 9–10 (Specialized TLE)
Senior high school
Core Subjects
Tracks
Applied track subjects
Academic
ABM, HUMSS, STEM, general academic, pre-baccalaureate maritime
Technical-vocational-livelihood
Agri-fishery, home economics, ICT, industrial arts, TVL maritime
Sports
Arts and design
PHILIPPINES

128 | PUBLIC POLICY INNOVATION FOR HUMAN CAPITAL DEVELOPMENT
educational reforms and how these translate into desired learning outcomes. As mentioned, data was specifically collected with a focus on STEM education and TVET. In the conduct of the study, a rundown was done of major policies and programs being implemented to improve STEM education and TVET in the country. The study used the data available from the Department of Education (DepEd) for basic education, Commission on Higher Education (CHED) for tertiary education, and the Technical Education and Skills Development Authority (TESDA). The data collected was from the databases of the respective agencies as well as from secondary sources such as previous program evaluations and research studies.
The discussion of the findings will focus on three aspects of education management: access, quality, and governance. These three aspects will provide insights on how these outcomes, based on the rundown of policy and programmatic reforms, impact the human capital development. This will also serve as the basis for the conclusion and the policy implications.
FindingsThe findings are divided into three major parts. Educational investment provides a picture of how the government is providing quality and relevant education across basic, tertiary, and technical-vocational education in the country. We will also discuss, briefly, the key performance indicators per level to understand the gains and challenges of the education system in terms of developing the human capital.
The next section will discuss STEM education. This part will look at the related policies and programs providing STEM education. The discussion will range from basic education to students entering the workforce. The third section is devoted to TVET and will set the overview of the landscape of technical-vocational education and the role of skills in productivity. All the topics cull out the public policy and programmatic innovations of the government to develop its human capital.
Educational InvestmentBasic EducationHuman capital development highlights the role of investing in the early years of education for greater gains as students enter the labor market. In 2011, the Philippines made kindergarten compulsory, recognizing the role of kindergarten education to the “academic and technical
PUBLIC POLICY INNOVATIONS FOR HUMAN CAPITAL DEVELOPMENT FRAMEWORK.
FIGURE 4
Strongly rooted, comfortable, and secure life by 2040
Accelerating human capital devlopment
STEM education TVET
Basic education Tertiary education Tech-Voc
Public policy and program innovations
Access Quality Governance
PHILIPPINES

PUBLIC POLICY INNOVATION FOR HUMAN CAPITAL DEVELOPMENT | 129
development of the Filipino child” [8]. It further added that this is the “period where the young mind’s absorptive capacity for learning is at its sharpest.” In 2013, the ‘K to 12’ basic education system was enacted into law, adding two additional years to the secondary level for a total of six years, four years in JHS, and two years in SHS. The key feature of the additional two years is the specialization of choice for the learners.
The budget for basic education has greatly increased in the past years, partly due to the requirements needed for the implementation of the ‘K to 12’ basic education system. The increase was particularly evident in the second year of implementation of SHS with an increase of 20.23%.
In terms of access, participation in elementary education was fluctuating for five years but gained a significant increase in SY2016–17. This fluctuation of access data was due to the changes in cutoff ages for kindergarten and grade 1. Participation in JHS steadily grew year after year. Continuous growth in cohort survival and completion rates are evident in the last five years. Steady improvement was also observed for learners dropping out of school. However, challenges still remain in the national performance in the National Assessment Test (NAT). While elementary education has consistently tiptoed between 68% and 69%, the secondary education, which got an average of 50.9%, is far from the mastery score which is 75%.
Higher EducationYear 2017 brought in one of the biggest reforms in higher education. The Republic Act 10931, known as the Universal Access to Quality Tertiary Education Act, provided for free tuition in tertiary education in state and local universities and colleges, and state-run technical-vocational institutions. The implementation of this reform enabled an increase in budget for SUCs, LUCs, and CHED. For this year alone, PhP40 billion (USD769.2 million) was allocated for the higher-education budget. Prior to the free higher education bill, the budget for state colleges and universities also increased steadily.
BASIC EDUCATION BUDGET, FY2013–18 (IN USD).
FIGURE 5
5.5 5.8
6.9
8.2
10.2 10.4
0.0
2.0
4.0
6.0
8.0
10.0
12.0
2013
Total budget (in USD) Percent increase
2014 2015 2016 2017 2018
5.17%
15.72% 15.28%20.23%
1.83%
Source: Department of Education, Philippines.
PHILIPPINES

130 | PUBLIC POLICY INNOVATION FOR HUMAN CAPITAL DEVELOPMENT
TABLE 1
KEY PERFORMANCE INDICATORS IN % FOR BASIC EDUCATION (ELEMENTARY), SY2012–17.
2012–13 2013–14 2014–15 2015–16 2016–17
Participation rate (net enrollment rate) 95.13 93.80 92.57 91.05 95.94
Cohort survival rate 74.24 78.97 85.08 87.52 94.18
Completion rate 72.66 77.67 83.74 84.02 92.69
Dropout rate (school leaving rate) 6.24 4.85 3.26 2.69 1.43
Achievement rate (grade 6) 66.79 68.88 69.97 69.10 n/a
Source: Enhance Basic Education Information System, Department of Education.
TABLE 2
KEY PERFORMANCE INDICATORS IN % FOR BASIC EDUCATION (JHS), SY2012–17.
2012–13 2013–14 2014–15 2015–16 2016–17
Participation rate (net enrollment rate) 64.24 64.90 63.23 68.15 74.18
Cohort survival rate 78.05 79.30 80.73 81.56 84.60
Completion rate 74.64 76.25 77.77 74.03 82.39
Dropout rate (school Leaving rate) 8.10 7.58 6.90 6.62 5.61
Achievement rate (grade 6) 48.90 51.41 53.77 49.48 n/a
Source: Enhance Basic Education Information System, Department of Education.
HIGHER EDUCATION BUDGET, FY2013–18 (IN USD).
FIGURE 6
10.44%
4.86%3.51%
25.10%
44.90%
727.5812.3 853.8
884.9
1181.5
2144.2
0
500
1000
1500
2000
2500
2013 2014 2015 2016 2017 2018
Total budget (in USD) Percent increase
Source: General Appropriations Act (2013–18).
PHILIPPINES

PUBLIC POLICY INNOVATION FOR HUMAN CAPITAL DEVELOPMENT | 131
In terms of access, the number of enrollees across disciplines and among private and public schools are increasing since AY`2012–13. There was considerable decline in enrollment in AY2016–17, attributed to the first year of implementation of grade 11, which amounted to limited number of college freshmen available for enrolling.
There is a decline in terms of performance of graduates in licensure examinations across disciplines that require a professional license. Meanwhile, faculty qualifications, both with master’s and doctorate degrees, are increasing, albeit at a slower rate.
TABLE 3
KEY PERFORMANCE INDICATORS IN HIGHER EDUCATION, AY2012–17.2012–13 2013–14 2014–15 2015–16 2016–17
Enrollments 3,317,265 3,563,396 3,811,726 4,104,841 3,589,484
Graduates 564,769 585,288 632,076 645,973 681,468
Performance (% passing in licensure examinations across all disciplines)
42.61 39.21 39.76 39.29 37.55
Faculty qualification
With MA/MS 38.75 40.87 40.81 40.34 40.37
With PhD 11.45 11.72 12.54 12.62 13.32
% of HEIs with accredited programs 22.40 24.47 25.38 26.63 28.01
Source: Commission on Higher Education.
Technical-vocational Education and Training (TVET)The Technical Education and Skills Development Authority (TESDA) has continued to improve its services to provide quality skills development. In terms of budget, TESDA has also received continuous increase in its budget for the implementation of its TVET programs. Of the PhP40 billion allocated under the Universal Access to Quality Tertiary Education Act, PhP7 billion was allocated for free access to TESDA training centers. Key performance indicators for TESDA will be further discussed in the section on TVET.
TVET BUDGET, FY2013–18 (IN USD).
FIGURE 7
Total budget (in USD) Percent increase
0
20
40
60
80
100
120
140
160
2013 2014 2015 2016 2017 2018
67.6
102.0 104.7
125.3 128.6
145.4
10.44%
4.86% 3.51%
25.10%
44.90%
Source: General Appropriations Act (2013–18).
PHILIPPINES

132 | PUBLIC POLICY INNOVATION FOR HUMAN CAPITAL DEVELOPMENT
STEM EducationProviding Opportunities for STEM Education in Basic EducationThe implementation of the K to 12 basic education curriculum provided the conceptual framework of science education in basic education. The science curriculum seeks the development of scientific literacy among learners and the application of scientific knowledge for “social, health, or environmental impacts.” The science curriculum, in line with the changes under the K to 12 reform, also uses spiral progression intended to deliver seamless learning where concepts are made deeper and more complex as one progresses from one grade level to the next. While science concepts are embedded in kindergarten and grades 1 to 2, formal teaching of science as a subject starts in grade 3.
Prior to the K to 12 program, however, the Philippines has implemented various programs and projects that valued the interest of learners in science and technology:
• Special Science Elementary Schools (SSES) program: The SSES program, launched in 2007, is a special curricular offered in selected elementary schools for those who are
CONCEPTUAL FRAMEWORK OF THE K TO 12 SCIENCE CURRICULUM.
FIGURE 8
Multi/interdisciplinary
approach
Science-technology-
society approach/contextual
learning
Problem/issue-based learning
Inquiry-based approach
Constructivism Social cognition learning model
Learning style theory
Gestalt psychology
Scienti�c and technological literacy
Understanding and Applying
Scienti�c Knowledge
Developing and Demonstrating Attitudes and
Values
Demonstrating Scienti�c
Inquiry Skills
CRITICAL/CREATIVE PROBLEM SOLVER RESPINSIBLE STEWARD
OF N
ATURE INNOVATIVE/INVENTIVE THINKER INFORMED DECISIO
N MAK
ER
E
FFEC
TIVE
CO
MM
UNIC
ATOR
Source: K to 12 Science Curriculum Guide, Department of Education.
PHILIPPINES

PUBLIC POLICY INNOVATION FOR HUMAN CAPITAL DEVELOPMENT | 133
inclined in science and technology. However, learners under the SSES are those who are classified as the ‘gifted and talented’ classes under Special Education (SPED) centers. There are screening procedures such as a diagnostic examination and interviews for those who intend to enroll in the program. [9]
The SSES curriculum, compared with regular science classes, offers longer instruction time in science. Instead of the 60-minute classes in science, grades 1 to 3 have 10 more minutes of science instruction (total 70 minutes) while grades 4 to 6 have 20 more minutes (total 80 minutes). Another key feature is the conduct of investigatory projects which is introduced in grade 3. [9]
For SY2016–17, only 0.84% of the total public elementary education enrollments are in the SSES Program. Private schools may adopt the program but may also develop their respective special curricula for science. It is notable that more females have enrolled in the program compared to males since SY2014–15. However, the gap had narrowed from 58% female enrollees in SY2014–15 to 54% in SY2017–18.
• Science, Technology, and Engineering (STE) program in high school: The STE program in secondary schools has been implemented far longer than the SSES. Aside from additional time for science instruction, the STEM program in secondary schools provides additional STEM subjects with focus on scientific research. Unlike the SSES, enrollment in the STEM program has been fluctuating in the past four years. As of SY2016–17, enrollment was 104,928 or 2.8% of the total public JHS enrollments. Data also shows that consistently more females were enrolled in the STE program, with an average of 64% during the four school years under consideration.
• Specialized Science High Schools
◦ Regional Science High Schools: The Regional Science High Schools (RSHSs) are secondary schools which were established to provide focus on STEM education and are located in key locations in every region. The RSHSs are managed by the Department of Education and have budgets similar to a regular school. There is an admission process prior to enrollment in an RSHS.
RSHS enrollment in SY2016–17 was 8,743 or 0.23% of the total public JHS enrollments. Consistent with the data for science programs in both elementary and secondary education, more females were enrolled in RSHSs, with an average of 61% of the total enrollments, during the four years under consideration.
◦ Philippine Science High School System: The Philippine Science High School (PSHS) system, an attached agency of the Department of Science and Technology (DOST), was established in 1963 through Republic Act 3661. This was primarily to offer potential learners with scholarships in secondary education “with special emphasis on subjects pertaining to the sciences with the end in view of pertaining its students for a science career.” Currently, there are 13 PSHS campuses across the country.
The admission process for a slot in a PSHS campus consists of a rigorous and competitive entrance examination, called the National Competitive Examinations
PHILIPPINES

134 | PUBLIC POLICY INNOVATION FOR HUMAN CAPITAL DEVELOPMENT
(NCE). Those who can take the examination should be part of the top 10% of the elementary school.
• STEM strand in SHS: One of the major reforms embedded in the K to 12 basic education system is the introduction of the SHS, i.e., two additional years of high school that offer specialization to learners. The four major tracks are academic, technical-vocational-livelihood (TVL), sports, and arts and design. Under the academic track, one of the specializations offered is STEM.
For SY2017–18, 14.6% of the total SHS enrollment chose STEM as a specialization. Within the academic track, 23.6% of students were in the STEM strand. Notably, this was 10% less than those who took the general academic strand (GAS). Two possible reasons can be drawn for those who selected GAS. One, the nature of GAS is to explore the interests of the learners without a commitment to specialization. Second, GAS requires less requirements from schools for offering SHS. This may lead to students choosing GAS as it could be the only available strand in their schools.
Interestingly, 53.7% of learners enrolled in the STEM strand are males. This is a reverse trend from the enrollment in special science programs in elementary and JHS. Females outnumber boys in accountancy and business management (ABM) with 70.8% of the enrollments as well as in humanities with 61.5% of the enrollments. 70.8% of those taking the STEM strand are enrolled in private schools.
STEM in Higher EducationIn the Philippines, CHED uses the acronym STEAM instead of STEM, which means science, technology, engineering, agri-fisheries, and mathematics (STEAM). For the purposes of this study, we will use STEM to ensure consistency with the basic education programs where agri-fisheries is under the TVL track.
The enrollment in higher education for STEM shows an increase in the last seven years. SY2016–17 is an exception because this was the school year when there were limited entrants to college due to the first year of implementation of grade 11. All disciplines registered low enrollments in this school year.
In the past five years, 60% of learners enrolled in STEM courses were males. This is reverse of the trend observed for the STEM enrollments in basic education but is consistent with the trend observed for the STEM strand in SHS. Meanwhile, in the past five years, an average of 58% of students in STEM were enrolled in private universities and colleges. This is slightly lower but still similar to the distribution of STEM students in SHS.
Providing Scholarship Opportunities in STEM EducationIn support of the implementation of the SHS program, DepEd introduced the SHS Voucher Program (SHS VP) wherein learners who seek to study SHS in private schools are provided with tuition fees paid directly to the school. This will help augment the resources needed in the implementation of SHS. Further, as observed, 70.8% of learners under the STEM strand are enrolled in private schools. The SHS voucher is an option for learners interested in pursuing STEM at private schools that offer the STEM strand.
For tertiary education, one of the major scholarship programs in STEM education in the country is the one being managed by the Department of Science and Technology (DOST). The DOST Scholarship, instituted through Republic Act No. 7687 or the Science and Technology Scholarship
PHILIPPINES
PUBLIC POLICY INNOVATION FOR HUMAN CAPITAL DEVELOPMENT | 135
Act of 1994, provides financial assistance to high-school graduates pursuing courses in STEM education. These include tuition and other school fees, textbooks and essential school supplies, uniforms, transportation expenses, and monthly living allowances.
To determine the career movements of DOST scholars from 2000 to 2012, DOST conducted a study called Tracking Actual Career Experience Report (TRACER) of 3,426 scholar-graduates. According to the study, eight out of 10 scholars were employed, the remaining 20% were categorized as self-employed, unemployed, or those who provided no information. 73.2% of those employed worked in private companies while others were in the government, academia, or nongovernment organizations. Notably, only 15 or 0.4% of the surveyed scholars worked overseas. Overall, 40.5% of those employed worked in the engineering field, followed by 15.5% working in non-STEM fields.
STEM and the Labor MarketIn 2010, DOST, using the data from the Philippine Statistics Authority (PSA), issued a study on the Human Resource in Science and Technology (HRST) in the Philippines. This study provided the landscape of HRST in the Philippines. In this study, it was found that only 2.3% or 721,000 Filipino workers aged 15 years or above were identified as science and technology (S&T) professionals. While this amounted to an increase in absolute number of S&T professionals since 1990 (362,000) and 2000 (593,000), the proportion of the S&T professionals to the labor population is considered small. However, if further disaggregated, it is notable that S&T professionals composed 40.8% of those working in professional occupations.
Interestingly, when disaggregated by gender, 50.72% of S&T professionals were males, with almost equal number of females in S&T occupations. While not comparable with the current data on those enrolled in basic and tertiary education, the gap between males and females after graduation has narrowed. If further disaggregated by age, the median age of those in the S&T profession is 33. This is a far cry from the median age in 1990 which was 45. As the population becomes younger, so does the median age for professionals.
Investment in STEM EducationIn basic education, there is no concrete disaggregation of costs in implementing STEM education, aside from the allocation for STEM programs. From 2008 to 2015, the average budget for combined programs (Regional Science High School, STEM for High School, and Special Science Program for Elementary Schools) offering STEM education was PhP141.3 million (USD2.7 million). For 2015, only 0.04% of the total budget in education was allocated for these programs. However, this did not include the capital outlays for science and technology equipment.
This is true until 2015 when there is separate allocation for these programs. In 2016, to allow every school to offer science programs using the curriculum developed for these special programs at the elementary and secondary levels, the funding for STEM was embedded in the maintenance and other operating expenses (MOOE) of the schools. There is no clear disaggregation of expenses being incurred on STEM education.
Technical and Livelihood Training and Education (TVET)Providing TVET Opportunities in Basic EducationPrior to the implementation of the TVL track through SHS, there are prior TVET programs offered in secondary schools. Under the Strengthened Technical and Vocational Education Program (STVEP), 282 technical-vocational public secondary high schools offered TVL specializations
PHILIPPINES

136 | PUBLIC POLICY INNOVATION FOR HUMAN CAPITAL DEVELOPMENT
anchored on TESDA training regulations. With the implementation of the K to 12 system, the STVEP also aligned its curriculum content with the prescribed standards of K to 12.
Overall, 37.5% of the total SHS enrollments were in the TVL track. More than half or 61.9% took the academic track where STEM is subsumed. TVL enrollment was composed of 54.4% males and 45.6% females. Unlike the STEM strand, 65.6% of TVL enrollees were in public schools.
Aside from the SHS VP for those enrolling in the private schools, DepEd, in partnership with TESDA, has implemented the Joint Delivery Program for TVL (JDP-TVL) where specialized classes under the TVL track will be delivered by the TESDA-accredited training centers. The JDP-TVL is a tuition fee assistance to be given in the form of a voucher, so that learners can cross-enroll to eligible private SHSHs, non-DepEd public SHSs, and private TVIs.
Strengthening TVET through Programs Implemented by TESDAWhile basic and tertiary education have clear definitions of their clienteles, TVET will be offered to a wide range of individuals with varied experiences and competencies. In a study assessing TESDA scholarship programs, Orbeta and Abrigo [10] identified four types of clients of TVET. These included
1. those who are out of school and seek training to be part of the labor market;
2. those who are currently unemployed and aim to improve their chances of finding a job;
3. returning overseas Filipino workers (OFWs) who will stay permanently in the country and will avail the government reintegration program; and
4. currently employed persons who seek to level up their skills or acquire new skills from these training programs.
In serving such clientele, TESDA offers three modes for delivering technical and vocation education programs (see Table 4). Institutions-based programs are directly delivered TVET programs through public and private TESDA-accredited institutions. These include the school-based programs, which cover agriculture, fishery, and trade; and center-based programs which are delivered in TESDA regional and provincial centers nationwide. TESDA-delivered programs are now covered by Republic Act 10931 (Universal Access to Quality Tertiary Education Act), thus making TVET programs free of fees. Next, enterprise-based programs are those being implemented within companies and firms accredited by TESDA. These programs include programs on apprenticeship, learnership, and the dual training system (DTS). There are also community-based training programs, which target the marginalized sector in communities to shore up skills required by the locality. This is usually implemented in cooperation with local government units (LGUs).
From 2014 to 2016, there was an increase in enrollments for the training programs offered by TESDA. Completion rate has also been consistently increasing year after year since 2014 (see Figure 8). The decline in 2016 was due, once again, to the implementation of the SHS program where more previous high-school graduates opted to go back to school via SHS. It is also observed that more learners are enrolled in institution-based training programs.
For 2016, Table 5 shows the top 10 most availed training courses. For these training courses and certifications, Shielded Metal Arc Welding (SMAW) NC II have the highest completion rate.
PHILIPPINES

PUBLIC POLICY INNOVATION FOR HUMAN CAPITAL DEVELOPMENT | 137
TABLE 4
TVET ENROLLMENTS AND GRADUATES BY DELIVERY MODE, 2014–16.
Delivery mode 2014 2015 2016
Enrollees 2,033,417 2,281,389 2,269,665
Institution-based 1,028,005 1,166,613 1,151,644
Enterprise-based 69,138 63,625 72,458
Community-based 936,274 1,051,151 1,045,563
Graduates 1,785,679 2,129,758 2,151,236
Institution-based 833,659 1,036,290 1,057,574
Enterprise-based 57,417 57,002 67,080
Community-based 894,603 1,036,466 1,026,582 Source: Technical Education and Skills Development Authority.
TABLE 5
TOP 10 TRAINING PROGRAMS BY ENROLLMENTS AND GRADUATES, 2016.
Total number of enrollments Total number of graduates
Food and Beverage Services NC II 61,383 52,484
Shielded Metal Arc Welding (SMAW) NC II 55,823 52,116
Cookery NC II 55,300 48,852
Bread and Pastry Production NC II 54,402 45,946
Housekeeping NC II 47,223 43,656
Electrical Installation and Maintenance NC II 38,806 35,392
Computer Systems Servicing NC II 38,542 32,615
Shielded Metal Arc Welding (SMAW) NC I 29,504 26,980
Household Services NC II 22,933 24,191
Bookkeeping NC III 18,156 21,389
Source: Technical Education and Skills Development Authority.
TVET ENROLLMENTS AND GRADUATES, 2014–16.
FIGURE 9
2,033,417
2,281,389 2,269,665
1,785,679
2,129,758 2,151,236
0
500,000
1,000,000
1,500,000
2,000,000
2,500,000
2014 2015 2016
Total number of enrollments Total number of graduates
Source: General Appropriations Act (2013–18).
PHILIPPINES

138 | PUBLIC POLICY INNOVATION FOR HUMAN CAPITAL DEVELOPMENT
TVET Scholarship ProgramsTESDA offers two main scholarship programs. The first one is the Private Education Student Financial Assistant (PESFA), established through Section 8 of Republic Act No. 854 or the Expanded Government Assistance to Students and Teachers in Public Education. Primarily, this program seeks to provide financial assistance to the marginalized but deserving learners in post-secondary degree courses. Recipients of this scholarship are based on their academic standing and status and family income. The scholarship covers free tuition, student allowance, book expenses, and payment for free assessment. In one of the implementation schemes of the PESFA for 2018, priority was given to training programs that would produce graduates for the manufacturing sector (TESDA Circular No. 28, s. 2018).
Meanwhile, the Training for Work Scholarship Program (TWSP) provides immediate interventions and course offerings that are industry priorities and key employment generators. For 2018, priority industries included but were not limited to agri-fishery/agribusiness/agro-industrial, tourism, information technology-business process management (IT-BPM), semiconductor and electronics, and automotive, among others (TESDA Circular, No. 3, s. 2018). The TWSP covers a wider range of beneficiaries as the minimum qualification is just the age (the learner should have attained at least 18 years of age at the time she or he finished the training program).
Complementing the TWSP is the Special Training for Employment Program (STEP), which is a community-based training program that seeks to address the specific skill requirements of a local community. STEP also aims to promote employment through “entrepreneurial self-employment, and service-oriented activities.” Just like the TWSP, it covers a wider set of beneficiaries as the minimum qualification is that the recipient must be at least 15 years of age when the training starts.
Data from a period of three years shows there was an increase in the number of beneficiaries (except in 2016 as explained above) for TWSP. However, the coverage of the program is still low. For TWSP, only 9.3% of the total enrollments were beneficiaries in 2016. While there is no data for PESFA in 2014 and 2015, the 2016 data shows that only 0.58% of the total enrollees were beneficiaries. However, in the assessment of Orbeta and Abrigo [10], of the TESDA scholarships, most PESFA scholars have high employment rates but the overall employment rate is still generally low.
TABLE 6
BENEFICIARIES OF TWSP, 2014–16.
Year Enrollees Graduates Assessed Certified
2014 205,922 197,026 159,132 140,654
2015 280,200 262,164 212,168 183,739
2016 210,060 181,480 152,017 136,667
Total 696,182 640,670 523,317 461,060
Source: Technical Education and Skills Development Authority.
TVET and the Labor MarketIn the 2013 Impact Evaluation Study (IES) of TVET Programs conducted by TESDA, it was found that seven out of 10 (65.7%) 2012 TVET graduates were part of the labor force. Consistent with the national labor force market survey, more males (69.6%) were participating in the labor force than females (65.5%). Disaggregated by age groups, TVET graduates who were in the labor force were
PHILIPPINES

PUBLIC POLICY INNOVATION FOR HUMAN CAPITAL DEVELOPMENT | 139
composed majorly of those in the 15–24 years age group (54.8%). However, those in the 25–34 and 35–44 years of age groups registered high labor force participation rates. [11]
49.2% of TVET graduates who joined the labor force had finished high school. While majority of the TVET graduates in the labor force graduated from institution-based delivery mode (69.1%), labor force participation rate was extremely high for those who graduated from enterprise-based delivery modes (80.3% as compared to 68.8 and 61.7% for institution-based and community-based modes, respectively).
DiscussionThis section is divided into four parts. The first part will discuss the position of the Philippines in context of the fourth industrial revolution to lay down the skills needed for this change, particularly in STEM education and TVET. The next three parts are where public policies, programs, and innovations may have a considerable impact on human capital development. The part on access will discuss how public policies and programs provide opportunities for learners in terms of STEM education and TVET. The part on quality will expound the current curriculum and delivery of STEM education and TVET to develop the skills required for the future. Finally, the part on governance underscores the enabling mechanisms that support the advancement of STEM and TVET skills.
Philippines and Industry 4.0The Philippines was ranked 56th in the World Economic Forum’s (WEF’s) 2018 Global Competitiveness Index that measures national competitiveness defined as the set of institutions, policies, and factors that determine the level of productivity [12]. This was 12 points higher than its rank (68th) in the 2017 index. The report also noted the marked growth (exceeding 6%) of the Philippines contributing to the fast-growing economy of the east Asian and Pacific region.
Also notable is the Philippines’ mention in the WEF’s 2018 Readiness for the Future of Production Report, which provides an assessment of how countries fare today to “shape and benefit from the changing nature of production in the future.” The report categorized the Philippines as a legacy country, with a strong current baseline of production (structure of production) but at risk with regard to the future. This is because its performance across the key factors; such as technology and innovation, and human capital, to make the most out of the Industry 4.0, leaves much to be desired [13].
The two WEF reports complement each other in that both recognize the current growth of the country. However, in terms of readiness for the future, the country needs to boost its drivers of production; particularly in technology and innovation, and human capital; where Philippines ranked 59th and 66th, respectively [13].
Meanwhile, in terms of innovation, the Philippines ranked 73rd in Global Innovation Index, in both 2017 and 2018. Using the performance metrics of the index for 2018, the country ranked 49th in knowledge and technology outputs. It ranked 86th in human capital and research, consistent with the low rank of the country in WEF’s report on readiness.
The challenge for the Philippines is to sustain its economic gains while preparing for the changing workforce demands in the future. A study conducted by the International Labor Organization (ILO) presented how disruptive technologies may reshape the landscape of labor in the ASEAN region,
PHILIPPINES

140 | PUBLIC POLICY INNOVATION FOR HUMAN CAPITAL DEVELOPMENT
with particular focus on five key sectors: automotive and auto parts; electrical and electronics (E&E); textiles, clothing, and footwear (TCF); business process outsourcing (BPO); and retail. For example, robotic automation, 3D printing, and the internet of things (IoT) will shape the E&E sector, which will have an impact on jobs. Over 60% of salaried workers in the Philippines, together with Thailand, Vietnam, and Indonesia, occupy E&E positions that are at risk of automation [14]. In the BPO industry where Philippines is a key player, 89% of salaried workers occupy positions that are at high risk of automation. This is in part due to software automations, which reduce costs by 40–75% for BPO clients [14].
To prepare for these upcoming changes, the development of human capital through education, in particular STEM education and TVET, holds the key.
AccessSTEM EducationThe efforts in making STEM education more accessible to learners have resulted in significantly increasing the enrollments from those who are interested in specializing in STEM. In basic education, for example, by embedding the budget for special programs in the MOOE, more schools may opt to offer special curricular programs for STEM. Meanwhile, the implementations of the SSES and STE programs for JHS provide options for learners across key stages of the education system. While these are tagged as special interest programs, they are accessible only to those who have showed initial aptitude in STEM through diagnostic examinations. This does not necessarily consider the interest of the learners. The fine balance between aptitude and interest limits the objectives and scopes of the STEM programs.
In terms of gender equity, more female learners are enrolled in STEM education in elementary and JHS programs but the trend reverses once they reach SHS and tertiary levels. Oftentimes, learners and parents opt to enroll in STEM programs in basic education because of the perception that these classes have top-tier teachers and facilities, and the decision is not necessarily based on their interests. The balance between interest and aptitude should be maintained in order to retain the learners in the STEM programs. Thus, it is essential for every learner to have a variety of entry points to STEM education to strengthen the STEM workforce in future, as the country prepares for new skills required in Industry 4.0. To be able to reach out to more students proceeding to the STEM track and courses at the tertiary level, a more holistic and dynamic implementation of the STEM curriculum is imperative in the regular curriculum.
As gleaned from data obtained for SHS and tertiary education, more are enrolled in private schools for taking STEM. There is the SHS Voucher Program to assist learners in pursuing courses in private schools. The process is fairly easy in applying for the voucher as graduates of public schools are automatically recipients of the voucher. Of the 70% enrolled in private schools under the STEM strand, it is important to know how many pursued the STEM track and map their locations. This will help understand the demand for STEM classes and plan accordingly for the allocation of resources.
TVETAccess in TVET is continuously being strengthened by the programs implemented by TESDA. Complemented by the K to 12 program, TESDA has garnered gains in implementing its various modalities. For example, the high labor force participation rates of enterprise-based training programs show how to engage industries and train the learners with skills that can immediately be utilized by a company or an organization.
PHILIPPINES

PUBLIC POLICY INNOVATION FOR HUMAN CAPITAL DEVELOPMENT | 141
The scholarship programs provide an opportunity for TESDA to touch base with the industries and communities, especially with the TWSP. This is an opportunity to revisit delivery models and to further involve the industries in training and development of skills. While access to these scholarship programs is still low, TESDA will be covered by free higher education to be implemented this year. Thus, time will tell how this will affect trends in enrollments and graduations.
QualitySTEM Education and TVET CurriculumWhile special programs for STEM education are provided from basic education up to tertiary education, there needs to be a stronger linkage among these programs. There are already systems in place that implement STEM programs. The SSES, for example, offers additional time for science in grades 1 and 2. However, in the regular curriculum, science is embedded in other subjects such as English and the Filipino language. Science is introduced as a standalone subject when the learner reaches grade 3. It is understood that those taking STEM programs have the aptitude for these additional subjects. A review of the objectives of these programs will allow us to clearly lay out the goals of the program and the target beneficiaries to design the curriculum in a way that would address the concerns between the interest and the aptitude.
Same is the case with TVET, as the inevitable automation of specific tasks in manufacturing and production put certain occupations at risk. In the strategic plan of TESDA, they identified priority industries where emerging technologies may affect the skills requirement in future. For example, in the tourism sector, augmented and virtual reality can introduce voice technology. These changes should be considered in the review of curriculum and learning packages in the sector, equipping learners not just for the current skills but the flexibility to adapt to these changes. Alignment with the skills needed as well as preparing learners for lifelong learning to help them cope with the changing landscape of the workforce is crucial in the review of STEM and TVET curricula.
GovernanceResource AllocationBudget has continuously improved in the past years, but the challenge is to sustain it, so that all levels of education in the public-school system are accessible to everyone. To fully measure the extent of allocation for STEM and TVET, most particularly for investments made in STEM, allocation and utilization data should be gathered to understand the expenditures on STEM education in the country. As mentioned, for basic education, budget for science programs is embedded in MOOE but there is no measure of how it is utilized. The School Improvement Plan (SIP) may provide the individual plans of schools, depending on their respective contexts. However, the actual utilization of the budget needs to be studied to provide an overview of how schools do or do not implement different programs related to STEM education and TVET. This is also true for CHED as well as agencies such as the Department of Labor and Employment (DOLE) and Department of Science and Technology (DOST).
Data Collection and Data Management Tracking the career path of students will help us get a view of the whole STEM and TVET landscape, especially now that the education system has expanded. The current Learner Information System (LIS) of DepEd may be able to provide data on where the STEM program enrollees proceed after reaching the SHS. However, this will only be applicable to the basic education system. As the gap between male and female enrollees in STEM courses widens in tertiary education, there is no existing tracking mechanism to pinpoint the career options chosen by learners. This is also true of
PHILIPPINES

142 | PUBLIC POLICY INNOVATION FOR HUMAN CAPITAL DEVELOPMENT
the SHS graduates under the TVL track. Being able to gather relevant data on the tracks of learners after basic education will provide evidence to support public policy innovations.
An improved data collection mechanism should be established across the concerned agencies to cull out data accurately and efficiently for STEM education and TVET. While these agencies are rich in data, the interconnectedness of all variables is diluted due to the different methods of collection and measurement.
Conclusion and Policy ImplicationsThe Philippines has taken several steps towards preparing the future workforce with relevant skills, particularly by strengthening the implementation of STEM education and TVET. The linkages between basic, tertiary, and technical-vocational education are stronger within the TVET framework as programs among the agencies are interconnected and follow the standards set by TESDA. However, for STEM, there are various policies, programs, and projects that need to be consolidated in line with the changes in the curriculum and STEM standards.
What is interesting in the next few years, in particular for CHED and TESDA, is the implementation of the free higher education scheme covering programs and course offerings of both the agencies. The data that will be mined from the enrollment patterns, access and equity concerns, quality, and governance mechanism can change the current situation of STEM and TVET.
To further boost human capital through STEM and TVET, below are some policy implications based on the findings:
• Review of STEM curriculum and development of a national STEM education framework: A unified review of the STEM curriculum to align all initiatives on STEM education may be the key to target both interest and aptitude, right from the basic education to the labor force. The mapping of all policies and programs on STEM education as well as the mandates of each agency in advancing STEM education may be a start to this endeavor. A National STEM Education Framework is also timely as we prepare for the fourth industrial revolution. The framework should leverage our current strengths to develop policies, programs, and projects that will lead to optimum gains in future.
• Strengthening of the industry-academia-government connection: Much has been said and done for strengthening the linkages among industries, the academia, and the government. The Philippines has taken steps towards developing this consortium of supply and demand. Strengthening these efforts and building a clear action plan is significant to address the future challenges.
• Development of an evaluation agenda that includes STEM education and TVET in the Philippines: One of the limitations of the study pertains to impact evaluation results for the programs and policies implemented by the government. While there are studies that are conducted to improve implementation, the utilization of these research results has been difficult to track. Some programs have an unclear theory of change which may result into a difficulty in developing an evaluation design. Thus, it is recommended to pursue the development of an evaluation agenda, either per agency or sector-wide, to prioritize programs that may have been implemented for a long time but may need updating or revising.
PHILIPPINES

PUBLIC POLICY INNOVATION FOR HUMAN CAPITAL DEVELOPMENT | 143
• Clear advocacy plan for STEM, TVET, and other emerging skills in the Philippines: One of the missing points in pushing forward the agenda of STEM and TVET is communicating all the information to the future workforce, i.e., the current learners. The communication and advocacy plan should seek to break current perceptions (e.g., STEM is for the gifted, TVET is a secondary option) associated with STEM, TVET, and other emerging skillsets needed for the future. A clear advocacy plan targeting parents, guidance counselors, schools, industries, and concerned government agencies, should be developed to gain momentum for various career paths of our learners, taking into utmost consideration their interests and current aptitudes.
References[1] Schultz T.W. Investment in Human Capital. The American Economic Review 1961; vol. 51,
no. 1, pp. 1–17. www.jstor.org/stable/1818907.
[2] Deloitte. The Fourth Industrial Revolution is here – are you ready? https://www2.deloitte.com/content/dam/Deloitte/de/Documents/Innovation/Industry-4-0-
Are-you-ready-report.pdf
[3] Constant L., et al. International TVET Policies and Practices. Improving Technical Vocational Education and Training in the Kurdistan Region—Iraq. Santa Monica, CA: RAND Corporation; 2014, pp. 39–56. www.jstor.org/stable/10.7249/j.ctt6wq8s7.12.
[4] Acosta P., Takiko I., Rosechin O., et al. Developing Socioemotional Skills for the Philippines’ Labor Market. Directions in Development. Washington, DC: World Bank; 2017.
[5] Asian Development Bank. Asian Development Outlook 2018: How Technology Affects Jobs. https://www.adb.org/sites/default/files/publication/411666/ado2018.pdf. Accessed on 26 June 2018.
[6] World Bank. Making growth work for the poor: a poverty assessment for the Philippines. Washington, D.C.: World Bank Group; 2018. https://hubs.worldbank.org/docs/imagebank/pages/docprofile.aspx?nodeid=29892868.
[7] National Economic and Development Authority, Republic of the Philippines. Ambisyon Natin 2040: A Long-Term Vision for the Philippines. http://2040.neda.gov.ph/about-ambisyon-natin-2040/. Accessed on 30 May 2018.
[8] Republic Act No. 10157, Republic of the Philippines. An Act Institutionalizing the Kindergarten Education into the Basic Education System and Appropriating Funds Therefor, approved 20 January 2012.
https://www.officialgazette.gov.ph/2012/01/20/republic-act-no-10157/. Accessed on 30 May 2018.
[9] Department of Education, Republic of the Philippines. DepEd Order No. 57, s. 2011: Policy Guidelines in the Implementation of the Special Science Elementary Schools (SESS) Project; 2011. https://www.deped.gov.ph/wp-content/uploads/2011/07/DO_s2011_57-3.pdf. Accessed on 2 June 2018.
PHILIPPINES

144 | PUBLIC POLICY INNOVATION FOR HUMAN CAPITAL DEVELOPMENT
[10] Orbeta Jr. A., Abrigo M.R. An Assessment of TESDA Scholarship Programs. Philippine Institute for Development Studies; 2013. https://pidswebs.pids.gov.ph/CDN/PUBLICATIONS/pidsrp1301.pdf. Accessed on 26 June 2018.
[11] Technical Education and Skills Development Authority, Republic of the Philippines. Impact Evaluation Study of TVET Programs (Highlights); 2013. https://www.tesda.gov.ph/Uploads/File/Researches/2013%20IES%20Highlights.pdf. Accessed on 26 June 2018.
[12] Schwab K., ed. World Economic Forum. The Global Competitiveness Report 2018. http://www3.weforum.org/docs/GCR2018/05FullReport/TheGlobalCompetitivenessReport2018.pdf. Accessed on 15 June 2018.
[13] World Economic Forum. Readiness for the Future of Production Report; 2018. http://www3.weforum.org/docs/FOP_Readiness_Report_2018.pdf. Accessed on 15 June 2018.
[14] Chang J.-H., Rynhart G., Huynh P. ASEAN in Transformation: How Technology is Changing Jobs and Enterprises. International Labor Organization; 2016. https://www.ilo.org/wcmsp5/groups/public/---ed_dialogue/---act_emp/documents/publication/wcms_579553.pdf. Accessed on 15 June 2018.
PHILIPPINES

PUBLIC POLICY INNOVATION FOR HUMAN CAPITAL DEVELOPMENT | 145
SRI LANKA
Prof. Murage Don Athula Lakshman RanasingheProfessor of Economics, Dean of Faculty of Arts
University of Colombo
Vidana Gamage Kalpani Yasodha Department of Economics, University of Colombo
IntroductionToday, education policy makers around the world are challenged with shaping the future of education. With the increasing adoption of modern technologies, the role of human factor in the production process, and therefore, the role of human capital formation is questionable. Which type of knowledge and skills will be useful in ‘future labor markets’ has become a topic of popular debate, especially in the context of rapid growth of research and innovations in ‘artificial intelligence.’
Such innovations create new jobs and destroy some existing jobs. A more challenging issue is that the workers unemployed due to job destruction are not fully matched with the skill requirements of the new jobs. This assigns more responsibilities to educational institutions that are responsible for human capital production for future needs. Training the future generation in future technologies and retraining the current workforce for those technologies will be the role of these institutions. World Economic Forum [1] has reported in this context that, in 2018, on an average, only 29% of the production and related work was done by automated machines. However, most of the leading industries in the world anticipate that the contribution of machines will increase to 42% in 2022. The same report further highlights that by 2022, over 42% of workplace-related skills will be changed. Therefore, reskilling of current and future workers will be a key responsibility of education policy in future.
In this context, Sri Lanka is not an exception. As a lower-middle-income country and with its geographical location in the Indian Ocean and within SAARC regional boundaries, Sri Lanka also faces the challenges. In near future, when considering the key factors determining geographical locations of industries, cheap labor will not be a prominent factor for many components of value chains. It is the availability of workers with relevant skills in the local labor market that the industries will consider.
In addition, some global, regional, and national labor market characteristics will also determine the magnitude and shape of the challenges for education policy makers.
This chapter explores the present human capital policy of Sri Lanka in global and local contexts. The main focus here is education policy and its relevance for labor market requirements.
The education policy of Sri Lanka is criticized for its lack of emphasis on skills formation, underinvestment, and disparity of educational investment. Poor coordination among different

146 | PUBLIC POLICY INNOVATION FOR HUMAN CAPITAL DEVELOPMENT
stakeholders responsible for human capital formation in Sri Lanka is also a popular criticism. This chapter is an attempt to review and assess those critiques.
The chapter is organized in six sections, including the Introduction. Section 2 briefly outlines the background of the study. It mainly focuses on the social and political foundations of the present education policy of the country. Section 3 is about the methodology adopted in this study in exploring the education policy of Sri Lanka. Key findings of the study are presented in Section 4. Sections 5 and 6, which are titled Discussion and Conclusions, respectively, are self-explanatory.
BackgroundThe EconomySri Lanka was in the low-income-economy category for a long time after its political independence in 1948. In 1997, it was upgraded to the lower-middle-income status, as its gross national income (GNI) per capita increased from $996 to $3,895. Currently, Sri Lanka has reached closer to the lower bound of upper-middle-income category ($4,036). According to World Bank statistics, the GNI per capita for year 2017 was $3,850. Thus, Sri Lanka is marginally below the upper bound of the lower-middle-income category.
As per the population projections for year 2017, the population of the country was 2.2 million, of which 10% was above 65 years of age (ageing population) while 15% was in the age group 15–24 (young population).
As far as social statistics of the country is concerned, it is a mixed bag. Due to long-run welfare-oriented policy regimes, Sri Lanka has shown very impressive macro indicators on the social welfare front. For example, life expectancy at birth is 77 years and 93% of adults can read and write their native languages. It has a moderate growth rate of 4.7% per annum. However, a very high public debt rate (80% of GDP), youth unemployment rate of 21%, annual inflation rate of 6%, and poverty rate of 4.1% are some of the flip sides of the Sri Lankan economy.
Education SystemThe foundation for the modern education system of Sri Lanka was laid in 1946 with the implementation of historical Kannangara committee recommendations, also known as Kannangara reforms, named after Dr. CWW Kannangara, the first minister of education in independent Sri Lanka (then Ceylon). Kannangara has been honored as the father of free education in Sri Lanka.
Kannangara policy reforms were influenced more by ‘nationalist political interest and equity principle’ than economics and labor market requirements. From a broader perspective, the entire Kannangara policy package can be divided into four distinct but interrelated elements, namely Vernacular Language Policy, Free Education Policy, Mandatory Education Policy, and linking vocational and formal education streams through practical schools. Sedara [2], however, has listed nine elements.
There is a plethora of writings on Kannangara reforms. These include early reference sources such as Ministry of Education and Cultural Affairs [3]; and recent discussions such as Ranasinghe [4], Sedara [2], and Ranasinghe [5]. The first three proposals were backed mainly by nationalist political interests of that time and the equity principle and implemented immediately. However, the fourth proposal became less popular and was not implemented properly. Despite its political popularity, there were serious criticisms of the Kannangara policy [6].
SRI LANKA

PUBLIC POLICY INNOVATION FOR HUMAN CAPITAL DEVELOPMENT | 147
Since 1946, the same education system has continued with few turning points. For example, in 1971, due to the influence of ILO [7] findings, two prevocational subjects were introduced to school curricular under the five-year economic development plan. However, these subjects were removed from the curricular after 1977.
The second turning point in the education policy of Sri Lanka was visible after implementation of a liberal economic policy in 1977–78. Gradual expansion of private-fee-levying educational institutions (international schools and private universities), conversion of the medium of instruction from vernacular languages to English, and establishment of a solid link between formal education and vocational education were the key changes that took place in Sri Lankan education system after economic liberalization. In addition, an increasing percentage of youth in Sri Lanka is now seeking educational opportunities abroad.
Further, the youth unrest in 1990s [8] led the policy makers to rethink the education policy. Key slogans of the unrest were regarding the poor quality of education and regional disparity in educational opportunities.
The new wave of education-policy reforms, which came into effect after 1997, was an outcome of the socioeconomic and political environment that developed after the economic liberalization [9].
One of the key labor market factors that went along with the education policy of 1946 was the high incident of unemployment, especially among the educated youth. There is plenty of literature on the unemployment problem in Sri Lanka. Based on the subject contents, one can identify two vintages of literature. ILO [8], Kelly and Gunasekera [10], Ranasinghe [11], and Rama [12], for example, represent the first vintage. Except Kelly and Gunasekera, all other studies share the opinion that education policy has something to do with youth unemployment. The first vintage literature identifies the relationship between education and youth unemployment mainly in terms of ‘attitude mismatch.’
Unemployment literature in the second vintage is more specific that the mismatch is based on skills and not only on attitudes. Based on that, the second vintage literature also has very specific recommendations for the education policy. Example studies are Ariyawansa [13], Chandrakumara [14], Herath and Ranasinghe [15], Ranasinghe and Herath [16], and Ranasinghe and Logendra (Draft) [17]. These studies contribute to the policy debate on educational reforms to incorporate employable skills in curriculars. Findings of these studies guided policy makers’ attention to popular terminologies like soft skills, interpersonal skills, and STEM education policies. This has led the researchers and policy makers to look for new parameters in assessing the existing education policy and formulating new policies. The new parameters in education policies are mainly based on employability issue of graduates from schools, technical colleges, and universities. The Graduand Employment Census of the Ministry of Higher Education is an indication of the changes in education policy forums [18]. Currently, statistics pertaining to employability of graduates have become mandatory information in strategic plans of all higher-education institutes.
Methodology The objective of this chapter is to cover general education from grade 1 to General Certificate of Education Advanced Level (GCE A/L) examination at grade 13, university education, and vocational education. As far as the coverage is concerned, this study addresses key issues pertaining to the education system and the labor market in Sri Lanka.
SRI LANKA

148 | PUBLIC POLICY INNOVATION FOR HUMAN CAPITAL DEVELOPMENT
Issues pertaining to the education system of Sri Lanka can be identified at three major levels, namely, general education, university education, and vocational education. National-level information regarding general education is available from ‘school census.’ (School census is an annual enumeration of all the public schools in Sri Lanka. Even though the census schedule was changed time to time, school census has been collecting a wealth of information pertaining to student enrollments and teachers in the schools functioning in Sri Lanka.) In 2017, the school census had covered 10,194 public schools. Simultaneously, a separate census has been carried out to cover private schools, pirivenas (Buddhist religious schools, mainly for monks), international schools, teachers training colleges, and national colleges of education. In 2017, there were 80 private schools, 26 special schools, 753 pirivenas, and 265 international schools.
Information pertaining to university education are available from UGC annual reports and graduate employment survey reports. Currently, the Tertiary and Vocational Education Training (TVET) Commission has disseminated a lot of useful information regarding the TVET stream in Sri Lanka. These sources of data, in general, provide information pertaining to enrollments and their various compositions, and to a certain extent, pertaining to resources availability.
National-level data pertaining to labor market outcomes are available from Quarterly Labor Force Surveys (QLFS) of the Department of Census and Statistics.
This report is an attempt to explore the following five themes using data available from the above sources.
1. Education financing: Over the past decade, two major concerns have developed regarding financing education. They address two principles of education financing, namely, adequacy and equity.
2. Excessive competition for higher educational opportunities: In Sri Lanka, higher-education sector is still dominated by public universities. Due to financial constraints, public universities cannot absorb all the students qualifying GCE AL for higher education. As a result, a large number of GCE AL-qualified youth are without higher-education opportunities.
3. Mainstreaming vocational education: In Sri Lanka, as compared with the demand for university education, very few are willing to join the vocational stream. There have been significant changes in this sector under recent education-policy reforms. In order to overcome this problem, several policy changes have been introduced in the recent past.
4. Labor market outcomes: Employability and returns to educational and vocational/technical training are also widely discussed in the source literature.
5. STEM and future plans of education: In modern education-policy dialogues, the graduate employability issue has become prominent. In this context, STEM policy has become one of the most demanding education-policy frameworks.
The methodology adopted in this study is mainly ‘literature review,’ where published and unpublished academic literature and policy documents play a dominant role. In addition to that, key features of the present education system are elaborated using secondary data available from the
SRI LANKA

PUBLIC POLICY INNOVATION FOR HUMAN CAPITAL DEVELOPMENT | 149
school census, quarterly labor force survey reports, and Central Bank reports. As far as statistical methods are concerned, this chapter does not go beyond statistical tables and various graphs.
FindingsBased on the methodology described above, this section presents the key findings pertaining to the five issues listed in the methodology section.
Present Education SystemThe entire education system of Sri Lanka is classified into four sub sectors: general education (grade 1 to 13); university education (undergraduate and postgraduate); professional education (such as CIMA, charted accountancy, etc.); and vocational and technical education. These sub sectors are fairly independent and administratively different. General education is the responsibility of Ministry of Education, while Ministry of Higher Education is responsible for university education. Professional education is mainly handled by international educational institutes, along with local private education providers. Ministry of Skills Development and Vocational Training is responsible for vocational and technical education. In addition, there are several other ministries and agencies sharing certain responsibilities towards educational development in Sri Lanka.
The diagram in Figure 1 represents the education system of Sri Lanka. It is extracted from Edirisinghe, et al [19] and has been slightly modified. The diagram is divided into three segments, i.e., top-middle, bottom-left, and bottom-right. The top-middle segment represents primary and secondary levels of education. According to the mandatory education policy of Sri Lanka, every Sri Lankan child should have completed education up to the junior secondary level, i.e., up to grade 9 [20]. Gomez [21] discusses alternative interpretation of mandatory education policy of Sri Lanka prior to 1997. After grade 9, the education system is divided into two types as formal education and vocational education. The bottom-left segment represents formal education, which is considered by many as the mainstream or the popular stream.
EDUCATION SYSTEM OF SRI LANKA.
FIGURE 1
Primary and secondary
Formal education
Vocational education
Junior secondary education(grade 6 to 9)
Tertiary education
Primary education (grade 1 to 5)
Senior-secondary education(grade 12 to 13)
Postgraduate education
Senior-secondary education(grade 10 to 11)
Technical education
Universityundergraduate
education
Advanced technical education
Professional and nonprofessional
tertiary education
Vocational training
Source: Extracted from Edirisinghe et al (Undated).
SRI LANKA

150 | PUBLIC POLICY INNOVATION FOR HUMAN CAPITAL DEVELOPMENT
Senior-secondary education is further divided into two segments, i.e., grades 10–11 and grades 12–13. This division represents an important threshold between the education levels GCE O/L and GCE A/L. Until they reach grade 11, students do not face any threshold examinations that qualifies them for the next level. In grade 11, students sit for the first threshold examination (O/L) and they can continue beyond that only if they have obtained a minimum score. According to the statistics available from Department of Examination, Sri Lanka [22], annually over 300,000 students sit for GCE O/L and nearly 70% of them are qualified to continue to GCE A/L.
Up to GCE O/L, all students follow common subjects. Subject specialization in Sri Lankan education system starts at GCE A/L where students can choose arts, commerce, science, or technology as the specialization stream. The choice of specialization depends on the O/L result, interest, and availability of educational facilities. At the end of grade 13, the second threshold examination is held. This is called GCE A/L. This is the terminal examination of general education and is also the university entrance examination. Annually, over 250,000 candidates sit for the GCE A/L and over 60% are qualified for university education. State universities recruit only 20% out of this 60%.
Those who pass GCE A/L have three avenues for higher education. They can join either a state university or private/international universities/affiliated colleges or a professional education stream. Thereafter, both university entrants and professional qualifiers can further continue education for postgraduate diplomas and degrees. The highest educational qualification in the country is PhD for all disciplines except medicine. For medicine, the highest qualification is MD.
The bottom-right segment of the diagram in Figure 1 represents the vocational and technical education system of Sri Lanka. According to the diagram, the formal education system is the feeder for vocational and technical education stream. Those who drop from formal education after compulsory education, can join vocational training institutes at a very low level and can continue for technical and advanced technical education too. The academic education and technical education systems are matched again at the advanced technical level. Figure 1 shows that with an advanced technical qualification, one can go to professional streams.
Education FinancingA comprehensive assessment of education financing up to 2012 is available from Ranasinghe et al [23]. This paper has highlighted several salient features of education financing in Sri Lanka. First, public financing of education in Sri Lanka is heavily inadequate. In terms of public expenditure on education as a percentage of GDP, various sources have shown that in 2010, the public expenses to GDP ratio was less than 2%. Compared with overall average (4%) of the lower-middle-income country group, 2% is grossly inadequate.
However, according to UNDP [24], the situation is improving. Table 1 shows that in 2018, the ratio of public expenses on education to GDP had increased to 3.5%. A comparison of Sri Lanka’s situation with the rest of the world is also given in Table 1.
The chart in Figure 2 was constructed using the data available from Index Mundi [25]. Index Mundi provides data from 1973 to 2015. The data for 2016 was obtained from Global Economy Com [26]. It shows that on average, 2.54% of the GDP has been spent on education throughout the period 1973–2016. As also shown in Figure 2, it remained close to 3% during 1973–96 with a slight drop in 1984 to 2.16%. Then, there was a steady drop during 1996–2012. The lowest percentage spend (1.5%) was reported for year 2012. It again started increasing after that, recording the highest percentage of 3.49% in the year
SRI LANKA

PUBLIC POLICY INNOVATION FOR HUMAN CAPITAL DEVELOPMENT | 151
2016. According to Benson [27], the minimum for this spend to be adequate is 8% of the GDP. These statistics suggest that the education system of Sri Lanka has been heavily underinvested throughout. In 2012, the Federation of University Teachers Associations (FUTA) called for a massive campaign, forcing the government to increase government expenses on education to 6%.
The second criterion of education finance is related to efficiency. The ratio of public expenses on education to GDP is not representing the efficiency of financing. In order to capture the efficiency of education financing, some output-based indices are proposed. Table 1 reports some of such output-based measures. By these measures, Sri Lanka has shown a very satisfactory situation in terms of efficiency in education financing. All the measures, except tertiary education enrollment, are much above the global average. (UNDP has classified Sri Lanka in high HDI category.)
TABLE 1
SELECTED HDI INDICES.
Literacy Secondary education
Enrollment (primary)
Enrollment (secondary)
Enrollment (tertiary)
Dropout (primary)
Public expenses
to GDP
2006–16 2006–17 2012–17 2012–17 2012–17 2007–17 2012–17
Sri Lanka 91.20 82.80 102.00 98.00 19.00 1.60 3.50
Very high HDI 89.30 102.00 106.00 71.00 4.90
High HDI 94.20 72.10 103.00 96.00 50.00
Medium HDI 74.30 51.10 110.00 73.00 24.00 16.30 3.90
Low HDI 52.50 24.80 98.00 43.00 9.00 43.10
Developing countries 81.10 59.80 105.00 75.00 32.00 22.80
Least developed countries
59.60 29.60 103.00 48.00 10.00 45.20 3.10
World 81.20 66.50 105.00 79.00 36.00 21.40 4.80
Source: UNDP, 2018.
TIME TREND OF GOVERNMENT EXPENSES ON EDUCATION TO GDP RATIO: SRI LANKA 1973–2016.
FIGURE 2
4.00
3.50
3.00
2.50
2.00
1.50
1.00
0.50
0.001973 1979 1981 1983 1985 1989 1991 1995 1998 2010 2012 2014 2016
1975 1980 1982 1984 1986
1987
1988 1990 1994 1996 2009 2011 2013 2015
Source: Author’s own construction using data available from Index Mundi.
SRI LANKA

152 | PUBLIC POLICY INNOVATION FOR HUMAN CAPITAL DEVELOPMENT
Personal investments in education are reported in Table 2. Monthly household income and expenditure are converted to USD using the official exchange rates prevailed in respective years. According to Table 2, nearly 5% of mean household expenditure is spent on education. Personal educational expenses, as percentage of non-food expenditure, are around 6%.
The third criterion for education finance is the equity principle. The equity principle expects that the benefits of public expenses on education should be available for every citizen of the country. Available statistics from School Census 2017 [28] show that there is a significant disparity in school facilities across districts. More resources are available in schools in Western Province when compared with other provinces. For example, in 2017, out of 10,194 public schools, 55% had computers for study purposes. In Western Province alone, 69% schools had computer education facilities for students. Out of 1,029 1AB schools (i.e., schools with science AL education facilities), 19% were located in the Western Province. Out of the total 106,756 graduate teachers in the country, 24% were employed in Western Province and out of all trained teachers (129,638) in the country, 16% were employed in Western Province.
TABLE 2
FAMILY INVESTMENTS IN EDUCATION.
2005 2006/07 2009/10 2012/13 2016
Mean household expenditure per month (USD) 349 404 465 322 380
Mean monthly household expenditure on education (USD) 8.63 11.12 15.11 8.92 14.28
Average monthly household expenditure on education as percentage of total expenditure (%)
2.47 2.75 3.25 2.77 3.76
Mean household expenditure on non-food items per month (Rs)
202 243 258 195 241
Average monthly household expenditure on education as percentage of total non-food expenditure (%)
4.27 4.57 5.85 4.58 5.93
Source: Department of Census and Statistics. Household Income and Expenditure Survey 2016. Colombo: Department of Census and Statistics; 2018 [29].
Competition in Higher EducationAccording to Table 1, Sri Lanka’s low enrollment at tertiary level can be identified as an issue in the education policy of Sri Lanka. It is indicative of the limited higher educational opportunities available in the country. According to Annual Performance Report of Ministry of Education for 2017 [30], on an average, 60% of students had qualified for university entrance. However, due to the lack of opportunities at public universities, the actual number of students entering the university education was much lower. Figure 3 presents the percentage of eligible students versus percentage of students entering university education over time. The figure represents the entrance to 15 public universities only. In addition, currently there are a number of private universities and affiliated colleges offering foreign degrees in Sri Lanka.
The solid line in Figure 3 represents percentage of students eligible for university education, while the dotted line represents the percentage of students actually entering university education. It shows that over time, the percentage eligible for university education has increased from 45% in 1990 to 61% in 2017. However, the percentage of students entering university education has remained around 20% throughout the period. This shows the rationing of higher education opportunities in Sri Lanka. Based on this, a new debate has been initiated among the scholars in Sri Lanka on ‘free education versus freedom for education,’ as noted in The Island daily [31].
SRI LANKA

PUBLIC POLICY INNOVATION FOR HUMAN CAPITAL DEVELOPMENT | 153
Mainstreaming Vocational Education The prevailing link between formal and vocational education systems is briefly described in the section above. One of the salient features of the system is that formal and vocational streams have been developed in their own ways, independent of each other and without considering the required linkage between the two. In the model presented in Figure 1, as far as the vocational education is concerned, the formal education system has been serving simply as a feeder to it. The formal system provides inputs to vocational education streams at different points.
The importance of mainstreaming vocational education has been recognized by education policy makers since the inception of the present education policy. For example, one of the key proposals of Kannangara reforms was to establish practical schools (it was expected to establish 243 practical schools to train the enrollees in various vocations). A model practical school was established in Handessa, a remote village located in the Central Province of Sri Lanka. Therefore, the practical school system is also known in Sri Lanka as the Handessa school system.
Kannangara, in his reform policy, recommended to have thresholds at various levels of school education and to drop a certain percentage of students at each threshold and enroll them in practical schools in vocational skills. However, this proposal was not properly implemented.
The second attempt to introduce vocational subjects in formal education was made during 1971–77. During this period, two prevocational subjects were introduced in the school curricular. However, these subjects were removed from the curricular after 1977.
Apart from introducing vocational subjects in school curricular, a separate technical education was developed outside the formal education system. This was formerly started in 1893 with the commencement of Ceylon Technical College in 1893.
Under the present educational reforms, more attention is given to mainstreaming of the vocational and technical education systems.
PERCENTAGE OF ELIGIBLE VS PERCENTAGE OF STUDENTS ENTERING UNIVERSITY EDUCATION, 1990–2017.
FIGURE 3
70.00
60.00
50.00
40.00
30.00
20.00
10.00
0.001990
Eligible Admitted
1995 2000 2005 2010 2011 2012 2013 2014 2015 2016 2017
Source: Author’s own construction using data available from UGC statistics.
SRI LANKA

154 | PUBLIC POLICY INNOVATION FOR HUMAN CAPITAL DEVELOPMENT
There are several important strategies implemented in the technical as well as formal education sectors in the country.
The establishment of institutional framework for vocational and technical education was an important turning point in this regard. Enactment of Tertiary and Vocational Education Act No 20 of 1990 and establishment of Tertiary and Vocational Education Commission (TVEC) in 1991 were two of the initial steps taken in this regard. TEVC implemented the National Vocational Qualification Framework (NVQF) in 2004. This was prepared considering the national and international skills demand. The NVQF has identified seven skill levels. These seven NVQ levels are available on the website of Vocational Training Authority of Sri Lanka [32, 33].
Table 3 summarizes the seven NVQ levels.
TABLE 3
SEVEN NVQ SKILL LEVELS.
Broad categories 7 levels
Certificate
Level 1: Work under direct supervision
Level 2: Work under guidance
Level 3: Work independently and quality is monitored
Level 4: Work independently
Diploma Level 5: Self working and give guidance
Higher National Diploma (HND) Level 6: Managerial
Degree Level 7: Planning and implementation
Source: Vocational Training Authority, Sri Lanka.
The University Grants Commission (UGC), following international practices, has developed a qualification framework for formal education, called Sri Lanka Qualifications Framework (SLQF), which was approved in 2015 [34].
The SLQF has also defined several paths for NVQ recipients to join the university education at different levels.
Introduction of the technology stream to GCE (A/L) in 2013 [35] was another path-breaking initiative in the education policy of Sri Lanka. This was one of the key recommendations (Recommendation 9.1.4) of the National Education Commission 1997 [36]. Recommendations of the Report of the Presidential Commission on Youth 1990 were also instrumental in designing this stream.
According to the Ministry of Education website, the purpose of introducing technology stream is to attract more of arts stream students to technology. In introducing the technology stream, it has been anticipated to increase the percentage of students choosing the science stream from 22% to 40% and commerce stream from 27% to 35%. It is further anticipated to decrease the arts enrollment from 51% to 21%.
Table 4 presents relevant statistics regarding the technology stream at GCE AL, compared with other streams.
SRI LANKA

PUBLIC POLICY INNOVATION FOR HUMAN CAPITAL DEVELOPMENT | 155
TABLE 4
CHANGE OF CHOICE OF SUBJECT STREAM.
2006 2017 Change in percentage points
Science 23 21 2
Arts 49 45 4
Commerce 28 22 6
Technology 12 12
Source: School Census Reports 2006 and 2017.
First column of Table 4 reports the percentage of grade 12 students in different subject streams in the 2006 survey. This depicts the situation before introducing the technology stream. Four years after the technology stream was introduced, the situation in 2017 is depicted in column 2. It shows that, as anticipated, the technology stream has attracted more students from the commerce stream than those from the arts stream.
Simultaneous to the introduction of technology stream at GCE A/L, several state universities have established technology faculties to cater to students qualifying from the technology stream. According to the UGC website, out of 15 state universities, 10 universities have established technology faculties.
TABLE 5
RECRUITMENTS FOR TECHNOLOGY FACULTIES BY UNIVERSITY AND GENDER, 2016/17.
UniversityRecruited for technology Recruited for all faculties
Female Male Total % F Female Male Total % F
Colombo 88 87 175 50 1,772 865 2,637 67
Sri Jayawardhanapura 125 197 322 39 2,341 1,435 3,776 62
Kelaniya 46 115 161 29 2,244 1,188 3,432 65
Jaffna 113 174 287 39 1,849 1,164 3,013 61
Ruhuna 36 100 136 26 1,377 902 2,279 60
Eastern 59 21 80 74 1,268 572 1,840 69
South Eastern 86 75 161 53 1,156 522 1,678 69
Rajarata 109 166 275 40 1,383 726 2,109 66
Wayamba 94 153 247 38 779 568 1,347 58
Uva 84 88 172 49 513 333 846 61
All 840 1,176 2,016 42 14,682 8,275 22,957 64
Source: UGC Statistics 2017.
Table 5 summarizes the situation in 10 state universities where technology faculties have been established. The columns titled “% F” indicates percentage of female enrollees in the technology faculty and also in the entire university. According to the last row of the table, all the 10 universities are far above the gender parity. Over 60% of enrollees are female. This is common for all the universities, with the female enrollments ranging from 58% in Wayamba to 69% in Eastern and South Eastern provinces. However, female enrollments in technology were less than the male enrollments. Overall, 42% of enrollees in technology faculties are female. The highest female enrollments in technology are found at Eastern University and the lowest at Ruhuna University.
SRI LANKA

156 | PUBLIC POLICY INNOVATION FOR HUMAN CAPITAL DEVELOPMENT
Labor Market OutcomesThis section briefly outlines the labor market outcomes of workers by their levels of education and vocational training. The focus is mainly on two labor market outcomes: employability and rate of return on human capital investment. There are many studies about the labor market outcomes in relation to formal education. However, studies specifically focusing on the issue of vocationally trained workers is rare.
In this regard, the general observation that many researchers have come across is that there is a positive relationship between employment and education. For example, Tertiary and Vocational Educational Council [37], using Quarterly Labor Force Survey data has shown the following:
1. The investment in human capital is pro-growth.
2. Probability of being employed is negatively related with education and vocational training.
3. There is a significant mismatch in the labor market for both, people with formal education and vocationally trained people.
This study also provides some empirical evidence on private rates of return for formal education and vocational training. According to the findings of this study, the marginal rate of return for formal education is around 8%, which is significantly lower than the marginal rate of return for vocational training.
There are several comprehensive studies on the employability issue, with special focus on arts graduates in Sri Lanka. All the studies have found that the employability of arts graduates is low compared with other disciplines as well as with the national statistics of overall employability of Sri Lankans (measured in terms of unemployment rate).
STEM and Future Plans of Education In the past few years, a discourse was begun by Sri Lankan policy makers on the importance of expanding the STEM education opportunities. Ministry of Education and Ministry of Science Technology and Research, in collaboration with international agencies and donors, has started several initiatives with regards to STEM [38, 39].
In May 2017, Sri Lanka received a USD100 million fund from The World Bank to improve the country’s higher-education sector [40]. The fund was received mainly to improve the quality of degree programs and to encourage research, development, and innovation in the higher-education sector in Sri Lanka.
Due to growing concerns, Ministry of Science Technology and Research submitted a Cabinet Paper (CP No. 16/1389/716/035) in order to draft a strategic plan to reform the current education system, by including STEM subjects. It received approval of the Cabinet of Ministers on 29 August 2017 [35]. Budget proposal for 2018 identified the importance of STEM education reforms and allocated Rs 85 million (USD0.48 million, at the exchange rate USD1=SLR177) to the Ministry of Education for introducing STEM education [41]. In the budget speech, Minister of Finance highlighted the several initiatives and strategic directions in Sri Lankan education system to introduce the STEM education framework. Introduction of various modern high-tech subjects such as genomics, coding, robotics, and nanoscience in school curricular (STEM + A concept); reforming school curricular;
SRI LANKA
PUBLIC POLICY INNOVATION FOR HUMAN CAPITAL DEVELOPMENT | 157
examination and assessment methods to cope with modern educational requirements; and special projects on promoting mathematics education in schools were the key proposals in the budget speech.
The government has also appointed a special committee to investigate the potentials and opportunities to practically implement STEM education within the existing education system in Sri Lanka. The committee has come up with a specific definition of STEM in the context of Sri Lanka in a report titled, ‘Sri Lanka STEM education strategy.’
The definition is, “STEM Education is a multidisciplinary, integrated approach to build interest and competencies in Science, Technology, Engineering, and Mathematics as a lifelong process that would produce a creative citizen with the capability of contributing innovatively to sustainable national development in a global context.” [35]
According to Polgampala, Shen, and Huang [42], a main goal of STEM education is to facilitate and encourage a transformation from a teacher-centered approach to a student-centered approach, where students become active learners. Under the new reforms, student-centered approach will become a main consideration in developing the curricula. In addition, curricula will be developed to give hands-on experience to students and develop their thinking abilities.
Another important change required for STEM education pertains to practical illustrations and applications [43, 44]. According to the above STEM strategy report, to fulfil this aspect, it is recommended to adopt methods such as inquiry-based learning, investigation, storytelling, plays and games, guided discovery method, and problem/project-based learning.
Moreover, the evaluation method will be changed to remove the unnecessary competition between students. Under the new reforms, students will be assessed partly through examinations and partly through continuous assessments. While 50% of the grades would come from examinations, the remaining 50% would come from continuous assessments.
When it comes to changes in the stages of education, first, primary education will be changed and adjusted to create an innovative and creative child who is STEM-capable. Towards that end, the current curriculum will be changed. The new curriculum will be based mainly on nature, environment, and practicability. Current primary curriculum consists of four subject areas: first language, mathematics, religion, and environment related activities (ERA). According to the proposed changes, students will learn a spiral curriculum through identified themes such as soil, water, food, air, sky, light, sound, interrelations, people, disasters, festivals, and tools and equipment. These themes will be integrated to subjects of science, engineering and technology, mathematics, first language, second language, ethics and etiquette, aesthetics, physical education, and creative work in key stage one.
For secondary education, the tenure will be reduced by a year. The existing system in secondary level consists of two stages, i.e., junior secondary (grade 6–9) and senior secondary (grade 10–11). With the STEM reforms, the secondary-level education will be decreased by a year and the new stages will be lower junior secondary (grades 6–8) and upper junior secondary (grades 9–10).
Subject contents will be designed to improve the skills of students in a way that encourages self-discovery, provides more space to engage in project-based activities, and helps develop more inquisitive minds. For that purpose, new subjects will be introduced, e.g., practical and technical skills (PTS) and digital competency (coding, robotics, mechatronics, electronic, and electrical). Combined subjects
SRI LANKA

158 | PUBLIC POLICY INNOVATION FOR HUMAN CAPITAL DEVELOPMENT
such as social studies, and civics and governance will be added to main subjects to produce responsible students who could recognize the social dynamics. The latter part of the secondary level will mainly be designed to develop a student’s future paths, both academic and vocational. For that, students have to take two additional subjects under two baskets, namely, academic and vocational.
Basket 1 (academic) comprises subjects like earth, atmosphere, and space science; technologies (electrical, electronics, telecommunication, mechanical, and modern technologies); literature; energy and environment; health systems and biomedical science; commerce and management; history and archaeology; geography; and economics.
Basket 2 (vocational) enables offerings such as designing, entrepreneurship, aqua science, agriculture, tourism and hospitality, performing arts, mechanics and motor mechanics, construction technology, and information and communication technology.
These will be useful for students when deciding their future career paths. To identify skills of students, they have to sit for a new competency test during the last term of grade 8.
Finally, at the senior secondary level, a STEM strategy will be initiated. Under the present system, a student who is following a particular stream can only follow the subjects related to that stream. However, this is not helpful in creating a balanced and productive citizen. Under the new reform, students will get a chance to select subjects from different streams, such as mathematics and music, science and drama, etc.
DiscussionThis chapter reviews the evolution and present state of education system in Sri Lanka. It is focused on formal education system (general and university) and technical and vocational education system. Beyond that, there are many professional education programs and training colleges for specific professional disciplines such as teachers training institutes and law collages. For manageability of the issue, these areas are excluded from the discussion in this chapter. The key question targeted by this study was whether the education system of Sri Lanka could be identified as a system adhering to the STEM education framework.
This is a questionable issue. On one hand, it is still too early to evaluate the education system of Sri Lanka within the STEM framework. Sri Lanka is still at a preparation stage for implementing the STEM framework. However, its education system has adopted most of the key attributes of STEM framework in an ad hoc manner.
The science element of STEM is almost incorporated in the education system by making science education compulsory up to GCE O/L. Every student completing GCE O/L is required to take science subjects. For example, according to Department of Examination, 74% of students who sat for O/L have passed in the science, 67% have passed in mathematics, and 51% has passed in English. There is also a slight improvement in the performances of all the said subjects.
This evidence covers two elements of STEM framework, i.e., science and mathematics.
As already described in previous sections, education policy makers have made numerous attempts to mainstream the technical education. Engineering is the only exception in this regard.
SRI LANKA

PUBLIC POLICY INNOVATION FOR HUMAN CAPITAL DEVELOPMENT | 159
It has not yet become a school-level subject in Sri Lanka. However, with the proposed curriculum changes, one can be optimistic about the reformulation of education system in Sri Lanka using the STEM framework.
Conclusion
Using reviews and secondary data, this chapter has examined the salient features of the education system of Sri Lanka. The focus of the analysis is limited to formal and vocational/technical education system of the country. Evolution of the present education system and its major turning points have been highlighted. In 1946, when the foundation of the present education system was laid down, the key policy drivers were based on nationalist political interests and the equity principle of provision of education. Labor market-related concerns of education policy have been discussed ever since its inception.
Most of the policy reforms after 1948 were mainly about introducing work skills through gen-eral education.
At present, the education policy has put more emphasis on introducing work-related skills. The STEM education is still at a discussion level. However, most of the STEM attributes are already in the general education policy.
References
[1] World Economic Forum. Insight Report: The Future of Jobs Report. http://www3.weforum.org/docs/WEF_Future_of_Jobs_2018.pdf. Accessed on 1 February 2019.
[2] Sedara U.M. Educational Reforms Beyond Kannangara for the 21st Century. Dr. C.W.W. Kannangara Memorial Lecture–27, Department of Research & Development, National Institute of Education, Maharagama, Sri Lanka; 2016, www.nie.lk.
[3] Ministry of Education and Cultural Affairs. Education in Ceylon, A Century Volume 1969: from the sixth century BC to the present day; 1969.
[4] Ranasinghe A. A Pearl of Great Price: The Free Education System in Sri Lanka, Unpublished PhD thesis. Netherlands: Tinbergen Institute, University of Amsterdam; 1999.
[5] Ranasinghe A. Kannangara 48th Memorial Speech, Richmond College, Galle (Written in Sinhala), 2017.
[6] Jayasuriya F.R. A Pearl of Great Price: An Evaluation. In: Ceylon Education in Ceylon, A Century Volume-1969: from the sixth century BC to the present day, Ministry of Education and Cultural Affairs, pp. 629–40.
[7] ILO. Matching Employment Opportunities and Expectations. Geneva: International Labour Office; 1971.
[8] Report of the Presidential Commission on Youth. Sessional Paper 1990; no. 1.
SRI LANKA

160 | PUBLIC POLICY INNOVATION FOR HUMAN CAPITAL DEVELOPMENT
[9] Little W.A. Education policy reform in Sri Lanka: the double-edged sword of political will. Journal of Education Policy 2011; vol. 26, no. 4, 499–512.
[10] Kelly T.F., Gunasekera H.M. A Critical Re-assessment of the Mismatch Unemployment Hypothesis for Sri Lanka. Upanathi, the Journal of the Sri Lanka Association of Economists 1990; vol. 5, nos. 1 & 2, pp. 39–55.
[11] Ranasinghe A. Youth Labor Market in Sri Lanka: A Challenge for Policy Makers. In: Hettige S.T., ed. Youth and Social Transformation: Improving Life Chances of Youth in Sri Lanka, A joint publication of Friedrich Ebert Stiftung and Social Policy Analysis and Research Center (SPARC), University of Colombo; 2014, pp. 61–105.
[12] Rama M. The Sri Lankan Unemployment Problem Revisited, World Bank Policy Research Working Paper 2016; no. 2227.
[13] Ariyawansa R.G. Employability of Graduates of Sri Lankan Universities. Sri Lankan Journal of Human Resource Management 2008; vol. 2, no. 1.
[14] Chandrakumara D.P.S. Employment of New Graduates in Sri Lanka: Implications for Policy Development, GSID Discussion Paper, no. 195. Japan: Nagoya University; 2014.
[15] Herath H.M.T.S, Ranasinghe A. Labour Market Prospects for Business Graduates in Sri Lanka. International Journal for Social Science and Humanity 2011; vol. 1, no. 1, pp. 26–30.
[16] Ranasinghe A., Herath H.M.T.S. Employer Satisfaction towards Business Graduates in Sri Lanka, 2011. International Conference on Social Science and Humanity IPEDR, vol. 5, Singapore: IACSIT Press; 2011, pp. VI-185–VI-189. http://www.ipedr.com/vol5/no1/39-H00086.pdf.
[17] Ministry of Education and Cultural Affairs, Ceylon. Education in Ceylon, A Century Volume-1969: from the sixth century BC to the present day; 1969.
[18] Ministry of Higher Education. Graduand Employment Census 2012; HETC. www.mohe.gov.lk/images/pdf/Overall_FINAL_report_2012.pdf. Accessed on 5 February 2019.
[19] Edirisinghe N., Thusharika H.K.N., Damayanthi P.G.R. Department of Technical Education & Training Research report FOR Impact of the Trainer Training Program on Teaching and Learning process in Technical Colleges and Vocational Training Centers in Sri Lanka. http://www.tvec.gov.lk/wp-content/uploads/2017/10/25-10-2017-Report-Repaired-3.pdf. Accessed on 7 February 2019.
[20] Ministry of Education. Education Reforms in 1997. file:///I:/STEM/General%20education/National_Policy_1997-I.pdf. Accessed on 10 February 2019.
[21] Gomez M. Compulsory Education and the Law. In: Sri Lanka Journal of Social Science. National Science Foundation Sri Lanka; 1989.
[22] http://www.statistics.gov.lk/Pocket%20Book/chap13.pdf. Accessed on 07 February 2019.
SRI LANKA
PUBLIC POLICY INNOVATION FOR HUMAN CAPITAL DEVELOPMENT | 161
[23] Ranasinghe A., Arunathilake N., Dunusinghe P. Study on Investment in General Education in Sri Lanka, National Education Commission, Funded by The Transforming School Education Project (TSEP), World Bank. Sri Lanka Research Series (2014), no. 07; 2016.
[24] UNDP. Human Indices and Indicators. Statistical Updates; 2018.
[25] https://www.indexmundi.com/facts/sri-lanka/indicator/SE.XPD.TOTL.GD.ZS. Accessed on 6 February 2019.
[26] https://www.theglobaleconomy.com/Sri-Lanka/Education_spending/. Accessed on 6 February 2019.
[27] Benson C.S. Educational Financing. In: Carnoy M., ed. International Encyclopedia of Economics of Education. Second Edition. Pergamon: Elsevier Science Ltd.; 1995, pp. 408–12.
[28] http://www.statistics.gov.lk/education/School%20Census%20Report_2017.pdf. Accessed on 12 February 2019.
[29] http://www.statistics.gov.lk/HIES/HIES2016/HIES2016_FinalReport.pdf. Accessed on 11 February 2019.
[30] Annual Performance Report 2017. Ministry of Education; 2017. http://www.moe.gov.lk/english/images/publications/2018/apr_e.pdf. Accessed on 07 February 2019.
[31] Abeyratne S. Free Education vs. Freedom of Education: University System in the Global Knowledge Hub of Sri Lanka. In: The Island, 22 January 2012.
[32] www.vtasl.gov.lk. Accessed on 10 February 2019.
[33] Tertiary and Vocational Education Commission, Ministry of Skills Development and Vocational Training, Sri Lanka. National Skills Report 2014. An initiative of Skills Sector Development Program; 2015.
[34] UGC. Sri Lanka Qualification Framework (SLQF). http:// www. ugc.ac.lk/ attachments/ 1156_SLQF.pdf. Accessed on 7 February 2019.
[35] http://www.moe.gov.lk/english/index.php?option=com_content&view=article&id= 1325&Itemid=1093. Accessed on 10 February 2019.
[36] Ministry of Education. National Education Commission Report 1997. file:///C:/Users/Admin/Downloads/National_Policy_1997-I.pdf. Accessed on 10 February 2019.
[37] Tertiary and Vocational Education Commission, Ministry of Skills Development and Vocational Training. National Skills Report 2014.
[38] Ministry of Education. Sri Lanka STEM education Strategy 2018. Ministry of Education, Sri Lanka, website. Accessed on 21 January 2019.
SRI LANKA

162 | PUBLIC POLICY INNOVATION FOR HUMAN CAPITAL DEVELOPMENT
[39] Ministry of Education. The student’s performances in Science, Mathematics, Engineering and Bio-technology streams have gone up according to the results of G.C.E. (A/L) results of 2018. http://www.moe.gov.lk. Accessed on 20 January 2019.
[40] The World Bank. Sri Lanka to Improve its Higher Education with World Bank Support. http://www.worldbank.org/en/news/ press-release/ 2017/05/12/ sri-lanka-improve-higher-education-with-world-bank-support. Accessed on 31 December 2018.
[41] Ministry of Finance, Sri Lanka. Budget Speech 2018. http://www.treasury.gov.lk/budget-speeches. Accessed on 19 January 2019.
[42] Polgampala A.S.V., Shen H., Huang F. Perception on STEM education in secondary schools in Sri Lanka: Trends and Challenges. Imperial Journal of Interdisciplinary Research 2016; 2(12): 301–6.
[43] De Jarnette N. America’s children: Providing early exposure to STEM (science, technology, engineering and math) initiatives. Education 2012; 133(1): 77–84.
[44] Sublette H. An effective model of developing teacher leaders in STEM education. Pepperdine University; 2013.
SRI LANKA
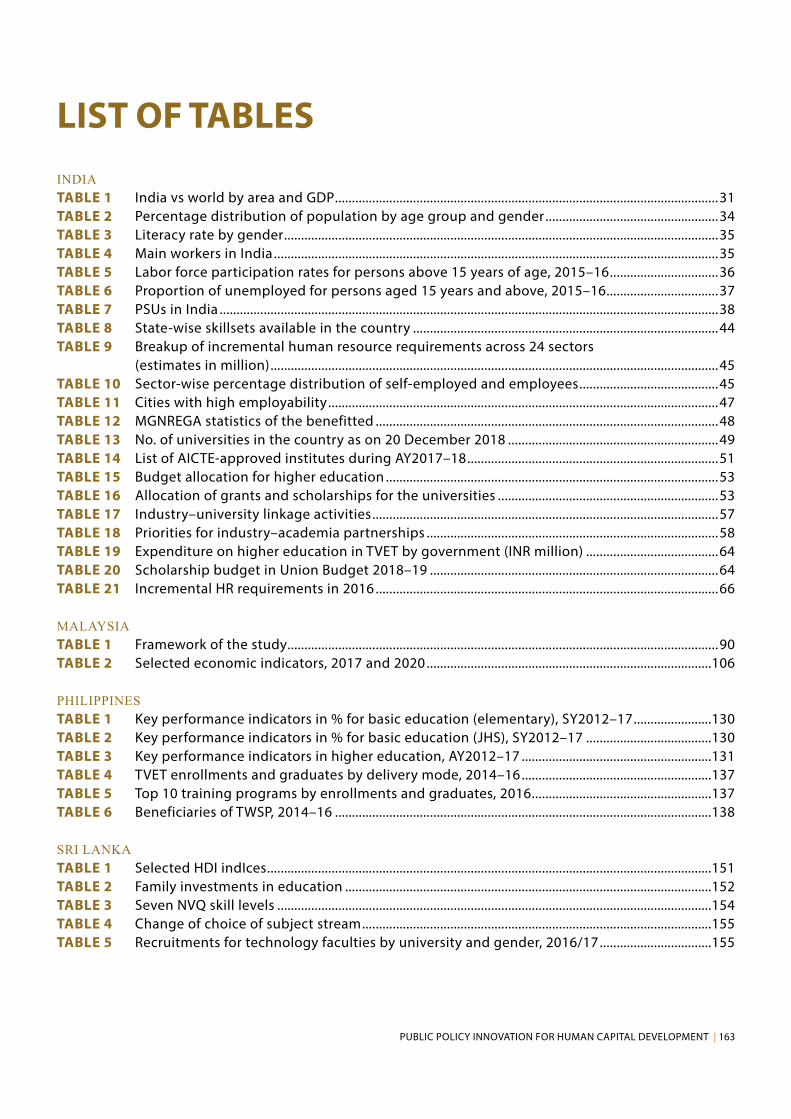
PUBLIC POLICY INNOVATION FOR HUMAN CAPITAL DEVELOPMENT | 163
LIST OF TABLESINDIATABLE 1 India vs world by area and GDP .................................................................................................................31TABLE 2 Percentage distribution of population by age group and gender ...................................................34TABLE 3 Literacy rate by gender ................................................................................................................................35TABLE 4 Main workers in India ...................................................................................................................................35TABLE 5 Labor force participation rates for persons above 15 years of age, 2015–16 ................................36TABLE 6 Proportion of unemployed for persons aged 15 years and above, 2015–16 .................................37TABLE 7 PSUs in India ...................................................................................................................................................38TABLE 8 State-wise skillsets available in the country ..........................................................................................44TABLE 9 Breakup of incremental human resource requirements across 24 sectors (estimates in million) ....................................................................................................................................45TABLE 10 Sector-wise percentage distribution of self-employed and employees .........................................45TABLE 11 Cities with high employability ...................................................................................................................47TABLE 12 MGNREGA statistics of the benefitted .....................................................................................................48TABLE 13 No. of universities in the country as on 20 December 2018 ..............................................................49TABLE 14 List of AICTE-approved institutes during AY2017–18 ..........................................................................51TABLE 15 Budget allocation for higher education ..................................................................................................53TABLE 16 Allocation of grants and scholarships for the universities .................................................................53TABLE 17 Industry–university linkage activities ......................................................................................................57TABLE 18 Priorities for industry–academia partnerships ......................................................................................58TABLE 19 Expenditure on higher education in TVET by government (INR million) .......................................64TABLE 20 Scholarship budget in Union Budget 2018–19 .....................................................................................64TABLE 21 Incremental HR requirements in 2016 .....................................................................................................66
MALAYSIATABLE 1 Framework of the study ...............................................................................................................................90TABLE 2 Selected economic indicators, 2017 and 2020 ....................................................................................106
PHILIPPINESTABLE 1 Key performance indicators in % for basic education (elementary), SY2012–17 .......................130TABLE 2 Key performance indicators in % for basic education (JHS), SY2012–17 .....................................130TABLE 3 Key performance indicators in higher education, AY2012–17 ........................................................131TABLE 4 TVET enrollments and graduates by delivery mode, 2014–16 ........................................................137TABLE 5 Top 10 training programs by enrollments and graduates, 2016 .....................................................137TABLE 6 Beneficiaries of TWSP, 2014–16 ...............................................................................................................138
SRI LANKATABLE 1 Selected HDI indIces ...................................................................................................................................151TABLE 2 Family investments in education ............................................................................................................152TABLE 3 Seven NVQ skill levels ................................................................................................................................154TABLE 4 Change of choice of subject stream .......................................................................................................155TABLE 5 Recruitments for technology faculties by university and gender, 2016/17 .................................155

164 | PUBLIC POLICY INNOVATION FOR HUMAN CAPITAL DEVELOPMENT
LIST OF FIGURESREPUBLIC OF CHINAFIGURE 1 Agencies and institutions involved in human capital development ...............................................11
INDIAFIGURE 1 Elements of human capital .........................................................................................................................31FIGURE 2 Male and female populations in rural and urban areas ......................................................................32FIGURE 3 Literacy rates in rural and urban areas (2001 and 2011) .....................................................................33FIGURE 4 Percentage distribution of population by age group and gender ...................................................34FIGURE 5 Trends in literacy rate by gender ..............................................................................................................35FIGURE 6 Main workers in rural and urban areas (2001 vs 2011) ........................................................................36FIGURE 7 Estimated training need for the period 2017–22 ..................................................................................44FIGURE 8 Employability trend rates ............................................................................................................................46FIGURE 9 Domain-wise employability .......................................................................................................................46FIGURE 10 Gender-wise employability ........................................................................................................................47FIGURE 11 Active workers by state, 2018–19 .............................................................................................................48FIGURE 12 Student enrollments across subsectors ..................................................................................................50FIGURE 13 Technical education in India ......................................................................................................................51FIGURE 14 Enrollments by programs for academic year 2016–17 ........................................................................52FIGURE 15 Gender and category-wise intake/enrollments for five years ...........................................................52FIGURE 16 Seven best practices for industry–university collaboration ..............................................................57FIGURE 17 Growth of ITIs .................................................................................................................................................59FIGURE 18 Gender and category-wise enrollments in diploma, 2012–18 ..........................................................60FIGURE 19 Programs vs institutes in diploma for AY2017–18 ................................................................................61FIGURE 20 Category-wise enroLlments in diploma for AY2017–18 ......................................................................61
INDONESIAFIGURE 1 Education system in Indonesia ..................................................................................................................73FIGURE 2 Indonesia’s PISA score ..................................................................................................................................75FIGURE 3 Indonesia’s expenditure on education, health, and social securities ..............................................76FIGURE 4 Composition of Indonesia’s educational budget ..................................................................................76FIGURE 5 Workforce profile in 2018 ............................................................................................................................78FIGURE 6 Open unemployment rate in 2018 ...........................................................................................................78FIGURE 7 Indonesia’s contribution to research output in Asia and world ........................................................79FIGURE 8 Educational background of sectoral labor .............................................................................................80
MALAYSIAFIGURE 1 Population size and growth rate, 1970–2040 ........................................................................................85FIGURE 2 Age distribution, 1970–2020 ......................................................................................................................85FIGURE 3 GDP growth and unemployment rate, 1990–2017 ...............................................................................86FIGURE 4 Highest educational attainment of population aged 15 years and above, 1950–2010 ..............87FIGURE 5 Total public expenditure on education (% of GDP), 2016 ..................................................................88FIGURE 6 Role of EPU and other agencies in human capital development planning ...................................91FIGURE 7 Human capital development planning machinery ..............................................................................92FIGURE 8 Human capital development planning conceptual framework ........................................................93

PUBLIC POLICY INNOVATION FOR HUMAN CAPITAL DEVELOPMENT | 165
LIST OF FIGURES
FIGURE 9 Contribution to GDP by main economic sectors, 1970 and 2017 .....................................................96FIGURE 10 Employed persons by industry, 2017 .......................................................................................................97FIGURE 11 Science and technology human capital planning, 2020 .....................................................................97FIGURE 12 Malaysia’s development policies and plans ...........................................................................................99FIGURE 13 STEM pipeline ...............................................................................................................................................107FIGURE 14 STEM and non-STEM enrollments at upper-secondary level, 2007–17 .........................................108FIGURE 15 Percentage of science graduates by highest qualification ..............................................................108FIGURE 16 Trend of workforce skills, 2015–20 .........................................................................................................109FIGURE 17 Graduate Tracer Study Report finding, 2015 ........................................................................................112
PHILIPPINESFIGURE 1 Philippine population, 1990–2015 .........................................................................................................124FIGURE 2 GDP growth and per capita growth in Philippines .............................................................................125FIGURE 3 The K to 12 basic education system .......................................................................................................127FIGURE 4 Public policy innovations for human capital development framework ........................................128FIGURE 5 Basic education budget, FY2013–18 (in USD)......................................................................................129FIGURE 6 Higher education budget, FY2013–18 (in USD) ..................................................................................130FIGURE 7 TVET budget, FY2013–18 (in USD) ..........................................................................................................131FIGURE 8 Conceptual framework of the K to 12 science curriculum ...............................................................132FIGURE 9 TVET enrollments and graduates, 2014–16 ..........................................................................................137
SRI LANKAFIGURE 1 Education system of Sri Lanka .................................................................................................................149FIGURE 2 Time trend of government expenses on education to GDP ratio: Sri lanka 1973–2016 ...........151FIGURE 3 Percentage of eligible vs percentage of students entering university education, 1990–2017 ............................................................................................................153

166 | PUBLIC POLICY INNOVATION FOR HUMAN CAPITAL DEVELOPMENT
LIST OF CONTRIBUTORSChief ExpertsProf. Yuto KitamuraAssociate ProfessorDivision of Curriculum DevelopmentGraduate School of EducationUniversity of TokyoJapan
Dr. Will BrehmAssistant ProfessorWaseda Institute for Advanced StudiesJapan
National ExpertsREPUBLIC OF CHINAProf. Chuing Prudence ChouProfessorNational Chengchi University (NCCU)
INDIAProf. Vedulla Venkata Ramana Vice Chairman, Telangana State Council of Higher EducationProfessor and former Dean, School of Management StudiesUniversity of Hyderabad
INDONESIADr. Irwan Endarayanto AluiciusHead, Division of Academic Policy StudiesGadjah Mada University
MALAYSIADr. Habibah Abdul RahimDirector, Educational Planning and Research DivisionMinistry of Education
PHILIPPINESEmiljohn Columna SentillasEducation Program Specialist IIPolicy Research and Development Division, Planning Service Department of Education
SRI LANKAProf. Murage Don Athula Lakshman RanasingheProfessor of Economics, Dean of Faculty of ArtsUniversity of Colombo

Bangladesh
Cambodia
Republic of China
Fiji
Hong Kong
India
Indonesia
Islamic Republic of Iran
Japan
Republic of Korea
Lao PDR
Malaysia
Mongolia
Nepal
Pakistan
Philippines
Singapore
Sri Lanka
Thailand
Turkey
Vietnam