apparent minimum free energy requirements for methanogenic …€¦ · the final sulfate...
TRANSCRIPT

Apparent minimum free energy requirements for methanogenic
archaea and sulfate-reducing bacteria in an anoxic marine sediment
Tori M. Hoehler a', Marc J. Alperin b, Daniel B. Albert b, Christopher S. Martens b
NASA Ames Research Center, MS 239-4. Moffett Field, CA 94035-I000. USA
b Department of Marine Sciences, CB# 3300. University of North Carolina, Chapel Hill, NC 27599. USA
Abstract
Among the most fundamental constraints governing the distribution of
microorganisms in the environment is the availability of chemical energy at biologically
useful levels. To assess the minimum free energy yield that can support microbial
metabolism in situ, we examined the thermodynarriics of H2-consuming processes in
anoxic sediments from Cape Lookout Bight, NC, USA. Depth distributions of H2 partial
pressure, along with a suite of relevant concentration data, were determined in sediment
cores collected in November (at 14.5°C) and August (at 27°C) and used to calculate free
energy yields for methanogenesis and sulfate reduction. At both times of year, and for
both processes, free energy yields gradually decreased (became less negative) with depth
before reaching an apparent asymptote. Sulfate reducing bacteria exhibited an asymptote
of-19. I _+ 1.7 kJ.(mol SO42") l, while methanogenic archaea were apparently supported by
energy yields as small as -10)5 _ 0.7 kJ.(mol CH4) l.
Key Words: Anoxic sediments, Hydrogen, Critical Free Energy
https://ntrs.nasa.gov/search.jsp?R=20010105202 2020-07-05T06:08:36+00:00Z


I. Introduction
Currentlyunderstoodmechanismsof energyconservationrequirethat,in orderto
bebiologically useful,energymustbeavailableat levelsnot lessthanone-thirdto one-
fifth of theenergyneededto phosphorylateADP to AT.P[1]. Theexistenceof this
"'biologicalenergyquantum"meansthat asignificantamountof thechemicalenergy
availableon Earthcannotbeexploitedby life. Likewise,theabsolutemagnitudeof the
biological energyquantummustbea critical parameterin determiningthe distribution of
microbial life in theenvironment.This isparticularlyrelevantfor oligotrophicsettings,
suchasdeepseasedimentsandcrustalrocks,whicharenow thoughtto potentially harbor
avast"deepbiosphere"[2-5].
Extensiveresearchbasedonorganismsin cultureprovidesa detailed"
understandingof energyconservationin chemotrophicanaerobes[6-10]. Thesestudies,
combinedwith theoreticalconsiderations,suggesta quantumof about-20 kJ.moll asthe
minimum energythat canbeexploitedby living cells[1]. A clearnextstepin
understandingmicrobial energyconservationis to examinetheapparentenergy
requirementsof microorganismsin naturalecosystems,wheretheyareoften obligatedto
function at theenergeticfringe.
This studysoughtto investigatein situ bioenergetic requirements by monitoring
the free energy yields obtained by H2-consuming microorganisms in anoxic marine
sediments from Cape Lookout Bight (CLB), NC, USA. In such sediments, H2 is
produced via bacterial fermentation of complex organic matter [!1, 12], and is
subsequently consumed by sult'ate-reducing bacteria (SRB) or. ,,_hcn sulfate is absent.
methane-producing archaea (MPA) [13-16]:
SO4" ;'- 4H2 ,'I_N S 2.' _ + 4H20 (1)
CO2 + 4H2 _n'_ _ CH4 + 2H20 t2)
The coupling between production and consumption of H2 in CLB is very close, resulting
in very low partial pressures and very short residence times for H2 [ 17]. as is typical for
sedimentary environments [ 18].
Previous studies have shown that in such closely coupled systems, H:
concentrations are controlled by the H2-consuming organisms in a pattern that reflects the
availability of free energy. Specifically, H2-consuming organisms catalyzing more
exergonic processes can generally maintain H2 partial pressures at lower levels. This
effect has been demonstrated by varying the terminal electron acceptor (e.g., SO42 -vs-
CO.,) [ 17, 19, 20] or the temperature [21-24], both'of which affect the free energy yield of
H2 consumption. Subsequently, we demonstrated that the relationship between H2 partial
pressures and intracellular bioenergetics in CLB sediments is quantitative temperature
and sulfate concentration [17]. Based on this finding, we utilized measurements of H:
partial pressures in CLB sediment cores to examine the bioenergetics of methanogenesis
and sulfate reduction in a natural ecosystem.
2. Methods
2. 1 Study Site and Sampling'Methodology
Sediments tbr laboratory, studies and depth profiling were obtained from Cape
Lookout Bight, a 10-m deep back barrier island lagoon located in coastal North Carolina.

USA. Due to high rates ol"sedimentation [251 and organic carbon loading [201, the
sediments are tree of bioturbation and completely anoxic below 2 mm [27 I. Sulthte
reduction is the dominant terminal electron-accepting process in the upper portion of the
sediment column: below the depth of sulfate depletion, which varies seasonally between 8
and 25 cm, methanogenesis is the dominant process [28"1..
2.2. Experimental and Analytical Methodology
Free energy calculations are based on concentration data originally reported in
[17], which includes a detailed description of methodology for the laboratory and field
investigations discussed here. A brief synopsis of the experimental design follows:
Temperature Experiments: Actively methane-producing sediments from Cape
Lookout Bight were slurried with a sterile anoxic solution of either NaCI (salinity = 34%o)
or NaCI + Na2SO4 to a final porosity of approx. 0.9 .(a 25% dilution of the whole
sediment). The final sulfate concentration in the first treatment was <101aM and
methanogenesis remained active; in the second, the sulfate concentration was 35 mM and
sulfate reduction supplanted methanogenesis as the dominant terminal metabolic process.
The methanogenic slurry was divided among 20 serum vials and the sulfate-reducing
slurry among 16 vials, and these replicates were divided evenly among four constant
temperature baths (9.0, 15.5, 23.4, and 29.8°C) for a 2-week incubation in the dark. At
the end of the period, previously described methods were employed for analysis of H2,
CH4, ECO2, EH2S, and S04 in each sample vial [17].
Sulfate Concentration Experiment: Actively methanogenic sediments from
Cape Lookout Bight were slurried with a sterile anoxic solution containing NaCI +
Na,SO_to a final porosityof approx.05)/a 25%dilution ot"thewholesediment).A final
sulthteconcentrationol-'6mM wasmeasuredandsulfatereductionbecamethedominant
modeof terminalmetabolism.Theslurry wasdispensedinto 15serumvials,which were
subsequentlyamendedwith concentratedanoxicsolutionsof NaCland/orNa2SO._to
yield final sult'ateconcentrationsof 6, 11,25,52,and 104mM (n=3 replicateseach).The
vials wereincubatedin thedarkat22°C for oneweek,afterwhicheachsamplevial was
analyzedfor H2,EH2S,andSOj> usingpreviouslydescribedmethods[I 7]. Two of the
104mM sampleswerecompromisedduring theincubationperiod,sothat theH2partial
pressurereportedat thisconcentrationreflectsasinglesample.
Depth Profiles: Cores of sediment were taken from Cape Lookout Bight at each
of two sampling times (Augusi,. 40-cm long core, sediment temp. = 27°C; and November,
70-cm long core, sediment temp. = 14.5°C). Sediments were subsampled at desired depth
intervals, transferred anaerobically to serum vials _vithout slurrying, and incubated in the
dark at in situ temperature for 5 days. During the incubation, the sediment was disturbed
as little as possible in order to avoid disrupting in situ microbial assemblages. At the end
of the incubation, each sample was analyzed for H2, CH4, and SO4 _ using previously
described methods [ 17].
Concentrations of ECO2 and EH2S were not measured but were instead taken as
the average of previously measured depth profiles at the same site, time of year, and
temperature. For Y-H2S, we averaged 4 July/August profiles taken over 3 years and 2
November profiles taken over 2 years (from [29]): for ECO,_, we used 3 July/August
profiles taken over 3 years and 2 November profiles taken over 2 years (from [30] and
[31]). Year-to-year variation (__.l t_) in ECO2 was always less than _+ 15% at all depths in

thesedimentcolumn. ForEHzS,variationwaslessthan+ 20% at all depths, except tbr
the upper 3 cm of the sediment column in November, where it ,,,,'as ___74%.
2.3. Thermodynamic Calculations
Free energy values for H2-based sulfate reductioh (AGsR) or methanogenesis
(AGMp) under in situ conditions were calculated from
. i {SO_. _pH: )4 (3)
or
' (P.,(4)
where { } denotes activity; P denotes partial pressure; R is the universal gas constant; T is
absolute temperature; and AG°_T).SR and AG°/T).Mp are the standard free energies of
reaction for sulfate reduction and methane production, corrected to ambient temperature
using the Gibbs function, AG = AH - TAS [32]. Standard tree energies of formation of
products and reactants (used to calculate AG°sR and AG°MP) were taken from [32] and
[33]. Partial pressures differ from fugacities by less than 0.1% under the P-T conditions
of our experimental systems [32], and fugacity coefficients are thus neglected in the
present treatment.
Speciation in the ECO-,, YHzS, and EHzSO4 systems was calculated based on a
measured average pH of 7.2 (which remained approximately constant with depth and
temperature in the sediments) and using acidity and Henry's law constants from [32] and

]34]. Errorsreportedfor thefreeenergyvaluesarecalculatedthrougha standarderror
propagationroutine,utilizing thestandarddeviationamongreplicates(for all measured
quantities)andanassumedstandarddeviationot'_ 20%tbr ECO:and_vH:Sin thedo_,vn-
coreprofiles (seesection2.2). Forthe uppermostsampleof theNovemberprofile, a
standarddeviationof+ 75%for YH2S was assumed, per the discussion in section 2.2.
3. Results and Discussion
3.1. Temperature and Sulfate Concentration Experiments
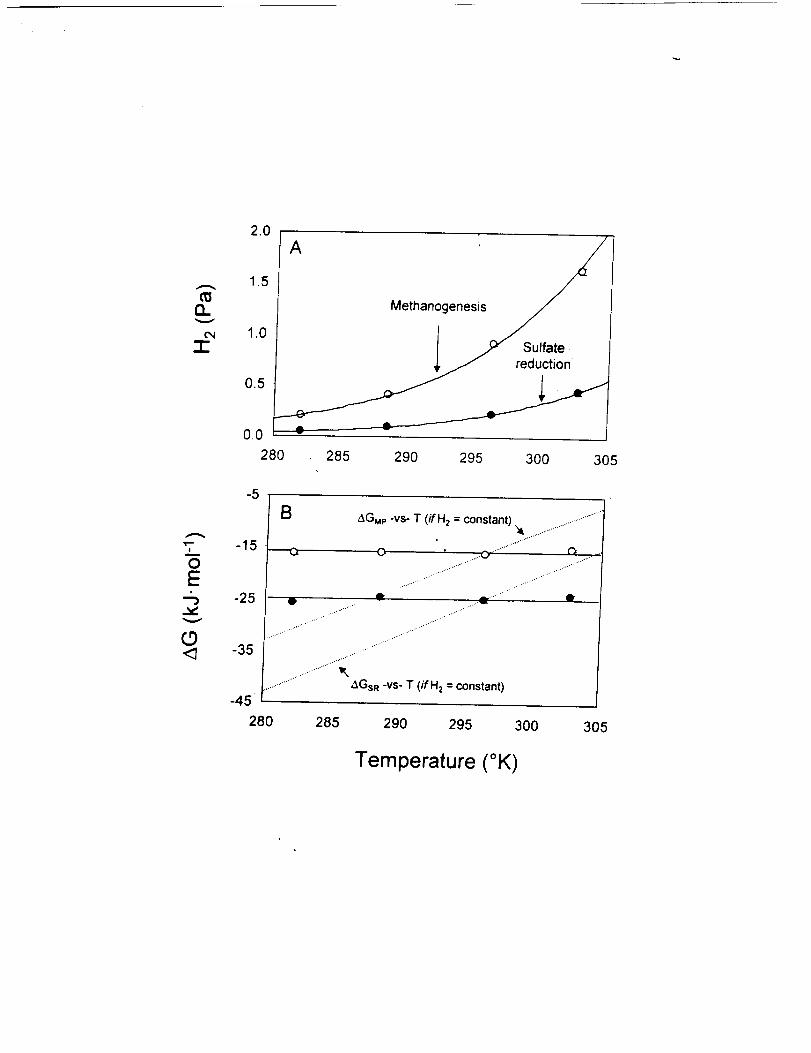
Two previously published experiments demonstrate that H2 partial pressures in
CLB sediments are controlled quantitatively by the bioenergetics of H2-consuming
microorganisms [17]. In the first, H2 partial pressures were monitored in sulfate-reducing
and methanogenic sediments that were subjected to variations in temperatureover the
range of 10 to 30°C. If the concentrations of all products and reactants remained
constant, this temperature increase would change the in situ free energy yield for both
processes (AGsR and AGMp in eq. 3 and 4) by approximately +17 kJ-mol t, meaning much
less free energy is available at higher temperature. However, in both treatments, the H2
partial pressure increased with increasing temperature (Figure l a), similar to previous
observations in methanogenic [21-24] and sulfate-reducing [23] systems. Relative to the
initial sediment temperature of 22°C, the H2 partial pressure either increased or decreased
in a way that was exactly sufficient to offset the temperature-induced change in AG, and
thereby maintain a constant (___3%) free energy yield for the Hz-consuming organisms:
AGMp = -15.8 + 0.5 kJ-mol "z in methane-producing sediments and AGs_ = -24.7 ___0.6
kJ.mol -I under sulfate-reducing conditions (Figure l b).

In asecondexperiment.H: partialpressuresin anactivelysulfate-reducing
sediment_,veretbundto decreasein responseto increasingsulthteconcentrations(Figure
2a). According to equation3. anincreasein sulfateconcentrationsmakesAGsR more
negative (more available free energy), which could allow for more efficient utilization of
H2. Solving equation 3 for PH2:
[
P,. = .exp RT (5)
shows that, in order for sulfate reducers to maintain a constant _GsR (as in the
temperature experiment), the H2 partial pressure must change according to the
relationship PH2 _c {SO42} °25, given constant T and approximately constant {$2}, as
maintained in this experiment. "The experimental results agreed closely, exhibiting the
relationship PH2 _: {SO42-} TM 0ol, with r2= 0.996 (Figure 2a). Thus, as in the
temperature experiment, the variation in H2 was exfictly sufficient to offset the sulfate-
induced change in AGsR and maintain a constant energy yield (2_GsR = -22.8 _ 0.8 kJ-mol
i) for sulfate-reducing bacteria (Figure 2b).
In both experiments, the variation in H2 returns the system to a specific value of
zXGsR or AGMp, regardless of whether the environmental change (i.e., in temperature or
sulfate) is positive or negative with respect to the free energy yield. This can be
explained if:
1) H2-consuming organisms draw down the H2 partial pressure to as low a level as is
physiologically possible.

2) Fhephysiologiclimitation in this s_,stem is a bioenergctic one, so that the tl2 partial
pressure is consistently held at a level corresponding to biologically-critical free
energy yield.
The second point implies that measurements of H-, partial pressure in CLB sediment cores
can be used to quantitatively assess the energy requirements of methanogens and sulfate
reducers in situ. In order to do so, however, it is critical to consider how the spatial
distribution of H:-consuming organisms affects the partial pressure of H2 in the bulk pore
fluid - for it is this pool of H2 that is sampled by the H2 measurement technique, and
which is ultimately used to calculate in situ energy yields.
If H2-consuming organisms are distributed randomly in relation to discrete sources
of H2, the supply of H2 must be.drawn from the bulk pore fluid (Figure 3a). In order to
maintain mass transport into the cell, a gradient in H2 between the cell surface and the
bulk pore fluid is required [35]. Because the H2 pa.rtial pressure measured in the bulk
pool would thus always be higher than that at the cell surface, the actual energy yield
obtained by H-,-consuming organisms would always be overestimated by pore fluid
measurements. Such a scenario cannot simultaneously account for the quantitative link
between intracellular thermodynamics and extracellular (bulk fluid) H2 partial pressures
that is evident in both the temperature and sulfate experiments, unless the magnitude of
the H2 concentration gradient is very small in comparison to the measured partial
pressures.
Alternatively, H2-c6nsuming organisms could be localized around discrete sources
of H2 in order to intercept the outgoing flux (Figure 3b). Conrad [36] has previously
shown that such assemblages may account tbr a high percentage of H2 cycling in natural

ecosystems.For anygiven[-[_,source,the impetusforcontinuedcolonizationby l-[:-
consumerswouldpersistuntil theI--12efflux wasreducedto alevel thatwasno longer
biologically accessible. Assuming a bioenergetic limitation on H= consumption, the H2
partial pressure outside such clusters (in the bulk pore fluid, where measurements are
made) would then be fixed at levels corresponding preci.sely to the minimum energy
requirements of the H,, consumers. In this mechanism, changes in temperature or sulfate
concentration would automatically adjust pore water 1-[2 to a partial pressure exactly
equivalent to the critical AGsR or AGMP, as observed for the experimental treatments.
It is important to note that in such a scenario, the measured H2 partial pressure
would not necessarily reflect the energetic environment experienced by all, or even most,
HE-COnsuming organisms in the system. Instead, it must reflect the minimum energetic
yields that can still drive metabolism of H2 in the outermost "shell" of Hz-consuming
clusters - potentially only a small fraction of the H a consuming population, but
presumably having the most efficient organisms. With this in mind, we sought to use
down-core H2 measurements as a means of probing the in situ energy requirements of
methanogens and sulfate reducers in an intact sediment microbial ecosystem.
3.2. Depth Profiles of AGsR and AGMe in Cape Lookout Bight Sediments
Depth distributions of H2 partial pressure were measured in CLB sediments and
used to determine down-core variations in AGsR and AG.,,tr, for natural populations of
sulfate-reducing and methmaogenic bacteria. Here, we present data from two months:
August, when warmer temperatures (27.0°C) result in higher sulfate reduction rates and
sulfate depletion at shallow depths (-10 cm ; Fig. 4a); and November, when relatively

cool temperatures (14.5°C1 allow tbr somewhat deeper sultate penetration (-15 cm; Fig.
4c). ,L\t both times or'year, energy yields t'or sulfate-reducing bacteria increase t become
less thvorable) with depth before reaching an apparent asymptote. In August, an average
value of-20.3 _+0.6 kJ.mol l is reached by4 cm depth and maintained until the depletion
or" suit'ate at approximately 10 cm (Fig. 4b); under cooler conditions, an average ot'-19 _+
1.8 kJ'mol "l is maintained between 7 cm and the sulfate'.depletion depth of 16 cm (Fig.
4d). For methanogens, AGMp values were generally greater than zero when the sediments
contained sulfate, consistent with H2-based competitive exclusion of methanogenesis by
sulfate reducers[ 15, 16]. Below the sulfate depletion depth (where methanogenesis
becomes active [23]) AOMp values increase with depth before reaching average values of
-10.9 + 0.3 (August: Fig. 4b) and -10.4 _+0.8 kJ.mol j (November; Fig. 4d) below about
25 cm. Interestingly, this 25 cr'h "inflection point" marks the horizon above which the
methanogenic community is seasonally disrupted by infiltration of sulfate (above 25 cm),
but below which the community can adapt to permanently methanogenic conditions.
Thus, sulfate reducers in CLB sediments function with energy yields close to the
biologically useful minimum of-20 kJ.mol "l that is suggested by culture-based studies
[ ! ]. Methanogens in these sediments can apparently support metabolism of H2 with
energy yields as low as -10 kJ'mol "j. This value is significantly lower than has been
calculated for several other environments [37], but is comparable, in general, to the
findings of Westermann [24]. In support of the low energy yields observed for H2-based
methanogenesis, we calculate from pore water acetate concentrations [38] that
acetoclastic methanogenesis in CLB sediments proceeds at very similar levels, ranging
from AGMP(ac¢tate)= -12.8 kJmol "l (in the summer) to -10.5 kJ.mol _ (in the winter).

3 3 The ('ritical Free Ener©'
The very low energy yields observed tbr methanogens in CLB sediments, relative
to organisms in culture, are likely the result of adaptation by an intact microbial
community to long-term substrate limitation. In CLB sediments, the quantity of reactive
organic matter (and thus, the rate of fermentative H2 production) decreases in roughly
exponential fashion with depth, corresponding to age of the sediment [26]. Therefore,
after colonizing the sediment to an extent that is commensurate with the initial amount of
organic matter, bacteria are faced with an ever-decreasing supply of substrate. The
community as a whole must adapt for years afterwards to starvation-level conditions.
This is reflected in each of the down-core free energy profiles (Fig. 4B and 4D) by
initially more negative values of AGsR and AGMp that only approach asypmtofic levels at
depths representing many months of sediment accumulation.
Optimization of energy conservation efficiency, to allow organisms to exploit low
energy substrates, would depend on variability in the parameters which ultimately
determine the biological energy quantum, AGm,, [39]:
AGADp_An,AG mm - (6)
n.f
where n, AGADP,ATP, and fare defined as follows:
I. n is the stoichiometry of ions translocated per ATP formed in chemiosmotic energy
conservation. Most com_onlv, n = 3 ions per ATP, however recent work suggests
that some methanogens may utilize systems with n = 4 or 5 (see review in [I0]).

2. .:XG\Dr.+xH,is theenergyrequiredtbr phosphorylationot':\DP in vt_'o Ihis quantity
depends directly on the intracellular ratio of A-I'P to ADP. which is about I0:[ in
actively growing cells [6]• However, if the tree energy available fi'om the energy-
harvesting metabolism (e.g., sulfate reduction or methanogenesis) is insufficient to
catalyze ADP phosphorylation, ADP will quickly ac:eumulate as cellular metabolism
continues to hydrolyze ATP. This would lower the ATP:ADP ratio until ADP
phosphorylation again becomes favorable. Every factor of 10 decrease in the
ATP:ADP ratio decreases the overall energy requirement by about 5 kJ.mol "1,
potentially allowing organisms to capitalize on lower in situ free energy changes
simply by maintaining a lower "energy charge". This effect must of course be limited
to an energy charge not lower than the minimum needed to drive ATP-coupled
biochemistry.
3. f the thermodynamic efficiency factor, is the fr_tction of total available free energy'
that is actually conserved. Energy-harvesting metabolic processes frequently occur
via multiple reaction steps, not all of which are coupled to energy-conserving
mechanisms (e.g., ion gradient formation). Any of these non-coupled reactions which
operate at a disequilibrium (as is required for a reaction to proceed in a net forward
direction) have an associated free energy change, AG < 0, which is lost from the
system as heat. In actively growing anaerobic cultures, up to 60% of the available
free energy may be lost in this way [6]. However, when the availability of
"'conservable" free energy becomes limiting, ATP synthesis will become the rate-
limiting step in the overall energy-harvesting metabolism. Rate limitation at this final
step would cause accumulation of the products, and decrease in forward reaction rate,

of each of the non-coupled reactions, bringing them ever closer to equilibrium (AG =
0). This process would continue until the energy-coupled reactions garnered a
sufficient traction of the overall energy yield to drive ATP synthesis or the system
reached a value of./.= I (signifijing complete equilibrium in the non-coupled
reactions, where metabolism would cease to proceed, in a net forward direction).
Utilizing values ofn = 3, AGADP + ATP = + 50 kJ'mol l (ATP:ADP = 10), and/--_ 0.8. as
measured for cells in actively growing cultures, gives an energy quantum of about -20
kJ.mol l [1 ]. But the population for which we calculate an in situ AGm,n is almost
certainly not actively growing; rather, it is likely functioning at the bare minimum
required to sustain metabolic turnover of H2. The difference between the culture-based
and in situ AGrnin values might thus reflect the potential for optimization of energy-
conserving efficiency, through the mechanisms described above, in the microbial
populations of CLB sediments.
It is important to point out that optimization off and AG._p + ArP in the fashion
described above represents a trend towards a metabolism that is at equilibrium with
respect to ATP formation. This is a dramatic departure from conditions of active gro_da,
in which large quantities of energy are sacrificed in order to assure unidirectional
metabolism. In an environmental context, both metabolic states are important. Clearl.v,
estimates of growth energy requirements are needed to address the potential for microbial
colonization of oligotrophic environments. However, it seems likely that "steady-state'"
activity accounts for a much greater proportion of microbially-catalyzed chemical cycling
on Earth than does actual cell growth, so that a knowledge of maintenance energy
requirements is also critical tbr understanding environmental biogeochemistry.

This point is illustrated by anaerobic methane oxidation (AMO). This process is
widespread in the marine environment and significant in global geochemistry [40]. but
the responsible microbial agents have not been successfully cultured. Most recent
evidence implicates a two-member bacterial consortium consisting of an archaeal
(methanogenic?) and a sulfate-reducing partner [23, 41-45]. The total energy available
from the process under most environmental conditions would generally be insufficient to
support two organisms with a -20 kJ'mol l growth energy requirement. However,
sustained biological catalysis of AMO by an existing consortium would carry a
significantly lower energy requirement. For example, AMO actively occurs in CLB
sediments at H2 partial pressures that translate to energy yields of -13.5 + 1.0 kJ-mol _
for the methanogenic partner [23] and -18.8 _+ 1.2 kJ.mol 1 for the sulfate-reducing
partner - meeting the apparent in situ free energy requirements of both organisms.
How many other environmentally relevant processes might function in the region
between the energy quantum observed in actively growing cultures and the apparent
critical free energies required for intact communities in situ? The answer to this question
gains added significance .when considering that the function of>99% of the
microorganisms on Earth remains uncharacterized from the standpoint of culture-based
studies [46]. Establishing the magnitude of the gap, if any, between critical growth
energies and critical survival energies may be an important step in understanding the
distribution and nature of microbial life in oligotrophic environments.
Acknowledgments

[he authors are grate(ul to D. Des Marais, B. Bebout, B. Schink, and members of NASA-
Ames EMERG group for comments and discussion on an early draft of this manuscript.
[he work was supported by NSF grants OCE 92-I 7570 and OCE 96-33465. TMH ,,,,'as
supported by NDSEG, Royster, and NRC fellowships.
References
[ 1] Schink, 13. (1997) Energetics of syntrophic cooperation in methanogenic
degradation. Microbiol. Molecular Biol. Rev. 61,262-280.
[2] Pedersen, K. (1993) The deep subterranean biosphere. Earth Sci. Rev. 34, 243-
260.
Parkes, R.J., Cragg, B.A., Bale, S.J., Getliff, J.M., Goodman, K., Rochelle, P.A.,
Fry, J.C., Weightman, A.J. and Harvey, S.M. (1994) Deep bacterial biosphere in
Pacific Ocean sediments. Nature 371,410-413.
Frederickson, J.K. and Onstott, T.C. (1996) Microbes deep inside the earth.
Scientific American 275, 68-73.
Fyfe, W.S. (1996) The biosphere is going deep. Science 273,448.
Thauer, R.K., Jungermann, K. and Decker, K. (1977) Energy conservation in
chemotrophic anaerobic bacteria. Bacteriol. Rev. 41, 100-180.
Lancaster, J.R., Jr. (1989) Sodium, protons, and energy coupling in the
methanogenic bacteria. J. Bioenerg. Biomem. 21,717-740.
Thauer, R.K. (1990) Energy metabolism of methanogenic bacteria. Biochim.
Biophys. Acta 1018, 256-259.
[3]
[4]
[5]
[61
[7]
[8]

[91
[1o]
[11]
[12]
[13]
[14]
[15]
[16]
[17]
Mtiller, V., Blaut, M. and Gottschalk, G. (1993)Bioenergetics of methanogenesis.
Methanogenesis. In: (J. G. Ferr?. ed.). pp. 360-406. Chapman & Hail, New York.
Sch/ifer, G., Engelhard, M. and M_iller, V. (1999) Bioenergetics of the archaea.
Microbiol. Molecular Biol. Rev. 63,570-620.
DoIfing, J. (1988) Acetogenesis. Biology of Anaerobic Microorganisms. In: (A. J.
B. Zehnder, ed.), pp. 417-468. Wiley-lnterscience, New York.
McInerney, M.J. (1988) Anaerobic hydrolysis and fermentation of fats and
proteins. Biology of Anaerobic Microorganisms. In: (A. J. B. Zehnder, ed.), pp.
3 73-4 l 5. Wiley-Interscience, New York.
Claypool, G.E. and Kaplan, I.R. (1974) The origin and distribution of methane in
marine sediments. Natural gases in marine sediments. In: (I. R. Kaplan, ed.), pp.
99-140. Plenum, New York.
Martens, C.S. and Berner, R.A. (1974) Methane production in the interstitial
waters of sulfate depleted marine sediments. Science 185, 1167-1169.
Lovley, D.R. and Klug, M.J. (1983) Sulfate reducers can outcompete
methanogens at freshwater sulfate concentrations. Appl. Environ. Microbiol. 45,
187-192.
Conrad, R., Lupton, F.S. and Zeikus, J.G. (1987) Hydrogen metabolism and
sulfate-dependent inhibition of methanogenesis in a eutrophic lake sediment (Lake
Mendota). FEMS Microbioi. Ecol. 45, 107-115.
Hoehler, T.M., Alperin, M.J., Albert, D.B. and Martens, C.S. (1998)
Thermodynamic control on H 2 concentrations in an anoxic marine sediment.
Geochim. Cosmochim. Acta 62, 1745-1756.
[18]
[191
[20]
[21]
[22]
[23]
[24]
Zinder, S.H. (I 993) Physiological Ecology of Methanogens. Methanogenesis. In:
iJ. G. Ferry, ed.). pp. 128-206. Chapman & Hall, New York.
Cord-Ruwisch, R., Seitz, H.-J. and Conrad, R. (I 988) The capacity or"
hydrogenotrophic anaerobic bacteria to compete for traces of hydrogen depends
on the redox potential of the terminal electron ae.ceptor. Arch. Micro. 149, 350-
357.
Lovley, D.R. and Goodwin, S. (1988) Hydrogen concentrations as an indicator of
the terminal electron-accepting reactions in aquatic sediments. Geochim.
Cosmochim. Acta 52, 2993-3003.
Conrad, R., Schutz, H. and Babbel, M. (1987) Temperature limitation of hydrogen
turnover and methanog_nesis in anoxic paddy soil. FEMS Microbiol. Ecol. 45,
281-289.
Conrad, R. and Wetter, B. (1990)Influence of temperature on energetics of
hydrogen metabolism in homoacetogenic, methanogenic, and other anaerobic
bacteria. Arch. Micro. 155, 94-98.
Hoehler, T.M., Alperin, M.J., Albert, D.B. and Martens, C.S. (1994) Field and
laboratory studies of methane oxidation in an anoxic marine sediment: Evidence
for a methanogen-sulfate reducer consortium. Global Biogeochem. Cycles 8, 451-
463.
Westermann, P. (1994) The effect of incubation temperature on steady-state
concentration of hydrogen and volatile fatty acids during anaerobic degradation in
slurries from wetland sediments. FEMS Microbiol. Ecol. 13, 295-302.

[251
[26]
[27]
[28]
[29]
[30]
[311
Chanton, J.P., Martens, C.S. and Kipphut, O.W. (I 983) Lead-2 l l) sediment
geochronology in a changing coastal environment. Geochim. Cosmochim. Acta
47, 1791-1804.
Martens, C.S., Haddad, R.I. and Chanton, J.P. (1992) Organic matter
accumulation, remineralization and burial in an a,noxic coastal sediment.
Productivity, Accumulation, and Preservation of Organic Matter: Recent and
Ancient Sediments. In: (J. K. Whelan and J. W. Farrington, eds.), pp. 82-98.
Columbia University Press, New York.
Canuel, E.A. (1992) Seasonal Variations in the sources and accumulation of
organic matter in a coastal sediment. Ph.D. Thesis. University of North Carolina,
Chapel Hill.
Martens, C.S. and Klump, J.V. (1984) Biogeochemical cycling in an Organic rich
coastal marine basin: 4. An organic carbon.budget for sediments dominated bv
sulfate reduction and methanogenesis. Geochim. Cosmochim. Acta 48, 1987-
2004.
Chanton, J.P, (1985) Sulfur mass balance and isotopic fractionation in an anoxic
marine sediment. Ph.D, Thesis. University of North Carolina, Chapel Hill.
Klump, J.V. and Martens, C.S. (1989) The seasonality of nutrient regeneration in
an organic-rich coastal sediment: Kinetic modeling of changing pore-water
nutrient and sulfate distributions. Limnol. Oceanogr. 34, 559-577.
Boehme, S.E. (1989) Seasonal variation in the production of ZCO., in a methane-
producing sediment. Masters Thesis. North Carolina State University, Raleigh.
[321
[33]
[34]
[35]
[36]
[37]
[38]
[39]
Atkins, P.W. (1990) Physical Chemistry, 4th Edn., 095 pp. Oxtbrd University
Press, New York.
Barner, H.E. and Scheuerman, R.V. (1977) Handbook or'Chemical
Thermodynamic Data for Compounds and Aqueous Species, Wiley, New York.
Stumm, W. and Morgan, J.J. (1981) Aquatic chemistry: an introduction
emphasizing chemical equilibria in natural waters, 2nd Edn., 780 pp. Wiley, New
York.
Dolfing, J. (1992) The energetic consequences of hydrogen gradients in
methanogenic ecosystems. FEMS Microbio[. Ecol. 101, 183-187.
Conrad, R., Phelps, T.J. and Zeikus, J.G. (1985) Gas metabolism evidence in
support of the juxtaposition of hydrogen-producing and methanogenic bacteria in
sewage sludge and lake sediments. Appl. Environ. Microbiol. 50, 595:601.
Conrad, R. (1999) Contribution of hydrogen to methane production and control of
hydrogen concentrations in methanogenic soils and sediments. FEMS Microbiol.
Ecol. 28, 193-202.
Albert, D.B. and Martens, C.S. (1997) Determination of low molecular weight
organic acid concentrations in environmental samples via HPLC. Mar. Chem. 56,
27-38.
Thauer, R.K. and Morris, G. (1984) Metabolism of chemotrophic anaerobes: old
views and new aspects. The Microbe, 1984, Part II, Prokaryotes and Eukaryotes.
In: (M. Florkin and H. S. Mason, eds.), pp. 123-168. Cambridge University Press,
New York.

[401
[41]
[42]
[43]
[44]
[45]
Reeburgh. W.S. and Alperin, M.J. (1988) Studies on anaerobic methane
oxidation. Transport of Carbon and Minerals in Major World Rivers, Lakes, and
Estuaries. part 5. In: (E. T. Degens, S. Kempe, and A. S. Naidu. eds.), pp. 367-
375. SCOPE/UNEP, Hamburg.
HoehIer, T.M. and Alperin, M.J. (1996) Anaerobic methane oxidation by a
methanogen-sulfate reducer consortium: geochemical evidence and biochemical
considerations. Microbial Growth on C_ Compounds. In: (M. E. Lidstrom and F.
R. Tabita, eds.), pp. 326-333. Kluwer Academic Publishers, Dordrecht, The
Netherlands.
Hirtrichs, K.-U., Hayes, J.M., Sylva, S.P., Brewer, P.G. and DeLong, E.F. (1999)
Methane-consuming ar'cJaaebacteria in marine sediments, Nature 398, 802-805.
Boetius, A., Ravenschlag, K., Schubert, C.J., Rickert, D., Widdel, F., Gieseke, A.,
Amarm, R., J_rgensen, B.B., Witte, U. and 'Pfannkuche, O. (2000) A marine
microbial consortium apparently mediating anaerobic oxidation of methane.
Nature 407, 623-626.
Hinrichs, K.-U., Summons, R.E., Orphan, V., Sylva, S.P. and Hayes, J.M. (2000)
Molecular and isotopic analysis of anaerobic methane-oxidizing communities in
marine sediments. Organic Geochem. 31, 1685-1701.
Pancost, R.D., Damste, J.S.S., Lint, S.d., Van der Maarel, M.J.E.C. and Gottschal,
J.C. (2000) Biomarker evidence for widespread anaerobic methane oxidation in
Mediterranean sedirheats by a consortium of methanogenic archaea and bacteria.
Appl. Environ. Microbiol. 66, 1126- i 132.

[46] Ward, D.M., Weller,R.andBateson,M.M. (1990) 16S rRNA sequences reveal
numerous uncultured microorganisms in a natural community. Nature 345, 63-65.

FigureCaptions:
Figure 1. Responseof H2partialpressureandtreeenergy yield to variation in
temperature. (A) Hz partial pressure versus temperature under sulfate-reducing (e) or
methanogenic (O) conditions. Error bars represent _+one standard deviation about the
mean ofn = 4 - 5 replicate sediment samples. (B) AGsR (e) and AGMp (O) (under
sulfate-reducing and methanogenic conditions, respectively) versus temperature. Error
bars reflect the standard errors of measurement from (A), propagated through the AG
calculation. Solid lines represent the average free energy yield that was maintained across
the range of temperatures: AGsR = - 24.7 _+0.6 kJ.mol "_and AGMp = -15.8 + 0.5 kJ.moi l.
Dashed lines represent the temperature-based change in AG that would have occurred if
the H2 partial pressure did not change from the levels measured at the initial sediment
temperature of 22°C.
Figure 2. Response of H2 partial pressure and free energy yield to variation in pore water
sulfate concentration. (A) H2 partial pressure versus sulfate concentration in sediments
dominated by sulfate-reducing bacteria. Error bars represent one standard deviation about
the mean of n = 3 replicate sediment samples. For the 105 mM sulfate sample, no
replicates were measured. The solid curve represents a power function fit to the data.
Compare the observed exponential dependence of H2 on sulfate,-0.26 _+0.01 (r2 =
0.993). to the value of-0.25 theoretically required to maintain a constant free energy
yield. (B) AGsR versus sulfate concentration. Error bars reflect the standard errors of

measurementfrom (A), propagated through the AG calculation. For the 105 mM point,
which had only I replicate, an error of_+ 7% tbr H, partial pressure (representing the
average measurement error ["or the other [bur sulthte concentrations) was assumed for the
error propagation calculations. The solid line represents the average free energy yield that
was maintained across the range of sulfate concentratioias: AGsR = - 22.8 _+0.8 kJ.mol t.
The dashed line represent the sulfate-based change in AGsR that would have occurred if"
the H2 partial pressure did not change from the level measured at the initial pore water
sulfate concentration of 5.9 mM.
Figure 3. Dependence of measured H2 partial pressure on spatial organization of H2
consumer cells. (A) Random arrangement of H2 consumer cells in relation to H2 sources.
To maintain mass transport of H2, consumer cells maintain a gradient in PH, between the
bulk extracellular fluid and the intracellular mediuM. H2 measurements, which sample
the bulk extracellular fluid, overestimate the intracellular partial pressure. (B) H2
consumer cells arranged in a network around individual sources of H2. An efficient
network would continue to remove H2 down to the minimum biologically useful level.
with the remainder escaping to the bulk extracellular fluid. H2 measurements in this fluid
would thus reflect exactly the H2 partial pressure in the intracellular medium of the last
"'shell" of H2-consuming organisms.
Figure 4. Down-core profiies of in situ concentrations and free energy yields in sediment
cores from Cape Lookout Bight. (A) and (C): Concentrations of H2 (O) and sulfate (e)
in a sediment cores taken in August (27.0°C) and November (14.5°C), respectively. Error

barsrepresentonestandarddeviationaboutthemeanofn = 3 replicatesedimentsamples.
(B) and(D}: AGMp (O) and AGsR (O) in August and November. respectively, calculated
from the concentrations in (A) and (C), along with measured concentrations of CH4 and
estimated concentrations of ZHzS and X;CO2 (see methods). Error bars reflect the
standard errors of measurement from (A) and (C), along, with estimated errors for ZH2S
and £CO2 (see methods), propagated through the AG calculation. The horizontal dashed
lines in each profile represent the approximate depth of transition from sulfate-reducing
to methanogenic conditions.
D.
"1"
2.0
1.5
1.0
0.5
0.0
Methanogenesis
280 285 290 295 300 305
E
V
(.9<_
-5
-15
-45
B AGMp -VS- T (/fH2 = constant) "4 ....................................i
O ' ....O_'......... _., .,.........,r
.... . .....,"...,..
.....,...,"
.................. _Gs_ -vs- T (ff H2 = constant)
280 285 290 295 300 305
Temperature (°K)

13.V
-1"
OE-5v,
V
(3
0.18 _
0.15
0.12
0.09
0.06
-20
-23
-26
-29
-32
- PMz= 0.25"[SO42"]-°.25s
A '_,
0 30 60 90 120
B
,. &GsR -VS- SO4 2"
"'.. J if H2 = constant
°. ,-_
° .o
* -°__.
0 30 60 90 120
Sulfate (mM)

"UI
3
O._°
O"
_T
-h
_0
Q.
V
"U
_°
-I
"T(uO
o"f-
c-
O=-Or/
L -q--
ir, J
3
I-
©
°,oi<T
o
I m
E
(D
I
"u Q_
o
"UI
3
c-
_°
O"c-
_o
II
"UT
_°
IC)O
IO
!O
l/ _

E(J
V
r-
£3
Sulfate (mM) AG (kJ mol-_)
0 5 10 15 20 -40 -30 -20-10 0 +10A ,
10 ..................................0 .....................................
2O
30
40
5O
L(August) B6o
00 05 10 1.5 2.0
0 5 10 15
0
10
2O
30
4O
5O
(November) C6O
00 0.2 0.4 0.6
20 -40 '.-30 -20
II
(November)
-10 0 +10
QH9
D
H 2 (Pa)