appearance defective reduction in nonwoven process
TRANSCRIPT

Abstract—The objective of this paper is to reduce defectives
due to their appearance in a nonwoven production process. We
found that this type of waste normally occurs at a spinning
machine. A brainstorming process as well as knowledge from
previous works are used to determine root causes, which
include 4 parameter settings within a spinning machine - cabin
pressure, die temperature, cooling temperature and suction
speed. We used 2k-1 factorial design to screen parameters and
Box-Behnken design to fine-tune the parameters. From the
experiments, we found that only 3 parameter settings are the
major causes of the problem. Cooling pressure should be set at
2660.60 Pa, die temperature should be set at 219.85 degree
Celsius, and cooling temperature should be set at 29.73 degree
Celsius. After implementing this solution in manufacturing, it
reduces the appearance waste from 1.54% to 0.90%, which
equals to 42% improvement.
Index Terms— Nonwoven Process, Spinning Machine,
Appearance, Parameter Optimization, Box-Behnken Design
I. INTRODUCTION
nonwoven production process using the spun bonding
method has been widely used. One of the most widely
used systems is a Reicofil system shown in Fig 1. In this
system, a raw material is melted in an extruder and pushed
through a spinneret to create a strand. Then, the strand is
cooled in a chamber by passing through cold air, which
flows into the system. The cooled strand is then formed to be
nonwoven fabric on a belt. The nonwoven fabric is entered
a bonding process, winded, and then stored at a winder unit.
Fig. 1. Reicofil System
Manuscript received January 7, 2013.
Wipawee Tharmmaphornphilas is with the Department of Industrial
Engineering, Faculty of Engineering, Chulalongkorn University, Bangkok,
Thailand. E-mail: [email protected], phone no. 662-218-6829
(Corresponding author)
Worapot Rodraksa is with the Department of Industrial Engineering,
Faculty of Engineering, Chulalongkorn University, Bangkok, Thailand.
E-mail: [email protected]
II. DEFECTIVES IN A NONWOVEN PROCESS
We collected data from January 2012 to March 2012
and found that defectives in the nonwoven production
process can be classified into 2 main groups:
1. Appearance defectives – defectives whose
appearance do not fit customer requirements.
2. Nonappearance defectives – defectives whose
properties are out of specifications.
The percent defective can be calculated from the ratio
between the weight of the defective baby roll and the weight
of total baby roll.
Fig. 2 compares the percent defective in case of
appearance versus non-appearance types among 4 product
groups – 13 grams per square meter (gsm), 15 gsm, 17 gsm,
and 19 gsm. The highest percentage of waste is 1.76%,
which comes from 15-gsm product, followed by 1.27% from
13-gsm product. We also found that appearance defectives
are consistently higher than non-appearance defectives in all
product groups.
Fig. 3 shows the production volumes of every product
groups. The production amount of 15-gsm product is the
highest. Therefore, this paper focuses on the reduction of
appearance defectives for the 15-gsm nonwoven fabric.
However, the proposed methodology can be applied to other
product groups as well. Appearance defectives can be
classified into many types. Fig. 4 shows the Pareto chart of
appearance defectives in the nonwoven process. Filament
break is a major problem, followed by hole, dust, lump,
others (other types of defectives) and metal respectively.
1.27%
1.76%
0.85%
0.01%0.08% 0.10% 0.05%0.00%
0.00%
0.50%
1.00%
1.50%
2.00%
13gsm 15gsm 17gsm 19gsm
Appearance Defectives
Non Appearance Defectives
Fig. 2. Appearance versus Non-appearance defectives
Appearance Defective Reduction
in Nonwoven Process
Worapot Rodraksa and Wipawee Tharmmaphornphilas
A
Proceedings of the International MultiConference of Engineers and Computer Scientists 2013 Vol II, IMECS 2013, March 13 - 15, 2013, Hong Kong
ISBN: 978-988-19252-6-8 ISSN: 2078-0958 (Print); ISSN: 2078-0966 (Online)
IMECS 2013

-
gsm gsm gsm gsm
Kilog
ram
Nonwoven type (Gram per square mater)
Fig. 3. Production volumes
Filament Break
Hole Dust Lump Other Metal
Nowo
ven
Was
te (R
oll)
Defect
Percent Accumulate
Fig. 4. Types of appearance defectives.
III. ROOT CAUSE DETERMINATION
To determine root causes of the problems, we start by
brainstorming based upon 4M analyses: man, machine,
material and method to develop fishbone diagrams. The
brainstorming process is performed among experienced
operators in the nonwoven production process to determine
possible causes of filament break, hole, dust, and lump.
We found that filament break, hole and lump have
common root causes. Moreover, these types of defectives
usually occur due to spinning conditions. From the historical
data, these problems can be solved by adjusting the same
parameter condition. Therefore, we combine these three
defectives as a group.
Fig. 5 shows that more than 80% of defectives come
from filament break, hole and lump. Therefore, we focus on
reducing this group of waste. Root causes of these problems
and the numbers of occurrences of each problem are shown
in Table I. The highest three causes are cabin pressure, die
temperature and cooling air temperature, which are not in
good settings.
Filament break Hole and Lump
Dust Can not Specify Metal
Nonw
oven
Was
te R
oll
Defect
Percent Accumulate
Fig. 5. Groups of appearance defectives
Table I. Root causes and frequency of defectives
Root Cause Filament Break Hole Lump
Wrong adjust parameter 0 0 0
Wrong load material 1 0 0
No Cleaning before start up 0 0 0
Action out of procedure 0 0 0
Low skill of new operator 0 0 0
Die dirty 2 1 1
Die plug or die screen dirty 5 3 0
Chamber leak 2 0 0
Hani comb dirty 3 1 0
Air flow meter broken 0
Air pressure meter broken 0
Temperature out of range 2 2 3
Spin belt dirty 5
MFI property out of specification 0 0 0
Contamination 0 0 0
Cabin pressure not suitable 43 11 8
Die temperature not suitable 28 8 7
Cooling temperature not suitable 37 18 16
Cleaning point is not suitable 2 0 0
Other 9 5 2
Man
Material
Method
Machine
From previous works, Nanjundappa and Bhat [1]
studied process variables on the structure and property of
filament. It was found that the structure of polymer changed
during the course of bonding. Also, the final structure was
the result of the spinning and bonding conditions.
Jia [2] discussed two types of physical mechanisms of
filament break during a spinning process - cohesive failure
and capillary filament break. The capillary web break was
related to surface tension and occurred less than 1%. The
major cause of filament break was a cohesive failure, which
occurred when the tensile stress exceeded the fiber tensile
strength. Cabin pressure was a parameter that specified an
amount of airflow, which affected tensile stress. An
improper level of cabin pressure resulted in filament break.
Hietel [3] developed mathematical models of fiber
dynamic in the spinning and laydown region. He found that
fiber was stretched and changed its diameter due to viscous
and rubbery conditions. He also explained that the fiber flow
interaction was based on air flow, momentum and heat
exchange. Bhat and Malkan [4] explained that the filament break
and spot formation on a spin belt were due to high
temperature of polymer. If polymer temperature was too
high at a spinning process, it would lead to filament break
problem. Also, the fiber tensile strength would increase
when the air suction speed increased, which leaded to lower
filament break.
From the root causes analysis and previous papers, we
can conclude the causes of filament break, hole, and lump as
in Table II.
Table II. Summary of causes of the problem
Fishbone Jia [2] Hietel [3] Bhat et al. [4] Root causes
Cabin Pressure Air Flow Air Flow Cabin Pressure
Die Temp Melt Temp Die Temp
Cooling Air Temp Polymer Strength Heat Exchange Cooling Air Temp
Air Suction Suction Speed
Proceedings of the International MultiConference of Engineers and Computer Scientists 2013 Vol II, IMECS 2013, March 13 - 15, 2013, Hong Kong
ISBN: 978-988-19252-6-8 ISSN: 2078-0958 (Print); ISSN: 2078-0966 (Online)
IMECS 2013

Fig. 6 illustrates the relationship of parameter conditions in a
spinning region:
The cabin pressure is a parameter which affects air
flow. We can increase air flow in a spinning region by
increasing cabin pressure.
The die temperature is used to heat up polymer before
sending to a spinning zone. In our manufacturing, an
extruder temperature is fixed to prevent coke and
improve the extruder lifetime. Therefore, we use die
temperature to adjust melt temperature. However, it
might cause polymer degradation if the temperature is
set too high.
The cooling air temperature is a used to transform
melted polymer to solid polymer. The heat exchange
between melted polymer and cooling air affects
polymer strength.
The suction speed is used to balance air-to-polymer
during spinning process.
Fig. 6. A spinning region
IV. PARAMETER CONDITION DETERMINATION
From the previous section, four parameter settings are
found to be major causes of the problem. To determine
proper levels of each parameter, 2k-1
factorial design is used
in a screening process [5]. Then, Box-Behnken design is
used to fine-tune parameter levels. Details are discussed in
the following sections.
A. 2k-1
Factorial Design
A single replicate 2k-1
factorial design including 8
experiments is applied to screen the factors. These data are
analyzed in Minitab. We set the factors and factor levels as
shown in Table III. There are 4 factors, which are cooling
pressure (A), die temperature (B), cooling temperature (C),
and suction speed (D). The total waste due to filament
break, hole, and lump is used as a model response.
Table III. Factors and factor levels of 2k-1 Factorial Design
Factor Unit Level (-1) Level (+1)
Cabin Pressure Pa. 2400 3000
Die Temperature Degree Celsious 215 225
Cooling Temperature Degree Celsious 27 33
Suction Speed rpm 1500 2100
The model adequacy checking is done before analyzing
the data. The normal probability plots in Fig. 7 show that the
residuals are normally distributed with p-value equals to
0.959. Since the plots of residuals against fitted values show
no pattern, we conclude that the residuals are independent.
The plot of residuals versus the observation order also
appears random, which implies a constant residual variance.
Thus, the model meets all assumptions and the analysis
process can be continued [5]. The normal plot of the effects
in Fig. 8 shows that only three factors, including cabin
pressure (A), die temperature (B) and cooling temperature
(C), are significant with a significance level of 0.05.
Therefore, we eliminate the suction speed (D) in the next
experimental design.
0.500.250.00-0.25-0.50
99
90
50
10
1
ResidualP
erce
nt
8642
0.30
0.15
0.00
-0.15
-0.30
Fitted Value
Re
sid
ua
l
0.30.20.10.0-0.1-0.2-0.3
2.0
1.5
1.0
0.5
0.0
Residual
Fre
qu
en
cy
87654321
0.30
0.15
0.00
-0.15
-0.30
Observation Order
Re
sid
ua
l
Normal Probability Plot Versus Fits
Histogram Versus Order
Residual Plots for Percent Defective
Fig. 7. Residual plots for percent defective (2k-1 design)
43210-1-2
99
95
90
80
70
60
50
40
30
20
10
5
1
Effect
Pe
rce
nt
A A
B B
C C
D D
Factor Name
Not Significant
Significant
Effect Type
C
B
A
Normal Plot of the Effects(response is Defective, Alpha = 0.05)
Lenth's PSE = 0.25125
Fig. 8. Normal plot of the effects
B. Box-Behnken Design
The response surface methodology is very useful in
solving the engineering issues. The Box-Behnken design is
often used in the processes which are difficult or costly to
run at corner points.
Aslan [6] studied a methodology for modeling of
Turkish coal grinding circuits by applying the Box-Behnken
design. This study proved that the Box-Behnken design and
the response surface methodology could efficiently be
applied to model Turkish coals grinding circuits. It was an
economical way of obtaining the maximum amount of
Proceedings of the International MultiConference of Engineers and Computer Scientists 2013 Vol II, IMECS 2013, March 13 - 15, 2013, Hong Kong
ISBN: 978-988-19252-6-8 ISSN: 2078-0958 (Print); ISSN: 2078-0966 (Online)
IMECS 2013

information in a short period of time and with the fewest
number of experiments.
Ferreira et al. [7] described fundamental, advantages
and limitations of the Box-Behnken design for the
optimization of analytical methods. He concluded that the
Box-Behnken was a good design for response surface
methodology because it permitted: (1) estimation of the
parameters of the quadratic model; (2) building of sequential
designs; (3) detection of lack of fit of the model; and (4) use
of blocks.
Zhu and Liu [8] optimized the extraction process of
crude polysaccharides from pomegranate peel with water
by applying the Box-Behnken design. He concluded that the
response surface method proved to be useful for
optimization of technology PPP extraction.
From the benefits of the Box-Behnken design as
discussed, we applied this method to find the proper factor
levels. Three factors from the screening process are
considered in the experiments, including cooling pressure
(A), die temperature (B) and cooling temperature (C).
Fifteen experiments are performed as in Table IV, with
factors and their levels shown in Table V.
Table IV. The Box-Behnken design
StdOrder RunOrder PtType Blocks A B C
10 1 2 1 0 1 -1
6 2 2 1 1 0 -1
14 3 0 1 0 0 0
15 4 0 1 0 0 0
9 5 2 1 0 -1 -1
13 6 0 1 0 0 0
2 7 2 1 1 -1 0
3 8 2 1 -1 1 0
1 9 2 1 -1 -1 0
11 10 2 1 0 -1 1
7 11 2 1 -1 0 1
5 12 2 1 -1 0 -1
8 13 2 1 1 0 1
4 14 2 1 1 1 0
12 15 2 1 0 1 1
Table V. Factors and factor levels for the Box-Behnken design
Factor UnitLevel 1
(-1)
Level 2
(0)
Level 3
(1)
Cabin Pressure Pa. 2400 2700 3000
Die Temperature Degree Celsious 215 220 225
Cooling Temperature Degree Celsious 27 30 33
Similar to the previous section, the model adequacy
checking is performed before analyzing further results. In
Fig. 9, the normal probability plot shows that the residuals
are normally distributed with p-value of 0.195. From the
plots of residuals against fitted values and observation order,
we conclude that residuals are independent with constant
variance.
0.500.250.00-0.25-0.50
99
90
50
10
1
Residual
Pe
rce
nt
642
0.50
0.25
0.00
-0.25
-0.50
Fitted Value
Re
sid
ua
l
0.450.300.150.00-0.15-0.30-0.45-0.60
3
2
1
0
Residual
Fre
qu
en
cy
151413121110987654321
0.50
0.25
0.00
-0.25
-0.50
Observation Order
Re
sid
ua
l
Normal Probability Plot Versus Fits
Histogram Versus Order
Residual Plots for Defective
Fig. 9. Residual plots for percent defective (Box-Behnken)
The fitted response surface equation is shown in (1).
The model fits with r2(adj) equals to 0.9485.
XX
XXXXXX
XXXY
CB
CABACB
CBA
1219.0
0011.00002.02851.00916.0
7817.463558.442373.05967.5886
22
(1)
The response surface optimization in Fig. 10 shows the most
appropriate parameter levels. Cabin pressure (A) should be
set at 2,660.60 Pa, die temperature (B) should be set at
219.85 degree Celsius, and cooling temperature (C) should
be set at 29.73 degree Celsius. Due to the machine
resolution, we set cabin pressure at 2,661 Pa., die
temperature at 220 degree Celsius and cooling temperature
at 30 degree Celsius. For the suction speed, it is set at 1,500
revolutions per minute.
CurHigh
Low1.0000D
Optimal
d = 1.0000
Minimum
Defectiv
y = -0.2496
1.0000
Desirability
Composite
27.0
33.0
215.0
225.0
2400.0
3000.0B CA
[2660.6061] [219.8485] [29.7273]
Fig.10. An optimal plot from the response surface.
Proceedings of the International MultiConference of Engineers and Computer Scientists 2013 Vol II, IMECS 2013, March 13 - 15, 2013, Hong Kong
ISBN: 978-988-19252-6-8 ISSN: 2078-0958 (Print); ISSN: 2078-0966 (Online)
IMECS 2013
We set the most appropriate parameter levels in the
nonwoven process and collected the percent defective during
November to December 2012. Fig. 11 illustrates the defect
rate after improvement for 15-gsm fabric. The percent
defective of filament break is reduced from 2.14% to 1.26%,
corresponding to 41% improvement. The percent defective
of hole is reduced from 2.11% to 1.18%, corresponding to
44% improvement. The percent defective of lump is reduced
from 0.38% to 0.24%, corresponding to 37% improvement.
The average percent defective before implementing the
solution is 1.54% and after implementing the solution is
0.90%, which equals to 42% improvement.
0.00%
0.50%
1.00%
1.50%
2.00%
2.50%
3.00%
Jan Feb Mar Apr May Jun Jul Aug Sep Oct Nov Dec
Pe
rce
nt D
efe
cti
ve
Percent Defective of 15 gram per sq.m.
Filament Break
Hole
Lump
Fig.11. The percent defective of 15-gsm fabric before and after
improvement.
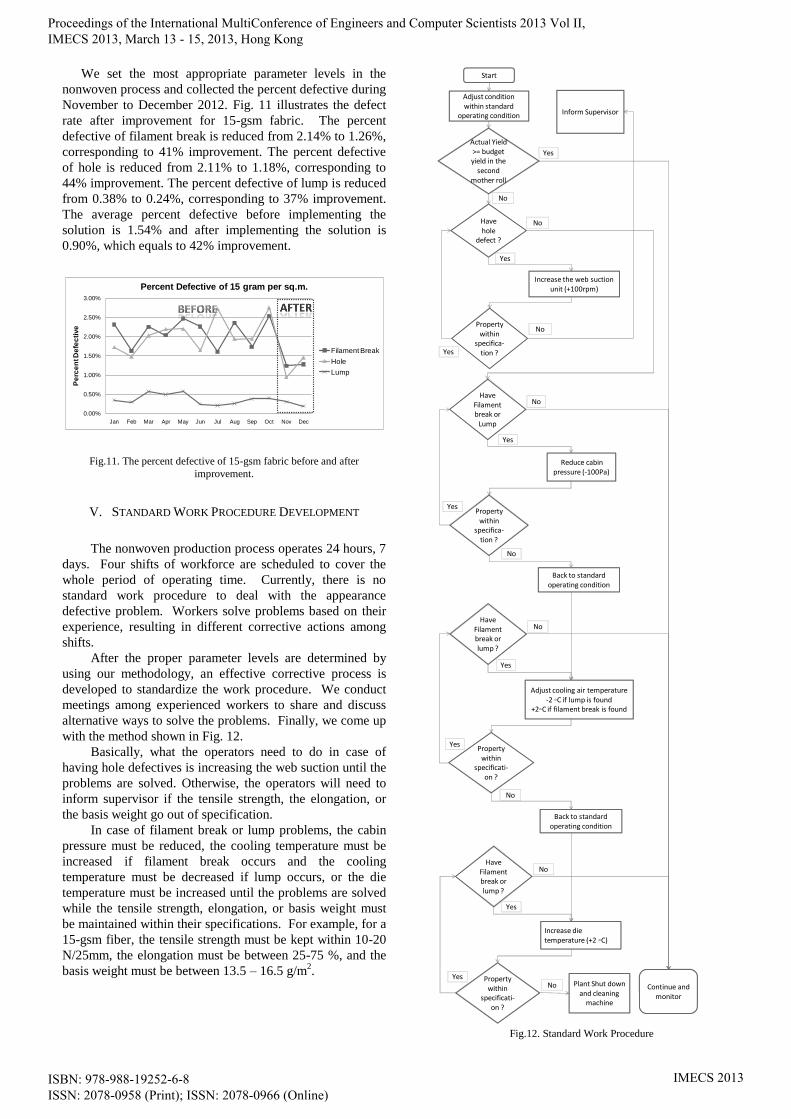
V. STANDARD WORK PROCEDURE DEVELOPMENT
The nonwoven production process operates 24 hours, 7
days. Four shifts of workforce are scheduled to cover the
whole period of operating time. Currently, there is no
standard work procedure to deal with the appearance
defective problem. Workers solve problems based on their
experience, resulting in different corrective actions among
shifts.
After the proper parameter levels are determined by
using our methodology, an effective corrective process is
developed to standardize the work procedure. We conduct
meetings among experienced workers to share and discuss
alternative ways to solve the problems. Finally, we come up
with the method shown in Fig. 12.
Basically, what the operators need to do in case of
having hole defectives is increasing the web suction until the
problems are solved. Otherwise, the operators will need to
inform supervisor if the tensile strength, the elongation, or
the basis weight go out of specification.
In case of filament break or lump problems, the cabin
pressure must be reduced, the cooling temperature must be
increased if filament break occurs and the cooling
temperature must be decreased if lump occurs, or the die
temperature must be increased until the problems are solved
while the tensile strength, elongation, or basis weight must
be maintained within their specifications. For example, for a
15-gsm fiber, the tensile strength must be kept within 10-20
N/25mm, the elongation must be between 25-75 %, and the
basis weight must be between 13.5 – 16.5 g/m2.
Start
Adjust condition within standard
operating condition
Actual Yield >= budget yield in the
second mother roll
Reduce cabin pressure (-100Pa)
Property within
specifica-tion ?
Yes
No
Increase the web suction unit (+100rpm)
Inform Supervisor
Continue and monitor
Have hole
defect ?
Have Filament break or
Lump
Back to standard operating condition
Have Filament break or lump ?
Property within
specificati-on ?
Adjust cooling air temperature-2 ◦C if lump is found
+2◦C if filament break is found
Back to standard operating condition
Property within
specifica-tion ?
Yes
Yes
Yes
Yes
Yes
Yes
No
No
No
No
No
No
Have Filament break or lump ?
Property within
specificati-on ?
Increase dietemperature (+2 ◦C)
Yes
Yes
No
No Plant Shut down and cleaning
machine
Fig.12. Standard Work Procedure
Proceedings of the International MultiConference of Engineers and Computer Scientists 2013 Vol II, IMECS 2013, March 13 - 15, 2013, Hong Kong
ISBN: 978-988-19252-6-8 ISSN: 2078-0958 (Print); ISSN: 2078-0966 (Online)
IMECS 2013

VI. CONCLUSION
The waste occurring the most in the nonwoven
production process comes from appearance defectives,
which is around 95.4% of the total waste. It was found that
filament break, hole and lump are the major appearance
problems. Brainstorming techniques as well as knowledge
from previous literatures are used to define root causes of
the problem. A 2k-1
experimental design is used to screen
factors, and it was found that the cabin pressure, the die
temperature, and the cooling temperature, are the significant
factors. Then, the response surface techniques are developed
to determine the optimum levels of these parameters – the
cabin pressure is 2660.60 Pa, die temperature is 219.85
degree Celsius, and cooling temperature is 29.73 degree
Celsius. Moreover, the standard work procedure for
correction process is developed based upon the operators’
experience to deal with the appearance defective problem.
After implementing the solution, the average percent
defective is reduced from 1.54% to 0.90%, which equals to
42% improvement on average.
REFERENCES
[1] R.Nanjundappa, Gajanan S. Bhat, “Effect of Processing Conditions
on the Structure and Properties of Polypropylene Spunbond Fabrics,”
Journal of Applied Polymer Science, Vol. 98, 2005, pp.2355-2368..
[2] J. Jia, “Melt Spinning of Continuous Filaments by Cold Air
Attenuation,” Ph.D. Thesis, School of Materials Science and
Engineering, Georgia Institute of Technology, Georgia, 2010.
[3] D. Hietel, N. Marheineke, “Model and Numerical Simulation of Fiber
Dynamics,” Proceeding in Applied Mathematics and Mechanics,
Vol. 5, 2005, pp. 667-670.
[4] G. Bhat, S. R. Malkan, “Extruded Continuous Filament Nonwovens:
Advances in Scientific,” Journal of Applied Polymer Science, Vol.
83, 2002, pp.572-585.
[5] D.C. Montgomery, Design and Analysis of Experiment, 5th ed, The
United State of America: John Wiley & Sons, INC., 2000.
[6] N. Aslan, “Application of Box–Behnken Design and Response
Surface Methodology for Modeling of Some Turkish Coals,” Fuel,
Vol. 86, 2007, pp. 90-97.
[7] S.L.C. Ferreira, R.E. Bruns, H.S. Ferreira, G.D. Matos, J.M. David,
G.C. Brand, E.G.P. da Silva, L.A. Portugal, P.S. dos Reis, A.S.
Souza, W.N.L. dos Santos, “Box-Behnken Design: An Alternative for
the Optimization of Analytical Methods,” Analytica Chimica Acta,
Vol. 597, 2007, pp. 179-186.
[8] C. Zhu, X. Liu, “Optimization of Extraction Process of Crude
Polysaccharides from Pomegranate,” Carbohydrate Polymer, Vol.
92, Issue 2, 2013, pp. 1197-2012.
Proceedings of the International MultiConference of Engineers and Computer Scientists 2013 Vol II, IMECS 2013, March 13 - 15, 2013, Hong Kong
ISBN: 978-988-19252-6-8 ISSN: 2078-0958 (Print); ISSN: 2078-0966 (Online)
IMECS 2013