appendix 1: fasd screening algorithm specifications and ...€¦ · web viewmodified non-word...
TRANSCRIPT

Supplementary Appendix
Supplement to: McQuire, C, Mukherjee, R, Hurt, L, Higgins, A, Greene, G, Farewell, D, Kemp, A, Paranjothy, S. Screening prevalence of fetal alcohol spectrum disorders in a region of the United Kingdom: a population-based birth-cohort study.
1

Appendix 1: FASD screening algorithm specifications and measures
Supplemental Table 1a: Schematic representation of the screening algorithms for FASD that were generated by varying combinations of the central nervous system (CNS) and prenatal alcohol exposure (PAE) criteria. Full definitions for the Liberal, Mid, Strict and Revised CNS criteria, and the terminology for all PAE categories are provided in Supplemental Table 1b.
2

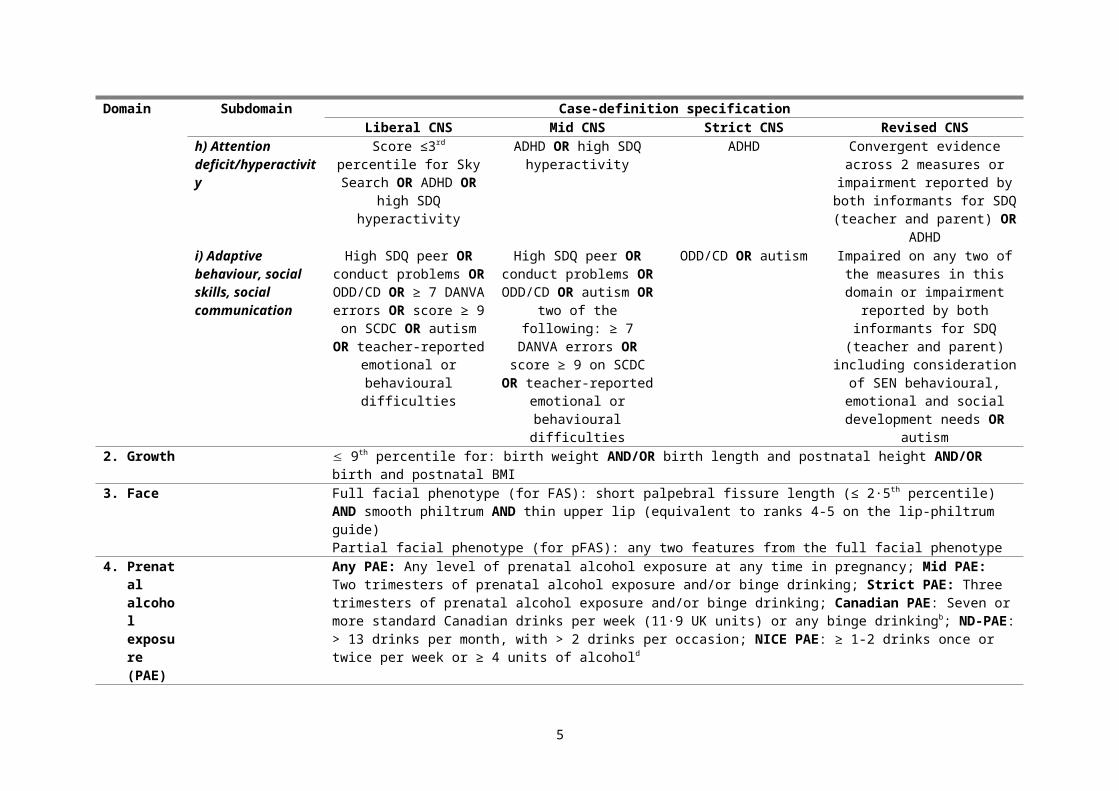
Supplemental Table 1b: FASD screening algorithm specifications (continued overleaf). Further details of the assessment measures are presented in Supplemental Table 1c.
Domain Subdomain Case-definition specificationLiberal CNS Mid CNS Strict CNS Revised CNS
1. Central Nervous System
(CNS)a
Impairment in ≥ 3 subdomains
a) Hard and soft neurologic signs
≤5th percentilein ALSPAC coordination
test OR ≥ 2 seizures not due to postnatal insult OR
cerebral palsy
≤5th percentile in ALSPAC coordination test OR
cerebral palsy
As for Mid ≤5th percentilein ALSPAC coordination test OR ≥ 2 seizures not due to postnatal
insult) OR cerebral palsy
b) Brain structure Head circumference ≤ 2nd percentile at birth
Head circumference ≤ 2nd percentile at birth AND age
7
As for Mid Head circumference ≤ 2nd percentile at birth OR age 7
c) Cognition Score ≤ 70 on total, verbal or performance IQ OR discrepancy of ≥ 1 SD between subdomains
As for Liberal As for Liberal Score ≤ 70 on total, verbal or performance IQ OR discrepancy of ≥ 1 SD between subdomains.
Not impaired if discrepancy between subdomains but IQ ≥ 120
d) Communication: receptive and expressive
Score ≤ 2 SD from the mean for WOLD listening
comprehension OR WOLD expressive language OR
teacher-reported communication impairment
at any time point
Impaired on any two of the measures in this domain
Score ≤ 2 SD from the mean for WOLD listening
comprehension AND WOLD expressive
language AND teacher-reported impairment at any
time point
Impaired on any two of the measures in this domain
(including consideration of SEN communication needs)
e) Academic achievement
Failing to meet the expected level at school at any time point (Key Stage 1 Level 1 or W; Key Stage 2 < Level
4) OR SEN at any time point
Failing to meet the expected level at school at all time
points (Key Stage 1 Level 1 or W; Key Stage 2 < Level
4) OR SEN at any time point
SEN at any time point Failing to meet the expected level at school at all time points OR SEN at any time point. Do not
mark as impaired if IQ ≤ 79. Do not mark as impaired if normal educational attainment and a
reason other than cognitive and learning needs for SEN.
f) Memory Score ≤3rd percentile on Forward Digit Span OR
Non-Word Repetition Task
As for Liberal ≤3rd percentile on Forward Digit Span
Score ≤3rd percentile on Forward Digit Span OR Non-Word
Repetition Task
3

Domain Subdomain Case-definition specificationLiberal CNS Mid CNS Strict CNS Revised CNS
g) Executive functioning and abstract reasoning
Score ≤3rd percentile for any of the available measures:
Opposite Worlds task, Counting Span task, Stop Signal task, Backwards
Digit Span task
Score ≤3rd percentile for two of the available measures
Score ≤3rd percentile forCounting Span AND
Backwards Digit Span tasks
OR Score ≤3rd percentile for Stop-Signal AND Opposite Worlds tasks
Score ≤3rd percentile for two of the available measures
h) Attention deficit/hyperactivity
Score ≤3rd percentile for Sky Search OR ADHD OR high
SDQ hyperactivity
ADHD OR high SDQ hyperactivity
ADHD Convergent evidence across 2 measures or impairment reported
by both informants for SDQ (teacher and parent) OR ADHD
i) Adaptive behaviour, social skills, social communication
High SDQ peer OR conduct problems OR ODD/CD OR
≥ 7 DANVA errors OR score ≥ 9 on SCDC OR
autism OR teacher-reported emotional or behavioural
difficulties
High SDQ peer OR conduct problems OR ODD/CD OR
autism OR two of the following: ≥ 7 DANVA errors OR score ≥ 9 on
SCDC OR teacher-reported emotional or behavioural
difficulties
ODD/CD OR autism Impaired on any two of the measures in this domain or
impairment reported by both informants for SDQ (teacher and parent) including consideration of SEN behavioural, emotional and
social development needs OR autism
2. Growth 9th percentile for: birth weight AND/OR birth length and postnatal height AND/OR birth and postnatal BMI3. Face Full facial phenotype (for FAS): short palpebral fissure length (≤ 2·5th percentile) AND smooth philtrum AND thin upper lip
(equivalent to ranks 4-5 on the lip-philtrum guide)Partial facial phenotype (for pFAS): any two features from the full facial phenotype
4. Prenatal alcohol exposure (PAE)
Any PAE: Any level of prenatal alcohol exposure at any time in pregnancy; Mid PAE: Two trimesters of prenatal alcohol exposure and/or binge drinking; Strict PAE: Three trimesters of prenatal alcohol exposure and/or binge drinking; Canadian PAE: Seven or more standard Canadian drinks per week (11·9 UK units) or any binge drinkingb; ND-PAE: > 13 drinks per month, with > 2 drinks per occasion; NICE PAE: ≥ 1-2 drinks once or twice per week or ≥ 4 units of alcohold
Abbreviations: CNS, central nervous system; DANVA, Diagnostic Analysis of Non-Verbal Accuracy; IQ, intelligence quotient; ND-PAE, Neurodevelopmental Disorder-Prenatal Alcohol Exposure; NICE, National Institute for Health and Care Excellence; ODD/CD, oppositional/conduct disorder; PAE, prenatal alcohol exposure; SD, standard deviation; SCDC, Social Communication Disorders Checklist; SDQ, Strengths and Difficulties Questionnaire; SEN, special educational needs; WOLD, Weschler Objective Language Dimensions.a CNS criterion met if there is evidence of impairment in ≥ 3 subdomains (a - i). The Revised CNS case-definition requires that this includes impairment in the subdomains that measure adaptive functioning (e and i).b The FASD Canadian 2016 guidelines suggest that more than one binge drinking episode is required to meet the PAE criteria; however, the ALSPAC data categorise binge drinking as: none, 1-2 days, 3-4 days, 5-10 days, > 10 days, or every day per month. Therefore, it was not possible to separate participants with one binge drinking episode from those with two or more.
c DSM-5 ND-PAE criterion of ‘more than minimal exposure’. Exposed to alcohol at any time during gestation, including prior to pregnancy recognition, and the exposure level was more than minimal (i.e. more than 13 drinks in any one month, with more than two drinks on any drinking occasion.d Drinking in excess of NICE 2008 antenatal guideline limits ≥1-2 drinks once or twice per week; equivalent to ~ 32g / 4 units of alcohol.
4
Supplemental Table 1c: Overview of the assessment measures used in one or more of the FASD screening algorithms (continued overleaf)
Criterion Domain ALSPAC variable
Age assessed(years)
Suggested threshold for impairment
Method for deriving
threshold for impairment
Test details
Growth(A)
Weight Weight Birth - 9 9th percentile at birth Standard norms Excel LMS Growth Add-in based on UK growth norms.1,2
Centiles for pre-term babies < 35 weeks gestation were generated using the Fenton Growth Calculator.3
Height Height Birth - 9 9th percentile at birth and postnatally (up to puberty)
Standard norms
Body mass index (BMI)
BMI Birth - 9 9th percentile at birth and postnatally (up to puberty)
Standard norms
Face(B)
Palpebral fissure length
3D facial scan data
15.5 ≤ 2.5th percentile Standard norms FAS Diagnostic and Prevention Network Z-Score Calculator for palpebral fissure length.4,5
Thin upper lip Equivalent to 4/5 on the lip-philtrum guide
Standard norms Wilson Scale for Lips.6
Smooth philtrum Standard normsCNS(C)
g) Hard and soft neurologic signs (including sensory-motor)
Movement score
7 Top 5% (95th percentile)Score: ≥ 6 for girls ≥ 7 for boys
Research literature
ALSPAC coordination test (modified version of Movement Assessment Battery)
The Movement Assessment Battery for Children was used to test the children’s motor ability.7
It comprises three sections, assessing static and dynamic balance, manual dexterity and ball skills. Because of time constraints, it was not possible to conduct the whole assessment, so specific subtests from each of the three sections were carried out:Manual dexterity: placing pegs and threading laceBall skills: bean bagsBalance: heel to toe walking
Odd et al. derived a summary score based on the three tasks. 'The top (i.e. indicating worse performance) 5th centile of this summed score was used to define
5

Criterion Domain ALSPAC variable
Age assessed(years)
Suggested threshold for impairment
Method for deriving
threshold for impairment
Test details
severe motor coordination difficulties as has been used previously in the literature.8
Seizures 1 - 13 > 1 seizure not due to fever, breath-holding or response to immunisation (i.e. due to epilepsy)
Expert opinion and FASD Canadian 2005 guidelines
ALSPAC asks the child’s caregiver: Has the child ever had a seizure, fit or convulsion? And whether the seizure was due to factors including immunisation, fever or breath-holding, epilepsy.
Cerebral palsy
NR Cerebral palsy Expert opinion Cerebral palsy reported by mother/carer
j) Brain structure
Head circumference
Birth and 7 ≤ 2nd percentile Standard norms Excel LMS Growth Add-in based on UK growth norms.1,2
k) Cognition WISC-III (short-form)
8 Score ≤ 70 on total, verbal or performance IQ
Discrepancy of at least 1 SD (i.e. 15 points) between the subdomains (i.e. verbal and performance IQ).
Standard norms and FASD Canadian 2005 guidelines
WISC-III (short form)
Alternate WISC items were used for all subtests, except for the coding subtest which was administered in its full form.9-12
Administered by members of the psychology team. Raw scores were calculated according to the items used in the alternate item form of the WISC, making the raw scores comparable to those that would have been obtained had the full test been administered.13,14
l) Communication: receptive and expressive
WOLD (Wechsler Objective Language Dimensions)
8 Score ≤3 for wold_list Score ≤3 for wold_express
Based on the distribution of ALSPAC participant data.
Wechsler Objective Language Dimensions (WOLD; modified):14
Listening comprehension: The listening comprehension subtest of the WOLD is divided into two parts. The first is a single word receptive vocabulary test, similar to the vocabulary subtest of the WISC. This was not therefore used. In the second part of the assessment, the child listens
6

Criterion Domain ALSPAC variable
Age assessed(years)
Suggested threshold for impairment
Method for deriving
threshold for impairment
Test details
to the tester read aloud a paragraph about a picture, which the child is shown. The child then answers questions on what they have heard.The child has to make inferences about what was read to them and answer the questions verbally. The task was discontinued if the child got three consecutive questions incorrect. Alternate items from the standard test were sampled except where the item had American cultural loading. In those cases, the next item was selected.
Expressive language: The WOLD has two expressive language subtests. In the second subtest three tasks were performed. Firstly, a picture was shown to the child who was asked to describe the scene, as if to someone who was not present and so could not see the picture. Secondly, the child was shown a map and asked to give directions from one location to another, using the shortest route possible and finally they were asked to explain the steps involved in a sequential task of putting batteries into a torch using pictures to help.These tasks assess the child’s descriptive, narrative and sequencing skills. All responses in this task were recorded on audio tape for later coding on five features, relating to the relevance, accuracy and logicality of the child’s responses. In the full WOLD assessment, each task has two examples. Only one of each was used in the ALPSAC tests.
Communication (general)
7 and 10 ‘Yes’ indicates reported impairment at any time point
Expert opinion Teacher-reported speech and language difficulties in school (needing special assistance)
m) Academic Special 9 to 10 2 (School Action) 3 (School Standard norms Pupil Level Annual School Census (PLASC) recorded
7

Criterion Domain ALSPAC variable
Age assessed(years)
Suggested threshold for impairment
Method for deriving
threshold for impairment
Test details
achievement needs 10 to 1111 to 12
Action plus) and 4 (SEN statement) indicate impairment
SEN: School action, school action plus and statement.15
Academic attainment
6-7 “Failing to meet expected level”Key stage 1: Level 1 or W
Standard normsKey Stage
Range of levels within which most children will work
Target that most children reach by the end of the key stage
Further information about Key Stage levels (Source: ALSPAC SATS Doc and ALSPAC Key Stage 2 File)
1 1 - 3 2 W = Code W (“working towards level 1”) means that the child was assessed but didn’t achieve level 1.
2 2 - 5 4 The basic scale consists of levels 1, 2, 3 and 4+, with grades A, B and C within level 2.Point Score - All Subjects4+ = 273 = 212A = 172B = 152C = 131 = 9
10-11 “Failing to meet expected level”Key Stage 2: < Level 4
Standard norms
p) Memory Short term 8 Score ≤ 3 Based on the WISC-III forward digit span13,14,16,17
8

Criterion Domain ALSPAC variable
Age assessed(years)
Suggested threshold for impairment
Method for deriving
threshold for impairment
Test details
memory distribution of ALSPAC participant data.
Children repeated lists of digits in order.
8 Score ≤ 2 Based on the distribution of ALSPAC participant data.
Modified Non-word Repetition Test14,18
Twelve nonsense words, four each of 3, 4 and 5 syllables and conforming to English rules for sound combinations. The child was asked to listen to each word via an audio cassette recorder and then repeat each item.
r) Executive functioning and abstract reasoning
Working memory
10 Score ≤ 2 Based on the distribution of ALSPAC participant data.
Counting Span Task19-21
The child was presented with red and blue dots on a white screen. The child was asked to point to and count the number of red dots out loud (the processing component). The children were shown:• Two practice sets of two screens• Three sets of two screens• Three sets of three screens• Three sets of four screens• Three sets of five screensAfter each set, the child was asked to recall the number of red dots seen on each screenin the order they were presented within that set (the storage component).
Working memory
8 ≤ 2 correct responses Based on the distribution of ALSPAC participant data.
WISC-III (short form) Backwards Digit Span.13,14,16,17
Children repeated lists of digits in reverse order.
Inhibition 10 ≤ 12 correct responses Based on the distribution of ALSPAC
Stop-signal paradigm20-22
This task observes the child’s ability to inhibit a body
9

Criterion Domain ALSPAC variable
Age assessed(years)
Suggested threshold for impairment
Method for deriving
threshold for impairment
Test details
participant data. movement that has already been requested using a computerized measure of impulsivity. When a ‘stop signal cue’ (bleep) was not heard the child was asked to press the corresponding button according to what was presented on screen. When the bleep was sounded the child was told to refrain from pressing the response button, thereforeinhibiting the stimulus response.
Opposite Worlds Task
8 Time (secs)≥ 28 for males aged 7 - <9 ≥ 24.5 for males aged 9 - 11
≥ 26 for females aged 7 - <9 ≥ 24 for females aged 9 - 11
Based on the distribution of ALSPAC participant data.
TEACh- Opposite Worlds Task14,23
A Stroop task, where the child is required to give a verbal response that contradicts the visual information he or she is given. The child is shown a trail made up of the numbers 1 and 2. In the ‘opposite world’ condition, the child must call out ‘two’ when he or she reaches a 1 and ‘one’ when he or she reaches a 2.
t) Attention deficit/hyperactivity
Selective attention
8 ≥ 11 for males aged 7 - <9 ≥ 9 for males aged 9 - 11
≥ 8 for females aged 7 - 11
Based on the distribution of ALSPAC participant data.
TEA-Ch Sky Search Task14,23
The child was asked to circle identical pairs of spaceships as quickly as possible but not missing any out. The child was asked to tick a box on the sheet to indicate that he/she had circled all the identical pairs he/she could find.
DAWBA ADHD
7.5 DAWBA ADHD Clinical diagnosis by ALSPAC team
Development and Well-Being Assessment (DAWBA)24
DAWBA diagnoses were classified by psychiatrists. For ADHD and oppositional/conduct disorders, the diagnostic procedure considers the teacher report in addition to the parent report. Full DSM-IV diagnoses were only made for children for whom the parent
10

Criterion Domain ALSPAC variable
Age assessed(years)
Suggested threshold for impairment
Method for deriving
threshold for impairment
Test details
report had been completed.
SDQ Hyperactivity Score
7 to 11 years
High SDQ Score ≥ 8
Standard norms Strengths and difficulties questionnaire (SDQ)25
u) Adaptive behaviour, social skills, social communication
SDQ Peer Problems Score
High SDQ Score ≥ 5 for teacher-ratedScore ≥ 4 for parent-rated
Standard norms
SDQ Conduct Problems Score
High SDQScore ≥ 4
Standard norms
DAWBA Oppositional-conduct disorder
7.5 DAWBA Oppositional-conduct disorder
Clinical diagnosis by ALSPAC team
Development and Well-Being Assessment (DAWBA)24
DAWBA diagnoses were classified by psychiatrists. For ADHD and oppositional/conduct disorders, the diagnostic procedure considers the teacher report in addition to the parent report. Full DSM-IV diagnoses were only made for children for whom the parent report had been completed.
Diagnostic Analysis of Non-Verbal Accuracy (DANVA)
8 ≥ 7 errors Research literature
Diagnostic Analysis of Non-Verbal Accuracy (DANVA)26
The DANVA faces subtest comprises 24 photos of child faces, with each face showing one of four emotions: happiness, sadness, anger or fear. The photos are presented to the child for two seconds each and he or she must respond as to whether the person in the photo is happy, sad, angry or afraid.
Social cognition
7.5 and 11 Score ≥ 9 Standard norms Social Communication Disorders Checklist (SCDC)27-
29
11

Criterion Domain ALSPAC variable
Age assessed(years)
Suggested threshold for impairment
Method for deriving
threshold for impairment
Test details
Measure of social-cognitive dysfunction.Autism spectrum disorder
Up to age 11
Any autism spectrum disorder Clinical diagnosis recorded in NHS or PLASC
Autism identified by NHS or PLASC records.30
Teacher reported emotional or behavioural difficulties
7 and 10 ‘Yes’ indicates reported impairment at any time point
Expert opinion Teacher-reported emotional or behavioural difficulties at school
Prenatal alcohol exposure(D)
Prenatal alcohol exposure (PAE)
Prenatal alcohol exposure
Prenatal (reported for each trimester):Data collected at approximately 8, 18 and 32 weeks gestation and 8 weeks postpartum.
N/A Self-reported alcohol consumption during pregnancy including information about dose, frequency and timing.
Timing: First, second or third trimesterDuration: None, one trimester, two trimesters, all trimestersDose/frequency: <1 glass per week At least one glass per week
1-2 glasses daily 3-9 glasses daily >9 glasses daily
The ALSPAC questionnaire defined a glass of alcohol as equivalent to a pub measure of spirits, ½ pint lager/beer, wine glass of wine etc.
‘Binge’ drinking in the last month: 1-2 days3-4 days 5-10 days >10 days everyday
‘Binge drinking’ defined as the consumption of 2 pints of beer, 4 glasses of wine, 4 pub measures of spirits or equivalent on a single occasion. Information on first trimester binge drinking was not available.
12

Criterion Domain ALSPAC variable
Age assessed(years)
Suggested threshold for impairment
Method for deriving
threshold for impairment
Test details
Dose (units): UK standard units
13

Appendix 2: Case-conference sampling strategy for validation of the FASD screening algorithms
In the validation stage of this study, we selected a stratified random sample of 31 participant profiles from the eligible ALSPAC sample to be considered by an expert case conference panel. The sample was stratified to ensure that at least two participant profiles were considered for each of the 24 algorithm specifications and that at least three participants did not meet criteria for FASD under any of the case ascertainment algorithms. By definition, participants who met criteria for the more stringent FASD classifications (i.e. higher levels/duration of PAE or more convergent evidence or severe symptoms for the CNS criteria) also met criteria for the less stringent classifications. Supplemental Figure 2a presents the number of participants in the validation sample who met criteria for each of the case ascertainment algorithms.
Supplemental Figure 2a: Sample for the FASD case ascertainment algorithm validation process. The number in each cell corresponds to the number of participants who met criteria for FASD under the corresponding algorithm specification. Total N = 31.
14

Appendix 3: Comparison of participant characteristics by missing data strategy
To investigate which factors were most influential in accounting for the higher prevalence of FASD in the analysis with multiple imputed data, we compared the patterns of PAE and clinical characteristics across each of the missing data strategies. The relative pattern of sociodemographic, PAE and clinical characteristics of individuals with and without FASD was broadly consistent across analyses. Compared to the complete case and single imputation methods, the multiply imputed data contained a higher proportion of individuals with PAE (up to 10% increase), growth deficiency (up to 4% increase) and CNS impairment in at least three subdomains (up to 13% increase) (see Supplemental Figure 3a).
Supplemental Figure 3a: Proportion of participants who met criteria for each of the main FASD domains in analyses with complete case, single imputation, and multiple imputation methods
15

Supplemental Figure 3b presents a comparison of the proportion of participants with impairment in each CNS subdomain, by missing data strategy. For all CNS subdomains, the multiply imputed data had the highest proportion of participants with impairment. The largest increases, relative to the complete case and singly imputed data, were in the cognitive (up to 10% increase) and adaptive functioning (up to 12% increase) subdomains. Overall, the increased prevalence of impairment across CNS subdomains, combined with the increased prevalence of PAE accounted for the higher prevalence of FASD in the analyses with multiply imputed data, compared to the complete case and single imputation methods.
Supplemental Figure 3b: Proportion of participants who met criteria for impairment in each CNS subdomain in analyses with complete case, single imputation and multiple imputation methods
16

Appendix 4: Multiple imputation method and missing data frequencies
To increase the plausibility of the missing at random (MAR) assumption, we used an inclusive strategy for the imputation model, which included hypothesised risk factors for FASD, sociodemographic variables, clinical characteristics and auxiliary variables. Models that impute subcomponents of composite outcomes have been shown to lead to increased precision and reduced bias, relative to methods that impute the composite outcomes directly.31,32 Therefore, we imputed the missing values of FASD subcomponents (including psychological test scores and PAE measures), and then combined these subcomponent values following imputation, to construct the final FASD status and FASD subtype composite outcomes. We used multiple imputation by chained equations (MICE) in Stata 14.2.33,34 We used 10 cycles to produce each imputed data set and generated 20 imputation sets. Imputation models were specified as binary (logit), ordered categorical (ologit), non-ordered categorical (mlogit) and continuous (regress) for each variable as appropriate. The imputation model specification and missing data frequencies are presented in Supplemental Table 4a.
Supplemental Table 4a: Multiple imputation model specification and missing data frequencies (continued overleaf)
N eligible = 13,495Variable description Categories N
availableMissing
(%)Imputation command
Alcohol dose/frequency during pregnancy
None/<1 glass per week/1-6 glasses per week/7+ glasses per week
12,947 4 ologit
Binge drinking during pregnancy (Questionnaire B)
No/Yes 12,519 7 logit
Binge drinking during pregnancy (Questionnaire C)
No/Yes 8,411 38 logit
Alcohol consumption pre-pregnancy
Never/<1 glass per wk/1+ glasses per week/1-2 glasses daily/3-9 glasses daily/10+ glasses daily
12,602 7 ologit
Alcohol drinking change during pregnancy
No evidence of continued drinking/Had more or No change
11,621 14 logit
Measures of alcohol per week (Questionnaire A)
Continuous 11,375 16 regress
Measures of alcohol per week (Questionnaire C)
Continuous 6,619 51 regress
Short palpebral fissure length
No/Yes 4,370 68 logit
Philtrum shape Smooth/Indentation near nose/Indentation in middle/Indentation near vermillion border/Deep groove from nose to vermillion border/Deep groove to Cupid's bow
4,370 68 ologit
Upper lip fullness Thin/Medium/Thick 4,370 68 ologitLow coordination No/Yes 6,520 52 logitMore than one seizure not due to postnatal insult
No/Yes 11,646 14 logit
Small head circumference (OFC) at birth
No/Yes 8,340 38 logit
Small head circumference (OFC) at age 7
No/Yes 7,449 45 logit
Verbal IQ Continuous 6,830 49 regressPerformance IQ Continuous 6,821 49 regressFull-scale IQ Continuous 6,800 50 regress
17

N eligible = 13,495Variable description Categories N
availableMissing
(%)Imputation command
Low listening comprehension
No/Yes 6,821 49 logit
Low expressive language No/Yes 4,493 67 logitCommunication problems at school
No/Yes 4,100 70 logit
Special educational needs No/Yes 11,312 16 logitLow academic attainment at KS1 and KS2
No/Yes 11,824 12 logit
Low non-word repetition No/Yes 6,809 50 logitLow forward digit span No/Yes 6,702 50 logitLow opposite world task No/Yes 6,657 51 logitLow counting span No/Yes 6,455 52 logitLow stop signal No/Yes 6,426 52 logitLow backwards digit span No/Yes 6,683 50 logitADHD No/Yes 7,952 41 logitSDQ hyperactivity (parent-rated)
No/Yes 9,402 30 logit
SDQ hyperactivity (teacher-rated)
No/Yes 9,145 32 logit
Low selective attention No/Yes 6,638 51 logitOppositional-conduct disorder
No/Yes 7,952 41 logit
SDQ peer problems (parent-rated)
No/Yes 9,414 30 logit
SDQ peer problems (teacher-rated)
No/Yes 9,145 32 logit
SDQ conduct problems (parent-rated)
No/Yes 9,412 30 logit
SDQ conduct problems (teacher-rated)
No/Yes 9,137 32 logit
Significant social cognitive dysfunction
No/Yes 8,678 36 logit
Emotional/behavioural problems at school
No/Yes 9,088 33 logit
Autism No/Yes 13,495 0 -DANVA ≥ 7 errors No/Yes 6,304 53 logitGrowth impairment No/Yes 13,419 1 logitIllicit drug use during pregnancy
No/Yes 12,886 5 logit
Smoking during pregnancy No/Yes 13,304 1 logitMultivitamin supplements during pregnancy
No/Yes 12,898 4 logit
Iron supplements during pregnancy
No/Yes 12,907 4 logit
Zinc supplements during pregnancy
No/Yes 12,906 4 logit
Calcium supplements during pregnancy
No/Yes 12,905 4 logit
Folic acid supplements during pregnancy
No/Yes 12,903 4 logit
Any vitamin supplements during pregnancy
No/Yes 12,908 4 logit
18

N eligible = 13,495Variable description Categories N
availableMissing
(%)Imputation command
Daily calorie intake during pregnancy
Continuous 11,660 14 regress
Retinol (RNI met) No/Yes 11,660 14 logitCalcium(RNI met) No/Yes 11,660 14 logitOmega-3 (RNI met) No/Yes 11,660 14 logitFolate (RNI met) No/Yes 11,660 14 logitRiboflavin (RNI met) No/Yes 11,660 14 logitSelenium (RNI met) No/Yes 11,660 14 logitVitamin B12 (RNI met) No/Yes 11,660 14 logitVitamin C (RNI met) No/Yes 11,660 14 logitVitamin E (RNI met) No/Yes 11,660 14 logitZinc (RNI met) No/Yes 11,660 14 logitIodine (RNI met) No/Yes 11,660 14 logitIron (RNI met) No/Yes 11,660 14 logitMagnesium (RNI met) No/Yes 11,660 14 logitNiacin (RNI met) No/Yes 11,660 14 logitPhosphorous (RNI met) No/Yes 11,660 14 logitPotassium (RNI met) No/Yes 11,660 14 logitSodium RNI met) No/Yes 11,660 14 logitThiamin (RNI met) No/Yes 11,660 14 logitVitamin B6 (RNI met) No/Yes 11,660 14 logitMarital status Married/Not married 12,646 6 logitHome ownership Mortgaged or owned/Council or housing
assoc./Rented (private)/Other12,595 7 mlogit
Maternal social class Professional/Managerial or technical/Skilled non-manual/Skilled manual/Partly skilled/unskilled
9,718 28 ologit
Paternal social class Professional/Managerial or technical/Skilled non-manual/Skilled manual/Partly skilled/unskilled
10,590 22 ologit
Highest educational qualification (maternal)
CSE/Vocational/O Level/A Level/Degree 11,988 11 ologit
Highest educational qualification (paternal)
CSE/Vocational/O Level/A Level/Degree 11,516 15 ologit
Maternal age (years) < 20/20-29/30+ 13,495 0 -Religion (maternal) None/Christian/Other 11,783 13 mlogitUnplanned pregnancy No/Yes 12,620 6 logitTotal life events during pregnancy
Continuous 10,204 24 regress
Weighted total life events during pregnancy
Continuous 10,204 24 regress
Relationship problems during pregnancy
No/Yes 12,801 5 logit
Very affected by relationship problems during pregnancy
No/Yes 12,801 5 logit
Bereavement during pregnancy (any)
No/Yes 12,781 5 logit
Very affected by No/Yes 12,781 5 logit
19

N eligible = 13,495Variable description Categories N
availableMissing
(%)Imputation command
bereavement during pregnancyMajor financial problem during pregnancy
No/Yes 12,763 5 logit
Very affected by major financial problems during pregnancy
No/Yes 12,763 5 logit
Moved house during pregnancy
No/Yes 12,984 4 logit
Very affected by house move during pregnancy
No/Yes 12,769 5 logit
Very affected by illness or accident during pregnancy
No/Yes 12,783 5 logit
Illness or accident during pregnancy
No/Yes 12,783 5 logit
Partner ill during pregnancy
No/Yes 12,765 5 logit
Very affected by partner illness during pregnancy
No/Yes 12,765 5 logit
Child ill during pregnancy No/Yes 12,762 5 logitVery affected by child illness during pregnancy
No/Yes 12,762 5 logit
Depression during pregnancy
No/Yes 12,551 7 logit
Anxiety during pregnancy No/Yes 12,469 8 logitSocial support during pregnancy
Continuous 11,050 18 regress
Any abuse (mother) No/Yes 12,902 4 logitMaternal grandmother had alcoholism
No or Don't Know/Yes 11,716 13 logit
Maternal rs1229984 genotype (>= 1 rare allele)
No/Yes 7,712 43 logit
Maternal impulsivity No/Yes 7,149 47 logit
Perinatal trauma/complications
No/Yes 12,665 6 logit
Postnatal binge drinking (8 weeks)
No/Yes 8,214 39 logit
Postnatal alcohol problems No/Yes 9,680 28 logitParity 0/1/2/>2 12,487 7 ologitGestational age at delivery Continuous 13,495 0 -Previous miscarriage 0/1/≥2 12,539 7 ologitUltrasound at any point in pregnancy
No/Yes 10,858 20 logit
Maternal BMI (pre-pregnancy)
Underweight/Normal/Overweight/Obese 11,140 17 ologit
Child gender Male/Female 13,495 0 -Maternal ethnicity White/Non-White 11,904 12 logit
20

Appendix 5: Characteristics of participants according to data completeness
Supplemental Table 5a: Comparison of the distribution of sociodemographic factors, prenatal exposures and FASD outcome variables among participants with complete data, compared to those who had missing data for one or more of the measures required to ascertain FASD status (continued overleaf)
Eligible sampleN = 13,495
N (%)a
Participants with complete data
N = 223(N [%])
Participants with missing data for one
or more of the measures required to ascertain FASD
statusN = 13,272 (N [%])
SOCIODEMOGRAPHIC FACTORSMaternal age (years) <29 8,480 (62·9) 105 (47·1) 8,375 (63·1)30+ 5,015 (37·2) 118 (52·9) 4,897 (36·9)Maternal ethnicity White 11,600 (97·5) Censoredb
Non-White 304 (2·6)Marital status Not married 3,163 (25·0) 28 (12·6) 3,135 (25·3)Married 9,483 (75·0) 194 (87·4) 9,289 (74·7)Maternal social class Professional 573 (5·9) 12 (5·7) 561 (5·9)Managerial/technical 3,060 (31·5) 74 (35·4) 2,986 (31·4)Skilled non-manual 4,153 (42·7) 96 (45·9) 4,057 (42·7)Skilled manual 763 (7·9) 13 (6·2) 750 (7·9)Partly skilled/unskilled 1,169 (12·0) 14 (6·7) 1,155 (12·2)Paternal social class Professional 1,160 (11·0) 40 (18·5) 1,120 (10·8)Managerial/technical 3,596 (34·0) 74 (34·3) 3,522 (34·0)Skilled non-manual 1,156 (10·9) 33 (15·3) 1,123 (10·8)Skilled manual 3,333 (31·5) 53 (24·5) 3,280 (31·6)Partly skilled/unskilled 1,345 (12·7) 16 (7·4) 1,329 (12·8)Maternal education CSE 2,416 (20·2) 19 (8·5) 2,397 (20·4)Vocational 1,182 (9·9) 13 (5·8) 1,169 (9·9)O Level 4,149 (34·6) 77 (34·5) 4,072 (34·6)A Level 2,706 (22·6) 76 (34·1) 2,630 (22·4)Degree 1,535 (12·8) 38 (17·0) 1,497 (12·7)Paternal educationCSE 3,013 (26·2) 25 (11·3) 2,988 (26·5)Vocational 975 (8·5) 21 (9·5) 954 (8·5)O Level 2,436 (21·2) 49 (22·2) 2,387 (21·1)A Level 3,004 (26·1) 68 (30·8) 2,936 (26·0)Degree 2,088 (18·1) 58 (26·2) 2,030 (18·0)Home ownership statusMortgaged/owned 9,240 (73·4) 205 (92·3) 9,035 (73·0)Council/housing association 2,016 (16·0) 5 (2·3) 2,011 (16·3)Rented (private) 902 (7·2) 5 (2·3) 897 (7·3)Other 437 (3·5) 7 (3·2) 430 (3·5)PRENATAL EXPOSURESPrenatal alcohol use (any)No 4,132 (31·1) 61 (27·4) 4,071 (31·2)Yes 9,135 (68·9) 162 (72·7) 8,973 (68·8)
21

Eligible sampleN = 13,495
N (%)a
Participants with complete data
N = 223(N [%])
Participants with missing data for one
or more of the measures required to ascertain FASD
statusN = 13,272 (N [%])
Prenatal alcohol exposure (max dose/frequency during pregnancy)None 4,171 (32·2) 63 (28·3) 4,108 (32·3)<1 glass per week 5,480 (42·3) 103 (46·2) 5,377 (42·3)1-6 glasses per week 2,872 (22·2) 49 (22·0) 2,823 (22·2)7+ glasses per week 424 (3·3) 8 (3·6) 416 (3·3)Prenatal binge drinkingNo 9,927 (77·8) 180 (80·7) 9,747 (77·7)Yes 2,839 (22·2) 43 (19·3) 2,796 (22·3)Alcohol use before pregnancyNone 1,048 (8·3) 5 (2·2) 1,043 (8·4)≤ 1 - 6 glasses per week 10,144 (80·5) 191 (85·7) 9,953 (80·4)7+ glasses per week 1,410 (11·2) 27 (12·1) 1,383 (11·2)Prenatal smokingNo 9,601 (72·2) 192 (86·1) 9,409 (71·9)Yes 3,703 (27·8) 31 (13·9) 3,672 (28·1)Prenatal illicit drug useNo 12,464 (96·7) Censoredb
Yes 422 (3·3)Prenatal vitamin supplement use (any)No 5,938 (46·0) 95 (42·6) 5,843 (46·1)Yes 6,970 (54·0) 128 (57·4) 6,842 (53·9)Prenatal stressful life eventsMean (SD) 7 (4) 6 (4) 7 (4)Social support scoreMean (SD) 20 (5) 21 (4) 20 (5)Prenatal anxietyNo 9,545 (76·6) 184 (82·5) 9,361 (76·4)Yes 2,924 (23·4) 39 (17·5) 2,885 (23·6)Prenatal depressionNo 9,940 (79·2) 194 (87·0) 9,746 (79·1) Yes 2,611 (20·8) 29 (13·0) 2,582 (20·9)Unplanned pregnancyNo 8,722 (69·1) 187 (83·9) 8,535 (68·9)Yes 3,898 (30·9) 36 (16·1) 3,862 (31·2)CLINICAL CHARACTERISTICSFacial phenotypeShort palpebral fissure lengthNo 3,390 (77·6) 174 (78·0) 3,216 (77·6)Yes 980 (22·4) 49 (22·0) 931 (22·5)Smooth philtrumNo 3,461 (79·2) 166 (74·4) 3,295 (79·5)Yes 909 (20·8) 57 (25·6) 852 (20·5)Thin upper lipNo 3,951 (90·4) 193 (86·6) 3,758 (90·6)Yes 419 (9·6) 30 (13·5) 389 (9·4)Central nervous systemCoordination testNormal 6,204 (95·1) 218 (97·8) 5,986 (95·1)Poor motor coordination 316 (4·9) 5 (2·2) 311 (4·9)Head circumference at birthNormal 8,229 (98·7) Censoredb
22

Eligible sampleN = 13,495
N (%)a
Participants with complete data
N = 223(N [%])
Participants with missing data for one
or more of the measures required to ascertain FASD
statusN = 13,272 (N [%])
Small (<2nd percentile) 111 (1·3)Head circumference at age 7Normal 6,841 (91·8) 200 (89·7) 6,641 (91·9) Small (<2nd percentile) 608 (8·2) 23 (10·3) 585 (8·1)Full scale IQMean (SD) 104 (17) 109 (15) 104 (17)Verbal IQMean (SD) 107 (17) 111 (15) 107 (17)Performance IQMean (SD) 100 (17) 102 (17) 100 (17)Significant difference between IQ subdomainsNo 3,772 (55·5) 119 (53·4) 3,653 (55·5)Yes 3,028 (44·5) 104 (46·6) 2,924 (44·5)WOLD listening comprehension taskNormal 6,627 (97·2) 216 (96·9) 6,411 (97·2)Low performance 194 (2·8) 7 (3·1) 187 (2·8)WOLD expressive languageNormal 4,324 (96·2) Censoredb
Low performance 169 (3·8)Speech and language problems at schoolNo 3,552 (86·6) 217 (97·3) 3,335 (86·0)Yes 548 (13·4) 6 (2·7) 542 (14·0)Special educational needsNo 8,867 (78·4) 195 (87·4) 8,672 (78·2)Yes 2,445 (21·6) 28 (12·6) 2,417 (21·8)Low academic attainment at Key Stage 1 and 2No 10,174 (86·1) 209 (93·7) 9,965 (85·9)Yes 1,650 (14·0) 14 (6·3) 1,636 (14·1)Non-word repetition taskNormal 6,565 (96·4) 212 (95·1) 6,353 (96·5)Low performance 244 (3·6) 11 (4·9) 233 (3·5)Forward digit span taskNormal 6,557 (97·8) 214 (96·0) 6,343 (97·9)Low performance 145 (2·2) 9 (4·0) 136 (2·1)Opposite worlds taskNormal 6,460 (97·0) Censoredb
Low performance 197 (3·0)Counting span taskNormal 6,166 (95·5) 218 (97·8) 5,948 (95·4)Low performance 290 (4·5) 5 (2·2) 284 (4·6)Stop signal taskNormal 6,214 (96·7) 215 (96·4) 5,999 (96·7)Low performance 212 (3·3) 8 (3·6) 204 (3·3)Backwards digit span taskNormal 6,182 (92·5) 204 (91·5) 5,978 (92·5)Low performance 501 (7·5) 19 (8·5) 482 (7·5)ADHDNo 7,786 (97·9) 215 (96·4) 7,571 (98·0)Yes 166 (2·1) 8 (3·6) 158 (2·0)SDQ hyperactivityNo 10,174 (86·4) 195 (87·4) 9,979 (86·4)
23

Eligible sampleN = 13,495
N (%)a
Participants with complete data
N = 223(N [%])
Participants with missing data for one
or more of the measures required to ascertain FASD
statusN = 13,272 (N [%])
Yes 1,604 (13·7) 28 (12·6) 1,576 (13·6)Oppositional-conduct disorderNo 7,703 (96·9) 215 (96·4) 7,488 (96·9)Yes 249 (3·1) 8 (3·6) 241 (3·1)SDQ peer problemsNo 9,594 (81·4) 186 (83·4) 9,408 (81·4)Yes 2,189 (18·6) 37 (16·6) 2,152 (18·6)SDQ conduct problemsNo 9,530 (80·9) 189 (84·8) 9,341 (80·8)Yes 2,249 (19·1) 34 (15·3) 2,215 (19·2)SCDC social communication problemsNo 7,820 (90·1) 206 (92·4) 7,614 (90·1)Yes 858 (9·9) 17 (7·6) 841 (10·0)Emotional and/or behavioural problems at schoolNo 8,245 (90·7) 210 (94·2) 8,035 (90·6)Yes 843 (9·3) 13 (5·8) 830 (9·4)AutismNo 13,414 (99·4) Censoredb
Yes 81 (0·6)DANVA taskNormal 4,891 (77·6) 177 (79·4) 4,714 (77·5)Low performance 1,413 (22·4) 46 (20·6) 1,367 (22·5)GrowthGrowth deficiencyNo 12,310 (91·7) 214 (96·0) 12,096 (91·7)Yes 1,109 (8·3) 9 (4·0) 1,100 (8·3)AUXILIARY VARIABLES Pregnancy/perinatal complicationsNo 8,881 (70·1) 157 (70·7) 8,724 (70·1)Yes 3,784 (29·9) 65 (29·3) 3,719 (29·9)Binge drinking (8 weeks postpartum)No 4,973 (60·5) 152 (69·1) 4,821 (60·3)Yes 3,241 (39·5) 68 (30·9) 3,173 (39·7)Postnatal alcohol problems (maternal self-report and AUDIT 5 to 18 years postpartum)No 7,900 (81·6) 162 (72·7) 7,738 (81·8)Yes 1,780 (18·4) 61 (27·4) 1,719 (18·2)Parity0 5,597 (44·8) 109 (49·8) 5,488 (44·7)1 4,369 (35·0) 72 (32·9) 4,297 (35·0)2 1,781 (14·3) 26 (11·9) 1,755 (14·3)>2 740 (5·9) 12 (5·5) 728 (5·9)Gestational age at delivery (weeks)Mean (SD) 39·5 (1·8) 39·5 (1·5) 39·5 (1·9)Previous miscarriage0 9,861 (78·6) 169 (76·5) 9,692 (78·7)1 2,017 (16·1) 45 (20·4) 1,972 (16·0)≥2 661 (5·3) 7 (3·2) 654 (5·3)Ultrasound scan during pregnancyNo 533 (4·9) 9 (4·0) 524 (4·9)Yes 10,035 (95·1) 214 (96·0) 10,111 (95·1)Maternal BMI (pre-pregnancy)
24

Eligible sampleN = 13,495
N (%)a
Participants with complete data
N = 223(N [%])
Participants with missing data for one
or more of the measures required to ascertain FASD
statusN = 13,272 (N [%])
Underweight 558 (5·0) 9 (4·2) 549 (5·0)Normal 8,280 (74·3) 162 (75·4) 8,118 (74·3)Overweight 1,684 (15·1) 33 (15·4) 1,651 (15·1)Obese 618 (5·6) 11 (5·1) 607 (5·6)Child sexFemale 6,541 (48·5) 101 (45·3) 6,853 (51·6)Male 6,954 (51·5) 122 (54·7) 6,419 (48·4)a Sample size for each variable differs from eligible sample due to missing data. Percentages do not always sum to 100 due to rounding.b Data from these cells are not reported due to a cell count < 5 for one of the strata.Abbreviations: BMI, body mass index; CSE, Certificate of secondary education; DANVA, Diagnostic Analysis of Nonverbal Accuracy; SCDC, Social Communication Disorder Checklist; SD, standard deviation; SDQ, Strengths and Difficulties Questionnaire; WOLD, Weschler Objective Language Dimensions.
25

Appendix 6: FASD screening algorithm performance
Supplemental Table 6a: Test accuracy statistics for ALSPAC FASD screening algorithms (index test), compared to the case-conference panel FASD classification (reference standard). Measure with shortest 0,1 distance highlighted in bold (lower 0,1 values indicate better performance). This is the algorithm that was selected for the primary prevalence analyses.
FASD case-definition TP FP FN TN Na Sens %(95% CI)
Spec %(95% CI)
0,1 Included in prevalence analysis
Liberal CNS; Any PAE 11 17 0 3 31 100 (74 - 100) 15 (5 - 36) 0·85 NoLiberal CNS; Mid PAE 8 11 3 9 31 73 (43 - 90) 45 (26 - 66) 0·61 NoLiberal CNS; Strict PAE 4 6 6 14 30 40 (17 - 69) 70 (48 - 85) 0·67 NoLiberal CNS; Canadian PAE 2 4 9 16 31 18 (5 - 48) 80 (56 - 94) 0·84 NoLiberal CNS; ND-PAE 4 4 7 16 31 36 (15 - 65) 80 (56 - 94) 0·67 NoLiberal CNS; NICE PAE 5 5 6 15 31 45 (21 - 72) 75 (51 - 91) 0·60 NoMid CNS; Any PAE 10 9 1 11 31 91 (62 - 98) 55 (34 - 74) 0·46 Yes - primary analysisMid CNS; Mid PAE 7 6 4 14 31 64 (35 - 85) 70 (48 - 85) 0·47 Yes - sensitivity analysisMid CNS; Strict PAE 4 3 6 17 30 40 (17 - 69) 85 (64 - 95) 0·62 NoMid CNS; Canadian PAE 2 2 9 18 31 18 (5 - 48) 90 (68 - 99) 0·82 NoMid CNS; ND-PAE 3 2 8 18 31 27 (9 - 57) 90 (68 - 99) 0·73 NoMid CNS; NICE PAE 4 3 7 17 31 36 (15 - 65) 85 (64 - 95) 0·65 NoStrict CNS; Any PAE 6 3 5 13 27 55 (28 - 79) 81 (57 - 93) 0·49 NoStrict CNS; Mid PAE 5 1 6 15 27 45 (21 - 72) 94 (72 - 99) 0·55 NoStrict CNS; Strict PAE 3 0 7 16 26 30 (11 - 60) 100 (81 - 100) 0·70 NoStrict CNS; Canadian PAE 2 0 9 16 27 18 (5 - 48) 100 (81 - 100) 0·82 NoStrict CNS; ND-PAE 3 0 8 16 27 27 (10 - 57) 100 (81 -100) 0·73 NoStrict CNS; NICE PAE 3 0 8 16 27 27 (10 - 57) 100 (81 - 100) 0·73 NoRevised CNS; Any PAE 7 6 4 14 31 64 (35 - 85) 70 (48 - 85) 0·47 Yes - sensitivity analysisRevised CNS; Mid PAE 6 3 5 17 31 55 (28 - 79) 85 (64 - 95) 0·48 NoRevised CNS; Strict PAE 3 2 7 18 30 30 (11 - 60) 90 (70 - 97) 0·71 No
26

FASD case-definition TP FP FN TN Na Sens %(95% CI)
Spec %(95% CI)
0,1 Included in prevalence analysis
Revised CNS; Canadian PAE 1 1 10 19 31 9 (2 - 38) 95 (76 - 99) 0·91 NoRevised CNS; ND-PAE 1 1 10 19 31 9 (2 - 38) 95 (76 - 99) 0·91 NoRevised CNS; NICE PAE 2 2 9 18 31 18 (5 - 48) 90 (70 - 97) 0·82 NoAbbreviations: CI, confidence interval; CNS, central nervous system; FN, false negative; FP, false positive; PAE, prenatal alcohol exposure; Sens, sensitivity; Spec, specificity; TN, true negative; TP, true positive.Notes: a N refers to number of participants out of the total case-conference sample (N = 31) with sufficient information available to determine FASD classification for each case-definition category. For example, some participants had missing data on PAE for one or more trimester and, therefore, had insufficient data available to meet Strict PAE case-ascertainment algorithms. 0,1 statistic indicates distance from the top left-hand corner of a Receiver Operating Characteristic (ROC) plot with lower values indicating better test performance, defined as d = √ ([1-Sensitivity]2 + [1-Specificity]2).
27

Supplemental Figure 6a: Receiver operating characteristic (ROC) plot depicting diagnostic accuracy of the FASD screening algorithms, relative to the FASD classifications assigned by the expert case-conference panel. Dashed arrows represent distance from the top left-hand corner of the ROC plot (which would indicate perfect agreement with the case-conference panel) and text boxes indicate the 0,1 statistic for the three FASD screening algorithms with the highest level of agreement with the case-conference panel. Note that the position of the Mid CNS/Mid PAE and Revised CNS/Any PAE algorithms overlap, as they had the same 0,1 value.
0.46
0.47
28

References:
1. LMSgrowth [computer program]. Tyne & Wear, UK: Harlow Printing, Ltd.; 2016.2. Cole TJ, Freeman JV, Preece MA. British 1990 growth reference centiles for weight, height, body mass
index and head circumference fitted by maximum penalized likelihood. Stat Med. 1998;17(4):407-429.3. Fenton Preterm Growth Charts: Research Bulk Calculator [computer program]. Calgary, Alberta:
University of Calgary; 2015.4. Palpebral fissure length z-score calculator [computer program]. Washington.
https://depts.washington.edu/fasdpn/htmls/diagnostic-tools.htm. Accessed May 22, 2018.5. Strömland K, Chen Y, Norberg T, Wennerström K, Michael G. Reference values of facial features in
Scandinavian children measured with a range-camera technique. Scand J Plast Reconstr Surg Hand Surg. 1999;33(1):59-65.
6. Wilson C, Playle R, Toma A, Zhurov A, Ness A, Richmond S. The prevalence of lip vermilion morphological traits in a 15-year-old population. Am J Med Genet A. 2013;161(1):4-12.
7. Henderson SE SD. Movement Assessment Battery for Children manual. Sidcup, UK: The Psychological Corporation; 1992.
8. Odd DE, Lingam R, Emond A, Whitelaw A. Movement outcomes of infants born moderate and late preterm. Acta Paediatr. 2013;102(9):876-882.
9. Donders J. A short form of the WISC-III for clinical use. Psychol Assess. 1997;9(1):15-20.10. Donders J. Using a short form of the WISC-III: sinful or smart? Child Neuropsychol. 2001;7(2):99-
103.11. Donders J, Warschausky S. Validity of a short form of the WISC-III in children with traumatic head
injury. Child Neuropsychol. 1996;2(3):227-232.12. Finch AJ, Ollendick TH, Ginn FW. WISC short forms with mentally retarded children. Am J Ment
Defic. 1973;78(2):144–149.13. Wechsler D. WISC III (Wechsler Intelligence Scale for Children). London: The Psychological
Corporation; 1992.14. ALSPAC. Focus at 8: built files documentation. University of Bristol; 2006.
http://www.bristol.ac.uk/alspac/researchers/access/. Accessed November 26, 2015.15. ALSPAC. PLASC file: data collected from the Pupil Level Annual School Census. University of
Bristol; 2008. http://www.bristol.ac.uk/alspac/researchers/access/. Accessed November 26, 2015.16. Gerton BK, Brown TT, Meyer-Lindenberg A, et al. Shared and distinct neurophysiological components
of the digits forward and backward tasks as revealed by functional neuroimaging. Neuropsychologia. 2004;42(13):1781-1787.
17. Hale JB, Hoeppner JAB, Fiorello CA. Analyzing digit span components for assessment of attention processes. J Psychoeduc Assess. 2002;20(2):128-143.
18. Gathercole SE, Willis CS, Baddeley AD, Emslie H. The children's test of nonword repetition: a test of phonological working memory. Memory. 1994;2(2):103-27.
19. Case R, Kurland DM, Goldberg J. Operational efficiency and the growth of short-term memory span. J Exp Child Psychol. 1982;33(3):386-404.
20. Handley SJ, Capon A, Beveridge M, Dennis I, Evans JSB. Working memory, inhibitory control and the development of children's reasoning. Think Reason. 2004;10(2):175-195.
21. ALSPAC. Focus at 10: built files documentation. University of Bristol; 2005. http://www.bristol.ac.uk/alspac/researchers/access/. Accessed November 26, 2015.
22. Logan GD, Cowan WB, Davis KA. On the ability to inhibit simple and choice reaction time responses: a model and a method. J Exp Psychol Hum Percept Perform. 1984;10(2):276-291.
23. Manly T, Robertson, I.H., Anderson, V., Nimmo-Smith, I. . Test of Everyday Attention for Children (TEA-Ch). Bury St. Edmonds: Thames Valley Test Company Limited; 1999.
24. Goodman R, Ford T, Richards H, Gatward R, Meltzer H. The Development and Well-Being Assessment: description and initial validation of an integrated assessment of child and adolescent psychopathology. J Child Psychol Psychiatry. 2000;41(5):645-655.
25. Goodman R. The Strengths and Difficulties Questionnaire: a research note. J Child Psychol Psychiatry. 1997;38(5):581-586.
26. Nowicki S, Duke MP. Nonverbal receptivity: The Diagnostic Analysis of Nonverbal Accuracy (DANVA). In: Hall JA & Bernieri FJ, editors. Interpersonal Sensitivity: Theory and Measurement. Mahwah, NJ: Lawrence Erlbaum Associates Publishers; 2001:183-198.
27. Skuse DH, James RS, Bishop DVM, et al. Evidence from Turner's syndrome of an imprinted X-linked locus affecting cognitive function. Nature. 1997;387(6634):705-708.
29

28. Skuse DH, Mandy W, Steer C, et al. Social communication competence and functional adaptation in a general population of children: preliminary evidence for sex-by-verbal IQ differential risk. J Am Acad Child Adolesc Psychiatry. 2009;48(2):128-137.
29. Skuse DH, Mandy WPL, Scourfield J. Measuring autistic traits: heritability, reliability and validity of the Social and Communication Disorders Checklist. Br J Psychiatry. 2005;187(6):568-572.
30. Williams E, Thomas K, Sidebotham H, Emond A. Prevalence and characteristics of autistic spectrum disorders in the ALSPAC cohort. Dev Med Child Neurol. 2008;50(9):672-677.
31. Eekhout I, de Vet HC, Twisk JW, Brand JP, de Boer MR, Heymans MW. Missing data in a multi-item instrument were best handled by multiple imputation at the item score level. J Clin Epidemiol. 2014;67(3):335-342.
32. Plumpton CO, Morris T, Hughes DA, White IR. Multiple imputation of multiple multi-item scales when a full imputation model is infeasible. BMC Res Notes. 2016;9:doi: 10.1186/s13104-13016-11853-13105.
33. Royston P. Multiple imputation of missing values: further update of ice, with an emphasis on categorical variables. Stata Journal. 2009;9:466-477.
34. Stata Statistical Software: Release 14 [computer program]. Texas: College Station, StataCorp LP; 2015.
30