appendix - 1.1 part a: structure and form of government ...agmaha.nic.in/audit...
TRANSCRIPT

APPENDIX - 1.1
(Reference: Paragraph 1.1; Page 1)
Part A: Structure and Form of Government Accounts
Structure of Government Accounts: The accounts of the State Government are kept in three parts (i) Consolidated Fund, (ii) Contingency Fund and (iii) Public Account.
Part I: Consolidated Fund All revenues received by the State Government, all loans raised by issue of treasury bills, internal and external loans and all moneys received by the Government in repayment of loans shall form one consolidated fund entitled 'The Consolidated Fund of State' established under Article 266(1) of the Constitution of India.
Part II: Contingency Fund Contingency Fund of the State established under Article 267(2) of the Constitution is in the nature of an imprest placed at the disposal of the Governor to enable him to make advances to meet urgent unforeseen expenditure, pending authorisation by the Legislature. Approval of the Legislature for such expenditure and for withdrawal of an equivalent amount from the Consolidated Fund is subsequently obtained, whereupon the advances from the Contingency Fund are recouped to the Fund.
Part III: Public Account Receipts and disbursements in respect of certain transactions such as small savings, provident funds, reserve funds, deposits, suspense, remittances etc which do not form part of the Consolidated Fund, are kept in the Public Account set up under Article 266(2) of the Constitution and are not subject to vote by the State legislature.

Audit Report (Civil) for the year ended 31 March 2007
176
APPENDIX - 1.1 (Contd.)
(Reference: Paragraph 1.1; Page 1)
PART B: Layout of Finance Accounts Statement Layout
Statement No.1 Presents the summary of transactions of the State Government – receipts and expenditure, revenue and capital, public debt receipts and disbursements etc in the Consolidated Fund, Contingency Fund and Public Account of the State.
Statement No.2 Contains the summarized statement of capital outlay showing progressive expenditure to the end of 2006-07
Statement No.3 Gives financial results of irrigation works, their revenue receipts, working expenses and maintenance charges, capital outlay, net profit or loss, etc.
Statement No.4 Indicates the summary of debt position of the State which includes borrowing from intern debt, Government of India, other obligations and servicing of debt.
Statement No. 5 Gives the summary of loans and advances given by the State Government during the year repayments made, recoveries in arrears etc
Statement No.6 Gives the summary of guarantees given by the Government for repayment of loans etc. raised by the statutory corporations, local bodies and other institutions.
Statement No.7 Gives the summary of cash balances and investments made out of such balances. Statement No.8 Depicts the summary of balances under Consolidated Fund, Contingency Fund and
Public Account as on 31 March 2007 Statement No.9 Shows the revenue and expenditure under different heads for the year 2006-07 as a
percentage of total revenue/expenditure Statement No.10 Indicates the distribution between the charged and voted expenditure incurred during the
year Statement No.11 Indicates the detailed account of revenue receipts by minor heads Statement No.12 Provides accounts of revenue expenditure by minor heads under non–plan and plan
separately and capital expenditure by major head wise Statement No.13 depicts the detailed capital expenditure incurred during and to the end of 2006-07 Statement No.14 Shows the details of investment of the State Government in statutory corporations,
Government companies, other joint stock companies, co-operative banks and societies etc up to the end of 2006-07
Statement No.15 Depicts the capital and other expenditure to the end of 2006-07 and the principal sources from which the funds were provided for that expenditure
Statement No.16 Gives the detailed account of receipts disbursements and balances under heads of account relating to Debt, Contingency Fund and Public Account
Statement No.17 Presents detailed account of debt and other interest bearing obligations of the Government of Maharashtra
Statement No.18 Provides the detailed account of loans and advances given by the Government of Maharashtra, the amount of loan repaid during the year, the balance as on 31 March 2007
Statement No.19 Gives the details of earmarked balances of reserve funds

Appendices
177
APPENDIX - 1.1 (Concld.)
(Reference: Paragraph 1.2; Page 4)
Part C: List of terms used in the Chapter I and basis of their calculation Terms Basis of calculation
Buoyancy of a parameter Rate of Growth of the parameter/GSDP Growth
Buoyancy of a parameter (X) With respect to another parameter (Y)
Rate of Growth of parameter (X)/ Rate of Growth of parameter (Y)
Rate of Growth (ROG) [(Current year Amount /Previous year Amount)-1]* 100
Development Expenditure Social Services + Economic Services Average interest paid by the State Interest payment/[(Amount of previous year’s
Fiscal Liabilities + Current year’s Fiscal Liabilities)2]*100
Interest spread GSDP growth – Average Interest Rate Quantum spread Debt stock *Interest spread Interest received as per cent to Loans Outstanding
Interest Received [(Opening balance + Closing balance of Loans and Advances)2]*100
Revenue Deficit Revenue Receipt – Revenue Expenditure Fiscal Deficit Revenue Expenditure + Capital Expenditure +
Net Loans and Advances – Revenue Receipts – Miscellaneous Capital Receipts
Primary Deficit Fiscal Deficit – Interest payments Balance from Current Revenue (BCR) Revenue Receipts minus all Plan grants and
Non-plan Revenue Expenditure excluding expenditure recorded under the major head 2048 – Appropriation for reduction of Avoidance of debt
Audit Report (Civil) for the year ended 31 March 2007
178
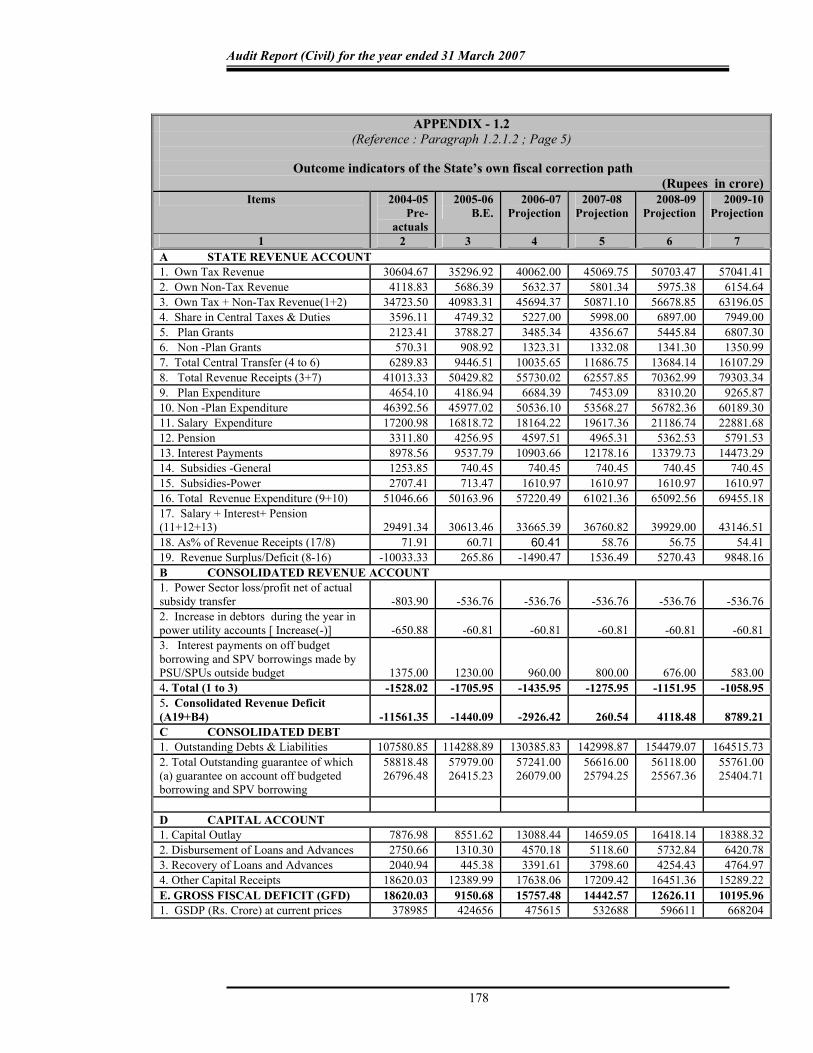
APPENDIX - 1.2
(Reference : Paragraph 1.2.1.2 ; Page 5)
Outcome indicators of the State’s own fiscal correction path (Rupees in crore)
Items 2004-05 Pre-
actuals
2005-06 B.E.
2006-07 Projection
2007-08 Projection
2008-09 Projection
2009-10 Projection
1 2 3 4 5 6 7 A STATE REVENUE ACCOUNT 1. Own Tax Revenue 30604.67 35296.92 40062.00 45069.75 50703.47 57041.41 2. Own Non-Tax Revenue 4118.83 5686.39 5632.37 5801.34 5975.38 6154.64 3. Own Tax + Non-Tax Revenue(1+2) 34723.50 40983.31 45694.37 50871.10 56678.85 63196.05 4. Share in Central Taxes & Duties 3596.11 4749.32 5227.00 5998.00 6897.00 7949.00 5. Plan Grants 2123.41 3788.27 3485.34 4356.67 5445.84 6807.30 6. Non -Plan Grants 570.31 908.92 1323.31 1332.08 1341.30 1350.99 7. Total Central Transfer (4 to 6) 6289.83 9446.51 10035.65 11686.75 13684.14 16107.29 8. Total Revenue Receipts (3+7) 41013.33 50429.82 55730.02 62557.85 70362.99 79303.34 9. Plan Expenditure 4654.10 4186.94 6684.39 7453.09 8310.20 9265.87 10. Non -Plan Expenditure 46392.56 45977.02 50536.10 53568.27 56782.36 60189.30 11. Salary Expenditure 17200.98 16818.72 18164.22 19617.36 21186.74 22881.68 12. Pension 3311.80 4256.95 4597.51 4965.31 5362.53 5791.53 13. Interest Payments 8978.56 9537.79 10903.66 12178.16 13379.73 14473.29 14. Subsidies -General 1253.85 740.45 740.45 740.45 740.45 740.45 15. Subsidies-Power 2707.41 713.47 1610.97 1610.97 1610.97 1610.97 16. Total Revenue Expenditure (9+10) 51046.66 50163.96 57220.49 61021.36 65092.56 69455.18 17. Salary + Interest+ Pension (11+12+13) 29491.34 30613.46 33665.39 36760.82 39929.00 43146.51 18. As% of Revenue Receipts (17/8) 71.91 60.71 60.41 58.76 56.75 54.41 19. Revenue Surplus/Deficit (8-16) -10033.33 265.86 -1490.47 1536.49 5270.43 9848.16 B CONSOLIDATED REVENUE ACCOUNT 1. Power Sector loss/profit net of actual subsidy transfer -803.90 -536.76 -536.76 -536.76 -536.76 -536.76 2. Increase in debtors during the year in power utility accounts [ Increase(-)] -650.88 -60.81 -60.81 -60.81 -60.81 -60.81 3. Interest payments on off budget borrowing and SPV borrowings made by PSU/SPUs outside budget 1375.00 1230.00 960.00 800.00 676.00 583.00 4. Total (1 to 3) -1528.02 -1705.95 -1435.95 -1275.95 -1151.95 -1058.95 5. Consolidated Revenue Deficit (A19+B4) -11561.35 -1440.09 -2926.42 260.54 4118.48 8789.21 C CONSOLIDATED DEBT 1. Outstanding Debts & Liabilities 107580.85 114288.89 130385.83 142998.87 154479.07 164515.73 2. Total Outstanding guarantee of which (a) guarantee on account off budgeted borrowing and SPV borrowing
58818.4826796.48
57979.0026415.23
57241.0026079.00
56616.00 25794.25
56118.0025567.36
55761.0025404.71
D CAPITAL ACCOUNT 1. Capital Outlay 7876.98 8551.62 13088.44 14659.05 16418.14 18388.32 2. Disbursement of Loans and Advances 2750.66 1310.30 4570.18 5118.60 5732.84 6420.78 3. Recovery of Loans and Advances 2040.94 445.38 3391.61 3798.60 4254.43 4764.97 4. Other Capital Receipts 18620.03 12389.99 17638.06 17209.42 16451.36 15289.22 E. GROSS FISCAL DEFICIT (GFD) 18620.03 9150.68 15757.48 14442.57 12626.11 10195.96 1. GSDP (Rs. Crore) at current prices 378985 424656 475615 532688 596611 668204

Appendices
179
APPENDIX - 1.3
(Reference : Paragraph 1.2; Page 3)
Summarised financial position of the Government of Maharashtra as on 31 March 2007 (Rupees in crore) (Rupees in crore) As on 31.03.2006 LIABILITIES As on 31.03.2007
88847.39* Internal Debt 98601.89 19715.97 Market Loans bearing interest 20883.23
22.68 Market Loans not bearing interest 23.15 2530.94 Loans from LIC 2336.10
66577.80 Loans from other institutions 75359.41 -- Ways and Means Advances/Overdrafts
from Reserve Bank of India --
8447.04 Loans and Advances from Central Government 8542.30 137.08 Pre 1984-85 Loans 6.73
1116.10 Non-Plan Loans 112.03 6987.41 Loans for State Plan Schemes 8204.81
9.25 Loans for Central Plan Schemes 8.42 197.20 Loans for Centrally Sponsored Plan Schemes 210.31
-- Ways and Means Advances -- 711.42 Contingency Fund 94.64
8770.73 Small Savings, Provident funds etc. 9411.05* 13375.34 Deposits 15089.56 23050.54 Reserve Funds 25394.21
3270.23 Suspense and Miscellaneous Balances 3555.73 1360.69 Remittances 45.64*
147833.38 TOTAL 160735.02 As on 31.03.2006 ASSETS As on 31.03.2007
70175.22 Gross Capital Outlay on Fixed Assets 72264.60 31917.62 Investments in shares of Companies,
Corporations etc. 37531.49
38257.60 Other Capital Outlay 34733.11 15362.51 Loans and Advances 17633.43
5210.29 Loans for Power Projects 5231.43 9446.46 Other Development Loans 11602.73 705.76 Loans to Government servants 799.27 12.45 Advances 12.99
5038.30 Cash 7183.90 4.05 Cash in Treasuries 3.75
(-) 128.43 Deposits with Reserve Bank -151.59 125.85 Local remittances 136.90
8.16 Departmental Cash Balance 15.78 0.43 Permanent Advances 0.43
3209.72 Cash Balance Investments 4662.04 1818.52 Investment of earmarked balances 2516.59
57244.90 Deficit on Government Accounts 63640.21 3841.56 (i) Revenue Deficit of the Current Year -810.10
-- (ii) Pro forma correction 8002.80 797.38 (iii) Other adjustments -797.39
52605.96 Accumulated deficit upto 31 March 2005 57244.90 -- Capital Receipts -0.11
147833.38 TOTAL 160735.02
* Lower Rounding

Audit Report (Civil) for the year ended 31 March 2007
180
APPENDIX - 1.4
(Reference: Paragraph 1.2; Page 3)
Abstract of Receipts and Disbursements for the year 2006-07 (Rupees in crore) (Rupees in crore)
Receipts Disbursements 2005-06
(1)
(2)
(3)
2006-07
(4)
2005-06
(5)
(6)
Non- Plan (7)
Plan
(8)
Total
(9)
2006-07
(10) Section-A : Revenue
48438.29∗ I. Revenue receipts
62195.38 52279.85 I. Revenue expenditure
53150.20 8235.08 61385.28 61385.28
33540.24 Tax revenue 40099.25 21696.50 General services 24821.32 284.97 25106.29 19917.19 Social services 18254.73 5304.13 23558.86
5935.05 Non-tax revenue
7518.24 10761.83 Education, Sports, Art and Culture
11544.80 771.69 12316.49
2124.03 Health and Family Welfare
1737.86 515.69 2253.55
4982.00 State’s share of Union Taxes
6022.76 2301.52 Water Supply, Sanitation, Housing and Urban Development
1381.69 2184.27 3565.96
22.45 Information and Broadcasting
22.78 0.80 23.58
1582.00 Non-Plan grants
3489.00 1652.80 Welfare of Scheduled Castes, Scheduled Tribes and Other Backward Classes
877.00 1027.46 1904.46
272.93 Labour and Labour Welfare
243.75 74.77 318.52
1255.33 Grants for State Plan Scheme
3919.12 2749.31* Social Welfare and Nutrition
2414.51 717.11 3131.62
32.32 Others 32.34 12.34 44.68 9314.71 Economic Services 9107.99 2595.05 11703.04 2732.22 Agriculture and
Allied Activities 2669.35 693.28 3362.63
1143.67 Grants for Central and Centrally sponsored Plan Schemes
1147.01
2017.92 Rural Development 1897.84 692.47 2590.31
21.23 Special Areas Programmes
0.24 32.60 32.84
1318.37 Irrigation and Flood Control
1269.37 244.66 1514.03
1993.13 Energy 2145.11 456.19 2601.30 457.90 Industry and
Minerals 366.82 199.08 565.90
554.40 Transport 611.70 85.02 696.72 13.00 Science,
Technology and Environment
-- 24.51 24.51
206.54 General Economic Services
147.56 167.24 314.80
1351.45 Grants-in-aid and Contributions
966.16 50.93 1017.09
3841.56 II Revenue deficit carried over to Section B
-- -- II Revenue Surplus carried over to Section B
810.10
∗ Lower rounding

Appendices
181
APPENDIX - 1.4 (Contd.)
(1) (2) (3) (4) (5) (6) (7) (8) (9) (10) Section B
2123.01 III. Opening Cash balance including Permanent Advances and Cash Balance Investment
5038.30 -- III. Opening Overdraft from RBI
--
-- IV. Miscellaneous Capital receipts
0.11 10078.44 IV Capital Outlay 2109.90 7982.28 10092.18 10092.18
70.74 General Services 81.29 161.34 242.63 1247.19 Social Services (-)2.14 874.29 872.15 12.30 Education, Sports,
Art and Culture -- 112.46 112.46
90.50 Health and Family Welfare
-- 76.23 76.23
901.63 Water Supply, Sanitation, Housing and Urban Development
0.01 29.15 29.16
207.82 Welfare of Scheduled Castes, Scheduled Tribes and Other Backward Classes
-- 593.37 593.37
1.14 Social Welfare and Nutrition
(-)2.15 4.35 2.20
33.80 Others -- 58.73 58.73
8760.51 Economic Services 2030.75 6946.65 8977.40
325.87 Agriculture and Allied Activities
156.77 615.71 772.48
463.76 Rural Development -- 476.15 476.15 42.61 Special Area
Programme -- 41.42 41.42
6064.321 Irrigation and Flood Control
1648.33 3674.64 5322.97
562.19 Energy -- 800.37 800.37 129.74 Industry and
Minerals -- 11.44 11.44
1084.83 Transport 148.77 1326.65 1475.42 87.15 General Economic
Services 76.88 0.18 77.06
0.04 Science Technology and Environment
-- 0.09 0.09
551.25 V. Recoveries of Loans and Advances
50.70 4261.62 V Loans and Advances disbursed
2321.62
272.49 From Power Projects
124.08 1654.26 For Power Projects 145.23
118.12 From Government Servants
132.54 206.64 To Government Servants
226.04
160.64 From others (-)205.92 2400.72 To Others 1950.35 -- VI. Revenue
surplus brought down
810.10 3841.56 VI Revenue deficit brought down
--
Audit Report (Civil) for the year ended 31 March 2007
182
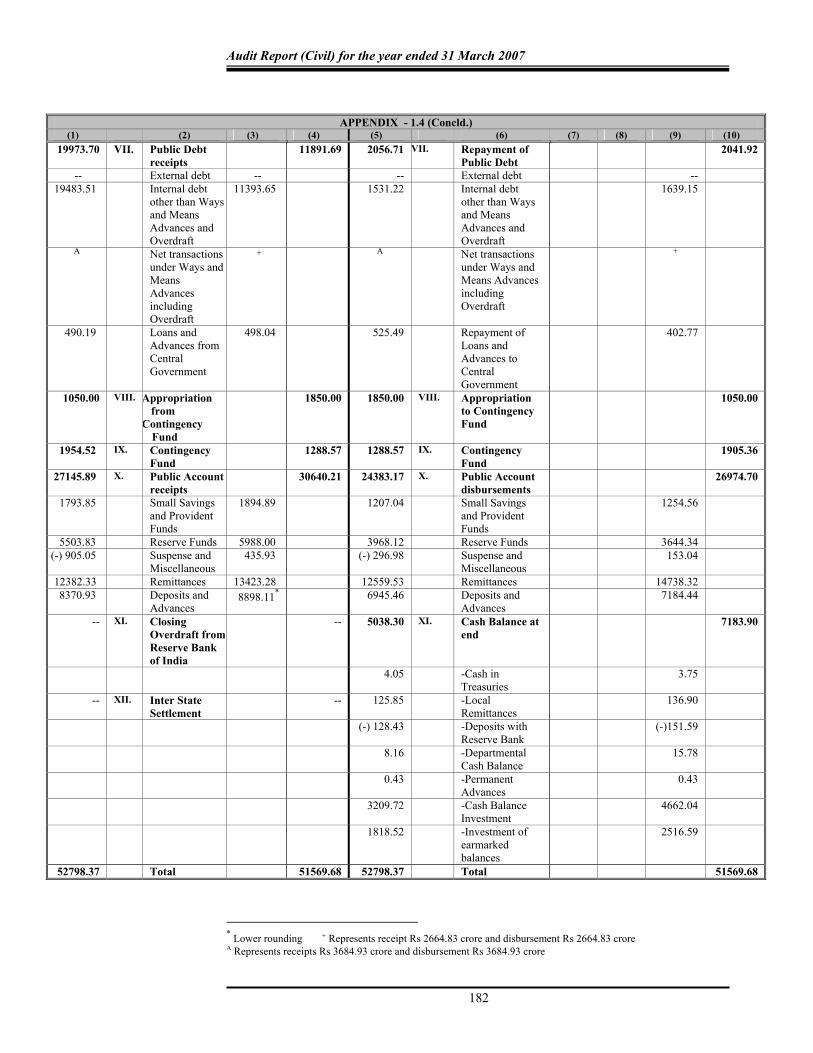
APPENDIX - 1.4 (Concld.)
(1) (2) (3) (4) (5) (6) (7) (8) (9) (10) 19973.70 VII. Public Debt
receipts 11891.69 2056.71 VII. Repayment of
Public Debt 2041.92
-- External debt -- -- External debt -- 19483.51 Internal debt
other than Ways and Means Advances and Overdraft
11393.65 1531.22 Internal debt other than Ways and Means Advances and Overdraft
1639.15
A Net transactions under Ways and Means Advances including Overdraft
+ A Net transactions under Ways and Means Advances including Overdraft
+
490.19 Loans and Advances from Central Government
498.04 525.49 Repayment of Loans and Advances to Central Government
402.77
1050.00 VIII. Appropriation from
Contingency Fund
1850.00 1850.00 VIII. Appropriation to Contingency Fund
1050.00
1954.52 IX. Contingency Fund
1288.57 1288.57 IX. Contingency Fund
1905.36
27145.89 X. Public Account receipts
30640.21 24383.17 X. Public Account disbursements
26974.70
1793.85 Small Savings and Provident Funds
1894.89 1207.04 Small Savings and Provident Funds
1254.56
5503.83 Reserve Funds 5988.00 3968.12 Reserve Funds 3644.34 (-) 905.05 Suspense and
Miscellaneous 435.93 (-) 296.98 Suspense and
Miscellaneous 153.04
12382.33 Remittances 13423.28 12559.53 Remittances 14738.32 8370.93 Deposits and
Advances 8898.11* 6945.46 Deposits and
Advances 7184.44
-- XI. Closing Overdraft from Reserve Bank of India
-- 5038.30 XI. Cash Balance at end
7183.90
4.05 -Cash in Treasuries
3.75
-- XII. Inter State Settlement
-- 125.85 -Local Remittances
136.90
(-) 128.43 -Deposits with Reserve Bank
(-)151.59
8.16 -Departmental Cash Balance
15.78
0.43 -Permanent Advances
0.43
3209.72 -Cash Balance Investment
4662.04
1818.52 -Investment of earmarked balances
2516.59
52798.37 Total 51569.68 52798.37 Total 51569.68
* Lower rounding + Represents receipt Rs 2664.83 crore and disbursement Rs 2664.83 crore A Represents receipts Rs 3684.93 crore and disbursement Rs 3684.93 crore

Appendices
183
APPENDIX - 1.5
(Reference: Paragraph 1.2; Page 3)
Sources and Application of funds (Rupees in crore)
2005-06 Sources 2006-07 48438.29 1 Revenue receipts 62195.38
-- 2 Capital receipts 0.11 551.25 3 Recoveries of Loans and Advances 50.70
17916.99 4 Increase in Public debt other than overdraft 9849.77 2760.11 5 Net receipts from Public account 3668.12
586.80 Increase in Small Savings and Provident Funds 640.33 1425.47 Increase in Deposits and Advances 1713.67 1535.71 Increase in Reserve funds 2343.66
(-) 177.20 Net effect of Remittances (-)1315.04 (-) 610.67 Net effect of Suspense and Miscellaneous
transactions 285.50
(-) 797.38 6 Adjustment closed to Government Accounts 797.39 -- 7 Decrease in closing cash balance --
68869.26 Total 76561.47 Application
52279.85 1 Revenue expenditure 61385.28 10078.44 2 Capital expenditure 10092.18
4261.62 3 Lending for development and other purposes 2321.62 (-) 665.94 4 Net effect of contingency fund transactions 616.79
2915.29 5 Increase in closing cash balance 2145.60 68869.26 Total 76561.47
Explanatory notes for Appendix 1.3, 1.4 and 1.5 1. The abridged accounts in the foregoing statements have to be read with comments and
explanations in the Finance Accounts. 2. Government accounts being mainly on cash basis, the deficit on Government account, as
shown in Appendix 1.3, indicates the position on cash basis, as opposed to accrual basis in commercial accounting. Consequently, items payable or receivable or items like depreciation or variation in stock figures etc, do not figure in the accounts.
3. Suspense and Miscellaneous balances include cheques issued but not paid, payments made on behalf of the State and other pending settlement etc.
4. There was a difference of Rs 4.97 crore (credit) between the figures reflected in the accounts and that intimated by the RBI under “Deposit with Reserve Bank”. The difference is under reconciliation (August 2007).

Audit Report (Civil) for the year ended 31 March 2007
184
APPENDIX - 1.6 (Reference: Paragraph 1.2; Page 3)
Time series data on State Government Finances
(Rupees in crore) 2002-03 2003-04 2004-05 2005-06 2006-07
(1) (2) (3) (4) (5) (6) Part A: Receipts 1. Revenue Receipts 31103.05 34370.52 41013.33 48438.29 62195.38 (i) Tax Revenue 22799.46(73) 25162.16(73) 30605.76(75) 33540.24(69) 40099.25(64) Taxes on Agricultural Income -- -- -- -- -- Taxes on Sales, Trade, etc. 13488.34(59) 15325.95(61) 18816.72(62) 19676.73(59) 24130.72(60) State Excise 1938.68(9) 2324.42(9) 2218.87(7) 2823.85(8) 3300.70(8) Taxes on Vehicles 941.23(4) 1205.97(5) 1177.15(4) 1309.11(4) 1841.06(5) Stamps and Registration fees 2823.11(12) 3354.06(13) 4116.49(13) 5265.86(16) 6415.72(16) Land Revenue 386.41(2) 360.49(2) 360.72(1) 428.97(1) 484.17(1) Other Taxes 3221.69(14) 2591.27(10) 3915.81(13) 4035.72(12) 3926.88(10) (ii) Non-tax Revenue 4517.47(15) 3548.94(10) 4118.83(10) 5935.05(12) 7518.24(12) (iii) State’s share of Union taxes and duties 2279.96(7) 3389.49(10) 3595.02(9) 4982.00(11) 6022.76(10) (iv) Grants-in-aid from GOI 1506.16(5) 2269.93(7) 2693.72(6) 3981.00(8) 8555.13(14) 2. Miscelleneous Capital Receipts -- -- -- -- 0.11 3. Total revenue and Non-debt capital receipts (1 + 2)
31103.05 34370.52 41013.33 48438.29 62195.49
4. Recoveries of Loans and Advances 469.16 482.16 2040.94 551.25 50.70 5. Public Debt Receipts 9758.42 22381.11 22188.84 19973.70 11891.69 Internal Debt (excluding Ways and Means Advances and Overdrafts)
8796.64 21128.70 20387.16 19483.51 11393.65
Net transactions under Ways and Means Advances and Overdraft
-- -- -- -- --
Loans and Advances from Government of India$
961.78 1252.41 1801.68 490.19 498.04
6. Appropriation from Contingency Fund 450.00 850.00 300.00 1050.00 1850.00 7. Inter State settlement -- -- -- -- -- 8. Total receipts in the Consolidated Fund (3+4+5+6+7)
41780.63 58083.79 65543.11 70013.24 75987.88
9. Contingency Fund Receipts 465.80 886.85 347.50 1954.52 1288.57 10. Public Accounts receipts 44867.16 24452.02 27991.38 27145.89 30640.21 11. Total receipts of the State (8+9+10) 87113.59 83422.66 93881.99 99113.65 107916.66 Part B: Expenditure/Disbursement 12. Revenue expenditure (Per cent of 15) 40474.30(88) 42680.06*(81) 51046.66(83) 52279.85(78) 61385.28(83) Plan 3244.41(8) 3544.70(8) 4654.10(9) 5231.70(10) 8235.08(13) Non-Plan 37229.89(92) 39135.36(92) 46392.56(91) 47048.15(90) 53150.20(87) General Services (incl. Interests payments) 17946.81(44) 19820.08(46) 22271.16(44) 21696.50(41) 25106.29(41) Social Services 14217.83(35) 15990.32(38) 17548.71(34) 19917.19(38) 23558.86(38) Economic Services 7635.77(19) 5883.00(14) 10381.12(20) 9314.71(18) 11703.04(19) Grants-in-aid and Contribution 673.89(2) 986.66(2) 845.67(2) 1351.45(3) 1017.09(2) 13. Capital Expenditure (Per cent of 15) 3683.68(8) 8199.14(15) 7876.98(13) 10078.44(16) 10092.18(14) Plan 1645.08(45) 3735.08(46) 5021.31(64) 6800.45(67) 7982.28(79) Non-Plan 2038.60(55) 4464.06(54) 2855.67(36) 3277.99(33) 2109.90(21) General Services 39.38(1) 48.63(1) 48.02(1) 70.74(1) 242.63(2) Social Services 159.28(4) 282.56(3) 283.89(3) 1247.19(12) 872.15(9) Economic Services 3485.02(95) 7867.95(96) 7545.07(96) 8760.51(87) 8977.40(89)

Appendices
185
APPENDIX - 1.6 (Concld.)
(1) (2) (3) (4) (5) (6) 14. Disbursement of Loans and Advances (Per cent of 15)
1704.08(4) 1901.99(4) 2750.66(4) 4261.62(6) 2321.62(3)
15. Total (12+13+14) 45862.06 52781.19 61674.30 66619.91 73799.08 16. Repayments of Public Debt 1355.31 8253.17 10993.95 2056.71 2041.92 Internal Debt (excluding Ways and Means Advances and Overdrafts)
233.22 410.92 1611.15 1531.22 1639.15
Net transactions under Ways and Means Advances and Overdrafts
-- -- -- -- --
Loans and Advances from Government of India$
1122.09 7842.25 9382.80 525.49 402.77
17. Appropriation to Contingency Fund 450.00 850.00 300.00 1850.00 1050.00 18. Total disbursement out of Consolidated Fund (15+16+17)
47667.37 61884.36 72968.25 70526.62 76891.00
19. Contingency Fund disbursements 486.85 897.50 404.52 1288.57 1905.36 20. Public Account disbursements 38221.87 19637.06 20825.15 24383.17 26974.70 21. Total disbursement by the State (18+19+20)
86376.09 82418.92 94197.92 96198.36 105771.06
Part C: Deficits 22. Revenue Deficit(-)/Surplus (+) (1-12) (-)9371.25 (-)8309.54 (-)10033.33 (-)3841.56 810.10 23. Fiscal Deficit (-)/Surplus (+) (3+4-15) (-)14289.85 (-)17928.51 (-)18620.03 (-)17630.37 (-)11552.89 24. Primary Deficit (-)/Surplus (+) (23-25) (-)7160.10 (-)9593.03 (-)9641.47 (-)8283.13 102.78 Part D: Other data 25. Interest Payments (included in revenue expenditure)
7129.75 8335.48 8978.56 9347.24 11655.67
26. Arrears of Revenue (Percentage of Tax and non-tax Revenue Receipts)
5879.01(22) 6866.45(24) 12584.30(36) 15347.47(39) 30836.47(65)
27. Financial Assistance to local bodies etc. 5258.55 18516.03 21218.24 27387.69 26852.22 28. Ways and Means Advances/Overdraft availed (days)
171/154 168/39 68/12 21/20 42/-
29. Interest on WMA/Overdraft 42.88 34.12 9.23 9.04 3.12 30. Gross State Domestic Product (GSDP) 295191c 333145c 371878c 432413c 497172D 31. Outstanding Debt (year end) 54054.61 68182.55 79377.44 97294.43 107144.20 32. Outstanding guarantees (year end)A 2453.50 70125.72 60870.90 66238.82 63509.49 33. Maximum amount guaranteed (year end) 37521.19 82228.45 80183.53 86725.14 87777.56 34. Number of incomplete projects 133 146 153 158 96 35. Capital blocked in incomplete projects 3829.26 4224.89 4826.19 5239.74 4039.37
$ Includes Ways and Means Advances from GOI c Based on Economic Survey of Maharashtra DAdvance estimates as furnished by Directorate of Economics and Statistics, Government of Maharashtra A As per Finance Accounts of respective year

Audit Report (Civil) for the year ended 31 March 2007
186
APPENDIX - 1.7
(Reference: Paragraph 1.2.1.4; Page 6)
Statement showing Excess of expenditure over the projections in the CFS for the year as a whole
Department Purpose of Expenditure Major Heads of Account
Range of Percentage of variation between actual monthly spending and CFs projected to Legislature
Forestry and Wildlife 2406 61 to 105 Revenue and Forests Capital Outlay on Forestry and
Wildlife 4406 50 to 727
Housing 2216 32 to 553 Roads and Bridges 3054 42 to 570 Public Works 2059 32 to 294 Capital Outlay on Roads and Bridges 5054 31 to 296 Capital Outlay on Housing 4216 45 to 170
Public Works
Capital Outlay on Roads and Bridges 4059 27 to 909 Major and Medium Irrigation 2701 528 Minor Irrigation 2702 106 to 4795 Capital Outlay on Major and Medium Irrigation Projects
4701 38 to 370
Capital Outlay on Minor Irrigation 4702 26 to 2310
Water Resources
Capital Outlay on Power Projects 4801 25 to 228

Appendices
187
APPENDIX - 1.8
(Reference: Paragraph 1.5.5; Page 19)
Statement showing department-wise breakup of outstanding Utilisation Certificates (Grants) Sr. No.
Department Number of certificates
Amount (Rupees in
crore) 1 Agriculture, Animal Husbandry, Dairy Development and Fisheries 13002 533.43 2 Co-operation, Marketing and Textiles 2084 206.56 3 Employment and Self-employment 19 26.15 4 Environment 1 0.09 5 Finance 31 33.42 6 Food, Civil Supplies and Consumer Protection 36 0.21 7 General Administration 251 162.15 8 Higher and Technical Education 1608 1185.19 9 Home 1841 927.70
10 Housing 30 6.14 11 Industries, Energy and Labour 114 422.42 12 Irrigation 7 0.05 13 Law and Judiciary 544 3.21 14 Medical Education and Drugs 317 33.70 15 Planning 4494 914.14 16 Public Health 3830 516.46 17 Public Works 378 120.24 18 Revenue and Forests 10270 887.94 19 Rural Development and Water Conservation 8267 2164.98 20 School Education and Sports 11413 5981.57 21 Social Justice, Cultural Affairs, and Special Assistance 31731 1200.21 22 Tribal Development 4078 927.41 23 Urban Development 1721 1772.80 24 Water Resources 47 6.39 25 Water Supply and Sanitation 2545 1079.14 26 Women and Child Development 3218 370.80
Total 101877 19482.50 Department-wise break up of outstanding Utilisation certificates (Loans)
1 Agriculture, Animal Husbandry, Dairy Development and Fisheries 66 10.92 2 Co-operation, Marketing and Textiles 353 381.96 3 Industries, Energy and Labour 2011 32.53 4 Revenue and Forests 501 353.14 5 Rural Development and Water Conservation 83 4.13 7 Social Justice, Cultural Affairs, and Special Assistance 208 23.99 8 Tribal Development 168 111.98 9 Urban Development 284 48.81
Total 3674 967.46 Grand total (Grants + Loans) 105551 20449.96

Audit Report (Civil) for the year ended 31 March 2007
188
APPENDIX - 1.9 (Reference: Paragraph 1.5.6; Page 19)
Statement showing department-wise break up of non-submission of accounts
Year(s) for which information was awaited Name of Department
1993-94 to 1995-96, 1996-97 to 2003-04, 2005-06 and 2006-07
Environment
1994-95 to 1995-96 and 1998-99 to 2003-04 and 2006-07
Food, Civil Supplies and Consumer Protection
1993-94 to 2002-03, 2005-06 to 2006-07 Home
1999-2000 to 2003-04, 2005-06 and 2006-07 Industries, Energy and Labour
1999-2000 to 2003-04, 2005-06 Law and Judiciary
1994-95 to 2003-04, 2005-06 and 2006-07 Medical Education and Drugs
1997-98 and 1999-2000 to 2005-06 and 2006-07 Planning
1991-92 to 2003-04, 2005-06 and 2006-07 Tribal Development
1993-94 to 2005-06 and 2006-07 Women and Child Welfare

Appendices
189
APPENDIX - 1.10
(Reference: Paragraph 1.5.7; Page 19)
Statement showing performance of the autonomous bodies Sr. No.
Name of body Period of entrustment
Year upto which
accounts were
rendered
Period upto which
Separate Audit
Report is issued
Placement of SAR in
the Legislature
Delay in submission of
accounts
Period of delay
(1) (2) (3) (4) (5) (6) (7) (8) 1 Maharashtra
Housing and Area Development Authority, Mumbai
01.04.2003 to
31.03.2008
2004-05 2003-04 1999-2000 and 2000-01
March 2007
2004-05 Annual Accounts received between February 2006 and August 2006
Delay for about one year two months
2. Slum Rehabilitation Authority, Mumbai
1.4.2001 to
31.03.2006
1996-97 to 1998-
99
1996-97 to 1998-99
First Audit 1996-97 to 1998-99 Annual Accounts received in April 2003
Delay for about one year
3. Maharashtra State Khadi and Village Industries Board, Mumbai
01.04.2002 to
31.03.2007
2005-06 2004-05 2003-04 July 2007
2005-06 Accounts adopted on 20-4-2007
Delay for about ten months
4. Maharashtra Jeevan Pradhikaran, Mumbai
01.04.2002 to
31.03.2007
2005-06 2004-05 2003-04 December
2006
2005-06 Adopted Accounts received on 10-4-2007
Delay for about ten months
5. Mumbai Metropolitan Region Development Authority, Mumbai
01.04.2004 to
31.03.2009
-- 2005-06 No provision for
placement
-- --
6. Maharashtra State Commission for Women, Mumbai
01.04.2003 to
31.03.2008
2003-04 2001-02 and 2002-03
No provision for
placement
2003-04 Accounts received in first week of April 2007
Delay for about two years ten months
7. Maharashtra Maritime Board, Mumbai
01.04.2006 to
31.03.2011
2005-06 2004-05 1996-97 to 2003-04
April 2006
2005-06 Adopted accounts received on 8-5-2007
Delay for about ten months

Audit Report (Civil) for the year ended 31 March 2007
190
APPENDIX - 1.10 (Concld.)
(1) (2) (3) (4) (5) (6) (7) (8) 8. Maharashtra
Krishna Valley Development Corporation, Pune
01.04.2006 to
31.03.2011
2005-06 2004-05 2003-04 July 2006
2005-06 Adopted accounts received in December 2006
Delay for about six months
9. Konkan Irrigation Development Corporation, Thane
01.04.2003 to
31.03.2008
-- 2005-06 2002-03 March 2005
-- --
10. Vidharbha Irrigation Development Corporation, Nagpur
01.04.2002 to
31.03.2007
2004-05 Nil Not placed Accounts were received late due to pending approval of Governing body
Delay ranged over one year
11. Tapi Irrigation Development Corporation, Jalgaon
01.04.2003 to
31.03.2008
2004-05 2002-03 1999-2000, 2000-01
July 2005 2001-02
December 2006
Accounts were received late due to pending approval of Governing body
Delay ranged over one year
12. Godavari Marathwada Irrigation Development Corporation, Aurangabad
01.04.2004 to
31.03.2009
2005-06 2001-02 1998-99, 1999-2000
March 2005 2000-01
March 2006
Accounts were received late due to pending approval of Governing body
Delay ranged over six months to one year
13. Maharashtra Pollution Control Board, Mumbai
01.04.2003 to
31.03.2008
2003-04 and
2004-05
-- First Audit 2003-04 and 2004-05 Adopted accounts received in March 2007
Two years nine months delay for 2003-04 and one year nine months delay for 2004-05

Appendices
191
APPENDIX - 1.11
(Reference: Paragraph 1.6; Page 19 )
Statement showing cases of misappropriation reported upto March 2007 and pending finalization as on 31 May 2007 (Rupees in lakh)
Reported upto March 2003
Reported during 2003-04
Reported during 2004-05
Reported during 2005-06
Reported during 2006-07
Total Sr. No.
Name of Department
Cases Amounts Cases Amounts Cases Amounts Cases Amounts Cases Amounts Cases Amounts 1 Agriculture,
Animal Husbandry, Dairy Development and Fisheries
65 45.08 65 45.08
2 Finance 7 125.26 1 40.07 8 165.34 3 Food, Civil
Supplies and Consumer Protection
11 30.85 11 30.85
4 General Administration
2 1.35 2 1.35
5 Housing 1 0.07 1 0.07 6 Higher and
Technical Education
3 30.83 3 30.83
7 Home 15 19.13 2 1.59 1 0.32 18 21.04 8 Irrigation 3 3.11 2 0.43 1 0.51 6 4.05 9 Law and
Judiciary 2 0.74 1 0.34 3 1.08
10 Medical Education and Drugs
3 7.17 3 7.17
11 Public Health 15 50.97 15 50.97 12 Public Works 1 1.08 1 1.08 13 Revenue and
Forests 64 22.34 64 22.34
14 Rural Development and Water Conservation
17 200.69 17 200.69
15 School Education and Sports
2 2.56 2 2.56
16 Social Justice, Cultural Affairs and Special Assistance
8 84.64 8 84.64
17 Water Resources
1 1.50 1 1.50
Total 219 625.87 5 42.10 4 2.67 228 670.64

Audit Report (Civil) for the year ended 31 March 2007
192
APPENDIX - 1.12
(Reference: Paragraph 1.6; Page 20)
Write-off of losses, etc. during 2006-07 Losses, irrecoverable revenues,
advances etc. written-off Sr. No.
Department
Number of cases
Amount (Rupees in lakh)
1 Food, Civil Supplies and Consumer Protection
184 8.48
2 Planning 1 1.19 3 Public Health 1 0.18 4 Trade, Commerce and Mining 1 1.12
Total 187 10.97 i.e. 0.11 crore

Appendices
193
APPENDIX - 1.13
(Reference : Paragraph 1.7.2.1; Page 21)
Departmentally managed commercial/quasi-commercial undertaking whose pro forma accounts which are in arrears for more than one year as on 31 March 2007
Sl. No. Name of the Scheme Arrears since
Number of accounts
Remarks
Agriculture, Animal Husbandry, Dairy Development and Fisheries Department 1 GMMS, Worli 2006-07 1 2 Mother Dairy, Kurla 2006-07 1 3 Central Dairy, Goregaon 2006-07 1 4 Milk Transport Scheme, Worli 2006-07 1 5 Agriculture Scheme, Mumbai 2005-06 2 6 Unit Scheme, Mumbai 2005-06 2 7 Electricity Scheme, Mumbai 2005-06 2 8 Cattle Feed Scheme, Mumbai 2005-06 2 9 Water Supply Scheme, Mumbai 2005-06 2
10 Dairy Project, Dapchari 2006-07 1 11 Government Milk Scheme, Khopoli 2006-07 1 12 Government Milk Scheme, Mahad 2006-07 1 13 Government Milk Scheme, Pune 2006-07 1 14 Government Milk Scheme,
Mahabaleshwar 2006-07 1
15 Government Milk Scheme, Satara 2006-07 1 16 Government Milk Scheme, Nagpur 2006-07 1 17 Government Milk Scheme, Wardha 2006-07 1 18 Government Milk Scheme,
Chandarapur 2006-07 1
19 Government Milk Scheme, Gondia 2006-07 1 20 Government Milk Scheme,
Aurangabad 2006-07 1
21 Government Milk Scheme, Nanded 2006-07 1 22 Government Milk Scheme, Bhoom 2006-07 1 23 Government Milk Scheme, Parbhani 2006-07 1 24 Government Milk Scheme, Yavatmal 2006-07 1 25 Government Milk Scheme, Amravati 2006-07 1 26 Land Development by Bulldozer
Scheme, Amravati 1996-97 11
27 Land Development by Bulldozer Scheme, Aurangabad
1999-00 8
28 Land Development by Bulldozer Scheme, Pune
1995-96 12
29 Land Development by Bulldozer Scheme, Nagpur
1997-98 10
30 Allapalli and Pedigundam Forest Ranges of Forest Divisions including Saw Mills and Timber Depot.
1985-86 21
Food and Civil Supplies and Consumer Protection Department 31 Procurement distribution and price
control scheme Mumbai and Thane Rationing Areas
2006-07 1
32 Public Distribution and Price Control Scheme of Moffusil
2006-07 1

Audit Report (Civil) for the year ended 31 March 2007
194
APPENDIX - 1.14 (Reference: Paragraph 1.7.2.1; Page 21)
Summarised statement of finalisation of accounts and the government investment
thereon in departmentally managed commercial and quasi-commercial undertakings Sl. No.
Number of undertaking
under the department
Name of undertaking Account finalised
up to
Investment as per last accounts
(Rupees in crore)
Remarks
(1) (2) (3) (4) (5) (6) Agriculture, Animal Husbandry, Dairy Development and Fisheries Department Mumbai Region
1 Greater Mumbai Milk Scheme, Worli 2005-06 17.02 2 Mother Dairy, Kurla 2005-06 21.41 3 Aarey Milk Scheme, Goregaon 2005-06 23.34 4 Milk Transport Scheme, Worli 2005-06 2.89 5 Agriculture Scheme, Mumbai 2004-05 2.91 6 Unit Scheme, Mumbai 2004-05 11.14 7 Electricity Scheme, Mumbai 2004-05 5.75 8 Cattle Feed Scheme, Mumbai 2004-05 0.11 9 Water Supply, Mumbai 2004-05 13.94
10 Dairy Project, Dapchari 2005-06 13.85 11 Government Milk Scheme, Chiplun 2006-07 1.61 12 Government Milk Scheme, Mahad 2005-06 1.66 13 Government Milk Scheme, Ratnagiri 2006-07 8.13 14 Government Milk Scheme, Khopoli 2005-06 1.55 15 Government Milk Scheme, Kankavali 2006-07 3.15 16 Government Milk Chilling Centre,
Saralgaon 2006-07 0.43
17 Cattle Breeding and Rearing Farm, Palghar
2006-07 1.63
18 Government Milk Distribution Depot, Gove-Bhiwandi
2006-07 0.26
Pune Region 19 Government Milk Scheme, Pune 2005-06 10.18 20 Government Milk Scheme, Solapur 2006-07 3.18 21 Government Milk Scheme, Miraj 2006-07 21.13 22 Government Milk Scheme,
Mahabaleshwar 2005-06 0.87
23 Government Milk Scheme, Satara 2005-06 9.07 Nagpur Region 24 Government Milk Scheme, Nagpur 2005-06 9.71 25 Government Milk Scheme, Wardha 2005-06 4.25 26 Government Milk Scheme, Chandarapur 2005-06 0.87 27 Government Milk Scheme, Gondia 2005-06 12.18
Aurangabad Region 28 Government Milk Scheme, Aurangabad 2005-06 6.94 29 Government Milk Scheme, Udgir 2006-07 17.31 30 Government Milk Scheme, Beed 2006-07 38.38 31 Government Milk Scheme, Nanded 2005-06 13.74 32 Government Milk Scheme, Bhoom 2005-06 8.86 33 Government Milk Scheme, Parbhani 2005-06 2.57

Appendices
195
APPENDIX - 1.14 (Concld.)
(1) (2) (3) (4) (5) (6) Nasik Region 34 Government Milk Scheme, Nashik 2006-07 3.18 35 Government Milk Scheme, Dhule 2006-07 10.66 36 Government Milk Scheme, Chalisgaon 2006-07 2.39 37 Government Milk Scheme, Ahmednagar 2006-07 17.63 38 Government Milk Scheme, Wani 2006-07 0.61
Amravati Region 39 Government Milk Scheme, Amravati 2005-06 3.45 40 Government Milk Scheme, Akola 2006-07 20.14 41 Government Milk Scheme, Yavatmal 2005-06 4.75 42 Government Milk Scheme, Nandura 2006-07 3.14
Agriculture, Animal Husbandry, Dairy Development and Fisheries 43 Land Development by Bulldozer Scheme,
Pune 1994-95 4.00
44 Land Development by Bulldozer Scheme, Aurangabad
1998-99 21.93
45 Land Development by Bulldozer Scheme, Amravati
1995-96 0.01
46 Land Development by Bulldozer Scheme, Nagpur
1996-97 2.18
Revenue and Forest Department 47 1 Allapalli and Pedigundam Forest range of
Forest Division including Saw Mills and Timber Depot
1985-86
48 2 Procurement distribution and price control scheme Mumbai and Thane Region
2005-06 434.69
49 Public Distribution price control scheme, Moffusil
2005-06 456.42
Investment denotes the
closing Government
Capital

196
APPENDIX - 1.15 (Reference : Paragraph 1.7.2.1; Page 21 )
Summarised financial statement of departmentally managed commercial/Quasi-commercial undertakings
Sl. No. Particulars of the undertaking
Year of commence-
ment of activities
Period of accounts
Mean Capital
Block assets
at depre-ciated cost
Depre-ciation
provided during
the year
Turnover Net Profit
(+) / Net Loss (-)
Interest on Mean capital
Total return (9 + 10)
Percentage of return on
Mean capital
(1) (2) (3) (4) (5) (6) (7) (8) (9) (10) (11) (12) ( Rupees in lakh ) (In per cent)
Agriculture, Animal Husbandry, Dairy Development and Fisheries Department Government Milk Schemes Mumbai Region
1 Greater Mumbai Milk Scheme, Worli 1947 2005-06 1,262.92 1,314.91 53.95 15,124.51 -124.66 132.61 7.95 0.63
2 Milk Transport Scheme, Worli 1951 2005-06 326.85 118.34 27.02 0.00 0.00 34.32 34.32 10.50 3 Mother Dairy, Kurla 1975 2005-06 1,379.47 2,216.15 45.26 6,846.17 -949.60 144.84 - 804.76 0.00 4 Central Dairy, Goregaon 1951 2005-06 1,641.36 595.28 39.07 6,061.78 - 816.09 172.34 - 643.75 0.00 5 Agriculture Scheme, Mumbai 1950 2004-05 275.72 284.20 4.82 20.35 - 62.41 28.95 - 33.46 0.00 6 Unit Scheme, Mumbai 1950 2004-05 1,150.53 867.35 31.73 243.70 164.66 120.81 285.46 24.81 7 Electrical Scheme, Mumbai 1950 2004-05 459.70 15.40 1.82 266.18 - 172.95 48.31 - 124.65 0.00 8 Cattle Feed Scheme, Mumbai 1950 2004-05 30.16 21.29 0.56 82.73 53.49 3.61 57.10 189.31 9 Water Supply Scheme, Mumbai 1950 2004-05 1,293.80 465.27 10.14 3.96 - 62.07 135.85 73.78 5.70
10 Dairy Project, Dapchari 1960 2005-06 1,054.00 589.77 21.42 69.82 - 779.31 110.67 - 668.64 0.00 11 Government Milk Scheme, Khopoli 1966 2005-06 156.24 178.21 9.90 1,372.24 3.65 16.40 20.05 12.83 12 Government Milk Scheme, Mahad 1966 2005-06 131.13 91.79 1.89 36.11 - 83.91 13.77 - 70.14 0.00
13 Cattle Breeding and Rearing Farm, Palghar 1979 2006-07 186.92 61.90 1.37 37.03 - 64.10 19.63 - 44.48 0.00
14 Government Milk Scheme, Gove-Bhiwandi 1987 2006-07 27.50 32.86 1.91 392.91 0.31 2.89 3.20 11.63
15 Government Milk Chilling Centre, Saralgaon 1978 2006-07 34.61 16.42 1.07 5.32 - 20.38 3.63 - 16.75 0.00
16 Government Milk Scheme, Chiplun 1966 2006-07 112.42 75.00 3.99 256.58 - 105.61 11.80 - 93.81 0.00
17 Government Milk Scheme, Ratnagiri 1965 2006-07 203.57 68.63 3.50 133.54 - 116.91 21.37 - 95.53 0.00
18 Government Milk Scheme, Kankavali 1966 2006-07 269.64 237.83 18.63 185.65 - 130.52 28.31 - 102.21 0.00

197
APPENDIX - 1.15 (Contd.) (1) (2) (3) (4) (5) (6) (7) (8) (9) (10) (11) (12) ( Rupees in lakh ) (In per cent) Pune Region
19 Government Milk Scheme, Pune 1950 2005-06 968.98 403.96 21.88 4,408.00 - 563.41 101.74 - 461.66 0.00
20 Government Milk Scheme, Mahabaleshwar 1966 2005-06 145.29 45.02 1.88 424.82 - 56.77 15.26 - 41.51 0.00
21 Government Milk Scheme, Satara 1979 2005-06 1,069.19 318.44 10.36 403.45 - 347.53 112.26 - 235.27 0.00 22 Government Milk Scheme, Miraj 1961 2006-07 3,255.88 569.58 30.03 1,853.93 - 1,010.33 341.87 - 668.46 0.00 23 Government Milk Scheme, Solapur 1960 2006-07 237.40 64.81 5.73 271.34 - 234.40 24.93 - 209.48 0.00 Nashik Region
24 Government Milk Scheme, Nashik 1960 2006-07 204.55 80.69 6.82 332.03 - 223.79 21.48 - 202.31 0.00 25 Government Milk Scheme, Wani 1978 2006-07 41.42 13.42 0.26 103.80 - 44.44 4.35 - 40.09 0.00 26 Government Milk Scheme,
Ahmednagar 1969 2006-07 1,881.53 772.79 12.49 6,032.05 - 1,054.83 197.56 - 857.26 0.00
27 Government Milk Scheme, Chalisgaon
1969 2006-07 190.02 4.90 0.44 204.59 - 70.18 19.95 - 50.23 0.00
28 Government Milk Scheme, Dhule 1961 2006-07 1,228.43 300.30 12.70 1,017.17 - 410.30 128.99 - 281.31 0.00 Aurangabad Region
29 Government Milk Scheme, Aurangabad
1962 2005-06 496.95 301.28 10.06 661.92 - 356.38 52.18 - 304.20 0.00
30 Government Milk Scheme, Nanded 1977 2005-06 1,186.87 112.68 3.89 594.38 - 435.27 124.62 - 310.65 0.00 31 Government Milk Scheme, Bhoom 1978 2005-06 721.86 150.57 4.04 1,505.36 - 382.52 75.80 - 306.72 0.00 32 Government Milk Scheme,
Parbhani 1979 2005-06 135.54 73.03 1.98 329.11 - 165.79 14.23 - 151.56 0.00
33 Government Milk Scheme, Udgir 1971 2006-07 1,373.54 594.07 23.76 927.25 - 616.32 144.22 - 472.09 0.00 34 Government Milk Scheme, Beed 1976 2006-07 3,786.81 615.70 18.45 2,634.11 -768.30 397.62 - 370.68 0.00
Nagpur Region 35 Government Milk Scheme, Nagpur 1958 2005-06 840.65 124.70 28.44 1,972.56 - 662.84 88.27 - 574.57 0.00 36 Government Milk Scheme, Wardha 1976 2005-06 339.53 38.69 1.62 120.20 - 152.23 35.65 - 116.58 0.00 37 Government Milk Scheme,
Chandrapur 1979 2005-06 102.62 132.43 12.42 1,370.78 - 191.15 10.77 - 180.37 0.00
38 Government Milk Scheme, Gondia 1979 2005-06 861.03 115.29 2.54 2,364.39 - 255.45 90.41 - 165.04 0.00

198
APPENDIX - 1.15 (Concld.)
(1) (2) (3) (4) (5) (6) (7) (8) (9) (10) (11) (12) ( Rupees in lakh ) (In per cent) Amravati Region
39 Government Milk Scheme, Amravati
1962 2005-06 265.74 167.92 6.18 556.26 - 189.82 27.90 - 161.92 0.00
40 Government Milk Scheme, Yavatmal
2000 2005-06 361.20 244.21 8.42 214.89 - 172.32 37.93 - 134.40 0.00
41 Government Milk Scheme, Akola 1962 2006-07 1,824.33 575.52 21.93 1,480.62 - 560.90 191.55 - 369.35 0.00 42 Government Milk Scheme,
Nandura 1979 2006-07 236.31 70.66 2.17 258.22 - 169.27 24.81 - 144.46 0.00
43 Land Development by Bulldozer Scheme, Pune
1944 1994-95 144.26 77.47 4.52 46.75 - 72.83 18.75 -54.08
44 Land Development by Bulldozer Scheme, Aurangabad
1960 1998-99 32.99 1.05 - 2.02 - 23.42 4.78 - 18.64
45 Land Development by Bulldozer Scheme, Amravati
1965 1995-96 2.82 0.41 - 1.80 - 4.46 0.40 - 4.06
46 Land Development by Bulldozer Scheme, Nagpur
1996 1996-97 2.17 0.23 - 1.81 0.21 0.32 - 0.53
Food Civil Supplies and Consumer Protection Department
47 Procurement Distribution and price control scheme MRA/TRA
1959 2005-06 42524.82 118.93 11.89 8740.82 -1752.87 2154.05 401.18 0.94
48 Procurement Distribution and price control scheme MOFFUSIL
1957 2005-06 38822.23 515.86 57.14 105829.94 1106.81 3924.38 5031.19 12.96
Revenue and Forest Department
49 Allapalli and Pedigundam Forest Range of Forest Divisions including Saw Mills and Timber Depot
1926 1985-86 1857.85 15.27 9.27 826.24 383.32 170.74 554.06 29.82
Appendices
199
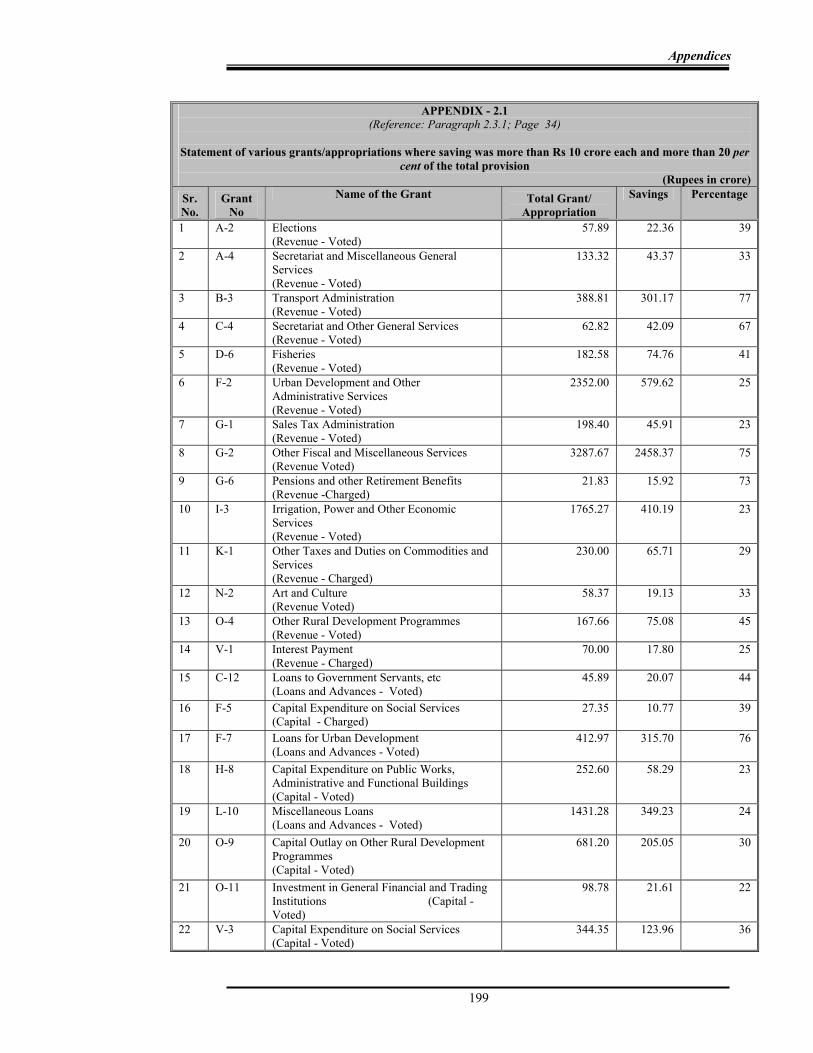
APPENDIX - 2.1 (Reference: Paragraph 2.3.1; Page 34)
Statement of various grants/appropriations where saving was more than Rs 10 crore each and more than 20 per
cent of the total provision (Rupees in crore)
Sr. No.
Grant No
Name of the Grant Total Grant/ Appropriation
Savings Percentage
1 A-2 Elections (Revenue - Voted)
57.89 22.36 39
2 A-4 Secretariat and Miscellaneous General Services (Revenue - Voted)
133.32 43.37 33
3 B-3 Transport Administration (Revenue - Voted)
388.81 301.17 77
4 C-4 Secretariat and Other General Services (Revenue - Voted)
62.82 42.09 67
5 D-6 Fisheries (Revenue - Voted)
182.58 74.76 41
6 F-2 Urban Development and Other Administrative Services (Revenue - Voted)
2352.00 579.62 25
7 G-1 Sales Tax Administration (Revenue - Voted)
198.40 45.91 23
8 G-2 Other Fiscal and Miscellaneous Services (Revenue Voted)
3287.67 2458.37 75
9 G-6 Pensions and other Retirement Benefits (Revenue -Charged)
21.83 15.92 73
10 I-3 Irrigation, Power and Other Economic Services (Revenue - Voted)
1765.27 410.19 23
11 K-1 Other Taxes and Duties on Commodities and Services (Revenue - Charged)
230.00 65.71 29
12 N-2 Art and Culture (Revenue Voted)
58.37 19.13 33
13 O-4 Other Rural Development Programmes (Revenue - Voted)
167.66 75.08 45
14 V-1 Interest Payment (Revenue - Charged)
70.00 17.80 25
15 C-12 Loans to Government Servants, etc (Loans and Advances - Voted)
45.89 20.07 44
16 F-5 Capital Expenditure on Social Services (Capital - Charged)
27.35 10.77 39
17 F-7 Loans for Urban Development (Loans and Advances - Voted)
412.97 315.70 76
18 H-8 Capital Expenditure on Public Works, Administrative and Functional Buildings (Capital - Voted)
252.60 58.29 23
19 L-10 Miscellaneous Loans (Loans and Advances - Voted)
1431.28 349.23 24
20 O-9 Capital Outlay on Other Rural Development Programmes (Capital - Voted)
681.20 205.05 30
21 O-11 Investment in General Financial and Trading Institutions (Capital - Voted)
98.78 21.61 22
22 V-3 Capital Expenditure on Social Services (Capital - Voted)
344.35 123.96 36

Audit Report (Civil) for the year ended 31 March 2007
200
APPENDIX - 2.2
(Reference: Paragraph 2.3.3; Page 34)
Excess over grants/appropriations requiring regularisation Sr. No. Grant No Name of the Grant/
Appropriation Total Grant/
Appropriation Actual
Expenditure Amount of
Excess Grant - Revenue/Capital
1 C-5 Other Social Services 287333000 333929360 46596360 2 C-6 Natural Calamities 17502100000 20017303526 2515203526 3 D-2A Relief on Account of Natural
Calamities 1005563000 1455512040 449949040
4 F-3 Secretariat and Other Social Services
155967000 165328552 9361552
5 G-7 Social Security and Welfare 395466000 397086980 1620980 6 H-5 Roads and Bridges 19796439000 20534712424 738273424 7 K-6 Energy 22571596000 25410947966 2839351966 8 T-2 Co-operation 4199007000 4234218855 35211855 9 T-3 Social Security and Welfare 1458000 1486411 28411
10 ZA-2 Social Security and Welfare 180000 239242 59242 11 B-10 Loans For Housing 709969000 724266771 14297771 12 D-14 Loans to Government Servants
etc 189386000 189496000 110000
13 H-7 Capital Expenditure on Social Services and Economic Services
6792706000 7317426439 524720439
14 L-8 Capital Expenditure on Regional Imbalance
954300000 955865326 1565326
15 T-8 Loans for Tribal Area Development Sub-Plan
17430000 17673642 243642
16 M-4 Capital Expenditure on Food, Storage and Warehousing
27320466000 29329303000 2008837000
Total Grants 101899366000 111084796534 9185430534 Appropriation - Revenue/Capital
17 B-5 Jails 150000 258756 108756 18 C-3 Interest Payment 6353000 6608329 255329 19 C-7 Forest 12056000 12892804 836804 20 D-1 Interest Payment 177816000 195640876 17824876 21 H-1 Interest Payment 1165491000 1165491374 374 22 H-6 Public Works and
Administrative and Functional Buildings
25305000 25440818 135818
23 L-1 Interest Payment 2191446000 2465855535 274409535 24 N-3 Welfare of Scheduled Castes,
Scheduled Tribes and Other Backward Classes
150000 178023 28023
25 Q-1 Interest Payment 64575000 141355199 76780199 26 T-1 Interest Payment 32650000 33977548 1327548 27 U-1 Interest Payment 12660000 17984459 5324459 28 C-10 Capital Expenditure on
Economic Services 0 75000 75000
29 Y-7 Capital Expenditure on Economic and Social Services
1000000 1432974 432974
3689652000 4067191695 377539695 105589018000 115151988229 9562970229
Total - Appropriations Grand Total Grand Total (Rupees in crore) 10558.90 11515.20 956.30

Appendices
201
APPENDIX - 2.3
(Reference: Paragraph 2.3.5; Page 34)
Statement of various grants/appropriations where supplementary provision proved unnecessary (Rupees in crore )
Sr.No.
Number and Name of the Grant/Appropriation
Original provision
Supplementary Provision
Total Grant/ Appropriation
Actual Expenditure
Saving
(1) (2) (3) (4) (5) (6) (7) I - GRANT
1 A-2 - Elections 53.78 4.10 57.88 35.52 22.36 2 A-5 - Social Services 87.33 8.02 95.35 85.15 10.20 3 A-6 - Information of Publicity 24.27 2.13 26.40 23.47 2.93 4 B-1 - Police Administration 2696.99 153.42 2850.41 2619.55 230.86 5 B-2 - State Excise 43.47 0.60 44.07 42.21 1.86 6 B-4 - Secretariat and Other
General Services 14.59 0.34 14.93 13.71 1.22
7 B-5 - Jails 101.66 1.36 103.02 93.43 9.59 8 C-1 - Revenue and District
Administration 529.53 7.77 537.30 471.06 66.24
9 C-4 - Secretariat and Other General Services
55.71 7.11 62.82 20.73 42.09
10 D-3 - Agriculture Services 936.71 69.65 1006.36 898.88 107.48 11 D-5 - Dairy Development 856.45 38.78 895.23 720.75 174.48 12 D-9 - Capital Expenditure on
Animal Husbandry 1.77 0.14 1.91 0.53 1.38
13 D-10 - Capital Expenditure on Dairy Development
1.65 0.75 2.40 0.27 2.13
14 F-2 - Urban Development and Other Administratve Services
2130.18 221.82 2352.00 1772.38 579.62
15 F-4 - Compensation and Assignment
546.70 0.37 547.07 541.78 5.29
16 F-5 - Capital Expenditure on Social Services
5.10 0.06 5.16 2.11 3.05
17 F-7 - Loans for Urban Development
405.20 7.77 412.97 97.27 315.70
18 G-1 - Sales Tax Administration
197.31 1.08 198.39 152.48 45.91
19 G-3 - Interest Payment and Debt Services
10031.64 1.64 10033.28 9717.20 316.08
20 G-4 - Secretariat General Services
9.54 2.55 12.09 8.56 3.53
21 I-3 - Irrigation, Power and Other Economic Services
1561.99 203.28 1765.27 1355.08 410.19
22 I-4 - Secretariat - Economic Services
6.05 0.28 6.33 5.89 0.44
23 J-1 - Administration of Justice 286.63 23.82 310.45 281.94 28.51 24 J-2 - Secretariat and Other
Social and Economic Services
18.48 0.88 19.36 18.30 1.06
25 K-3 - Stationery and Printing 84.81 7.01 91.82 83.62 8.20 26 K-4 - Labour and
Employment 64.31 0.96 65.27 61.95 3.32
27 L-4 - Secretariat - Economic Services
7.37 0.25 7.62 7.29 0.33

Audit Report (Civil) for the year ended 31 March 2007
202
APPENDIX - 2.3 (Concld.)
(1) (2) (3) (4) (5) (6) (7) 28 L-9 -Loans to Government
Servants, etc. 3.95 0.02 3.97 3.90 0.07
29 N-1 - Secretaiat and Other Social Services
31.78 0.18 31.96 26.83 5.13
30 N-2 - Arts and culture 56.59 1.78 58.37 39.24 19.1331 N-5 - Loans to
Government Servants, etc. 1.24 0.01 1.25 0.71 0.54
32 O-4 - Other Rural Development Programmes
165.90 1.76 167.66 92.58 75.08
33 O-10 - Capital Outlay on Hill Areas
45.25 0.14 45.39 41.42 3.97
34 O-12 - Loans to Government Servants, etc.
0.68 0.05 0.73 0.51 0.22
35 R-1 - Medical and Public Health
1702.07 80.91 1782.98 1606.93 176.05
36 R-5 - Loans to Government Servants, etc.
14.81 0.20 15.01 10.07 4.94
37 V-3 - Capital Expenditure on Social Services
264.75 79.61 344.36 220.40 123.96
38 V-6 - Loans to Government Servants, etc.
5.48 2.05 7.53 5.12 2.41
39 X-1 - Social Security and Nutrition
764.02 86.04 850.06 718.80 131.26
40 ZA-1 - Secretariat and Other Social Services
25.49 0.26 25.75 19.70 6.05
41 ZC-1 - Parliament/State/Union Teritory Legislature
55.17 2.23 57.40 47.50 9.90
Total 23896.40 1021.18 24917.58 21964.82 2952.76II - APPROPRIATION 42 C-1 - Revenue and District
Administration 325.98 13.96 339.94 322.45 17.49
43 G-6 - Pension and Other Retirement Benefits
16.48 5.35 21.83 5.90 15.93
44 K-1 - Other Taxes and Duties on Commodities and Services
187.95 42.05 230.00 164.29 65.71
45 O-3 - Rural Employment 1444.67 192.72 1637.39 1442.80 194.5946 O-7 - Secretariat
Economic Services 1.36 0.13 1.49 1.28 0.21
Total 1976.44 254.21 2230.65 1936.72 293.93 Grand total 25872.84 1275.39 27148.23 23901.54 3246.69

Appendices
203
APPENDIX - 2.4
(Reference: Paragraph 2.3.6; Page 34)
Statement of cases where Supplementary provision resulted in saving exceeding Rs 1 crore in each case (Rupees in crore)
Sr. No
Number Name of the Grant/Appropriation
Original Provision
Supplementary Provision
Total Expenditure Saving
(1) (2) (3) (4) (5) (6) (7) (8) I Grants 1 A-4 Secretariat and
Miscellaneous General Services
88.97 44.35 133.32 89.95 43.37
2 B-3 Taxes on Vehicles 79.03 309.78 388.81 87.64 301.17 3 C-7 Forestry and Wild Life 337.29 69.84 407.13 365.89 41.24 4 D-4 Animal Husbandry 299.90 91.98 391.88 356.86 35.02 5 E-2 General Education 9860.07 831.71 10691.78 10542.28 149.50 6 G-6 Pension and Other
Retirement Benefits 3390.06 504.32 3894.38 3539.71 354.67
7 H-6 Public Works & Administrative & Functional Buildings
901.97 104.21 1006.18 959.84 46.34
8 L-2 District Administration 783.99 40.16 824.15 806.79 17.36 9 L-3 Rural Development and
Programmes 1029.59 507.23 1536.82 1358.27 178.55
10 L-5 Compensation and Assignments
271.48 30.36 301.84 279.15 22.69
11 N-3 Welfare of Scheduled Castes, Scheduled Tribes and Other Backward Classes
1532.64 308.18 1840.82 1738.78 102.04
12 O-3 Rural Employment 569.16 200.00 769.16 701.43 67.73 13 Q-3 Housing 175.48 236.05 411.53 334.37 77.16 14 R-1 Medical and Public
Health 1702.07 80.90 1782.97 1606.92 176.05
15 T-5 Revenue Expenditure on Tribal Area Development Sub Plan
745.08 245.10 990.18 877.99 112.19
16 W-2 General Education 1138.90 256.44 1395.34 1379.46 15.88 17 W-3 Technical Education 389.12 72.62 461.74 446.42 15.32 18 W-4 Art and Culture 274.26 45.02 319.28 302.57 16.71 19 Y-2 Water Supply and
Sanitation 1350.54 135.09 1485.63 1436.90 48.73
20 H-8 Capital Outlay On Public Works, Administrative & Functional Buildings
171.65 80.95 252.60 194.31 58.29
21 H-9 Capital Outlay On Removal of Regional Imbalance
424.93 30.69 455.62 439.75 15.87
22 I-5 Capital Outlay On Rural Development
4206.08 1378.37 5584.45 5540.43 44.02
23 L-7 Capital Outlay on Rural Development
240.21 78.00 318.21 282.79 35.42
24 N-4 Capital Expenditure on Social Services
47.35 557.55 604.90 593.90 11.00
25 O-9 Capital Outlay on Other Rural Development Programmes
393.85 287.35 681.20 476.15 205.05

Audit Report (Civil) for the year ended 31 March 2007
204
APPENDIX - 2.4 (Concld.)
(1) (2) (3) (4) (5) (6) (7) (8) 26 T-6 Capital Outlay On
Tribal Development Sub Plans
189.72 305.14 494.86 458.61 36.25
27 V-5 Capital Expenditure on Social Services & Economic Services
865.38 828.10 1693.48 1539.41 154.07
Total 31458.77 7659.49 39118.26 36736.57 2381.69 II Appropriation 1 B-3 Transport
Administration 922.45 250.47 1172.92 1001.00 171.92
2 I-1 Interest Payments 1467.07 26.23 1493.30 1478.11 15.19 3 F-5 Capital Expenditure on
Social Services 5.00 22.35 27.35 16.58 10.77
Total 2394.52 299.05 2693.57 2495.69 197.88 Grand Total 33853.29 7958.54 41811.83 39232.26 2579.57 (i) Supplementary Grants/ Appropriations
7958.54
(ii) Savings 2579.57 (iii) Actual requirements (i)-(ii) 5378.97

Appendices
205
APPENDIX - 2.5
(Reference: Paragraph 2.3.7; Page 34)
Statement of various grants/appropriation where supplementary provision proved insufficient by more than Rs 1 crore each
(Rupees in crore ) Sr. No.
Number Name of the Grants and Appropriation
Original Supplementary Total Expenditure Excess
I Grants 1 B-10 Loans For Housing 60.05 10.95 71.00 72.43 1.43 2 C-5 Other Social Services 8.12 20.61 28.73 33.39 4.66 3 C-6 Natural Calamities 380.83 1369.38 1750.21 2001.73 251.52 4 D-2A Relief on Account of
Natural Calamities 100.56 100.56 145.55 44.99
5 H-5 Roads and Bridges 1625.42 354.22 1979.64 2053.47 73.83 6 H-7 Capital Expenditure on
Social Services and Economic Services
607.62 71.65 679.27 731.74 52.47
7 K-6 Energy 1640.99 616.17 2257.16 2541.09 283.93 8 T-2 Welfare of Scheduled
Castes, Scheduled Tribes and Other Backward Classes
408.65 11.25 419.90 423.42 3.52
Total 4731.68 2554.79 7286.47 8002.82 716.35 II Appropriations 9 L-1 Interest Payment 216.77 2.37 219.14 246.58 27.44 10 Q-1 Interest Payment 5.47 0.99 6.46 14.14 7.68 Total 222.24 3.36 225.60 260.72 35.12 Grand Total 4953.92 2558.15 7512.07 8263.54 751.47

Audit Report (Civil) for the year ended 31 March 2007
206
APPENDIX - 2.6
(Reference: Paragraph 2.3.8; Page 35)
Cases where re-appropriation of funds proved excessive or insufficient over grant by over Rs 1 crore (Rupees in crore)
Sr. No.
Grant No.
Title of Grant/Appropriation
Head of Account Re-Appropriation Excess(+) Saving(-)
1 2 3 4 5 6 1 A-2 Election 2015-105 (00) (01) (+) 0.21 (-) 1.502 B-1 Police Administration 2055-109 (00) (01) (-) 128.80 (+) 40.983 B-1 Police Administration 2055-003 (00) (01) (-) 2.61 (+) 1.264 B-1 Police Administration 2055-108 (01) (01) (-) 4.00 (+) 3.355 B-1 Police Administration 2055-001 (00) (01) (-) 1.09 (+) 1.326 B-1 Police Administration 2055-108 (02) (01) (+) 60.21 (-) 20.607 B-1 Police Administration 2055-112 (00) (01) (+) 1.93 (-) 1.428 B-1 Police Administration 2055 -116 (00) (01) (+) 3.08 (-) 1.649 B-10 Loans for Housing 7610-201 (00) (01) (-) 1.18 (+) 3.0410 C-1 Revenue and District
Administration 2053-094 (01) (-) 17.35 (+) 2.03
11 C-1 Revenue and District Administration
2053-094 (03) (-) 29.01 (+) 3.85
12 C-6 Natural Calamities 2245 - 101 (03) (03) (-) 0.36 (+) 1.4613 C-6 Natural Calamities 2045 - 101 (04) (05) (-) 20.43 (+) 5.1814 C-6 Natural Calamities 2245 - 113 (00) (01) (-) 41.32 (+) 6.5915 C-7 Forest 2406 - 101 (01) (01) (-) 22.00 (+) 9.8016 C-7 Forest 2406- 110(00)(01) &
(00)(02) (-) 2.24 (+) 1.67
17 C-7 Forest 2406-001(01)(02) (-)0.87 (+)1.4218 C-7 Forest 2406-101 (03)(01) &
(11)(01) (-) 1.08 (+) 1.55
19 C-7 Forest 2406- 105 (01) (-) 4.04 (+) 4.1320 D-1 Interest payment 2049 - 104 (01) (-) 0.88 (+) 2.8821 D-1 Interest payment 2049 - 104 (02) (-) 0.27 (+) 2.2622 D-3 Agriculture Services 2401-001(00) (02) (-) 13.54 (+) 7.4623 D-3 Agriculture Services 2401-114(00)(06) (+) 1.54 (-) 2.2524 D-3 Agriculture Services 2401-119 (03) (01) (-) 2.89 (+) 1.0225 D-4 Animal Husbandry 2403-102(06)(02) (-)0.05 (+)1.4626 D-4 Animal Husbandry 2403-101 (01) (01) (+) 1.72 (-) 0.5827 G-6 Pension and other
Retirement Benefits 2071 - 105 (00) (01) (+) 34.49 (-) 55.07
28 G-6 Pension and other Retirement Benefits
2071-103 (00) (03) (+) 2.80 (-) 1.31
29 G-6 Pension and other Retirement Benefits
2071-111 (00) (01) (+) 48.29 (-) 19.36
30 G-6 Pension and other Retirement Benefits
2071-115(00)(01) (+)46.81 (-)6.54
31 G-8 Public Debt and Inter-state Settlement
6004 - 101 (-) 75.88 (+) 76.92
32 H-3 Housing 2216-001 (00) (01) (-) 19.63 (+) 4.0433 H-5 Roads & Bridges 3054 – 001 (00) (01) (-) 43.28 (+) 13.03

Appendices
207
APPENDIX - 2.6 (Contd.)
1 2 3 4 5 6 34 H-6 Public Works and
Administrative and Functional Building
2059-001(51)(01) (+)1.63 (-)3.37
35 H-6 Public Works and Administrative and Functional Building
2059 – 799 (00) (01) (-) 8.56 (+) 3.84
36 H-6 Public Works and Administrative and Functional Building
2059-799(00)(03) (+)4.08 (-)21.59
37 H-6 Public Works and Administrative and Functional Building
2059 - 001 (-) 4.34 (+) 8.50
38 H-6 Public Works and Administrative and Functional Building
2059-001(53)(01) (-)0.33 (+)3.26
39 H-7 Capital Expenditure on Social and Economic Services
5054-337 (00)(01) (00) (02) (00) (03)
(-) 15.51 (+) 55.37
40 H-8 Capital Expenditure.on Social and Economic Services
4210 -105 (00) (01) (00) (02)
(-) 4.39 (+) 6.98
41 I-3 Irrigation, Power and other Economic Services
2701-800(02) (-) 34.27 (+) 6.72
42 I-3 Irrigation, Power and other Economic Services
2701-001 (05) (+) 2.70 (-) 2.84
43 I-3 Irrigation, Power and other Economic Services
2402-102(01) (-)1.92 (+)6.16
44 I-3 Irrigation, Power and other Economic Services
2702-800(09) (+)3.01 (-)1.23
45 I-5 Capital Expenditure on Irrigation
4701-190(04)(03) (-)13.03 (+)14.20
46 I-5 Capital Expenditure on Irrigation
4701-(01)(02) (+)17.61 (-)13.43
47 I-5 Capital Expenditure on Irrigation
4402-800(01) (+)8.44 (-)1.59
48 J-1 Administration of Justice
2014-105(02)(01) (-)24.32 (+)3.60
49 K-6 Energy 2801-800(00)(01) (-)149.56 (+)456.4450 L-3 Rural Development
Programmes 2501-101(00)(01) (-)2.76 (+)9.50
51 L-7 Capital Expenditure on Rural Development
4402-102(01)(03) (+)15.41 (-)6.15
52 M-4 Capital Outlay on Food, Storage and Warehousing
4408-101 (02 (01) (-) 604.89 (+) 5.54

Audit Report (Civil) for the year ended 31 March 2007
208
APPENDIX - 2.6 (Contd.) 1 2 3 4 5 6
53 N-3 Welfare of Scheduled castes Scheduled Tribes and Other Backward Classes
2225-800(01)(06) (-)37.00 (+)1.73
54 N-3 Welfare of Scheduled castes Scheduled Tribes and Other Backward Classes
2235-104(08)(01) (-)9.92 (+)4.64
55 N-3 Welfare of Scheduled castes Scheduled Tribes and Other Backward Classes
2235-104(08)(02) (-)17.85 (+)2.74
56 N-3 Welfare of Scheduled castes Scheduled Tribes and Other Backward Classes
2225-277(01)(11) (-)9.60 (+)12.35
57 N-3 Welfare of Scheduled castes Scheduled Tribes and Other Backward Classes
2225-277(04)(01) (+)2.64 (-)1.08
58 N-3 Welfare of Scheduled castes Scheduled Tribes and Other Backward Classes
2225-277(01)(01) (-)9.43 (+)17.23
59 N-3 Welfare of Scheduled castes Scheduled Tribes and Other Backward Classes
2235-104(08)(07) (+)12.08 (-)5.30
60 O-3 Rural Employment 2505-001(01)(01) (-)8.78 (+)8.5961 R-1 Medical and Public
Health 2210-110 (01)(01) & (06)(01)
(-) 19.00 (+) 1.72
62 R-1 Medical and Public Health
2211-103 (01)(11) (-) 2.23 (+) 1.03
63 R-1 Medical and Public Health
2210-001 (01) (09) (-) 1.69 (+) 1.86
64 T-5 Revenue Expenditure on Tribal Area Development. Sub-plan
2225-102 (06) (01) (-) 15.52 (+) 5.19
65 T-5 Revenue Expenditure on Tribal Area Development. Sub-plan
2210-800 (00)(01) (+) 1.22 (-) 16.55
66 T-5 Revenue Expenditure on Tribal Area Development. Sub-plan
2702-800 (00) (02) (+) 3.19 (-) 1.88
67 T-6 Capital Expenditure on Tribal Development. Sub-plan
4702-800 (00) (01) (+) 2.74 (-) 6.52
68 T-6 Capital Expenditure on Tribal Development. Sub-plan
4225-800 (01)(03) (+) 7.29 (-) 1.95
69 T-6 Capital Expenditure on Tribal Development. Sub-plan
4402-796 102 (00) (01) (+) 3.56 (-) 1.11

Appendices
209
APPENDIX - 2.6 (Concld.)
1 2 3 4 5 6 70 T-6 Capital Expenditure on
Tribal Development. Sub-plan
4701-796 (1) (+) 4.33 (-) 2.43
71 T-6 Capital Expenditure on Tribal Development. Sub-plan
5054 -796 (00) (01) (+) 25.42 (-) 6.61
72 T-6 Capital Expenditure on Tribal Development. Sub-plan
4701-796 (01) (+) 4.33 (-) 2.43

Audit Report (Civil) for the year ended 31 March 2007
210
APPENDIX - 2.7
(Reference Paragraph 2.3.9; Page 35)
Statement of various grants/appropriation in which savings occurred but no part of which had been surrendered
(Rupees in crore)Sr.No. Grant No. Number and Name of grant/appropriation Saving I GRANT 1 D-2 Social Security and Welfare 0.122 D-8 Capital Outlay on Husbandry 0.183 G-6 Pensions and other retirement Benefits 354.674 H-11 Loans to Government Servants, etc. 0.235 M-5 Loans to Government Servants, etc. 0.606 N-5 Loans to Government Servants, etc. 0.547 O-5 Hill Areas 0.118 Q-3 Housing 77.159 Q-4 Secretariat - Economic Service 0.2010 Q-6 Loans to Government Servants, etc. 0.2511 X-4 Loans to Government Servants, etc. 0.34 Total 434.39II APPROPRIATION 12 B-3 Transport Administration 171.9213 I-5 Capital Expenditure on Irrigation 0.4214 K-1 Other Taxes and Duties on Commodities and Services 65.7115 K-4 Labor and Employment 0.3316 L-5 Compensation and Assignments 0.1817 ZC-1 Parliament/State/Union Territory Legislatures 0.19Total 238.75Grand Total 673.14

Appendices
211
APPENDIX - 2.8
(Reference: Paragraph 2.3.9; Page 35)
Details of saving of Rs 1 crore and above not surrendered (Rupees in crore)
Sr.No.
Number and Name of Grants/Appropriation Saving Surrender Saving which remained to be Surrendered
1 B-1 - Police Administration 230.86 191.94 38.922 B-3 - Transport Administration 301.17 3.80 297.373 C-1 - Revenue and District Administration (Charged) 17.49 0.07 17.424 C-2 - Stamps and Registration 6.19 3.07 3.125 C-4 - Secretariat and Other General Services 42.09 41.00 1.096 D-6 - Fisheries 107.82 55.82 52.007 D-11 - Capital Expenditure on Fisheries 6.47 1.90 4.578 E-1 - Interest Payment 74.28 68.31 5.979 E-2 - General Education 149.50 136.27 13.2310 F-2 - Urban Development and Other Administration
Serivices 579.62 520.88 58.74
11 F-4 - Compensation and Assignments 5.29 2.05 3.2412 G-3 - Interest Payment and Debt Services 316.08 220.20 95.8813 G-6 - Pensions and Other retirement Benefits
(Charged) 15.93 6.80 9.13
14 H-6 - Public works and Administration and functional Buildings
46.34 21.12 25.22
15 I-5 - Capital Expenditure on Irrigation 44.02 38.68 5.3516 J-1 - Administration of Justice (Charged) 7.18 5.87 1.3117 J-4 - Capital Outlay on Public Works 1.58 0.33 1.2518 K-3 - Stationery and Printing 8.20 6.52 4.6719 K-7 - Industries 3.74 2.47 1.2720 K-7 - Industries (Charged) 9.72 2.00 7.7221 L-5 - compensation and Assignments 22.69 20.45 2.2422 L-7 - Capital Expenditure on Rural Development 35.42 18.29 17.1223 O-3 - Rural Employment 67.73 55.90 11.8324 O-3 - Rural Employment (Charged) 194.59 0.13 194.4625 O-9 - Capital Expenditure on Other Rural
Development Programmes 205.04 180.83 24.21
26 O-11 - Investment in General Financial and Trading Institutions
21.61 4.28 17.33
27 R-1 - Medical and Public Health 176.04 127.19 48.8528 T-5 - Revenue Expenditure on Tribal Area
development Sub-Plan 112.18 81.16 31.02
29 T-6 - Capital Expenditure on Tribal Development Sub-Plan
36.25 13.78 22.47
30 W-2 - General Education 15.88 11.79 4.0931 W-3 - Technical Education 15.32 10.78 4.5432 W-4 - Art and Culture 16.71 11.44 5.2733 X-1 - Social Security and Nutrition 131.26 79.03 52.2334 ZC-1 - Parliament/State/Union Territory Legislatures 9.90 7.10 2.80 Total 3034.19 1951.25 1082.94

Audit Report (Civil) for the year ended 31 March 2007
212
APPENDIX - 2.9
(Reference: Paragraph 2.3.10; Page 35)
Cases of surrender of funds in excess of Rs 10 crore on 29 and 30 March 2007 (Rupees in crore)
Sr. No.
Grant No.
Major Head Amount of Surrender
1 A04 2070 – Other Administrative Services 36.632 B01 2055 – Police 175.393 B01 2070 – Other Administrative Services 12.324 C01 2029 - Land Revenue 12.715 C01 2053 – District Administration 12.776 C04 2059 – Public works 23.857 C06 2245 – Relief on account of Natural Calamities 119.088 C07 2406 – Forestry and Wild Life 15.989 C12 7610 – Loans to Government Servant 16.34
10 D03 2401 – Crop Husbandry 122.2411 E02 2202 – General Education 136.2712 F02 2217 – Urban Development 520.5013 F05 4217 – Capital Outlay on Urban Development 13.0914 F07 6217 – Loans for Urban Development 314.7215 G01 2040 – Sales Tax 42.8516 G02 2075 – Miscellaneous General Services 1824.6717 I03 2701 – Medium Irrigation 23.0018 I03 2701 – Medium Irrigation 375.0819 I05 4701 – Capital Outlay on Medium Irrigation 14.3320 J01 2014 – Administration of Justice 39.0321 K06 2801 – Power 172.7622 L03 2515 – Other Rural Development Programmes 169.1423 L05 3604 – Compensation to Local Bodies and Panchayat 20.4524 L10 7615 – Miscellaneous Loans 156.2025 M04 4408 – Capital Outlay on Food Storage & Warehousing 1221.3126 N02 2205 – Art and Culture 18.0527 N03 2225 – Welfare of SC, ST and other backward classes 105.6428 N03 2235 Social Security and Welfare 17.2029 N04 4225 Capital Outlay on Welfare of Scheduled Castes,
Scheduled Tribes 11.00
30 O03 2505 Rural Employment 55.9031 O04 2515 Other Rural Development Programme 75.0832 O09 4515 Capital Outlay on Other Rural Development
Programme 180.83
33 R01 2210 Medical and Public Health 107.3034 R01 2211 Family Welfare 16.0935 S01 2210 Medical and Public Health 19.9936 T05 2225 Welfare of SC/ST and other backward classes. 51.5637 V03 4425 Capital Outlay on Co-operation 113.1538 V05 6425 Loans for Co-operation 99.9539 W02 2202 General Education 11.8140 W03 2203 Technical Education 10.7841 X01 2236 Nutrition 76.2842 Y02 2215 Water Supply and Sanitation 53.79
TOTAL 6615.11

Appendices
213
APPENDIX - 2.10 (Reference: Paragraph 2.3.11; page 35)
Details of Surrender in excess of actual saving in the grants/appropriations involving substantial
amounts (Rupees in crore)
Sr.No. Number and name of grant /appropriation Amount Surrendered Actual Savings1 A-1 Governor and Council of Ministers 4.77 4.062 A-3 Public Service Commission 0.34 0.333 A-8 Loans to Government Servants, etc. 0.36 0.334 B-2 State Excise 1.99 1.865 B-5 Jails 9.86 9.586 C-1 Revenue and District Administration 75.25 66.247 C-7 Forest 56.76 41.248 C-9 Capital Expenditure on Other Administrative
service and other Social Service 1.76 1.759 D-3 Agriculture Services 124.37 107.48
10 D-4 Animal Husbandry 35.12 35.0211 E-3 Secretariat and other Social Services 3.03 2.2912 F-8 Loans to Government Servants, etc. 0.75 0.6313 G-4 Secretariat General Services 4.47 3.5314 G-8 Public Debt and Inter State Settlement 394.55 218.0315 H-3 Housing 9.27 3.4316 H-8 Capital Expenditure on Public Works,
Administrative and Functional Building 65.03 58.2917 H-9 Capital Outlay on Removal of Regional
Imbalance 16.09 15.8718 I-3 Irrigation, Power and Other Economic
Services 424.51 410.1919 J-1 Administration of Justice 33.16 28.5120 K-4 Labour and Employment 3.81 3.3221 K-10 Capital Expenditure on Industries 0.38 0.0722 K-12 Loans to Government Servants, etc. 4.93 4.8723 L-3 Rural Development Programmes 213.81 178.5524 M-2 Food, Storage and Warehousing 6.86 4.7625 M-3 Secretariat and Other Economic Services 0.61 0.1926 N-3 Welfare of Scheduled casts Scheduled Tribes
and Other backward classes 122.83 102.0427 O-7 Secretariat - Economic Services 2.23 1.7128 O-8 Census Survey and Statistics 0.90 0.8529 S-1 Medical and Public Health 19.98 5.9330 T-4 Secretariat - Social Services 0.04 0.0331 V-2 Co-operation 11.21 8.9732 V-3 Capital Expenditure On Social Services 123.96 123.9533 V-6 Loans to Government Servants, etc. 2.44 2.4134 W-7 Revenue Expenditure on Removal of
Regional Imbalance 9.42 8.9435 Y-2 Water Supply and Sanitation 53.79 48.7336 ZA-4 Loans to Government Servants, etc. 0.27 0.26
Total 1838.91 1504.24

Audit Report (Civil) for the year ended 31 March 2007
214
APPENDIX - 2.11
(Reference: Paragraph 2.3.12; Page 36)
Pending NPDC bills for the years upto 2006-07 Sr.No. Department Number of AC
bills Amount (Rupees in
lakh) 1. General Administration 1466 3738.452. Home 6218 24771.533. Revenue and Forest 5117 36255.064. Agriculture, Animal Husbandry,
Dairy Development and Fisheries 9678 11634.10
5. School Education 639 2127.346. Urban Development 44 22.797. Finance 212 127.668. Public Works 39 40.879. Water Resources 478 34.4610. Law and Judiciary 3490 1198.2511 Industries, Energy and Labour 378 1195.5412 Rural Development and Water
Conservation 8878 6769.17
13 Food, Civil Supplies and Consumer Protection
85 206.49
14 Social Welfare, Cultural Affairs and Sports
1119 2427.17
15 Planning 4547 9572.4316 Housing and Special Assistance 152 68.2017 Public Health 4892 4628.6118 Medical Education and Drugs 1132 2404.0419 Tribal Development 182 428.3520 Co-operation and Textiles 576 35425.1221 Higher and Technical Education 301 856.4722 Women and Child Welfare 156 262.3023 Water Supply and Sanitation 199 839.8324 Trade Commerce and Mining 21 17.2625 Maharashtra Legislature Secretariat 3 0.3226 Environment 3 0.4327 Employment and Self Employment 5 6.7028 Urdu Academy 2 0.6929 Parliamentary Affairs 3 0.11
TOTAL 50015 145059.74

Appendices
215
APPENDIX - 2.12
(Reference: Paragraph 2.3.13; Page 36)
Delay in remittances of unspent amounts Sr.No
DDO/Department Period of IR Para No.
Subject Amount (Rupees in
lakh)
Remarks
1. Sub-Divisional Agriculture Officer, Amravati
01.12.2005 to 28.02.2007
2 Non-refund of Government grant lying unspent under compensation to farmers affected by reddening of cotton
7.15 In spite of DSAO’s instructions (12/06), unspent balance of Rs 7.15 lakh was not refunded/remitted as of March 2007.
2. District Superintending Agriculture Officer, Akola
01.09.2004 to 31.12.2006
2 Unspent balance of Rs.1.32 lakh under natural calamity
1.32 Unspent balance of Rs 1.32 lakh under natural calamity was not credited to Government account as of March 2007.
3. Special District Social Welfare Officer, Chandrapur
01.10.2004 to 30.06.2006
3 Non-crediting of unspent balance
2.89 Unspent balance of Rs 2.89 lakh of scholarship grant for the year 2004-05 was not credited ito Government account as of July 2007.
4. Collector, Osmanabad
01.10.2004 to 31.01.2006
5 Non-crediting of unspent balance
8.79 Unspent balance of Rs 8.79 lakh of grant received during 2004-05 was not credited to Government account as of March 2007.

Audit Report (Civil) for the year ended 31 March 2007
216
APPENDIX - 2.13
(Reference: Paragraph 2.4 ; Page 36)
Statement of unreconciled expenditure Sr. No.
Department Amount (Rupees in
crore)
Grant Number and Major
Head (1) (2) (3) (4) 1. General Administration 1.94 2012 – A-1 2. -do- 4.28 2013 – A-1 3. -do- 5.26 2015 – A-2 4. -do- 41.16 2059 – A-4 5. -do- 29.01 2251 – A-5 6. -do- 35.00 3053 – A-7 7. -do- 0.06 7610 - A-8 8. Home 249.75 2055 – B-1 9. -do- 2.19 2045 – B-4
10. -do- 2.41 2052 – B-4 11. -do- 2.72 2217 – B-6 12. -do- 45.94 2235 – B-6 13. -do- 17.21 2250 – B-6 14. -do- 192.05 3452 – B-7 15 -do- 0.44 5075 – B-9 16. -do- 148.76 5055 – B-9 17. -do- 5.85 7610 - B-10 18. Revenue and Forests 0.13 2029 – C-1 19. -do- 6.06 2053 – C-1 20. -do- 25.27 2225 - C-5 21. -do- 0.38 2406 – C-7 22. -do- 0.27 2415 – C-7 23. -do- 0.10 4235 – C-9 24. -do- 0.02 6245 – C-9 25. -do- 0.46 5475 – C-10 26. -do 7.81 7610 - C-12 27. -do- 0.20 2406 – C-18 28. Agriculture, Animal Husbandry, Dairy
Development and Fisheries 175.61 2404 – D-5
29. -do- 3.00 2405 – D-6 30. -do- 13.57 7610 - D-14 31. School Education and Sports 468.53 2202 – E-2 32. -do- 0.82 7610 - E-4 33. Finance 2.27 2020 – G-1 34. -do- 0.53 2040 – G-1 35. -do- -0.22 7610 - G-9 36. Public Works 0.42 5054 – H-9 37. -do- 7.63 7610 - H-11 38. Water Resources 10.22 7610 - I-7 39. Law and Judiciary 57.69 2014 – J-1 40. -do- -0.86 7610 - J-5 41. Industries, Energy and Labour 417.22 2049 – K-2 42. -do- 0.43 2057 – K-3 43. -do- 10.71 2058 – K-3

Appendices
217
APPENDIX - 2.13 (Concld.)
(1) (2) (3) (4) 44. Industries, Energy and Labour 363.47 2852 – K-7 45. -do- 5.01 4250 – K-9 46. -do- 0.14 6250 – K-9 47. -do- 6.00 4885 – K-10 48. -do- 0.94 7610 - K-12 49. Rural Development and Water Conservation 12.32 2505 – L-3 50. -do- 2.18 3451 – L-4 51. -do- 0.23 2515 – L-4 52. -do- 0.72 7610 - L-9 53. -do- 514.38 7615 – L-10 54. Food, Civil Supplies and Consumer Protection 0.63 3475 – M-3 55. -do- 0.52 7610 - M-5 56. Social Justice, Cultural Affairs and Special
Assistance 0.37 7610 - N-5
57. Planning 0.77 2701 – O-3 58. -do- 2.00 3425 – O-6 59. -do- 50.23 5465 – O-11 60. -do- -0.01 7610 - O-12 61. Housing 0.03 7610 - Q-6 62. Public Health 7.25 2210 – R-1 63. -do- 0.86 2011 – R-1 64. -do- 3.67 7610 - R-5 65. Medical Education and Drugs 0.32 7610 - S-4 66. Tribal Development 1.10 7610 - T-9 67. -do- 30.36 6225 – T-10 68. Environment 4.03 3435 – U-4 69. Co-operation, Marketing and Textiles 150.93 2425 – V-2 70. -do- 0.19 3456 – V-3 71. -do- 117.18 4425 – V-5 72. -do- 6.14 6425 – V-5 73. -do- 3.26 7610 - V-6 74. Higher and Technical Education 7.11 2205 – W-4 75. -do- 5.37 7610 - W-8 76. Women and Child Welfare 17.95 2236 – X-1 77. -do- 0.63 7610 - X-4 78. Water Supply and Sanitation 969.57 2215 – Y-2 79. Employment and Self Employment 0.06 7610 - ZA-4
TOTAL 4278.21

Audit Report (Civil) for the year ended 31 March 2007
218
APPENDIX - 2.14
(Reference: Paragraph 2.5.1 ; Page 36)
Statement of various grants/appropriations where expenditure exceeded the approved provision by Rs 25 lakh or more and also by more than 10 per cent of the total provision
(Rupees in crore)Sr. No.
Grant No
Name of the Grant Total Grant Actual Expenditure
Amount of Excess (Percentage)
1 C-5 Other Social Services 28.73 33.39 4.66 (16) 2 C-6 Natural Calamities 1750.21 2001.73 251.52 (14) 3 D-2A Relief on Account of Natural Calamities 100.56 145.55 44.99 (45) 4 K-6 Energy 2257.16 2541.01 283.85 (13) 5 L-1 Interest Payments 219.14 246.58 27.44 (13) 6 Q-1 Interest Payments 6.46 14.14 7.68 (119) 7 U-1 Interest Payments 1.27 1.80 0.53 (42) Total 4363.53 4984.20 620.67

Appendices
219
APPENDIX - 2.15
(Reference: Paragraph 2.5.2 ; Page 36)
Statement of cases where expenditure was incurred without any provision of funds (Rupees in crore)
Sr.No. Grant No. Head of Account Expenditure Home Department 1 B-1 2055-101-(00)(02) 0.07 2 B-3 2041-910(00)(02) 0.01 Revenue and Forest Department 3 C-6 2245-02-101(02)(01) 0.29 Urban Development Department 4 F-2 3606(502) 1.88 Water Resources Department 5 I-3 2702-01-800(16)(01)
2702-01-800(16)(04) 3606-502(00)(01)
0.72 0.22
35.87 Industries, Energy and Labour Department 6 K-6 3606-502 0.25 Social Justice, Cultural Affairs and Special Assistance Department 7 N-3 2235-01-800(01)(03) 0.01 Planning Department 8 O-7 3451-090-(03)(41) 0.23 Public Health Department 9 R-1 2210-01-110-7(06)(23) 0.14 10 R-1 2210-06-010-(01)(09) 0.50 Tribal Development Department 11 T-5 2505-60-796(03)(01) 0.05 12 T-5 2225-02-102(01)(01)(TASP) 0.65 13 T-5 2225-02-102(01)(01)(OTASP) 0.52 Total 41.41

Audit Report (Civil) for the year ended 31 March 2007
220
APPENDIX - 2.16
(Reference: Paragraph 2.6 ; Page 38)
Cases of drawal from Contingency Fund where the expenditure was not such as could not have been foreseen
Sr. No.
Sanction number and date
Department/Grant number/Major Head
Purpose for which drawn
Amount Sanctioned (Rupees in
crore) (1) (2) (3) (4) (5)
1. CNF-11-06/121 Bud -13 dated 10.05.2006
Industries Energy and Labour Department K-10 MH 6885
Loans to MELTRON for repayment of deposits in vested by Chief Ministers Relief Fund in it.
12.00
2. CNF-11-07/112 Bud-12 dated 24.01.2007
Co-operation, Marketing and Textile Department V-5 MH 6851
Expenditure for loans to Shri Bhagwati Sahakari Rasayan and Khat Udyog Limited.
2.63
3. CNF-11-07/115/Bud-16 dated 29.01.2007
Rural Development and Water Conservation Department L-2 MH 2053
Expenditure for purchase of 5000 Electronic Voting Machines for was in Zilla Parishad and Panchatyat Samiti Election.
2.75
4. CNF-11-07/149/Bud-12 dated 30.03.2007
Co-operation Marketing and Textile Department V-3 MH 6851
Expenditure regarding share capital contribution to Co-operative Spinning Mills
34.21
5. CNF-11-07/150/Bud-12 dated 30.03.2007
Agriculture, Animal Husbandry and Dairy Development and Fisheries Department D-5 MH 2404
Financial assistance to four Co-operative Dairy Development Departments for quality milk production and distribution under Central Government sponsored scheme
1.80
6. CNF-11-07/151/Bud-12 dated 30.03.2007
Co-operation, Marketing and Textiles Department V-3 MH 4425
Expenditure on account of Share capital contribution to Co-operative Sugar factories
9.00
7. CNF-11-07/152/Bud-12 dated 30.03.2007
Co-operation, Marketing and Textiles Department V-5 MH 6425
A non-plan expenditure regarding Loans invoking guarantee given by the Government Loans to Co-operative Sugar Mills
5.00
8. CNF-11.06/13/Bud-12 dated 17.05.2006
Co-operation, Marketing and Textiles Department V-2 MH 2425
Revision of interest and Loan taken by Grapes Growers Co-operative Society
4.20
9. CNF 11.06/80/Bud-4 dated 3.10.2006
Revenue and Forest Department C-10 MH 6401
Withdrawal to pay the dues of employees of Maharashtra State Farming Co-operation
1.84
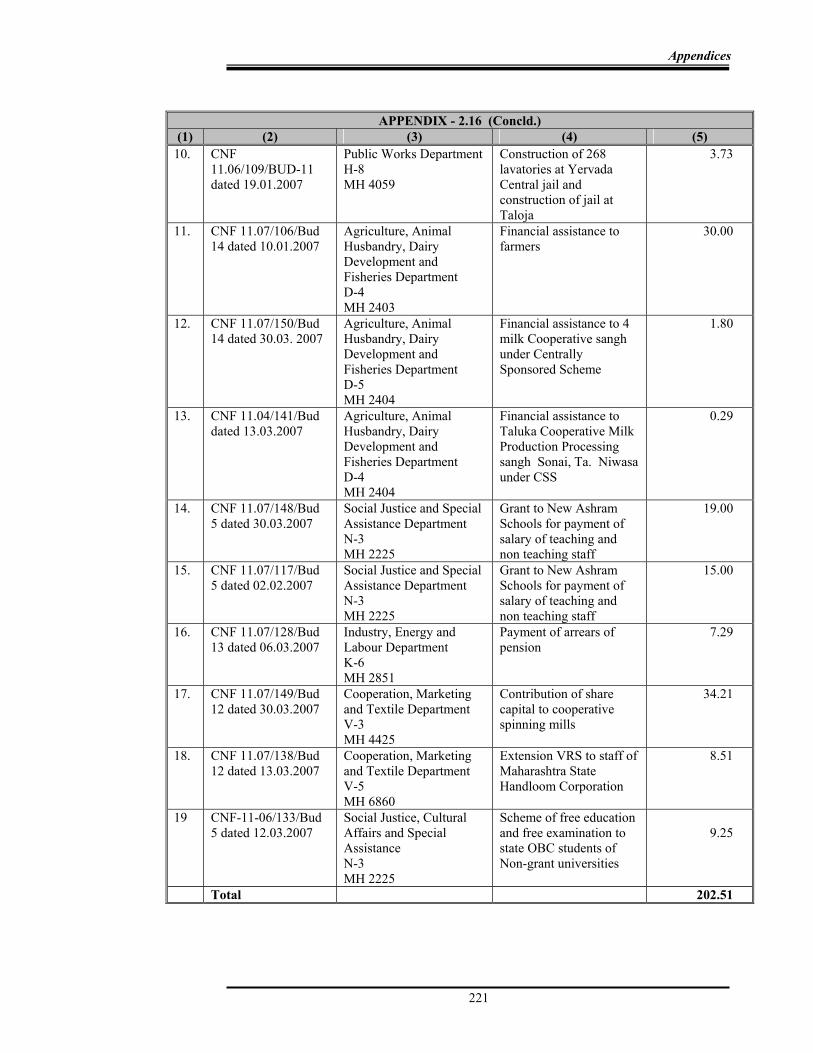
Appendices
221
APPENDIX - 2.16 (Concld.)
(1) (2) (3) (4) (5) 10. CNF
11.06/109/BUD-11 dated 19.01.2007
Public Works Department H-8 MH 4059
Construction of 268 lavatories at Yervada Central jail and construction of jail at Taloja
3.73
11. CNF 11.07/106/Bud 14 dated 10.01.2007
Agriculture, Animal Husbandry, Dairy Development and Fisheries Department D-4 MH 2403
Financial assistance to farmers
30.00
12. CNF 11.07/150/Bud 14 dated 30.03. 2007
Agriculture, Animal Husbandry, Dairy Development and Fisheries Department D-5 MH 2404
Financial assistance to 4 milk Cooperative sangh under Centrally Sponsored Scheme
1.80
13. CNF 11.04/141/Bud dated 13.03.2007
Agriculture, Animal Husbandry, Dairy Development and Fisheries Department D-4 MH 2404
Financial assistance to Taluka Cooperative Milk Production Processing sangh Sonai, Ta. Niwasa under CSS
0.29
14. CNF 11.07/148/Bud 5 dated 30.03.2007
Social Justice and Special Assistance Department N-3 MH 2225
Grant to New Ashram Schools for payment of salary of teaching and non teaching staff
19.00
15. CNF 11.07/117/Bud 5 dated 02.02.2007
Social Justice and Special Assistance Department N-3 MH 2225
Grant to New Ashram Schools for payment of salary of teaching and non teaching staff
15.00
16. CNF 11.07/128/Bud 13 dated 06.03.2007
Industry, Energy and Labour Department K-6 MH 2851
Payment of arrears of pension
7.29
17. CNF 11.07/149/Bud 12 dated 30.03.2007
Cooperation, Marketing and Textile Department V-3 MH 4425
Contribution of share capital to cooperative spinning mills
34.21
18. CNF 11.07/138/Bud 12 dated 13.03.2007
Cooperation, Marketing and Textile Department V-5 MH 6860
Extension VRS to staff of Maharashtra State Handloom Corporation
8.51
19 CNF-11-06/133/Bud 5 dated 12.03.2007
Social Justice, Cultural Affairs and Special Assistance N-3 MH 2225
Scheme of free education and free examination to state OBC students of Non-grant universities
9.25
Total 202.51

Audit Report (Civil) for the year ended 31 March 2007
222
APPENDIX - 2.17
(Reference: Paragraph 2.7; Page 38)
Actual funds released and spent under nine sectors vis-à-vis the Governor’s directives (Rupees in crore)
Vidarbha Marathwada Rest of Maharashtra Sector-wise
allocations during 2006-07
Allocation directed by Governor
Actual expenditure
Percentage of
expenditure to allocation
Allocation directed by Governor
Actual expenditure
Percentage of expenditure to allocation
Allocation directed by Governor
Actual expenditure
Percentage of expenditure to
allocation
Irrigation 941.91 1525.11 161.91 531.46 887.70 167.00 1006.63 808.76 80.34
Roads 171.64 104.99 61.16 47.76 20.76 43.46 166.46 93.85 56.38
General Education
5.61 0.00 0.00 5.02 0.00 0.00 18.87 0.00 0.00
Technical Education
33.74 8.19 24.27 22.87 10.05 43.94 82.04 24.63 30.02
Water Supply
0.00 0.00 0.00 8.85 8.85 100.00 0.00 0.00 0.00
Land Development
28.91 31.35 108.43 11.59 0.01 0.08 54.93 71.30 129.80
Veterinary Services
0.03 0.21 700.00 0.29 0.08 27.58 1.01 0.14 13.86
Health 60.05 11.85 19.73 149.42 10.20 6.82 256.33 42.14 16.44
Energisation of Pumps
201.81 0.00 0.00 76.49 0.00 0.00 71.28 0.00 0.00
Total 1443.70 1681.70 116.49 853.75 937.650 109.82 1657.55 1040.82 62.79

Appendices
223
APPENDIX - 3.1 (Reference: Paragraph 3.1.3; Page 41)
Statement showing the details of offices covered in audit
Number of implementing agencies in each district
Sr. No Name of the agency Number 1 Collector 1 2 Tahsildar 2 3 Zilla Parishad Irrigation 1 4 Zilla Parishad PWD 1 5 Executive Engineer (Local Sector) 1 6 Dy. Conservator of Forest 1 7 Dy. Director of Social Forestry 1 8 Executive Engineer PWD 2 9 Superintendent Agriculture Officer 1
10 Taluka Agriculture Officer 2 Total 13
Details of Implementing agencies district wise
District District level Taluka level Ahmednagar Collector Ahmednagar
Ex. Engineer (PWD) EGS Ex. Engineer (PWD) Ex. Engineer MI (Local Sector) Dy. Director Social Forestry Dy. Conservator of Forest The Superintendent Agriculture Officer
Pathardi Tahsildar Block Development Officer Taluka Agriculture Officer Dy. Engineer Sub-Division (PWD) Sangamner Tahsildar Block Development Officer Taluka Agriculture Officer Dy. Engineer Sub-Division (PWD) Ex. Engineer MI/LS
Aurangabad Commissioner Aurangabad Collector Ex. Engineer (PWD) Ex. Engineer MI (Local Sector) Dy. Director Social Forestry Dy. Conservator of Forest Superintendent Agriculture Officer
Phulmbari Tahsildar Taluka Agriculture Officer Block Development Officer Dy. Engineer (PWD) Sub-Division Khultabad Tahsildar Block Development Officer Taluka Agriculture Officer
Dy. Engineer (PWD) Sub-Division Sangli Collector
Superintendent Agriculture Officer Ex. Engineer PWD Ex. Engineer MI (Local Sector) Dy. Conservator of Forest Dy. Director of Social Forestry Ex. Engineer ZP (PWD) Ex. Engineer ZP (Irrigation)
Atpadi Tahsildar Block Development Officer Taluka Agriculture Officer Jath Tahsildar Taluka Agriculture Officer Dy. Engineer PED Sub-Division Dy. Engineer Irrigation Sub-Division
Solapur Commissioner Collector Treasury Officer Ex. Engineer PWD 1 Ex. Engineer PWD 2 Ex. Engineer MI (Local Sector)
Akkalkot Tahsildar Block Development Officer Taluka Agriculture Officer Dy. Engineer (PWD) Sub-Division Dy. Engineer (Irrigation) Sub-Division

Audit Report (Civil) for the year ended 31 March 2007
224
APPENDIX - 3.1 (Concld.) District District level Taluka level Solapur Dy. Conservator of Forests
Dy. Director of Social Forestry Superintendent Agriculture Officer Ex. Engineer ZP(PWD) 1 Ex. Engineer ZP(PWD) 2 Ex. Engineer PWD Pandharpur Solapur Municipal Corporation
Sangola Tahsildar Block Development Officer Taluka Agriculture Officer Dy. Engineer (PWD) Sub-Division Dy. Engineer (Irrigation) Sub-Division
Nandurbar
Collector Ex. Engineer PWD Ex. Engineer Narmada Irrigation Division Es. Engineer MI (Local Sector) Ex. Engineer ZP(PWD) Ex. Engineer ZP(Irrigation) Superintendent Agriculture Officer Dy. Director of Social Forestry Nandurbar Municipal Council
Navapur Tashildar Block Development Officer Range Forest Officer Plantation Officer Taluka Agriculture Officer Dy. Engineer (PWD) Sub-Division Sahada Tashildar Block Development Officer Ex. Engineer PWD Sahada Dy. Conservator of Forests Dy. Engineer (PWD) Sub-Division Dhadgaon Taluka Agriculture Officer Dy. Engineer Irrigation Sub-Division
Nasik
Commissioner Collector Ex. Engineer PWD (North ) Ex. Engineer PWD (East) Ex. Engineer MI (Local Sector) Ex. Engineer ZP(PWD) Ex. Engineer ZP(Irrigation) Dy. Conservator of Forest Dy. Director of Social Forestry Nasik Municipal Corporation
Trimbakeshwar Tahsildar Block Development Officer Taluka Agriculture Officer Range Forest Officer Igatpuri Tahsildar Block Development Officer Taluka Agriculture Officer Dy. Engineer PWD Sub-Division Range Forest Officer Dy. Engineer ZP (Irrigation) Sub-Division
Yavatmal Collector Ex. Engineer PWD Ex. Engineer ZP(PWD) Ex. Engineer MI(Local Sector) Superintendent Agriculture Officer Ex. Engineer ZP (Irrigation) Dy. Conservator of Forest Yavatmal Municipal Council
Babulgaon Tahsildar Taluka Agriculture Officer Pusad Tahsildar Taluka Agriculture Officer Ex.Engineer PWD Dy. Conservator of Forests Pusad Municipal council
Amravati Commissioner Collector Superintendent Agriculture Officer Ex. Engineer PWD Dy. Conservator of Forest Dy. Director of Social Forestry Ex. Engineer ZP (PWD) Ex. Engineer ZP (Irrigation) Amravati Municipal Corporation
Chandur Railway Tahsildar Taluka Agriculture Officer Dy. Engineer (PWD) Sub-Division Nandgaon Tahsildar Taluka Agriculture Officer Dy. Engineer (Irrigation) Sub-Division

Appendices
225
APPENDIX - 3.2 (Reference: Paragraph 3.1.6.3; Page 43)
Statement showing year-wise funds demanded, funds actually provided, expenditure incurred and
savings in the test-checked districts (Rupees in crore)
Name of the district
Year Funds demanded
Funds actually provided
Expenditure incurred
Savings
Nandurbar 2002-03 43.47 12.44 11.79 0.65 2003-04 43.56 6.63 6.56 0.07 2004-05 Not furnished. Not furnished. Not furnished. Not furnished. 2005-06 --do-- --do-- --do-- --do-- Total 87.03 19.07 18.35 0.72 Sangli 2002-03 57.77 4.99 4.76 0.23 2003-04 135.75 3.95 2.51 1.44 2004-05 192.46 8.03 6.29 1.74 2005-06 148.88 29.88 25.82 4.06 Total 534.86 46.85 39.38 7.47 Ahmednagar 2002-03 165.68 27.37 26.54 0.83 2003-04 580.46 19.24 18.65 0.59 2004-05 485.62 29.71 26.41 3.30 2005-06 512.29 33.39 32.29 1.10 Total 1744.05 109.71 103.89 5.82 Nashik 2002-03 62.10 27.50 26.92 0.58 2003-04 96.77 14.19 12.02 2.17 2004-05 74.17 37.59 35.76 1.83 2005-06 45.29 54.71 53.92 0.79 Total 278.33 133.99 128.61 5.37 Yavatmal 2002-03 29.81 21.36 21.04 0.32 2003-04 32.80 11.12 10.93 0.19 2004-05 48.53 16.84 13.26 3.58 2005-06 53.64 16.85 15.34 1.51 Total 164.78 66.17 60.57 5.60 Aurangabad 2002-03 43.24 71.37 63.22 8.15 2003-04 67.03 36.95 36.42 0.54 2004-05 99.15 82.02 78.92 3.10 2005-06 52.73 70.19 67.49 2.69 Total 262.15 260.53 246.05 14.48 Grand total 3071.20 636.32 596.85 39.46

Audit Report (Civil) for the year ended 31 March 2007
226
APPENDIX - 3.3 (Reference: Paragraph 3.1.8.3; Page 46)
Statement showing mandays generated and maximum number of mandays to be generated in the State and in
the selected districts during 2002-06. Position in the State as a whole
Year
Mandays generated (in lakh)
No. of registered labourers
Maximum no of manday to be generated
1 2 3 4 (Col 3 x 365) 2002-03 1545 2003-04 1853 2004-05 2217 2005-06 1690 Total 7305
Not available --
Position in selected Districts Year Mandays
generated (In lakh) ( per
centage to col 4)
Number of registered labourers (In lakh)
Maximum no of mandays to be generated (in lakh)
Nandurbar 2002-03 22.83 (5.95) 2003-04 17.06 (4.44) 2004-05 56.38 (14.68)
1.05 384
Sangli 2002-03 11.18 (2.78) 2003-04 73.48 (18.28) 2004-05 64.02 (15.93)
1.10 402
Ahmednagar 2002-03 63.72 (6.47) 2003-04 188.50 (19.13) 2004-05 140.55 (14.27)
2.71 985
Solapur 2002-03 127.48 (11.94) 2003-04 249.99 (23.47) 2004-05 195.39 (18.35)
2.92 1065
Amaravati 2002-03 39.22 (4.36) 2003-04 27.40 (3.04) 2004-05 45.50 (5.05)
2.47 900
Nasik 2002-03 61.20 (8.38) 2003-04 45.91 (6.29) 2004-05 69.35 (9.50)
2.00 730
Yavatmal 2002-03 44.89 (6.36) 2003-04 28.74 (4.07) 2004-05 31.33 (4.44)
1.95 706
Districtwise information for 2005-06 and 2006-07 is awaited
Note: The information regarding list of registered labourers was not available with the departments

Appendices
227
APPENDIX - 3.4 (Reference: Paragraph 3.1.12.3; Page 52)
Statement showing norms of Inspection to be carried out by the various authorities under EGS.
Sr No Designated Officer Inspection Norms Works in a year
1 Superintending Engineer 12 2 Executive Engineer 25 3 Dy Engineer 50 4 Joint Director (Agriculture) 12 5 District Superintendent Agriculture Officer 25 6 Sub Divisional Agriculture Officer 25 7 Taluka Agriculture Officer 50 8 Conservator of Forest 12 9 Dy. Conservator of Forests 25 10 Divisional Forest Officer 25 11 Asstt. Range Forest Officer 50 12 Director of Social Forest 12 13 Dy. Director of Social Forest 25 14 Asstt. Director of Forest 50 15 Officer on Special Duty 12 16 Executive Engineer in the O/O Divisional
Commissioner. 25
17 Deputy Engineer in the O/O Divisional Commissioner.
50
18 Accounts Officer Audit of accounts 12 19 District Collector One work of each PS 20 Dy. Collector/Tahsildar (EGS) 25 21 Executive Engineer Collector 25 22 Dy. Engineer Collector 50 23 Tahsildar 50 24 Sub Divisional Officer 50 25 Chief Executive Officer ZP One work of each PS 26 Executive Engineer ZP 25 27 Dy Engineer ZP 50 28 Project Officer TSP 25 29 Vigilance Branch of Div. Commissioner 12 30 Vigilance Branch of the Collector 25

Audit Report (Civil) for the year ended 31 March 2007
228
APPENDIX - 3.5
(Reference: Paragraph 3.2.6.1; Page 58)
Benefit Cost Ratio (Rupees in lakh)
Benefits Amount1. Existing benefits i) From un-irrigated culturable land under command of 1,90,000 ha @ Rs 81.02 per 1000 ha ii) From un-irrigated culturable land under submergence dam seat tail channel and colony 13588 ha @ Rs 81.02 per 1000 ha iii) From un-irrigated culturable land under submergence 1313 ha @ Rs 344.92 per 1000 ha iv) Reserved forest area 5142 ha @ Rs 6020 (i.e. 3.01 lakh for 50 years)
15394.40077
1076.635776
452.8757573
309.5484Total 17233.4607
2. Benefits after irrigation i) from command area 1,90,000 ha @ Rs 516.57 per 1000 ha ii) un-irrigated produce from galfer land of 2462 ha (60 per cent of 4103 ha) @ Rs 9952 per ha iii) Royalty receipt from Pesciculture yield for 17776 ha at 50 kg per ha = 888800 kg @ Rs 20 per kg iv) for industrial use of water v) for drinking purpose vi) benefits from Fishing about 150 kg per ha 19000 x 150 x 25
98148.44628
260.74
177.76
5601.00
56.02
712.50Total 104956.4663
3. Net benefit after irrigation (2-1) 87723.014. Benefit from Hydel schemes 670.58
Total benefits (3+ 4) 88393.59Annual Cost
2) Depreciation of i) pumping system @ 8.33 % assumed life as 12 years (10420.92 x 72 % = 7503.06) ii) rising main @ 3.33 % assumed life 30 years (2917.86 x 3.33) iii) 1 % of project cost less cost of pumps
625.00
96.16
5374.743) Annual operation cost i) 160915 ha. for flow irrigation (Rs. 300 / ha.) ii) 89885 ha. for lift irrigation (industrial rate considered in first RAA)
482.75
3938.804) Annual maintenances cost of head works @ 1% of cost of head works (89127.316 x 1 %)
891.27
5) i) Maintenance cost for canal irrigation (160915 ha x Rs 180 per ha) ii) Lift irrigation (65070 ha x Rs 600 per ha)
289.65 390.42
6) Depreciation of 2 % of flood protection + maintenance cost (4 %) of Rs 45.20 crore
271.20
7) Administrative changes @ Rs 75 per ha of 2,50,800 ha 188.10Total 67337.55 BCR calculation = 88393.59 / 67337.55 = 1.3

229
APPENDIX - 3.6 (Reference: Paragraph 3.3.7.2; Page 75)
Yearwise details of expenditure vis-a-vis budget provision
Name of Scheme 2002-03 2003-04 2004-05 2005-06 2006-07 Budget
provision Actual
Expenditure Budget
provision Actual
Expenditure Budget
provision Actual
Expenditure Budget
provision Actual
Expenditure Budget
provision Actual
Expenditure Social Justice and Special Assistance Department Reimbursement of tuition fees and exam fees to BC students
1477.43 1589.43 1917.27 1928.38 1851.63 2006.59 2841.81 3247.35 9337.91 5245.34
Award of scholarship to BC Girl students studying in Std V to VII
701.44 618.48 529.88 517.94 1339.68 1132.15 1783.90 1629.20 1629.04 1601.59
Government of India Post Matric Scholarship Scheme 6748.67 6860.34 9062.92 9010.66 25531.25 14631.73 12077.92 12581.58 13781.44 13848.96 Book Bank Scheme for SC students 209.14 176.76 184.86 176.16 484.04 337.14 311.96 267.91 400.48 301.42 Pre-Matric Scheme to children of those who are engaged in unclean occupation
518.60 641.99 658.37 682.20 664.48 820.65 1227.39 1207.65 1401.77 1327.23
Award of scholarship to BC Girl students studying in Std VIII to X
00 00 2719.19 1978.70 2245.86 2312.37 2450.83 2392.05 2999.42 2937.18
Scholarship to SC student for abroad studies 00 00 93.63 93.63 172.05 126.88 150.84 147.18 383.95 280.73 Establishment of schools for children whose parents are engaged in unclean occupation
26.41 26.41 42.95 42.95 39.53 39.53 48.29 48.29 49.64 43.54
Government Hostel facilities 1806.55 1806.55 2485.84 2485.84 2281.20 2281.20 4864.04 4864.04 4044.72 3927.22 GIA to hostel run by volentry organisation 2281.08 2281.08 4466.26 4466.26 6372.17 6372.17 6965.66 6965.66 4356.08 4356.08 GIA for construction/Expansion of building for SC boys and Girls
5.44 5.44 150.71 150.71 00 00 115.24 115.24 78.26 15.68
Total 13774.76 14006.48 22311.88 21533.43 40981.89 30060.41 32837.88 33466.15 38462.71 33884.97 Tribal Development Department Govt. hostels 2090.07 2264.82 2057.79 2853.82 2802.79 2688.92 3435.69 3435.69 3944.66 3812.48 Govt. ATS 14830.69 14837.99 17878.82 17883.04 17929.54 17855.11 22814.79 22814.79 25495.21 25416.74 Tuition fees/examination fees 253.01 253.01 217.44 217.27 360.76 355.91 381.71 381.71 511.86 506.52 G.O.I scholarship 1399.05 1399.05 1400.00 1401.50 2426.31 2463.00 2155.43 2155.43 3741.61 3796.59 Award of Scholorship to S.T. Girls to stop drop out at school level
1434.74 1434.74 1450.52 1445.40 1805.62 1805.62 1996.08 1811.64
GIA to NGOs for running Ashram Schools 13126.36 13153.67 13962.55 13859.77 13331.62 13437.88 15936.85 15936.85 18710.3 13684.01 Total 31699.18 31908.54 36951.34 37650.14 38301.54 38246.22 46530.09 46530 54399.72 49027.98

Audit Report (Civil) for the year ended 31 March 2007
230
APPENDIX - 3.7
(Reference: Paragraph 3.4.5; Page 92)
District-wise and Agency-wise expenditure under RSVY (Rupees in crore)
Agency Ahmed-nagar
Bhan-dara
Chandr-apur
Dhule Gadchiroli Gondia Hingoli Nanded Nand-urbar
Total
EE Irrgn Dn ZP/ Irrn
Dn
3.20 -- -- 1.34 1.70 -- 1.60 -- 1.85 9.69
EE PW Dn ZP
-- -- --- -- -- -- -- 2.85 4.49 7.34
DHO
(ZP)r
-- 2.33 2.28 1.93 -- 2.36 0.96 1.69 -- 11.55
ADO(ZP) 3.19 1.59 8.07 -- 2.51 2.90 -- 0.48 -- 18.74
EO(ZP) -- -- -- 2.61 -- -- 1.29 -- 0.47 4.37
DCF 0.76 -- -- -- 2.13 0.72 -- -- 3.02 6.63
NGO/Corpn
VEDHA -- 1.12 -- -- -- -- -- -- -- 1.12
MAVIM -- 1.53 -- -- 1.64 -- -- -- -- 3.17
MITTRA -- -- -- -- 1.03 -- -- -- -- 1.03
DSAO -- -- -- -- -- -- -- 0.66 -- 0.66
PWD -- -- -- 0.67 2.39 -- -- -- -- 3.06
DSO -- -- -- -- -- -- 0.61 -- -- 0.61
MI(ZP) -- 1.69 3.37 0.49 -- -- -- -- -- 5.55
MSEDCL -- 1.45 -- -- -- -- -- -- -- 1.45
Fisheries -- 1.38 -- -- -- -- -- -- -- 1.38
ADHO -- -- 1.83 0.43 1.93 1.89 -- 2.27 -- 8.35
Total 7.15 11.09 15.55 7.47 13.33 7.87 4.46 7.95 9.83 84.70

Appendices
231
APPENDIX - 3.8 (Reference: Paragraph 3.4.7.1; Page 94)
Shortfall in release of funds by GOI
Funds due upto March 2007
Funds received
upto March 2007
Shortfall
District Year of starting
No. of years
completed upto
March 2007 (Rupees in crore)
Shortfall percentage
Ahmednagar 2005-06 2 30 22.50 7.50 25Bhandara 2003-04 3 45 22.50 22.50 50
Chandrapur 2004-05 3 45 22.50 22.50 50Dhulia 2005-06 2 30 15 15 50
Gadchiroli 2003-04 3 45 30.00 15.00 50Gondia 2004-05 3 45 30 15 33Hingoli 2005-06 2 30 22.50 7.50 25Nanded 2005-06 2 30 30 -- --
Nandurbar 2005-06 2 30 15 15 50Total 330 210 120 36.36

Audit Report (Civil) for the year ended 31 March 2007
232
APPENDIX - 3.9
(Reference: Paragraph 3.4.7.1; Page 94)
Delay in release of funds by State Government (Amount in crore)
Year Date of release of funds by GOI to State
Amount District Date of release of
funds by State to DRDA
Amount Period of delay
(months)
2003-04 16.9.03 7.50 Bhandara 12.11.03 7.50 2
16.9.03 7.50 Gadchiroli 12.11.03 7.50 2
2004-05 11.5.04 7.50 Gondia 16.8.04 5.00 3
11.5.04 7.50 Gondia 8.11.04 2.50 6
11.5.04 7.50 Chandrapur 16.8.04 5.00 3
11.5.04 7.50 Chandrapur 8.11.04 2.50 6
21.5.04 7.50 Gadchiroli 16.8.04 1.00 3
21.5.04 7.50 Gadchiroli 10.2.05 6.50 9
21.5.04 7.50 Bhandara 16.8.04 1.00 3
21.5.04 7.50 Bhandara 10.2.05 6.50 9
2005-06 27.1.06 7.50 Nandurbar 29.8.06 7.50 7
3.3.06 7.50 Gondia 29.8.06 7.50 5
14.3.06 7.50 Ahmednagar 29.8.06 7.50 5
16.3.06 7.50 Dhule 29.9.06 7.50 6
23.3.06 7.50 Gadchiroli 29.9.06 7.50 6
24.3.06 7.50 Chandrapur 29.9.06 7.50 6
2006-07 29.8.06 7.50 Gondia 9.2.07 7.50 5
28.12.06 7.50 Nanded 9.2.07 7.50 2
5.1.07 7.50 Ahmednagar 9.2.07 7.50 1

Appendices
233
APPENDIX - 3.10
(Reference: Paragraph 3.4.8; Page 96)
Implementation of the District Plan District-wise allocation on Agriculture, Employment Generation and construction
(Rupees in lakh)Employment Generation
Agriculture Construction Miscellaneous District
Allocation Per cent Allocation Per cent Allocation Per cent Allocation Per cent
Ahmednagar 297.60 6 1870.50 42 1800 40 531.90 12
Bhandara 365.34 8 1425.05 32 1574.88 35 1135.29 25
Chandrapur 614.98 14 1718.87 38 1121.00 25 967.48 21
Dhule 528.23 12 1829.39 41 862.00 19 1232.23 27
Gondia 586.23 13 1738.00 39 1582.77 35 537.53 12
Hingoli 178.56 4 1201.88 27 2693.20 60 388.27 9
Nanded 111.50 2 1951.75 43 2155.70 48 282.24 7
Nandurbar 99.88 3 1164.73 26 2333.84 52 851.56 19

Audit Report (Civil) for the year ended 31 March 2007
234
APPENDIX – 3.11
(Reference: Paragraph 3.4.8.1; Page 96)
Targets and Achievements Number of schemes with achievement Total no. of
schemes 0 to 50 per cent 51 to 99 per cent 100 per cent and more
Name of District
Agri.-* Emp Gen.* Agri. Emp Gen. Agri. Emp Gen. Agri. Emp Gen.
Ahmednagar 6 10 5 6 -- 2 1 2Bhandara 14 14 11 9 1 2 2 3Chandrapur 10 10 6 9 3 1 1 --Dhule 11 4 8 2 2 1 1 1Gadchiroli 4 4 2 1 1 2 1 1Gondia 16 18 10 12 2 2 4 4Hingoli 3 3 3 3 -- -- -- --Nanded 5 2 3 1 2 1 -- --Nandurbar 9 5 8 4 1 1 -- --Total 78 70 56 47 12 12 10 11
* Agri. = Agriculture Related Schemes , Emp. Gen. = Employment Generation Related Schemes.

Appendices
235
APPENDIX - 3.12 (Reference: Paragraph 3.4.8.3; Page 98)
Inadmissible expenditure under RSVY
Sr No
District Name of the Department Number and type of vehicle/computer
Expenditure incurred
(Rupees in lakh)1 Chandrapur Sericulture Department Mobile A/C Van 4.912 MAVIM Training Mobile Van 6.973 DRDA Scorpio 9.85 4 DRDA Mobile van 6.79 5 DHO Mobile van 24.606 MS Tribal Corporation Mini Truck
Mobile Van 7.00 7.00
Gadchiroli DHO Ambulance (5 nos) 36.66 Tyres & Tubes 4.65 Rural Water Supply
Department ZP Trucks (2) 20.14
Tyres and Repairs 2.23 Gram Panchayat Tractor (3)
Mini Tempo (1) 14.81
Bhandara DHO Mobile Van (19 nos.) 83.25 PD DRDA, Bhandara Purchase of
Laptop/Computers 3.56
Total 232.42

Audit Report (Civil) for the year ended 31 March 2007
236
APPENDIX - 3.13 (Reference: Paragraph 3.5.7.6; Page 108)
Table showing variation in area of cotton cultivation
Area of cotton cultivation (in hectare) as reported by
District
MRSAC DSAO & ADO(ZP) (per cent) increase
Collector (through Talathi) (per cent) increase
Number of
farmers
Amount paid
(Rupees in lakh)
Replies by DSAO about difference
Akola 170120 197501 (16) 213098 (25)
178804 2116.41 The difference will be verified and results of verification will be intimated to audit
Amravati 212790 241051 (13) 254400 (20)
255271 2623.00 The CCR for 2005-06 was prepared on a assumptive basis. However, compensations were made as per actual area where cotton was sown.
Buldhana 190770 209630 (10) 278963 (46)
288395 2534.99 No reply
Wardha 105460 96632 (-8) 137163.52 (30)
121473 1357.82 No reply
Washim 56880 58591 (3) 82400 (45) 70567 823.77 Compensations were made as per the list provided by the Collector.
Yavatmal 31320 320494 (2) 349200 (11)
254630 3490.00 CCR is a estimation of over all trend observed. Compensation was, however, paid as per actual sown area
TOTAL 767340 1123899 1315224.50 1169140 12945.99

237
APPENDIX - 4.1 (Reference: Paragraph 4.2.5, Page 117)
Excess payment of additional component
Name of the project and name of village where land
acquired is located
Date of declaration of
award and amount
Value of land and houses included in
the amount of award
Date and amount of advance payment
Additional component on the amount shown in
Column 3
Additional component
admissible on amount in
Column 4 less amount in column 3
Excess payment
1 2 3 4 5 6 7 Wakod Medium Project,Village Leha, Taluka- Fulambri, Dist. Aurangabad
04-11-2005 Rs 678.69 lakh
Rs 296.84 lakh 12-04-1996 Rs 97.61 lakh
Rs 290.91 lakh Rs 195.25 lakh Rs 95.66 lakh
Bembla Project, Taluka Babhulgaon, Dist. Yavatmal, Village – Thalegaon
09-06-2005 Rs 717.00 lakh
Rs 484.49 lakh 26-04-2004 Rs 48.08 lakh
Rs 87.20 lakh Rs 80.71 lakh Rs 6.49 lakh
Village Barad Yavatmal 27-06-2005 Rs 590.88 lakh
Rs 401.68 lakh 29-05-2004 Rs 114.99 lakh
Rs 68.28 lakh Rs 58.03 lakh Rs 10.25 lakh
Village Malapur Yavatmal 31-05-2005 Rs 464.56 lakh
Rs 316.03 lakh 31-05-2004 Rs 78.97 lakh
Rs 53.72 lakh Rs 47.04 lakh Rs 6.68 lakh
Village, Kopra Yavatmal 15-01-2007 Rs 808.93 lakh
Rs 542.63 lakh 22-03-2004 Rs 150.69 lakh
Rs 103.10 lakh Rs 85.02 lakh Rs 18.08 lakh
Sillegaon Project, Village Sillegaon, Tah. Gangapur , Dist. Auragabad
24-02-2005 Rs 202.84 lakh
Rs 107.21 lakh March 2001 Rs 103.75 lakh
Rs 64.32 lakh Rs 14.72 lakh Rs 49.60 lakh
Total Rs 3417.90 lakh Rs 2148.88 lakh Rs 594.09 lakh Rs 667.53 lakh Rs 480.77 lakh Rs 186.76 lakh

Audit Report (Civil) for the year ended 31 March 2007
238
APPENDIX - 4.2
(Reference: Paragraph 4.3.11; Page 132)
Statement showing excess payment of mobilisation advance/machinery advance Rupees in crore
Work 1 Work 2 Total Estimated cost 24.64 10.81 Mobilisation advance admissible as per agreement (5 per cent of estimated cost)
1.23 0.54 1.77
Mobilisation advance actually paid 2.44 1.08 3.52 Excess mobilisation advance paid 1.21 0.54 1.75 Machinery advance admissible as per agreement (90 per cent of the cost of new machinery and 75 per cent of the depreciated cost of old machinery limited to 10 per cent of estimated cost)
0.64 0.16 0.80
Machinery advance paid at 75 per cent of the present evaluated cost of old machinery
1.22 0.36 1.58
Excess machinery advance paid 0.58 0.20 0.78 Total excess advance paid 1.79 1.74 2.53

239
APPENDIX - 4.3 (Reference: Paragraph 4.5.4; Page 155)
Statement showing outstanding IRs and paras issued upto December 2006 but outstanding as on 30 June 2007 Upto 2001-02 2002-03 2003-04 2004-05 2005-06 2006-07 Total IR Paras IR Paras IR Paras IR Paras IR Paras IR Paras IR Paras
Agriculture, Animal Husbandry, Dairy Development and Fisheries
206 300 37 90 84 132 108 555 132 411 104 405 671 1893
Co-operation and Textile 221 354 55 128 74 149 64 141 47 120 48 127 509 1019 Employment and Self Employment 01 01 -- -- -- -- 02 05 02 04 02 03 07 13 Environment 01 01 -- -- 01 01 -- -- -- -- -- -- 02 02 Finance 05 07 05 05 07 13 08 15 08 13 10 25 43 78 Food and Civil Supplies 01 01 -- -- 02 05 02 02 01 02 04 06 10 16 General Administrative 08 10 06 07 06 09 08 17 08 17 09 22 45 82 Higher and Technical Education and
Employment 302 660 57 91 64 130 129 432 87 486 135 703 774 2502
Home 136 219 38 87 35 81 83 226 86 282 32 191 410 1086 Housing and Special Assistance 01 01 -- -- 01 01 04 09 01 02 02 08 09 21 Industry, Energy and Labour 26 44 10 20 28 52 19 39 17 43 19 69 119 267 Irrigation 414 977 74 176 65 174 108 296 149 511 86 396 896 2530 Law and Judiciary 08 10 07 11 15 27 15 23 18 42 28 55 91 168 Maharashtra Legislature Secretariate -- -- -- -- -- -- -- -- 01 10 -- -- 01 10 Medical Education and Drugs 77 134 18 46 24 65 31 98 23 117 22 132 195 592 Planning -- -- -- -- -- -- 02 03 02 05 02 06 06 14 Public Health 57 74 35 71 34 71 92 223 109 335 47 213 374 987 Public Works 149 318 51 132 58 172 109 338 113 571 66 331 546 1862 Revenue and Forest 729 1682 150 433 206 633 271 854 277 992 225 1053 1858 5647 Rural Development and Water
Conservation 754 1350 173 512 643 2300 221 1053 279 1145 507 2843 2577 9203
School Education and Sports 29 41 16 22 22 39 36 81 14 43 8 47 125 273 Social Welfare, Cultural Affairs,
Sports and Tourisum 131 219 47 96 22 52 64 173 48 171 40 141 352 852
Tribal Development 31 51 23 53 09 18 26 58 32 134 26 115 147 429 Urban Development 04 47 04 19 08 164 12 102 08 206 10 164 46 702 Women and Child Welfare 70 105 43 72 34 72 55 120 85 192 62 127 349 688 Water Supply and Sanitation 01 01 01 01 01 01 03 08 12 32 20 80 38 123 Total 3362 6607 850 2072 1443 4361 1472 4871 1559 5886 1514 7262 10200 31059

Audit Report (Civil) for the year ended 31 March 2007
240
APPENDIX - 4.4
(Reference: Paragraph 4.5.4; Page 156)
Statement showing number of paragraphs/reviews in respect of which Government explanatory memoranda (UORs) had not been received.
Sr. No.
Name of Department upto 1998-
99
1999 -2000
2000 -01
2001 -02
2002 -03
2003 -04
2004 -05
2005-06
Total
1 Agriculture, Animal Husbandry, Dairy Development and Fisheries
6 3 -- 3 6 2 3 1 24
2 Co-operation and Textiles
1 -- -- -- -- 1 1 -- 3
3 Finance -- -- -- -- -- -- -- 1 14 Food, Civil Supplies and
Consumer Protection -- -- -- -- -- 1 1 1 3
5 General Administration 1 -- -- -- -- -- -- 1 26 Home -- -- -- -- -- -- 1 2 37 Housing 12 -- 1 2 4 1 5 6 318 Higher and Technical
Education -- -- -- -- -- -- -- 2 2
9 Industry, Energy and Labour
-- -- 1 -- 1 1 -- -- 3
10 Medical Education & Drugs
1 2 -- 1 3 3 -- 1 11
11 Planning 2 -- -- -- -- -- 2 -- 412 Public Health 4 1 -- 1 -- 2 1 -- 913 Public Works -- -- -- -- -- -- 1 1 214 Revenue and Forests 8 1 -- -- 1 1 4 3 1815 Rural Development and
Water Conservation 20 -- -- 1 1 1 -- 1 24
16 Social Justice, Cultural Affairs and Special Assistance
5 1 -- 3 -- 2 -- 1 12
17 Tribal Development -- 1 -- -- -- -- -- 1 218 Urban Development 4 -- -- -- 3 3 1 -- 1119 Water Supply and
Sanitation -- -- 3 -- 1 -- -- 2 6
20 Water Resources 5 2 1 1 -- 5 6 10 3021 Women and Child
Welfare 5 -- -- -- 1 1 -- -- 7
22 School Education -- -- -- -- -- -- -- 1 123 Employment and Self
Employment -- -- -- -- -- -- -- 1 1
Total 74 11 6 12 21 24 26 36 210

Appendices
241
APPENDIX - 5.1
(Reference: Paragraph 5.1.1; Page 158)
Statement showing details of schemes implemented by the Women and Child Development Department
Sr. No. Child Welfare 1 GIA to NGOs for Children Care and Protection and for destitute children 2 Balika Samruddhi Yojna Women Welfare 1 GIA to NGOs for running shelter homes 2 GIA to MAVIM (SHG) 3 GIA to Mahila Mandal 4 Counselling centres for women - GIA 5 Scholarship/Stipend to women for Vocational training 6 Abolition of Dowry - GIA 7 Scheme for rehabilitation of Devdasi - GIA to NGOs 8 Marriage Allowances to the daughter of destitute and deserted women - GIA 9 Establishment of women multipurpose centre GIA 10 Ahilyabai Holkar Award 11 Subsistence grants to devdasis 12 Swayamsiddha (CSS) - GIA 13 Kamdhenu Yojna - GIA 14 Habitual offenders, Probation of offender scheme 15 GIA for Self Employment Scheme to women 16 GIA to NGOs for conducting group marriages of farmers daughters Schemes under ICDS 1 Distribution of nutritious food and beverages Urban

Audit Report (Civil) for the year ended 31 March 2007
242
APPENDIX - 5.2
(Reference: Paragraph 5.1.2; Page 159)
Organisational Chart
Secretary, Women and Child Development Department
Commissioner, Women and Child Development
Department
Secretary, Integrated Child Development Services
Deputy Chief Executive Officer, Zilla Parishad (33)
District Women and Child Development Officer (35)
Child Development Project Officer Urban (78)
Government Institutes (81)
Non-Government Organisation
(518)
Child Development
Project Officer Rural (280)
Child Development
Project Officer Tribal (58)
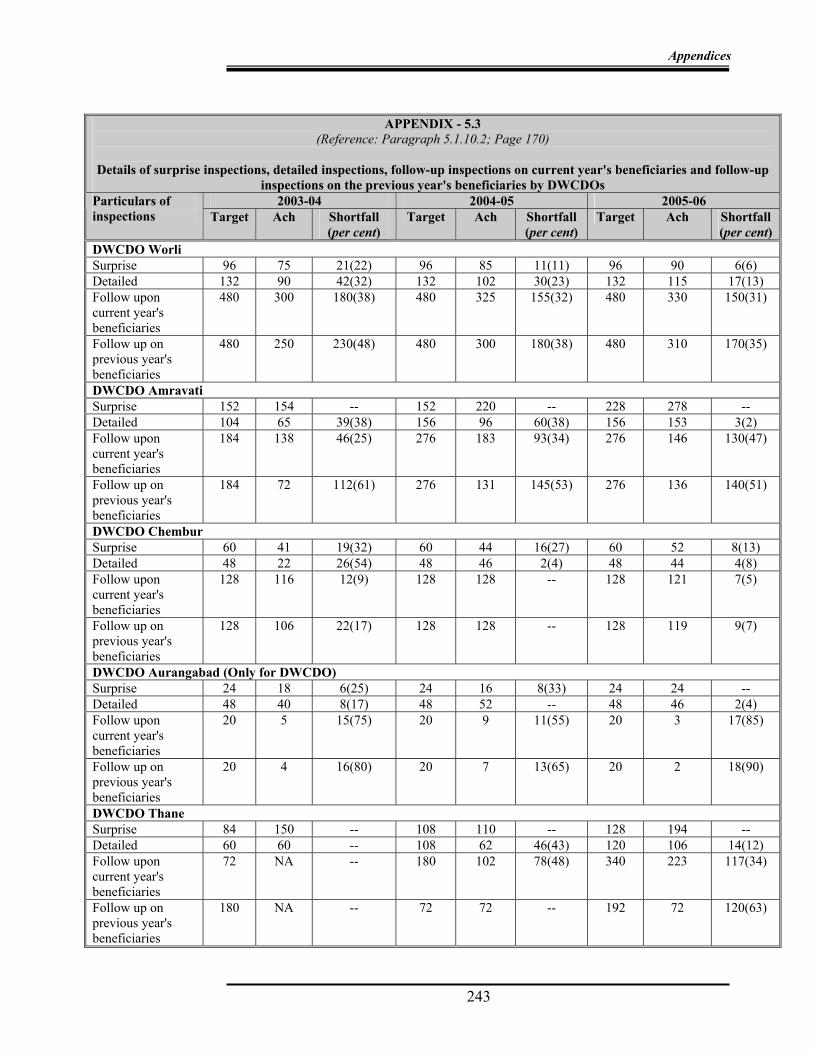
Appendices
243
APPENDIX - 5.3
(Reference: Paragraph 5.1.10.2; Page 170)
Details of surprise inspections, detailed inspections, follow-up inspections on current year's beneficiaries and follow-up inspections on the previous year's beneficiaries by DWCDOs
2003-04 2004-05 2005-06 Particulars of inspections Target Ach Shortfall
(per cent) Target Ach Shortfall
(per cent) Target Ach Shortfall
(per cent) DWCDO Worli Surprise 96 75 21(22) 96 85 11(11) 96 90 6(6) Detailed 132 90 42(32) 132 102 30(23) 132 115 17(13) Follow upon current year's beneficiaries
480 300 180(38) 480 325 155(32) 480 330 150(31)
Follow up on previous year's beneficiaries
480 250 230(48) 480 300 180(38) 480 310 170(35)
DWCDO Amravati Surprise 152 154 -- 152 220 -- 228 278 -- Detailed 104 65 39(38) 156 96 60(38) 156 153 3(2) Follow upon current year's beneficiaries
184 138 46(25) 276 183 93(34) 276 146 130(47)
Follow up on previous year's beneficiaries
184 72 112(61) 276 131 145(53) 276 136 140(51)
DWCDO Chembur Surprise 60 41 19(32) 60 44 16(27) 60 52 8(13) Detailed 48 22 26(54) 48 46 2(4) 48 44 4(8) Follow upon current year's beneficiaries
128 116 12(9) 128 128 -- 128 121 7(5)
Follow up on previous year's beneficiaries
128 106 22(17) 128 128 -- 128 119 9(7)
DWCDO Aurangabad (Only for DWCDO) Surprise 24 18 6(25) 24 16 8(33) 24 24 -- Detailed 48 40 8(17) 48 52 -- 48 46 2(4) Follow upon current year's beneficiaries
20 5 15(75) 20 9 11(55) 20 3 17(85)
Follow up on previous year's beneficiaries
20 4 16(80) 20 7 13(65) 20 2 18(90)
DWCDO Thane Surprise 84 150 -- 108 110 -- 128 194 -- Detailed 60 60 -- 108 62 46(43) 120 106 14(12) Follow upon current year's beneficiaries
72 NA -- 180 102 78(48) 340 223 117(34)
Follow up on previous year's beneficiaries
180 NA -- 72 72 -- 192 72 120(63)

© COMPTROLLER AND AUDITOR GENERAL OF INDIA
2007