appendix, 1.2.2 impact assessment on ,river feale
TRANSCRIPT
a
.i :
‘*
Appendix, 1.2.2 Impact Assessment on ,River Feale Increased Effluent
Chloride
For
insp
ectio
n pur
pose
s only
.
Conse
nt of
copy
right
owne
r req
uired
for a
ny ot
her u
se.
EPA Export 25-07-2013:14:49:52
a
Assessment of the Impact of Increased Effluent Chloride Concentrations from
Kerry Ingredients on the River Feale Listowel - County Kerry
(April 2005)
Commissioned by: Kerry Ingredients plc (Listowel) Carried out by: Aquatic Services Unit, UCC (April 2005)
For
insp
ectio
n pur
pose
s only
.
Conse
nt of
copy
right
owne
r req
uired
for a
ny ot
her u
se.
EPA Export 25-07-2013:14:49:52
Introduction and Brief
The Aquatic Services Unit (ASU) were commissioned by Kerry Ingredients to assess how their request to increase their IPC License limit for effluent chloride concentration at their Listowel plant to 2,000 mg/l, would impact the aquatic biota of the River Feale downstream of the discharge.
General Study Approach
In undertaking this assessment, ASU used recent historical flow data for the River Feale at Listowel (1976-2001) and combined this with the maximum expected effluent discharge flow and chloride concentration (2,000 mg/l, Cl) in order to calculate typical downstream chloride concentrations in the river. These values were then compared with published chloride toxicity data in the literature in order to assess their likely significance for biota of the River Feale.
Chloride Toxicity as Revealed iu the Literature - Overview
Overview
The majority of the published toxicity data on chloride is based on single species laboratory based toxicity testing, whereas similar field data are less common. Those field studies which are available tend to be confined to arid regions of the world where intensive irrigation or other hydrological phenomena have lead to widespread salinization of the soil which in turn has lead to very elevated sodium chloride levels in rivers, streams and lakes. Much of the published data from arid regions comes from Australia where this is a significant problem over wide areas, with some also from the US and South Africa. In an effort to better manage high chloride discharges to surface waters several significant reviews have been undertaken on the impacts of salinity and chloride on aquatic biota in Australia. Some work has also been undertaken on the impact of chloride derived from roadway de-icing on surface water (e.g. in Canada) and on naturally occurring hyper saline waters (e.g. in the US).
Limitations of Published Data
The main limitation of the vast majority of the published data on the environmental impact of elevated chloride is that it refers to work done outside the temperate regions of western Europe and so many of the species referred to do not occur in Irish tieshwaters. In many cases, however, species of the same genus or family may occur in Ireland, which will generally give an adequate insight into the likely effects. It also appears that whole groups tend to react in particular ways e.g. mayflies (Ephemeroptera) tend to be quite sensitive to chloride, whereas fish as a group appear to be relatively resistant. It should be borne I mind, however, that there are exceptions to the latter rule in most groups e.g. mayfly larvae of the genus Caenis are significantly more tolerant that other Ephemeroptera. Finally, while field observations are always very welcome because they more adequately reflect the complexity of organism and community responses, there may be difficulties in accurately apportioning the degree of observed impact to a single toxicant e.g. chloride as other water chemistry and or ecological biotic factors may be equally or even more influential.
For
insp
ectio
n pur
pose
s only
.
Conse
nt of
copy
right
owne
r req
uired
for a
ny ot
her u
se.
EPA Export 25-07-2013:14:49:52
Specific Published Studies and Results
USEPA 1988
e
0
The *USEPA published their ‘Ambient Water Quality Criteria for Chloride’ in 1988 (EPA 440/5-88-001 February 1988), which they based on a detailed review of the published data on the subject as it applied to freshwater organisms, which occur in the United States. In this (USEPA 1988), they present guideline criteria for chloride (as sodium chloride) for aquatic animals in fieshwaters. They did not set criteria for aquatic plant life because there were insufficient data available on an ‘important’ plant species. Their criteria are as follows:
‘except where a locally important species is very sensitive, freshwater aquatic organisms and their uses should not be afected unacceptably if the four-day average concentration of chloride, associated with sodium, does not exceed 230 mgll more than once every three years on average and if the one- hour average concentration does not exceed 86Omg/l more than once every three years on average ’
They add that:
‘because freshwater animals have a narrow range of acute susceptibilities to chloride, excursions above this criterion might affect a substantial number of species’.
As these appear to be the criteria still in force in the US on a national basis, they have been taken as the benchmark against which to assess the likely chloride concentrations in the Feale if the Kerry Ingredients effluent chloride concentration is increased to 2,000 mg/l. In doing this, the concentrations outlined (i.e. 23Omg/l, and 860 mg/l) were compared to the toxicities reviewed in USEPA 1988 and in other literature in order to gauge whether they appeared to offer a reasonable degree of protection.
It is important to point out that it has been shown (USEPA 1988) that the toxicity of chloride as sodium chloride is less than the toxicity of chloride in the form of potassium chloride, magnesium chloride or calcium chloride.
Other Published Studies and Reviews
In this section, specific chloride concentrations and related observations are presented to give an overview of the range of chloride concentrations, which are significant for freshwater organisms. Here, wherever possible, the emphasis will be placed on species or groups known to occur in Ireland and or the River Feale.
For
insp
ectio
n pur
pose
s only
.
Conse
nt of
copy
right
owne
r req
uired
for a
ny ot
her u
se.
EPA Export 25-07-2013:14:49:52
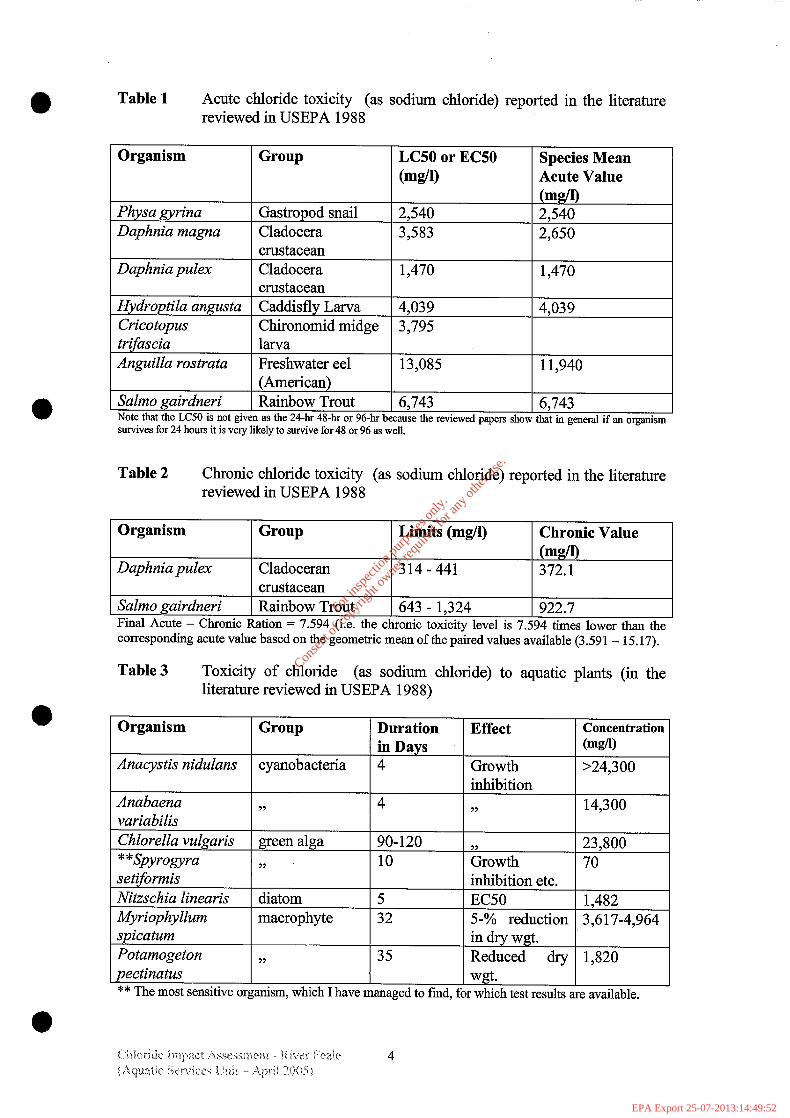
Table 1 Acute chloride toxicity (as sodium chloride) reported in the literature reviewed in USEPA 1988
Organism Group LC.50 or EC50 Species Mean @m Acute Value
(mg/l) Physa gyrina Gastropod snail 2,540 2,540 Daphnia magna Cladocera 3,583 2,650
crustacean Daphnia pulex Cladocera 1,470 1,470
crustacean Hydroptila angusta Caddisfly Larva 4,039 4,039 Cricotopus Chironomid midge 3,795 trifacia larva Anguilla rostra ta Freshwater eel 13,085 11,940
(American) Salmo gairdneri Rainbow Trout 6,743 6,743 Note that the LC50 is not given as the 24-hr 48-hr or 96-hr because the reviewed papers show that in general if an organism survives for 24 hours it is very likely to survive for 48 or 96 as well.
Table 2 Chronic chloride toxicity (as sodium chloride) reported in the literature reviewed in USEPA 1988
Organism Group Limits (mg/l) Chronic Value (mg/l)
Daphnia pulex Cladoceran 314-441 372.1 crustacean
Salmo gairdneri Rainbow Trout 643 - 1,324 922.7 Final Acute - Chronic Ration = 7.594 (i.e. the chronic toxicity level is 7.594 times lower than the corresponding acute value based on the geometric mean of the paired values available (3.591- 15.17).
Table 3 Toxicity of chloride (as sodium chloride) to aquatic plants (in the literature reviewed in USEPA 1988)
For
insp
ectio
n pur
pose
s only
.
Conse
nt of
copy
right
owne
r req
uired
for a
ny ot
her u
se.
EPA Export 25-07-2013:14:49:52
l Field Observations
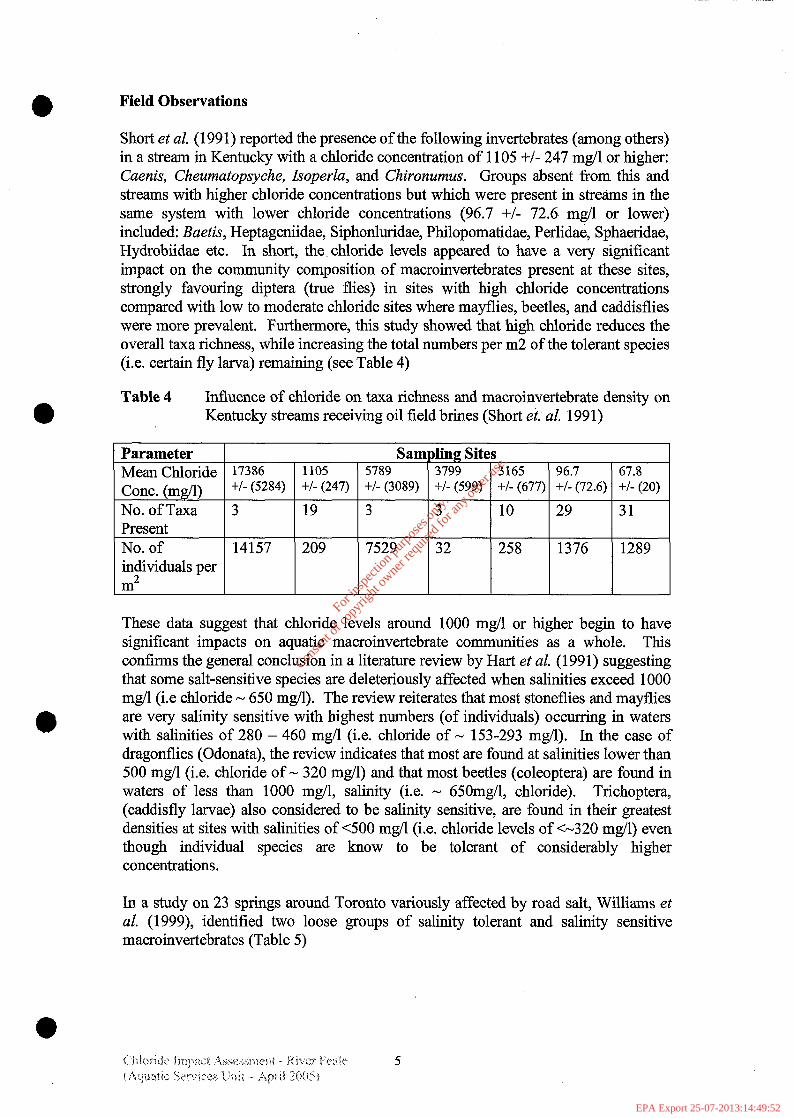
Short et al (1991) reported the presence of the following invertebrates (among others) in a stream in Kentucky with a chloride concentration of 1105 -I-/- 247 mg/l or higher: Caenis, Cheumatopsyche, IsoperZa, and Chironumus. Groups absent from this and streams with higher chloride concentrations but which were present in streams in the same system with lower chloride concentrations (96.7 +/- 72.6 mg/l or lower) included: Baetis, Heptageniidae, Siphonluridae, Philopomatidae, Perlidae, Sphaeridae, Hydrobiidae etc. In short, the. chloride levels appeared to have a very significant impact on the community composition of macroinvertebrates present at these sites, strongly favouring diptera (true flies) in sites with high chloride concentrations compared with low to moderate chloride sites where mayflies, beetles, and caddisflies were more prevalent. Furthermore, this study showed that high chloride reduces the overall taxa richness, while increasing the total numbers per m2 of the tolerant species (i.e. certain fly larva) remaining (see Table 4)
l Table 4 Influence of chloride on taxa richness and macroinvertebrate density on
Kentucky streams receiving oil field brines (Short et. al. 1991)
Parameter Sampling Sites Mean Chloride 17386 1105 5789 3799 3165 96.7 67.8
Cont. (mg/l) +/- (5284) +/- (247) +/- (3089) +/- (599) +/- (677) +/- (72.6) +/- (20)
No. of Taxa 3 19 3 3 10 29 31 Present No. of 14157 209 7529 32 258 1376 1289 individuals per m2
These data suggest that chloride levels around 1000 mg/l or higher begin to have significant impacts on aquatic macroinvertebrate communities as a whole. This confirms the general conclusion in a literature review by Hart et al. (1991) suggesting that some salt-sensitive species are deleteriously affected when salinities exceed 1000 mg/l (i.e chloride - 650 mg/l). The review reiterates that most stoneflies and mayflies are very salinity sensitive with highest numbers (of individuals) occurring in waters with salinities of 280 - 460 mg/l (i.e. chloride of - 153-293 mg/l). In the case of dragonflies (Odonata), the review indicates that most are found at salinities lower than 500 mg/l (i.e. chloride of - 320 mg/l) and that most beetles (coleoptera) are found in waters of less than 1000 mg/l, salinity (i.e. - 65Omg/l, chloride). Trichoptera, (caddisfly larvae) also considered to be salinity sensitive, are found in their greatest densities at sites with salinities of ~500 mg/l (i.e. chloride levels of c-320 mg/l) even though individual species are know to be tolerant of considerably higher concentrations.
In a study on 23 springs around Toronto variously affected by road salt, Williams et al. (1999), identified two loose groups of salinity tolerant and salinity sensitive macroinvertebrates (Table 5)
For
insp
ectio
n pur
pose
s only
.
Conse
nt of
copy
right
owne
r req
uired
for a
ny ot
her u
se.
EPA Export 25-07-2013:14:49:52

Table 5 Relative salinity tolerance of freshwater macroinvertebrates in 23 Canadian springs (from Williams et aZ., 1999).
1 Tolerant 1 Sensitive Lymnea (gastropod snail) Acarai (water mites) Physa (gastropod snail) MoZZana (caddisfly larva) Ceratopogonidue (biting midge Simulium (black fly larva)
larva) Tipulidae (crane fly larva) Collembola (spring-tail)
Turbellaria (flat worms) AseEZus (crustacean) Lepidostoma (caddisfly larva) Nemoura (stonefly larva) Chironomidae (non-biting
midges) Pisidium (pea mussels) Gammarus (freshwater crustacean)
A more ecosystem functional approach to the impact of chloride / salinity is likely to be taken in future where the impact on parameters such as material and energy flow in the food chain will be assessed. Such and approach by Silva and Davies (1999) in field experiments in the Elbow River in Canada looked at net primary productivity, community respiration (oxygen consumption) and macroinvertebrate drift under different simulated salinities (1.2, 2.4, 4.5 and 8.2 ppt - i.e. chloride of 736 - 5,029 w4. Their results indicated that all treatments impacted on the measured parameters but that the lowest salinity had least measurable impact.
Conclusion of Chloride Literature Review
The bulk of the individual acute and chronic toxicity data as reviewed in USEPA 1988 and the data from field distribution in relation to salinity or chloride levels (from Australia, Canada, South Africa and the US) would indicate that healthy freshwater communities are most likely to occur at chloride levels (as sodium chloride) at or below 250-500 mg/l for continuous exposure. Nevertheless, some few species may require even lower concentrations for optimum performance.
The assessment of the data presented in USEPA 1988 and the more field-based observations from the other papers examined, suggests that the criteria laid down in USEPA 1988 should provide adequate protection for the River Feale aquatic plants and macroinvertebrate communities. These criteria are again:
the four-day average concentration of chloride, associated with sodium, should not exceed 230 mg/l more than once every three years on average and the one-hour average concentration should not exceed 86OmgA more than once every three years on average.
Even though the lower limit of 230 mg/l, outlined may be higher that the optimal conditions for some organisms, these are likely to be the exception rather than the rule
For
insp
ectio
n pur
pose
s only
.
Conse
nt of
copy
right
owne
r req
uired
for a
ny ot
her u
se.
EPA Export 25-07-2013:14:49:52
and furthermore, the USEPA 1988 criteria have time limits / frequency restrictions attached as well, which offer additional protection.
Calculation of the Increased Chloride Values Expected following New Effluent Discharge Limits
This section presents summary flow and chloride data for the River Feale at Listowel and summary effluent discharge and chloride concentrations
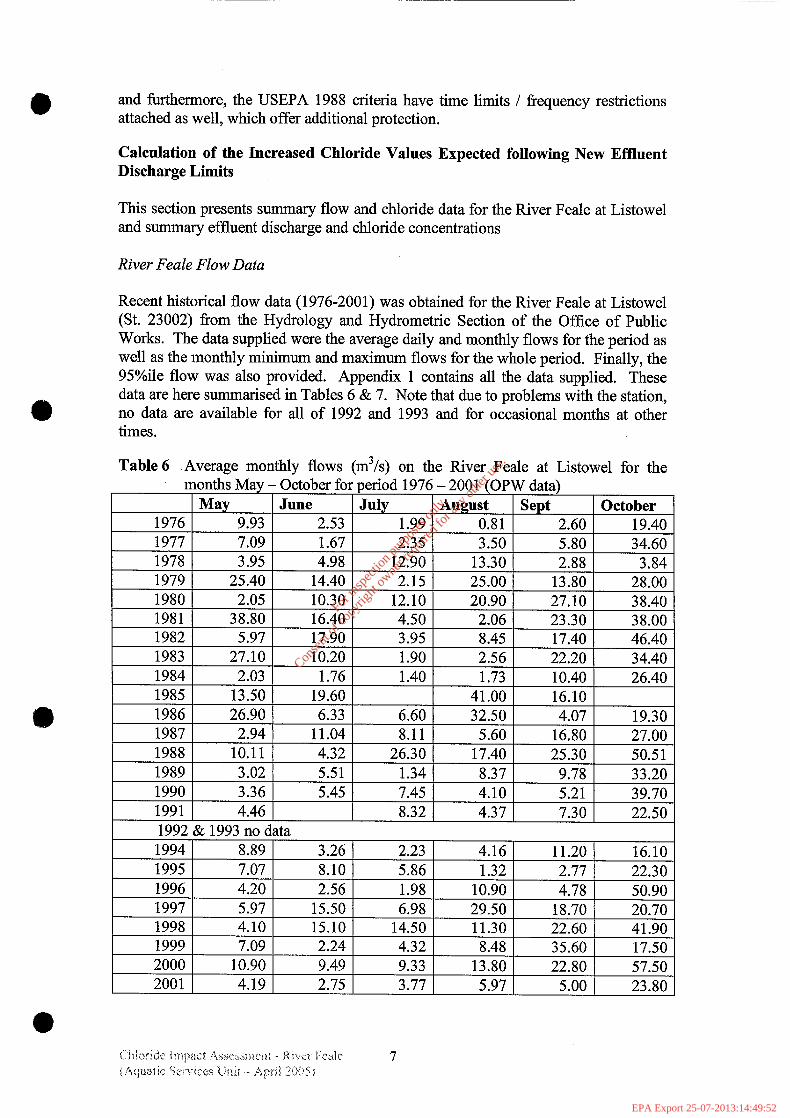
River Feale Flow Data
Recent historical flow data (1976-2001) was obtained for the River Feale at Listowel (St. 23002) from the Hydrology and Hydrometric Section of the Office of Public Works. The data supplied were the average daily and monthly flows for the period as well as the monthly minimum and maximum flows for the whole period. Finally, the 95%ile flow was also provided. Appendix 1 contains all the data supplied. These data are here summarised in Tables 6 & 7. Note that due to problems with the station, no data are available for all of 1992 and 1993 and for occasional months at other times.
Table 6 Average monthly flows (m3/s) on the River Feale at Listowel for the
1976 9.93 2.53 1.99 1 0.81 1 2.60 ) 1977 7.09 1.67
1979 1 25.40 1 14.40 1
I 1981 1 38.80 1 16.40 1
1983 27.10 10.20 1.90 2.56 : 1984 2.03 1.76 1.40 1.73 10.40 26.40
1985 13.50 19.60 41.00 16.10 1986 26.90 6.33 6.60 32.50 4.07 19.3t-l
I 1988 1 10.11 I
I .--’
-_ .- -
1987 1 2.94 1 11.04 I 8.11 5.60 16.80 27.00
I 26.30 17.40 25.30 50.51 1989 1 33.21 0 3.02 5.51 1.34 8.37 9.78
3.36 5.45 7.45 4.10 5.21 4.46 8.32 4.37 7.30
993 no data 8.89 3.26 2.23 4.16 11.20 7.07 8.10 5.86 1.32 2.77 4.20 2.56 1.98 10.90 4.78 5.97 15.5
1990 I 3z-t 1 -
-
- '0 6.98 29.50 18.70 20.70
1998 4.10 15.10 14.50 11.30 22.60 41.90 1999 7.09 2.24 4.32 8.48 35.60 17.50
2000 10.90 9.49 9.33 13.80 22.80 57.50
2001 4.19 2.75 3.77 5.97 5.00 23.80
__I 16.10
For
insp
ectio
n pur
pose
s only
.
Conse
nt of
copy
right
owne
r req
uired
for a
ny ot
her u
se.
EPA Export 25-07-2013:14:49:52
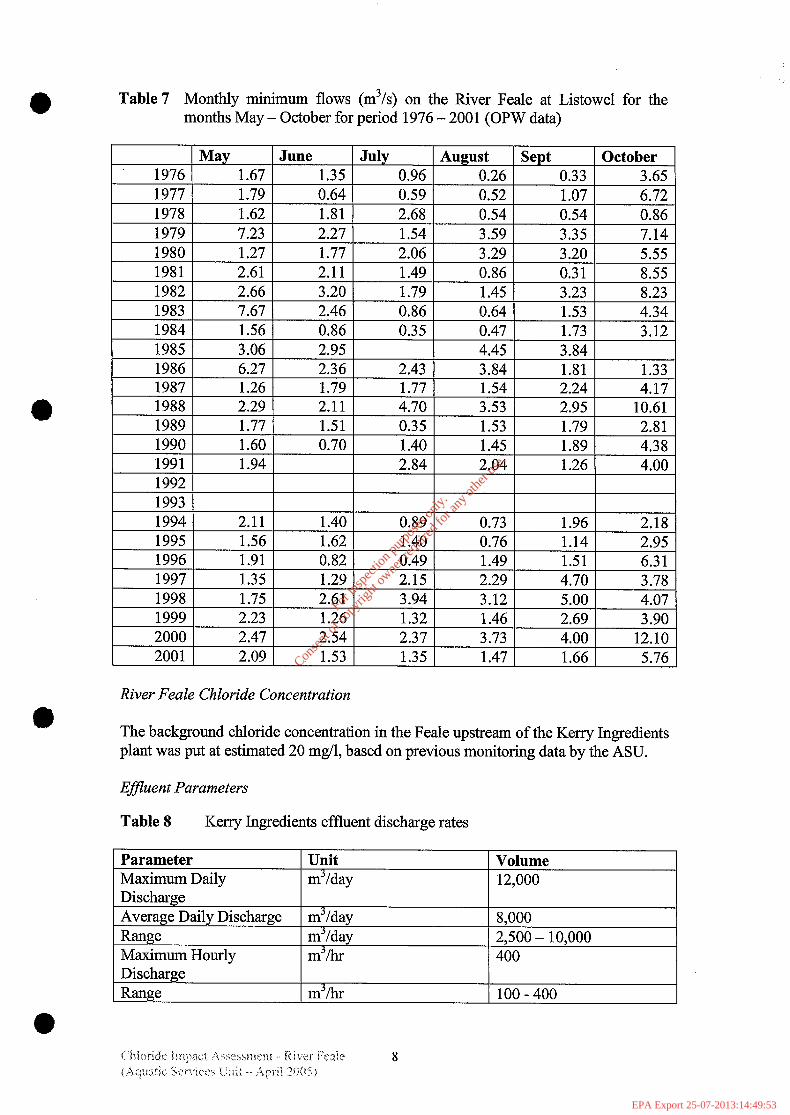
Table 7 Monthly minimum flows (m3/s) on the River Feale at Listowel for the months May - October for period 1976 - 2001 (OPW data)
1976 1 1.67 1 0.96 1 0.26 1
1978 I 1.62 I 1.81 I 2.68
River Feale Chloride Concentration
The background chloride concentration in the Feale upstream of the Kerry Ingredients plant was put at estimated 20 mg/l, based on previous monitoring data by the ASU.
Effluent Parameters
Table 8 Kerry Ingredients effluent discharge rates
Parameter Unit Volume Maximum Daily m3/day 12,000 Discharge Average Daily Discharge m3/day 8,000 Range m3/day 2,500 - 10,000 Maximum Hourly m31hr 400 Discharge Range m3ihr 100 - 400
For
insp
ectio
n pur
pose
s only
.
Conse
nt of
copy
right
owne
r req
uired
for a
ny ot
her u
se.
EPA Export 25-07-2013:14:49:53
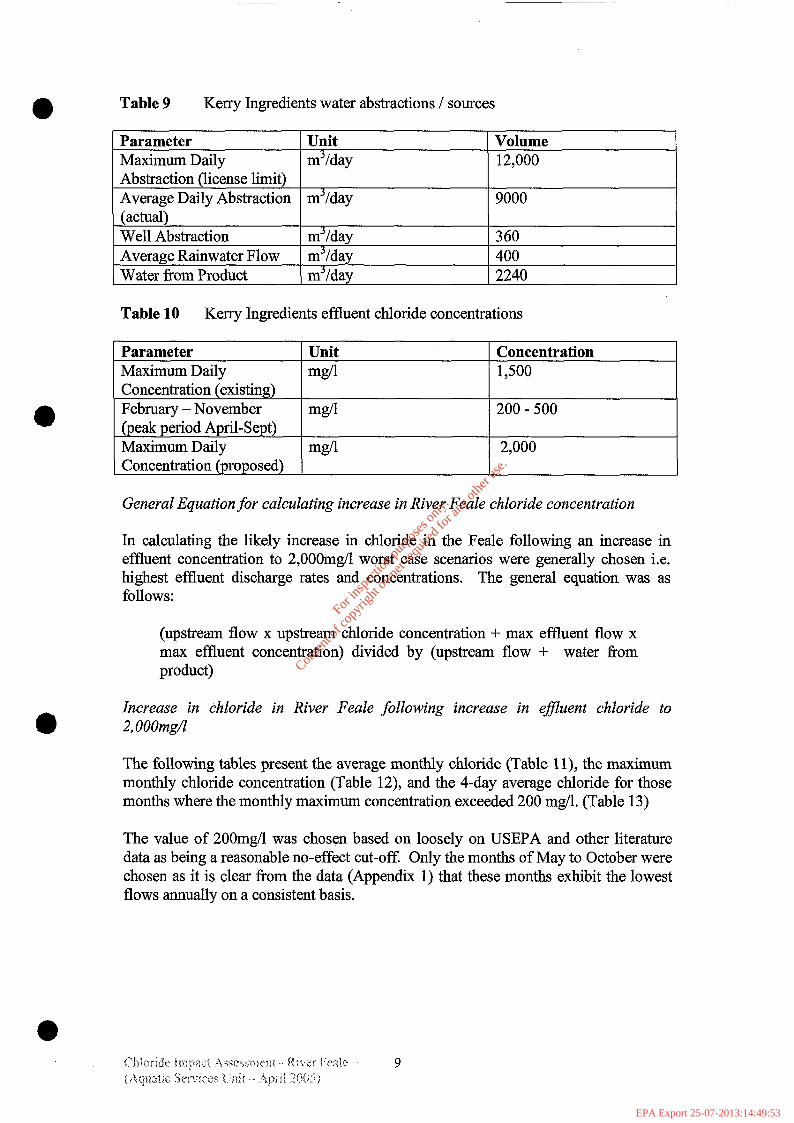
Table 9 Kerry Ingredients water abstractions / sources
Parameter Unit Volume Maximum Daily m3/day 12,000 Abstraction (license limit) Average Daily Abstraction m3/day 9000 (actual) Well Abstraction m3/day 360 Average Rainwater Flow m3/day 400 Water from Product m3/day 2240
Table 10 Kerry Ingredients effluent chloride concentrations
Parameter Unit Concentration Maximum Daily 4 1,500 Concentration (existing) February - November mdl 200 - 500 (peak period April-Sept) Maximum Daily mg/l 2,000 Concentration (proposed)
General Equation for calculating increase in River Feale chloride concentration
In calculating the likely increase in chloride in the Feale following an increase in effluent concentration to 2,00Omg/l worst case scenarios were generally chosen i.e. highest effluent discharge rates and concentrations. The general equation was as follows:
(upstream flow x upstream chloride concentration + max effluent flow x max effluent concentration) divided by (upstream flow + water from product)
Increase in chloride in River Feale following increase in efluent chloride to 2, OOOmgA
The following tables present the average monthly chloride (Table 1 l), the maximum monthly chloride concentration (Table 12), and the 4-day average chloride for those months where the monthly maximum concentration exceeded 200 mg/l. (Table 13)
The value of 2OOmg/l was chosen based on loosely on USEPA and other literature data as being a reasonable no-effect cut-off. Only the months of May to October were chosen as it is clear from the data (Appendix 1) that these months exhibit the lowest flows annually on a consistent basis.
For
insp
ectio
n pur
pose
s only
.
Conse
nt of
copy
right
owne
r req
uired
for a
ny ot
her u
se.
EPA Export 25-07-2013:14:49:53
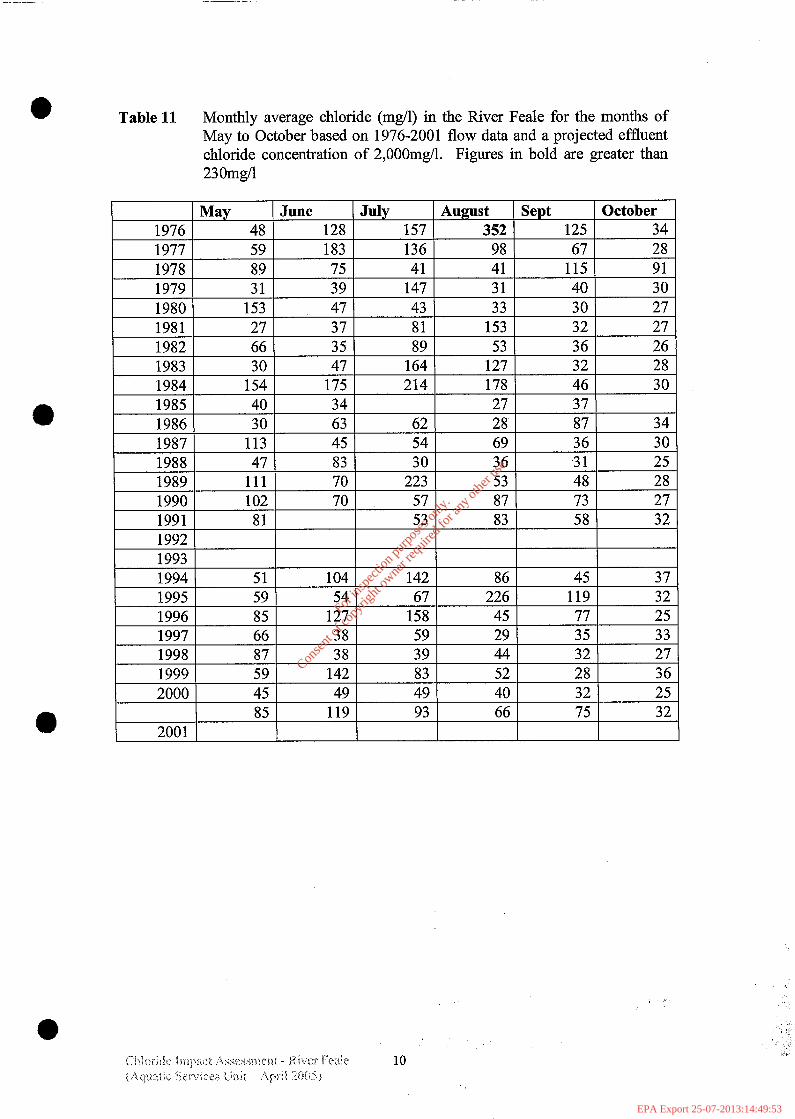
Table 11 Monthly average chloride (mg/l) in the River Feale for the months of May to October based on 19762001 flow data and a projected effluent chloride concentration of 2,OOOmgA. Figures in bold are greater than 23OmgA
1 Mav 1 June 1 Julv 1 Amust I Sent 1 October 1 1976 48 128 157 352 125 34 1977 59 183 136 98 67 28 1978 89 75 41 41 115 91 1979 31 39 147 31 40 30 Gi3b 153 47 43 33 30 27 1981 27 37 81 153 32 27 1982 66 35 89 53 36 26 1983 30 47 164 127 32 28 1984 154 175 214 178 46 30 1985 40 34 27 37 1986 30 63 62 28 87 34 1987 113 45 54 69 36 30 1988 47 83 30 36 .31 25 1989 111 70 223 53 48 28 1990 102 70 27 57 87 73 1991 1 81 1 53 1 83 1 58 ) 32 1 1992 1993 1994 51 104 142 86 45 37 1995 59 54 67 226 119 32 1996 85 127 158 45 77 25
t 1997 I 66 I 38 I 59 I 29 1 35 I 33 I -__. 1998 s3 38 39 44 32 27 1999 59 142 83 52 28 36 2000 45 49 49 40 32 25
85 119 93 66 75 32 2001
For
insp
ectio
n pur
pose
s only
.
Conse
nt of
copy
right
owne
r req
uired
for a
ny ot
her u
se.
EPA Export 25-07-2013:14:49:53
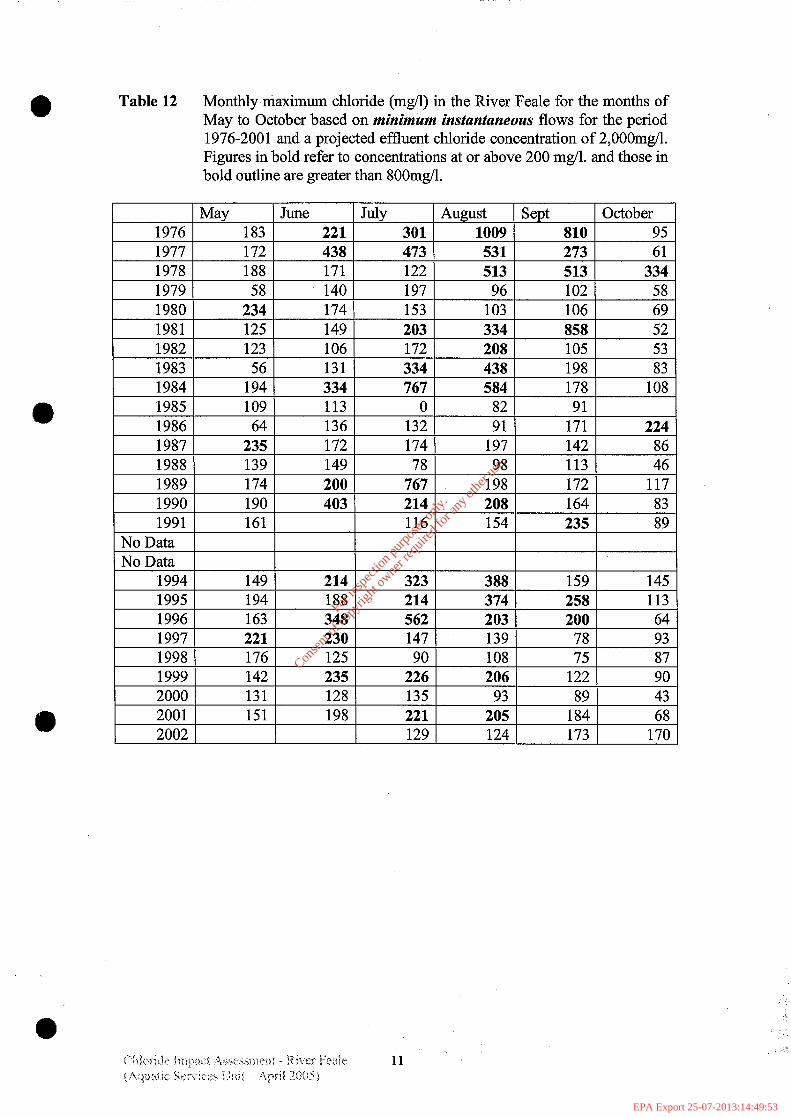
Table 12 Monthly maximum chloride (mg/l) in the River Feale for the months of May to October based on minimum instantaneous flows for the period 1976-2001 and a projected effluent chloride concentration of 2,OOOmgL Figures in bold refer to concentrations at or above 200 mg/l. and those in bold outline are greater than SOOmg/l.
May June July August Sept October 1976 183 221 301 1009 810 95 1977 172 438 473 531 273 61 1978 188 171 122 1 513 513 334 1979 58 140 197 I 96 102 58 1980 234 174 153 103 106 69 1981 125 149 203 334 858 52 1982 123 106 172 208 105 53 1983 56 131 334 438 198 83 1984 194 334 767 584 178 108 1985 109 113 0 82 91 1986 64 136 132 91 171 224 1987 235 172 174 197 142 86 1988 139 149 78 98 113 46 1989 174 200 767 I98 172 117 1990 190 403 214 208 164 83 1991 161 116 154 235 89
No Data No Data
1994 1995
149 214 323 388 159 145 194 188 214 374 258 113
1996 163 348 562 203 200 64 1997 221 230 147 139 78 93 1998 176 125 90 108 75 87 1999 142 235 226 206 122 90 2000 131 128 135 93 89 43 2001 151 198 221 205 184 68 2002 129 124 173 170
For
insp
ectio
n pur
pose
s only
.
Conse
nt of
copy
right
owne
r req
uired
for a
ny ot
her u
se.
EPA Export 25-07-2013:14:49:53
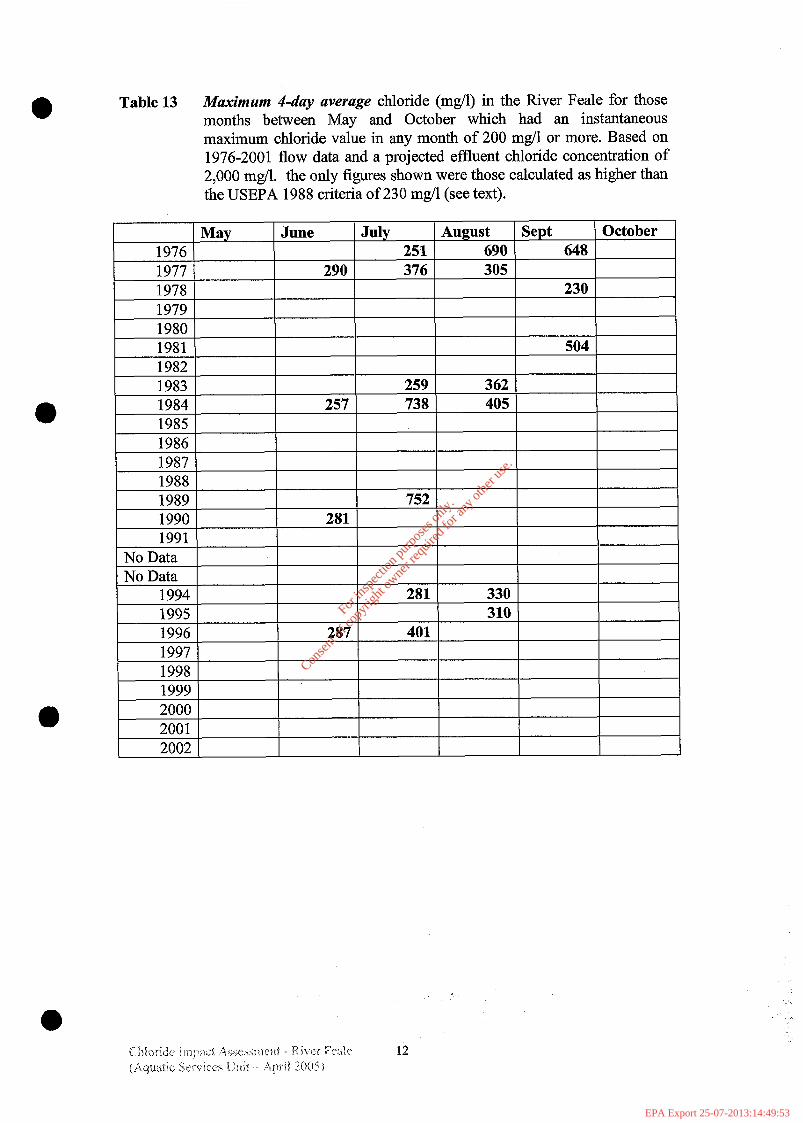
Table 13 Maximum 4day average chloride (mg/l) in the River Feale for those months between May and October which had an instantaneous maximum chloride value in any month of 200 mg/l or more. Based on 1976-2001 flow data and a projected effluent chloride concentration of 2,000 mg/l. the only figures shown were those calculated as higher than the USEPA 1988 criteria of 230 mg/l (see text).
For
insp
ectio
n pur
pose
s only
.
Conse
nt of
copy
right
owne
r req
uired
for a
ny ot
her u
se.
EPA Export 25-07-2013:14:49:53
Comparison of USEPA Criteria with River Peale Predicted Chloride Levels
The USEPA criteria are as follows:
the four-day average concentration of chloride, associated with sodium, should not exceed 230 mg/l more than once every three years on average and the one-hour average concentration should not exceed 86OmgA more than once every three years on average.
When these data are compared to the projected increased chloride concentrations on the River Feale based on historical flow data it is apparent that the first criterion is breached several times during the 26 year period of the record but only significantly so in 1976, 1984 and 1989. In these years the 4-day average concentration exceeded 500 mg/l (Table 13). The second part of the criteria i.e. a maximum hourly concentration of 860 mg/l, was only once exceeded, during August 1976 (Table 12).
Overall Conclusion and Recommendation
Based on the average and maximum chloride values predicted using recent historical flow data for the River Feale at Listowel and a projected effluent concentration of 2000 mg/l, and an effluent flow of 12,000 m3/day little adverse impact on the aquatic flora and fauna of the river Feale would be expected to arise. This conclusion is based on the fact that the USEPA 1988 criteria would only occasionally be exceeded significantly to judge by the flow record of the previous 26 years. Furthermore, the concentrations predicted are in most cases considered acceptable to judge from the wider scientific literature on the subject. The only time when measurable impacts are considered possible is when in-river chloride levels exceed 400-5OOmg/l, for extended periods (>4days). This was predicted to occur on average every 5 years. Bear in mind also that these levels would generally only be reached if both the maximum effluent concentrations and maximum effluent discharge rate happened to coincide with the extended low flow period. On such occasions a slight to significant drop in macroinvertebrate species diversity might occur, although this cannot be said to be certain, especially given that the monthly average chloride levels were generally much lower than the 4-day averages (Table 11). The most likely species to be affected, were this to occur, would be mayflies (excluding Caenis), perhaps also some caddisfly larvae and the freshwater limpet AncyZus. Macrophytes and fish would not be expected to be impacted at all by the projected increased chloride levels. The river reach potentially affected would be 4 kilometres of the lower reach of the river between the factory outfall and the upper estuary downstream of Finuge Bridge. Further downstream from this point an increase in dilution due to saltwater incursion would be anticipated as well as a natural reduction in the diversity of macroinvertebrates associated with the predominance of silt and mud in the substrate.
Data from annual biological monitoring in the river stretch between the factory outfall and Finuge Bridge shows a good diversity of macroinvertebrates including several mayfly nymphs, which could potentially be affected during periods of extended lows flows. In the event of some reduction in diversity, a rapid recovery would be predicted due to drift from upstream and dilution of the chloride as the river rose. Finally, it is also worth noting that in the event of low flow conditions, the River Feale chloride concentration would only increase slowly, perhaps over several days to
For
insp
ectio
n pur
pose
s only
.
Conse
nt of
copy
right
owne
r req
uired
for a
ny ot
her u
se.
EPA Export 25-07-2013:14:49:53
weeks, so that the biota would be able to adjust more easily than if the chloride levels were to increase rapidly as in experimental scenarios.
Monitoring
The literature search has revealed certain groups e.g mayflies (Ephemetoptera), stoneflies (Plecoptera), and caddisflies (Trichoptera) to be particularly sensitive to increased chloride, so that attention should be paid to the status of these groups during the annual biological monitoring, especially during periods of extended low flow. At present there is no indication from the annual biological monitoring that the freshwater reaches of the river downstream of the Kerry Ingredients is showing any impact due to chloride in the effluent.
For
insp
ectio
n pur
pose
s only
.
Conse
nt of
copy
right
owne
r req
uired
for a
ny ot
her u
se.
EPA Export 25-07-2013:14:49:53

Literature Consulted
Goetsch P. A. and Palmer C. G. (1997). Salinity tolerances of selected macroinvertebrates of the Sabie River, Kruger National Park, South Atica. Arch. Environ. Contam. Toxicol. 32: 32-41
Hart, B.T., Bailey, P., Edwards, R., Hortle, K, James, K, McMahon, A, Meredith, C. and K Swadling. (1990). Effects of salinity on river, stream and wetland ecosystems in Victoria, Australia. Wat. Res. 24: 1103-l 117.
Hart, B.T., Bailey, P., Edwards, R., Hortle, K, James, K, McMahon, A, Meredith, C. and K Swadling. (1991). A review of the salt sensitivity of the Australian freshwater biota. HydrobioZogia 210: 105-144.
l
Kay, W.R, Halse, S. A., Scanlon, M.D., and Smith, M. J. (2001). Distribution and environmental tolerances of aquatic macroinvertebrate families in the agricultural zone of southwestern Australia. J. N. Am. Benthol. Sot. 20: 182-199
Kefford, B.J. (2000). The effects of saline water disposal: implications for moinitoring programs and management. Environmental Monitoring and Assessment 63: 3 13-327
Moreno, J.L. Aboal M. Vidal-Abarca, M.R. and M.L Suarez (2001). Macroalgae and submerged macrophytes from fresh and saline waterbodies of ephemeral streams (‘ramblas’) in semiarid south-eastern Spain. Mar. Freshwater Res. 52: 891-905.
Short, T.M., Black, J.A. and W. J. Birge (1991). Ecology of a saline stream: community responses to spatial gradients of environmental conditions. Hydrobiologia 226: 167-l 78.
l Silva, E.I.L. and R.W. Davies (1999). The effects of simulated irrigation induced
changes in salinity on metabolism of lotic biota. Hydrobiologia 416: 193- 202.
United States Environmental Protection Agency (1998). Ambient water qua& criteria fir chloride. EPA 440/5-88-001 (Office of Water Regulations and Standards, Criteria and Standards Division, Washington DC 20460.
Williams, D.D., Williams, N.E. and Yong Cao (1999). Road salt contamination of groundwater in a major metropolitan area and development of a biological index to monitor its impact. Vat. Rex 34: 127-138.
For
insp
ectio
n pur
pose
s only
.
Conse
nt of
copy
right
owne
r req
uired
for a
ny ot
her u
se.
EPA Export 25-07-2013:14:49:53
”
: :
I
0:
. , . .
:
“,_, :
2. ,
.b’
For
insp
ectio
n pur
pose
s only
.
Conse
nt of
copy
right
owne
r req
uired
for a
ny ot
her u
se.
EPA Export 25-07-2013:14:49:53