appendix 17 air quality assessment - austar … · toronto nsw 2283 ph: 02 4950 5322 fax: ... (da...
TRANSCRIPT

APPENDIX 17
Air Quality Assessment

September 2008
Ventilation Shaft Air Quality Impact Assessment
Austar Coal Mine

Ventilation Shaft Air Quality Impact Assessment
Prepared by
Umwelt (Australia) Pty Limited
on behalf of
Austar Coal Mine
2/20 The Boulevarde PO Box 838
Toronto NSW 2283
Ph: 02 4950 5322 Fax: 02 4950 5737
Email: [email protected] Website: www.umwelt.com.au
Project Director: Peter Jamieson Project Manager: Catherine Pepper Report No. 2274/R39/FINAL Date: September 2008

Umwelt (Australia) Pty Limited 2274/R39/FINAL September 2008 i
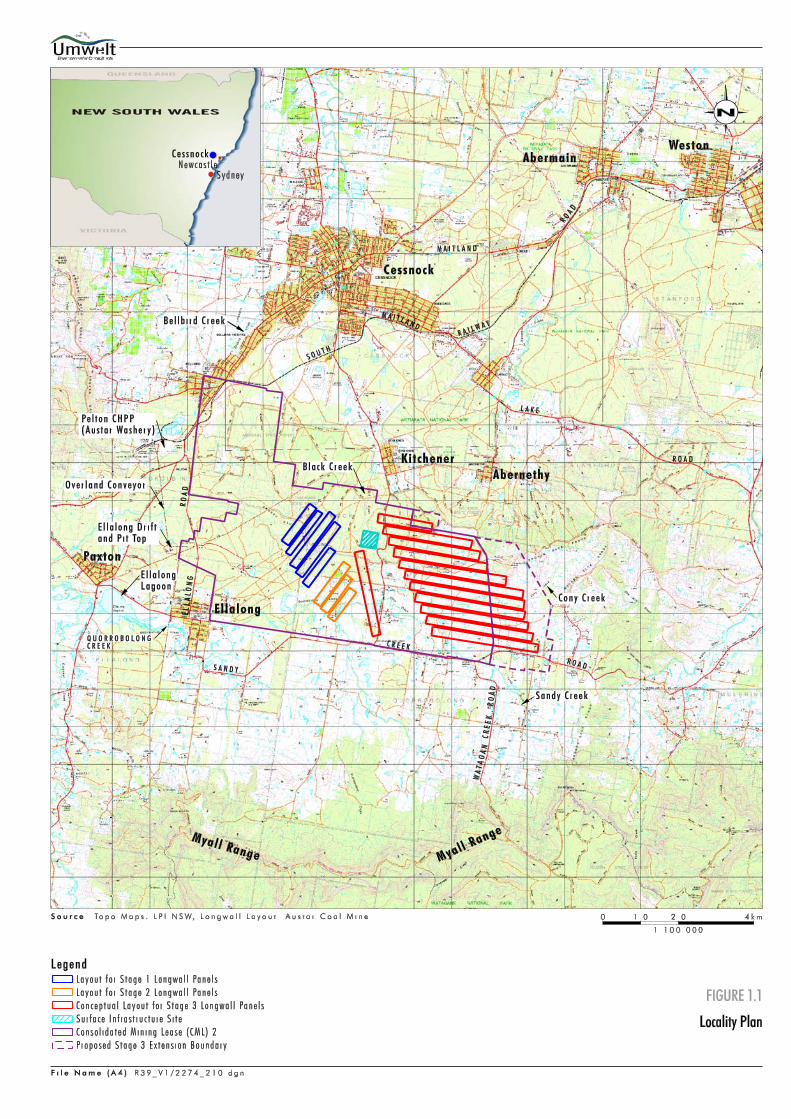
EXECUTIVE SUMMARY Austar Coal Mine Pty Limited (Austar) is an underground mine formed from the former Ellalong, Pelton, Cessnock No.1 (Kalingo) and Bellbird South Collieries near Cessnock, NSW (refer to Figure 1.1). Austar Coal Mine is proposed to be developed in three stages. A modification to consent (DA 29/56) was granted for Stage 1 of the mine in September 2006 and for the commencement of Stage 2 of the mine in June 2008. The modifications allowed the use Longwall Top Coal Caving (LTCC) technology extract coal at the site. As part of proposed Stage 3 development, a new Surface Infrastructure Site is to be constructed to support the ongoing operation of the mine. The new infrastructure will include a mine ventilation system, mine access for workers and surface facilities such as administration buildings, a bathhouse and workshop (refer to Figure 1.2). The Surface Infrastructure Site is situated approximately 1.5 kilometres south of Kitchener and approximately 6 kilometres south of Cessnock. The ventilation system at Surface Infrastructure Site will consist of an upcast ventilation shaft and downcast ventilation shaft that are required to provide sufficient quantity of air to support the proposed longwall mining in Stage 3. Umwelt (Australia) Pty Limited (Umwelt) has been commissioned by Austar to conduct an assessment of the air quality impact of the air to be discharged from the proposed upcast ventilation shaft. The key objectives of the assessment include:
• identifying possible air quality impacts on potentially affected nearest sensitive receptors (private residences);
• identifying the existing ambient air quality environment (dust concentration and deposition) around the shaft; and
• identifying potential emission rates from the proposed vent. Site-specific ambient air quality levels have been sourced and adopted from Austar local dust deposition and particulate matter observations. Meteorological data has been sourced from the Bureau of Meteorology (BoM) stations Cessnock and Williamtown. The AUSPLUME Gaussian Plume Dispersion Model software (EPA, Victoria) has been utilised to predict potential dust deposition rates, PM10 and Total Suspended Particulate (TSP) emissions associated with operation of the ventilation shaft. Twenty-five (25) residential dwellings are located within approximately 2 kilometres of the ventilation system. The modelling indicates that the contribution of dust deposition and particulate matter emissions from the ventilation system on these residences is less than relevant air quality criteria and therefore considered negligible.

Umwelt (Australia) Pty Limited 2274/R39/FINAL September 2008 i
TABLE OF CONTENTS
1.0 Introduction ................................................................................. 1
1.1 Description of the Ventilation System ................................................2
2.0 Surface Infrastructure Site ......................................................... 2
2.1 Location and Topography ...................................................................2
2.2 Nearby Residential Receptors.............................................................2
3.0 Air Quality Assessment and Criteria ......................................... 3
3.1 Total Suspended Particulate and PM10 Particulate Matter ................3
3.2 Dust Deposition....................................................................................4
3.3 Air Quality Goals ..................................................................................5
3.4 Assessment Methodology ...................................................................5
4.0 Existing Environment.................................................................. 6
4.1 Local Climatic Conditions ...................................................................6
4.2 Existing Air Quality ..............................................................................7 4.2.1 Background Dust Deposition..............................................................................7 4.2.2 Ambient Particulate Matter .................................................................................7 4.2.3 Adopted Background Concentrations for Assessment Purposes ......................9 4.2.4 Estimated Particulate Matter Emissions.............................................................9
5.0 Dispersion Modelling ................................................................ 10
5.1 Modelling Approach ...........................................................................10
5.2 Dispersion Meteorology.....................................................................10 5.2.1 Wind..................................................................................................................10 5.2.2 Atmospheric Stability ........................................................................................11
6.0 Emissions Assessment ............................................................ 11
6.1 Dispersion Modelling .........................................................................11 6.1.1 Dust Deposition ................................................................................................11 6.1.2 PM10..................................................................................................................13 6.1.3 TSP...................................................................................................................15
6.2 Gas Emissions....................................................................................16
7.0 Conclusion................................................................................. 17

Umwelt (Australia) Pty Limited 2274/R39/FINAL September 2008 ii
8.0 Abbreviations and Glossary..................................................... 17
9.0 References ................................................................................. 18
FIGURES
1.1 Locality Plan..................................................................................................1
1.2 Conceptual Layout for Proposed Surface Infrastructure Site...................1
2.1 Location of Nearby Residences...................................................................2
4.1 Location of Monitoring Sites........................................................................7
5.1 Frequency of Occurrence of Stability Classes.........................................11
6.1 Modelled Dust Deposition..........................................................................12
6.2 Modelled 24-hour maximum PM10 Concentration ....................................14
6.3 Modelled Annual Average PM10 Concentration........................................14
6.4 Modelled Annual Average TSP Concentration .........................................16
APPENDICES
A Meteorological Input File for AUSPLUME

Umwelt (Australia) Pty Limited 2274/R39/FINAL September 2008 1
1.0 Introduction Austar Coal Mine Pty Limited (Austar) operates an underground coal mine located approximately 10 kilometres south of Cessnock in the Lower Hunter Valley in NSW (refer to Figure 1.1). The mine is an aggregate of the former Ellalong, Pelton, Cessnock No.1 and Bellbird South Collieries and is located in the South Maitland Coalfields. These operations including coal extraction, handling, processing and transport collectively form the Austar Mining Complex. The underground mining component of the Austar Mining Complex is currently being undertaken within Consolidated Mining Lease 2 (CML2) (refer to Figure 1.1) under development consent DA 29/95. The DA 29/95 was granted by the NSW Minister for Urban Affairs and Planning in 1996, enabling coal extraction from the Greta Seam using a conventional retreat longwall extraction method to a height of up to 4.5 metres. Austar is seeking approval to extend underground mining into the Stage 3 area using Longwall Top Coal Caving (LTCC) technology. The Stage 3 Project (the Project) consists of two components: • The longwall extraction of up to 7 metres of coal from longwall panels A6 to A17 within
the Greta Coal Seam using LTCC technology. It is proposed that longwall extraction will occur at a rate of up to 3.6 million tonnes per year (Mtpa) of Run of Mine Coal (ROM) to facilitate a maximum product coal production rate of 3 Mtpa from Austar’s existing Pelton Coal Handling and Preparation Plant (CHPP) over a 21 year mine life.
• The construction and operation of new Surface Infrastructure Site and access road off Quorrobolong Road, south west of Kitchener. The proposed Surface Infrastructure Site will include upcast and downcast ventilation shafts, main ventilation fan, bath house, workshop, electricity substation and distribution line, service boreholes, offices and store. Access to longwalls in the Stage 3 area for men and materials will be via the proposed new Surface Infrastructure Site.
The proposed conceptual mine plan for Stage 3 and the location of the proposed Surface Infrastructure Site are shown in Figure 1.2. The Surface Infrastructure Site is situated approximately 1.5 kilometres south of Kitchener and approximately 6 kilometres south of Cessnock. The ventilation system at Surface Infrastructure Site will consist of an upcast ventilation shaft and downcast ventilation shaft designed to provide sufficient quantity of air to support the proposed longwall mining. Umwelt (Australia) Pty Limited (Umwelt) has been commissioned by Austar to conduct an assessment of the air quality impact of the air to be discharged from the proposed upcast ventilation shaft. Also assessed are the potential impacts of the discharge air from the operation of the upcast ventilation shaft on the surrounding environment. This Air Quality Impact Assessment has been undertaken as part of the overall Environmental Assessment for the project. The key objectives of the assessment are to:
• identify the existing ambient air quality environment (dust concentration and deposition) around the site;
• identify potential emission rates from the proposed vent; and
• identify possible air quality impacts on potentially affected nearest sensitive receptors (private residences).


Umwelt (Australia) Pty Limited 2274/R39/FINAL September 2008 2
1.1 Description of the Ventilation System Coal from the proposed Stage 3 mine will be handled and processed utilising existing infrastructure and facilities. Approval for the Project is sought by early 2009 which will allow for the construction of the new ventilation upcast shaft to commence. The new ventilation system is central to the operations of ongoing LTCC longwall mining beyond 2010. The proposed upcast and downcast ventilation shafts will be approximately 4.5 metres and 6.5 metres in diameter respectively and will be constructed to a depth of approximately 460 metres. The shafts will be constructed using raised bore techniques or drill and blast techniques or a combination thereof. A third construction bore used to raise the cuttings from the large shafts during construction will also be required. This shaft will be approximately 2.4 metres in diameter. The downcast shaft will allow access for employees and materials and provide additional air to enter the mine. The upcast ventilation shaft will allow air to be extracted from the mine and two exhaust fans will be placed over the shaft in order to draw air out of the workings. A second egress winder is proposed to be fitted to this shaft.
2.0 Surface Infrastructure Site 2.1 Location and Topography The site is located in the upper part of Black Creek catchment area on the northern side of Broken Back Range. The site is located approximately 680 metres to north of the ridgeline, approximately 1.5 kilometres south of Kitchener, and approximately 6 kilometres south of Cessnock (refer to Figure 1.1). The predominant land cover of the area surrounding the site is native vegetation and bushland. The site has an elevation of approximately 113 metres above Australian Height Datum (mAHD) in an area of significant vertical relief. Elevations within a 2 kilometre radius of the site range from approximately 89 mAHD to 225 mAHD. 2.2 Nearby Residential Receptors The nearest potentially affected residences to the site are shown on Figure 2.1. The residences are situated on southern side of Broken Back Range within Quorrobolong Creek catchment. The surrounding area can be characterised as typical of a rural landscape. Residential dwellings located within approximately 2 kilometres of the site have been assessed as being potentially affected by air quality impacts (refer to Table 2.1).


Umwelt (Australia) Pty Limited 2274/R39/FINAL September 2008 3
Table 2.1 – Summary of Nearby Receptors
Residence ID Elevation (m AHD) Distance from source of emissions (m)
1 129 1933 2 130 2027 3 129 1970 4 129 1529 5 127 1520 6 126 1569 7 136 1362 8 128 1563 9 127 1594 10 126 1540 11 137 1472 12 138 1443 13 148 1215 14 135 1364 15 136 1390 16 138 1381 17 140 1239 18 163 1790 19 161 1783 20 169 761 21 157 1527 22 156 1568 23 145 1674 24 143 1722 25 167 1306
3.0 Air Quality Assessment and Criteria Sources of particulate matter may be anthropogenic (that is, those produced by human activities) or naturally occurring. Naturally occurring particulates may be derived from volcanoes, dust storms, bush and grassland fire, and living vegetation. Human activities, such as the burning of fossil fuel in vehicles, power plants, and many industrial processes also generate significant amounts of fine particles. Anthropogenic dust currently accounts for approximately 10 per cent of the total amount of dust emissions in the global atmosphere. Increased levels of fine particles in the air are linked to health hazards such as heart disease and altered lung function. 3.1 Total Suspended Particulate and PM10 Particulate Matter Particulate matter (PM) refers to tiny particles of solid or liquid suspended in a air. The size of the particles is typically less than 50 micrometers (μm) and ranging down to 0.1 μm. Particulate matter less than 50 μm is size is referred to as total suspended particulate or TSP. The particles less than 10 μm and 2.5 μm in diameter are referred to as PM10 and PM2.5 particles, respectively.

Umwelt (Australia) Pty Limited 2274/R39/FINAL September 2008 4
The current NSW Department of Environment and Climate Change (DECC) Air Quality Assessment Criteria applicable to particulate matter less then 10 μm (PM10) and TSP are outlined in Table 3.1.
Table 3.1 – DECC Goals for Particulate Matter Concentrations
Pollutant Standard/Goal(μg/m3) Averaging Period Reference
50 24-hour maximum DECC
30 Annual mean DECC Particulate matter < 10μm
(PM10) 50 24-hour average, 5 exceedances allowed per year NEPC
Total suspended particulate
matter (TSP) 90 Annual mean NHMRC
3.2 Dust Deposition Dust is a general name for solid particles (insoluble solids) with diameter less than 500 μm. Dust occurs in the atmosphere from various sources such as soil dust lifted up by wind or dust from volcanic eruption. Airborne dust is considered an aerosol and can have an effect on the atmosphere and the local climate. Under certain circumstances, large amounts of dust dispersed within the air in an enclosed space (such coal dust or flour) can be an explosion hazard. Airborne dusts can also contribute to occupational lung diseases such as pneumoconiosis. Dust deposition is the process by which solid particles collect or deposit themselves on solid surfaces, decreasing the concentration of the particles in the air. Table 3.2 shows current air quality assessment criteria applicable to dust deposition.
Table 3.2 – DECC Goals for Dust Deposition
Maximum Increase in Deposited Dust level
(g/m2/month)
Maximum Total Deposited Dust level
(g/m2/month) Averaging Period
2 4 Annual

Umwelt (Australia) Pty Limited 2274/R39/FINAL September 2008 5
3.3 Air Quality Goals A summary of the applicable Air Quality Goals for this assessment are outlined in Table 3.3.
Table 3.3 – DECC Air Quality Goals
Pollutant Maximum Concentration Averaging Time
PM10 50 μg/m3
30 μg/m3
24 hours
Annual
TSP 90 μg/m3 Annual
Dust Deposition
2 g/m2/month (maximum increase in deposited
dust level)
4 g/m2/month (maximum total in deposited dust level)
Annual
3.4 Assessment Methodology Dispersion models use a computer model to simulate atmospheric conditions and the behaviour pollutants. Dispersion models are used to determine the impact of a proposed development on the surrounding environment and provided concentration or deposition estimates that can be compared against impact assessment criteria. The Approved Methods for the Modelling and Assessment of Air Pollutants in New South Wales, DECC 2006 provides two methods for undertaking air impact assessment using dispersion models. These are:
Level 1 impact assessments for screening-level assessments using worst-case input data such as maximum pollutant loadings generating maximum exposed levels for off-site receptor overlaid onto the maximum background concentration. The results of the Level 1 dispersion modelling represent a worst-case impact when compared against the relevant impact assessment criterion.
Level 2 impact assessments using refined dispersion modelling assessments based on
site-specific input data contemporaneous with the meteorological data and background concentration so that individual dispersion model predictions corresponding to pre-existing background concentration.
A Level 1 assessment has been used because the predicted worst-case impact of the proposed ventilation system, reported as the 100th percentile or maximum pollutant loadings, generating maximum exposed levels for off-site receptors is well below the relevant impact assessment criterion.

Umwelt (Australia) Pty Limited 2274/R39/FINAL September 2008 6
4.0 Existing Environment 4.1 Local Climatic Conditions Local climate data has been obtained from observations compiled for Cessnock from 1973 to 2000 at Bureau of Meteorology (BoM) Station 61242. Cessnock is located approximately 6 kilometres north of the site. A summary of BoM climate parameters for Cessnock is outlined in Table 4.1.
Table 4.1 – Climate Averages (Cessnock, 1973-2000)
Month Parameter
Jan Feb Mar Apr May Jun Jul Aug Sep Oct Nov Dec
Average Maximum Temperature (°C) 29.9 29.2 27.4 24.6 21.0 17.9 17.5 19.4 22.2 24.9 27.1 29.4
Average Minimum Temperature (°C) 17.5 17.4 15.5 11.8 8.9 6.0 4.5 5.0 7.7 10.8 13.4 15.9
Average Daily Evaporation (mm) 5.7 5.0 4.0 2.9 1.9 1.6 1.8 2.6 3.6 4.3 5.2 6.0
Average Rainfall (mm) 89.7 92.3 91.7 66.0 62.5 54.4 40.1 35.4 44.1 60.7 71.2 64.6
Average Temp. at 9am (°C) 23.0 22.1 21.2 18.3 14.3 10.9 9.9 11.9 15.9 19.2 20.2 22.5
Average Relative Humidity at 9am (%) 69.6 74.5 73.7 73.7 80.2 80.2 78.2 70.4 62.2 59.4 64.0 63.8
Average Cloud Cover at 9am (oktas) 4.9 5.0 4.7 4.3 4.6 4.2 3.8 3.1 3.6 4.4 4.6 4.7
Average Temp. at 3pm (°C) 28.4 27.8 25.9 23.2 19.8 16.7 16.4 18.3 20.9 23.2 25.4 28.0
Average Relative Humidity at 3pm (%) 50.0 52.2 54.2 52.5 56.5 56.4 51.7 44.4 44.0 45.9 46.4 45.3
Average Cloud Cover at 3pm (oktas) 5.1 5.1 5.0 4.8 4.9 4.7 4.3 4.0 4.4 4.8 5.1 4.9
As indicated in Table 4.1, January is the warmest month with a mean daily maximum temperature of 29.9 oC. July is the coldest month with mean daily minimum temperature of 4.5 oC. February is the wettest month with average monthly rainfall of 92.3 mm. August is the driest month with average monthly rainfall of 35.4 mm. The evaporation rates are highest in December and lowest in June. The relative humidity varies from 44 percent to 80.2 per cent and can be described as medium to high.

Umwelt (Australia) Pty Limited 2274/R39/FINAL September 2008 7
4.2 Existing Air Quality 4.2.1 Background Dust Deposition Background dust deposition monitoring has been undertaken by Carbon Based Environmental since the end of March 2007. There are five deposition gauges installed in the area surrounding Austar lease boundaries. The locations of the gauges are provided in Figure 4.1. Monthly background dust deposition (insoluble solids) monitoring data is available for the period between April and September 2007. Table 4.2 presents a summary of insoluble solids for the observation period at the monitoring sites.
Table 4.2 – Summary of Monthly Dust Deposition (g/m2/month)
Monitoring Gauge Number and Location Month DG01
Pynes DG02 Pelton
DG03 Bellbird
DG04 Ellalong
DG05 Fan
All Sites Average
April - 0.9 2.8 1.4 1.5 1.7
May 0.4 0.5 0.2 1.0 1.4 0.7
June 0.4 0.4 0.4 0.2 - 0.4
July 0.6 0.3 0.4 0.3 1.1 0.5
August 0.9 0.6 1.5 0.5 - 0.9
September 0.6 2.5 1.2 0.6 1.4 1.3
Period Average 0.6 0.9 1.1 0.7 1.4 0.9
Dust deposition measurements generally reflect the influence of activities around the monitoring site. Some gauges can be contaminated by bird droppings, vegetation (such as, plant matter, algae, pollen, seeds) and insects. Results showing contamination by bird droppings, vegetation and/or insects have been excluded from the monthly average. The results of the measurements indicate that the dust deposition level at the monitoring sites for the period from April 2007 to September 2007 is below the DECC Air Quality Impact Assessment criteria for insoluble solids of 4 g/m2/month. The highest measured dust deposition rate at DG05 of 1.5 g/m2/month has been assumed as a conservative value for annual background ambient dust fallout at the study area for assessment purposes. DG05 is locate adjacent to similar farming and forest land and is approximately 2 kilometres west of the proposed Surface Infrastructure Site. 4.2.2 Ambient Particulate Matter Two PM10 High Volume Air Samplers (HVAS) separate and collect fine particulates with an effective aerodynamic diameter of less than 10 μm. The PM10 HAVS have been installed at the Pelton and Pynes sites. The HVAS commenced monitoring on the 24 March 2007, and are operated for 24 hours every sixth day. The HVAS locations are shown in Figure 4.1. Table 4.3 shows measured PM10 concentrations for each PM10 HVAS monitoring site for period from April to September 2007 and estimates of TSP concentrations at each site, based on measured PM10 concentrations.


Umwelt (Australia) Pty Limited 2274/R39/FINAL September 2008 8
Estimated TSP concentrations were derived from the PM10 measurements provided in Table 4.3 by assuming that PM10 is approximately 40 percent of TSP. This relationship is based on measurements published by the NSW Mineral Council (2000). Analysis of the data in Table 4.3 indicates that the measured average for PM10 for period from April 2007 to September 2007 of 13 μg/m3 is below the annual average DECC criteria of 30 μg/m3. The measured daily PM10 concentrations presented in Table 4.3 do not exceed the 24-hour average DECC criteria of 50 μg/m3. The estimated average for TSP for period from April 2007 to September 2007 of 32 μg/m3 is less than the annual average DECC criteria of 90 μg/m3.
Table 4.3 – PM10 HVAS Monitoring Results
Sampling Date Pelton – PM10 (μg/m3)
Pynes – PM10 (μg/m3)
Two sites average - PM10
(μg/m3) Estimated TSP
(μg/m3)
24/03/2007 17 16 17 41 30/03/2007 14 13 14 34 05/04/2007 23 27 25 63 11/04/2007 22 21 22 54 17/03/2007 31 34 33 81 23/03/2007 13 16 15 36 29/03/2007 12 14 13 33 05/05/2007 39 42 41 101 11/05/2007 17 17 17 43 17/05/2007 16 19 18 44 23/05/2007 12 7 10 24 29/05/2007 23 14 19 46 04/06/2007 13 8 11 26 10/06/2007 6 3 5 11 16/06/2007 0 0 0 0 22/06/2007 1 1 1 3 28/06/2007 6 0 3 8 04/07/2007 4 2 3 8 10/07/2007 1 1 1 3 16/07/2007 10 5 8 19 22/07/2007 9 4 7 16 28/07/2007 5 3 4 10 03/08/2007 11 8 10 24 09/08/2007 12 4 8 20 15/08/2007 12 10 11 28 21/08/2007 12 9 11 26 27/08/2007 20 14 17 43 02/09/2007 19 24 22 54 08/09/2007 6 5 6 14 14/09/2007 18 16 17 43 20/09/2007 8 11 10 24 26/09/2007 16 19 18 44 Average 13 12 13 32

Umwelt (Australia) Pty Limited 2274/R39/FINAL September 2008 9
4.2.3 Adopted Background Concentrations for Assessment Purposes DECC standards outlined in the Approved Methods for Modelling and Assessment of Air Pollutants in New South Wales (DECC, 2005) (AMMAAP) states that for a Level 1 assessment:
• The background concentration of the pollutant being assessed is determined as the maximum level from representative ambient monitoring data for each relevant averaging period.
• The exposure at the off-site receptors is the sum of the maximum background concentration and the 100th percentile dispersion model prediction for each relevant averaging period.
• The total impact is then compared with the relevant impact assessment criterion for each relevant averaging period.
For assessment purposes:
• The highest measured dust deposition rate of 1.5 g/m2/month has been assumed to represent the worst-case annual background ambient dust fallout level in the study area.
• The highest 24-hour recorded PM10 concentration in the study area as reported in Table 4.3 is 42 μg/m3.
• The annual average observed PM10 concentration in the study area as reported in Table 4.3 is 13 μg/m3.
• The annual average TSP concentration at the study area for assessment purposes has been estimated to be 32 μg/m3 (refer to Section 4.2.2).
4.2.4 Estimated Particulate Matter Emissions A representative rate of particulate matter emission from the proposed ventilation shaft has been estimated based on the proposed Austar annual underground coal production of 3 million tonnes. This estimated emission rate is based on measured PM10 emissions from the ventilation shaft of a reference coal mine in the Hunter Valley adjusted for the tonnage of coal extracted from the underground mine. The annual TSP emissions from the proposed ventilation shaft have been based on the following parameters:
• exhaust velocity – 10 m/s;
• exhaust temperature – 20 oC;
• vent release height – 4 m;
• vent diameter – 4 m;
• exhaust flow rate – 126 m3/s;
• exhaust area – 12.6 m2;
• in-stack PM10 concentration – 2.8 mg/m3; and
• PM10 emission rate – 355.76 mg/s.

Umwelt (Australia) Pty Limited 2274/R39/FINAL September 2008 10
This is considered to be a conservative estimate of emission rates from the ventilation shaft and represents an annual TSP emission of 20 tonnes per annum.
5.0 Dispersion Modelling 5.1 Modelling Approach The dispersion modelling was done using AUSPLUME Gaussian plume dispersion model software (Version 6.0) developed by the Environment Protection Authority (EPA). AUSPLUME is a steady-state model, which assumes the atmosphere is a state of uniform flow, and that wind velocity is a function of height alone and does not vary with direction. AUSPLUME is the dispersion model used for the majority of assessments in New South Wales. The dispersion modelling was conducted according to methodology published in the AUSLPUME Gaussian Plume Dispersion Model: Technical User Manual (EPA, 2000) and the AMMAAP. The default options specified in the manual have been applied in the modelling, as per the AMMAAP. 5.2 Dispersion Meteorology The dispersion model requires atmospheric dispersion data, in particular, wind speed, wind direction, atmospheric stability class and mixing heights. Two Bureau of Meteorology sites have been sourced for the purposes of this modelling: Cessnock Automatic Weather Station (AWS) and Williamtown. A meteorological dataset for the year 2003 has been used in the creation of the meteorological input file for modelling purposes. Cessnock AWS is the closest weather observation site and located approximately 6 kilometres north of the study area. Meteorological parameters (cloudiness, vertical air temperature profile) are not recorded at Cessnock AWS and have been sourced from Williamtown weather station, located approximately 45 kilometres east of the study area. The dataset for 2003 year represents 352 days (that is, 96 per cent coverage, all seasons well-presented), is concurrent with the background data used for this assessment and satisfies the AMMAAP meteorological data requirements. The technique used in preparation of the meteorological input file for AUSPLUME is detailed in Appendix A. 5.2.1 Wind Wind direction and speed are the most critical parameters in the dispersion modelling. Wind direction determines the initial direction of transport of the pollutant from the source. Wind speed determines the travel time from source to receptor and dilutes the plume in the direction of transport.

Umwelt (Australia) Pty Limited 2274/R39/FINAL September 2008 11
An overview of the seasonal wind behaviour for 2003 at Cessnock AWS is presented in Appendix A. Analysis of annual and seasonal wind roses indicates that:
• annual predominant wind directions are south-west, south and north-west;
• the prevailing wind speed both annually and for all seasons was measured to be in the order of 2 to 4 m/s;
• the predominant wind directions in summer are south-east and south;
• the predominant wind directions in autumn are south and south-west;
• the predominant wind directions in winter are north-west and south-west; and
• the predominant wind directions in spring are north-west and south. 5.2.2 Atmospheric Stability The dispersion model uses atmospheric stability data in conjunction with the wind direction and speed data. Figure 5.1 illustrates annual frequency of occurrence of hourly atmospheric stability classes for dispersion modelling purposes in the study area. The results indicate the most common stability class is Class ‘D’. This class is indicative of neutral conditions which will neither enhance nor impede pollutant dispersion. The second most typical stability class is Class ‘F’. This class indicates stable conditions which represent very low vertical mixing turbulence. Class ‘F’ stability results in pollutant plumes that have negligible dilution extending for long distance downwind of the emissions source.
6.0 Emissions Assessment 6.1 Dispersion Modelling 6.1.1 Dust Deposition The results of dispersion modelling for dust fallout at each of the nearby residential receptors are presented in Table 6.1. As described in Section 4.3.1 the background ambient level of dust deposition for the study area has been assumed to be 1.5 g/m2/month.

0
5
10
15
20
25
30
35
40
A B C D E FPasquill-Gifford Stability Class
% D
istr
ibut
ion

Umwelt (Australia) Pty Limited 2274/R39/FINAL September 2008 12
Table 6.1 – Predicted Dust Depositions at Nearest Residences
Annual Average Dust Deposition (g/m2/month)
Residence ID Predicted Increase
Air Quality Goal –
Incremental Representative
Background
Total (Background + Predicted)
Air Quality Goal - Total
1 0.09 2 1.5 1.59 4 2 0.10 2 1.5 1.60 4 3 0.09 2 1.5 1.59 4 4 0.09 2 1.5 1.59 4 5 0.06 2 1.5 1.56 4 6 0.06 2 1.5 1.56 4 7 0.06 2 1.5 1.56 4 8 0.09 2 1.5 1.59 4 9 0.08 2 1.5 1.58 4
10 0.06 2 1.5 1.56 4 11 0.14 2 1.5 1.64 4 12 0.15 2 1.5 1.65 4 13 0.03 2 1.5 1.53 4 14 0.04 2 1.5 1.54 4 15 0.04 2 1.5 1.54 4 16 0.04 2 1.5 1.54 4 17 0.03 2 1.5 1.53 4 18 0.02 2 1.5 1.52 4 19 0.02 2 1.5 1.52 4 20 0.15 2 1.5 1.65 4 21 0.17 2 1.5 1.67 4 22 0.16 2 1.5 1.66 4 23 0.14 2 1.5 1.64 4 24 0.13 2 1.5 1.63 4 25 0.13 2 1.5 1.63 4
The predicted incremental increase in dust deposition presented in Table 6.1 is considerably less than the air quality goal of 2 g/m2/month at all nearest residences. The maximum incremental increase in dust deposition of 0.17 g/m2/month is predicted to occur at Residence 21. The predicted mean monthly dust deposition rates presented in Table 6.1 are less that the project air quality criteria of 4 g/m2/month at all nearby receptors. The atmospheric dispersion modelling of the dust emissions from the proposed ventilation shaft indicates that the proposed operation will have and insignificant impact on the dust deposition rates at all the nearby receptors. Figure 6.1 shows predicted dust deposition rates around the proposed ventilation shaft.


Umwelt (Australia) Pty Limited 2274/R39/FINAL September 2008 13
6.1.2 PM10 The modelled results for PM10 concentrations at each nearest residence are displayed in Tables 6.2 and 6.3. As discussed in Section 4.3.2 the maximum 24-hour average daily varying measured background PM10 data was taken to predict 24-hour maximum average and annual average concentrations is based on the annual average of the available PM10 concentrations measured in the study area.
Table 6.2 – Predicted 24-hour Maximum PM10 Concentrations at Nearest Residences
Maximum 24-hour Average PM10 Concentrations (μg/m3)
Residence ID Predicted Increase
Representative Background
Total (Background +
Predicted) Air Quality Goal - Total
1 0.04 42.00 42.04 50 2 0.06 42.00 42.06 50 3 0.04 42.00 42.04 50 4 0.03 42.00 42.03 50 5 0.00 42.00 42.00 50 6 0.00 42.00 42.00 50 7 0.00 42.00 42.00 50 8 0.02 42.00 42.02 50 9 0.02 42.00 42.02 50 10 0.00 42.00 42.00 50 11 0.06 42.00 42.06 50 12 0.06 42.00 42.06 50 13 0.00 42.00 42.00 50 14 0.00 42.00 42.00 50 15 0.00 42.00 42.00 50 16 0.00 42.00 42.00 50 17 0.00 42.00 42.00 50 18 0.01 42.00 42.01 50 19 0.00 42.00 42.00 50 20 0.00 42.00 42.00 50 21 0.10 42.00 42.10 50 22 0.10 42.00 42.10 50 23 0.08 42.00 42.08 50 24 0.08 42.00 42.08 50 25 0.07 42.00 42.07 50

Umwelt (Australia) Pty Limited 2274/R39/FINAL September 2008 14
Table 6.3 – Predicted Annual Average PM10 Concentrations at Nearest Residences
Annual Average PM10 Concentrations (μg/m3)
Residence ID Predicted Increase
Representative Background
Total (Background +
Predicted) Air Quality Goal - Total
1 0.23 13 13.23 30 2 0.24 13 13.24 30 3 0.23 13 13.23 30 4 0.24 13 13.24 30 5 0.20 13 13.20 30 6 0.20 13 13.20 30 7 0.22 13 13.22 30 8 0.23 13 13.23 30 9 0.22 13 13.22 30 10 0.20 13 13.20 30 11 0.29 13 13.29 30 12 0.29 13 13.29 30 13 0.20 13 13.20 30 14 0.20 13 13.20 30 15 0.19 13 13.19 30 16 0.20 13 13.20 30 17 0.19 13 13.19 30 18 0.17 13 13.17 30 19 0.19 13 13.19 30 20 0.41 13 13.41 30 21 0.32 13 13.32 30 22 0.32 13 13.32 30 23 0.28 13 13.28 30 24 0.27 13 13.27 30 25 0.30 13 13.30 30
Analysis indicates that the predicted PM10 concentrations do not exceed the air quality criteria at all nearest residences. The maximum 24-hour incremental PM10 concentration increase of 0.1 μg/m3 (i.e. 0.2 per cent of the background concentration) is predicted for the Residences 21 and 22. The annual average PM10 increment of 0.41 μg/m3 (i.e. 2.2 per cent of the background concentration) is predicted for the Residence 20. The modelling indicates that contribution of operation of the ventilation shaft to PM10 emissions at all residential receptors is negligible. Figure 6.2 and 6.3 shows modelled 24-hour maximum and annual average PM10 concentration contours at the site. The contours indicate the levels of PM10 concentrations over potentially affected areas around the emissions source under existing modelling conditions.


Umwelt (Australia) Pty Limited 2274/R39/FINAL September 2008 15
6.1.3 TSP Table 6.4 presents the modelled results for TSP concentrations at each nearest residence. As discussed in Section 4.3.2 the estimated annual average background ambient TSP concentration was taken to be 32 μg/m3. This background level has been incorporated into the model.
Table 6.4 – Predicted TSP Concentrations at Nearest Residences
Annual Average TSP Concentrations (μg/m3)
Residence ID Predicted Increase
Representative Background
Total (Background +
Predicted) Air Quality Goal - Total
1 0.37 32.0 32.37 90 2 0.36 32.0 32.36 90 3 0.36 32.0 32.36 90 4 0.41 32.0 32.41 90 5 0.32 32.0 32.32 90 6 0.31 32.0 32.31 90 7 0.39 32.0 32.39 90 8 0.40 32.0 32.4 90 9 0.37 32.0 32.37 90 10 0.32 32.0 32.32 90 11 0.55 32.0 32.55 90 12 0.56 32.0 32.56 90 13 0.25 32.0 32.25 90 14 0.29 32.0 32.29 90 15 0.29 32.0 32.29 90 16 0.32 32.0 32.32 90 17 0.26 32.0 32.26 90 18 0.13 32.0 32.13 90 19 0.19 32.0 32.19 90 20 0.99 32.0 32.99 90 21 0.57 32.0 32.57 90 22 0.55 32.0 32.55 90 23 0.48 32.0 32.48 90 24 0.46 32.0 32.46 90 25 0.53 32.0 32.53 90
Analysis indicates that the predicted TSP concentrations do not exceed the air quality impact assessment criteria at all nearest residences. The maximum annual average increment of TSP concentration of 0.99 μg/m3 (i.e. 2.1 per cent of the estimated background) is predicted for Residence 20. The modelling indicates that the contribution of the operation of the ventilation system to TSP emissions at all residential receptors is negligible.
Umwelt (Australia) Pty Limited 2274/R39/FINAL September 2008 16
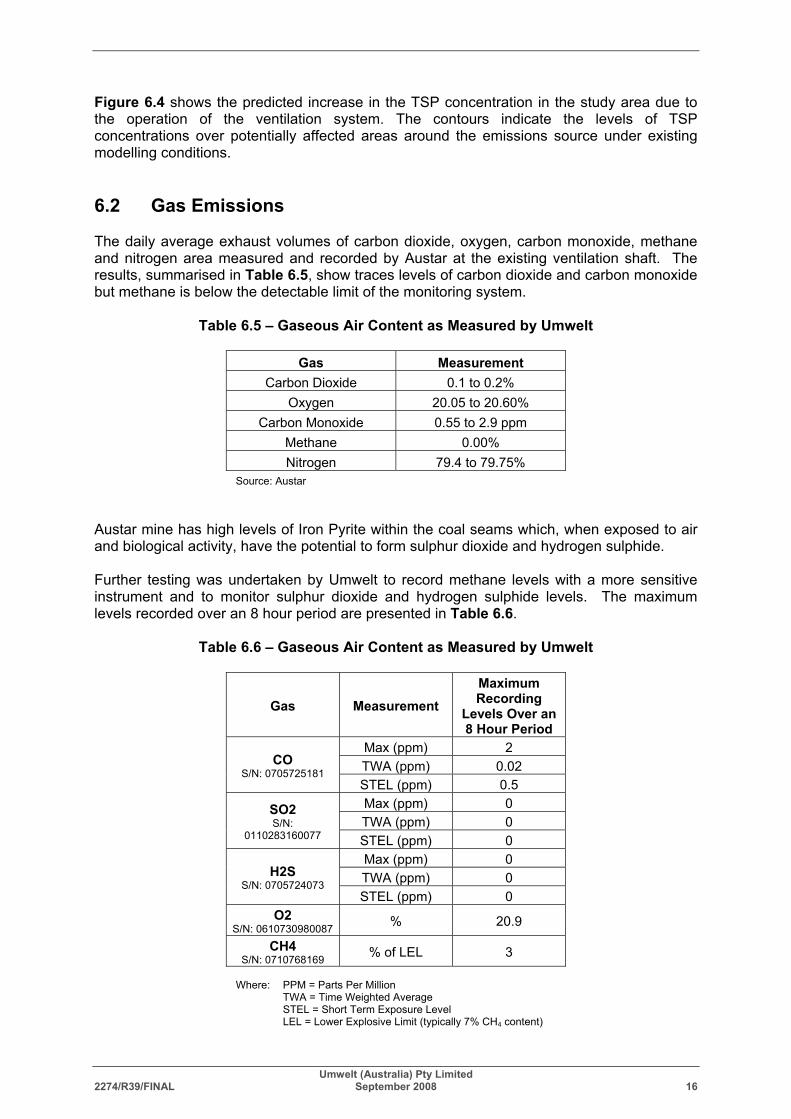
Figure 6.4 shows the predicted increase in the TSP concentration in the study area due to the operation of the ventilation system. The contours indicate the levels of TSP concentrations over potentially affected areas around the emissions source under existing modelling conditions. 6.2 Gas Emissions The daily average exhaust volumes of carbon dioxide, oxygen, carbon monoxide, methane and nitrogen area measured and recorded by Austar at the existing ventilation shaft. The results, summarised in Table 6.5, show traces levels of carbon dioxide and carbon monoxide but methane is below the detectable limit of the monitoring system.
Table 6.5 – Gaseous Air Content as Measured by Umwelt
Gas Measurement Carbon Dioxide 0.1 to 0.2%
Oxygen 20.05 to 20.60% Carbon Monoxide 0.55 to 2.9 ppm
Methane 0.00% Nitrogen 79.4 to 79.75%
Source: Austar Austar mine has high levels of Iron Pyrite within the coal seams which, when exposed to air and biological activity, have the potential to form sulphur dioxide and hydrogen sulphide. Further testing was undertaken by Umwelt to record methane levels with a more sensitive instrument and to monitor sulphur dioxide and hydrogen sulphide levels. The maximum levels recorded over an 8 hour period are presented in Table 6.6.
Table 6.6 – Gaseous Air Content as Measured by Umwelt
Gas Measurement Maximum Recording
Levels Over an 8 Hour Period
Max (ppm) 2 TWA (ppm) 0.02 CO
S/N: 0705725181 STEL (ppm) 0.5 Max (ppm) 0 TWA (ppm) 0
SO2 S/N:
0110283160077 STEL (ppm) 0 Max (ppm) 0 TWA (ppm) 0 H2S
S/N: 0705724073 STEL (ppm) 0
O2 S/N: 0610730980087 % 20.9
CH4 S/N: 0710768169 % of LEL 3
Where: PPM = Parts Per Million TWA = Time Weighted Average STEL = Short Term Exposure Level LEL = Lower Explosive Limit (typically 7% CH4 content)


Umwelt (Australia) Pty Limited 2274/R39/FINAL September 2008 17
The levels of oxygen and carbon dioxide detected during the test period are consistent with the Austar daily average gas concentrations recordings. The level of methane detected during the test period is equivalent to 0.2% as reported by the Austar monitoring system. The measurements for sulphur related compounds indicate that there are no sulphur dioxide or hydrogen sulphide emissions within the exhaust gases of the existing ventilation system.
7.0 Conclusion The Air Quality Impact Assessment of the proposed operation of a ventilation system as a component of the Austar underground coal mining operations extension. was undertaken using the AUSPLUME Gaussian Plume Dispersion Model software developed by EPA (Victoria). To predict dust emission impacts the model used available meteorological information, background air quality records and digital terrain data. The results of the dispersion modelling indicate very small incremental increase in particulate matter concentration and dust deposition at all nearest potentially affected residences. The predictions indicate that dust deposition rates, PM10 and TSP concentrations will be within the relevant DECC air quality criteria at all surrounding residences. Gas monitoring of the existing Austar ventilation shaft indicated that the concentration of coal related gases such as methane and sulphur compounds is negligible and will not have an impact on the surrounding environment.
8.0 Abbreviations and Glossary
mAHD metres above Australian Height Datum AMMAAP Approved Methods for the Modeling and Assessment of Air
Pollutants AWS Automatic Weather Station DECC Department of Environment and Climate Change EPA Environmental Protection Authority HVAS High Volume Air Sampler km Kilometres mg milligram Mt megatonnes m3 cubic metres oC Degrees Celsius oktas eight (Cloud cover scale used in meteorology)

Umwelt (Australia) Pty Limited 2274/R39/FINAL September 2008 18
PM10 Particulate Matter in the size range of zero to ten microns in diameter
TEOM Tapered Element Oscillating Microbalance TSP Total Suspended Particulate matter, usually in the size range of
zero to 50 microns in diameter Umwelt Umwelt (Australia) Pty Limited μg microgram
9.0 References Austar Coal Mine Pty Ltd, 2006. Austar Coal Mine Mining Operations Plan 1/1/06 –
31/12/08. DECC, August 2006. Approved Methods for the Modelling and Assessment of Air Pollutants
in New South Wales. EPA Victoria, 2004. Ausplume Gaussian Plume Dispersion Modelling, Technical User
Manual. NSW Mineral Council, 2000. Particulate Matter and Mining Interim Report, Technical Paper. Umwelt (Australia) Pty Limited, 2007. Environmental Assessment Report – Ventilation Shaft
and Powerline Corridor for South Eastern Mining Area, Baal Bone Colliery.

APPENDIX A
Meteorological Input File for AUSPLUME

Input
Meteorological
data file for
AUSPLUME Cessnock-2003 for
Ellalong, NSW
This file was exclusively compiled
for Umwelt (Australia) Pty Ltd. By
pDs MultiMedia & Consultancy
Service.
All rights reserved @2007
pDs Consultancy
@2007

Input Meteorological data file for AUSPLUME
pDs Consultancy [email protected]
E
R
M
Introduction
Gaussian plume models require hourly averaged meteorological data
from a single site which is preferably in the model domain (site-specific
data). While site-specific data is preferred, data from the nearest off-site
meteorological station can be used when on-site data are not available.
This data should represent the area of concern and the meteorological
parameters should chracterise the transport and dispersion conditions of
the area of concern.
Meteorological input is crucial in Gaussian plume modeling. Therefore
compilation of input meteorological data files should be done meeting
the procedures and algorithms set by environment regulators. It is always
preferred to collect mandatory data such as wind speed, direction,
sigamatheta (Calculated from Wind Direction measurements) and ambient
temperature onsite. And again instrumentations and siting should meet
Australian Standard (2923 -ambient air guide for measurement of
horizontal wind for air quality applications).
Cessnock weather station found to be the best available data source
maintained by Bureau of Meteorology to prepare input meteorological
data file for Ella long (NSW).
This file was complied following the set procedure and the algorithms
recommended by EPA, Victoria.


Input Meteorological data file for AUSPLUME
pDs Consultancy [email protected]
E
R
M
DATA PROCESSING
Data Source
1. Cessnock AWS Data- BoM, NSW (Regional Office).
2. Williamtown Cloud data and Williamtown Airport Vertical temperature
Profiles –National Climate Centre- Bureau of Meteorology, Melbourne.
Input Information
Onsite (Cessnock) parameters
a. Wind speed (km/h)
b. Wind direction
c. Ambient Temperature (C)
d. Surface Pressure
e. Dew point
Offsite (Williamtown)
f. Total Clod amount
Wind was measured at 10m (Anemometer Height), surface
roughness assumed to be 0.3m
OFFSITE
Williamtown (NSW)
1. Vertical temperature profiles; Temperature, Dew point (1
profile per day)

Input Meteorological data file for AUSPLUME
pDs Consultancy [email protected]
E
R
M
Other Info:
Land use category: Mixed Rural
Surface Roughness: 0.3 m
Anemometre Height :10m
QA/QC ON RAW DATA
This data set was treated as follows
Incomplete days removed
Suspected wind stalls (both wind direction and speed) removed
Small gaps filled with previous or following data
Pressure, Dew point Temperature and cloud amount were checked for
unusual values
W ILLIAMTOWN (BOM)VERTICAL TEMPERATURE PROFILES
Gaps in vertical temperature profiles were filled with previous or
following day data for the completeness.

Input Meteorological data file for AUSPLUME
pDs Consultancy [email protected]
E
R
M
DETERMINATION OF SECONDARY PARAMETERS
VERTICAL STABILITY
Solar Radiation for day time and Modified Pasquill Stability Class
outlined in the reference, Davis and Singh, Jl of Hazardous
Materials, 11 was used to determine night-time stability class.
Solar radiation was theoretically calculated using off site cloud
observations.
Table 1 for daytime and part of Table 2 for night-time were used.
TABLE 1: STABILITY CLASSIFICATION FOR DAYTIME USING SOLAR
RADIATION AND WIND SPEED
Solar Radiation ( W/m2 )
Wind
Speed(m/s)
925 675 175 < 175
< 2 A A B D
< 3 A B C D
< 5 B B C D
< 6 C C D D
6 C D D D

Input Meteorological data file for AUSPLUME
pDs Consultancy [email protected]
E
R
M
Table 2: Modified Pasquill stability calsses
Surface
Wind Speed
(m/s)
At 10m
Daytime incoming solar
radiation
Within 1
Hour
before
sunset
or after
sunrise
Night-time cloud amount
(Octas)
Strong
(>600)
Moderate
(300-
600)
Slight
(<300)
Overcast 0-3 4-7 8
< 2 A A-B B D D F F D
< 3 A-B B C D D F E D
< 5 B B-C C D D E D D
< 6 C C-D D D D D D D
6 C D D D D D D D

Input Meteorological data file for AUSPLUME
pDs Consultancy [email protected]
E
R
M
M IXING HEIGHT (CONVECTIVE & MECHANICAL)
DEFINITION:
The mixing height, the depth of the surface mixed layer is the height of
the atmosphere above the ground, which is well mixed due either to
mechanical turbulence or convective turbulence. The air layer above this
height is stable.
The mixing height was determined by using the methodology of Benkley
and Schulman (Journal of Applied Meteorology, Volume 18, 1979,pp 772-
780). Williamtown upper air observation containing temperature and
moisture profiles were used to determine daytime mixing height.
Surface wind speeds and roughness are used to calculate the depth of the
mechanically forced boundary layer during the night time.
MixHm=0.185* Ustar/Cterm
Where Ustar=.35*Usfc/Ln (Htanemo/Z0)
Cterm = Coriolis Term =2 Sin( )
Where is the angular velocity of the earth
is the latitude
Htanemo= Anemometer Height, Z0 is the roughness

Input Meteorological data file for AUSPLUME
pDs Consultancy [email protected]
E
R
M
Height of the convective boundary layer was determined using daytime
temperature sounding (Vertical temperature and dewpoint profiles) in
between sunrise and sunset.
ANALYSIS
DATA COVERAGE
Season No. of Days Percentage
Summer (90 days) 89 99%
Autumn (92 days) 82 89%
Winter(92 days) 90 98%
Spring (91 days) 91 100%
Annual (365 days) 352 96%
All seasons are well represented.

Input Meteorological data file for AUSPLUME
pDs Consultancy [email protected]
E
R
M
ANNUAL W INDROSES

Input Meteorological data file for AUSPLUME
pDs Consultancy [email protected]
E
R
M
SEASONAL W INDROSES

Input Meteorological data file for AUSPLUME
pDs Consultancy [email protected]
E
R
M
ANNUAL STABILITY D ISTRIBUTION
Stability
Category
%
Distribution
Avg Wind
Speed
Avg
Temperature
Avg Mixing
Height
A 2 1.6 21.4 824
B 7 3. 20.8 1110
C
14 4. 20.5 1195
D 37 4.8 18. 1155
E 15 3.4 15. 786
F 25 1.7 12. 428

Input Meteorological data file for AUSPLUME
pDs Consultancy [email protected]
E
R
M
STATISTICS OF CESSNOCK (NSW) INPUT METEOROLOGICAL DATA FILE-2003
Stability Stat Jan Feb Mar Apr May Jun Jul Aug Sep Oct Nov Dec Annual
A Max of Temp 32.0 30.0 25.0 24.0 20.0 20.0 23.0 25.0 31.0 32.0
Min of Temp 16.0 20.0 16.0 17.0 20.0
7.0 11.0 11.0 19.0 7.0
Average of Temp 24.1 25.5 20.7 20.6 20.0
14.4 18.3 19.1 23.6 21.4
Max of WS 2.5 2.5 2.5 1.4 1.1
2.5 2.5 2.5 2.5 2.5
Min of WS 0.6 0.6 0.6 0.6 1.1
0.6 1.1 0.6 0.6 0.6
Average of WS 1.7 1.8 1.2 1.2 1.1
1.4 1.6 1.6 1.7 1.6
Max of MixH 2539 1850 1459 803 710
1377 2127 1600 1800 2539
Min of MixH 141 188 276 170 710
287 270 141 234 141
Average of MixH 969 924 626 434 710
779 987 784 818 824
B Max of Temp 38.0 33.0 28.0 25.0 23.0 20.0 20.0 18.0 25.0 27.0 36.0 33.0 38.0
Min of Temp 18.0 18.0 15.0 7.0 11.0 8.0 6.0 6.0 3.0 10.0 11.0 16.0 3.0
Average of Temp 25.5 25.6 22.9 20.7 18.6 13.9 14.0 12.9 17.2 19.3 22.7 24.1 20.8
Max of WS 4.7 4.7 4.7 4.7 4.2 1.4 4.2 4.7 4.7 4.7 4.7 4.7 4.7
Min of WS 1.1 0.6 0.6 0.6 0.6 0.6 0.6 0.6 0.6 0.6 0.6 0.6 0.6
Average of WS 3.8 3.1 3.1 2.4 1.8 1.1 1.4 2.4 3.2 3.3 3.4 3.3 3.0
Max of MixH 2615 2346 1915 1693 1548 1397 1389 1685 2015 2646 2205 2178 2646
Min of MixH 422 322 357 141 299 141 328 141 322 264 504 188 141
Average of MixH 1378 1120 1107 1021 911 476 653 748 1285 1372 1244 1024 1110
C Max of Temp 40.0 35.0 28.0 26.0 25.0 22.0 22.0 23.0 29.0 28.0 37.0 40.0 40.0
Min of Temp 19.0 18.0 17.0 10.0 10.0 5.0 5.0 0.0 2.0 10.0 14.0 17.0 0.0
Average of Temp 28.3 25.6 23.0 18.9 17.3 15.2 14.3 15.1 18.2 18.4 22.7 26.0 20.5
Max of WS 9.2 8.3 5.8 5.8 5.8 4.7 5.8 5.8 10.8 10.8 9.2 9.7 10.8
Min of WS 2.5 1.1 2.2 0.6 1.1 0.6 2.2 0.6 0.6 2.2 0.6 1.4 0.6
Average of WS 5.2 4.1 3.8 3.4 3.7 3.3 3.6 3.4 4.5 4.1 4.3 4.5 4.0
Max of MixH 2801 2792 2081 1772 1777 1637 1729 2347 2402 2545 2714 2776 2801
Min of MixH 539 340 469 281 469 298 432 170 381 404 328 475 170
Average of MixH 1547 1230 1303 990 942 918 926 1051 1427 1350 1356 1279 1195
D Max of Temp 42.0 35.0 30.0 26.0 26.0 22.0 22.0 23.0 34.0 29.0 37.0 39.0 42.0
Min of Temp 11.0 15.0 8.0 7.0 3.0 0.0 -2.0 -4.0 -1.0 3.0 4.0 12.0 -4.0
Average of Temp 23.8 23.4 20.5 17.5 15.6 13.6 11.4 13.5 18.0 16.5 18.9 22.6 18.0
Max of WS 11.4 8.6 8.6 7.8 11.4 9.2 10.8 13.9 12.8 10.8 10.8 10.3 13.9
Min of WS 0.6 0.6 0.6 0.6 0.6 0.6 0.6 0.6 0.6 0.6 0.6 0.6 0.6
Average of WS 5.3 4.7 4.0 3.7 4.4 4.6 4.7 4.8 5.9 4.7 4.7 4.8 4.8
Max of MixH 2576 2117 1955 1949 2607 2156 2226 3011 2818 2448 2750 2902 3011
Min of MixH 141 141 252 141 141 141 170 141 141 229 141 141 141
Average of MixH 1298 1151 998 892 1043 1073 1079 1155 1435 1179 1175 1171 1155
E Max of Temp 34.0 29.0 24.0 22.0 24.0 22.0 20.0 22.0 30.0 28.0 33.0 29.0 34.0
Min of Temp 11.0 17.0 12.0 9.0 3.0 6.0 3.0 0.0 2.0 8.0 10.0 11.0 0.0
Average of Temp 20.9 21.0 18.0 15.7 13.9 11.6 9.7 10.8 13.5 14.6 17.3 19.4 15.0
Max of WS 4.7 4.7 4.7 4.7 4.7 4.7 4.7 4.7 4.7 4.7 4.7 4.7 4.7
Min of WS 2.2 2.2 2.2 2.2 2.2 2.2 2.2 2.2 2.2 2.2 2.2 2.2 2.2

Input Meteorological data file for AUSPLUME
pDs Consultancy [email protected]
E
R
M
Average of WS 3.5 3.5 3.2 3.2 3.4 3.6 3.3 3.3 3.6 3.2 3.3 3.6 3.4
Max of MixH 1459 1160 1365 1102 1236 1283 1207 1324 1242 1201 1154 1248 1459
Min of MixH 439 375 357 357 404 422 422 410 387 357 439 480 357
Average of MixH 803 792 729 722 786 841 761 759 840 756 768 819 786
F Max of Temp 36.0 29.0 21.0 24.0 23.0 19.0 20.0 20.0 24.0 23.0 32.0 31.0 36.0
Min of Temp 11.0 14.0 8.0 7.0 4.0 -1.0 -2.0 -4.0 -1.0 4.0 4.0 12.0 -4.0
Average of Temp 17.5 19.4 15.8 13.3 11.5 8.3 6.4 6.2 8.5 12.2 13.4 17.5 12.0
Max of WS 2.5 2.5 2.5 2.5 2.5 2.5 2.5 2.5 2.5 2.5 2.5 2.5 2.5
Min of WS 0.6 0.6 0.6 0.6 0.6 0.6 0.6 0.6 0.6 0.6 0.6 0.6 0.6
Average of WS 2.0 2.1 1.8 1.8 1.6 1.5 1.4 1.6 1.6 1.8 1.8 1.8 1.7
Max of MixH 721 750 697 715 814 750 926 797 961 943 973 850 973
Min of MixH 141 188 141 141 141 141 141 141 141 141 141 141 141
Average of MixH 503 508 434 442 398 384 374 393 425 449 450 438 428

Input Meteorological data file for AUSPLUME
pDs Consultancy [email protected]
E
R
M
D ISCLAIMER
Compilation of input meteorological data file for AUSPLUME
was done under the supervision of qualified and experienced
meteorologists. Although all due care has been taken, we
cannot give any warranty, nor accept any liability (except that
required by law) in relation to the information given, its
completeness or its applicability to a particular problem.
These data and other material are supplied on the condition
that you agree to indemnify us and hold us harmless from
and against all liability, losses, claims, proceedings,
damages, costs and expenses, directly or indirectly relating
to, or arising from the use of or reliance on the data and
material which we have supplied.
COPYRIGHT
Bureau of Meteorology holds the copyright for the original
data purchased for Umwelt (Australia) Pty Ltd.
Copyright of the value added data set: Input meteorological
data file for AUSPLUME is held by pDs MultiMedia and
Consultancy Service. The purchaser shall not reproduce,
modify or supply (by sale or otherwise) this data set.

Input Meteorological data file for AUSPLUME
pDs Consultancy [email protected]
E
R
M
BIBLIOGRAPHY
Australian Standard 2923-1987 :Standards Association of Australia
Benkley, C.W,& Schulman L.L 1979 :Estimating Hourly Mixing Depths from
Historical Meteorological Data :Jl of Applied Meteorology Vol 1 page 772-780
Dewundege, P.,2002, Comparison of Some Feasible Schemes For Atmospheric
Stability Determination: A Case Study. Proceedings of the 15th International
Clean Air and Environment Conference, Christchurch, NZ, 2002, Clean Air
Society of Australia & New Zealand
Lorimer, G.S and Godfrey, J.J 1998, Plume Models: Techniques for better usage.
Proceedings of the 13th International Clean Air and Environment Conference,
Adelaide, 1996, Clean Air Society of Australia & New Zealand, pp 507-512
Mohan, M and Siddiqi, T. A. 1998, Analysis of various schemes for the
estimation of atmospheric stability classification. Atmospheric Environment
Vol 32, No. 21, pp. 3775-3781
Turner, D.B. 1970, Workbook of atmospheric dispersion estimates, Office of Air
Program Pub. No. AP-26, EPA,USA
USEPA, 2000, Meteorological Monitoring Guidance for Regulatory Modelling
Applications, EPA-450/R-99-005. United States Environmental Protection
Agency, Washington DC, USA.