appendix 17b - wrate assessment - planning inspectorate · sncr selective non catalytic reduction...
TRANSCRIPT
Ferrybridge Multifuel 2 (FM2)
Document Ref: 6.4.24
Environmental Statement – Volume III (Appendices)
July 2014 Appendix 17B
APPENDIX 17B: WRATE ASSESSMENT REPORT
Ferrybridge Multifuel 2 (FM2)
Document Ref: 6.4.24
PINS Ref: EN010061
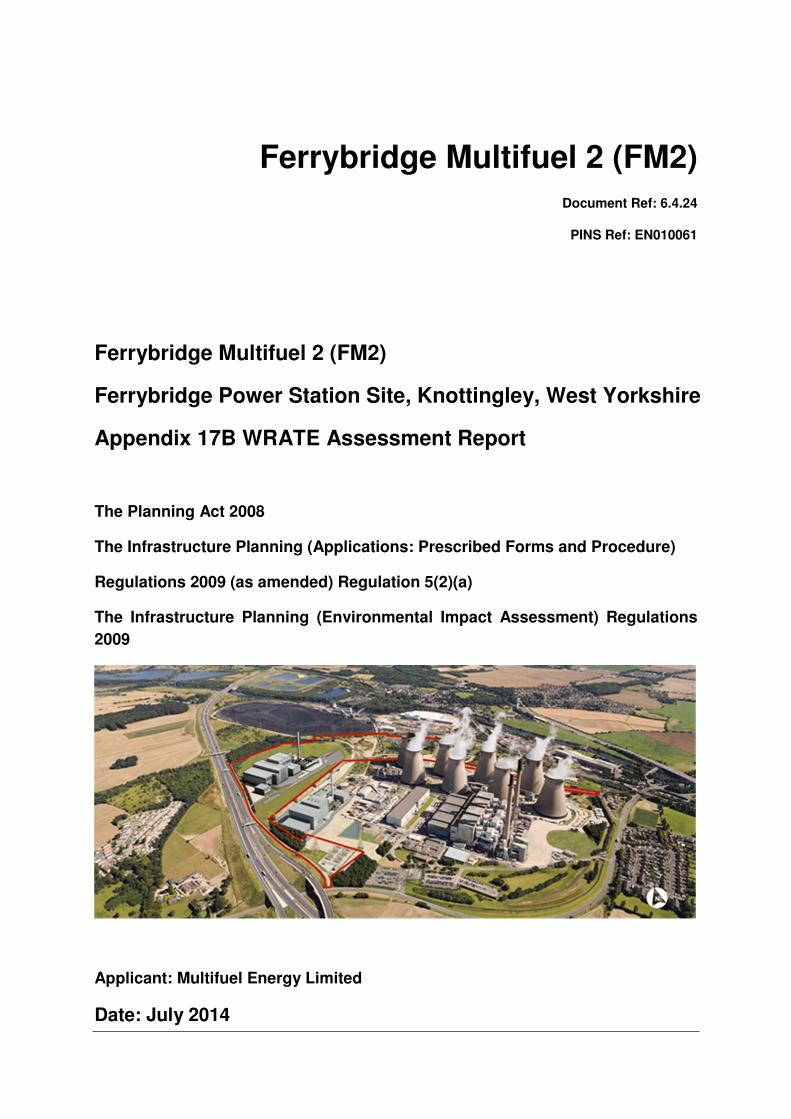
Ferrybridge Multifuel 2 (FM2)
Ferrybridge Power Station Site, Knottingley, West Yorkshire
Appendix 17B WRATE Assessment Report
The Planning Act 2008
The Infrastructure Planning (Applications: Prescribed Forms and Procedure)
Regulations 2009 (as amended) Regulation 5(2)(a)
The Infrastructure Planning (Environmental Impact Assessment) Regulations
2009
Applicant: Multifuel Energy Limited
Date: July 2014
Ferrybridge Multifuel 2 (FM2)
Document Ref:6.4.24
Appendix 17B WRATE Assessment Report
July 2014 (i)
Document Number 6.4.24
Revision
Author
Signed R Hamblin Date 21/7/14
Approved By
Signed M Bains Date 21/7/14
Document Owner URS
Revision History
Revision No. Date Reason for Revision Authorised By
Submission version 30/7/14 K Cobb
Ferrybridge Multifuel 2 (FM2)
Document Ref: 6.4.24
Appendix 17B WRATE Assessment Report
July 2014 (ii)
Glossary
CCGT Combined Cycle Gas Turbine
CHP Combined Heat and Power
C&I Commercial and Industrial
ES Environmental Statement
FGT Flue Gas Treatment
GWP Global Warming Potential
HDPE High-density Polyethylene
HTP Human Toxicity Potentials
IBA Incinerator Bottom Ash
LCA Life Cycle Analysis
MBT Mechanical and Biological Treatment
MRF Materials Recycling Facility
MSW Municipal Solid Waste NCV Net Calorific Value
SNCR Selective Non Catalytic Reduction
tpa tonnes per annum
WEEE Waste Electric and Electronic Equipment
WDF Waste Derived Fuel
WRATE Waste and Resources Assessment Tool for the Environment
Ferrybridge Multifuel 2 (FM2)
Document Ref: 6.4.24
Appendix 17B WRATE Assessment Report
July 2014 (iii)
CONTENTS
17B. WRATE ASSESSMENT REPORT ............................................................................. 1
17B.1. Introduction to WRATE ................................................................................................ 1
17B.2. Impact Assessment ..................................................................................................... 2
17B.3. Assessment ................................................................................................................. 3
Assessment Summary ................................................................................................. 3
Waste Composition ..................................................................................................... 4
Waste Pre-treatment ................................................................................................... 6
Transport ..................................................................................................................... 7
Recycling ..................................................................................................................... 7
Energy Recovery – Proposed Development ............................................................... 8
Landfill ......................................................................................................................... 8
17B.4. Results ....................................................................................................................... 10
17B.5. Model Analysis........................................................................................................... 14
Variation to annual throughput - 425,000 tonnes ...................................................... 14
Variation to annual throughput - 675,000 tonnes ...................................................... 15
Pre-treatment ............................................................................................................. 20
Transport Distances .................................................................................................. 20
Proposed Development Outputs ............................................................................... 21
17B.6. Conclusions ............................................................................................................... 22
17B.7. References ................................................................................................................ 23
Ferrybridge Multifuel 2 (FM2)
Document Ref: 6.4.24
Appendix 17B WRATE Assessment Report
July 2014 Page 1 of Appendix 17B
17B. WRATE ASSESSMENT REPORT
17B.1. Introduction to WRATE
17B.1.1. An assessment of the Proposed Development (Ferrybridge Multifuel 2) has been
undertaken using the Environment Agency’s WRATE (Waste and Resources Assessment
Tool for the Environment) lifecycle assessment tool to evaluate the relative environmental
burden of the chosen waste management routes.
17B.1.2. WRATE is a Life Cycle Assessment (LCA) model that was first developed by the
Environment Agency in 2007. WRATE allows users to quantify and compare the relative
environmental burdens of equivalent integrated waste management systems across their
entire life cycle.
17B.1.3. WRATE calculates the potential impacts arising from all processes in the waste
management system including the collection, transportation, transfer, treatment, disposal
and recycling of materials. The model takes account of the construction and operation of
infrastructure and vehicles, and offsets this burden against the avoided burdens
associated with materials and energy recovery. All inputs of waste, energy and materials,
and outputs of energy, process residues, materials and emissions are accounted for.
17B.1.4. Background data are provided by built-in databases, namely:
• the energy-mix database, which contains information related to the electricity
generation mix, energy generation efficiency, losses during electricity transport and
marginal electricity production; and
• the waste composition database, which contains the information relating to the type
and quantity of waste, including a pre-defined elemental waste composition for each
waste fraction, a default waste composition and calorific value and moisture content.
17B.1.5. In using WRATE the user specifies the waste stream(s) to be managed, then defines the
way in which the waste is to be managed, step by step, including (as appropriate) the
collection medium, vehicles, intermediate facilities, treatment, recovery and/or final
disposal. WRATE calculates and presents the environmental impacts in terms of six
default impacts: abiotic resource depletion, freshwater, aquatic ecotoxicology,
acidification, eutrophication, global warming potential and human toxicity.
17B.1.6. For the purpose of this assessment, the impact in terms of global warming potential
(GWP) only is considered in detail, as these data are to be utilised in the carbon
assessment for the Proposed Development. Outputs from the WRATE analysis have
informed Chapter 4 Need, Alternatives and Design Evolution and Chapter 17
Sustainability of the Environmental Statement (ES). The analysis has also taken
account of, and been developed in conjunction with, the Fuel Availability and Waste
Hierarchy Assessment (Application Document Ref. No. 5.9) for the Proposed
Development.
17B.1.7. In completing the WRATE assessment, the software version 2.0.1.8, (built 26/10/2012)
was used, which draws on guidance provided in:
• ISO 14040:1997 – Principles and framework;
• ISO 14041:1998 – Goal and scope definition and inventory analysis;
• ISO 14042:2000 – Life cycle impact assessment;
• ISO 14043:2000 – Life cycle interpretation;
• ISO 14048:2002 – Data documentation format; and
• ISO 14049:2000 – Examples of application of ISO 14041 to goal and scope definition
and inventory analysis.
Ferrybridge Multifuel 2 (FM2)
Document Ref: 6.4.24
Appendix 17B WRATE Assessment Report
July 2014 Page 2 of Appendix 17B
17B.2. Impact Assessment
17B.2.1. The primary purpose of this assessment is to assess the carbon impact of the Proposed
Development. Climate change (i.e. Global Warming Potential) (GWP100a) is an
assessment of the amount of carbon dioxide and other gases emitted that cause global
warming. Apart from CO2, the other major greenhouse gas is methane (CH4). Methane is
considered 23 times more potent than CO2 in terms of its effect on global warming over a
100 year period. Climate change impact in WRATE is expressed in kg CO2-equivalent
(eq).
17B.2.2. It is important to note that where the model results show a minus value for the kg CO2-eq
this is not indicative of a process being a carbon ‘sink’ but of a process displacing
conventional energy or electricity use, and hence resulting lower global emissions than
would be the case under the default scenario. The energy mix selected for this
assessment is the default WRATE 2020 energy mix. The electricity displaced by the
Proposed Development would be made up of a mix of generation types known as the
‘marginal’ mix. This mix is forecast by WRATE (using Department of Energy and Climate
Change [DECC] data) for every year up until 2020. For this assessment, the year of study
was selected as 2020. WRATE forecasts the marginal energy mix for that year to be
33.8% coal, 4.2% gas and 62.0% gas – Combined Cycle Gas Turbine (CCGT).
17B.2.3. It is recognised that the Defra publication ‘Energy from Waste – A guide to the debate
Feb 2014’ (ref 17B-1) states that “A gas fired power station (Combined Cycle Gas
Turbine – CCGT) is the current standard comparator as this is the marginal technology if
you wanted to build a new power station today.” If 100% CCGT were used as the
comparator this would reduce the overall benefit predicted for the Proposed
Development, although a benefit would still be predicted. The predicted effect of the
change in energy mix is heavily dependent on the carbon intensity and emission factors
used in the assessment. Estimates of carbon intensities for different types of energy
generation are provided in the carbon assessment (Appendix 17A).
17B.2.4. The other Environment Agency default impacts that are reported by WRATE (but which
are not relevant to this carbon footprint assessment) include the following:
• Acidification Potential; average European (kg SO2-Eq) – this relates to the release of
acidic gases such as sulphur dioxide that have the potential to react with water in the
atmosphere to form ‘acid rain’ and causing damage to the environment.
• Eutrophication Potential (kg PO4-EQ) – this relates to the release of nitrate and
phosphate. Increased concentrations in water and soils can result in increased algal
growth reducing the oxygen in the water and damage to plant stability in soils, both
damaging the environment.
• Freshwater Aquatic Ecotoxicity: FAETP infinite (kg1,4-DCB-Eq) – this relates to the
impact of toxic substances on aquatic organisms and the bioaccumulation of toxins
such as mobile heavy metals.
• Human Toxicity: HTP infinite (kg 1,4-DCB-Eq) – this relates to the impacts on human
health. Characterisation factors, expressed as Human Toxicity Potentials (HTP)
describe fate, exposure and the effects of toxic substances.
• Resources: depletion of abiotic resources (kg antimony-Eq) – this relates to the
extraction of raw materials and resources. An abiotic depletion factor is determined for
each mineral or fossil fuel based on the rate of extraction and the global resource
reserves.
Ferrybridge Multifuel 2 (FM2)
Document Ref: 6.4.24
Appendix 17B WRATE Assessment Report
July 2014 Page 3 of Appendix 17B
17B.3. Assessment
Assessment Summary
17B.3.1. Scenario 1 is the disposal of pre-treated waste to landfill (landfill baseline) and scenario 2
is the combustion of pre-treated waste as Waste Derived Fuel (WDF) at the Proposed
Development for energy recovery. Both the baseline and the Proposed Development
scenarios are modelled twice to assess the impact of different starting proportions of
municipal solid waste (MSW) and commercial and industrial (C&I). This is to account for
the fact that the actual source of fuel for the Proposed Development (therefore the likely
mix of MSW and C&I) is not yet determined, as contracts will not be let until the key
consents for the Proposed Development are obtained. Two scenarios have therefore
been developed (A and B) to demonstrate the likely range of MSW/C&I mix that may
occur.
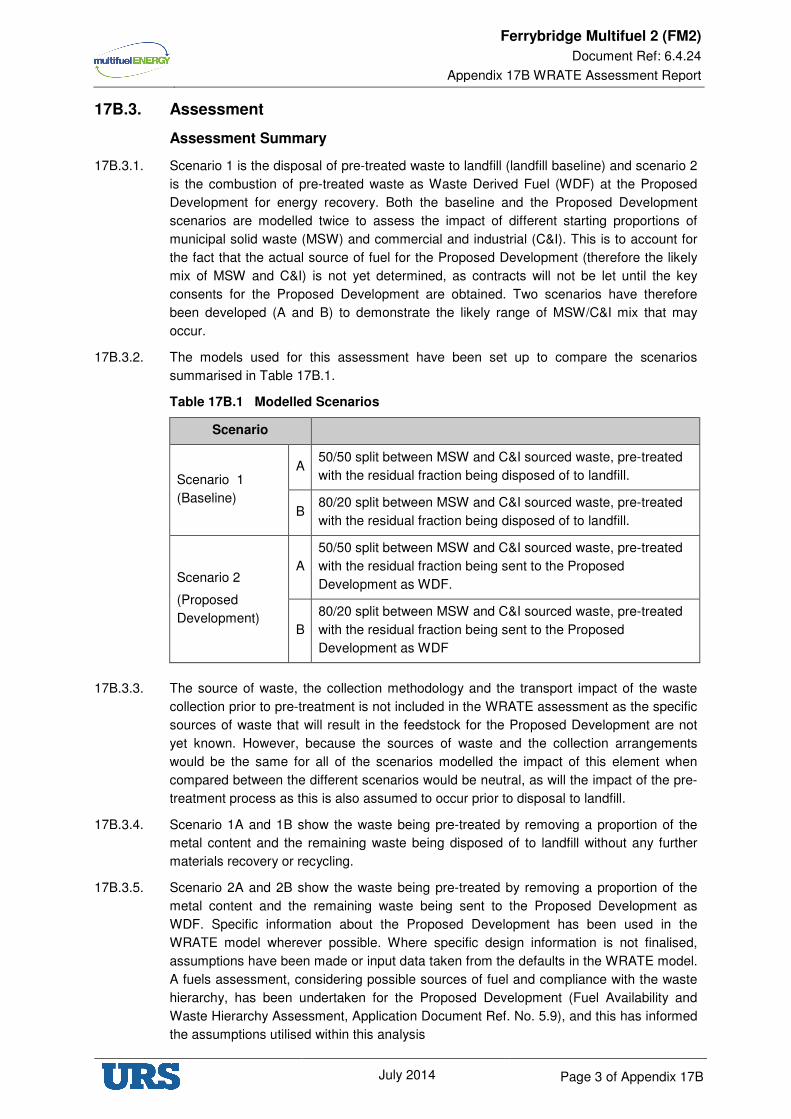
17B.3.2. The models used for this assessment have been set up to compare the scenarios
summarised in Table 17B.1.
Table 17B.1 Modelled Scenarios
Scenario
Scenario 1
(Baseline)
A 50/50 split between MSW and C&I sourced waste, pre-treated
with the residual fraction being disposed of to landfill.
B 80/20 split between MSW and C&I sourced waste, pre-treated
with the residual fraction being disposed of to landfill.
Scenario 2
(Proposed
Development)
A
50/50 split between MSW and C&I sourced waste, pre-treated
with the residual fraction being sent to the Proposed
Development as WDF.
B
80/20 split between MSW and C&I sourced waste, pre-treated
with the residual fraction being sent to the Proposed
Development as WDF
17B.3.3. The source of waste, the collection methodology and the transport impact of the waste
collection prior to pre-treatment is not included in the WRATE assessment as the specific
sources of waste that will result in the feedstock for the Proposed Development are not
yet known. However, because the sources of waste and the collection arrangements
would be the same for all of the scenarios modelled the impact of this element when
compared between the different scenarios would be neutral, as will the impact of the pre-
treatment process as this is also assumed to occur prior to disposal to landfill.
17B.3.4. Scenario 1A and 1B show the waste being pre-treated by removing a proportion of the
metal content and the remaining waste being disposed of to landfill without any further
materials recovery or recycling.
17B.3.5. Scenario 2A and 2B show the waste being pre-treated by removing a proportion of the
metal content and the remaining waste being sent to the Proposed Development as
WDF. Specific information about the Proposed Development has been used in the
WRATE model wherever possible. Where specific design information is not finalised,
assumptions have been made or input data taken from the defaults in the WRATE model.
A fuels assessment, considering possible sources of fuel and compliance with the waste
hierarchy, has been undertaken for the Proposed Development (Fuel Availability and
Waste Hierarchy Assessment, Application Document Ref. No. 5.9), and this has informed
the assumptions utilised within this analysis
Ferrybridge Multifuel 2 (FM2)
Document Ref: 6.4.24
Appendix 17B WRATE Assessment Report
July 2014 Page 4 of Appendix 17B
Waste Composition
17B.3.6. As stated previously, and as further described in the Fuel Availability and Waste
Hierarchy Assessment (Application Document Ref. No. 5.9), it is not possible to define
the specific mix of MSW or C&I that might comprise the fuel for the Proposed
Development. It is also not possible at the current time to specify the geographical source
of the fuel or the specific average NCV.
17B.3.7. The average throughput for the Proposed Development is expected to be approximately
570,000 tonnes per annum. This tonnage has been modelled for this assessment on the
basis that this would represent the most likely throughput. In order to provide a robust
assessment the upper and lower average throughput tonnages have both also been
modelled.
17B.3.8. In order to accurately reflect the varying proportions of waste from these sources that the
Proposed Development might handle in the future, two scenarios have been modelled:
• Scenario 1A and 2A – 50/50 split between MSW and C&I sourced waste; and
• Scenario 1B and 2B – 80/20 split between MSW and C&I sourced waste.
17B.3.9. The default WRATE Municipal Solid Waste (MSW) composition for England has been
used for the MSW composition in the models. The composition of the C&I waste has
been based on the data from a study undertaken for the Environment Agency Wales in
2007 (Ref. 17B-1).
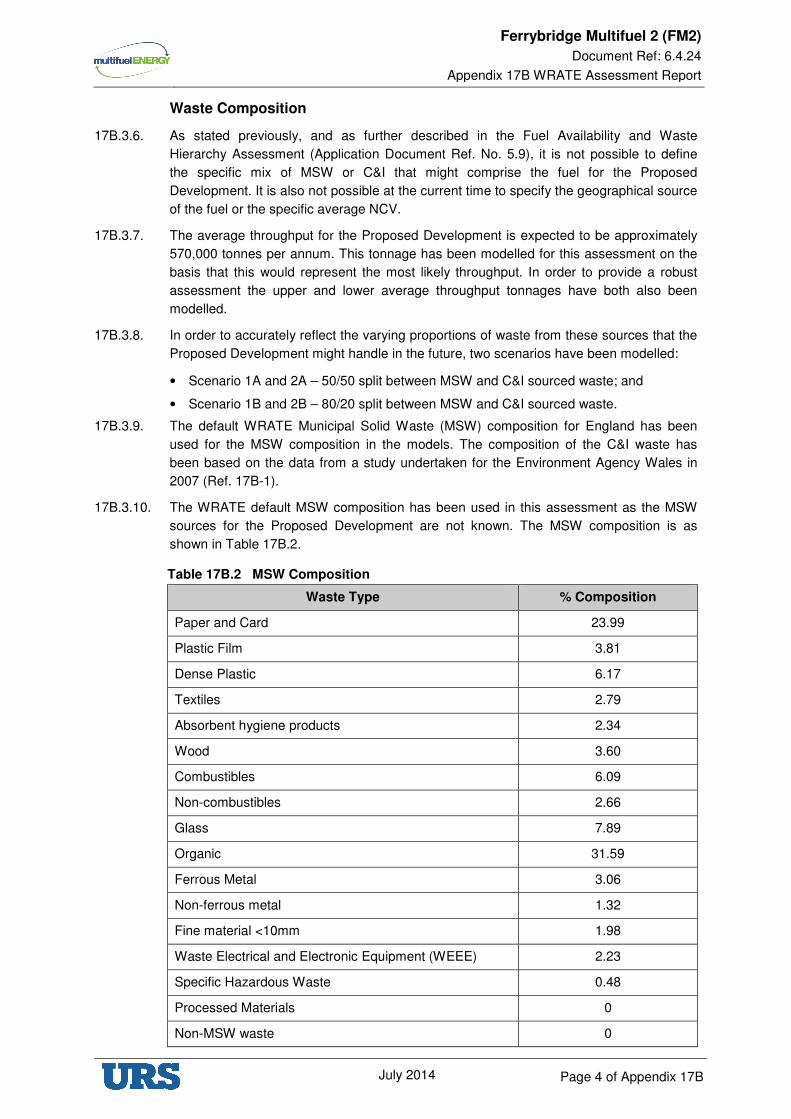
17B.3.10. The WRATE default MSW composition has been used in this assessment as the MSW
sources for the Proposed Development are not known. The MSW composition is as
shown in Table 17B.2.
Table 17B.2 MSW Composition
Waste Type % Composition
Paper and Card 23.99
Plastic Film 3.81
Dense Plastic 6.17
Textiles 2.79
Absorbent hygiene products 2.34
Wood 3.60
Combustibles 6.09
Non-combustibles 2.66
Glass 7.89
Organic 31.59
Ferrous Metal 3.06
Non-ferrous metal 1.32
Fine material <10mm 1.98
Waste Electrical and Electronic Equipment (WEEE) 2.23
Specific Hazardous Waste 0.48
Processed Materials 0
Non-MSW waste 0
Ferrybridge Multifuel 2 (FM2)
Document Ref: 6.4.24
Appendix 17B WRATE Assessment Report
July 2014 Page 5 of Appendix 17B
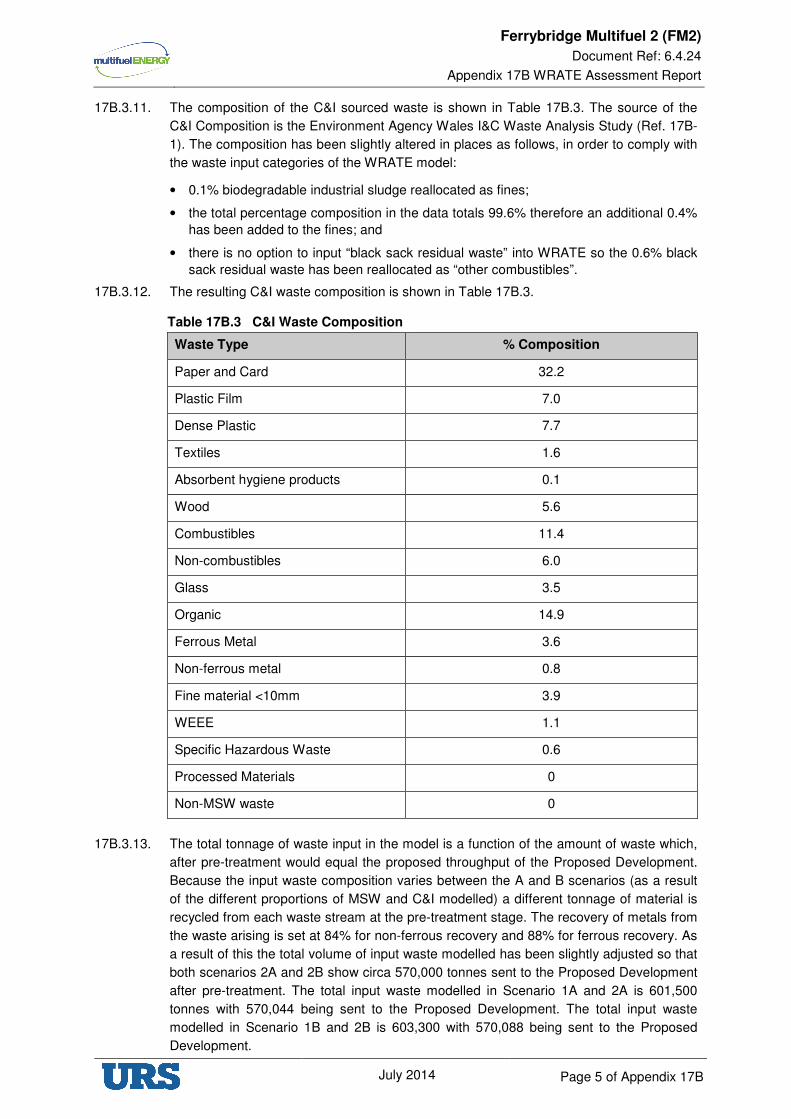
17B.3.11. The composition of the C&I sourced waste is shown in Table 17B.3. The source of the
C&I Composition is the Environment Agency Wales I&C Waste Analysis Study (Ref. 17B-
1). The composition has been slightly altered in places as follows, in order to comply with
the waste input categories of the WRATE model:
• 0.1% biodegradable industrial sludge reallocated as fines;
• the total percentage composition in the data totals 99.6% therefore an additional 0.4%
has been added to the fines; and
• there is no option to input “black sack residual waste” into WRATE so the 0.6% black
sack residual waste has been reallocated as “other combustibles”.
17B.3.12. The resulting C&I waste composition is shown in Table 17B.3.
Table 17B.3 C&I Waste Composition
Waste Type % Composition
Paper and Card 32.2
Plastic Film 7.0
Dense Plastic 7.7
Textiles 1.6
Absorbent hygiene products 0.1
Wood 5.6
Combustibles 11.4
Non-combustibles 6.0
Glass 3.5
Organic 14.9
Ferrous Metal 3.6
Non-ferrous metal 0.8
Fine material <10mm 3.9
WEEE 1.1
Specific Hazardous Waste 0.6
Processed Materials 0
Non-MSW waste 0
17B.3.13. The total tonnage of waste input in the model is a function of the amount of waste which,
after pre-treatment would equal the proposed throughput of the Proposed Development.
Because the input waste composition varies between the A and B scenarios (as a result
of the different proportions of MSW and C&I modelled) a different tonnage of material is
recycled from each waste stream at the pre-treatment stage. The recovery of metals from
the waste arising is set at 84% for non-ferrous recovery and 88% for ferrous recovery. As
a result of this the total volume of input waste modelled has been slightly adjusted so that
both scenarios 2A and 2B show circa 570,000 tonnes sent to the Proposed Development
after pre-treatment. The total input waste modelled in Scenario 1A and 2A is 601,500
tonnes with 570,044 being sent to the Proposed Development. The total input waste
modelled in Scenario 1B and 2B is 603,300 with 570,088 being sent to the Proposed
Development.
Ferrybridge Multifuel 2 (FM2)
Document Ref: 6.4.24
Appendix 17B WRATE Assessment Report
July 2014 Page 6 of Appendix 17B
Waste Pre-treatment
17B.3.14. Waste that is sent to the Proposed Development will have undergone some
processing/pre-treatment to refine its composition. For the same reasons set out
previously regarding fuels composition and NCV value, it is also not possible to define
specifically what pre-treatment will occur prior to the fuel arriving at the Site as this will
depend on the nature of the contracts eventually let for the Proposed Development.
17B.3.15. Based on the discussions and agreements reached to date for the multifuel facility
currently under construction (FM1), a basic pre-treatment process has been assumed for
the WRATE analysis. This is based on the experience of FM1 that remaining fuel
contracts are likely to involve relatively simple Material Recycling Facilities (MRF) rather
than more complex MRFs or Mechanical Biological Treatment (MBT) facilities. The
simplest option within the WRATE model that aligns with this assumption is a simple MBT
pre-treatment process (noting this is not full MBT, purely the pre-treatment aspect of that
option).
17B.3.16. The pre-treatment process used for all of the modelled scenarios shows a proportion of
the metals (ferrous and non-ferrous) being extracted from the input waste and recycled. A
proportion of the WEEE waste is also removed and sent for recovery. The pre-treatment
process modelled is a WRATE pre-treatment process for a MBT facility. Some of the MBT
facilities in WRATE require the user to model a separate pre-treatment process before
the user can model an MBT. The process used in this model is the ‘MBT crushing and
metals GENERIC process’. This would usually precede an MBT process but in this case
has been used as a stand-alone process for metals removal.
17B.3.17. The pre-treatment process modelled has been included in both the scenarios showing
waste being sent to the Proposed Development and waste being disposed of to landfill.
This results in a more conservative assessment when comparing the Proposed
Development to the baseline scenario as the benefit of the metals recycling is attributable
to both scenarios and not just to the Proposed Development.
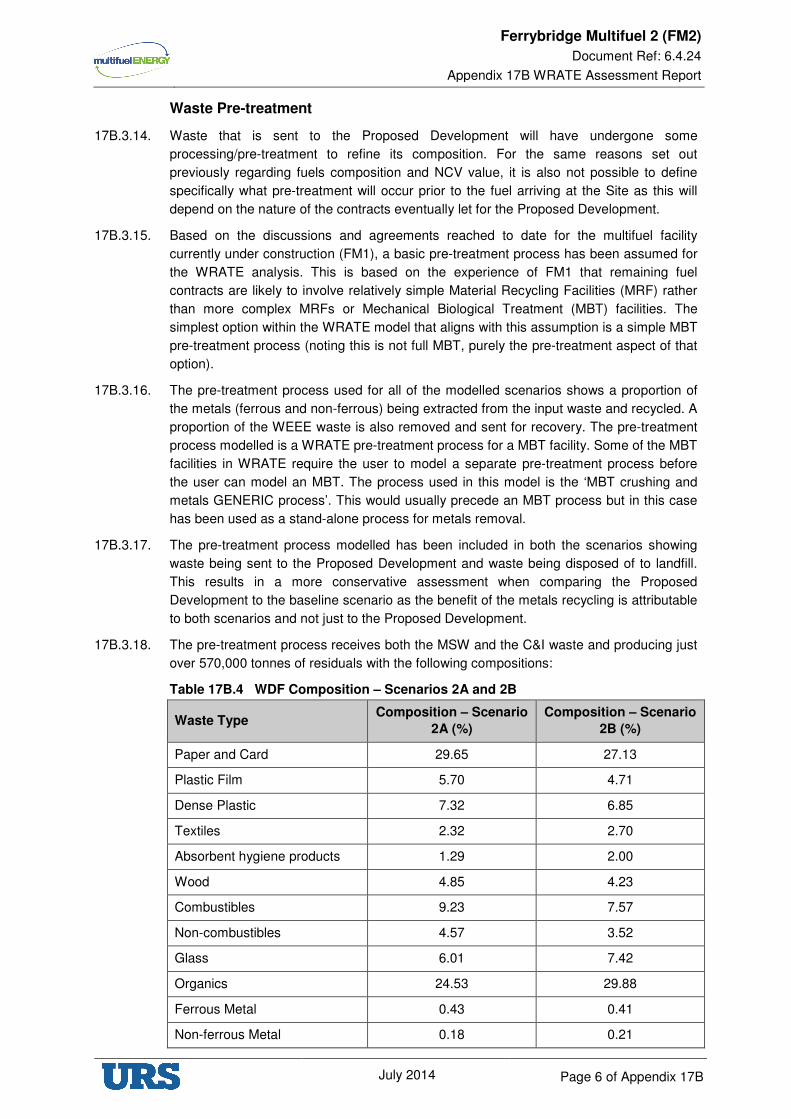
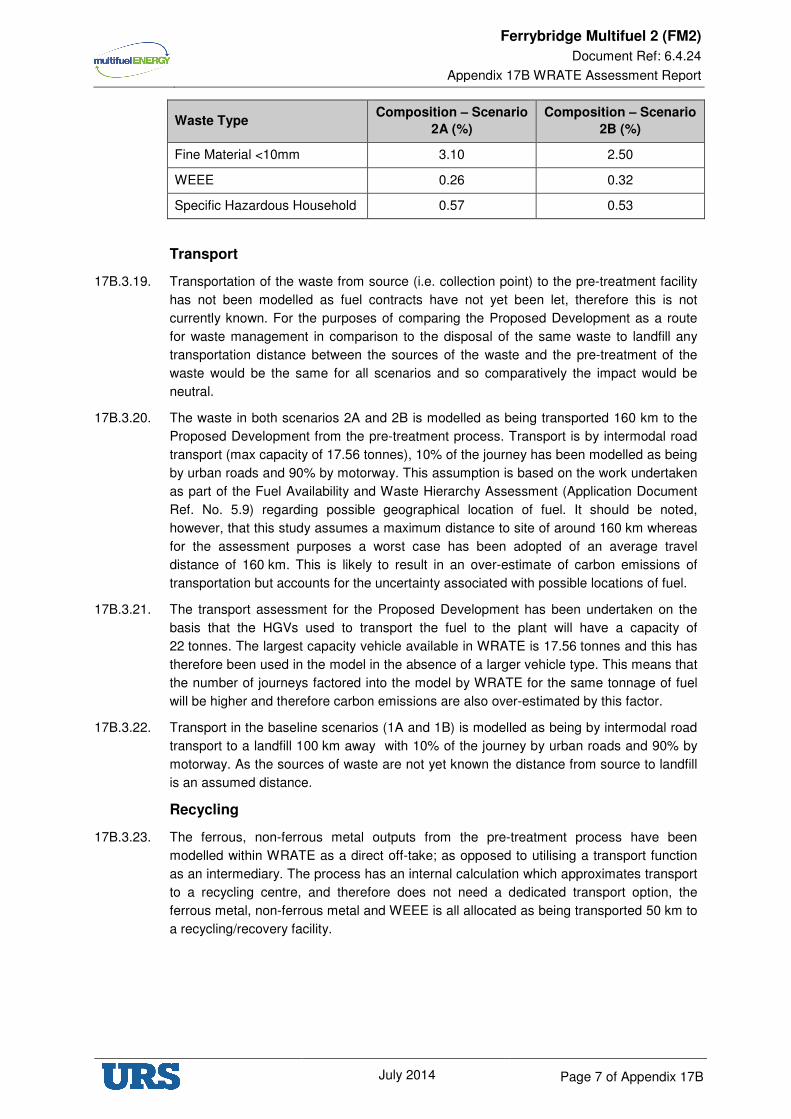
17B.3.18. The pre-treatment process receives both the MSW and the C&I waste and producing just
over 570,000 tonnes of residuals with the following compositions:
Table 17B.4 WDF Composition – Scenarios 2A and 2B
Waste Type Composition – Scenario
2A (%)
Composition – Scenario
2B (%)
Paper and Card 29.65 27.13
Plastic Film 5.70 4.71
Dense Plastic 7.32 6.85
Textiles 2.32 2.70
Absorbent hygiene products 1.29 2.00
Wood 4.85 4.23
Combustibles 9.23 7.57
Non-combustibles 4.57 3.52
Glass 6.01 7.42
Organics 24.53 29.88
Ferrous Metal 0.43 0.41
Non-ferrous Metal 0.18 0.21
Ferrybridge Multifuel 2 (FM2)
Document Ref: 6.4.24
Appendix 17B WRATE Assessment Report
July 2014 Page 7 of Appendix 17B
Waste Type Composition – Scenario
2A (%)
Composition – Scenario
2B (%)
Fine Material <10mm 3.10 2.50
WEEE 0.26 0.32
Specific Hazardous Household 0.57 0.53
Transport
17B.3.19. Transportation of the waste from source (i.e. collection point) to the pre-treatment facility
has not been modelled as fuel contracts have not yet been let, therefore this is not
currently known. For the purposes of comparing the Proposed Development as a route
for waste management in comparison to the disposal of the same waste to landfill any
transportation distance between the sources of the waste and the pre-treatment of the
waste would be the same for all scenarios and so comparatively the impact would be
neutral.
17B.3.20. The waste in both scenarios 2A and 2B is modelled as being transported 160 km to the
Proposed Development from the pre-treatment process. Transport is by intermodal road
transport (max capacity of 17.56 tonnes), 10% of the journey has been modelled as being
by urban roads and 90% by motorway. This assumption is based on the work undertaken
as part of the Fuel Availability and Waste Hierarchy Assessment (Application Document
Ref. No. 5.9) regarding possible geographical location of fuel. It should be noted,
however, that this study assumes a maximum distance to site of around 160 km whereas
for the assessment purposes a worst case has been adopted of an average travel
distance of 160 km. This is likely to result in an over-estimate of carbon emissions of
transportation but accounts for the uncertainty associated with possible locations of fuel.
17B.3.21. The transport assessment for the Proposed Development has been undertaken on the
basis that the HGVs used to transport the fuel to the plant will have a capacity of
22 tonnes. The largest capacity vehicle available in WRATE is 17.56 tonnes and this has
therefore been used in the model in the absence of a larger vehicle type. This means that
the number of journeys factored into the model by WRATE for the same tonnage of fuel
will be higher and therefore carbon emissions are also over-estimated by this factor.
17B.3.22. Transport in the baseline scenarios (1A and 1B) is modelled as being by intermodal road
transport to a landfill 100 km away with 10% of the journey by urban roads and 90% by
motorway. As the sources of waste are not yet known the distance from source to landfill
is an assumed distance.
Recycling
17B.3.23. The ferrous, non-ferrous metal outputs from the pre-treatment process have been
modelled within WRATE as a direct off-take; as opposed to utilising a transport function
as an intermediary. The process has an internal calculation which approximates transport
to a recycling centre, and therefore does not need a dedicated transport option, the
ferrous metal, non-ferrous metal and WEEE is all allocated as being transported 50 km to
a recycling/recovery facility.
Ferrybridge Multifuel 2 (FM2)
Document Ref: 6.4.24
Appendix 17B WRATE Assessment Report
July 2014 Page 8 of Appendix 17B
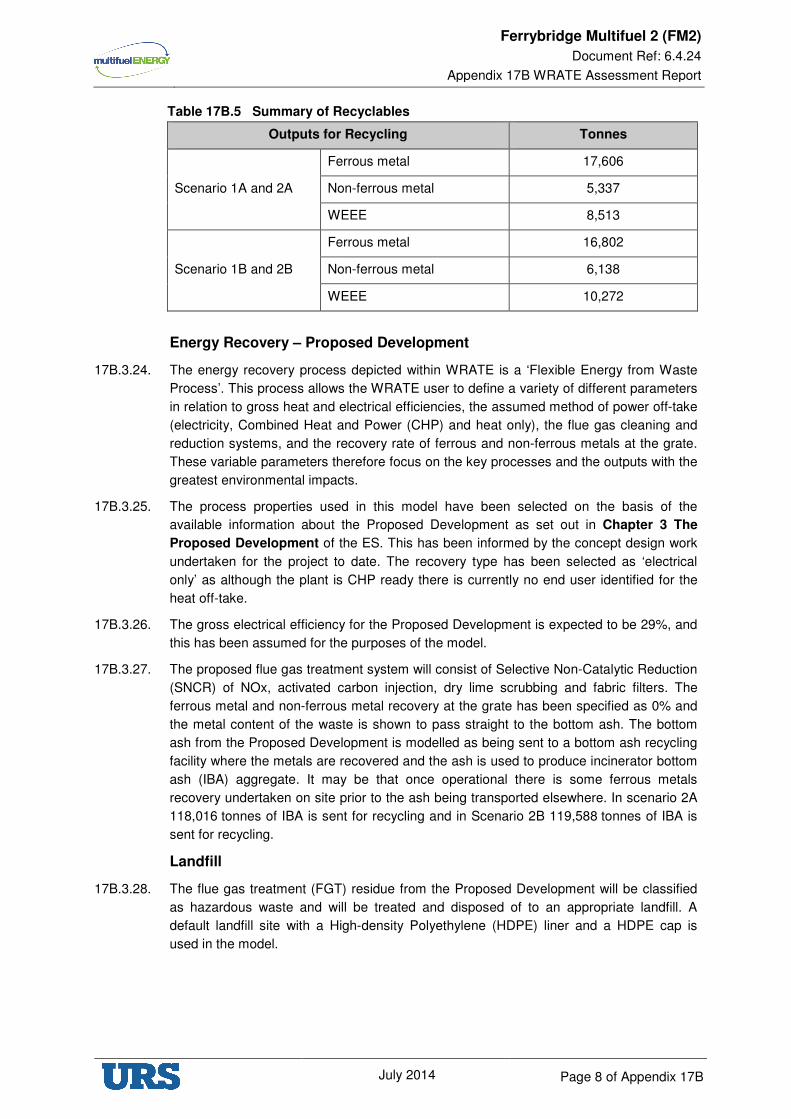
Table 17B.5 Summary of Recyclables
Outputs for Recycling Tonnes
Scenario 1A and 2A
Ferrous metal 17,606
Non-ferrous metal 5,337
WEEE 8,513
Scenario 1B and 2B
Ferrous metal 16,802
Non-ferrous metal 6,138
WEEE 10,272
Energy Recovery – Proposed Development
17B.3.24. The energy recovery process depicted within WRATE is a ‘Flexible Energy from Waste
Process’. This process allows the WRATE user to define a variety of different parameters
in relation to gross heat and electrical efficiencies, the assumed method of power off-take
(electricity, Combined Heat and Power (CHP) and heat only), the flue gas cleaning and
reduction systems, and the recovery rate of ferrous and non-ferrous metals at the grate.
These variable parameters therefore focus on the key processes and the outputs with the
greatest environmental impacts.
17B.3.25. The process properties used in this model have been selected on the basis of the
available information about the Proposed Development as set out in Chapter 3 The
Proposed Development of the ES. This has been informed by the concept design work
undertaken for the project to date. The recovery type has been selected as ‘electrical
only’ as although the plant is CHP ready there is currently no end user identified for the
heat off-take.
17B.3.26. The gross electrical efficiency for the Proposed Development is expected to be 29%, and
this has been assumed for the purposes of the model.
17B.3.27. The proposed flue gas treatment system will consist of Selective Non-Catalytic Reduction
(SNCR) of NOx, activated carbon injection, dry lime scrubbing and fabric filters. The
ferrous metal and non-ferrous metal recovery at the grate has been specified as 0% and
the metal content of the waste is shown to pass straight to the bottom ash. The bottom
ash from the Proposed Development is modelled as being sent to a bottom ash recycling
facility where the metals are recovered and the ash is used to produce incinerator bottom
ash (IBA) aggregate. It may be that once operational there is some ferrous metals
recovery undertaken on site prior to the ash being transported elsewhere. In scenario 2A
118,016 tonnes of IBA is sent for recycling and in Scenario 2B 119,588 tonnes of IBA is
sent for recycling.
Landfill
17B.3.28. The flue gas treatment (FGT) residue from the Proposed Development will be classified
as hazardous waste and will be treated and disposed of to an appropriate landfill. A
default landfill site with a High-density Polyethylene (HDPE) liner and a HDPE cap is
used in the model.
Ferrybridge Multifuel 2 (FM2)
Document Ref: 6.4.24
Appendix 17B WRATE Assessment Report
July 2014 Page 9 of Appendix 17B
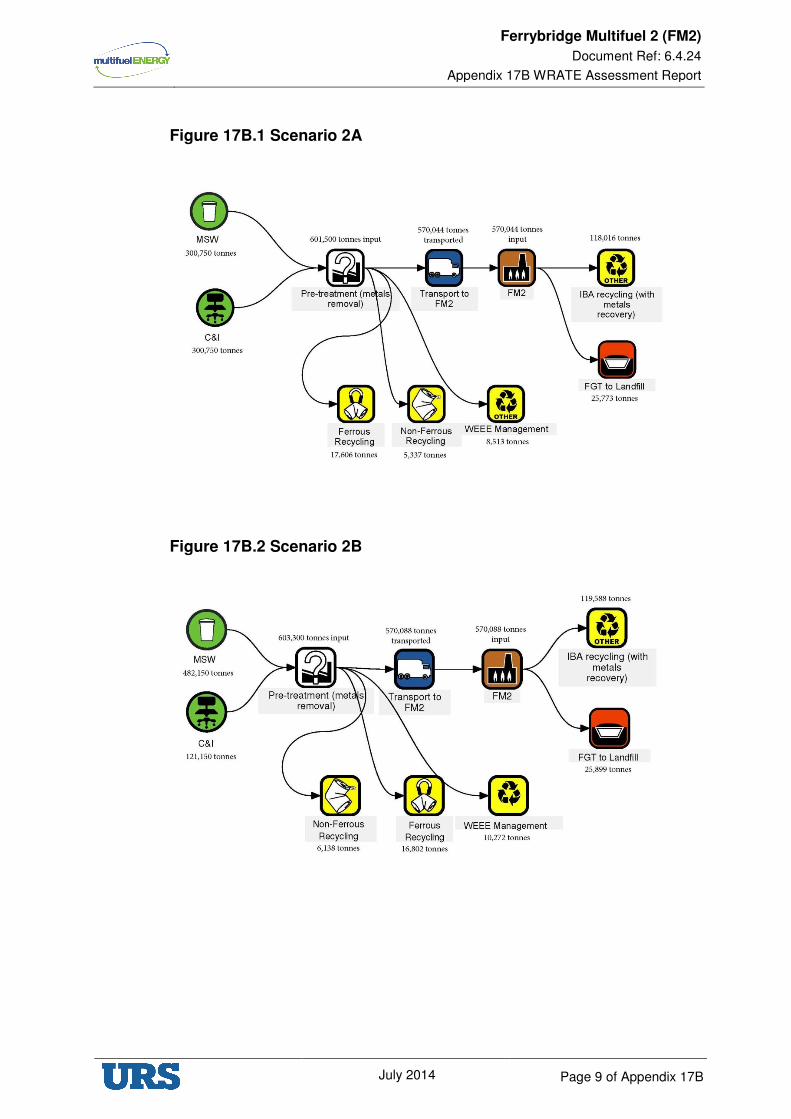
Figure 17B.1 Scenario 2A
Figure 17B.2 Scenario 2B
Ferrybridge Multifuel 2 (FM2)
Document Ref: 6.4.24
Appendix 17B WRATE Assessment Report
July 2014 Page 10 of Appendix 17B
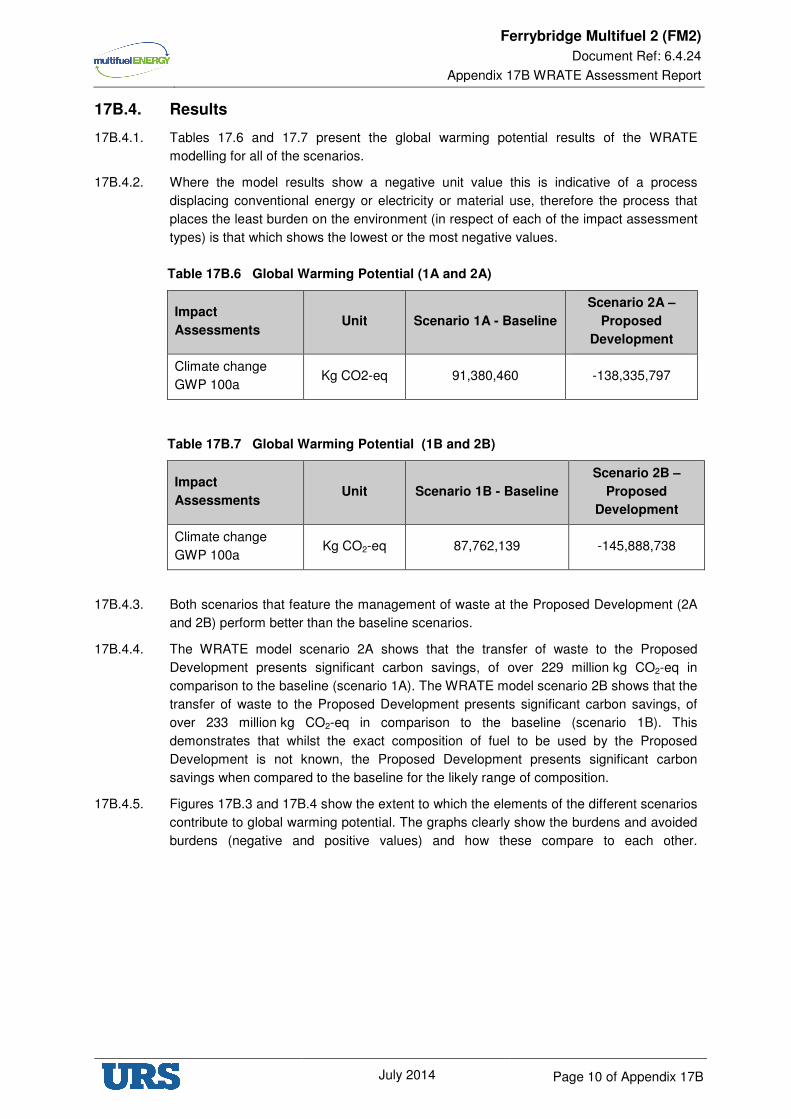
17B.4. Results
17B.4.1. Tables 17.6 and 17.7 present the global warming potential results of the WRATE
modelling for all of the scenarios.
17B.4.2. Where the model results show a negative unit value this is indicative of a process
displacing conventional energy or electricity or material use, therefore the process that
places the least burden on the environment (in respect of each of the impact assessment
types) is that which shows the lowest or the most negative values.
Table 17B.6 Global Warming Potential (1A and 2A)
Impact
Assessments Unit Scenario 1A - Baseline
Scenario 2A –
Proposed
Development
Climate change
GWP 100a Kg CO2-eq 91,380,460 -138,335,797
Table 17B.7 Global Warming Potential (1B and 2B)
Impact
Assessments Unit Scenario 1B - Baseline
Scenario 2B –
Proposed
Development
Climate change
GWP 100a Kg CO2-eq 87,762,139 -145,888,738
17B.4.3. Both scenarios that feature the management of waste at the Proposed Development (2A
and 2B) perform better than the baseline scenarios.
17B.4.4. The WRATE model scenario 2A shows that the transfer of waste to the Proposed
Development presents significant carbon savings, of over 229 million kg CO2-eq in
comparison to the baseline (scenario 1A). The WRATE model scenario 2B shows that the
transfer of waste to the Proposed Development presents significant carbon savings, of
over 233 million kg CO2-eq in comparison to the baseline (scenario 1B). This
demonstrates that whilst the exact composition of fuel to be used by the Proposed
Development is not known, the Proposed Development presents significant carbon
savings when compared to the baseline for the likely range of composition.
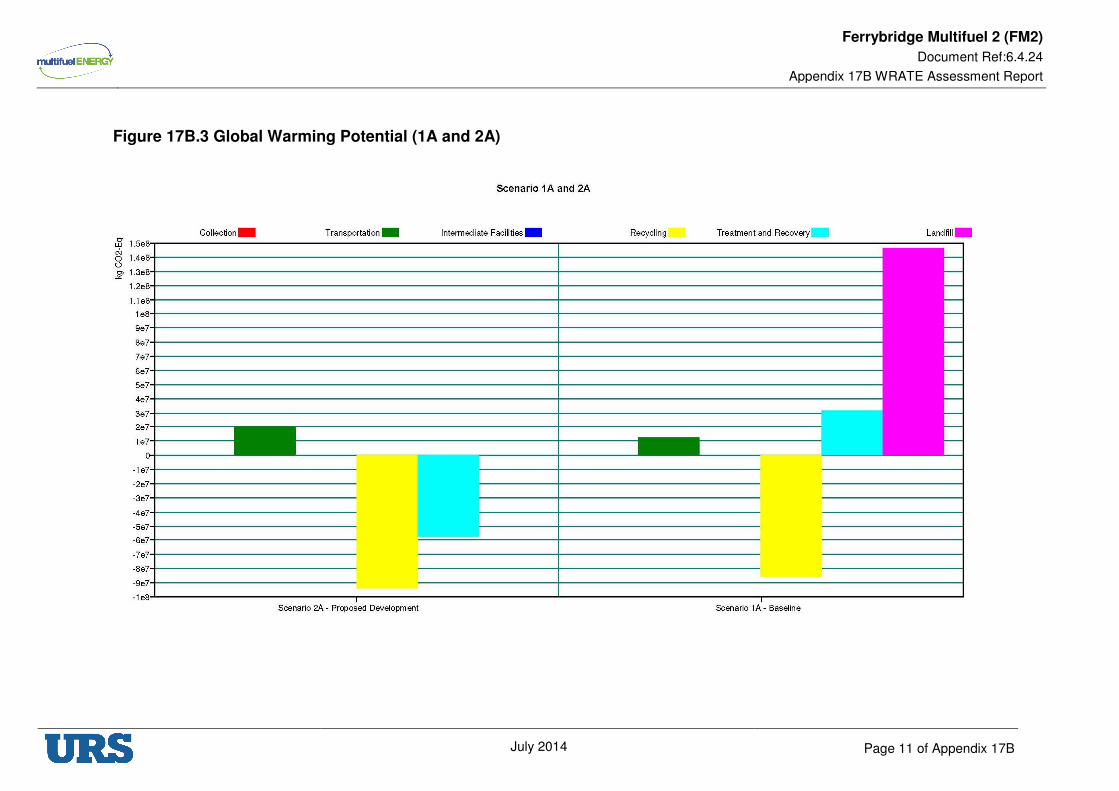
17B.4.5. Figures 17B.3 and 17B.4 show the extent to which the elements of the different scenarios
contribute to global warming potential. The graphs clearly show the burdens and avoided
burdens (negative and positive values) and how these compare to each other.
Ferrybridge Multifuel 2 (FM2)
Document Ref:6.4.24
Appendix 17B WRATE Assessment Report
July 2014 Page 11 of Appendix 17B
Figure 17B.3 Global Warming Potential (1A and 2A)
Ferrybridge Multifuel 2 (FM2)
Document Ref:6.4.24
Appendix 17B WRATE Assessment Report
July 2014 Page 12 of Appendix 17B
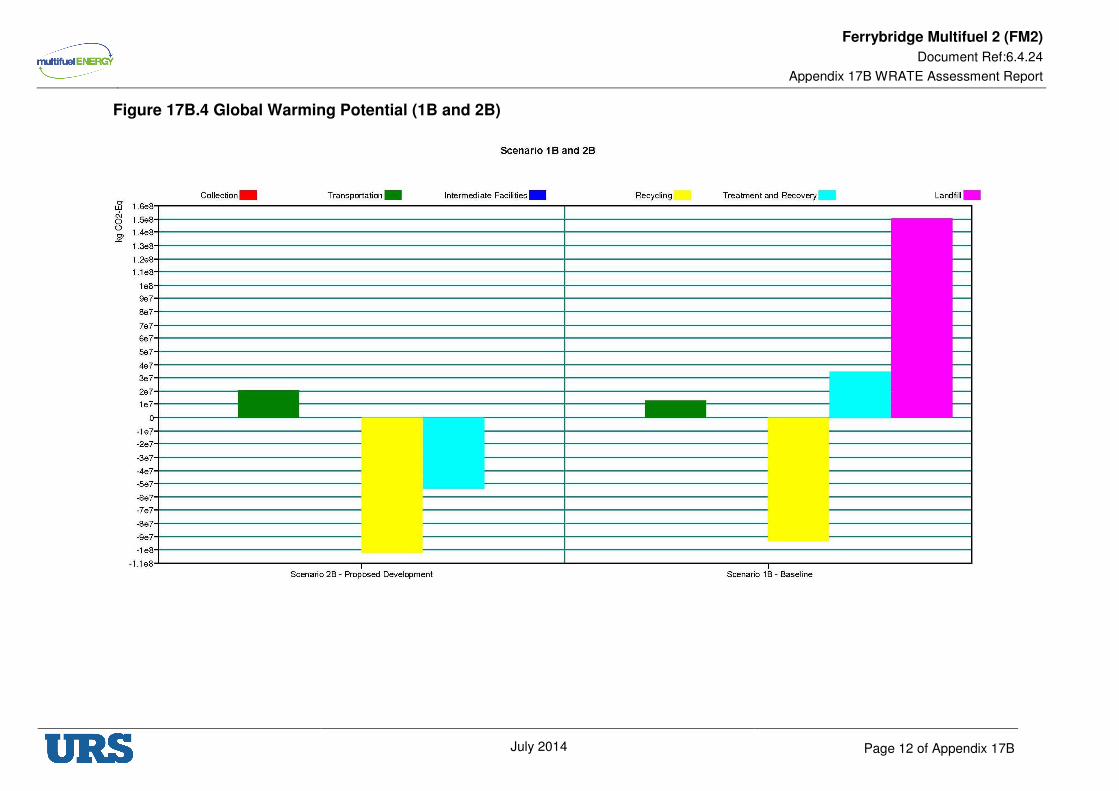
Figure 17B.4 Global Warming Potential (1B and 2B)
Ferrybridge Multifuel 2 (FM2)
Document Ref: 6.4.24
Appendix 17B WRATE Assessment Report
July 2014 Page 13 of Appendix 17B
17B.4.6. Figures 17B.3 and 17B.4 show that the major carbon impact is the landfilling of the waste
as modelled in the baseline scenarios 1A and 1B. The metals recycling in all of the
scenarios is the dominant beneficial element in terms of carbon impact (shown in yellow)
with the additional recycling of IBA from the Proposed Development increase this benefit
in scenarios 2A and 2B.
17B.4.7. The treatment and recovery process (shown in light blue) incorporates both the pre-
treatment process and the Proposed Development process impacts. It can be seen here
that in scenario 1A the impact of the pre-treatment process is a positive figure – most
likely to be predominantly related to the energy requirement of that process. In contrast
scenario 2A also includes this burden but this offset by the Proposed Developments
process which is a net producer of energy and which reduces carbon emissions by
displacing energy that would otherwise be generated in part from fossil fuels.
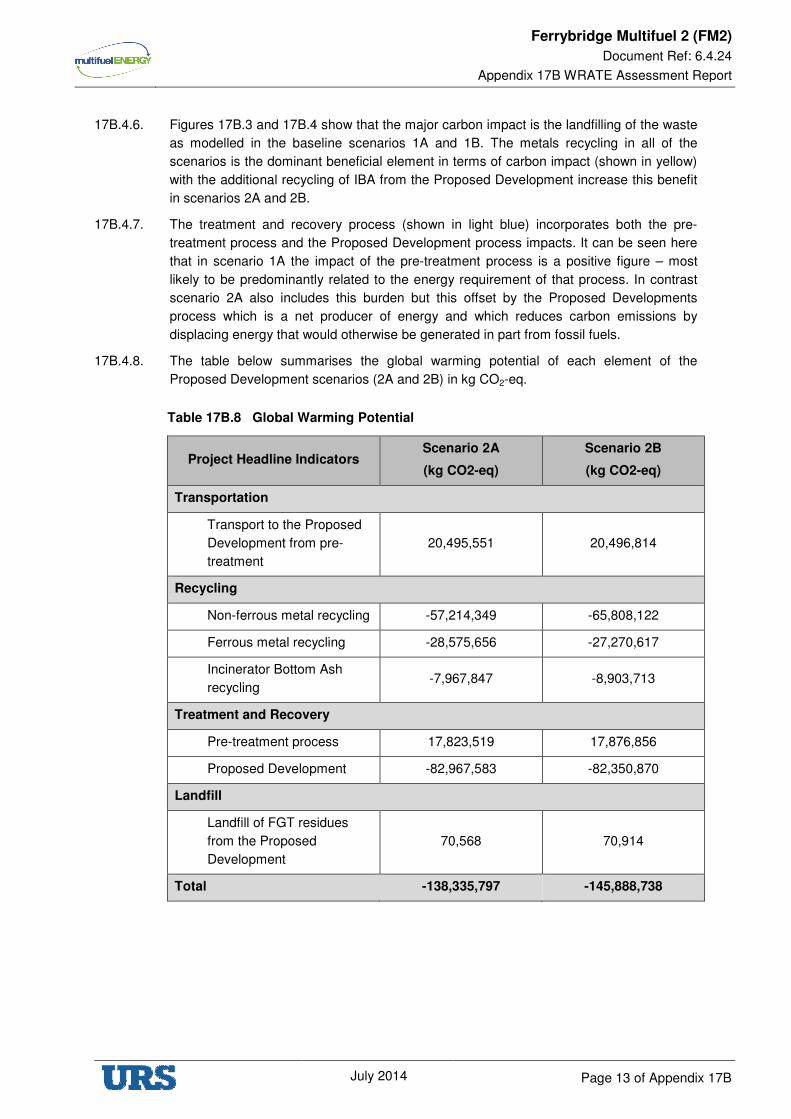
17B.4.8. The table below summarises the global warming potential of each element of the
Proposed Development scenarios (2A and 2B) in kg CO2-eq.
Table 17B.8 Global Warming Potential
Project Headline Indicators Scenario 2A
(kg CO2-eq)
Scenario 2B
(kg CO2-eq)
Transportation
Transport to the Proposed
Development from pre-
treatment
20,495,551 20,496,814
Recycling
Non-ferrous metal recycling -57,214,349 -65,808,122
Ferrous metal recycling -28,575,656 -27,270,617
Incinerator Bottom Ash
recycling -7,967,847 -8,903,713
Treatment and Recovery
Pre-treatment process 17,823,519 17,876,856
Proposed Development -82,967,583 -82,350,870
Landfill
Landfill of FGT residues
from the Proposed
Development
70,568 70,914
Total -138,335,797 -145,888,738
Ferrybridge Multifuel 2 (FM2)
Document Ref: 6.4.24
Appendix 17B WRATE Assessment Report
July 2014 Page 14 of Appendix 17B
17B.5. Model Analysis
17B.5.1. There are a number of unknowns associated with the feedstock for the Proposed
Development. Depending on the average NCV of the feedstock sourced the Proposed
Development will accept a range of tonnages, the highest throughput being 675,000 tpa
and the lowest throughput being 425,000 tpa.
17B.5.2. In order to provide a thorough assessment of the carbon impacts associated with the
Proposed Development, the highest and lowest tonnages have also been modelled for
comparison with the most likely throughput of 570,000 tpa. It should be noted that the
results presented in this section are as a result of changes made to the tonnage of WDF
being sent to the Proposed Development – no changes have been made to the WDF
composition, the pre-treatment process or any of the other associated processes. No
changes have been made to the baseline scenario (disposal to landfill) with the exception
of the total tonnage of waste being dealt with.
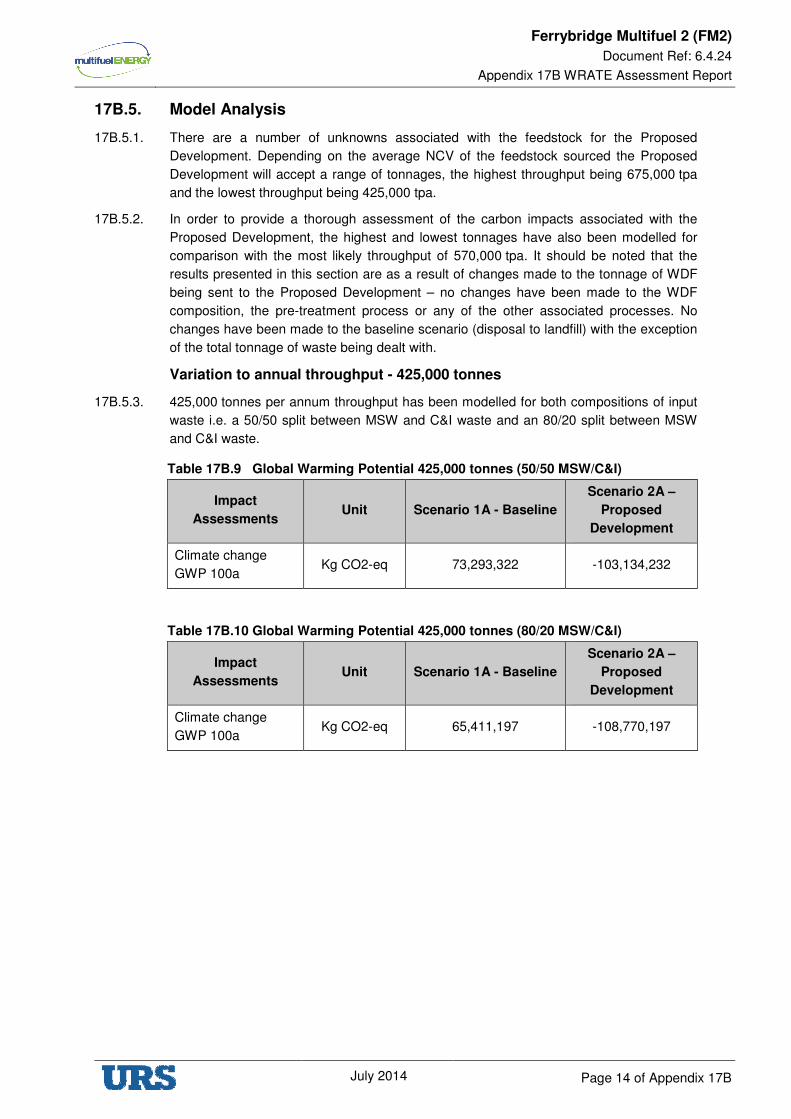
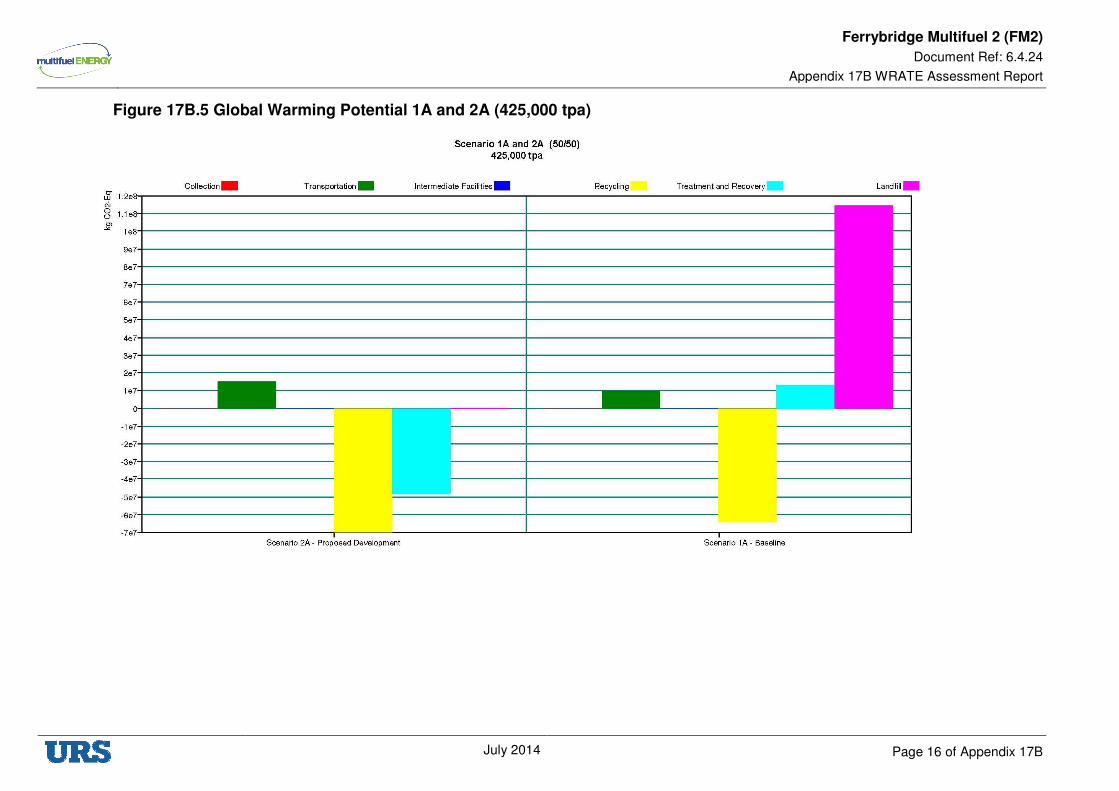
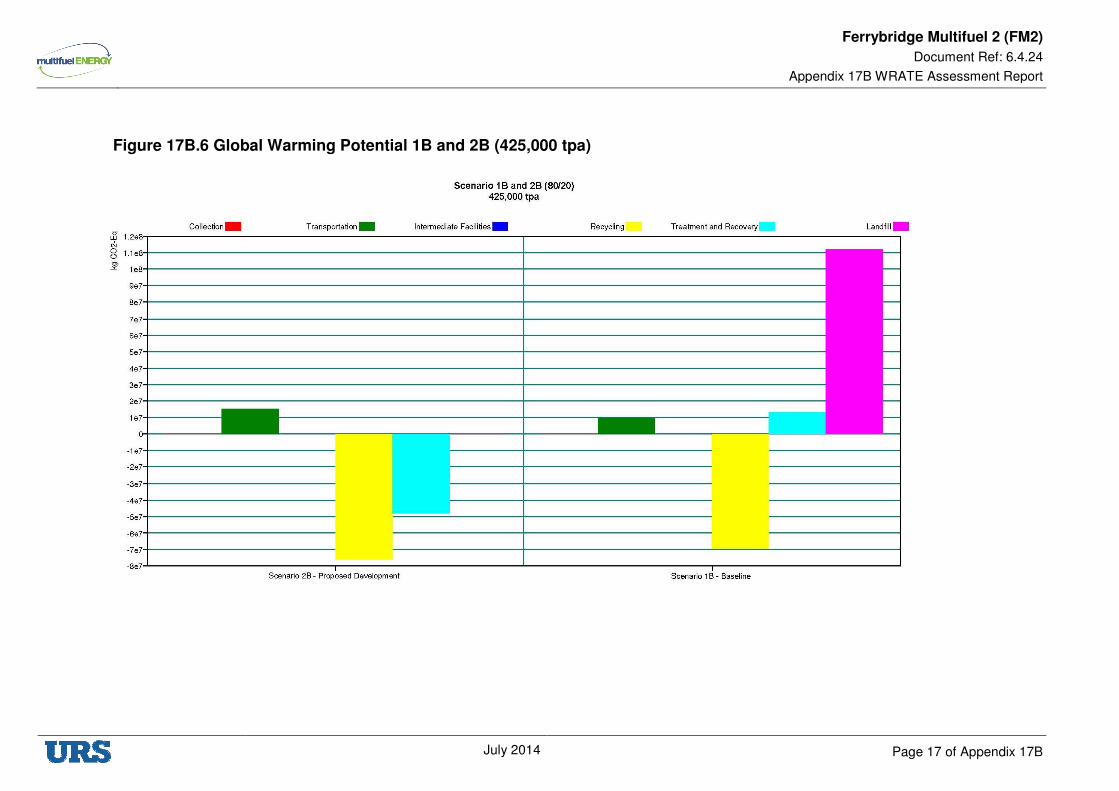
Variation to annual throughput - 425,000 tonnes
17B.5.3. 425,000 tonnes per annum throughput has been modelled for both compositions of input
waste i.e. a 50/50 split between MSW and C&I waste and an 80/20 split between MSW
and C&I waste.
Table 17B.9 Global Warming Potential 425,000 tonnes (50/50 MSW/C&I)
Impact
Assessments Unit Scenario 1A - Baseline
Scenario 2A –
Proposed
Development
Climate change
GWP 100a Kg CO2-eq 73,293,322 -103,134,232
Table 17B.10 Global Warming Potential 425,000 tonnes (80/20 MSW/C&I)
Impact
Assessments Unit Scenario 1A - Baseline
Scenario 2A –
Proposed
Development
Climate change
GWP 100a Kg CO2-eq 65,411,197 -108,770,197
Ferrybridge Multifuel 2 (FM2)
Document Ref: 6.4.24
Appendix 17B WRATE Assessment Report
July 2014 Page 15 of Appendix 17B
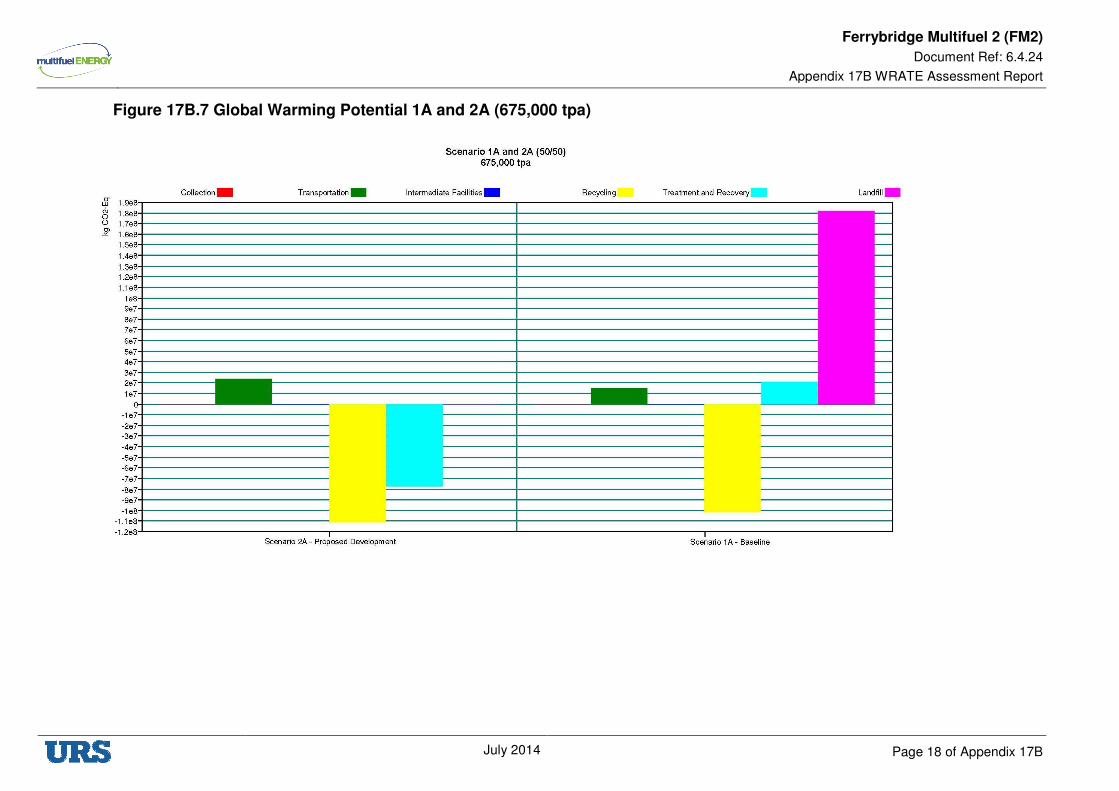
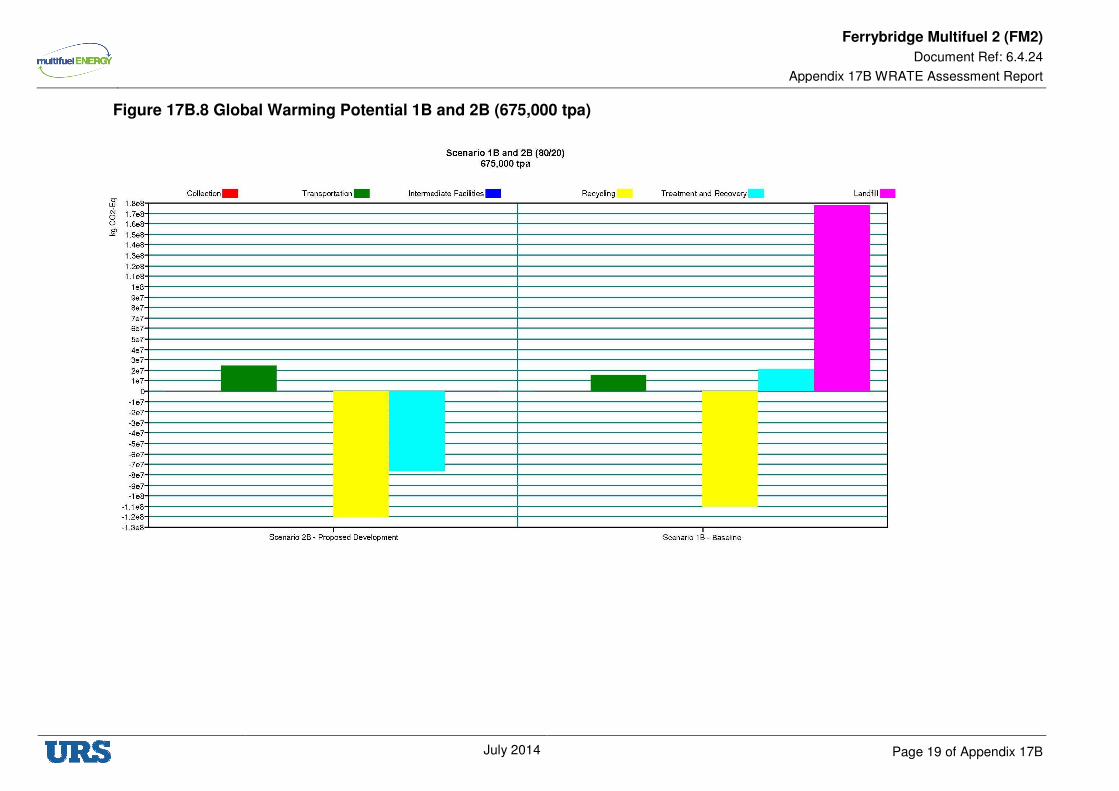
Variation to annual throughput - 675,000 tonnes
17B.5.4. 675,000 tonnes per annum throughput has been modelled for both compositions of input
waste i.e. a 50/50 split between MSW and C&I waste and an 80/20 split between MSW
and C&I waste.
Table 17B.11 Global Warming Potential 675,000 tonnes (50/50 MSW/C&I)
Impact
Assessments Unit Scenario 1A - Baseline
Scenario 2A –
Proposed
Development
Climate change
GWP 100a Kg CO2-eq 116,408,852 -163,804,311
Table 17B.12 Global Warming Potential 675,000 tonnes (80/20 MSW/C&I)
Impact
Assessments Unit Scenario 1A - Baseline
Scenario 2A –
Proposed
Development
Climate change
GWP 100a Kg CO2-eq 103,904,954 -172,739,989
17B.5.5. Figures 17B.5 – 17B.8 show the breakdown of the results for the varying tonnages and
waste compositions considered.
Ferrybridge Multifuel 2 (FM2)
Document Ref: 6.4.24
Appendix 17B WRATE Assessment Report
July 2014 Page 16 of Appendix 17B
Figure 17B.5 Global Warming Potential 1A and 2A (425,000 tpa)
Ferrybridge Multifuel 2 (FM2)
Document Ref: 6.4.24
Appendix 17B WRATE Assessment Report
July 2014 Page 17 of Appendix 17B
Figure 17B.6 Global Warming Potential 1B and 2B (425,000 tpa)
Ferrybridge Multifuel 2 (FM2)
Document Ref: 6.4.24
Appendix 17B WRATE Assessment Report
July 2014 Page 18 of Appendix 17B
Figure 17B.7 Global Warming Potential 1A and 2A (675,000 tpa)
Ferrybridge Multifuel 2 (FM2)
Document Ref: 6.4.24
Appendix 17B WRATE Assessment Report
July 2014 Page 19 of Appendix 17B
Figure 17B.8 Global Warming Potential 1B and 2B (675,000 tpa)
Ferrybridge Multifuel 2 (FM2)
Document Ref: 6.4.24
Appendix 17B WRATE Assessment Report
July 2014 Page 20 of Appendix 17B
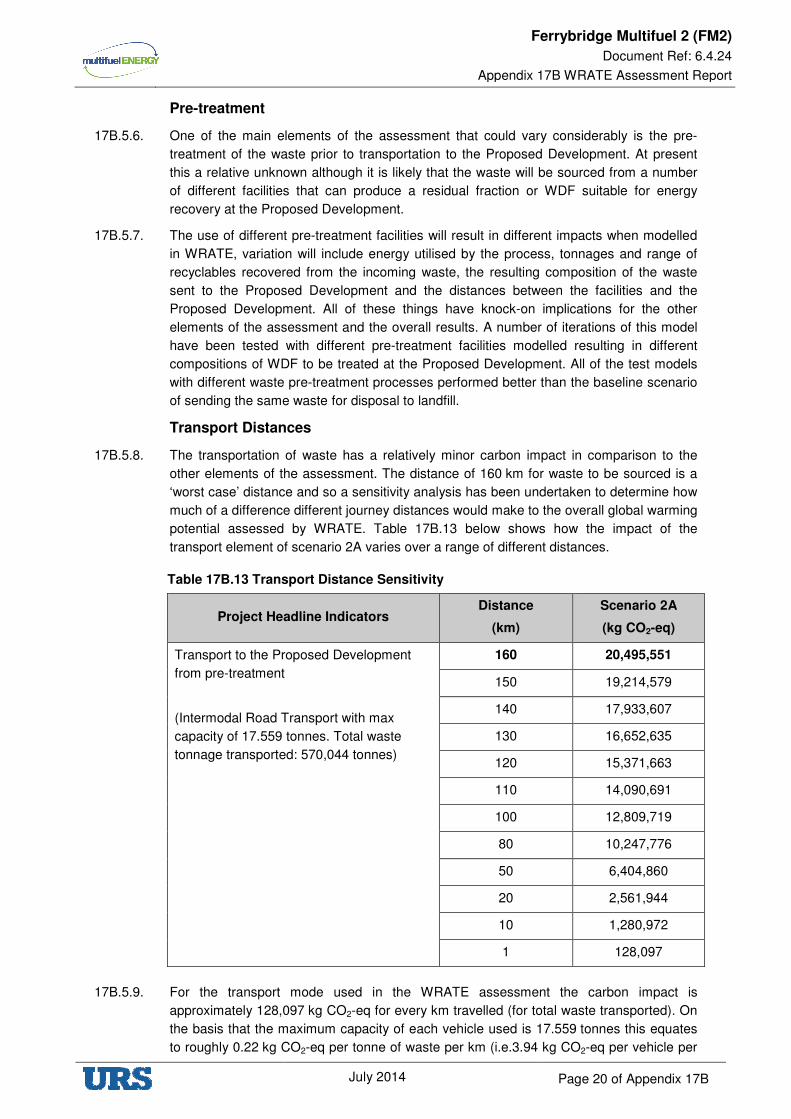
Pre-treatment
17B.5.6. One of the main elements of the assessment that could vary considerably is the pre-
treatment of the waste prior to transportation to the Proposed Development. At present
this a relative unknown although it is likely that the waste will be sourced from a number
of different facilities that can produce a residual fraction or WDF suitable for energy
recovery at the Proposed Development.
17B.5.7. The use of different pre-treatment facilities will result in different impacts when modelled
in WRATE, variation will include energy utilised by the process, tonnages and range of
recyclables recovered from the incoming waste, the resulting composition of the waste
sent to the Proposed Development and the distances between the facilities and the
Proposed Development. All of these things have knock-on implications for the other
elements of the assessment and the overall results. A number of iterations of this model
have been tested with different pre-treatment facilities modelled resulting in different
compositions of WDF to be treated at the Proposed Development. All of the test models
with different waste pre-treatment processes performed better than the baseline scenario
of sending the same waste for disposal to landfill.
Transport Distances
17B.5.8. The transportation of waste has a relatively minor carbon impact in comparison to the
other elements of the assessment. The distance of 160 km for waste to be sourced is a
‘worst case’ distance and so a sensitivity analysis has been undertaken to determine how
much of a difference different journey distances would make to the overall global warming
potential assessed by WRATE. Table 17B.13 below shows how the impact of the
transport element of scenario 2A varies over a range of different distances.
Table 17B.13 Transport Distance Sensitivity
Project Headline Indicators Distance
(km)
Scenario 2A
(kg CO2-eq)
Transport to the Proposed Development
from pre-treatment
(Intermodal Road Transport with max
capacity of 17.559 tonnes. Total waste
tonnage transported: 570,044 tonnes)
160 20,495,551
150 19,214,579
140 17,933,607
130 16,652,635
120 15,371,663
110 14,090,691
100 12,809,719
80 10,247,776
50 6,404,860
20 2,561,944
10 1,280,972
1 128,097
17B.5.9. For the transport mode used in the WRATE assessment the carbon impact is
approximately 128,097 kg CO2-eq for every km travelled (for total waste transported). On
the basis that the maximum capacity of each vehicle used is 17.559 tonnes this equates
to roughly 0.22 kg CO2-eq per tonne of waste per km (i.e.3.94 kg CO2-eq per vehicle per
Ferrybridge Multifuel 2 (FM2)
Document Ref: 6.4.24
Appendix 17B WRATE Assessment Report
July 2014 Page 21 of Appendix 17B
km). As previously mentioned, the overall impact assessed for the transport element of
the scenarios is likely to be greater in the models than in reality as the vehicles that will
be used to transport waste will have a greater capacity and so the number of vehicles
overall will be less.
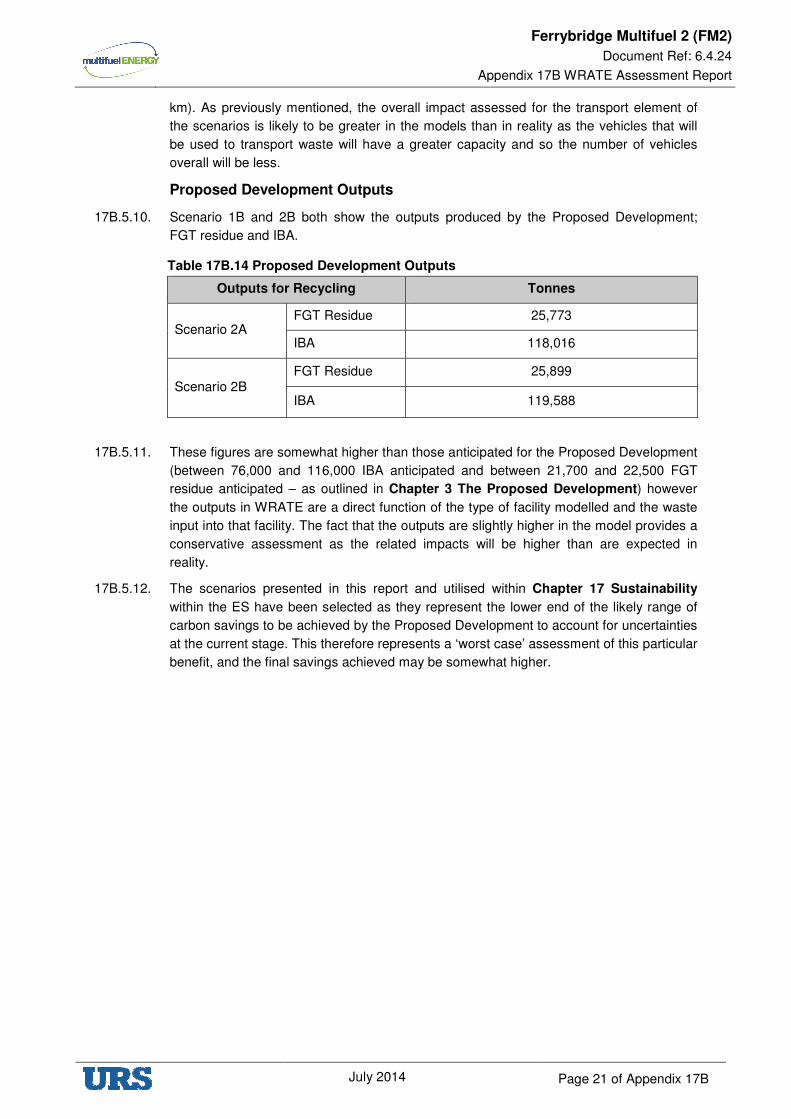
Proposed Development Outputs
17B.5.10. Scenario 1B and 2B both show the outputs produced by the Proposed Development;
FGT residue and IBA.
Table 17B.14 Proposed Development Outputs
Outputs for Recycling Tonnes
Scenario 2A FGT Residue 25,773
IBA 118,016
Scenario 2B FGT Residue 25,899
IBA 119,588
17B.5.11. These figures are somewhat higher than those anticipated for the Proposed Development
(between 76,000 and 116,000 IBA anticipated and between 21,700 and 22,500 FGT
residue anticipated – as outlined in Chapter 3 The Proposed Development) however
the outputs in WRATE are a direct function of the type of facility modelled and the waste
input into that facility. The fact that the outputs are slightly higher in the model provides a
conservative assessment as the related impacts will be higher than are expected in
reality.
17B.5.12. The scenarios presented in this report and utilised within Chapter 17 Sustainability
within the ES have been selected as they represent the lower end of the likely range of
carbon savings to be achieved by the Proposed Development to account for uncertainties
at the current stage. This therefore represents a ‘worst case’ assessment of this particular
benefit, and the final savings achieved may be somewhat higher.
Ferrybridge Multifuel 2 (FM2)
Document Ref: 6.4.24
Appendix 17B WRATE Assessment Report
July 2014 Page 22 of Appendix 17B
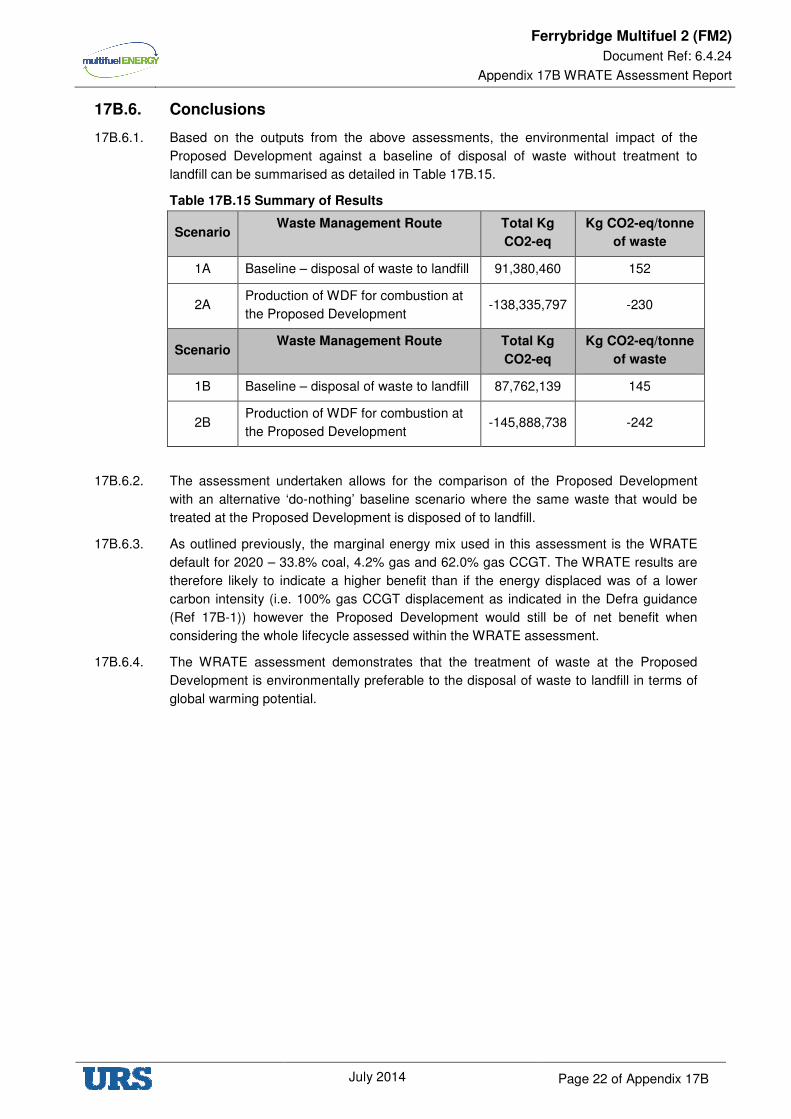
17B.6. Conclusions
17B.6.1. Based on the outputs from the above assessments, the environmental impact of the
Proposed Development against a baseline of disposal of waste without treatment to
landfill can be summarised as detailed in Table 17B.15.
Table 17B.15 Summary of Results
Scenario Waste Management Route Total Kg
CO2-eq
Kg CO2-eq/tonne
of waste
1A Baseline – disposal of waste to landfill 91,380,460 152
2A Production of WDF for combustion at
the Proposed Development -138,335,797 -230
Scenario Waste Management Route Total Kg
CO2-eq
Kg CO2-eq/tonne
of waste
1B Baseline – disposal of waste to landfill 87,762,139 145
2B Production of WDF for combustion at
the Proposed Development -145,888,738 -242
17B.6.2. The assessment undertaken allows for the comparison of the Proposed Development
with an alternative ‘do-nothing’ baseline scenario where the same waste that would be
treated at the Proposed Development is disposed of to landfill.
17B.6.3. As outlined previously, the marginal energy mix used in this assessment is the WRATE
default for 2020 – 33.8% coal, 4.2% gas and 62.0% gas CCGT. The WRATE results are
therefore likely to indicate a higher benefit than if the energy displaced was of a lower
carbon intensity (i.e. 100% gas CCGT displacement as indicated in the Defra guidance
(Ref 17B-1)) however the Proposed Development would still be of net benefit when
considering the whole lifecycle assessed within the WRATE assessment.
17B.6.4. The WRATE assessment demonstrates that the treatment of waste at the Proposed
Development is environmentally preferable to the disposal of waste to landfill in terms of
global warming potential.
Ferrybridge Multifuel 2 (FM2)
Document Ref: 6.4.24
Appendix 17B WRATE Assessment Report
July 2014 Page 23 of Appendix 17B
17B.7. References
Ref 17B-1 Energy from waste – A guide to the debate; Defra; February 2014 (revised
edition)
Ref 17B-1 2 Wales I&C Waste Analysis Study; Environment Agency; 2007