appendix 3 4 gucha migori river basin integrated flood
TRANSCRIPT

Appendix 3-4
Gucha Migori River Basin Integrated Flood Management
Plan

REPUBLIC OF KENYA PROJECT ON CAPACITY DEVELOPMENT
FOR EFFECTIVE FLOOD MANAGEMENT IN FLOOD PRONE AREA
GUCHA MIGORI RIVER BASIN INTEGRATED FLOOD MANAGEMENT PLAN
-ZERO DRAFT-
JULY 2014
WRMA and JICA


Project on Capacity Development for Gucha Migori River Basin Effective Flood Management in Flood Prone Area Integrated Flood Management Plan-Draft-
- i -
Republic of Kenya Project on Capacity Development for Effective Flood Management in Flood Prone Area
Gucha Migori River Basin Integrated Flood Management Plan
- Draft -
Table of Contents
POLICY OF RIVER BASIN FLOOD MANAGEMENT PLAN (DRAFT) ................. 4
Policy of Flood Management in the Relevant River Basin (Draft) ............................................. 4
The Role and Responsibility of WRMA ....................................................................................... 5
River Basin Committee ............................................................................................................... 6
Environmental and Social Considerationsons ............................................................................ 7
OUTLINE OF GUCHA MIGORI RIVER BASIN ..................................................... 8
Natural Conditions ..................................................................................................................... 9
1.1.1 Background .................................................................................................................... 9
1.1.2 Topography , Vegetation and Soil ............................................................................... 10
1.1.3 River Characteristics .................................................................................................. 15
1.1.4 Hydrology and Meteorology ........................................................................................ 35
1.1.5 Lower Gucha Migori River Basin Floods ................................................................... 39
Socio Economic Conditions........................................................................................................ 40
1.1.6 General Profile ............................................................................................................. 40
1.1.7 Administration ............................................................................................................ 40
1.1.8 Population .................................................................................................................... 43
1.1.4 Industrial, Agricultural Products and Commercial Activities .................................. 44
Development Plan ..................................................................................................................... 44
1.1.5 Vision 2030 ................................................................................................................... 44
1.1.6 County Development Plan (2013-2018) ..................................................................... 45
1.1.7 Lake Victoria Catchment Area Catchment Management Strategy (June 2009) .... 45
1.1.8 Bonyunyu Dam in the Upstream ............................................................................... 45
1.1.9 National irrigation Board (NIB) Irrigation Project ................................................... 45
ENVIRONMENTAL AND SOCIO-ECONOMIC CONDITIONS .............................................. 46
1.1.10 Environmental issues .................................................................................................. 47
1.1.11 Socio-economic issues .................................................................................................. 47

Gucha Migori River Basin Project on Capacity Development for Integrated Flood Management Plan-Draft- Effective Flood Management in Flood Prone Area
- ii -
ANALYSIS OF FLOOD CHARACTERISTICS ..................................................... 49
3.1 Overall Condition on Floods in the Gucha Migori River Basin ..................................... 49
3.1.1 Records of Flood Damages .......................................................................................... 49
3.1.2 Flood Condition Inquiring From Relevant Communities ......................................... 52
3.1.3 Existing Structures along the River ........................................................................... 57
3.2 FLOOD CHARACTERISTICS AND SITUATIONAL DAMAGES IN GUCHA MIGORI
RIVER BASIN ........................................................................................................................... 58
3.2.1 Concept of Flood Characteristics and Situation of Damages in the Gucha Migori
River Basin .................................................................................................................................. 58
3.2.2 Soil and sediment run off in upstream middle stream and downstream ................ 61
3.2.3 Flood Characteristics of Low-lying Area in the Lower Gucha Migori River Basin (B)
62
3.2.4 Flash flood from the neighbouring hills, overflow of small tributaries of R. Gucha
Migori and permanent and seasonal streams overflow(C)....................................................... 64
3.2.5 Flood Hazard Map in the downstream of Gucha Migori river basin ....................... 66
3.3 Analysis on Flood Damage and Countermeasure .......................................................... 66
3.3.1 Analysis on Flood Damage and Countermeasure for Earth and Soil Flown Out Area
in the Upstream of Gucha Migori River Basin ......................................................................... 66
3.3.2 Analysis on Flood Damage and Countermeasure in the Long-term Inundated Area
of the Downstream of Gucha Migori River ................................................................................ 67
3.4 Selection of Flood Damage to be Prevent Preferentially ............................................... 68
3.4.1 The Result of Workshop for Flood Damage Analysis by Community ....................... 68
3.4.2 Selection of Flood Damage to be prioritized .............................................................. 70
SELECTING PROCESS FOR POSSIBLE PROJECTS ...................................... 71
4.1 Evaluation on 5 Criteria ................................................................................................. 71
4.1.1 View Point of Evaluation ............................................................................................. 71
RECOMMENDATION .......................................................................................... 76
Figure 1.1 Counties wherein Gucha Migori River Basin lies ................................................................... 4
Figure 2.1 Records of Flood Damage in the Gucha Migori River Basin .................................................. 8
Figure 0.2 Gucha Migori River Basin Map as at 1976 ............................................................................. 9
Figure 2. 3 Gucha Migori River Basin Map ........................................................................................... 10
Figure 2. 4 Longitidunal Profile for Gucha Migori River ....................................................................... 13
Figure 2.1 Records of Flood Damage in the Gucha Migori River Basin .................................................. 8
Figure 2.1 Records of Flood Damage in the Gucha Migori River Basin .................................................. 8

Project on Capacity Development for Gucha Migori River Basin Effective Flood Management in Flood Prone Area Integrated Flood Management Plan-Draft-
- iii -
Figure 3.1.1 Records of Flood Damage in the Gucha Migori River Basin ............................................. 49
Figure 3.1.2 Location Map of Principal Community in Downstream Area.......................................... 54
Figure 3.2.1 Records of Flood Damage and Classification of Flood Characteristics in the
Gucha Migori River Basin ...................................................................................................................... 60
Figure 3.2.2 Mechanism of Flood Damage .......................................................................................... 61
Figure 3.2.3 Flood Characteristics in the Low-lying area of Lower Gucha Migori River ................... 63
Figure 3.2.4 Flood Characteristics near the Gucha Migori River’s Tributaries .................................... 64
Figure 3.3.1 Analysis on Problem Tree ................................................................................................ 66
Figure 3.3.2 Analysis on Objective Tree .............................................................................................. 67
Figure 3.3.3 Analysis on Problem Tree ................................................................................................ 67
Figure 3.3.4 Analysis on Objective Tree .............................................................................................. 67

Gucha Migori River Basin Project on Capacity Development for Integrated Flood Management Plan-Draft- Effective Flood Management in Flood Prone Area
- 4 -
POLICY OF RIVER BASIN FLOOD MANAGEMENT PLAN (DRAFT)
POLICY OF FLOOD MANAGEMENT IN THE RELEVANT RIVER BASIN (DRAFT)
The Gucha Migori river basin is a vast expansive river basin that consist of two river system i.e.
River Gucha system and R. Migori System. These two rivers merge at a confluence in Sango
area in Central Kadem Location in Nyatike district to become the wide R. Gucha Migori. The
river thereafter flows and pours its water in Lake Victoria. R. Gucha has its source in Nyamira
County in the Kisii highlands while R. Migori has its source in Narok County specifically in
Emuria Dikiri district.
Figure 0.1 Counties wherein Gucha Migori River Basin lies
The Gucha Migori river basin belongings to the jurisdiction of WRMA-LVSC Southern
Shoreline Sub Regional Office (SRO) concerning the general water resource management
flood management inclusive flood management. Then, LOGUMI WRUA, Ongoche WRUA
(Nyatike district), Nyangweta WRUA (Kenyenya district), Middile Gucha WRUA (Gucha
district), Nyarwaba WRUA (Nyamarambe district), Chirichiro WRUA (Masaba district),
Nyamache WRUA (Nyamache district), Kenyamware WRUA (Nyamira district) Upper Magor
WRUA (Emuria Dikiri district) are established within the Gucha Migori river basin. In the
flood plane of R. Gucha Migori there is the LOGUMI WRUA that is located within the Lower
Gucha Migori Sub-catchment and implements grass-roots water management in

Project on Capacity Development for Gucha Migori River Basin Effective Flood Management in Flood Prone Area Integrated Flood Management Plan-Draft-
- 5 -
collarroboration with WRMA.
The principal flood damages are destruction of houses, enforcement of longterm evacuation,
heavy losses of crops in the farmlands, contamination of water resources by polluted water
diffusion, growing worse sanitary conditions and impassable roads and longer period of flood
waater inundation of the villages within the flood prone areas etc.
The reason why floods occur is a result of heavy rains in the upstream that leads to heavy
surface run-off water to flow into both R. Gucha and R. Migori systems. The surface run-off
water erodes soil as it flows into the river leading to heavy sedimentation of the river channel
as the water flows downstream. The heavy sediments are deposited downstream leading to
shallow river channel in the downstream and with heavy and at a high spead river flows
downstream the water overflows its banks leading to floods. On the other hand the flood plain
area also experience flash floods from the neighbouring hills within the Lower Gucha Migori
Sub-catchment. The flash floods lead to damage of houses and losses of properties, crops and
livestock. The measures against floods will be important because the numbers of affected by
floods with flood inundation of more than two months are more than three thousand (3000)
every year.
Therefore the important point of the flood management policy in relevant river basin shall be
mitigation against the impacts of flood damage which include disruption of the daily livelihood
and lack of a hospitable and safe evacuation place moreover enlightment schemes that will
make it easier,quicker and faster life-skills in recovery from the flood damages.
In the course of drawing up the flood management plan, the appropriate combination of
structural and non-structural measures or the view point of “Self-help”, “Mutual support” and
“Public assistance” should be considered. And also consensus building among the stakeholders
through the participation of WRUA or communities should be implemented
WRUA and communities implement the distribution, evolution, maintenance of structural
measures and non-structural measures with initiative.
WRUA and communities shall work together from the period of project planning so that
incubate their ownership
The scoping period of this plan is 5 years from 2013 to 2018, the contents of plan will be
revised properly in necessity.
THE ROLE AND RESPONSIBILITY OF WRMA
Main constituent of this plan is WRMA. WRMA should assist WRUA to make it possible for it
to build realizable tasks in to the Sub-Catchment Management Plan (SCMP) by itself. In
addition, WRMA provide the technical assistance to implement the countermeasures against
flooding matters.

Gucha Migori River Basin Project on Capacity Development for Integrated Flood Management Plan-Draft- Effective Flood Management in Flood Prone Area
- 6 -
Concerning the tasks that WRUA has no initiative, WRMA shall precede the implementation
of tasks while coordinating it with relevant stakeholders.
RIVER BASIN COMMITTEE
Flood management cannot achieve the objectives without the cooperation of various
stakeholders within the river basin.
Some river basins are divided by plural sub catchment such as upper stream, lower stream, left
bank and right bank.
According to this condition, WRMA shall establish “Integrated Flood Management River
Basin Committee” in order to share the information concerning flood management and
coordinate in river basin unit.
The stakeholders in the relevant river basin preferable to participate in the committee are listed
below.
Table 1 The Stakeholders in Gucha Migori River Basin
No Organization Remarks
1 WRUAs within Gucha Migori River Basin
One representative from each of the nine
WRUAs
2 Provincial Administration District Commissioner, Nyatike district
3 Ministry of State for Special Programmes
Active in providing humanitarian assistance to
disaster victims in Lower Gucha Migori area
4 CFMOs within LOGUMI SC One representative from each CFMO
5 Ministry of Water and Irrigation Migori County Director for Water
6 Heads of Evacuation Places (Nyora and Kabuto Primary
Schools)
One representatives from the two schools that act
as evacuation places
7 Ministry of Agriculture
Nyamira County Director and District Agricultural
Officer Nyatike
8 Ministry of Forestry Narok County Director
9 Ministry Of Education District Education Officer Nyatike
10 Kenya Meteorological Department Contact Person at National Level
11 Lake Basin Development Authority (LBDA) Representative from Kerian Sub-regional Office
12 National Environmental Management Authority Migori County Director
13 Blue Cross One representative
14 Kenya Red Cross Representative from Migori Branch
15 World Vision Representative from Regional Office
16 CAAC CAAC member
17 Fishermen One representative
18 Farmers One representative
19 Environment/Natural Resources Management CBOs Environment representative
20 Religious Group
One each from downstream, midstream and
upstream
21 Kenya Forest Service CAAC member
22 Department of Social Services Registers WRUAs and other social welfare groups
22 Kenya National Chamber of Commerce and Industry Gucha Migori chapter
23 Catholic Diocese of Gucha Migori One representative
24 WRMA HQ, RO, SRO
In the committee, exchanging of opinions between the relevant stakeholders, approval of flood
management plan, consensus building, discussion of role sharing and activity evaluation etc.
shall be done
Committee members shall be discussing about the following themes once in every some

Project on Capacity Development for Gucha Migori River Basin Effective Flood Management in Flood Prone Area Integrated Flood Management Plan-Draft-
- 7 -
months for the time being.
Tabel 1 The Schedule of Integrated Flood Management Committee Meeting(Draft)
Discussion Themes Remarks
1st
Meeting
Information sharing on current situation and problems in flooding
Discussion on conceivable flood measures
Held on 18th
Dec.
2013
2nd
Meeting Cause & Effect of floods in Gucha Migori
Held on 27th
Feb.
2014
3rd
Meeting Draft IFMP and building consensus on the draft IFMP Tentative date
10th
April 2014
4th
Meeting Methods of incorporating the IFMP into the SCMP, CMS,
county government strategic plans Tentative date
22nd
May 2014
5th
Meeting Prioritization of countermeasures and identifying avenues for
funding the implementation Tentative date
26th
June 2014
ENVIRONMENTAL AND SOCIAL CONSIDERATIONSONS
On planning the flood measures project, the appropriate environmental and social
consideration shall be done based on Kenyan regal code “Environmental Management and
Coordination Act (EMCA) 1999”.

Gucha Migori River Basin Project on Capacity Development for Integrated Flood Management Plan-Draft- Effective Flood Management in Flood Prone Area
- 8 -
OUTLINE OF GUCHA MIGORI RIVER BASIN
Gucha Migori River Basin is located at the northern part of the piedmont of Mt. Kenya in the central
part of the Republic of Kenya.
Figure 0.1 Records of Flood Damage in the Gucha Migori River Basin
Gucha Migori River Basin is located at the north ern part of the piedmont of Mt. Kenya in the central
part of the Republic of Kenya.

Project on Capacity Development for Gucha Migori River Basin Effective Flood Management in Flood Prone Area Integrated Flood Management Plan-Draft-
- 9 -
Natural Conditions
1.1.1 Background
Wikipedei the Free Encyclopedia explains concerning R. Gucha as follows: Gucha River,
referred to River Kuja by Luo community starts from the highlands of Kiabonyoru in Nyamira
county passing through the heart of Gucha District running west through Migori Town where
its Joined by other smaller rivers then into Lake Victoria. Streams, as it runs across the Gusii
Land come together and one of them being Mogonga River, known by every Kisii of its deadly
effects it leaves behind when it floods. Mogonga and Gucha are almost equal in size and they
meet just 1 mile before entering into Ogembo Town Center.
It further explains concerning Migori town as follows: Its elevation is roughly 1500 meters
above sea level (asl.) at Kakrao descending by 100 m asl. into the Migori river. The different
peaks near the town are a little over 1550 m asl.
The graphic description of the Gucha Migori based on a study carried out in 1976 is as
indicated in the figure 2.2 below:
Figure 0.2 Gucha Migori River Basin Map as at 1976
Sour
ce: P
relim
inar
y R
epor
t No.
14
Agr
icul
tura
l Uni
vers
ity W
agen
inge
n N
ethe
rland
s
Trai
ning
Pro
ject
in P
edol
ogy
Kis
ii, K
enya

Gucha Migori River Basin Project on Capacity Development for Integrated Flood Management Plan-Draft- Effective Flood Management in Flood Prone Area
- 10 -
1.1.2 Topography , Vegetation and Soil
(1) Topography, Geology and Vegetation Gucha-Migori River Basin cuts across five counties i.e. Nyamira County, Kisii County, Narok
County, Homa Bay County and Migori County. The Gucha-Migori River Basin is therefore
located on the south-western corner of the Lake Victoria Basin in western Kenya. The R.
Gucha has its source in the of Nyamira county, which rise up to nearly 3,000 m.amsl at
Kiabonyoro peak GPS location Altitude1653M South 00034’07.6” East 034058’50.3”.
The Migori River has its source in Chepalungu forest, at altitudes of around 2,000 m.amsl, and
drains a large area west of the Sirian Escarpment which shields the Maasai Mara to the east.
The two rivers together have a catchment area which spans over 6,900 km² in Nyamira, Kisii,
Migori and a section in the western-most Narok counties. At the confluence of R. Gucha and
R. Migori near Macalder Mines, about 30 km from their mouth on Lake Victoria the mean
annual runoffs (MAR) of the Gucha and Migori rivers are estimated at 1,083 and 609
Mm3/year respectively. At the outflow to Lake Victoria the MAR is estimated at 1,884
Mm3/year. Figure 1.2.1
Figure 0.3 Gucha Migori River Basin Map
Source: Identification of Multipurpose Water Resources Development Project in Gucha Migori River Basin In Kenya: Final Strategy Report
1 Identification of Multipurpose Water Resources Development Project in Gucha Migori River Basin in Kenya: Final Strategy Report
Catchment Area=6900 sq km
L. V
icto
ria

Project on Capacity Development for Gucha Migori River Basin Effective Flood Management in Flood Prone Area Integrated Flood Management Plan-Draft-
- 11 -
The geology of the Gucha catchment consists mainly of old Bukoban system rocks which are
of Palaeozoic age. Those within the catchment are represented by the Kisii series. A narrow
belt of Precambrian and Kavirondian systems of rock occur in the lower western parts of the
catchment. The Bukoban system consists of a broad north-south belt of acidic volcanics with
a narrow belt of quartzite and escarpments. On the far western andsoutheastern parts of the
catchment is found a quartzitic belt which is sandwiched by a broad belt of basalt. Kisii
soapstones within the central parts of of the catchment are derived from the basalt by
hydrothermal activity. Post-Kavirondian conglomerates, grits and sandstones are predominant
in some parts of the catchment such as Wanjare-South Mugirango. Most of the western parts
lie within the rhyolite and tuff belt. Western parts that border the South Nyanza district are
predominantly covered by porphyritic and non-porphyritic felsite and andésite.
The Gucha River rises from an elevation of 1500M at its confluence with Gucha-Migori to
1800M in the Kisii uplands which in some parts rise up to an altitude of 3000M. The main
watershed of the Gucha River occurs within the Kisii uplands which are above the
sub-Miocene erosion surface (Pulfrey, 1960).2
To understand the slope in the river basin, the basin has been divided into three slope units as
follows: a) upstream slope unit, mistream slope unit and downstream slope units. These slope
units have different slope gradient and slope form depending on the location. The slope
gradient is in percentage (%) while the slope form is the profile curvecature. The slope
gradient in Gucha Migori varies from 0-5% to 5%-10% in the downstream with slope form of
concave, 10-15% to 20-25% in the midstream with slope form of convex but irregular and 25%
to over 40% in the upstream with slope form of convex in most parts.
Land use characteristics of Gucha Migori River Basin are shown on Figure 0.4. In the
upstream areas there are extensive agricultural activities. The land in the upstream is arable
leading to deforestation. In Kisii highlands the population is huge compared to the available
land. In the upstream especially in the Kisii highlands Eucalyptus trees have been extensively
been planted. There is heavy brick-making in Nyamira district due to the nature of the soil in
the area. In Transmara there has been a shift from livestock keeping to commercial agriculture
that has led to heavy deforestation. Most of the forests in Transmara are owned by individuals
who engage in charcoal production. The forest cover in Transmara district is mainly
indigeneous trees. In the midstream of Gucha Migori River Basin, the land is arable and
there is heavy investment in sugarcane and tobacco farming. In the midstream the trees are
conserved in the hilltops. In the downstream the land is fertile and arable but the climate is
semi-arid and vegetation cover is mainly savanna grasslands.
2) Soil Erosion in Gucha Migori River Basin
Soil erosion is a serious problem in the Gucha catchment, bank and channel erosion are partly
2 Impact of hydrological and land use processes on the quality of water in the Gucha catchment, southwestern Kenya

Gucha Migori River Basin Project on Capacity Development for Integrated Flood Management Plan-Draft- Effective Flood Management in Flood Prone Area
- 12 -
responsible for the sediments transported by the river. In addition cultivation in areas adjacent
the river also contributes to the observed sediment transport rates. Other factors in sediment
production are untarmacked and feeder access roads (Omari, 1986). The average suspended
sediment concentration is 325.5 ppm while the total sediment transport rate is 0.4 x 10⁶ t
year"1 (Ongwenyi, 1979).3
The following figures indicate:
i) The Longitudinal Profile for the R. Gucha Migori is as indicated in the Figure 2.3
ii) Landuse map in the river basin is indicated in Figure 2.4.
3 Impact of hydrological and land use processes on the quality of water in the Gucha catchment, southwestern Kenya

Figure 0.4 Longitidunal Profile for Gucha M
igori River
Source: Preliminary Report No. 14 Agricultural University Wageningen Netherlands Training Project in Pedology
Kisii, Kenya U
pstream
Midstream
Dow
nstream
Project on Capacity Development for Gucha Migori River Basin Effective Flood Management in Flood Prone Area Integrated Flood Management Plan-Draft-
- 13-

Project on Capacity Development for Gucha Migori River Basin Effective Flood Management in Flood Prone Area Integrated Flood Management Plan-Draft-
- 13 -
Figure 0.5 Distribution Map of Topographic Slope of Gucha Migori River Basin

Gucha Migori River Basin Project on Capacity Development for Integrated Flood Management Plan-Draft- Effective Flood Management in Flood Prone Area
14
(2) Soil
Soil Distribution Map of Gucha Migori River Basin is as per Figure 2.5. The upstream of
Gucha system consist of the fertile reddish volcanic loamy soils that cover most parts of Kisii
and Nyamira highlands. The upstream of Migori system consist of fertile alluvial grayish clay
soil. The midstream area is mainly covered by fertile grayish clay soil and some areas area
sandy. The downstream is covered by grayish clay soil in some parts, while other parts are
covered by black cotton soil and near the river it is characterized by clay soil and sandy soil.
Figure 0.6 Soil Distribution Map (Soil texture)
Upstream Migori system: Greyish Alluvial soil
Midstream: Greyish Clay and sandy soil
Downstream: Greyish Clay, black cotton soil and sandy soil
Upstream Gucha system:
Reddish volcanic loamy soil

Project on Capacity Development for Gucha Migori River Basin Effective Flood Management in Flood Prone Area Integrated Flood Management Plan-Draft-
- 15 -
1.1.3 River Characteristics
(1) Riverbed Materials
The R. Gucha Migori is a river that forms after two big rivers join together to drain its water
into Lake Victoria. It is wide with some places like Sango having a width of approximately one
hundred and twenty metres (120M). It is imperative therefore to highlight the river bed
materials from the source to the Lake. The table 2.1 below therefore indicate the riverbed
materials for both R. Gucha and R. Migoriand R. Gucha Migori after the confluence.
Table 2.1 Location and Riverbed Materials in R. Gucha Migori
SN Place River Name and
features Riverbed Material
1 Getengerine in Kiabonyoru,
Nyamira District (This area is where
the source of R. Gucha is located) R.Gucha (at the source) Pebbles and water is very clean
2 Magombo in Kenyerere in Nyamira
District R. Gucha Rocks and water is very clean
3 Rigwero in Nyamira District R. Kanyamware a tributary
of R. Gucha Rocky riverbed, water not clean and
cattle treads noted on the riverbanks
4 Gekano-Kanyamwere boundary.
(There is a confluence of R. Gekano;
R. Kanyamware and R. Gucha)
Confluence of R. Gekano
and R. Kanyamware all
joining into R. Gucha
Pebbles, soil sediments riverbed, water
is brown in colour and riverbank
erosion noted
5 Kianwarimu-Gekano bridge R. Gucha Pebbles, soil sediments riverbed, water
is brown in colour and riverbank
erosion noted
6 Gekano area in Nyamira district R. Gucha Soil sediment with few pebbles
riverbed, water is brown in colour and
the riverbank erosion is pronounced
7
Esani bridge in Esani area boundary
of Manga and Boribari District. The
place experiences floods during rainy
season
R. Gucha Soil sediment (sandy) and pebbles
riverbed, water is brown in colour and
the riverbank erosion is pronounced
8 Kegati Water plant in Kisii Town
(Water suppy plant for Kisii) R. Gucha
Rocky and soil sedimentation riverbed
and water is brown in colour after the
intake
9 Ogembo Bridge in Gucha District R. Gucha Rocky and soil sedimentation riverbed
and water is not clean
10 Sare Bridge in Awendo Town R. Sare a tributary of R.
Gucha
Rocky and sandy riverbed; overgrown
vegetation on some parts of the river
channel water is brown in colour
11 Oyani Bridge in Awendo town R. Oyani a tributary of R.
Gucha
Rocky and sandy riverbed; run-off
surface water from surrounding hill
flow into river channel and water in the
river is brown in colour
12 Gogo Kengen, Nyatike District. (A
hydroelectric generation planted
established during colonial era) R. Gucha Rocky and sandy riverbed
13 Daraja Aego, Nyatike District R. Gucha Rocky and sandy riverbed and wooden
logs in the river channel

Gucha Migori River Basin Project on Capacity Development for Integrated Flood Management Plan-Draft- Effective Flood Management in Flood Prone Area
16
14 Sango area in Nyatike district. (This
is where the confluence of R. Gucha
and R. Migori is located) R. Gucha Migori
Rocky and sandy riverbed; Sediment
deposits that has led to gold mining
when the water levels of the river
reduces
15 Wath Onger (This is Lower Gucha
Migori Area) R. Gucha Migori
Rocky and sandy riverbed and wooden
logs in the river channel
16 Onyinjo Area R. Onyinjo a seasonal river
that flows into R. Gucha
Rocky riverbed with overgrown
vegetation in some parts of the river
channels
17 Mirogi R. Mirogi that flows into R.
Gucha Rocky riverbed water is dirty and in
some places the water seems stagnant
18 Oljoposei Area in Transmara District R. Oljoposei draining into
R. Migori Rocky and pebble riverbed and the river
channel is narrow
19 Kaposorwa in Transmara District R. Moiguiet Soil sedimentation riverbed, narrow
channel and watering point for
livestock
20 Kapng’eno area in Transmara District
(this is where the confluence of R.
Moiguiet and R. Migori is located)
R. Moiguiet joining R.
Migori
Confluence of two rivers and velocity
of both rivers is high, natural
indigenous trees noticeable and soil
sedimentation riverbed
21 Magor bridge in Transmara East
district R. Migori
Soil sedimentation riverbed, water
levels low during dry season and very
high during rainy season
22 Esoit-Naibor area R. Migori Rocky riverbed and wooden logs
noticeable in the river channel
23 Mikei area in Nyatike District R. Migori Rocky and sandy riverbed and
community people use different points
for gold ore washing
24 Enoosaen area in Keyian division
Transmara District R. Enoosaen a tributary of
R. Migori
Rocky and sandy materials. Lots of car
washing activities within the river
channel
25 Enoosaen area in Keyian division
Transmara District R. Enoosaen a tributary of
R. Migori Pebbles and sand alluvial materials
26 ASTU, Indiyano Sub-location
Transmara District R. Remo a tributary of R.
Migori Rocky, pebbles and sand alluvial
materials.
27 Ndiri area Transmara District R. Ndiri a seasonal river
and tributary of R. Migori
Rocky, pebbles and alluvial soil
sediments materials. Water at some
points the flow is very slow almost
stagnant
28 Transmara-Kuria boundary bridge R. Migori Rocky and sand alluvial materials.
29 Nyeikute village, Komanga
Sub-location in Kuria-Kihancha
District
R. Nyogoto a tributary of R.
Migori Rocky and sand alluvial materials.
30 Daraja ya Masaba area boundary of
Nthiange and Masaba sub-locations
in Kuria District
R. Bungenech a tributary of
R. Migori Rocky and sand alluvial materials.
31
Hibwa Area in Kuria District. (This is
where a conluence of R. Bosara and
R. Nyandara is and thus forming R.
Hibwaa)
R. Hibwaa a tributary of R.
Migori and starts at the
confluence of R. Bosara and
R. Nyandara (both sources
are in Tanzania)
Rocky, pebbles and sand alluvial
materials.
32 Ragane Area near the boundary of
Kuria and Migori districts R. Ragena a tributary of R.
Migori Rocky and pebbles materials.

Project on Capacity Development for Gucha Migori River Basin Effective Flood Management in Flood Prone Area Integrated Flood Management Plan-Draft-
- 17 -
33 Migori Bridge in Migori Town R. Migori Rocky and sand alluvial materials.
34 Nyasare Estate in Migori town R. Nyasare a tributary of R.
Migori Rocky, pebbles and sand alluvial
materials.
35 R. Migori at Nyasare area in Migori
town R. Migori Rocky and sand alluvial materials.
36 Nyamure in Magina area in Migori
town
R. Nyagugo also known as
R. Nyamure about 100M to
R. Migori
Rocky, pebbles and sand alluvial
materials.
37 Kakrao area R. Nyasarara that drains
into R. Migori Rocky, pebbles and sand alluvial
materials and is crystal in colour.
38 Othatcho location near othatcho hills R. Othatcho (spring) that
drains into R. Migori Pebbles and soil sediment materials and
is crystal clear
39 Eko area, Ajego Sub-location,
Othatcho location R. Eko a tributary of R.
Migori Rocky and soil sediment materials
40 Nyarogi Sub-location, Othatcho
location R. Nyakonya a tributary of
R. Migori Rocky and soil sediment materials
41 Kadem south - Othatcho locations
boundary
R. Owich a seasonal river
and a tributary of R.
Migori Rocky and soil sediment materials
42
Mikei area in Nyatike District here
after the R. Migori moves towards
confluence with R. Gucha at Sango
area in Lower Gucha Migori SC
R. Migori Rocky and sandy riverbed and
community people use different points
for gold ore washing
Source JICA Project Team
(2) River Structures
River Gucha Migori has two river systems i.e. River Gucha system and R. Migori system.
Along these two systems there are various river structures constructed therein along the river
or besides the river in the two river system.
The pictures in table 2.2 below are divided in the respective river system and indicate the river
structures and riverbed materials along R. Gucha Migori from the upstream, midstream and
downstream.

Gucha Migori River Basin Project on Capacity Development for Integrated Flood Management Plan-Draft- Effective Flood Management in Flood Prone Area
18
Table 2.2 Pictures of the River Structures along R. Gucha Migori
River Gucha System: Upstream
Description : R. Gucha at its source in Getengerine village in Kiabonyoru and community members use it for domestic use
Description : R. Gucha at its source in Getengerine village in Kiabonyoru,Nyamira District the river channel is narrow
Description : Magombo in Kenyerere in Nyamira District the water in the river channel is colourless and clean with rocky riverbed
Description : Magombo in Kenyerere in Nyamira District the river structure is a culvert constructed for purposes of road transport
Description : R. Kanyamwere a tributary of R. Gucha located in Rigwero area in Nyamira District, the river water starts changing colour and the riverbed material is rocky
Description : R. Kanyamwere a tributary of R. Gucha located in Rigwero area in Nyamira District, the river acts as watering point for livestock and thereis a vehicular bridge

Project on Capacity Development for Gucha Migori River Basin Effective Flood Management in Flood Prone Area Integrated Flood Management Plan-Draft-
- 19 -
Description : Confluence point at Gekano-Kanyamware boundary where R. Gekano and R. Kanyamware join and both drain into R. Gucha. Riverbed material is pebbles and soil sediments and there is riverbank erosion
Description : Gekano-Kanyamware boundary the river structure is a seventeen metre (17M) concrete vehicular bridge that links two sub-locations and there are brick making works by community members just 20M from the river
Description : Kianwarimu-Gekano area where the water is light brown greyish in colour and the riverbed material is pebbles and soil sediments and there is riverbank erosion
Description : Kianwarimu-Gekano area here there is a twenty metre (20M) steel footbridge constructed and blue gum trees are planted in the riparian areas
Description : R. Gucha widens at Gekano area in Nyamira district as it flows downstream riverbed material is soil sediments with few traces of pebbles
Description :Gekano area in Nyamira district where there is a river structure a drainage canal dug by community members to channel water from their nearby hills into the river channel

Gucha Migori River Basin Project on Capacity Development for Integrated Flood Management Plan-Draft- Effective Flood Management in Flood Prone Area
20
Description : Esani area boundary of Manga and Boribari Districtriver structure includes a vehicular bridge constructed on the murram road that links Manga and Boribari
Description : Community member from Esani explains how the drainage canal was dug and now it protects the bridge from being flooded but the nearby school still get affected by floods during rainy seasons
Description: Kegati area in Kisii Town the river water
is brown in colour and riverbed material is
rocky and soil sediment there is minimal
riverbank erosion
Description : Kegati area in Kisii Town the river structure includes water intake that supplies Kisii town
Description : Kegati area in Kisii Town the river structure includes vehicular bridge that KisiiNarok road passes over the R. Gucha
Description : Kegati area in Kisii Town the water flows downstream and there is vegetation cover in the riparian areas

Project on Capacity Development for Gucha Migori River Basin Effective Flood Management in Flood Prone Area Integrated Flood Management Plan-Draft-
- 21 -
Description :Ogembo town in Gucha District the river water is brown in colour and riverbed material is rocky and soil sediment there is minimal riverbank erosion
Description :Ogembo town in Gucha District the river structure includes vehicular bridge that KisiiKilgorisroad passes over the R. Gucha
Description : Ogembo town in Gucha District the river structure includes the gabion works used to reinforce the vehicular bridge that KisiiKilgoris road passes over the R. Gucha
Description : Ogembo town in Gucha District the river structure includes the under construction footbridge that will give pedestrian easy access to the market stalls
River Gucha System: Midstream
Description : Sare bridge in Awendo town R. Sare a tributary of R. Gucha. The river water is brown in colour and riverbed material is rocky and sandy there is minimal riverbank erosion
Description :Sare bridge in Awendo town the river structure includes the gabion works used to reinforce the vehicular bridge that KisiiMigori road passes over the R. Sare
Gucha Migori River Basin Project on Capacity Development for Integrated Flood Management Plan-Draft- Effective Flood Management in Flood Prone Area
22
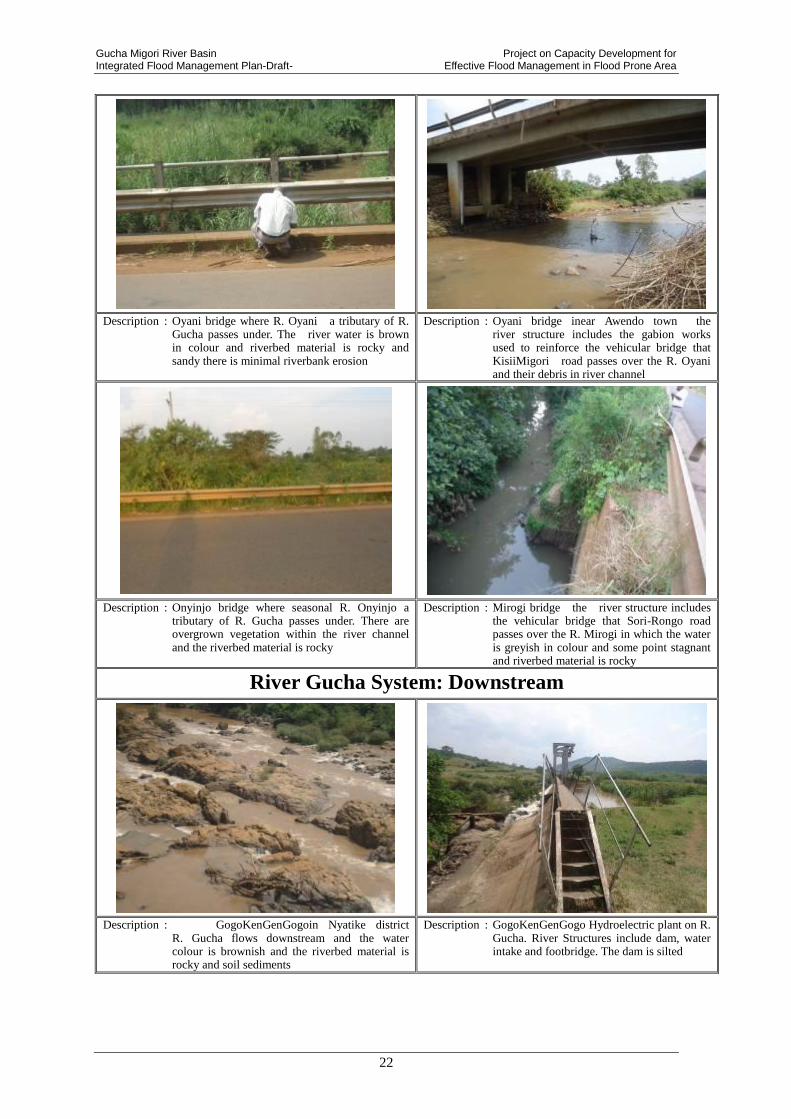
Description : Oyani bridge where R. Oyani a tributary of R. Gucha passes under. The river water is brown in colour and riverbed material is rocky and sandy there is minimal riverbank erosion
Description : Oyani bridge inear Awendo town the river structure includes the gabion works used to reinforce the vehicular bridge that KisiiMigori road passes over the R. Oyani and their debris in river channel
Description : Onyinjo bridge where seasonal R. Onyinjo a tributary of R. Gucha passes under. There are overgrown vegetation within the river channel and the riverbed material is rocky
Description : Mirogi bridge the river structure includes the vehicular bridge that Sori-Rongo road passes over the R. Mirogi in which the water is greyish in colour and some point stagnant and riverbed material is rocky
River Gucha System: Downstream
Description : GogoKenGenGogoin Nyatike district R. Gucha flows downstream and the water colour is brownish and the riverbed material is rocky and soil sediments
Description : GogoKenGenGogo Hydroelectric plant on R. Gucha. River Structures include dam, water intake and footbridge. The dam is silted

Project on Capacity Development for Gucha Migori River Basin Effective Flood Management in Flood Prone Area Integrated Flood Management Plan-Draft-
- 23 -
Description : GogoKenGenGogo Hydroelectric plant on R. Gucha. The water flows at high velocity
Description : GogoKenGenGogo Hydroelectric plant on R. Gucha. The dam is silted leading to vegetation growth in some parts of the dam
Description : DarajaAego in Nyatike District, R. Gucha flows downstream and the water colour is brownish and the riverbed material is rocky and soil sediments. The river structure is the vehicular bridge on Migori-WathOnger road
Description : DarajaAego in Nyatike District, R. Gucha flows downstream and the water abstractors using pumps to pump into their lorry thereafter use the water to wash gold ore in the mines
Description : Sango area in Nyatike District, the confluence of R. Gucha and R. Migori the water colour is brownish and the riverbed material is rocky, sandy and soil sediments.
Description : Sango area in Nyatike District, the confluence of R. Gucha and R. Migori there is a huge deposit of soil sediments within the river channel which during rainy season is covered by water

Gucha Migori River Basin Project on Capacity Development for Integrated Flood Management Plan-Draft- Effective Flood Management in Flood Prone Area
24
Description : Sango area in Nyatike District, the confluence of R. Gucha and R. Migori the community members mine gold from the soil sediments deposited within the river channel during low rain seasons
Description : R. Gucha at the downstream where there is riparian encroachment with agricultural activities undertaken almost at the brick of the riverbanks
Description : WathOnger R. GuchaMigori flows downstream the water is brownish in colour and the riverbed material is rocky, sandy and soil sediments and in the river structure includes vehicular bridge on WathOnger-Muhuru Bay road
Description : WathOnger R. GuchaMigori flows downstream the water is brownish in colour and the river structure includes WRMA’s river gauge station and in the river channel there are wooden logs debris
River Migori System: Upstream
Description : Oljoposei Area in Transmara District, where R. Oljoposei which drains into R. Migori has riverbed material as rocky and pebble riverbed and the river channel is narrow
Description : Oljoposei Area in Transmara District, where R. Oljoposei which drains into R. Migori has river structure of a box culvert and community members use the river for washing their motorcycle

Project on Capacity Development for Gucha Migori River Basin Effective Flood Management in Flood Prone Area Integrated Flood Management Plan-Draft-
- 25 -
Description : Kaposorwa in Transmara District, R. Moiguiet that drains into R. Migori flows through. The riverbed material soil sedimentation
Description : Kaposorwa in Transmara District, R. Moiguiet which drains into R. Migori has river structure of a vehicular bridge and the river is a watering point for livestock
Description : Kapng’eno area in Transmara District, R. Moiguiet joins with R. Migori the area is the confluence of two rivers and riverbed material is soil sedimentation rand natural indigenous trees are noticeable
Description : Kapng’eno area in Transmara District, R. Moiguiet joins with R. Migori at this confluence there are no river structures and community members wade through water to cross the river
Description : Magor bridge in Transmara East district R. Migori flows through. The riverbed material soil sedimentation water levels are low during dry season and very high during rainy season
Description : Magor bridge in Transmara East district R. Migori flows under this bridge . The river structure is a vehicular steel bridge, there vegetation noted in the river channels

Gucha Migori River Basin Project on Capacity Development for Integrated Flood Management Plan-Draft- Effective Flood Management in Flood Prone Area
26
Description : Esoit-Naibor area in Transmara District, R. Migori flows downstream riverbed material is rocky riverbed and wooden logs noticeable in the river channel
Description : Esoit-Naibor area in Transmara District, R. Migori flows downstream river structure is a vehicular two compartment bridge
Description : Enoosaen area in Keyian in Transmara District, R. Enoosaen that drains into R. Migori flows downstream riverbed material is rocky and sandy
Description : Enoosaen area in Keyian in Transmara District, R. Enoosaen that drains into R. Migori flows downstream river structure is wooden footbridge and there are car washing activities
Description : Enoosaen area in Keyian in Transmara District, R. Enoosaen that drains into R. Migori flows downstream riverbed material is rocky and sand alluvial
Description : Enoosaen area in Keyian in Transmara District, R. Enoosaen that drains into R. Migori flows downstream river structure is eight cylindrical culvert of which 2 are blocked
Project on Capacity Development for Gucha Migori River Basin Effective Flood Management in Flood Prone Area Integrated Flood Management Plan-Draft-
- 27 -
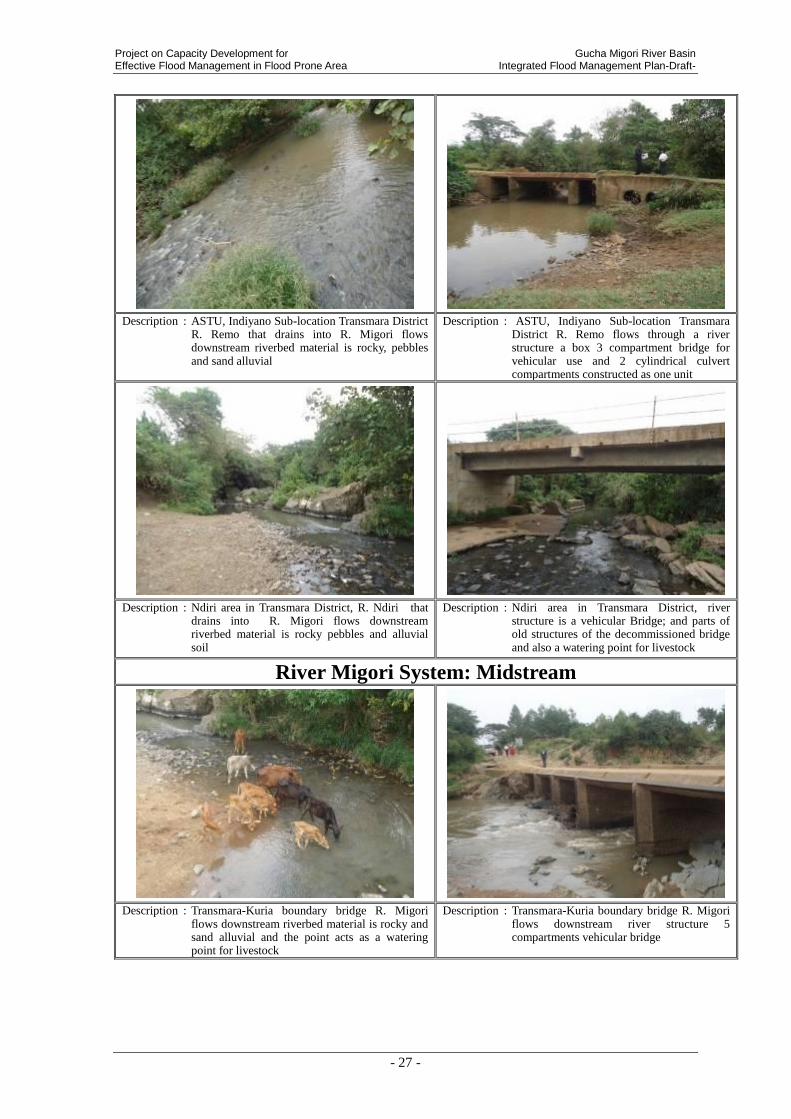
Description : ASTU, Indiyano Sub-location Transmara District R. Remo that drains into R. Migori flows downstream riverbed material is rocky, pebbles and sand alluvial
Description : ASTU, Indiyano Sub-location Transmara District R. Remo flows through a river structure a box 3 compartment bridge for vehicular use and 2 cylindrical culvert compartments constructed as one unit
Description : Ndiri area in Transmara District, R. Ndiri that drains into R. Migori flows downstream riverbed material is rocky pebbles and alluvial soil
Description : Ndiri area in Transmara District, river structure is a vehicular Bridge; and parts of old structures of the decommissioned bridge and also a watering point for livestock
River Migori System: Midstream
Description : Transmara-Kuria boundary bridge R. Migori flows downstream riverbed material is rocky and sand alluvial and the point acts as a watering point for livestock
Description : Transmara-Kuria boundary bridge R. Migori flows downstream river structure 5 compartments vehicular bridge

Gucha Migori River Basin Project on Capacity Development for Integrated Flood Management Plan-Draft- Effective Flood Management in Flood Prone Area
28
Description : Nyeikute village, Komanga Sub-location in Kuria-Kihancha District R. Nyogoto a tributary of R. Migori has riverbed material of rocky and sand alluvial
Description : R. Nyogoto a tributary of R. Migori has river structure box culvert for vehicular use; River overflows the bridge and affects the farms nearby
Description : Daraja ya Masaba area boundary of Nthiange and Masaba sub-locations in Kuria District R. Bungenech a tributary of R. Migori has riverbed material of rocky and sand alluvial. River catchment is intact with minimal human activities observed
Description : R. Bungenech a tributary of R. Migori has river structure of box culvert on the road that links the two locations i.e. Nthiange and Masaba sub-locations in Kuria District
Description : At the confluence of R. Bosara and R. Nyandara is where R. Hibwaa a tributary of R. Migori starts. Riverbed material are rocky, pebbles and sand Rocky, pebbles and sand alluvial
Description : R. Hibwaa has river structure a vehicular bridge and gabions. There are debris blockages on the bridge compartments

Project on Capacity Development for Gucha Migori River Basin Effective Flood Management in Flood Prone Area Integrated Flood Management Plan-Draft-
- 29 -
Description : Ragane Area near the boundary of Kuria and Migori districts. R. Ragane a tributary of R. Migori flows and riverbed material is rocky and pebbles and one of the river structure is the vehicular bridge
Description : R. Ragane a tributary of R. Migori flows and the river structure includes gabion works that reinforces the bridge and drainage canal that drains run-off water into the river channel
Description : Migori Bridge in Migori where R. Migori flows and riverbed material is rocky and sandy
Description : R. Migori flows downstream and there is a river structure i.e. bridge constructed above the river channel on an A1 road
Description : Nyasare estate in Migori Town: R. Nyasare a tributary of R. Migori and the rriverbed material is rocky, pebbles and sandy
Description : R. Nyasare as it flows downstream it has river structure which is 5 compartment cylindrical culvert and a house is constructed just beside the river

Gucha Migori River Basin Project on Capacity Development for Integrated Flood Management Plan-Draft- Effective Flood Management in Flood Prone Area
30
Description : On R. Nyasare there is also a run-off water drainage that drains into the river channel
Description : R. Nyasare drains into R. Migori which is about 100 M apart at this point. There are no river structures on R. Migori at this point but there are vegetation growing in the river channel
Description : Nyamure in Magina area in Migori Town: R. Nyagugoalso known as R. Nyamure a tributary of R. Migori and the rriverbed material is rocky, pebbles and sandy has river structure a 3 compartment cylindrical culvert and gabions
Description : R. Nyagogo drains into R. Migori which is about 200 M apart at this point. There are no river structures on R. Migori at this point but there are sand harvesting activities and the point acts as a watering point for the livestock
Description : Kakrao area in Migori district R. Nyasarara a tributary of R. Migori and the rriverbed material is soil sediments, rocky and pebbles
Description : R. Nyasarara that drains into R. Migori flows downstream river structure is 4 compartment cylindrical culvert of which some are blocked

Project on Capacity Development for Gucha Migori River Basin Effective Flood Management in Flood Prone Area Integrated Flood Management Plan-Draft-
- 31 -
Description : Othatcho location in Migori district R. Othatcho a tributary of R. Migori and the rriverbed material is soil sediments, rocky and pebbles
Description : R. Othatcho drains into R. Migori and has river structure a 1 compartment cylindrical culvert and on its channel there is a natural indentation on the river channel that acts as a reservoir for water during dry season
Description : Eko area, Ajego sub-location in Migori district R. Eko a tributary of R. Migori and the rriverbed material is soil sediments and rocky
Description : R. Eko has river structure is a vehicular bridge
River Migori System: Downstream
Description : Nyarogi sub-location in Othatcho location R. Nyakonya a tributary of R. Migori and the riverbed material is soil sediments and rocky
Description : R. Nyakonya that drains into R. Migori flows downstream through a river structure a vehicular bridge and on both side of the river there is riparian land encroachment

Gucha Migori River Basin Project on Capacity Development for Integrated Flood Management Plan-Draft- Effective Flood Management in Flood Prone Area
32
Description : Kadem south - Othatcho locations boundary R. Owich though a seasonal river is a tributary of R. Migori and the rriverbed material is soil sediments and rocky
Description : R. Owich drains into R. Migori aand has river structure which is a 2 compartment cylindrical culvert and water pollution is negligible by evidence of breeding of tadpoles and other marine life
Description : Mikei area in Nyatike district R. Migori flows downstream to join with R. Gucha at Sango. The rriverbed material of R. Migori at this point is rocky and sandy and river structure is the vehicular bridge
Description : Wath Onger R. Gucha Migori flows downstream into the L. Victoria the riverbed material at this point is rocky and sandy and the water is brownish in colour. The river structure is a vehicular bridge and there is a WRMA automated and manual river gauge station
Source JICA Project Team
Description : Nyarogi sub-location in Othatcho location
R. Nyakonya a tributary of R. Migori and the rriverbed material is soil sediments and rocky
Description : R. Nyakonya that drains into R. Migori flows downstream through a river structure a vehicular bridge and on both side of the river there is riparian land encroachment
Description : Kadem south - Othatcho locations
boundary R. Owich though a seasonal river is a tributary of R. Migori and the rriverbed material is soil sediments and rocky
Description : R. Owich drains into R. Migori aand has river structure which is a 2 compartment cylindrical culvert and water pollution is negligible by evidence of breeding of tadpoles and other marine life
Description : Mikei area in Nyatike district R. Migori flows downstream to join with R. Gucha at Sango. The rriverbed material of R. Migori at this point is rocky and sandy and river structure is the vehicular bridge
Description : R. Othatcho drains into R. Migori and has river structure a 1 compartment cylindrical culvert and on its channel there is a natural indentation on the river channel that acts as a reservoir for water during dry season

Project on Capacity Development for Gucha Migori River Basin Effective Flood Management in Flood Prone Area Integrated Flood Management Plan-Draft-
- 33 -
(3) Changing of River Course
River Gucha Migori drains its water into Lake Victoria. The river changed its course in the
year 2001-2002 to establish its current channel that flows through Kabuto Nyora villages in
Lower Central Kadem. The initial channel was through Aneko village in Aneko location
(previously known as West Kadem).
Interviews with community members revealed that before the river changed its course it had
changed at least four times eastwards within Aneko bay.
The figure 2.6 shows the river channel on its old course, while figure 2.7 shows google map
that indicates the new channel and figure 2.8 shows an updated map that indicates the new
channel.
Figure 2.7 Gucha Migori River structures Map

Gucha Migori River Basin Project on Capacity Development for Integrated Flood Management Plan-Draft- Effective Flood Management in Flood Prone Area
34
Figure 2.8 Old Map indicating old river channel
Figure 2.9 Satellite data on google Map indicating the new river channel
Figure 2.10 New updated Map indicating the new river channel
Old River
The Base Map In 1997
New River
Old River

Project on Capacity Development for Gucha Migori River Basin Effective Flood Management in Flood Prone Area Integrated Flood Management Plan-Draft-
- 35 -
1.1.4 Hydrology and Meteorology
(1) Feature of Rainfall and Water Level Gauging Station
(a) Gauging Stations
Figure 2.9 shows locations of WRMA rainfall and water level gauging stations. Rainfall
gauging stations are indicated in red colour, while the water level gauging
stations are shown in purple colour.
Wath Onger River Gauging Station ID 1KB05 is located in the downstream of R. Gucha
Migori i.e. after the two rivers R. Gucha and R. Migori having joined together and
becoming a wide R. Gucha Migori.
Gucha Migori River Basin is endowed with river gauging stations strategically placed
both on R. Gucha system and R. Migori System.
Figure 0.7 Location Map of Rainfall and Water Level Gauging Stations
Migori RGS
Gucha RGS Wath Onger
RGS
Lolgorian
WS
Kisii WS
Migori WS

Gucha Migori River Basin Project on Capacity Development for Integrated Flood Management Plan-Draft- Effective Flood Management in Flood Prone Area
36
Water Level Gauging Station No.:1KB11
Observation River:Oyani River
Water Level Gauging Station No.:1KC03 Observation River:Migori River
Special Note:Water level gauge is broken off and damaged.
Water Level Gauging Station No.:1KB05
Observation River:Gucha Migori River
Water Level Gauging Station No.:1KB05 Observation River:Gucha Migori River
Special Note :This is an automated gauge station that transmit data to WRMA Regional Office
(b) River Gucha Migori Discharge Data The National Water Master Plan 1992 indicates the annual discharge for R. Gucha Migori as indicated
in the Figure 2.10 below
Figure 0.8 Annual Discharge R. Gucha Migori

Project on Capacity Development for Gucha Migori River Basin Effective Flood Management in Flood Prone Area Integrated Flood Management Plan-Draft-
- 37 -
Table 2.3 List of WRMA Rainfall Gauging Station within Gucha Migori River Basin
Station ID Name Status Start Year
640 Keroka Operational
New Nyamache tea factory Not operational
New TDP-Kilgoris Operational
New Lolgorian Operational
New Nkararo Operational
9134025 Migori Operational
9134009 Muhuru bay Operational
9034093 Homabay Operational
Source: WRMA
(c) Water Level and River Discharge Observation Data
List of water gauging stations in Gucha Migori River Basin is shown on Table of the
stations listed below, those stations obtained water level observation data is only Gauging
Station Nos. 5DA07 indicated by color. Automatic measurement is not done at each water
level gauging stations,
Table 2.4 List of Water Level Gauging Station in Gucha Migori River Basin
Station ID Name Status Start Year
1KB12 Kenyamware Operational 1970
1KB03 Gucha Operational 1993
1KB05 Wath Onger Operational 1980s
1KB11 Oyani Operational 1970s
1KC03 Migori Operational 1970s
1KC07 Enkaregituak Operational 1970s
Source: WRMA
(2) Meteorology
Rainfall is in two seasons like in most of Kenya and the highest rainfall is between March and
May. Average rainfall is approximately 1200 mm and above, but the rainfall patterns are
unique, as the small town has three patterns of rainfall according to the neighborhood. It could
rain in Kakrao but around Onyalo school would be very dry and Namba would have a slight
drizzle.
There are several sub-counties (formerly known as districts) within the Gucha Migori River
Basin. The climatic information of these districts is as follows:
a) Gucha Sub-county
i) Rainfall

Gucha Migori River Basin Project on Capacity Development for Integrated Flood Management Plan-Draft- Effective Flood Management in Flood Prone Area
38
The district experiences a highland equatorial climate. It receives an average of 1800 mm
of rainfall annually with the long rains between March and June while the shortest rains
are received from September to November. Hailstones are common occurrence during the
short rains. July and January are relatively dry months. (Source: Gucha District
Development Plan 2008-2012)
ii) Temperatures
The maximum temperatures in the district range between 21oC to 30
oC while the minimu
temperatures range between 15oC to 20
oC. An average relative humidity of 80% is
experienced in the district. (Source: Gucha District Development Plan 2008-2012)
b) Kisii Central District
i) Rainfall
The district has a highland equatorial climate resulting into bimodal rainfall pattern with
an average annual rainfall of 2000 mm which is highly reliable. It has two rainy seasons
the long rains occurring between February and June and the short rains occurring between
September to early December. Dry spells however occur sometimes towards the ends of
the short rains in some part of the district. (Source: Kisii Central District Development
Plan 2008-2012)
ii) Temperatures
The high altitude of the district is expected to lower temperatures. However the proximity
of the equator raises the temperatures to a mean annual maximum of 27oC in the lowlands
and minimum of 16oC. The maximum temperatures of the highlands are 24
oC with a
mean minimum of 14oC. The coldest seasons are experienced in late June, July and
August. (Source: Kisii Central District Development Plan 2008-2012)
c) Migori District
i) Rainfall
The district has a mild inland equatorial climate modified by relief altitude and proximity
to the lake. Rainfall pattern ranges from 700 mm to 1800 mm annually, with short rains
occurring between March and May while long rains fall during October to December. The
lakeshore divisions experience unreliable and poorly distributed rainfall. (Source: Migori
District Development Plan 2008-2012)

Project on Capacity Development for Gucha Migori River Basin Effective Flood Management in Flood Prone Area Integrated Flood Management Plan-Draft-
- 39 -
ii) Temperatures
The temperatures show a mean minimum of 17oC and maximum temperatures of 20
oC
with a high humidity and a potential evaporation of 1800 to 2000 mm per year. (Source:
Migori District Development Plan 2008-2012)
The data on rainfall for the year 2009 provided by Nyatike District Agricultural Office is
shown in the figure 2.11 below
Figure 0.9 Annual Rainfall in Nyatike downstream of R. Gucha Migori
1.1.5 Lower Gucha Migori River Basin Floods
(1) Secondary Data
a) Background
The secondary data collected from Lake Basin Authority “RIVER PROFILE STUDIES
VOLUME IV, LOWER KUJA, IRRIGATION DEVELOPMENT ANNEX II
HYDROLOGY OCT 1985” reports that: The Kuja flow record at1KB05 provides an
annual series of 15 years. Although this record is short it has the benefit of the station
being reasonably calibrated up to 5.78M (534M3/S). the highest level at which flows have
been gauged by current meter; with the highesr observed level in 15 years being at 6.70M,
under 1M higher than the maximum gauged by current meter. By contrast, records at
1KB1, 1KB1A and 1KC3 are longer but have less certain flood flow ratings. The highest
gauged flow of the Kuja at 1KB1/1KB1A is only 139M3/S, although the 1KC03Migori
has been gauged at 477 M3/S.
4 (Page A2-17)
b) Flood Series at 1KB5
4 Lake Basin Authority “River Profile Studies iv, Lower Kuja, Irrigation Development Annex II Hydrology Oct. 1985
0
50
100
150
200
250
300

Gucha Migori River Basin Project on Capacity Development for Integrated Flood Management Plan-Draft- Effective Flood Management in Flood Prone Area
40
The secondary data collected from Lake Basin Authority “RIVER PROFILE STUDIES
VOLUME IV, LOWER KUJA, IRRIGATION DEVELOPMENT ANNEX II
HYDROLOGY OCT 1985” reports that: The mean annual flood derived from this series
is 407 M3/S. Extreme Value (Type 1) analysis with Gringorten plotting positions gives the
following estimates:5 (Page A2-17)
SOCIO ECONOMIC CONDITIONS
1.1.6 General Profile
There are three predominant tribes within the basin i.e. the Luo tribe located in the
downstream and part of the midstream and call R. Gucha as R. Kuja. The Luo are mainly
farmers and fishermen; the Kisii tribe is located in the upstream of R. Gucha and is mainly
farmers; the Massai tribe is located in the upstream of R. Migori which they call R. Magor.
The Massai are pastoralist but are quickly adapting to farming especially in Transmara East
district; and Kuria tribe that are in the midstream of R. Migori. The Kuria are farmers. All
these tribes keep livestock.
1.1.7 Administration
(1) Local Administration
Administration division of the Republic of Kenya as of March 2013 is shown below.
Table 2.5 Administration Division in Republic of Kenya Administration Unit Officer in charge
County County commissioner District District commissioner Division District officer Location Chief Sub location Assistant Chief Village Village Elder Community Unit Respective Opinion Leader
In the administration system in Kenya, Central Government Administrative Organ (County –
5 Lake Basin Authority “River Profile Studies iv, Lower Kuja, Irrigation Development Annex II Hydrology Oct. 1985
(Page A2-18)

Project on Capacity Development for Gucha Migori River Basin Effective Flood Management in Flood Prone Area Integrated Flood Management Plan-Draft-
- 41 -
District – Division – Location – Sub-location) is managed under the Office of the President.
The smallest administrative unit is the Sub-location. For purposes of better and grassroot
oriented management the administrative organ engages village elders to manage respective
village within a sub-location. The Officer in charge at respective level is as “County
Commissioner” for County, “District Commissioner (DC)” for District, “District Officer (DO)”
for Division and Location, “Chief”, for Sub Location (Assistant Chief) and for Village “Elder”.
Gucha Migori River Basin consists of Nyamira County under which Nyamira and Manga
districts belong to, Kisii County under which Gucha, Kisii Central, Semeta and Kenyenya
districts belong to, Narok County under which Transmara East district belongs to, Migori
County wherein Migori, Kuria, Uriri and Nyatike districts belong to and Homabay County
wherein Ndhiwa district belongs to.
(2) Jurisdictional area of WRMA
Relation between the controlled area of WRMA (Water Resource Management Authority)
responsible for the administration relating to the water resource and Gucha Migori River Basin
is explained below. WRMA divides the country in 6 catchment areas and Gucha Migori River
Basin is included in the catchment called “Lake Victoria South Catchment (LVSCA)”.
Kisumu Regional Office in LVSCA have jurisdiction over the whole LVSCA. Besides, the
catchment is divided into three (3), i.e. Kisumu sub-region, Kericho sub-region, and Southern
Shoreline (Gucha Migori) sub-region. There are Sub-Regional Offices in the respective
sub-regions.
Figure 0.10 WRMA Southern Shoreline (Gucha Migori) Sub-Regional Office

Gucha Migori River Basin Project on Capacity Development for Integrated Flood Management Plan-Draft- Effective Flood Management in Flood Prone Area
42
Source : Lake Victoria South Catchment Area Catchment Management Strategy (June 2009)
Figure 0.11 LVSCA Catchment within the Kenya Map indicating the six regions
(3) Jurisdictional area of WRMA
0 100000 200000 300000 400000 500000 600000 700000 800000
-500000
-400000
-300000
-200000
-100000
0
100000
200000
300000
400000
500000
600000
Ewaso Ng'iroR
ift V
alle
y
Tana
Athi
Lake Victoria South
Lake Victoria North
Here is the LVSCA location
Gucha Migori River Basin

Project on Capacity Development for Gucha Migori River Basin Effective Flood Management in Flood Prone Area Integrated Flood Management Plan-Draft-
- 43 -
Relation between the controlled area of WRMA (Water Resource Management Authority)
responsible for the administration relating to the water resource and Gucha Migori River Basin
is explained below.
WRMA divides the country into six (6) catchment areas and Gucha Migori River Basin is
included in the catchment called “Lake Victoria South Catchment (LVSCA)”.
Kisumu Regional Office in LVSCA have jurisdiction over the whole LVSCA. Besides, the
catchment is divided into three (3), i.e. Kisumu sub-region, Kericho sub-region, and Southern
Shoreline (Gucha Migori) sub-region. There are Sub-Regional Offices in the respective
sub-regions.
1.1.8 Population
Approximately 2.5 million people live within the Gucha-Migori basin (or 360 cap/km²) and it
is estimated that 4.9 million people will live within the basin in 2030 (or 710 cap/km²), with
the large majority of the population dependant on subsistence farming. Rural population
densities in the upper half of the Gucha River basin and around Migori are (and will be)
therefore very high. This is a significant issue that poses challenges for land use, ownership,
and subsistence,especially in areas that already have a high urban population density (like Kisii
and Migori), and areas that have a high dependence on land. 6
The population census data of 2009 per districts in Gucha Migori River Basin is presented in
Table 2.6.
Table 2.6 Population Census Data in Gucha Migori River Basin (2009) District Male Female Total
HOMA BAY 145981 161346 307327 MIGORI 121181 132228 253409 RONGO 65240 68914 134154
KURIA WEST 66766 69496 136262 KURIA EAST 40248 41585 81833
KISII CENTRAL 133883 149234 283117 KISII SOUTH 25973 28996 54969
MASABA 67399 75588 142987 GUCHA 173472 190988 364460
GUCHA SOUTH 70458 75849 146307 NYAMIRA 125744 137457 263201 MANGA 41678 46181 87859
BORABU 34151 33461 67612 TRANS MARA 130323 130493 260816
Total 1242497 1341816 2584313
It is imperative to note that some of the districts lie on the boundary between Southern
shoreline (Gucha Migori) and Kericho sub-regional jurisdiction for example Masaba and
6 Identification of Multipurpose Water Resources Development Project in Gucha Migori River Basin in Kenya: Final Strategy Report
Source : Kenya National Bureau of Statistic, Census 2009

Gucha Migori River Basin Project on Capacity Development for Integrated Flood Management Plan-Draft- Effective Flood Management in Flood Prone Area
44
Borabu districts. It is also important to note that some of the district lie on the boundary of
Gucha Migori River Basin and Awach Tende and Awach Kibwon river basins.
1.1.4 Industrial, Agricultural Products and Commercial Activities
Agricultural products in the river basin are derived from farming, animal husbandry, fishing,
brick-making, sand harvesting, small scale business, carpentry and handicraft (stone carvings)
making.
There are industrial factories within the Gucha Migori River Basin which are mainly involved
in processing the agricultural products. The following are some of the example of industrial
factories within the river basin: 1) There is sugar processing company in Awendo, Transmara
and Ndhiwa, Migori county and 2) Tea factories in Nyamira and Kisii counties.
DEVELOPMENT PLAN
1.1.5 Vision 2030
Under the flagship projects on Water and Sanitation Vision 2030 envisages to rehabilitate the
hydro-metrological network andm rehabilitate 600 stations and this includes the stations in
Gucha Migori River Basin and in particular 1KB05 Wath Onger.Vision 2013 also envisages
Constructing twenty two (22) medium-sized multi-purpose dams with a total capacity of two
(2) billion M3 to supply water for domestic, livestock and irrigation use in the arid and
semi-arid areas in Kenya wherein the downstream of Gucha Migori River Basin shall be a
beneficiary of one of the dams.
Gucha Migori River Basin is also the hub of agricultural, livestock and fisheries activities in
Sourthern part of Western part of Kenya. In the Vision 2030 it envisages that Kenya will raise
incomes in agriculture, livestock and fisheries even as industrial production and the service
sector expand. This will be done by processing and thereby adding value to her products before
they reach the market. She will do so in a manner that enables her producers to compete with
the best in other parts of the world. This will be accomplished through an innovative,
commercially oriented and modern agriculture, livestock and fisheries sector.
These interventions are expected to generate an additional KSh.80-90 billion increase in GDP,
mainly through better yields in key crops, increased smallholder specialisationin the cash crop
sector (2-3cropsper plot),utilisation of a million hectares of currently uncultivated land, and
new cultivation of upto 1.2 million hectares of newly-opened lands.
Specific strategies will involve the following: (i) transforming key institutions in agriculture

Project on Capacity Development for Gucha Migori River Basin Effective Flood Management in Flood Prone Area Integrated Flood Management Plan-Draft-
- 45 -
and livestock to promote household and private sector agricultural growth; and (ii) increasing
productivity of crops and livestock. Kenya will also introduce new land use policies through:
better utilisation of high and medium. (Source: Kenya Vision 2030 Popular Version)
1.1.6 County Development Plan (2013-2018)
Currently the five counties in their respective jurisdiction are developing County Strategic
Development Plan. The strategic plan should include integrated water resource management.
1.1.7 Lake Victoria Catchment Area Catchment Management Strategy (June 2009)
According to “Lake Victoria South Catchment Area Catchment Management Strategy” which
is the management plan of WRMA in Lake Victoria South Catchment, the concept on
Integrated Flood Management in LVSCA is captured in Chapter 9 Flood and Drought
Management. This Chapter explains an overview of floods and drought in Lake Victoria South
Catchment, Flood and Drought Early Warning, vulnerabilities to floods and drought,
vulnerabilities of people to floods, priorities in floods protection, and achivement of floods.
Floods occur regularly in the catchment with devastating effects causing havoc to the human
population, crops and livestock and grossly undermining the socio-economic status of the local
population. The total area of flood risk will be surveyed and data made available for
implementation of control measures. Information and data obtained from the River Nyando
Integrated Flood Management Project by JICA will be adopted for replication in areas that
were not piloted. Flood mitigation measures will then be undertaken through structural
measures such as the construction of dykes and dams and non-structural measures such as the
development of flood early warning systems and capacity building in disaster management
skills and the implementation of flood warning system. Further action will be taken to
construct emergency evacuation centres and to train local communities on disaster
preparedness and management strategies on flood prevention and mitigation.
1.1.8 Bonyunyu Dam in the Upstream
Bonyunyu Dam Water and Sanitation Project aims at constructing a 7Million cubic meter
capacity dam on Gucha River, construction of 55,000m3/day Treatment works, Distribution
system, tanks and sanitation.
1.1.9 National irrigation Board (NIB) Irrigation Project
The National Irrigation Board is currently undertaking and irrigation project in the downstream
of R. Gucha Migori. There is an intake at Orango that will be constructed just after Gogo Dam
on R. Gucha system. There is another intake and water piping works at Sango area which is at

Gucha Migori River Basin Project on Capacity Development for Integrated Flood Management Plan-Draft- Effective Flood Management in Flood Prone Area
46
the confluence point of R. Gucha and R. Migori. It is imperative to note that the success of this
project will play an important role in the mitigation of floods in Lower Gucha Migori
Sub-catchment.
Source: National Irrigation Board Irrigation Project Planned Map
Figure 0.12 Planned NIB Irrigation Project Map
ENVIRONMENTAL AND SOCIO-ECONOMIC CONDITIONS
The catchment is faced with major issues which undermine the sustainable utilization of its
resources. These include among others: deforestation; wetland degradation; overutilization of
ecologically fragile areas including hill slopes, wetlands and river banks; land fragmentation;
water pollution; and loss of bio-diversity. With exploding population, shrinking land holdings,
stagnant farming practices and declining yield levels, changing rainfall regime due to global
climate change, and hardly any prospects for industrialization, there is a palpable stress in the
environmental conditions in the basin as manifested in poverty levels of the population and
environmental degradation. It is very clear that most of the environmental and social issues are
Gogo Falls and Hydroelectric Power Plant
Orango Intake
R. Migori
R. Gucha
Sango Pipeline and River Crossing
Lake Victoria

Project on Capacity Development for Gucha Migori River Basin Effective Flood Management in Flood Prone Area Integrated Flood Management Plan-Draft-
- 47 -
interdependent and cannot be treated separately.7
1.1.10 Environmental issues
The uppermost part of the Gucha-Migori basin was originally covered by a dense, tropical
highland forest similar to that currently in the undisturbed sections of the Mau water tower.
Over the past five decades, human settlement activities have completely cleared this from the
area, and no primary vegetation is to be found in most of the upper parts of the basin, with the
exception of the highly degraded Chepalungu forest in the upper Migori basin and of some
isolated areas on the valley floors although this is threatened by wetland/swamp reclamation.
The middle reaches of the Gucha-Migori basin were covered in thick bushlands and patches of
light forests but this has now also given way to cultivation and pastures. In particular, the
Migori River passes through large stretches of pasturelands used quite extensively by the
Maasai pastoralists. The original bushlands of the lower Gucha-Migori basin are progressively
being replaced by cultivation and are impacted by charcoal burning and logging as sources of
income and construction materials. The riverine and mountain wetlands, once numerous in
the upper parts of the Gucha basin, have been practically wiped out. The Kuja River enters
Lake Victoria through a small delta that has no major swamp. There are a number of
environmental issues in the Gucha-Migori basin. Most are interrelated and have become
increasingly serious due mainly to high population growth and related anthropogenic reasons
in many parts of the basin.8
1.1.11 Socio-economic issues
The catchment is notably characterized by high population density and growth rates
Approximately 2.5 million people live within the Gucha-Migori basin (or 360 cap/km²) and it
is estimated that 4.9 million people will live within the basin in 2030 (or 710 cap/km²), with
the large majority of the population dependant on subsistence farming. Rural population
densities in the upper half of the Gucha River basin and around Migori are (and will be)
therefore very high. This is a significant issue that poses challenges for land use, ownership,
and subsistence, especially in areas that already have a high urban population density (like
Kisii and Migori), and areas that have a high dependence on land. High poverty levels
Around 40% of Kenyans lived below the national poverty line In the Gucha-Migori basin,
around 53%, with Gucha (67%), Kuria (59%), Bomet (58%), Kisii (54%) districts over 50% of
the population below the poverty line. In addition, some of the areas within the basin had some
of the highest poverty densities in the country with more than 200 people below the poverty
line per km² (Gucha, Bomet, Kisii and Nyamira).
High disease prevalence rates it is recorded that the infant mortality rate is high – 95 per 1,000
7 Identification of Multipurpose Water Resources Development Project in Gucha Migori River Basin in Kenya: Final
Strategy Report 8 Identification of Multipurpose Water Resources Development Project in Gucha Migori River Basin in Kenya: Final
Strategy Report

Gucha Migori River Basin Project on Capacity Development for Integrated Flood Management Plan-Draft- Effective Flood Management in Flood Prone Area
48
– and the under-five mortality rate is also high –149 per 1,000 (these figures are for Nyanza
province but are similar for all the Gucha-Migori districts). The most prevalent diseases are
malaria, meningitis, HIV/AIDS, diarrhoea diseases, respiratory diseases, pneumonia, skin
diseases, eye infections and intestinal worms. Malaria is the leading cause of morbidity across
all the districts in the basin, representing an average of 52.5% of all cases. HIV prevalence
varies throughout the basin from 4.3% in Manga district to 22.3% in Homa Bay district.
Land Tenure Kenya’s recent history has been dotted with several intense episodes of
land-ownership conflict. The post-colonial land tenure management has led to a sectorization
with certain repercussions on the distribution of the different communities which populate the
country. This situation has become a source of inter-ethnic tensions which are exacerbated by
the high/growing population density. Subsitence agriculture with low prodctivity. Over 80% of
people depend upon agriculture (farming, livestock production and fishing) in the
Gucha-Migori sub-basin. Most of the agriculture in the basin is for subsistence. The main food
crops produced include maize, beans, finger millet, cassava, sweet potatoes and bananas.
Subsistence agriculture is characterised by productivity levels which have remained low for
decades despite technical advances which could support a major increase in productivity. This
leads to food insecurity and poverty. The impact of low per ha productivity is compounded by
diminishing land holdings. Frequent flooding and drought has been on increase in the
Gucha Migori River Basin. By reducing agricultural productivity, destroying crops and
properties, droughts and floods are major causes of food insecurity and poverty and a real
obstacle to development.9
9 Identification of Multipurpose Water Resources Development Project in Gucha Migori River Basin in Kenya: Final
Strategy Report
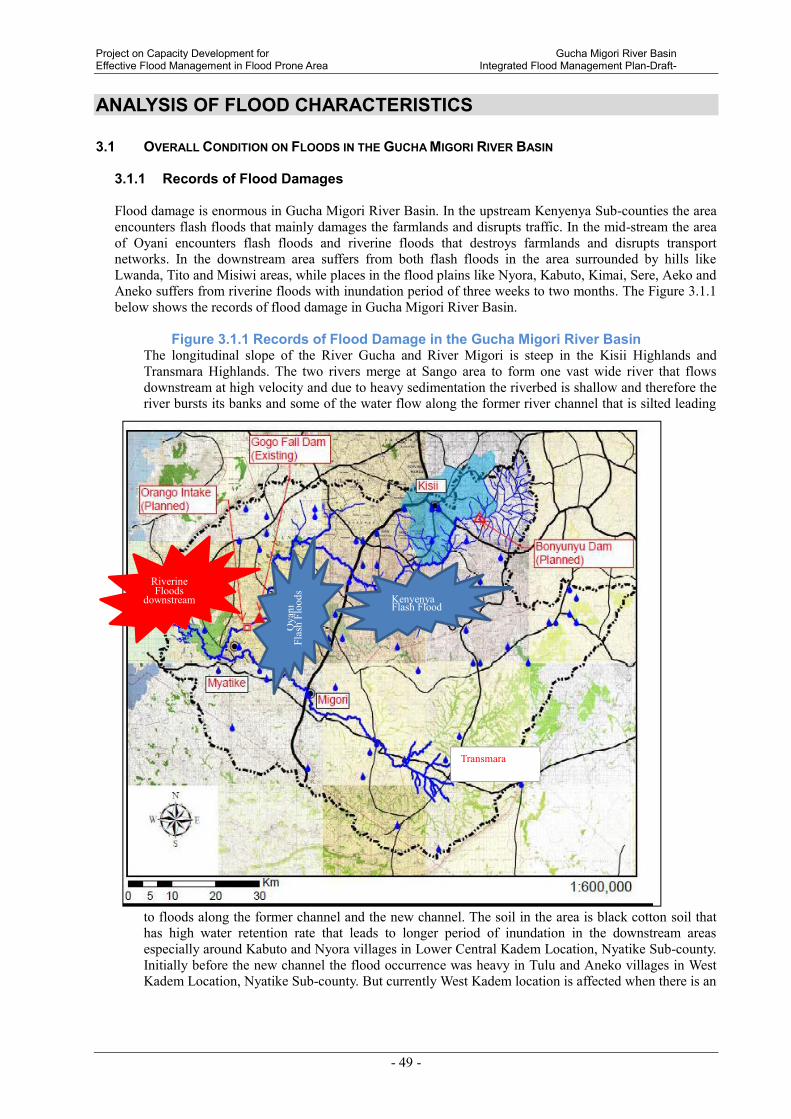
Project on Capacity Development for Gucha Migori River Basin Effective Flood Management in Flood Prone Area Integrated Flood Management Plan-Draft-
- 49 -
ANALYSIS OF FLOOD CHARACTERISTICS
3.1 OVERALL CONDITION ON FLOODS IN THE GUCHA MIGORI RIVER BASIN
3.1.1 Records of Flood Damages
Flood damage is enormous in Gucha Migori River Basin. In the upstream Kenyenya Sub-counties the area encounters flash floods that mainly damages the farmlands and disrupts traffic. In the mid-stream the area of Oyani encounters flash floods and riverine floods that destroys farmlands and disrupts transport networks. In the downstream area suffers from both flash floods in the area surrounded by hills like Lwanda, Tito and Misiwi areas, while places in the flood plains like Nyora, Kabuto, Kimai, Sere, Aeko and Aneko suffers from riverine floods with inundation period of three weeks to two months. The Figure 3.1.1 below shows the records of flood damage in Gucha Migori River Basin.
Figure 3.1.1 Records of Flood Damage in the Gucha Migori River Basin The longitudinal slope of the River Gucha and River Migori is steep in the Kisii Highlands and Transmara Highlands. The two rivers merge at Sango area to form one vast wide river that flows downstream at high velocity and due to heavy sedimentation the riverbed is shallow and therefore the river bursts its banks and some of the water flow along the former river channel that is silted leading
to floods along the former channel and the new channel. The soil in the area is black cotton soil that has high water retention rate that leads to longer period of inundation in the downstream areas especially around Kabuto and Nyora villages in Lower Central Kadem Location, Nyatike Sub-county. Initially before the new channel the flood occurrence was heavy in Tulu and Aneko villages in West Kadem Location, Nyatike Sub-county. But currently West Kadem location is affected when there is an
Transmara
Kenyenya Flash Flood
Oya
ni
Flas
h Fl
oods
Riverine Floods
downstream

Gucha Migori River Basin Project on Capacity Development for Integrated Flood Management Plan-Draft- Effective Flood Management in Flood Prone Area
50
overflow into the old river channel, the overflow of the streams that used to flow into the old channel
and the baskflow from the Lake Victoria.
(1) Upstream of Gucha Migori River Basin
In the upstream of R. Gucha Migori are mainly affected by flash floods. The flash floods mainly
affect farmlands and disrupt traffic. In 2012 in Kenyenya Sub-county it was reported that three people
drown and died as a result of the flash floods. The flash floods are as a result of the heavy rainfall
leading to heavy surface run-off water on the feeder roads that flow into the streams and rivers that
are tributaries of either R. Gucha in the Kisii Highlands or R. Migori in the Transmara Highlands.
During site investigation the following were noted:
a) Kiabonyoru area in Nyamira
The source of River Gucha is located in this area and it was observed that there were soil erosion on
the feeder roads was noted. This eroded soils forms part of sediments in the river.
b) Esani Area in Nyamira
River Gucha flow through this area it was observed that Nyantaro primary school.primary school is
built on a wetland. There is a road next to school that initially used to get flooded leading to
difficulties in accessing the school and this led to the community members through CDF assistance to
divert the river to prevent flooding of school and neighbouring homes and prevent damage to the
road.
c) Ogembo in Gucha
River Gucha flow through this area and it was observed that the river water was muddy yet the site
investigation was done during the dry spell which is an indication that soil erosion is rampant in this
area. In this area there are many feeder murram roads in the area that the surface run-off water flows
on into the river.
d) Kebabe Area in Gucha and Kenyenya
R. Riasucha a tributary of R. Nyangweta which also acts as a tributary of river Gucha flow through
this area and it was observed that a road in Kebabe has culverts constructed on it that causes havoc to
the neighbouring homes when it rains heavily because the rain water flow through the culverts and
have no place to flow to therefore the water inundates the farmlands, homes and has led to community
members to dig a trench that enhances soil erosion that flows into R. Nyangweta. As a result of heavy
surface run-off water that leads to flash floods that inundates the farmlands leading to loss of crops in
the area.
(2) Mid-stream of Gucha Migori River Basin
In the midstream of R. Gucha Migori the area experiences heavy rainfall during the long and short
rain seasons. The major towns in the midstream area are Migori Town, Awendo Town and Rongo
Town. In Awendo there is a sugar factory. The following observations were noted:
a) Masaa area under Oyani WRUA jurisdiction
R. Oyani a tributary of river Gucha flow through this area and it was observed that there were
extensive agricultural activities including human activities around the hills that surround Oyani area.
The farmlands in Oyani area gets flooded during heavy rains. The floods are as a result of the R.
Oyani breaking its banks but also the flood water comes from the surface run-off water from the
neighboring hills.
The main cash crop grown in the area is sugarcane and during the floods in the area the farmers lose
millions to the floods when their sugarcane is washed away.

Project on Capacity Development for Gucha Migori River Basin Effective Flood Management in Flood Prone Area Integrated Flood Management Plan-Draft-
- 51 -
There is a bridge at Masaa area that was constructed by Ministry of Roads and during the construction
the contractor constructed a gabion within the water channel and after the works the decommissioned
gabion remained under the bridge. The community members pointed out that during high flows the
gabions blocks the river water leading to water overflowing to the nearby farms.
(3) Downstream of Gucha Migori River Basin
In the lower parts of Gucha Migori Basin which forms the downstream of R. Gucha Migori
experience perennial floods and suffers damage from flood frequently. The floods cause adverse
effects on agriculture and agricutural products, infrastructures, houses, lives and properties, land use,
local economy and etc.
The effects and impacts of flood directly cause a stagnated economic growth. In the Sub-Catchment
Management Plan developed by LOGUMI WRUA activities aimed at management of floods are
prioritized.
According to information of data collected for lower parts of Gucha Migori River Basin which is
shown in the Table 3.1.1. It indicates that approximately 100 km2 was inundated in 1997 and 2002
and 2006 that was three times larger area and the number of victims and duration of the evacuation
was two times larger and longer than an ordinary year.
Table 3.1.1 Overview of Flood in the Lower Gucha Migori River Basin (Ordinary year and extraordinary years)
The flooding situation
in an ordinary year
The flooding situation
In an extreme year (1997, 2002
and 2006)
Flood area 25 km2 100 km
2
Depth of water 1 m 1.5 m
No of evacuee 900 1800
Evacuation duration 1 month 3 month
No of floods in a year 2 2
Source: The table is created by JICA Project Team based on information provided by WRUA
Overview of recent flood damages in the downstream of Gucha Migori River Basin is shown in

Gucha Migori River Basin Project on Capacity Development for Integrated Flood Management Plan-Draft- Effective Flood Management in Flood Prone Area
52
Table 3.1.2 presents estimated flood damage cost and inundated area of agriculture sector in the
downstream of Gucha Migori River Basin in the year 2012. It is imperative to note that the floods in
the year 2012 waere ordinary floods yet the river level rose to 7.2M and the flood damage was
enormous.
The floods affected severely Kabuto and Nyora villages and washed away most of their farmlands,
inundated homesteads and made the area very difficult to access. As a result of two months inundation
in the homesteads most houses sunk 1M down.

Project on Capacity Development for Gucha Migori River Basin Effective Flood Management in Flood Prone Area Integrated Flood Management Plan-Draft-
- 53 -
Table 3.1.2 Agricultural Damage in the Lower Gucha Migori River Basin in 2012 S/No Villages Crops Damaged No. Of
Affected
Farmers
Affected
acreage
Value In
Millions (M)
Kshs Lost.
1.
Kar
un
gu
Div
isio
n
in
Nyat
ike
Dis
tric
t
i. Sito valley
ii. Upper Okayo
iii. Alara.
iv. Okero
v. Ojawa
vi. Riat
vii. Osiri
viii. Agulu
ix. Wakine.
x. Atonge.
xi. Lower Okayo
xii. Obware valley
xiii. Along L. Victoria
Shore.
Young Sorghum,
Kales, Maize, Young
Cassava, Beans,
Tomatoes, Sweet
Potatoes, Watermelon.
Tree nurseries and
tree seedlings, Local
vegetables (e.g.
Mrenda,.
Black night shade and
Spider plant)
88 120 2.4 M
2.
Ny
atik
e D
ivis
ion
in
Ny
atik
e D
istr
ict
i. Kabuto
ii. Angugo
iii. Modi
iv. Luanda
v. Kimai
vi. Lower Magungu
vii. Nyora
Young Sorghum,
Kales, Maize, Young
Cassava, Beans,
Tomatoes, Sweet
Potatoes, Watermelon.
Tree nurseries and
tree seedlings, Local
vegetables (e.g.
Mrenda,.
Black night shade and
Spider plant)
390 415 10.3M
3.
Mu
hu
ru
Div
isio
n
in
Ny
atik
e D
istr
ict
i. Ratieny Valley
ii. Tagache/Kiambu
iii. Lower Tito
iv. Upper Tito.
v. Lisori
vi. Nyakumu
Young Sorghum,
Kales, Maize, Young
Cassava, Beans,
Tomatoes, Sweet
Potatoes, Watermelon.
Tree nurseries and
tree seedlings, Local
vegetables (e.g.
Mrenda,.
Black night shade and
Spider plant)
52 92 2.3M
Total 530 627
Acres
15.0M
Source: District Agriculture Office-Nyatike
3.1.2 Flood Condition Inquiring From Relevant Communities
The focal points having flood damages in the downstream of Gucha Migori river basin are Nyora,
Kabuto, Kimai, Aneko, Aeko, Lwanda, Misiwi, Tulu, Ratieny and Tito etc.
During the community inquiry survey on these communities on the flooding situations during ordinary floods, the community members were able to reveal as shown in the following

Gucha Migori River Basin Project on Capacity Development for Integrated Flood Management Plan-Draft- Effective Flood Management in Flood Prone Area
54
Table 3.1.24 while figure 3.1.2 is the map that shows these areas.
Table 3.1.3 Floods impact on communities in the downstream during an ordinary year
Village
name
Population Flood
Damages
Remarks
Popn. HH Affected
popn.
HH
1. Nyora 2620 262 924 184 Homes, farms
and transport
networks
Toilets collapse leading to
sanitation and hygiene
problems. Community assist
each other in evacuation
2. Kabuto 2678 270 844 152 Homes, farms
and transport
networks
Toilets collapse leading to
sanitation and hygiene
problems. Community assist
each other in evacuation
3. Kimai 2200 220 230 20 Homes,
grazing land
and transport
networks
Toilets collapse leading to
sanitation and hygiene
problems. Community assist
each other in evacuation
4. Aneko 3600 360 - - Affects mainly
farmlands
Community members are
involved in drainage
improvement
5. Aeko 8700 870 190 15 Few homes
and farmlands
Farmland destruction that
leads to heavy food
shortages
6. Lwanda 1526 254 520 50 Disrupts
transport and
damage homes
Toilets collapse leading to
sanitation and hygiene
problems. Community assist
each other in evacuation
7. Misiwi 2623 262 230 35 Disrupts
transport and
damage homes
Toilets collapse leading to
sanitation and hygiene
problems. Community assist
each other in evacuation
8. Tulu 1010 134 468 78 Disrupts
transport and
damage homes
Toilets collapse leading to
sanitation and hygiene
problems. Community assist
each other in evacuation
9. Ratieny 1300 170 200 20 Disrupts
transport and
damage homes
Farmland destruction that
leads to heavy food
shortages
10. Tito 2511 252 147 25 Disrupts
transport and
damage few
vhomes
Toilets collapse leading to
sanitation and hygiene
problems. Community assist
each other in evacuation Source: JICA project team survey by inquiring to communities

Project on Capacity Development for Gucha Migori River Basin Effective Flood Management in Flood Prone Area Integrated Flood Management Plan-Draft-
- 55 -
Figure 3.1.2 Location Map of Principal Community in Downstream Area
Widespread and long term inundation around the river caused by overflow from the R. Gucha Migori causes severe damages to especially “Nyora” and “Kabuto” villages located in inundation area on the either side of the river with flood depth ranging from 100cm to 150cm depth and 1 to 3 months duration period. According to the figure described above, “Nyora” or “Kabuto” villages are located in the downstream of R. Gucha Migori approximately 3KM from Lake Victoria. The river bursts its banks and overflow into the farmlands thereafter into the homesteads, schools etc. The inundated area becomes one big like basin full of water that looks like a lake. Both Kabuto and Nyora are densely populated and the crops in the farmlands in the area and poultry especially chickens being washed away into Lake Victoria.
Lwanda, Misiwi, Tito and Ratieny are affected by flash floods as a result of heavy rains in the neighboring hills in the downstream. While Tulu, Aeko, Aneko areas are affected by both flash floods and riverine floods. The flash floods are caused by the numerous streams (both permanent and seasonal) that flow through these areas. In Tulu area the water overflows the stream and inundates the area for more than two weeks with extensive damage in the farmlands.
According to this, the damage situations and flood type in each community by project team’s
inquiring survey on the communities are shown below.
1
2
3
4
5
6
7
8
9
10
1
7
2
4
5
1
6
3
8
9
Nyora
Misiwi
Kabuto
Aneko
Aeko
Tito
Kimai
Tulu
Ratieny
Lwanda

Gucha Migori River Basin Project on Capacity Development for Integrated Flood Management Plan-Draft- Effective Flood Management in Flood Prone Area
56
(1) Nyora Village - Water depth is 150cm in the farmlands and 120-100cm in the homesteads, duration is 1 to 2 month
when floods occur.
...........................................................(Inundation caused by overflow of River Gucha Migori)
- Flow from river water and from upstream even when there is no rainfall in Nyora area
................................................... (Inundation caused by R. Gucha Migori breaking its banks)
- Waters and sediments flow into the houses make homesteads inhabitable
..................................................... (Inundation caused by R. Gucha Migori breaking its banks)
- Small livestock such as goats, sheep, chicken and ducks swept away
..................................................... (Inundation caused by R. Gucha Migori breaking its banks)
- The murram roads are inundated with flood water cutting off the villages from travelling and
community members use canoes from one place to the other.
..................................................... (Inundation caused by R. Gucha Migori breaking its banks)
- The farms are flooded sweeping away the food crops
..................................................... (Inundation caused by R. Gucha Migori breaking its banks)
- During very heavy flows Nyora Primary School is closed and used as evacuation centre
..................................................... (Inundation caused by R. Gucha Migori breaking its banks)
- Some mud houses are swept away and others sink in case inundation is more than 2 months
..................................................... (Inundation caused by R. Gucha Migori breaking its banks)
(2) Kabuto
- Water depth is 150cm in the farmlands and 120-100cm in the homesteads, duration is 1 to 2 month
when floods occur.
...........................................................(Inundation caused by overflow of River Gucha Migori)
- Flood water flows from the R. Gucha Migori old and new channel and a seasonal stream that
transverse through the village.
......................... (Inundation caused by overflow of River Gucha Migori old and new channel)
- Flood waters flows into the farmlands and sweeps the crops away
......................................(Inundation caused by overflow of River Gucha Migori new channel)
- Sediment flows into the houses and deposited inside
......................................(Inundation caused by overflow of River Gucha Migori new channel)
- Access roads are affected by the flood water making Kabuto Health Centre inaccessible and give
affected families difficulties to access Kabuto Primary which acts as evacuation centre(Inundation
caused by overflow of River Gucha Migori old and new channel)
- Small livestock such as goats, sheep, chicken and ducks swept away
..................................................... (Inundation caused by R. Gucha Migori breaking its banks)
- The murram roads are inundated with flood water cutting off the villages from travelling and
community members use canoes from one place to the other.
..................................................... (Inundation caused by R. Gucha Migori breaking its banks)
- The farms are flooded sweeping away the food crops
..................................................... (Inundation caused by R. Gucha Migori breaking its banks)
- During very heavy flows Kabuto Primary School is closed and used as evacuation centre
..................................................... (Inundation caused by R. Gucha Migori breaking its banks)
- Some mud houses are swept away and others sink in case inundation is more than 2 months
..................................................... (Inundation caused by R. Gucha Migori breaking its banks)
(3) Kimai
- Water depth is 100cm in the farmlands and 50-100cm in the homesteads, duration is 2 weeks to 1
month when floods occur.
.......................................... (Inundation caused by overflow of Onyongo and Nyakori streams)
- Some of the grazing lands like Olumbe have permanent depression that makes the area be like a
water-pan during floods and even after
(Inundation caused by overflow of Onyongo and Nyakori streams and surface run-off from Otho
area)
- The flood waters sweep away the food crops
Project on Capacity Development for Gucha Migori River Basin Effective Flood Management in Flood Prone Area Integrated Flood Management Plan-Draft-
- 57 -
.......................................... (Inundation caused by overflow of Onyongo and Nyakori streams)
- The murram roads are inundated with flood water cutting off the villages from travelling.
(Inundation caused by overflow of Onyongo and Nyakori streams and surface run-off from Otho
area)
(4) Aneko - Water depth is 100cm in the farmlands and 50cm in the homesteads, duration is 1 to 3 weeks when
floods occur.
(Inundation caused by overflow of River Gucha Migori old channel and backflow from the L.
Victoria)
- Flood water flows from the R. Gucha Migori old channel, backflow from the lake, Kanga and
Nyakore and surface water from Othora hills.
... (Inundation caused by overflow of River Gucha Migori old and backflow from L. Victoria)
- The farms are flooded sweeping away the food crops
... (Inundation caused by overflow of River Gucha Migori old and backflow from L. Victoria)
(5) Aeko - Water depth is 80-100cm in the farmlands and 50cm in the homesteads, duration is 1 to 3 weeks
when floods occur.
.................... (Inundation caused by backflow L. Victoria and run-off water from Othora hills)
- Flood water flows from the R. Gucha Migori old channel, backflow from the lake, Kanga and
Nyakore and surface water from Othora hills.
.................... (Inundation caused by backflow L. Victoria and run-off water from Othora hills)
- The farms are flooded sweeping away the food crops
.................... (Inundation caused by backflow L. Victoria and run-off water from Othora hills)
- The grazing grounds are inundated making it difficult for livestock to graze
.................... (Inundation caused by backflow L. Victoria and run-off water from Othora hills)
- The murram roads are inundated with flood water cutting off the villages from travelling.
.................... (Inundation caused by backflow L. Victoria and run-off water from Othora hills)
- Some of the homes are inundated leading damages of the houses especially mud thatched huts.
.................... (Inundation caused by backflow L. Victoria and run-off water from Othora hills)
(6) Lwanda - Flood waters mainly from the neighbouring Magungu and Obware hills ........... (Flash flood)
- Leads to disruption of transport Lwanda Karungu Road ..................................... (Flash flood)
- Disruption of Education Programme .................................................................... (Flash floods)
- Leads to disruption of economic activity at the busy Lwanda trade centre ......... (Flash flood)
- Houses are inundated with flood water. ............................................................... (Flash flood)
- Destruction of toilets. .......................................................................................... (Flash flood)
(7) Misiwi
- Flood waters mainly from the Aora Chudho stream and Got Bim hills .............. (Flash flood)
- Leads to disruption of transport ........................................................................... (Flash flood)
- Houses are inundated with flood water. ............................................................... (Flash flood)
- Destruction of toilets. .......................................................................................... (Flash flood)
(8) Tulu
- Water depth is 80-100cm in the farmlands and 50cm in the homesteads, duration is 1 to 4 weeks
when floods occur. (Inundation caused by Nyokore stream and run-off water from Suna hills)
............................... (Inundation caused by Nyokore stream and run-off water from Suna hills)
- Flood water flows from run-off water from Suna hills and Nyakore stream).
............................... (Inundation caused by Nyokore stream and run-off water from Suna hills)
- The farms are flooded sweeping away the food crops
............................... (Inundation caused by Nyokore stream and run-off water from Suna hills)
- The grazing grounds are inundated making it difficult for livestock to graze
............................... (Inundation caused by Nyokore stream and run-off water from Suna hills)
- The murram roads are inundated with flood water cutting off the villages from travelling.

Gucha Migori River Basin Project on Capacity Development for Integrated Flood Management Plan-Draft- Effective Flood Management in Flood Prone Area
58
............................... (Inundation caused by Nyokore stream and run-off water from Suna hills)
- Tulu Siko village becomes an island as the flood water surrounds the village make it in accessible
............................... (Inundation caused by Nyokore stream and run-off water from Suna hills)
(9) Ratieny
- Flood waters mainly from the Ratieny stream that is fed by run-off water from the neighbouring
hills ...................................................................................................................... (Flash flood)
- Leads to disruption of transport ........................................................................... (Flash flood)
- Few houses are inundated with flood water. ........................................................ (Flash flood)
- Farmlands and grazinglands are seriously affected .............................................. (Flash floods)
(10) Tito
- Water depth 60-100cm with a duration of 3 weeks .............................................. (Flash floods)
- Flood waters mainly from the Kamegeta hills in Tanzania and flows into the R. Tito that eventually
over flow its banks............................................................................................... (Flash flood)
- Leads to disruption of transport feeder roads and road that links Kenya and Tanzania (Flash flood)
- Houses near R. Tito are inundated with flood water. ........................................... (Flash flood)
- Schools like Nyakondo are seriously affected ....................................................... (Flash flood)
3.1.3 Existing Structures along the River
a) Water Plant at Kigati in Kisii central Sub-county
The Water Plant at Kigati was established in 1976 and water intake at plant is 6000M3/day and
the water is supplied to Kisii town and its environ. The plant is currently under upgrading and it
targets an intake of 18000M3/day.
Based on interview with staff at the Water Plant it is estimated that sediment sieved during
intake is 1 tonne in 3 months i.e. one tonne in three months of sediment is removed by the water
plant from the river channel during intake. They dump this sediment within the farms within the
water plant compound. The sediment charecteristics is fine sand and soil (reddish-brownish in
colour) granules.
b) Water Plant at Ogembo in Gucha Sub-county
The Water Plant at Ogembo was established in 2005 and water intake at plant is 200M3/day and
the water is supplied to Ogembo town and its environ.
Based on interview with staff at the Water Plant it is estimated that sediment sieved during
intake is 1/4 tonne in 6 months i.e. a quarter tonne in six months of sediment is removed by the
water plant from the river channel during intake. They dump this sediment within the farms
within the water plant compound. The sediment charecteristics is fine sand and soil
(reddish-brownish in colour) granules.
c) Water Plant at Keroka in Gucha Sub-county
The Water Plant at Keroka was established in 1980 and water intake at plant is 500M3/day and
the water is supplied to Keroka town and its environ.
Based on interview with staff at the Water Plant it is estimated that sediment sieved during
intake is 1/2 tonne in 3 months i.e. a half tonne in three months of sediment is removed by the
water plant from the river channel during intake. They dump this sediment within the farms
within the water plant compound. The sediment charecteristics is fine sand and soil
(reddish-brownish in colour) granules.
d) Water Plant at Oyani in Uriri Sub-county
Targets water supply to Migori Town and its environ and the plant is currently construction.
e) Gogo falls dam
The secondary data collected from Lake Basin Authority “RIVER PROFILE STUDIES
VOLUME IV, LOWER KUJA, IRRIGATION DEVELOPMENT ANNEX II HYDROLOGY
OCT 1985” reports that: Gogo Falls dam was completed in 1957. In 1961 a severe flood caused
the dam to be overtopped and resulted in failure of the right abutment wingwall and the
formation of 8M deep erosion gully around the right end of the dam. Grundy estimated a
discharge of 30,000Ft3/S (850M
3/S) for the same flood a few KM downstream at KB1…
Following this failure a roughly built cofferdam was constructed at the upstream end of the gully.

Project on Capacity Development for Gucha Migori River Basin Effective Flood Management in Flood Prone Area Integrated Flood Management Plan-Draft-
- 59 -
The cofferdam blocked off a section of the secondary spillway, reducing the level of security of
the main dam, and by 1979 had developed serious leaks. In order to restore the dam to its pre
1961 level of security a fuse plug spillway was constructed in 1981 in the erosion gully on the
right bank; it is designed to fail by overtopping and subsequent erosion.
The dam now has three distinct spillways. The first spillway is typicaly in use, except periods of
low flows. The second spillway comes into operation at a discharge of approximately 220 M3/S.
The third, fuse plug, spillway is designed to breach at a discharge of 390 M3/S, corresponding to
a 1 in 5 year flood. On failing, the initial outflow will be of the order of 300-400 M3/S.
Combined with flow already in the river this will result in a surge downstream of 700-300 M3/S.
It may be noted therefore that in 1 in 5 year flood at Gogo could result in a flood discharge of
similar magnitude to that estimated for 1961. Attention is drawn to this because flood estimates
provided for 1KB05 and the Project do not allow for failure of Gogo Falls fuse plug spillway.
Careful consideration needs to be given to this aspect in relation to safety of staff engaged in
hydrological monitoring at Gogo Falls, 1KB1A and 1KB05… 10
(Page A2-19)
f) Drainage Canals
In Gekano area in Nyamira Sub-county there is a drainage canal that is dug by community
through CDF funding. The canal flows into R. Gucha, its water comes from the hilly areas near
Gekano Secondary. In Esani area in Nyamira Sub-county there is also a drainage canal that was
dug by community through CDF funding and it is the current channel of R. Gucha. The purpose
of canal was to reduce the impact of flash floods in the area during rainy seasons especially the
can now protects the vehicular bridge, the road and it reduces inundation of the nearby school
compound.
g) Bridges and Culverts along R. Gucha Migori System
There are at least twenty seven (27) civil works structures constructed along the R. Gucha and
R.Migori as they join to form R. Gucha Migori. These structures include culverts, footbridges
and vehicular bridges. It was noted during site visit survey that some culverts were blocked by
debris. In R. Oyani a tributary of R. Gucha for example at Masaa Bridge there is
decommissioned gabion that was left within and in the middle of the river channel by the
contractor who constructed the bridge. At Daraja Aego in Nyatike Sub-county the river channel
is rocky with sandy riverbed and there are wooden logs in the river channel. These two place lie
within R. Gucha system. While in the Migori system at Esoit-Naibor area it was noted during
survey that the river had rocky riverbed and wooden logs were observed in the river channel.
And in R. Gucha Migori in many places wooden logs were observed in the river channel for
example at Wath Onger Bridge.
3.2 FLOOD CHARACTERISTICS AND SITUATIONAL DAMAGES IN GUCHA MIGORI RIVER
BASIN
3.2.1 Concept of Flood Characteristics and Situation of Damages in the Gucha Migori River Basin
There are three types of flood characteristics in the Gucha Migori River Basin as described in table
3.2.1 below:
10 Lake Basin Authority “River Profile Studies iv, Lower Kuja, Irrigation Development Annex II Hydrology Oct. 1985

Gucha Migori River Basin Project on Capacity Development for Integrated Flood Management Plan-Draft- Effective Flood Management in Flood Prone Area
60
Table 3.22.1 Floods impact on communities in the downstream during an ordinary year
Mark Flood Type Area
A Soil and sediment run off Upstream and
mid-stream of the river
basin
B Widespread and long-running inundation
which is caused by overflow leading to
breaking of the R. Gucha Migori riverbanks
and heavy backflow from Lake Victoria
Low-lying area at the
lower river basin)
C Flash floods from the neighbouring hills,
overflow of small tributaries of R. Gucha
Migori and permanent and seasonal streams
overflow
Upstream, Mid-stream
and downstream

Project on Capacity Development for Gucha Migori River Basin Effective Flood Management in Flood Prone Area Integrated Flood Management Plan-Draft-
- 61 -
Figure 3.2.1 Records of Flood Damage and Classification of Flood Characteristics in the Gucha Migori River Basin
Flood damage has a close relationship with natural condition and Socio-economic condition in a local area. Natural condition defines types of Hazards in a river basin and Socio-economic condition defines vulnerabilities and exposures. Moreover, it could be said that disaster (flood) damage is defined from both aspects. Characteristics of flood damage are analyzed using information of last chapter (Natural condition and Socio-economic condition) about each flood characteristics of A), B) and C) as above-mentioned.
A
B
C
Upstream
Downstream
Lumi River
A
B
C
Upstream
Downstream
Lumi River
A
B
C
Upstream
Downstream
Lumi River
A
B
C
Upstream
Downstream
Lumi River
A
B
C
Upstream
Downstream
Lumi River
A
B
C
Upstream
Downstream
Lumi River
&
A
B
C
Upstream
Downstream
Lumi River
&
A
B
C
Upstream
Downstream
Lumi River

Gucha Migori River Basin Project on Capacity Development for Integrated Flood Management Plan-Draft- Effective Flood Management in Flood Prone Area
62
Source: Revised by JICA Project Team, based on material of “Community and Development assistant of Disaster Prevention, Mr.
Mikio Ishiwatari(1997) Figure 3.2.2 Mechanism of Flood Damage
3.2.2 Soil and sediment run off in upstream middle stream and downstream
(1) Flood Characteristics from Natural Conditions During the rainy seasons of March to May and September to November there is heavy rainfall in the upstream area of Kisii and Transmara highlands. In both areas in the upstream there are heavy agricultural activities and many feeder murram roads, and therefore during rainy season a large amount of volcanic alluvial soil is washed away from the farms and the murram road that flows downstream at high velocity. The feature is as follows:
- Sediment discharge in the upstream is causing aggradation of river bed levels in the downstream that is gentle slope and low flow velocity. - In addition, flash floods occur in the upstream areas on the tributaries of R. Gucha and R. Migori. Natural Conditions that are described in the last chapter and Hazards in this area are shown as Table 3.2..
Table 3.2.2 Natural Conditions and Hazards in Upstream and Middle Stream Natural Conditions Hazards
Heavy rains in the Kisii and Transmara highlands Geography: A sharp inclination (High Altitude of 1867m in Kisii Highlands and 1808m in Transmara highlands and lowlands of less than 1151 at Wath Onger downstream)
Soil Erosion High velocity and tractive force High peak discharge
Many earthen (murram) feeder roads Soil erosion Sediment run-off
(2) Characteristics of Flood Damage from Socio-economic conditions Relationship between conditions on Social and Economic and Vulnerability/ Exposure to Natural disasters in the upstream and middle stream are shown below:
The upstream area is an agricultural rich area with farmers engaged in cash crop farming especially of tea and sugarcane plantations. There farmers also grow food crops like maize and beans. There is heavy infestation of eucalyptus tree in the upstream of Kisii highlands. In Transmara the forest cover is drastically reducing as many community members in the area adapt agricultural farming lifestyle at the expense of pastoralist lifestyle. This has enhanced soil erosion in the upstream..
Social and Economic
Vulnerability/ Exposure
Natural Condition
-Population growth -Urbanization -Environmental degradation -Poverty, etc
-Dangerous building -Unsafe area -Precarious livelihood -Low income -Inadequate health service
-gradient of river -width, elevation of river bed -geology -precipitation, etc
Hazards
-High-velocity flow -Overflow stream, dyke break -Inundation -Sediment discharge -Bank erosion, etc
Disaster Damage

Project on Capacity Development for Gucha Migori River Basin Effective Flood Management in Flood Prone Area Integrated Flood Management Plan-Draft-
- 63 -
Table 3.2.3 Conditions on Social and Economic and Vulnerability / Exposure in Upstream, Middle Stream and downstream
Socio-economic conditions Vulnerability/ Exposure
Population is 1,671,328 .
Density of population 1500~2200 person/km2
Density of population is high. Vulnerability is
high.
Cash Crop Farmers in the upstream and
midstream
Access roads to the farms and market are
many. Exposure to surface water run-off is
high
Riparian land owners in the downstream Farms are close to the rivers. Vulnerability is
high
Feeder roads and trunk route Structural vulnerability of roads and bridges
The basin is vast cutting across five counties Difficult to coordinate, integrate or collect and
analysis data of metrological, hydrological
(3) Flood Damage Mechanism
3.2.3 Flood Characteristics of Low-lying Area in the Lower Gucha Migori River Basin (B) (1) Flood Characteristics from Natural Conditions
Downstream area is inundated by flood water that over flow R. Gucha Migori and backflow from the
Lake Victoria. The overflow is a result of the river lack of flow capacity due to heavy sedimentation
of the river channel. The sedimentation is also heavy at the mouth of the lake leading to the backflow.
- The lack of flow capacity is caused by heavy sedimentation of Gucha Migori River. Aggradation of
river bed levels is generated by discharged sediment.
- Meandering nature of the river at a sharp bends leading to the river changing its course and
continuous breaking of the riverbanks.
- Continuous widening of the river due to sedimentation.
- In addition, due to rising water level of the Lake Victoria, flooding water has nowhere to go
(2) Characteristics of Flood Damage from Socio-economic conditions
Due to long term inundation, the floods have heavy impacts including damages to properties and
farmlands, destruction of crops, no-access to drinking water (the only borehole with good drining
water is located in a high depth inundated area), non-functioning of infrastructures facilities (severed
road, physically impossible to commute to school, flooding in hospitals and etc.) and loss of livestock
and poultry.
- River Gucha Migori breaks its banks and inundated more than two villages with Kabuto and Nyora
villages being heavily affected. During floods community members use canoes to access various
points of the affected areas.
- Five hundred and seventy nine (579) households were inundated (KRCS calculation puts six persons
per one household) and 3,474 residents were affected in the year 2012.
- Evacuees who are evacuated during floods are displaced for over one month. The evacuees move to
schools for temporary shelter but because of the damage to school facility during evacuation
sometimes the evacuees are denied a place to evacuate to and they have to stay in the cold or at the
raised places in their relatives’ homes.
l p b w “S - m d ” d “ l b l y/ xp ” are shown in

Gucha Migori River Basin Project on Capacity Development for Integrated Flood Management Plan-Draft- Effective Flood Management in Flood Prone Area
64
Table 3.2.4.

Project on Capacity Development for Gucha Migori River Basin Effective Flood Management in Flood Prone Area Integrated Flood Management Plan-Draft-
- 65 -
Table 3.2.4 Conditions on Social and Economic and Vulnerability/ Exposure in the Lower Gucha Migori River Basin
Socio-economic conditions Vulnerability/ Exposure
Highly-populated villages (population density of
400 people per square kilometer)
A big number of community members are
affected by flood
Fishing, agriculture and livestock rearing are the
major source of livelihood in this area
Agricultural activities are affected, lack of
grazing land for livestock, canoes are used for
evacuation and transport hampering fishing
activities all this affects the residents' livelihood
Encroachment of the riparian land by farmers. Riverbanks are weaken and easy to be breached
Unpaved community road Roads are severely damaged by floods
Education activities in the area
Schools are occupied as evacuation places. Long
period of education programmes being
suspended enhances school dropout rate in the
area.
Figure 3.2.3 Flood Characteristics in the Low-lying area of Lower Gucha Migori River
(2) Flood Damage Mechanism
Around upstream to middle stream, sediment outflow occurs heavily with farmland erosion caused by
furious rainfall and high velocity sheet flow. Interviews with Agricultural Officers in the upstream
revealed that there is heavy erosion during heavy rains and that the storm water flows through the
many murram feeder roads into the river channel.
In the upstream and midstream agriculture is the main economic activity with much of their fertilizer
being deposited in the downstream as silt that makes the community members in the downstream
consider floods as having some good effects to their agricultural land by providing good silt that add
value to agriculture in the area.

Gucha Migori River Basin Project on Capacity Development for Integrated Flood Management Plan-Draft- Effective Flood Management in Flood Prone Area
66
Figure 3.2.4 Flood Characteristics near the Gucha Migori River’s Tributaries
Figure 3.2.5 Flood Characteristics: Damaged riverbank after floods by R. Gucha Migori
3.2.4 Flash flood from the neighbouring hills, overflow of small tributaries of R. Gucha Migori and permanent and seasonal streams overflow(C)
(1) Flood Characteristics from Natural Conditions
Table 3.2.1 Natural Conditions and Hazards near the Gucha Migori ’ T b
Natural Conditions Hazards
Short-term torrential rainfall at hilly areas Arrival time of flood is short.
High peak discharge
Steam erosion occurs
(2) Characteristics of Flood Damage from Socio-economic Conditions
Table 3.2.2 Conditions on Social and Economic and Vulnerability/ Exposure near the Gucha Migori ’ T b
Socio-economic conditions Vulnerability/ Exposure
Highly-populated villages (population density
of 600 people per square kilometer)
A big number of community members living at
the Lwanda township are affected by flash flood

Project on Capacity Development for Gucha Migori River Basin Effective Flood Management in Flood Prone Area Integrated Flood Management Plan-Draft-
- 67 -
Agriculture, motorcycle transport and
livestock rearing are the major source of
livelihood in this area
Agricultural activities are affected, lack of
grazing land for livestock, and transport by
motorcycle is dirupted
Unpaved community road
The tarmac roads becomes the channel through
which the strom water flow on and aftermath of
flash floods the roads are severely damaged by
floods
Figure 3.2.6 Flood Characteristics: Run-off water from nearby hills flow downstream
Figure 3.2.7 Flood Characteristics: The road through which the run-off water flow on
Figure 3.2.8 Flood Characteristics: The rain run-off water flow into the township
(2) Flood Damage Mechanism
Flash flood in the area is caused by concentrated rainfall around the hilly areas and occurrence of
flood with large peak flow in short term into the Lwanda Township. In Tito and Ratieny area the
concentrated heavy rains flow at high peak into the small seasonal river course and the nearby
streams and thereby leading to floods in the area.

Gucha Migori River Basin Project on Capacity Development for Integrated Flood Management Plan-Draft- Effective Flood Management in Flood Prone Area
68
3.2.5 Flood Hazard Map in the downstream of Gucha Migori river basin
Community members in Lower Gucha Migori Sub-catchment have developed four (4)
community-driven flood hazard maps. The maps are for the following areas:
i) Kabuto-Nyora (areas mainly affected by overflow of R. Gucha Migori);
ii) Lwanda Misiwi (areas that are affected by heavy rainfall run-off steming from the
neaibouring hills);
iii) Ratieny Tito (areas that are affected by heavy rainfall run-off steming from the neaibouring
hills that flows into the seasonal rivers and streams); and
iv) Aneko, Aeko Tulu (areas affected by the old channel that overflows during the high flow
peaks and the backflow from the lake).
Example of the community driven flood hazard map is shown in the figure 3.2.8 below.
Drawing the map on the ground Drawn map is transferred to manila paper
Figure 3.2.9 Flood Characteristics: The Community-driven Flood Hazard Map
3.3 ANALYSIS ON FLOOD DAMAGE AND COUNTERMEASURE
3.3.1 Analysis on Flood Damage and Countermeasure for Earth and Soil Flown Out Area in the Upstream of Gucha Migori River Basin
(1) Summary of Damage and Measures
Based on the field survey done by this time, flood damage in the downstream of Gucha Migori River
was analyzed using by logic tree.
Issues to be solved kind of damage specific damage situation of damage its cause Flood damage in loss of agriculture Loss of crops and soil Reduction of agricultural Encroachment Upstream and midstream Land of wetlands, of Gucha Migori River Basin Heavy soil erosion
Figure 3.3.1 Analysis on Problem Tree

Project on Capacity Development for Gucha Migori River Basin Effective Flood Management in Flood Prone Area Integrated Flood Management Plan-Draft-
- 69 -
Figure 3.3.2 Analysis on Objective Tree
3.3.2 Analysis on Flood Damage and Countermeasure in the Long-term Inundated Area of the Downstream of Gucha Migori River
(1) Summary of Damage and Measures
Based on the field survey done by this time, flood damage in the downstream of Gucha Migori River was analyzed using by logic tree.
Issues to be solved kind of damage specific damage situation of damage its cause Siltation of Water channels deforestation Flood damage in loss of livelihoods destruction of property displacement of heavy rainfall in Downstream of Gucha people the upstream Migori River human activity Encroachment Of wetlands & riparian Back flow from lake
Figure 3.3.3 Analysis on Problem Tree
Point to cope with Measures to be taken Action Displacement of people evacuation centre evacuation drill Loss of farm lands capacity building riparian land protection Reduce encroachment law enforcement Sanitation & hygene reduce contamination of Water by toilets construct raised toilets Mitigation of flood water pollution clean water supply drill boreholes Damage in the downstream Of Gucha Migori River weakened human capacity building training on floods resillience education on flood introduce disaster education disruption of education management in schools Loss of lives preparedness to floods early warning system
Figure 3.3.4 Analysis on Objective Tree
Flood damage in Upstream
and midstream of Gucha
Migori River Basin

Gucha Migori River Basin Project on Capacity Development for Integrated Flood Management Plan-Draft- Effective Flood Management in Flood Prone Area
70
Table 3.3.1 Countermeasure Method to be considered in Gucha Migori River
Short Term
(1 year)
Medium Term
(2 – 5 years) (SCMP)
Long Term
(5 -10 years)
Structural and
non-structural
measures by
the government
(Large scale)
1. Mainstreaming Flood
Management concepts
into school curriculum
2. Construction of
mobilets or provision
of mobilets to every
homestead
1. Improvement of evacuation
route by constructing
footbridges, culverts and
bridges;
2. Construction of
check-dams in the
upstream and mid-stream
3. Improvement of drainages
including the storm run-off
water on the feeder road
1. Construction of dykes
along R. Gucha Migori;
2. Desilting of R. Gucha
Migori and its tributary;
3. River training of R.
Gucha Migori;
4. Gabion works at
breached riverbank ;
5. Improvement of Gogo
falls dam
Community
participatory
works/activities
with
government
assistance
including
structural and
non-structural
measures
(Medium scale)
1. Improvement of
agricultural practices;
2. Drilling of borehole
and installing water
tanks at evacuation
places
3. Conducting evacuation
drills (bi-annually);
4. Construction of
Retarding basins;
5. Construction of raised
toilets in evacuation
places
1. Construction of an
evacuation centre;
2. Construction of water
pans
3. Establishing an
integrated flood
management forum
(Umbrella WRUA)
4. Construction of a storage
facility that can store
food and household
properties of the
evacuees;
5. Improved
Irrigation-based
agriculture
1. Construction of health
facility with an
admission wing with
capacity of at least 50
and maternity wing;
Community
initiative
works/activities
including
structural and
non-structural
measures
(Small scale)
1. Construction of well
maintained flood
resistant toilets;
2. Developing flood
sensitization posters;
3. Promotion of low-cost
water treatment;
4. Advocacy on sanitation
and hygiene
1. Establishing community
based early warning
system;
2. Capacity building on use
of eco-san toilets
1. Raising of houses in
the flood affected
areas;
3.4 SELECTION OF FLOOD DAMAGE TO BE PREVENT PREFERENTIALLY
3.4.1 The Result of Workshop for Flood Damage Analysis by Community In Gucha Migori River Basin, the workshop was held to analyze the problems in Lower Gucha Migori
sub-catchment with WRUA members, WRMA-SRO staff and JICA project team members on 30th
and
31st October 2012.
As a result of analysis, the causes of flood are pointed out as below:

Project on Capacity Development for Gucha Migori River Basin Effective Flood Management in Flood Prone Area Integrated Flood Management Plan-Draft-
- 71 -
Table 3.4.1 Analysis for the causes of flood by interviewing to WRUA Members
Area Causes Characteristics of flood
Downstream of
Gucha Migori
River
Delta and lowland; Lack of flow capacity of river
channel in the downstream; Heavy rainfall in the
upstream; Deforestation by cultivation; Large
volume of sediment discharge
Wide spreading and long period
inundation in lowland of the
downstream
River meandering; Bank erosion Shifting of river channel in the
downstream
Small rivers in
hilly area Heavy rainfall; Lack of flow capacity
Flash flood from small rivers in hilly
area
Concerning flood damages, following analysis was done and was indicated the priority order lead by
WRUA members
Table 3.4.2 Damage Analysis and Priority Order Determined by WRUA Members
Priority by
WRMA-Kisii Theme Direct impact Secondary impact
1 Evacuation problem
-Disruption of evacuation
route
-People have to evacuate
- Death of people
- Doctor and medical service
doesn't reach the area
- Closure of school for
evacuation use
2 Destruction of infrastructure -Road
-Communication networks
- Public transportation system
does not work
- Community is divided
- People can't transfer
- Supplies don't reach the
market
- Delayed response from out
side
3 Destruction of farm land
(livelihood)
-Loss of crops
-Loss of livestock
-Lack of food
-Income decrease
4 Water contamination
-Contamination of
well-water
-Overflow of sewer from
toilet
-Outbreak of disease
During the workshop that was held in Gucha Migori River Basin, on 30th and 31st October 2012 the
community members were able to discuss the flood problem in Lower Gucha Migori Sub-catchment
vis-à-vis hazard, risks, vulnerability and capacity.
The result of the discussion is indicated below:
Table 3.4.3 Discussion on flood problem vis-à-vis hazard, risks, vulnerability and community capacity to cope
Hazards
Flood hazards includes: Heavy sedimentation of the river channels; Encroachment of the riparian
areas and wetlands and heavy rains at the hilltops (rapid speed for onset leads to delayed warning on
possible flooding scenario) Poor farming techniques leading to soil erosion in the upstream;
Lack of ability to control sedimentation through trapping the sediments in the upstream;
Lack of capacity for community in desiliting the river channels

Gucha Migori River Basin Project on Capacity Development for Integrated Flood Management Plan-Draft- Effective Flood Management in Flood Prone Area
72
Lack of machinery for desiltation;
Soil infertility in the area leading to cultivation of riparian land that are assumed to be fertile;
Lack of knowledge on small scale irrigation methods leading to assumption that cultivating near the
river leads to easy irrigation;
Uncontrolled gold mining activities ; and
Destruction of reeds in the wetlands. Reeds are harvested to be used for house construction.
Risks
Cultivation of riparian land leading to breaching of riverbanks;
Lack of security of the homes disserted as affected families evacuate;
Poor evacuation routes that lack facilities like bridges that lead to hazardous evacuation;
Lack of education programmes on issues of flood management and also interference of education
programmes leading to poor performances of people therefore reduced capacity on management of
floods;
Contaminated water sources;
Invasion of the villages and farmlands by aquatic animals like hippopotamus, crocodile etc
Poor farming practices which includes riparian land cultivations;
Poverty: This lead to destruction of forests through charcoal burning etc;
Lack of capacity in flood management; and
Poor construction techniques whereby community people lay low foundations for houses that are below the
flood depth.
Vulnerability
Farms: The farmlands are located near the rivers or near the water sources are vulnerable; Children: Mainly children aged between 2 years and 6 years are the most vulnerable because during
flooding disaster there is panic confusion that makes this children more vulnerable because of
inability to make informed decision;
The aged: Senior citizens in the community majorly sixty five and above years are most vulnerable.
There is lack of caring for the elderly system;
Settlements: There are no alternative places for resettlement and most community members do not
prefer evacuating to the schools or evacuation places because there is lack of established evacuation
place or centre and evacuation to raised places makes evacuees be at the mercy of those in charge of
the raised place whether school or any other facility;
Water points: Contamination of water bodies leading to epidermis and quick spread of diseases; and
Sick persons: The sick who are being treated while at home also vulnerable. This is because they are few
trained community health workers
Capacity
Lack of collective responsibility in addressing flooding disaster;
Poor communication skills: One major way of communicating is through barazas that some people do
not attend and others though they attended they disseminate wrong information to others.
Communication through mobile phones is often hampered due to lack of providers’ network;
Lack of technical know how in the community on preparedness;
Destructive cultural practices and believes;
Lack of community mobilization skills;
Lack of knowledge on proper management of evacuation place which includes how to live at the
evacuation places; and
Lack of institutionalized flood early warning system
3.4.2 Selection of Flood Damage to be prioritized
The flood damages in Gucha Migori River Basin is principally classified 3 types such as A) Soil and
sediment run off (Upstream and midstream of the river basin), B) Widespread and long-running
inundation which is caused by overflow leading to breaking of the R. Gucha Migori riverbanks and
heavy backflow from Lake Victoria and C) Flash floods from the neighbouring hills, overflow of
small tributaries of R. Gucha Migori and permanent/seasonal streams overflow.

Project on Capacity Development for Gucha Migori River Basin Effective Flood Management in Flood Prone Area Integrated Flood Management Plan-Draft-
- 73 -
Based on the evaluation of flood damages by communities as elaborated above, each impact from
flood damages are evaluated from the viewpoints of social impacts as “Number of affected people and
houses” or economic impacts as “Losses of merchandise, agriculture, transportation and sightseeing
industry”, and are shown in the following table.
Table 3.4.3 Selection of The Flood Damages Should Be Corresponding Preferentially
Flood type
Social impacts Economic impact
Priority order Number of
affected people
Number of
affected houses
Merchandise Agriculture Transportation Small Scale
business
A) Soil and sediment run off
Low Low Low High Mid Mid Low
B) Widespread and
long-running inundation which is
caused by overflow
leading to breaking of the R. Gucha Migori
riverbanks and heavy
backflow from Lake Victoria
High High Low High High High High
C) Flash flood Mid Mid Mid Mid High High Slightly high
In the 3 types of flood damages, it shows that the damage by “B) Widespread and long-running
inundation which is caused by overflow leading to breaking of the R. Gucha Migori riverbanks and
heavy backflow from Lake Victoria” has strongest impacts socio-economically, and next is the
damage by flash flood. The damage by “Soil and sediment run off” in upstream and midstream to
midstream has impacts to agriculture but the impacts to socio-economic matters is not so high, and
then the priority is low. The countermeasure to reduce the soil erosion and sediment outflow should
implement in long term perspective because it takes long time to be given the effects.
(3) Selecting Process FOR POSSIBLE Projects 4.1 Evaluation on 5 Criteria
4.1.1 View Point of Evaluation
Candidate countermeasures that are extracted in last chapter are studied in detail. On the basis of the
result of last chapter, 5 criteria; relevance, effectiveness, efficiency, impact and sustainability is
considered.
The project team defined 5 criteria as the description on following table, and then evaluated the
countermeasures by marking “A”, “B” and “C” according to these 5 Items.
Table 3.41.4 Definition of 5 Items for Pilot Project Selection
1 Relevance Requirements from the stakeholders, Needs of target area Dimension of economic damage and human suffering.
2 Effectiveness Degree of damage mitigation (Number of beneficiary, Reduction of submergence period, area and number of affected people)
3 Efficiency Cost effectiveness (It is evaluated by estimated qualitative dimension and degree of damage mitigation)
4 Impact Spreading effect within a same basin or to other areas Indirect effects

Gucha Migori River Basin Project on Capacity Development for Integrated Flood Management Plan-Draft- Effective Flood Management in Flood Prone Area
74
5 Sustainability Sustainability of maintenance and project effects (On the assumption of pilot project completion according to the design.)
*The project team defined these 5 items for the purpose of this study according to “DAC’s evaluation 5 items”
The Integrated Flood Management Committee (IFMC) Gucha Migori River Basin Meeting that was
held on 24th July 2014 was tasked with the responsibility of keenly reviewing the proposed
countermeasures based on the above elaborated evaluation criteria thereafter rank the
countermeasures based on the priority as perceived by the IFMC members.
Through the group discusssions wherein groups were divided into three and each group was tasked
with evaluation of the countermeasures. Group one was tasked with evaluation of the shortterm
countermeasures, while group two was tasked with evaluation of mid-term countermeasures and
group three was tasked with evaluation of the longterm countermeasures. The groups thereafter
presented to the plenary on their findings including prioritization of the countermeasures and the
implementation period of such countermeasures. The group presentations based on the evaluation,
prioritization of the possible countermeasures is herein captured in the table below:
Table 3.4.2 Proposed Activities in Community-driven Flood Management Action Plan Activity Relevancy Effective
ness
Efficiency Impact Sustain
ability
Ranking Implementation
period
Proposed countermeasures for Shortterm implementation 1) Developing flood
sensitization posters
High High High High High (1) Jan 2015 to Dec 2017
2) Conducting evacuation
drills (bi-annually);
High High High High High (2) Jan 2015 to Dec 2017
3) Drilling of borehole and
installing water tanks at evacuation places
High High High High High (3) Jan 2015 to Dec 2017
4) Construction of raised
toilets in evacuation places
High High High High High (4) Sept. 2014 to Sept.
20167
5) Advocacy on sanitation and hygiene
High High High High High (5) Jan 2015 to Dec 2017
6) Promotion of low-cost
water treatment;
High High High High High (6) Jan 2015 to Dec 2017
7) Construction of mobilets or provision of mobilets to
every homestead
High High High High High (7) Jan 2015 to Dec 2017
8) Improvement of agricultural practices;
High High High High Fair (8) Jan 2015 to Dec 2017
9) Mainstreaming Flood
Management concepts into
school curriculum
High High High High Fair (9) Jan 2015 to Dec 2017
10) Construction of well
maintained flood resistant
toilets;
High High High Fair High (10) June 2015 to June
2016
11) Construction of Retarding basins;
High High Fair High Fair (11) Jan 2016 to Dec 2017
12) Check dams in the
up-streams
High High Fair Fair Fair (12) Jan 2016 to Dec 2017
Proposed countermeasures for Mid-term implementation 1) Construction of an
evacuation centre
High High High High High (1) Jan 2015 to Dec 2017
2) Construction of water pans High High High High High (2) Jan 2015 to Dec 2020
3) Establishing an integrated flood management forum
(Umbrella WRUA)
High High High High High (3) Jan 2015 to Dec 2015
4) Construction of a storage facility that can store food
and household properties
of the evacuees
High High High High High (4) Jan 2015 to Dec 2017
5) Improved Irrigation-based agriculture
High High High High High (5) Jan 2015 and conitinuous
6) Capacity building on use
of eco-san toilets
High High High High High (6) Jan 2015 to Dec 2015
7) Improvement of
evacuation route by
High High High High Fair (7) Jan 2015 to Dec 2018

Project on Capacity Development for Gucha Migori River Basin Effective Flood Management in Flood Prone Area Integrated Flood Management Plan-Draft-
- 75 -
constructing footbridges,
culverts and bridges;
8) Construction of check-dams in the
upstream and mid-stream
High High High High Fair (8) Jan 2015 to Dec 2019
9) Establishing community based early warning
system;
High High High High Fair (9) Jan 2015 to Dec 2017
10) Capacity development in
proper farming methods in the upstream;
High High High High Fair (10) Jan 2015 to Dec 2020
11) Improvement of drainages
including the storm run-off water on the feeder road
High High High High Low (11) Jan 2015 to Dec 2019
Activities targeted for long-term implementation 1) Construction of health
facility (dispensary)
High High High High High (1) Jan 2015 to Dec 2020
2) Raising of houses in the
flood affected
areas;(Through capacity building)
High High High High High (2) Jan 2015 to Dec 2020
3) Construction of dykes
along R. Gucha Migori
High High High Fair Fair (3) Jan 2015 to Dec 2020
4) Gabion works at breached riverbank
High Fair Fair High High (4) Jan 2015 to Dec 2020
5) Improvement of Gogo
falls dam
6)
High High High Fair Fair (5) Jan 2015 to Dec 2025
7) Construction of the dams
in the upstream
Fair Fair Fair Fair Fair (6) Jan 2015 to Dec 2025
8) River training of R. Gucha
Migori
Fair Fair Fair Fair Low (7) Jan 2015 to Dec 2023
9) Desilting of R. Gucha
Migori and its tributary
Fair Low Fair Fair Low (8) Jan 2015 to Dec 2020

Gucha Migori River Basin Project on Capacity Development for Integrated Flood Management Plan-Draft- Effective Flood Management in Flood Prone Area
76
PROJECT IMPLEMENTATION PLAN OF FLOOD COUNTERMEASURES
5.1 FLOOD COUNTERMEASURES IN THE FLOOD MANAGEMENT PLAN
The Flood Management Plan defines the most prioritized flood damage as a result of the long term
inundation after the confluence of R.Gucha and R. Migori and hence R. Gucha Migori and that is the
downstream areaof the both R. Gucha and R. Migori and also experience the backflow of the L.
Victoria and the second prioritized flood damage as result of the Flash Flood from Tributary River,
heavy runoff from the neighbouring hills and this is in the upstream, midstream and downstream
areas.
The countermeasures against the above mentioned flood damage should be incorporated in the CMS.
In addition, planning of small scale projects that can be implemented at the WRUA scale should be
incorporated in the Lower Gucha Migori WRUA SCMP and in the SCMPs of the WRUAs’ in the
midstream and upstream.
5.1.1 Structural Countermeasures
1) Short-term Structural countermeasures should be implemented in the following order:
• Drilling of borehole and installing water tanks at evacuation places
• Construction of raised toilets in evacuation places
• Construction of mobilets or provision of mobilets to every homestead
• Construction of Retarding basins;
• Check dams in the up-streams
2) Mid-term Structural countermeasures should be implemented in the following order:
• Construction of an evacuation centre
• Construction of water pans
• Construction of a storage facility that can store food and household properties of the evacuees
• Improvement of evacuation route by constructing footbridges, culverts and bridges;
• Construction of check-dams in the upstream and mid-stream
• Improvement of drainages including the storm run-off water on the feeder road
3) Long-term Structural countermeasures should be implemented in the following order:
• Construction of health facility (dispensary)
• Construction of dykes along R. Gucha Migori
• Gabion works at breached riverbank
• Improvement of Gogo falls dam
• Construction of the dams in the upstream
• River training of R. Gucha Migori
• Desilting of R. Gucha Migori and its tributary
5.1.2 Non-structural Countermeasures
1) Short-term Structural countermeasures should be implemented in the following order:
• Developing flood sensitization posters
• Conducting evacuation drills (bi-annually);
• Drilling of borehole and installing water tanks at evacuation places
• Advocacy on sanitation and hygiene
• Promotion of low-cost water treatment;

Project on Capacity Development for Gucha Migori River Basin Effective Flood Management in Flood Prone Area Integrated Flood Management Plan-Draft-
- 77 -
• Improvement of agricultural practices;
• Mainstreaming Flood Management concepts into school curriculum
2) Mid-term Structural countermeasures should be implemented in the following order:
• Establishing an integrated flood management forum (Umbrella WRUA)
• Improved Irrigation-based agriculture
• Capacity building on use of eco-san toilets
• Establishing community based early warning system;
• Capacity development in proper farming methods in the upstream;
3) Long-term Structural countermeasures should be implemented in the following order:
• Raising of houses in the flood affected areas;(Through capacity building)
5.2 DRAFT IMPLEMENTATION SCHEDULE OF FLOOD COUNTERMEASURES
WRMA, LOGUMI WRUA, stakeholders and members of the IFMC and JICA Project Team proposes
draft implementation schedule of flood countermeasures as following.

Gucha Migori River Basin Project on Capacity Development for Integrated Flood Management Plan-Draft- Effective Flood Management in Flood Prone Area
78
RECOMMENDATION
Fundamental countermeasure against long term inundation in the downstream of Gucha Migori
River on a long term basis should be considered.
Collaboration with existing organization such as Sub-county Disaster Management Committee
and County Disaster Management Committe is necessary to implement a project that can enforce
resilience of community against flood.
Integrated approach in flood management is important and should be the driving force. The
integrated apprpach gives room for cooperation between upstream. Midstream and downstream. It
also encompasses the idea of stakeholder cooperation and collaboration which includes sharing of
knowledge, data and information.
When undertaking flood management activities it is important to consider age, sex, human
physical vulnerabilities etc. It is important that when structures are constructed there must be
consideration of the physically challenged persons within the community (persons with
disabilities).
Flood management is not based on one phase of floods alone i.e. response but effective flood
management considers all the phases of floods. The pre-flood phase that entails preparedness,
flooding phase that entails response and post-flood phase that entails rehabilitation, reconstruction
and developing plan for the next flood occurrence.
I) Non disaster or Inter disaster Phase
III) Impact Phase
II) Pre disaster Phase
IV) Relief (Emergency) Phase
V) Reconstruction or Rehabilitation / Recovery Phase
Figure 5.2 Phases of Disaster
Source: Trainers Training Manual on Flood Disaster Management developed under the Nyando Project
Figure 5.1 Phases of Disaster
Source: Flood Management Textbook for school pupils

WRMA Stage One Training washeld on 14th to 25th October 2013 atKEWI in Nairobi and Sunset Hotelin Kisumu respectively. It is prede-termined by the Project Design Ma-trix that WRMA staffs be trained ineffective flood management. Thetrainings are divided into three stag-es i.e. stage one trainees are trainedin effective flood management,stage two the qualified traineestrain other WRMA staffs and there-after the training spreads across toall the sub-regional offices andWRUAs are also trained. The stageone training was segmented intotwo phases: phase one was held inNairobi while the phase two washeld in Kisumu.The training in Nairobi commencedin earnest on 14th October 2014and the training was officiallyopened by Technical Manager
WRMA HQ Eng. Kinyua represent-ing the Chief Executive Officer(CEO) and the Financial ManagerWRMA HQ who both made theopening remarks.
The training in Nairobi was theoreti-cal in nature and entailed under-standing the concepts in flood man-agement and modalities of achievingeffective management of floods.Facilitation during this phase was
WRMA STAGE ONE TRAINING
During the entire training period inNairobi the participants showed high-est level of discipline and more im-portantly they were all keen with theirstudies with an average of 99% at-tendance in all the lectures.The lecture room was electrifying andglowed with hunger for knowledgefrom the participants and passion forsessions by the lecturers. Just like theysay “accounting for every drop of wa-ter” the participants were accountingfor every minute of the lecture bytheir attentiveness, raising issues ofconcern, participating in group worksmaking presentations and answeringevery question asked. It was awe-some!The modules covered during stage onetraining included: Cause and effect of������ Understanding flood manage-ment� Flood disaster management�Rainfall observation� Rainfall Dataand Statistical Processing� IntegratedRiver Basin Flood Management(IRBFM); Community managedFlood Disaster Risk Reduction(DRR); Vulnerability assessment�Developing a Community Flood Haz-ard ��� Flood Early Warning ���
�� � Community Based Flood Early�������� Introduction to IntegratedFlood Analysis System (IFAS) and
Global Flood Alert System(GFAS)� Evacuation �����
����� Evacuation Centre������ ���� Capacity forTransmitting and Commu-nication Skills� Communi-cation on Desired Infor-mation to Schools� Effec-tive Public Awareness
During the Stage OneTraining the participantsagreed to be time con-scious and to maintainhigh level of disciplethrough out the trainingperiod.
�!#��$"!7����������,��� �!"!#��������
�����!���"�!��!����#�����"!����"
�")������"!
WRMA Stage OneTraining in Nairobi
and Kisumu held from14th 25th October 2013
The training in Kisumu washeld at Sunset Hotel and itinvolved both theoretical andpractical engagement. In the-ory sessions the participantswere given lectures on effec-tive flood management andthe lecturers used Power-Point Presentation mode.Thereafter a field excursionexercise on community floodhazard mapping was carriedout. The Winam WRUAplayed host to the trainingwherein the WRUA benefit-ed by being part and parcelof Community Flood Hazard
Map development. The areasvisited that fall under the ju-risdiction of Winam WRUAwere Okana and Nyamwareareas and two CommunityFlood Hazard Maps for thetwo areas were developed.There was also a site visit torainfall station at Ahero Na-tional Irrigation Board Com-pound and also observation ofhigh flow measurements at R.Nyando. The participants alsovisited Kamagaga EvacuationCentre a structural measureconstructed under the JapanGrant Aid Nyando Project.
The training in Japan was charac-terized with numerous site visits.In the next month Issue of theIFM Newsletter Training in Ja-pan will be revisited. Do not missyour copy!From Tokyo to Osaka we madeseveral site visits to rivers, dams,museums, forest and had a closeview of Mt . Fuji on our wayfrom Tokyo to Osaka in a Shin-kasen. A site visit to Arakawariver and we could not believethat this was a flood-way i.e. aman made river that was builtpurposely to control floods. Theriver is well managed and there isheavy investment by Ministry ofLand, Infrastructure and transportthat in each of their offices forthe class A rivers managed there
is Disaster Information system that com-prises of equipped offices with Fibre op-tic cables, CCTV,C-Band radar ,TVbroadcasts. Data collected is real timewhich is relayed on the screens in theoffice this has empowered the Japanesein management of all kinds of disasterswithout causing wide spread destruction.The management of rivers in Japan is an-chored in River Law which is adhered to bythe citizens and implemented to the letter.For every river there is a dedicated river mu-seum and its history is preserved, the riversare continuously maintained, and we ob-served a multi purpose dam that was firstconstructed in 616 AD and is in perfect use todate over the centuries they have been build-ing more embankments. In every place wewent the welcoming was warm and thanks to
WRMA STAGE ONE TRAINING PROCEEDINGS IN KISUMU
SITE VISITS IN JAPAN
TRAINING IN JAPANWRMA including 3 mem-bers from the WRUA. Dur-ing the training in Japan theparticipants were taken tovarious sites in Japan butduring the sites visits therewere observations that indi-cated culture shock and theamazement of the meltingpot characteristics of TokyoCity. The following werenoted:A) Timeliness which is astrong characteristics of Ja-pan the City Shuttle leave ontime and the smallest delayby a passenger means miss-ing the Shuttle! Let’s put in acontext, “The welcome was
very warm and the staffhad prepared everything itmade us forget the jetlagwe were all sufferingfrom. Fast forward and thenext day some of usmissed breakfast andthat was lesson number1: that in Japan, allocatedtime for activities is strict-ly adhered to�!���������#�
����� ������Other notable issueswere work ethics, seafood, hospitability. Humil-ity etc. For more do notmiss the next month issueof IFM Newsletter!
Disasters mainly earthquake,Tsunami and floods haveoccurred in Japan over centu-ries. This disaster occurrencehas not led to submission ofthe people but in the spirit ofthe nation and her peopleJapan has exerted resiliencethat has seen the nation ris-ing up from the horrors ofhistory of disaster to becomeone of the most developednation in the world.Therefore the training in Ja-pan by WRMA staffs on Ef-fective Flood managementwas timely.The training in Japan en-tailed of 20 staffs from
��� ��������������!��!���������������" ��� ��������������!��!���������������" 32
through a workshop mode of approach whichentailed PowerPoint presentations and thereafterquestions and comments from the trainees and insome cases there were group discussions andthereafter group presentations.There were also various lecturers engaged dur-ing the Stage One Training and they includedleading Kenyan Professors, Japanese Expertsand Project Supervisor Gucha Migori.The participants were WRMA staffs mainlyfrom the Flood Management Unit in the Head-quarters and the three Project Areas inclusive ofthe Regional Offices that the Project Areas fallunder.
Raising on Flood� Planningand design of flood damagemitigation measures; FloodDamage Mitigation Non-Structural Measures includ-ing Community BasedMeasures; Flood damagemitigation structuralmeasures including commu-nity-based measures; Co-operation and Co-ordinationbetween Upstream andDownstream � Role of Co-operation and Coordination�Co-operation with CountyGovernment, WRUA andDDMC� Role of DistrictDisaster Management Com-mittee (DDMC ��
���!�&����&��� ������!"(�� � ��
�������� ������������9�7�� �������� ������������9�7��
���#���!������"+" �!������!(7�&�((�6��,��(�+����� ��+��%"!#�
WRMA STAGE ONE TRAINING PROCEEDINGS IN NAIROBI
�� ���"+" �!������,�����"!"!#�������
,"���9 �+���"�!�
���� ��,���
� �!"!#�����"�!��&��,�����"!"!#
$��!�����!�"�!�%��"!#����"!"!#
���"!"!#�"!� ��#����
���� �%"�+���"�!�"!� ��#����
�����!���"�!���&�������� �%"�+���"�!
��"�&"!#�����"!#������*��� �"�(%��9+���"�!�������!��)"((�#�
����+,"!#��&�,�:��%��� ��!�#���!%
���� ��,����%��"!#��,�����"!"!#��"!�0� �!
���������"!�����"�!1��"���"�����"+�(7��%,���%���
�!#�� ���#������+�")�����2�� �
NEWJEC for the entertainment the dinners,sushi, beef bowl and all the cold drinks thatcame in ice. More will be in the next is-sue of this newsletter but I leave youwith this quote: “The greatest lesson isenhancement of disaster preventionwith focus on ability by people needs;’ji jyo’ ‘kyo jo’ ‘ko jyo’ meaning “ my-self” each other” public”
��������6��&(��%(#���� ��%����6��6�"�
���#���� �(�" �� ����%�� �"!!��1�����&��%�%�("+�+"��

Inside this issue: Pg
Inside Story 1 WRMA Stage Three Training
2
Inside Story 2 WRMA Stage Three Training : Site Visit
2
Inside Story 3 Working Group Meet-ing in Machakos
2
Inside Story 4 3rd IFMC Meetings
3
on the document and thereafter adopt it. WRUAs formulation of flood management plans. sub-regional level. The Zero Draft IFMP was presented and dis-cussed and the counter-measures evaluated and prioritized by the partici-pants. The lesson learnt extracted from the Pro-ject was also presented to the participants. In closing remarks Eng. MATAGORO stated that the 5th IFMC was im-portant because the com-ments of the IFMC members would have been factored into the IFMP. He added that the IFMC will be tasked also with identifying the ac-tors to implement the IFMP thereafter he de-clared the meeting closed.
The fourth Integrated Flood Manage-ment Committee (IFMC) for Gucha Migori was held on 24th July 2014 at IFAD Hall in Migori County. The fourth IFMC for Gucha Migori was unique because it was largely organized by WRMA-LVSC South-ern Shoreline Gucha Migori. The preparatory works entailed develop-ing presentations, procure the hall for the meeting and inviting all the stakeholders to attend. On 24th July the meeting was therefore held and it was attended by various stakehold-ers. In the opening remarks session the JICA Project Team Leader Eng. Hideki SAWA speech was read by Project Supervisor for Gucha Migori Mr. NGIDA. In the speech the JICA Project Team Leader congratulated Gucha Migori IFMC for holding its 4th meeting which he referred to as the 1st post-project IFMC meeting. He therefore wished the IFMC well and stated that it was JICA Project Team that such meetings will be con-tinuous and the developed IFMP
would be implemented through the IFMC effort. He concluded his speech by stating that the good success will be when the IFMC structures will be repli-cated in other flood prone are-as. Eng. MATAGARO DTCM in charge of floods from WRMA HQ in his opening remarks stat-ed that the IFMC was noble committee that must be all in-clusive and integrated in nature. He explained the purpose of the 4th IFMC and stated that at the end of meeting it was expected of the IFMC members to criti-cal examine the IFMP, make comments and mutually agree
FOURTH GUCHA MIGORI IFMC MEETING
Water Reflections: Issue 1
Integrated Flood Management Newsletter
ON CAPACITY DEVELOPMENT FOR EFFECTIVE FLOOD MANAGEMENT
IN FLOOD PRONE AREAS
THE PROJECT
30th July, 2014 IFM Newsletter Issue No.013
Linking nature and people through technology
draft manual for non-structural measures against floods. Mr Maina of WRMA Loitoktok presented on draft manual for structural measures against floods. There were also group and plenary discussions in the course of two days event. The group discussions entailed the theme of the future activities of the WRUAs and plan of expansion of flood management in other 12 flood prone areas. Day one of the Taveta IFM Forum also entailed site visit to Eldoro prima-ry School that culminated with the handing over ceremony of the com-pleted structures. During the site visit the pupils dramatized a flood occasion in Taveta that surrounded the theme of early warning, evacuation, response and relief distribution. The head teach-er led the participants to the raised road, the installed culvert, the raised evacuation hall and toilets. The participants were therefore able to observe and have an understanding of
Day one of Taveta IFM Forum en-tailed presentations. Mr. Karimba of Isiolo WRUA made a presentation on the situation report of community based flood early warning (CBFEWS) in Isiolo, Mr. Joshua Ouma of LOGUMI WRUA made a presentation on the situation report of (CBFEWS) in Gucha Migori Riv-er Basin, Mr. Fred Reuna of Lower Lumi WRUA made a presentation on the situation report of (CBFEWS) in Lumi River Basin. There were presentations by the re-spective Pilot Project Area WRMA SRO. Mr. Kinyanjui of WRMA Isi-olo presented on Riverbank Protec-tion in Isiolo, Mr. Njihia presented on implementation of non-structural activities in Gucha Migori and Mr. Musau presented on evacuation cen-tre in Lumi river basin. There were presentations from WRMA HQ with Mr. Mwangi pre-senting on recommendations for nationwide expansion of (CBFEWS). Ms. Orina presented on
community-driven flood management activi-ties that can be undertaken in flood prone areas.
Linking nature and people through technology
1 4
IFM Newsletter Issue No. 013
TAVETA INTEGRATED FLOOD MANAGEMENT FORUM: SITE VISIT
Eng. Matagaro makes opening remarks
WRMA CEO Eng. Olum makes opening remarks
TAVETA INTEGRATED FLOOD MANAGEMENT FORUM Taveta IFM Forum was held on 24th and 25th June 2014 at Greenpark Hotel Taveta County. The Forum was graced by the WRMA CEO Eng. Philip OLUM, WRMA Direc-tor Hon. Jackson Mwalulu, the Taveta and Meru County government representatives, JICA Kenya Ms. Meri Fukai JICA Chief Advisor Eng. KONDO, JICA Project Team led by Eng. SAWA WRMA staff from the HQ, the three pilot site and all Flood Management Officer (FMO) and also the WRUAs from the three pilot project areas. In his opening remarks the WRMA CEO pointed out the im-portance of involvement of the County governments in flood disaster management. He elaborated that through the JICA Project structures had been constructed and O&M was critical and therefore he called for cooperation between WRUA, WRMA and respective County govern-ment. He also thanked the Japan Government for the con-tinuous support and assistance that Japan Government has offered to Kenya on flood management. The Chief Officer Taveta County on her part stated that Taveta County government was going to implement more structural measures. She also clarified that she was
going to share Taveta IFMP with Taveta County Executive in order to strengthen flood management. Eng. KONDO in his opening remarks explained the JICA Projects on flood management in Kenya. He further explained the scope of PCDEFM Project. He clarified that through the Project the institutional frame-
work had been strength-ened. He appreciated WRMA for deploying FMO in all the flood prone areas in the country. WRMA Board Director Hon. Mwalulu appreciated JICA efforts in Flood Management in Taveta. He called for stakeholders cooperation in flood man-agement. He stated that as a mem-ber of WRMA Board he was going to request WRMA to strengthen flood management de-partment. He thereafter declared the Forum offi-cial opened.
f
f
Awarding of certificates to observers Explanation of raised road
Official opening of evacuation hall Official opening of raised toilet
Eldoro pupils dramatize a drama with a flood theme on flood led
community evacuation during handover ceremony
COMMUNITY BASED FLOOD EARLY WARNING SYSTEM (CBFEWS)
The workshop on CBFEWS took place on 12th to 14th May 2014, as per the planned schedule. The pur-pose of the workshop was to as-semble CBFEWS which would be used in the next phase of the pro-ject and also for the WRUAs to acquire skills on how to assemble the FEWS. The Workshop was attended by 3 Isiolo WRUAs, 3 LOGUMI WRUAs, 3 Lower Lumi WRUAs, 1 Kabarnet WRUA, 1 Nairobi WRUA, 1 JICA Volunteer and 3 WRMA members. It is imperative to note that even before the workshop the observers for the Flood Early Warning Sys-tem were had been trained on the monitor and the gauge. With the assistance from KRCS, the observ-ers were trained on how to take and keep records. A tool set for the
maintenance of the CBFEWS was given to Isiolo, Lower Lumi and LOGUMI WRUAs. In Gucha Migori for example it was noted that the observer sta-tioned at Emuria Dikiri in Narok County relayed information by sending an sms to WRMA Kisii SRO, LOGUMI and Upper Ma-gor WRUAs’ Secretaries. River gauges and rain gauges with accessories of a sensor and alarm were installed in the three pilot areas. In Gucha Migori 4 rain gauges and 1 river gauge were installed. KRCS and Migori County par-ticipated in some of the installa-tion. During the Taveta IFM Forum observer from Gucha Migori was considered the best observer and was rewarded. It is imperative to note that the
WRUA members are being trained on assemble of the CBFEW gadgets and installed CBFEW in Isiolo
Description : Teachers and students participate in the
installation of the rain gauge and the sensor
Description : The sensor having been installed is being
tested and also explanation to the observer
on how to operate and manage the sensor
Description : Explanation to the teachers and students
during the installation of the rain gauge and
the sensor
Description : The rain gauge is fitted in its holder at the
weather station to enable its draining after
every rainfall in the area.
Installation of rain gauge at Kiong’ongi Highin Middle Gucha WRUA jurisdic$on
Installation of rain gauge at Emuria Dikiri High in Upper Magor WRUA jurisdic$on
Description : Installation of the rain fall gau ge gadget
sensor
Description : The rain gauge is fitted in its holder at the
Iterio Girls, the co ntainer will be drained
after every rainfall in the area.
Installation of rain gauge at Iterio Girls High in Upper Riana WRUA jurisdic$on
cooperation and coordination between the upstream and downstream is of uttermost importance to en-sure the success of the CBFEWS.
Capacity development for WRMA and WRUA entailed trainings. The WRMA Stage One Training was pre-determined by the Project Design Matrix that WRMA staffs be trained in effective flood management by JICA Project Team. Stage two en-tailed the qualified first stage trainees training other WRMA staffs from other flood prone regions. Stage three entailed trained WRMA staffs train-ing the WRUAs. The third stage training was therefore held in Migori County wherein LOGUMI WRUA and representatives of Middle Gucha, Upper Magor and Ongoche WRUAs also participating. The training com-menced on 19th May 2014 and ran for one week i.e. it was completed on 25th May 2014. The third stage training was officially opened by Eng. Matagaro from
WRMA HQ. In his opening remarks he pointed out that the WRUA were the institution that were actively in-volved in flood management at the grassroots. He therefore stated that for
WRUA to be effective in engaging in flood management activities there was need for the WRUA members to be trained. He concluded his speech by
WRMA STAGE THREE TRAINING
During the entire training period the partic-ipants showed highest level of discipline and more importantly they were all keen with their studies with an average of 100% attendance in all the lectures. The lecture room was electrifying and glowed with hunger for knowledge from the participants and passion for sessions by the lecturers. Just like they say “accounting for every drop of water” the lecturers and partici-pants were accounting for every minute of the lecture by their attentiveness, raising issues of concern, participating in group works making presentations and answering every question asked. The WRUA mem-bers raised pertinent issues concerning flood management and the lecturers were apt in their response. The lecturers were creative in ensuring that the trainees do not miss out on the knowledge. One example to note was Mr. Rueben Ngessa creativity in ensuring a technical oriented lecture on IFAS and modelling was simplified and understandable to the trainees. The lectur-ers used English, Swahili and sometimes Luo as language of instruction. The ses-sions were awesome! This actually indi-cates that flood management in Kenya has been taken by horns and both WRMA and WRUA were up to the noble tasks. The site visits were equally awesome expe-rience. The trainees were trained on under-standing the importance of accurate data collection, purpose of the river gauge sta-tions and the installed community based flood early warning gauges. There were transect walks in Sere and Angugo Villages that culminated by the trainees drawing the community flood hazard maps for these
two village. During the transect walk JICA Kenya representative Ms. FUKAI who was in attendance walked through the tough terrains with the lecturers and trainees. It was an awe-some experience. Day two of the site visit entailed execution of an evacuation drill at Nyora. The drill was executed in
During the Stage Three Training the partici-pants agreed to be time conscious and to main-tain high level of disci-ple through out the training period.
WRMA staff lectures as trainees keenly listen
Trainees draw community-based
flood hazard map
WRMA Stage three
Training in Migori
County held from
19th to 25th May 2014
The Working Group Meeting was held at WRMA-Athi Regional Office Hall in Machakos Town on 4th and 5th June 2014. The objective of the Working Group Meeting was to carryout post-project capacity assessment of WRMA. The evaluation was based on the previous assessment that had been carried out during the 1st and 2nd working group meeting that was held in 2012 and it was
premised on the following the-matic viewpoints: to develop a system for collecting and ana-lysing information/data with respect to flood phenomena; to analyse cause and effects of floods by using related infor-mation/data; to coordinate rele-vant stakeholders for better flood management in the com-munities; to technically advice WRUAs in developing the SCMPS; to formulate and up-
The third Integrated Flood Management Committee (IFMC) for Isiolo River Basin was held on 21st May 2014 at Rangeland hotel in Isiolo County. The meeting was well attend-ed by stakeholders within the pilot area river basin. Isiolo WRUA were well represented. WRMA HQ, WRMA RO and WRMA SRO was well repre-sented in the meeting. The Isiolo and Meru County gov-ernments were also represent-ed. The main objectives of the
meeting were: finalization of
IFMP, discussion on IFMC
constitution and report on riv-
er bank protection and FEWS
installation and operation.
During the meeting, the fol-
lowing discussions were
made: review of Isiolo SCMP
to incorporate flood manage-
ment activities, IFMP to be
incorporated in ENNCA CMS,
enhancement of monitoring
network for collection of more
reliable data in relation to
flood management. There was
need to escalate the activities
identified in draft IFMP as
finalization of the Plan is un-
derway. In the composition of
stakeholders for the IFMC, the
members agreed to include
media, this will ensure the
effective flow of information
relating to the floods to the
WORKING GROUP MEETING IN MACHAKOS
THIRD IFMC MEETING ISIOLO RIVER BASIN
THIRD IFMC MEETING LUMI RIVER BASIN
the overview of IFMP for fi-nalization. In his presentation he explained that the 4th IFMC meeting was scheduled for August 2014 and thereafter the meetings will be held an-nually. Eng. Kondo clarified the importance of understand-ing the role of WRUA, WRMA and Taveta County government in the implemen-tation of the IFMP. He also presented on discussion on current improvement and fu-ture revision of the IFMP. Mr. Robert Owaga, JICA Pro-ject Supervisor for Lumi River Basin presented on Report on the countermeasures at Eldoro Primary School and CBFEWS operation in Lumi River Ba-sin. During his presentation Eng. Kondo pointed out the
importance of CBFEWS as experienced in Isiolo where floods occurred but because the upstream community issued a warning the flood damage in terms of human lives losses was averted. Mr. Clement Ngida, JICA Project Supervisor for Gucha Migori River Basin presented on Establishment of CFMO in LOGUMI SC. In his presentation he ex-
The third Integrated Flood Management Committee (IFMC) for Lumi River Basin was held on 10th April 2014 at Greenpark hotel in Taveta County. The meeting was well attended by stakeholders within the ba-sin. Lower Lumi and Upper Lumi WRUA were well repre-sented. WRMA HQ, WRMA Athi and WRMA Loitotok was well represented in the meeting. JICA Project Team was also adequately represented. The Taveta County government was also represented. During the meeting there were various presentations that main-ly aimed at effective flood man-agement. After the confirmation of the previous minutes, Mr. Joseph Maina FMO presented
Linking nature and people through technology Linking nature and people through technology 3 2
stating that the WRUA members selected for the training were just but a few and it was expected that the trained members share knowledge and information with other WRUA members that did not actively participate in the third stage training. There were five WRMA staffs that were involved in the actual training of the WRUAs. The staffs prepared PowerPoint presentations based on the revised WDC Manual that had a module of flood management incorporated therein. The training entailed lectures in a workshop environment, site visits to LOGUMI SC and group discussions and presentations.
collaboration with KRCS Migori branch which was an indication of the future stake-holders cooperation. It is im-portant to note that the Migori County government also implemented an evacua-tion drill a week later in Kabuto.
IFM Newsletter Issue No. 013 IFM Newsletter Issue No. 013
Lecturer explains concepts to eager for knowledge trainees
WRMA STAGE THREE TRAINING PROCEEDINGS: SITE VISITS
Relentless lecturers during
3rd stage training
Lecture at KB05 stn Wath Onger
WRUA member explains operation of CBFEWS
KRCS staff explain execution of drill
Execution of an evacuation drill
Teacher explain the raised toilet at
Nyora
Wrap up meeting after a successful
execution of evacuation drill
Working Group Participants in deep discussion on assessment
plained the difference of the CFMOs in LOGUMI SC and Nyando River Ba-sin. He thereafter explained the current activities of the CFMOs. After his presenta-tion the Lower Lumi WRUA requested that the presentation which was in English be translated to Swahili that they may use to establish CFMO in their own area.
intended target commu-
nities. The implementa-
tion of riverbank protec-
tion was a success amidst
challenges like low com-
munity participation dur-
ing implementation, lack
of community incentives.
The members a greed to
change clause on ‘ edu- Participants in the 3rd Isiolo IFMC meet-
ing held on 21st May 2014 at Range-
land Hotel
date training manuals on flood management and to conduct training seminars for staffs in HQ, ROs and SROs; and to introduce the concept of river basin flood management plan (RBFMP) which should be set between CMS and SCMP.
Presentation on IFMP Finalization
KRCS staff demonstrates basic first
aid during the Nyora execution of drill
Mr. Mutie presents the previous
minutes to the participants
cation on disaster prevention’
to ‘education on disaster
management’. The proposed
constitution for IFMC was to
be amended by the members
and relevant clause be includ-
ed. The adoption of the con-
stitution was scheduled for
the next IMFC meeting.
Plenary session during IFMC