appendix 3. presentation slides unit cost vegetation ... · benchmarking study framework hydro one...
TRANSCRIPT

DISTRIBUTION UNIT COST VEGETATION MANAGEMENT BENCHMARK STUDY DISTRIBUTION UNIT COST VEGETATION MANAGEMENT BENCHMARK STUDY INTRODUCTION AND FRAMEWORKINTRODUCTION AND FRAMEWORK
William PorterDirector of Research, Development and Industry Intelligence
22‐Oct‐2015
Appendix 3. Presentation Slides

PURPOSE OF BENCHMARKING STUDY
The objectives of this study by CN Utility Consulting (CNUC), enabled by peer and longitudinal comparisons, are:• To help Hydro One comply with Ontario Energy Board’s
(OEB) directives (EB2013‐0416), • To identify best management practices, • To identify measurements to substantiate continuous
improvement, and• To recommend innovative approaches to ensure a
successful and cost‐efficient utility vegetation management (UVM) program over the next seven to ten years and beyond

THE VEGETATION MANAGEMENT STUDY TEAM• Project team members:
– William Porter: Director of Consulting of CNUC and Project Lead– Nina Cohn: Statistical Analyst [CNUC’s Senior Analyst]– Stephen Cieslewicz: President of CNUC and Project and Expert
Witness Advisor and Witness• 60 years of experience in Utility Vegetation Management
(UVM)
• Same project team that performed the 2009 UVM benchmark project for Hydro One
• CNUC team has provided expert testimony for numerous legal and regulatory cases
• CNUC team has produced several peer‐reviewed publications and scientific articles

CNUC BACKGROUND AND RELATED PROJECTSProjects relevant to the current Hydro One Benchmarking Study• CNUC has been performing comprehensive benchmarking
of UVM programs since 2002 and has data dating back to 1997.
• The team is comprised of the authors of the UVM Benchmark & Industry Intelligence publications in 2002, 2010, 2012 and 2014.
Numerous projects for utilities in which UVM benchmarking was a key component, examples include:
Hydro One, MidAmerican Energy, Connexus Energy, Ameren Illinois, Puget Sound Energy, BC Hydro, United Illuminating, and Avista Utilities

BENCHMARKING STUDY FRAMEWORK
Hydro One Distribution UVM Benchmarking Study
Survey Design, Participation,
and Deployment
A Review of Hydro One’s Program
Data Management Data Analysis Recommendations
and Conclusions
Regulatory and Literature Review
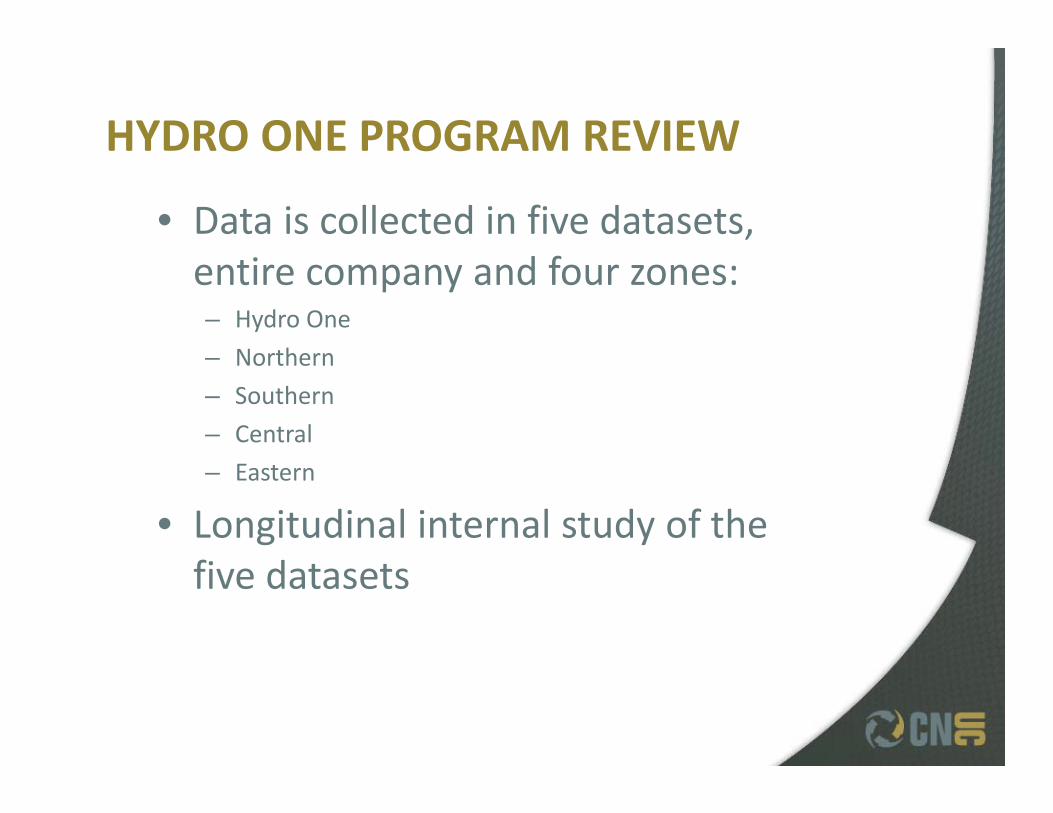
HYDRO ONE PROGRAM REVIEW
• Data is collected in five datasets, entire company and four zones:– Hydro One– Northern – Southern– Central– Eastern
• Longitudinal internal study of the five datasets

2009 CRITERIA FOR CHOOSING APPROPRIATE COMPARATORS• 2009 comparator locations based on climate conditions, growth, storm paths, and forest canopy cover:– Around Ontario– Northeastern North America– Western North America– Southeastern North America
• 2009 customer density:– ≤ 30 customers per circuit kilometre

CHOOSING CURRENT STUDY COMPARATORS
• Peer comparators– 2009 criteria– Unit and categorical comparisons– Total productivity factors
• General comparators– Policies and procedures– Best practices– Regulatory drivers– Workforce

COMPARATORS FOR 2015‐2016The following two slides are select lists of North American companies that have participated in CNUC benchmark surveys and who are potential comparators for this study
Additional companies may be invited
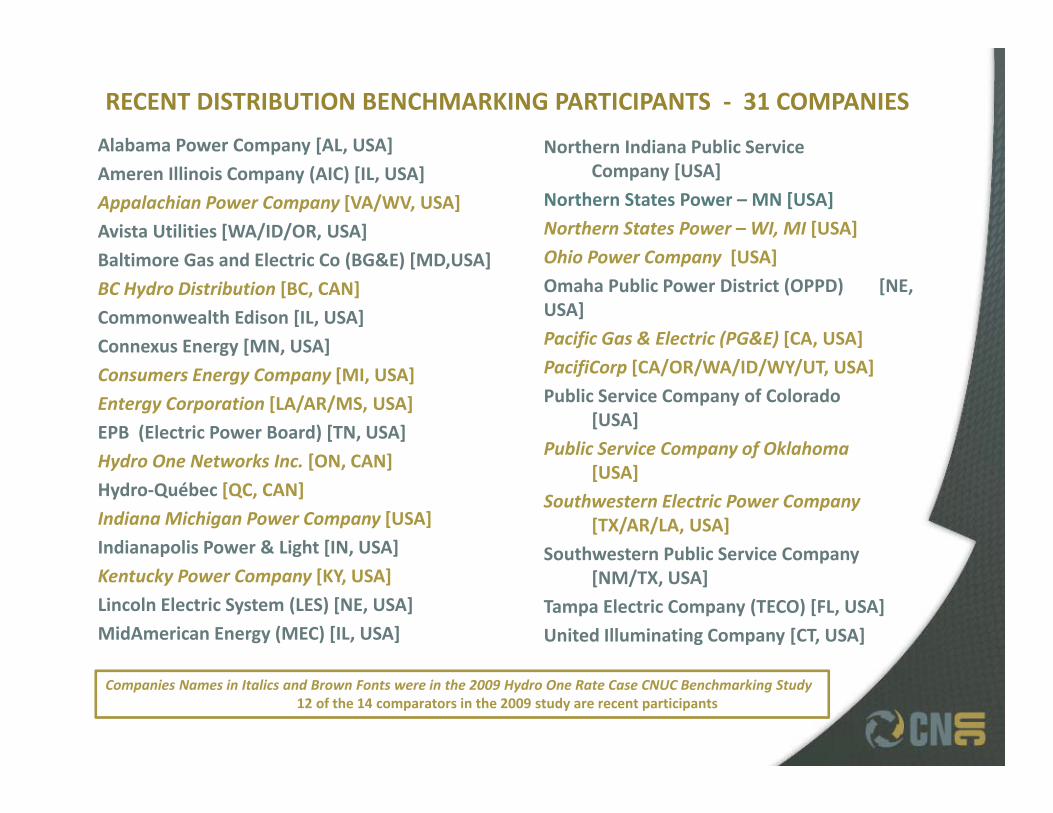
RECENT DISTRIBUTION BENCHMARKING PARTICIPANTS ‐ 31 COMPANIES
Alabama Power Company [AL, USA]Ameren Illinois Company (AIC) [IL, USA]Appalachian Power Company [VA/WV, USA]Avista Utilities [WA/ID/OR, USA]Baltimore Gas and Electric Co (BG&E) [MD,USA]BC Hydro Distribution [BC, CAN]Commonwealth Edison [IL, USA]Connexus Energy [MN, USA]Consumers Energy Company [MI, USA]Entergy Corporation [LA/AR/MS, USA]EPB (Electric Power Board) [TN, USA]Hydro One Networks Inc. [ON, CAN]Hydro‐Québec [QC, CAN]Indiana Michigan Power Company [USA]Indianapolis Power & Light [IN, USA]Kentucky Power Company [KY, USA]Lincoln Electric System (LES) [NE, USA]MidAmerican Energy (MEC) [IL, USA]
Northern Indiana Public Service Company [USA]
Northern States Power – MN [USA]Northern States Power – WI, MI [USA]Ohio Power Company [USA]Omaha Public Power District (OPPD) [NE, USA]Pacific Gas & Electric (PG&E) [CA, USA]PacifiCorp [CA/OR/WA/ID/WY/UT, USA]Public Service Company of Colorado
[USA]Public Service Company of Oklahoma
[USA]Southwestern Electric Power Company
[TX/AR/LA, USA]Southwestern Public Service Company
[NM/TX, USA]Tampa Electric Company (TECO) [FL, USA]United Illuminating Company [CT, USA]
Companies Names in Italics and Brown Fonts were in the 2009 Hydro One Rate Case CNUC Benchmarking Study12 of the 14 comparators in the 2009 study are recent participants

ADDITIONAL RECENT BENCHMARKING PARTICIPANTS ‐ SPECIAL TOPICS 17 ADDITIONAL COMPANIES
ATCO Electric [AB, CAN]Con Edison Inc. [NY, USA]Duke Energy Corporation [NC, USA]ENMAX Power Corporation [AB, CAN]Horizon Utilities [ON, CAN]KCPL [KS, USA]Manitoba Hydro [MB, CAN]National Grid [MA, USA]National Rural Electric Cooperative
Association [VA, USA]
New Brunswick Power [NB, CAN]Nova Scotia Power Inc. [NS, CAN]Puget Sound Energy Inc. [WA, USA]Saskatoon Light & Power [SK, CAN]SaskPower [SK, CAN]Southern Company [AL, USA]Toronto Hydro‐Electric System Limited
[ON, CAN]We Energies [MI/WI, USA]
Companies in 2009 Study not represented:
Allegheny Power [WVA/PA/MD/VA, USA]Central Maine Power [ME/NY, USA]

SURVEY DESIGN AND STRATEGYDefining and Gathering Data:• Utility characteristics• Productivity
Labour Hours, Work Types, Equipment, Costs, and Cycles
• UVM Practices• Safety• Reliability• Workforce characteristics• Regulatory Policies

METHODOLOGY FOR ANALYSIS
• Data Management and Analysis• Normalizing measurements to reflect total productivity factors
• Identifying Trends and Best Management Practices
• Modeling Efficiencies• Forecasting Workload

TOTAL PRODUCTIVITY AND EFFICIENCY FACTORS
– Tree density– Customer density/customer service– Weather/catastrophic events– Cost of living indices– Reliability measurements– Terrain and site characteristics– Forest composition and health– Worker turnover– Safety– Environmental Quality

THE STATE OF THE UVM INDUSTRY IN NORTH AMERICAIs Reliability Centered Maintenance (RCM) a standard of care for UVM?

UNDERSTANDING THE UVM INDUSTRYUTILITY VEGETATION MANAGEMENT (UVM) PROGRAM DRIVERS
1.5
2.0
2.5
3.0
3.5
4.0
4.5
5.0
5.5
6.0
6.5
2002 2006 2012 2013 2014
Weighted Ranking of the Importance of Each UVM Objective
1. Reliability
2. Safety
3. Comply with Specific Laws
4. Cost Effectiveness
5. Customer Service
6. Prevent Fires
7. Preserve and ProvideEnvironmental Quality
Most Important at the TopPrevious Studies Had Safety Ranked as the Number One Objective

SAFETY: HOW TO MEASURE SUCCESS•Electrocutions in the public sector
•Average percent of trees in contact at time of maintenance
•The frequency and costs of fires caused by trees and power lines
•incident reporting is not a true measure of line clearance safety
•Tree and power line contacts are an unsafe condition
•Accidents are not reported to external stakeholders by the majority of companies

RISK TOLERANCE0% 1%
8% 10% 15
%
15%
35%
35%
35%
50%
60%
60%
60%
70%
70% 75
% 80%
0%
10%
20%
30%
40%
50%
60%
70%
80%
90%
BB BD AH AA AP AZ AF AO BE AN AE AW AR AG AI AD AJ
Percen
t of Trees in
Con
tact
Company Code
Trees in Contact at Time of MaintenanceSample Size: 17
Average: 40% Q1: 15% Median: 35% Q3: 60%

COST: WHAT IS THE VALUE OF EFFECTIVE UTILITY VEGETATION MANAGEMENT?
• Electric reliability has gained the most attention by regulators
• The risk of electrical contacts, accidents, fires and increased customer interruptions has been significant enough to make a case for adopting best management practices in a UVM program

PREFERRED VS. DEFERRED MAINTENANCE
If a property owner, private tree company or worst of all, a child enters a tree that obscures the presence of a single phase primary tap and there is an injury or fatality, then the utility has suddenly lost all of the gain from taking a risk with trees that have low reliability impact.

GETTING TO KNOW THE CUSTOMER
40%
5%
25%
10%
0% 5% 10% 15% 20% 25% 30% 35% 40% 45%
The CSS information is available to theforestry notifiers/planners
Vegetation data and permissions collected bythe UVM program is stored in the CSS
A record is kept on customers that havevegetation near overhead lines on their
property
The UVM dept knows percent of overheadcustomers have trees that routinely require
UVM
Percent of Companies
Recorded Data about Customers Who Own Properties That Require UVM

INDUSTRY PERCEPTION OF WORKLOAD
• The UVM customer base is a subset of the utility customer population
• How many customers (meters) have UVM performed on their property? Question asked in survey
• 45% of utilities perceive their workload as 100% of their electric customers
• Is UVM is viewed as a system correction more than a customer transaction?

SYSTEM RELIABILITY
The efficacy of a program isn’t just measured by how long it has gone without an outage but rather how well it can prove the conditions that cause an outage won’t happen in the future.

RELIABILITY: A CHANGE IN UVM PRACTICES• In the past, the UVM goal was to create enduring
airspace between trees and conductors • Current UVM objectives have been realigned to fit
budget constraints, realistic schedules and greater tolerance for tree/wire conflicts
• Reliability metrics have been used to measure performance and direct UVM programs
• Changing reliability expectations has led to a shift in the primary purposes for performing UVM
• UVM has shifted from the singular endeavor to keep all vegetation away from the conductor to a reduction of outage consequences

RELIABILITY CENTERED (RC) UVM CHALLENGES
• What causes the system to fail the most often?
• What kind of outages have the longest duration?
• Which outages impact the most customers?
• Which outages interrupt the most load?

TRENDS IN THE UVM INDUSTRYVEGETATION‐RELATED SAIDI/SAIFI TO MEASURE UVM EFFICACY
70%
59%
48%
4%
4%
0% 10% 20% 30% 40% 50% 60% 70% 80%
SAIFI
SAIDI
CAIDI
CAIFI
MAIFI
Percent of Companies that Use Each Metric for UVM
Reliability Metrics Used for Utility Vegetation Management Planning and Evaluation
Sample Size: 27

PROBLEMS WITH UVM RELIABILITY CENTERED MANAGEMENT
• Less emphasis on safety
• Increased cost of reactive maintenance
• Unpredictable reliability once trees are in contact with conductors
• Down stream customers experience more tree‐related outages
• Inadequate emphasis on grid resiliency to high intensity, major, or widespread events that cause trees to fail into power lines

DESIGNATING MAJOR EVENT DAYS93%
89%
85%
84%
82%
80%
78%
75%
73%
72%
69%
68%
68%
57%
49%
47%
45%
44%
44%
7%
11%
15%
16%
18%
20%
22%
25%
27%
28%
31%
32%
32%
43%
51%
53%
55%
56%
56%
0%
10%
20%
30%
40%
50%
60%
70%
80%
90%
100%
AP AW AD AF BD AE AA AI AC AG AJ BB AZ AK BG AR AO AH BE
Percen
t of T
ree‐Re
lated Outages
Company Code
Major versus Non‐Major Event Tree‐Related Outages: Average Annual Percent in Each Category for Years 2010 ‐ 2013
Non‐Major Event Major Event
Sample Size: 19 Averages: Non‐Major Event: 69% , Major Event: 31% Median: 72%

ARE INDUSTRY RELIABILITY METRICS A GOOD MEASURE OF VEGETATION CONDITIONS?A COMPARISON OF COMPANIES X, Y AND Z
• X is a large UVM reliability‐centered maintenance company with best‐in‐class electric reliability performance
• Y is a large compliance‐centered, multiple objectives performance company with best‐in‐class UVM performance
• Z is a small company with best‐in‐class reliability, but an underfunded UVM program with increasing levels of liability risk

TREE‐RELATED SAIFI COMPARISON
0.11
0
0.11
0
0.11
2
0
0.1
0.2
0.3
0.4
0.5
0.6
0.7
0.8
0.9
1
J C T S Y Z X O R E Q N K G H A I B L M
Tree
‐Related
Non
‐MED
SAIFI
Company Code
Tree‐Related Non‐Major Event Day SAIFI Five‐Year Average 2009 ‐ 2013
Average: 0.258 Q1: 0.110 Median: 0.165 Q3: 0.314

TREE RELATED SAIDI
10.7
11.6
17.3
0
50
100
150
200
250
J C S Z X O Y R T Q H E K N G I A B L MTree
‐Related
Non
‐MED
SAIDI in Minutes
Company Code
Tree‐Related Non‐Major Event SAIDI Five Year Average 2009 ‐ 2013
Average: 51.3 Q1: 14.0 Median: 24.9 A3: 60.0

TOTAL NUMBER OF TREE‐RELATED OUTAGES0.015 (0.024
/mile)
0.081 (0.131/m
ile)
0.291 (0.168/m
ile)
0.00
0.05
0.10
0.15
0.20
0.25
0.30
Y S B H J T A C Z Q G O K E R N L I M X
Non
‐MED
Tree‐Re
lated Outages
Per P
ole Kilometre
Company Code
Non‐MED Tree‐Related Outages per Distribution Pole KilometreFive Year Average 2009 ‐ 2013
Average: 0.111 Q1: 0.068 Median: 0.089 Q3: 0.134

RELIABILITY CAN IMPROVE WHILE THE NUMBER OF TREE‐RELATED OUTAGES INCREASE
2006 2007 2008 2009 2010Outages 8,906 12,194 13,918 14,865 16,197SAIFI 0.0822 0.1073 0.1297 0.1237 0.0993
0
0.02
0.04
0.06
0.08
0.1
0.12
0.14
0
2,000
4,000
6,000
8,000
10,000
12,000
14,000
16,000
18,000
Non‐M
ajor Event SAIFI
Num
ber o
f Non
‐Major Event Outages
Comparison of Non‐Major Event Outages and SAIFI for Company X 2006 ‐ 2010

AN EFFECTIVE UVM PROGRAM HAS TO LOOK BEYOND THE CURRENT RELIABILITY PICTURE
Suburban: r = 0.868, p < 0.001
Rural: r = 0.960, p < 0.001
0
1
2
3
4
5
6
0 2 4 6 8 10 12 14
Average Num
ber o
f Outages per Circuit
Number of Years Since Vegetation Was Managed
Average Number of Tree‐Related Outages per Circuit versus Number of Years Since Vegetation Was Managed
Suburban Averages Outages Rural Averages Outages

WHAT DO CUSTOMERS PAY FOR UVM?RESIDENTIAL 38% AND INDUSTRIAL/COMMERCIAL 62% OF ELECTRICITY SALES
If 33% of all electric customers receive UVM on average every 4 years the Median at time of work cost per UVM customer is estimated to be $298
$16.38
$37.14
$39.00
$0
$20
$40
$60
$80
$100
$120
$140
$160
C U R O V H W X AA AB AC E AD AE AF G S AG AI Z Y I T AJ N L J K B M
Cost per Customer in
CAD
Company Code
Average Annual Cost of UVM per CustomerSample Size: 30
Average: $35.88 Q1: $17.01 Median: $26.98 Q3: $54.60
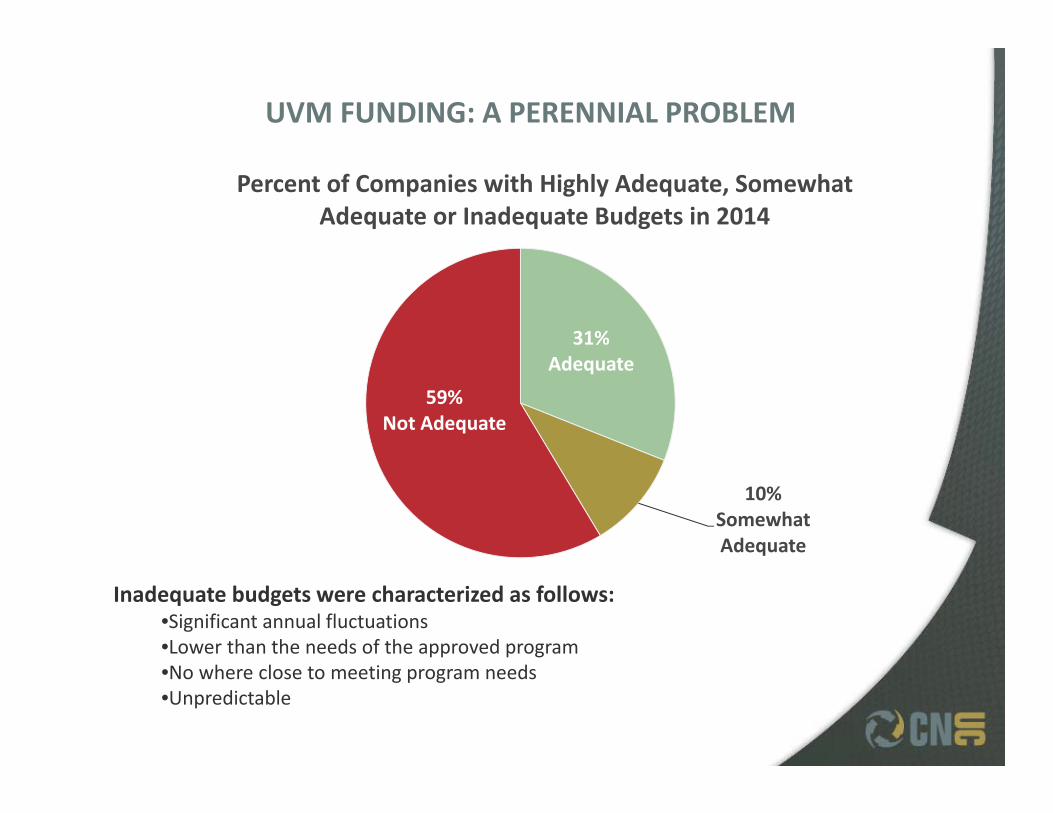
UVM FUNDING: A PERENNIAL PROBLEM
Inadequate budgets were characterized as follows: •Significant annual fluctuations •Lower than the needs of the approved program•No where close to meeting program needs•Unpredictable
31%Adequate
10%Somewhat Adequate
59%Not Adequate
Percent of Companies with Highly Adequate, Somewhat Adequate or Inadequate Budgets in 2014

INDUSTRY RELIABILITY INDICES ARE INADEQUATE FOR ACCESSING THE RELATIVE EFFICIENCY OF A PROGRAM
• Outages per kilometre is a better indicator of vegetation conditions
• Measurement of program efficiency should not rely primarily on reliability
• Program efficiency should include other stated objectives of UVM

KEY TO A SUCCESSFUL UVM PROGRAM, ADEQUATE FUNDING AND CUSTOMER ACCEPTANCE
Utilities can facilitate the relationship between the utility, the regulator and the customer by improving the data they collect and by providing clear analysis that proves compliance to UVM regulations and shows improvements in performance.

HYDRO ONE STUDY HORIZONS
• Best management practices and opportunities for gaining efficiency
• Balanced objectives and risk tolerances• Measurable performance against industry trends
• Modeling the system for various scenarios• Forecasting costs, including cost of deferred maintenance
• Opportunities for capitalization of UVM

QUESTIONS?

Distribution Total Factor Productivity Study
STEVE FENRICK
OCTOBER 22, 2015
Stakeholder Engagement Meeting

Communications• Strategic Communications Planning• Technology Assessments: Private vs. Commercial• Land Mobile Radio Design• Radio Path & Propagation Studies• Fiber WAN Design & Procurement• GIS Mapping & Integration of Communication Assets• Microwave & Fixed Data Design & Procurement
Utility Automation• Technology Work Plans• Integration, Testing, Training and
Support• Cyber Security & IT Assessments• Substation and Distribution
Automation• Strategic Planning• Consulting and Procurement
services on SCADA, AMI/AMR, OMS, GIS, CIS, and others
Engineering & Design• System Planning Studies• Distributed Generation Strategies• Transmission Studies• Power Factor Correction Studies• System Loss Evaluation• Substation Design• Line Design
PSE Services 2
• Load Forecasting• Statistical Performance
Measurement (Productivity & Benchmarking)
• Market & Load Research• Alternative Regulation• Demand-Side Management
(DSM)• Value of Service• Other Economic Studies
Economics & Research Rates & Financial Planning
• Revenue Requirement Studies• Class Cost of Service Studies• Rate Design• Key Account Services• Rate Comparisons &
Competitive Assessments• Strategic & Financial Planning

My ExperienceSteve Fenrick (Leader, Economics & Market Research)
Worked on empirical TFP and benchmarking research for 3rd
Generation IR (while at Pacific Economics Group) Engaged by the Ontario Energy Board to produce the
OM&A annual stretch factor updates (2010-2013) Peer group benchmarking update Econometric benchmarking update
Provided TFP research in Enbridge Gas (2013) case Benchmarking and TFP expert on behalf of the Coalition of
Large Distributors during the 4th Generation IR proceeding (2013)
Benchmarking expert on behalf of Toronto Hydro ICM (2013/2014) Custom IR (2014/2015)
Benchmarking expert on behalf of Hydro Ottawa Custom IR (2015)
3

Agenda 4
Section 1: Project Overview
Section 2: Empirical Approach
Section 3: Incorporating TFP Drivers into the TFP Measure
Section 4: Project Next Steps

Project Overview
Board’s March 12, 2015 Decision in EB-2013-0416, page 17:
“The OEB sees value in Hydro One measuring its own total factor productivity over time to be able to demonstrate improvement in productivity to its customers and the OEB. The OEB leaves it to Hydro One to determine its preferred total factor productivity study method. However, the period of the study should include years at least going back to 2002. The results of the study must be filed as part of Hydro One’s next rates application.”
5

Project Overview
In 4th Generation IR, the Board Staff’s expert developed industry TFP trends
The Board’s method was based on developing an X-factor for rate adjustments, not for providing a comprehensive view of performance
Board’s November 21, 2013 Decision in EB-2010-0379 stated on page 17: “The Board acknowledges that achieved industry TFP may be negative due to unforeseen events and/or situations in which costs may be incurred with no corresponding increase in output.”
A more “comprehensive” TFP measure is needed to properly demonstrate the performance of Hydro One
6

Project Overview
Project Objectives include:1. Provide the Board and stakeholders with Hydro One’s own
TFP trends starting in 2002 through 2022 Variable projections estimated by Hydro One will be used to
calculate TFP projections from 2015 and beyond
2. Build upon the 4th Generation IR TFP methodology by incorporating additional cost drivers into the analysis
3. Clearly explain the basis for weighting and incorporating these additional TFP drivers Wherever possible, use empirically-derived evidence
4. Provide high-level recommendations that Hydro One can use to inform its future planning or reporting processes
7

Empirical Approach
FromtheStaff’sconsultant PEG in4th GenerationIRproceeding: ∆ ∆ ∆
Outputs = customers, total kWh deliveries, system capacity peak demand
Inputs = Capital & OM&A
Output choice was logical when setting a TFP trend for a rate setting application, because revenues are primarily driven by these three outputs
However, in demonstrating the trend in performance of a particular distributor, the fact that input quantities (i.e. cost trends) are a function of other possible outputs must be recognized and incorporated into the study
8

Empirical Approach
Other possible TFP drivers that the TFP study will investigate: Changes in reliability (SAIFI & SAIDI) during the 2002-2022 period
Changes in customer service levels
Environmental output
Regulatory outputs and costs
Input price inflation of Hydro One
Other drivers as they may be uncovered during the course of the project
9

Incorporating TFP Drivers
Two possible approaches:1. Empirical modeling
2. Hydro One internal “added cost” estimates
Wherever possible, PSE will prefer empirical modeling based on externally-derived evidence in incorporating TFP drivers
If no model can be developed, Hydro One “added cost” estimates will be used if:1. PSE is convinced the variable in question is crucial
to properly demonstrating Hydro One’s TFP performance trend, and
2. Reasonable estimates can be obtained
10

Incorporating TFP Drivers
Working Assumptions:1. Reliability is an “output” of an electric distributor
and is positively correlated with cost (i.e., if reliability improves then cost is likely to increase)
2. Customer service is an “output” and is positively correlated with cost
3. Meeting more stringent environmental or regulatory requirements is an “output” and is positively correlated with cost
11

Project Next Steps
1. Modify TFP study plan based on feedback2. Data and information gathering
Hydro One interviews on possible TFP drivers Hydro One data and information gathering Industry sample data gathering
3. Analysis on incorporating TFP variables Reliability, customer service, environmental &
regulatory, input price, other
4. Finalize TFP estimates and write report5. TFP report to be filed in Hydro One’s next rate
case
12

Steve Fenrick
Leader, Economics & Market Research Group
608-268-3549
608-334-5994 (mobile)
13
Thank You:

DISPUTES & INVESTIGATIONS • ECONOMICS • F INANCIAL ADVISORY • MANAGEMENT CONSULT ING
Stakeholder Session #1
Distribution Pole Replacement
and Station Refurbishment Unit
Cost Benchmarking Studies
October 22, 2015

Section 1 »
Section 2 »
Section 3 »
Section 4 »
Section 5 »
Overview
Approach
Process and Metrics
Next Steps
2
Agenda

Overview
Navigant
3
» A global and independent consulting firm, Navigant’s reputation is for assisting our clients across core
industries to address the critical opportunities and challenges of new markets, evolving customer demands,
regulation and business model changes, new technologies, risk, and disputes
» With more than 400 consultants, Navigant’s Global Energy Practice is the largest energy management
consulting team in the industry. Our team of experienced professionals serves leading energy companies
to address their most complex business opportunities and challenges

Overview
First Quartile Consulting
4
» First Quartile Consulting is the leading provider of benchmarking services in the transmission and distribution
and customer service areas for utilities
» Established in 2007, the leadership team has was together for 20 years prior to founding of 1QC
› The 1QC team began conducting large-scale transmission and distribution benchmarking studies in 1989
› Annual studies under the First Quartile Consulting name began in 2008
» Beyond the annual studies, the firm conducts many different tailored benchmarking studies each year for
individual clients, designed to meet specific needs, be it deep concentration on a particular area (e.g. work
management approaches, capital planning, field construction, etc.), or a broader view across geographies or
outside the utility industry

Overview
Goals and Objectives
5
Design and implement a robust benchmarking study of Hydro One’s distribution
costs
The benchmarking study will:
» Include an appropriate group of businesses to use as comparators/peers to Hydro One, taking into account a
number of characteristics, including asset demographics, geography, customer characteristics, etc.;
» Quantify and evaluate Hydro One’s practices and unit costs for distribution pole replacement and distribution
substation refurbishment work relative to the peer group, taking into account cost drivers and differentiating
characteristics;
» Ensure a common understanding of the comparison criteria through the use of clear definitions;
» Explore cost variations and associated practices and methods;
» Make recommendations on practices that could be augmented or adopted to realize efficiency gains;
» Engage stakeholders in regards to the peer group selection criteria, comparison metrics, and preliminary
findings and recommendations.

Approach
Project Plan
6

Approach
Panel Design
7
Approaches to creating a pool of companies for a benchmarking study
Approach 1: Concentrate only on comparing overall performance outcomes
Panel 1: Select a homogeneous panel
Approach 2: Investigate operating practices in order to find the best practices
Panel 2: Select a panel of different utilities
Approach recommended for Hydro One:
a. Study goal is to look at both performance and practices
b. Select a “balanced” panel to include like companies as well as different companies
c. Some factors to consider in selecting peers for Hydro One:
� Size of company
� Density of the territory
� Regulatory regime
� Ownership structure
� Weather and storm patterns
� Ability to collect financial, operating, and practice data

Approach
Peer Group Selection
8
Step 3: Filter Existing
Benchmarking Community
Step 1: Identify demographics (e.g., volume, type and age of Dx poles, number and type of Dx substation
projects, climate, geography, customer density.)
Step 2: Establish appropriate sample size
Step 4: Identify and
Recruit Additional
Participants
Benchmark Sample
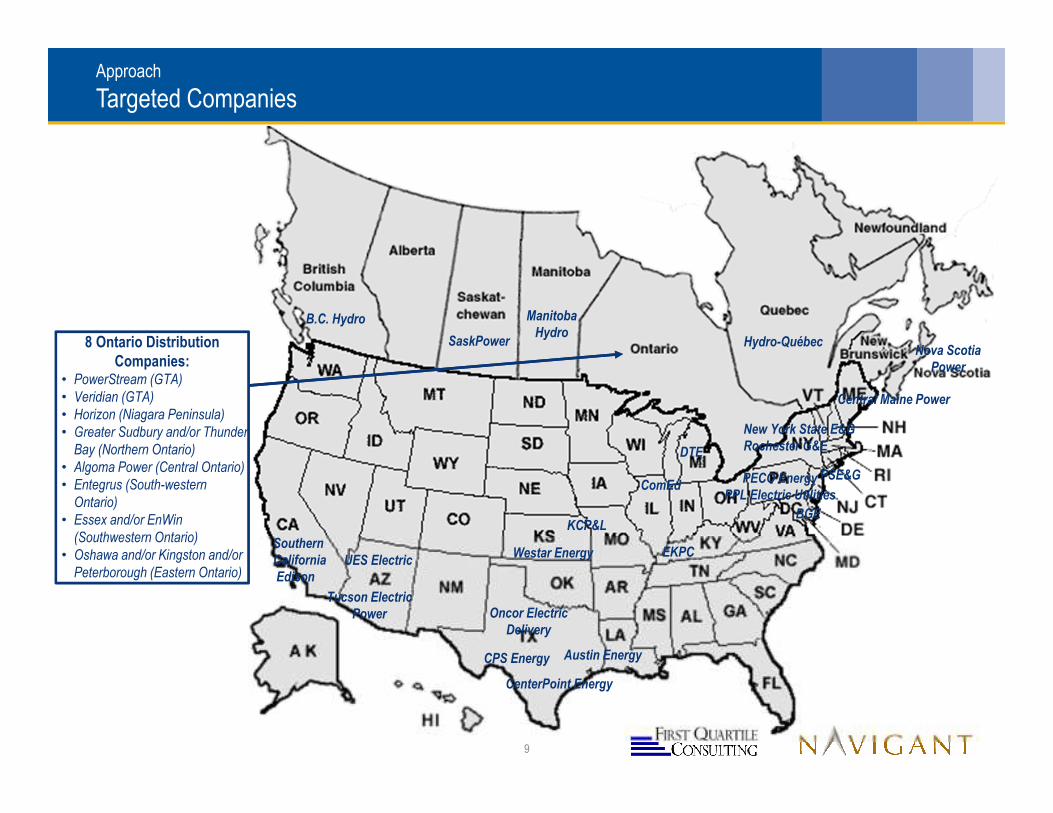
Approach
Targeted Companies
Oncor Electric
Delivery
KCP&L
ComEd
New York State E&G
Rochester G&E
B.C. Hydro
Tucson Electric
Power
Hydro-Québec
Southern
California
Edison
Austin Energy
CenterPoint Energy
CPS Energy
Westar Energy
BGE
PECO Energy
PPL Electric Utilities
PSE&G
Central Maine Power
EKPC
Manitoba
HydroSaskPower
DTE
UES Electric
Nova Scotia
Power
8 Ontario Distribution
Companies:• PowerStream (GTA)
• Veridian (GTA)
• Horizon (Niagara Peninsula)
• Greater Sudbury and/or Thunder
Bay (Northern Ontario)
• Algoma Power (Central Ontario)
• Entegrus (South-western
Ontario)
• Essex and/or EnWin
(Southwestern Ontario)
• Oshawa and/or Kingston and/or
Peterborough (Eastern Ontario)
9
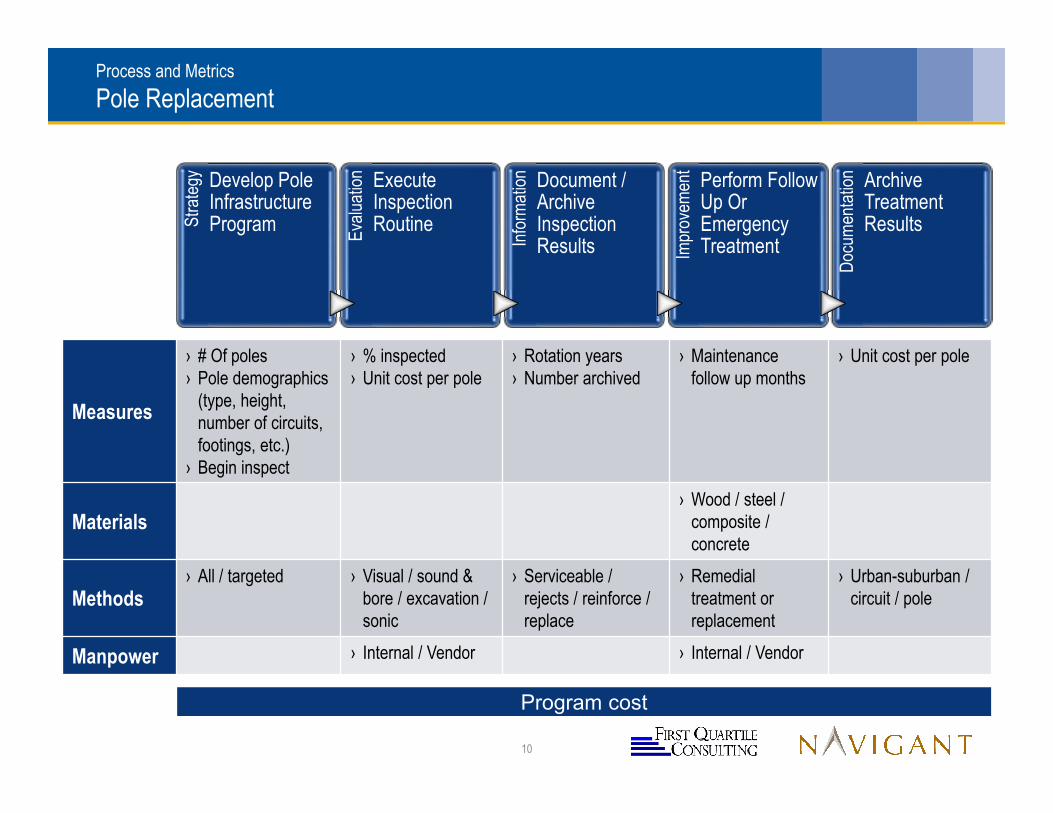
Process and Metrics
Pole Replacement
10
Str
ateg
y Develop Pole Infrastructure Program
Eva
luat
ion Execute
Inspection Routine
Info
rmat
ion Document /
Archive Inspection Results Im
prov
emen
t
Perform Follow Up Or Emergency Treatment
Doc
umen
tatio
n Archive Treatment Results
Measures
› # Of poles
› Pole demographics
(type, height,
number of circuits,
footings, etc.)
› Begin inspect
› % inspected
› Unit cost per pole
› Rotation years
› Number archived
› Maintenance
follow up months
› Unit cost per pole
Materials› Wood / steel /
composite /
concrete
Methods› All / targeted › Visual / sound &
bore / excavation /
sonic
› Serviceable /
rejects / reinforce /
replace
› Remedial
treatment or
replacement
› Urban-suburban /
circuit / pole
Manpower › Internal / Vendor › Internal / Vendor
Program cost

Process and Metrics
Substation Refurbishment
11
Str
ateg
y Develop the program
Eva
luat
ion Execute
substation evaluation routines In
form
atio
n Document / archive inspection and evaluation results
Pre
para
tion Design The
solution
Impr
ovem
ent
Perform construction
Doc
umen
tatio
n Record new asset information
Measures
› # of stations,
› Station
demographics
› Component
demographics
› # of stations
evaluated,
› Specific
components
evaluated
› Inspection cycles
by component,
› Number of
inspections
archived
› Station demographics per project
› Design and construction costs per
project
› Months to complete design
› Months to complete construction
› Units of
property
recorded
› Unit cost / kVA
Materials› Types and number of components
replaced / refurbished for each
project
Methods
› Refurbishment
strategy –
component
based vs.
station centric
› Evaluation
methods by
component
› Project initiation
criteria
› Component
replacement
criteria
› iMDS vs traditional substation
rebuild at existing site
Manpower › Internal/vendor
Program cost

Next Steps
12
Several short-term and some long-term activities to prepare the comparisons
» Follow-up from the stakeholder session
› Respond to inputs
› Modify the process and metrics as necessary
» Data gathering
› Hydro One internal data gathering
‒ Interviews
‒ Complete a questionnaire
› Peer group
‒ Recruit Canadian and US utilities to participate
‒ Work with participating utilities to validate their data for accuracy and comparability
» Summary and reporting
› Initial draft of data comparisons for data validation and analysis
› Analysis and normalization
› Draft report
» Analysis expected to be complete in Q1 2016, next stakeholder session planned for Q2 2016

Appendix

Glossary
Pole Replacement
Term Definition
Pole replacement Pertains to all the activates related to managing the wood pole assets
# of poles Approximate number of poles, in thousands, owned by the utility
Pole demographics Segmentation of the population of poles based on age (in service)
Begin inspect The age of a pole or circuit area that inspections will begin
% inspected The number of actual inspections performed divided by the scheduled number of inspections
Unit cost The actual cost divided by the number of pieces of work / circuits
Rotation years The number of years between inspections
# archived How many past inspections are recorded in the database
Maintenance follow up months The number of months after the inspection in which all non-urgent repairs or maintenance was
completed
Wood / steel / composite / concrete Common types of poles replaced
All / targeted The scope of the inspection program. All, the program is across the entire system. Targeted, the
program is aimed at specific areas (usually older)
Visual / sound & bore / excavation / sonic Methods of pole inspections
Serviceable / rejects / reinforce / replace Common categorization of poles post inspection
Remedial treatment / replacement Methods of treatment based on pole inspection results
Urban-suburban /
circuit / pole
Method of retaining past inspection and maintenance records, either for non-rural areas, by poles on
a circuit or individual pole
Internal / vendor The categorization of the actual resources utilized to perform the work
Program cost The total dollar amount spent, by the utility, on inspection and maintenance of their wooden pole
assets
14
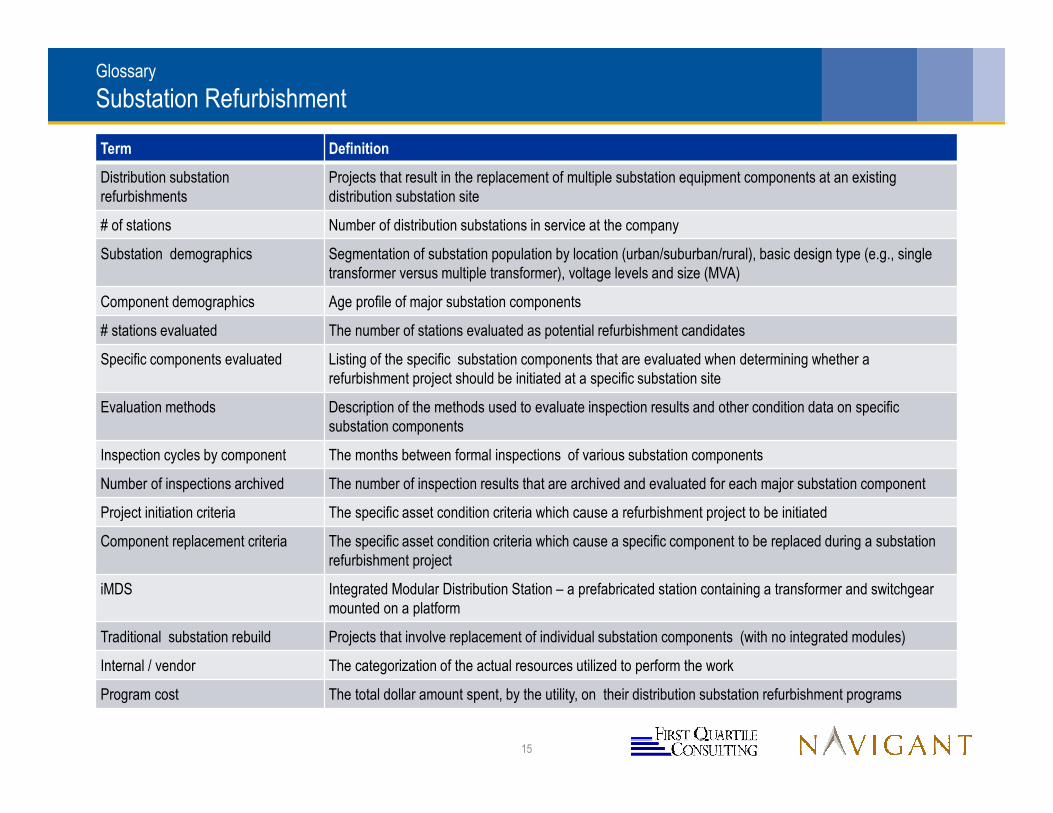
Glossary
Substation Refurbishment
Term Definition
Distribution substation
refurbishments
Projects that result in the replacement of multiple substation equipment components at an existing
distribution substation site
# of stations Number of distribution substations in service at the company
Substation demographics Segmentation of substation population by location (urban/suburban/rural), basic design type (e.g., single
transformer versus multiple transformer), voltage levels and size (MVA)
Component demographics Age profile of major substation components
# stations evaluated The number of stations evaluated as potential refurbishment candidates
Specific components evaluated Listing of the specific substation components that are evaluated when determining whether a
refurbishment project should be initiated at a specific substation site
Evaluation methods Description of the methods used to evaluate inspection results and other condition data on specific
substation components
Inspection cycles by component The months between formal inspections of various substation components
Number of inspections archived The number of inspection results that are archived and evaluated for each major substation component
Project initiation criteria The specific asset condition criteria which cause a refurbishment project to be initiated
Component replacement criteria The specific asset condition criteria which cause a specific component to be replaced during a substation
refurbishment project
iMDS Integrated Modular Distribution Station – a prefabricated station containing a transformer and switchgear
mounted on a platform
Traditional substation rebuild Projects that involve replacement of individual substation components (with no integrated modules)
Internal / vendor The categorization of the actual resources utilized to perform the work
Program cost The total dollar amount spent, by the utility, on their distribution substation refurbishment programs
15