appendix 4: vehicle use list - welcome to oklahoma's ... · web view1.2 summary of method the...
TRANSCRIPT

STANDARD OPERATING PROCEDURES
FOR
WATER QUALITY MONITORING AND MEASUREMENT ACTIVITIES
OKLAHOMA CONSERVATION COMMISSIONWater Quality Division
Lincoln Plaza Office Park4545 N. Lincoln Blvd., Suite 11A
Oklahoma City OK 73105(405) 522-4500

STANDARD OPERATING PROCEDURESfor the
OKLAHOMA CONSERVATION COMMISSIONfor
WATER QUALITY MONITORING AND MEASUREMENT ACTIVITIES
Approving Officers:
Name: Brooks Tramell - Monitoring Coordinator, Oklahoma Conservation Commission, Water Quality Division
Signature:______________________________ Date:____________
Name: Greg Kloxin - Quality Assurance Officer/Assistant Director, Oklahoma Conservation Commission, Water Quality Division
Signature:______________________________ Date:____________
Name: Kara Williams - Oklahoma Office of the Secretary of the Environment
Signature:______________________________ Date:____________
Name: Virginia Vietti - Project Officer, Region VI United States Environmental Protection Agency
Signature:______________________________ Date:____________
Name: EPA Approving Official- Office of Water Quality, Region VI United States Environmental Protection Agency
Signature:______________________________ Date:____________

Monitoring / Measurement SOPRevision No. 5
06/30/2009Page 3 of 238
TABLE OF CONTENTS
Alkalinity Measurement 4
Automated Water Sampler 13
Chain of Custody and Sample Labeling 20
Specific Conductance Measurement 27
Data Receipt 32
Decontamination for Aquatic Nuisance Species 34
Depth Integrated Sampler 40
Dissolved Oxygen Measurement 45
Equipment, Supplies, and Ordering 52
Procedure for Completing Field Data Sheets 56
Fish Collection 72
Flow Measurement (Meter Method) 85
Flow Measurement (Semi-Submergible Object Method) 96
Habitat Assessment 103
Hardness Measurement 115
Inorganic and Bacteria Sample Collection 121
Macroinvertebrate Collection, Subsampling, and Picking 132
Periphytometers and Processing for Chlorophyll-a Measurement 158
pH Measurement 168
Photodocumentation for Best Management Practices 175
Photodocumentation to Support Water Quality Monitoring 185
Reagents and Standards Shelf-life 191
Spike, Duplicate, Replicate and Blank Samples/ Measurements for Routine QA 193
Temperature Measurement 198
Turbidity Measurement 202
Vehicle Use and Maintenance 208
Winkler Titration for Dissolved Oxygen 219
SOP Appendix: Data Sheets 223

Alkalinity MeasurementStatus: Active
Date: 5/31/2008Page 4 of 238
OKLAHOMA CONSERVATION COMMISSIONWATER QUALITY DIVISION
STANDARD OPERATING PROCEDURE
ALKALINITY MEASUREMENT
(Hach Digital Titrator Model 16900-01)

Alkalinity MeasurementStatus: Active
Date: 5/31/2008Page 5 of 238
1.0 PROCEDURAL SECTION
1.1 Scope and Application123
Alkalinity is a measure of the acid-neutralizing capacity of water. It is the sum of all the titratable bases. Alkalinity is an aggregate property and can be interpreted in terms of specific substances only when the chemical composition of the sample is known. Although many materials may contribute to the alkalinity, the major contributor of alkalinity in natural water is a function of carbonate, bicarbonate, and hydroxide content. Other constituents, borates, phosphates, silicates, and/or other bases, may contribute to alkalinity, but in most situations, these substances are insignificant and may be ignored. The measured alkalinity value can vary significantly depending on the selected titration end-point.
Alkalinity is important to the biota because it buffers pH changes that occur naturally as a result of photosynthetic activity and other chemical processes. Also, components of alkalinity will complex some toxic heavy metals and reduce their toxicity.
1.2 Summary of MethodThe term alkalinity encompasses several different chemical components of water but can be best viewed as the ability of the water to resist a drop in pH, or in another sense, its buffering capacity. The test is performed by slowly titrating a sample with sulfuric acid to a colorimetric endpoint corresponding to a specific pH. Total Alkalinity is determined by the titration to a pH between 3.7 and 5.1, which includes all carbonates, bicarbonates, and hydroxides species. The selected indicator dye changes color within the desired pH range for alkalinity determination. For most analyses, bromcresol green-methyl red is used to indicate a pH endpoint of 4.3 to 5.1. The Hach alkalinity kit makes calculation of the final result simple by using a multiplication factor times the amount of acid added.
1.2.1 Definitions Alkalinity = [OH-] + [CO3
-2] + [HCO3-] - [H+]
Where:[H+] = hydrogen ion concentration[OH-] = hydroxide ion concentration[CO3
-2] = carbonate ion concentration[HCO3
-] = bicarbonate ion concentrationAlkalinity is reported as an equivalent concentration (mg/L) of calcium carbonate (CaCO3).
Total Alkalinity = Measurement of the alkalinity to the methyl orange or bromcresol green-methyl red endpoint (pH 4.3-5.1).
1.3 Health and Safety WarningsThe titrant acid used with this procedure is sulfuric acid (H2SO4). The normality of the acid varies, but 1.6 N and 0.16 N are the commonly used concentrations in the Hach procedure. Sulfuric acid in these concentrations can cause irritations and burns. Protective clothing and eye protection is required during titration process. If a drop gets in your eye, flush thoroughly with whatever water is available. Do not wait until you can get to a source of pure water if none is immediately available.
1.4 Cautions Make sure all air bubbles are removed from the delivery tube prior to sample reading.
1.5 Interference4
Highly colored or turbid samples may mask the color change at the endpoint—use a pH meter to determine the endpoint Chlorine may interfere with the indicators. Add one drop of Sodium Thiosulfate (0.1 N) to eliminate this effect.
1.6 Personnel QualificationField personnel must be trained and evaluated on use of equipment prior to collecting samples or data. Use of the equipment is subject to approval by the QA Officer and/or the Environmental Monitoring Coordinator. Training will be done through dry run exercises in the laboratory and field to familiarize field personnel with operation/collection, calibration and maintenance. Investigators must be familiar with the SOP document and owner’s manual, when applicable.
1 Text taken directly or in part from Standard Methods (APHA, AWWA, WPCF, 1992).2 Text taken directly or in part from Sawyer et al., 19943 Text taken directly or in part from EPA, 19864 Text taken directly or in part from Hach, 1988

Alkalinity MeasurementStatus: Active
Date: 5/31/2008Page 6 of 238
1.7 Apparatus & Materials Hach Digital Titrator Model 16900-01 Titration Cartridges 0.16 N and 1.6 N H2SO4. 250 mL Erlenmyer flask 100 mL graduated cylinder indicator dye powder pillows (Bromcresol Green-Methyl Red)
1.8 Instrument/Method CalibrationSee QC Section 2.3.
1.9 Equipment Operation & Preparation 4
1.9.1 Range Selection Select the sample volume and H2SO4 Titration Cartridge corresponding to the expected alkalinity
concentration as mg/L CaCO3 from Table 1. There are two basic ranges associated with the Hach Kit, High Range (1.6 N) and Low Range (0.16 N). Selection of the High or Low Range is based on the expected alkalinity concentration. The Low Range acid concentration is used when the alkalinity is between 10 – 160 mg/L, and the High Range acid concentration is used when the alkalinity is 100 – 4,000 mg/L
Generally, alkalinity values will be lower in the southeastern half of the state—falling into the Low Range, while most surface waters in the western half will be in the High Range. There will be exceptions, so if you are uncertain it is best to start with the High Range and switch to the Low Range if needed.
Failure to select the appropriate range will manifest when:a. The Low Range acid titration with 25 mL of sample requires more than a reading of 400 on the
buret to reach the endpoint.b. When using the High Range set-up and 100 ml of sample, it takes less than a reading of 100 on the
buret to reach the endpoint.
Obviously having some idea of the alkalinity value before you go into the field can save time, but expect to have to do more than one titration to arrive at the final value.
Table 1: Sample volume and titration cartridge concentration determination
Range(mg/L CaCO3)
Sample Volume(mL)
Titration Cartridge(N H2SO4)
Catalog Number Digit Multiplier
10 – 40 100 0.160 14388-01 0.140 – 160 25 0.160 " 0.4100 – 400 100 1.60 14389-01 1.0200 – 800 50 1.60 " 2.0500 – 2000 20 1.60 " 5.01000 – 4000 10 1.60 " 10.0
1.9.2 Set-up
1. Select the appropriate acid concentration corresponding to the expected sample alkalinity (see Table 1).2. In order to attach the cartridge, the plunger must be totally retracted. To do this press the plunger release button and slide the plunger all the way to the right. Place cartridge in the end slot and turn slightly to secure.3. Once the cartridge is in place, slide the plunger forward to meet the cartridge seal.4. Remove the cap on the cartridge and insert a clean delivery tube as shown in Figure 2.5. Expel any air by holding the cartridge tip up while turning the delivery knob. Turn delivery knob to flush tube
and continue flushing until 10 drops have been evacuated.6. Use the counter reset knob to turn the digital counter back to zero. Wipe or rinse the tip to remove excess acid.

Alkalinity MeasurementStatus: Active
Date: 5/31/2008Page 7 of 238
1.9.3 Measuring Total Alkalinity1. In most sampling instances, Total Alkalinity will be the only alkalinity measurement needed.2. Use a graduated cylinder to measure the appropriate volume of sample into a 250-mL Erlenmeyer flask. See
Table 1 for sample volume.3. Add the contents of one Bromcresol Green-Methyl Red Powder Pillow to the sample and swirl to mix. At
pH values greater than 5.1 the sample should turn green.4. Immerse the delivery tube tip in the solution and swirl the flask while titrating. Titrate by turning the
delivery knob. Keep turning the knob and swirling the sample until the sample changes to the appropriate color.
5. A stir plate can be used to aid in the titration process. Place a stir bar into the flask and place it on the stir plate. Switch the stir plate on to dissolve the dye powder and/or to swirl the sample during the titration.
6. Titrate to the appropriate endpoint based on the total alkalinity found in the water sample. Refer to Table 2 for a listing of endpoints given the water composition and concentration of alkalinity. A light greenish blue-gray is observed at pH 5.1 (~30 mg/L alkalinity), a violet-gray at pH 4.8 (~150 mg/L alkalinity), and a light pink is observed at 4.5 (~500 mg/L alkalinity). Since the OCC is primarily concerned with gross alkalinity concentrations, digital titration is an accepted method. However, certain projects may require a more accurate measurement. When necessary, alkalinity should be determined by potentiometric titration. See the Environmental Monitoring Coordinator for more information.
7. Determine Total Alkalinity concentration by using Equation 1. Record the result on the appropriate field data sheet and/or field notebook. All alkalinity values are assumed to be Total Alkalinity unless marked otherwise.
8. If the titration fails, (>400 digital units with 0.16 N or <100 digital units using 1.6 N), change the sample volume or switch to a different concentration of acid. To accomplish the latter, reverse the cartridge installation sequence to remove cartridge and install the different cartridge as directed above. Use a different delivery tube.
9. When completed, rinse the flask, dry all equipment, and remove the cartridge for storage. Always re-cap cartridges.

Alkalinity MeasurementStatus: Active
Date: 5/31/2008Page 8 of 238
Figure 1 Hach Digital Titrator with component description (Hach, 1988).
Figure 2 Hach Digital Cartridge with Delivery tube (Hach, 1988).

Alkalinity MeasurementStatus: Active
Date: 5/31/2008Page 9 of 238
Equation 1 Alkalinity calculation.
Digits Required x Digit Multiplier = mg/L as CaCO3 alkalinity
Where:Digits Required = number of units displayed on the digital counterDigit Multiplier = appropriate factor selected from Table 1
Table 2: Sample composition, endpoint pH, and expected color.
Sample Composition; Alkalinity Concentration
Endpoint(presented by APHA et al. 1994)
Endpoint(presented by Hach, 1988)
Hach Endpoint Color
Alkalinity ~ 30 mg/L pH 4.9 pH 5.1 Light greenish blue-grayAlkalinity ~ 150 mg/L pH 4.6 pH 4.8 Light violet-grayAlkalinity ~ 500 mg/L pH 4.3 pH 4.5 Light pink
Silicates or phosphates present pH 4.5 pH 4.5 Light pink
1.10 Sample CollectionWater samples should be collected from mid channel, from a pooled but not stagnant area. Care should be taken to avoid collection of any surface scum.
1.11 Sample Handling & PreservationMeasurement should be performed in the field at the time of collection. However, if measurement is preformed in the laboratory or at a later date, collect the samples in clean glass or HDPE plastic container with zero headspace. Place samples on ice. Avoid excessive agitation or prolonged exposure to air.
1.12 Sample Preparation and AnalysisThere is 14 day holding time on alkalinity (EPA, 1982), but Hach (1988) recommends that the samples be read as soon as possible after collection but within 24 hours.
1.13 TroubleshootingSee owner’s manuals
1.14 Data Acquisition, Calculation & Data ReductionNot applicable
1.15 Computer Hardware & SoftwareNot applicable
1.16 Data Management & Records Management
1.16.1 Field NotationAll alkalinity measurements made at each site should be recorded on the Site Collection Sheet (see SOP Appendix: Data Sheets). Data should be recorded following procedures outlined in the Procedure for Completing Field Data Sheets SOP.
1.16.2 Chain of Custody ProcedureAlkalinity should be measured in the field; therefore, no Chain of Custody form is required. However, if thelaboratory is going to measure alkalinity, then follow the procedures described in the Chain of Custody and Sample Labeling SOP.

Alkalinity MeasurementStatus: Active
Date: 5/31/2008Page 10 of 238
2.0 QA/QC SECTION
2.1 TrainingTraining of field personnel will be done through dry run exercises in the laboratory to familiarize them with instrument operation, calibration, and maintenance. All operators are required to become familiar with the SOP documents and owner’s manual. Prior to solo sample collection, field personnel are evaluated in a field setting for proper use of equipment and sample collection protocol. Annual field audits are performed on sample collectors following procedures outlined in the Quality Management Plan.
2.2 Maintenance Clean outside of unit with a with moist cloth Cap all cartridges Keep glassware clean
2.3 QC ProceduresThe digital titrator should be checked and calibrated against standards each quarter as directed by the QA officer at a QA and meter calibration session. Values will be recorded in the equipment logbook.
The collection of QA samples should follow the procedure specified in the Preparation of Spike, Duplicate, and Blank Samples for Routine QA SOP. Results will be recorded in the field notebook..
2.3.1 Accuracy Check1. Snap the neck off an Alkalinity Voluette Ampoule standard 0.500 N.2. Pipet 5 mL of sample to 1000 mL of DI water, mix thoroughly.3. Take a 100 mL aliquot, add a Bromcresol Green-Methyl red Powder Pillow to sample.4. Titrate to violet-gray endpoint (pH 4.8) using 1.60 N acid.5. The final value should be 125 mg/L alkalinity.6. Repeat the processes using 1 mL of alkalinity standard for 1000 mL DI.7. Use 0.160 N acid to titrate to violet-gray endpoint.8. The final value should be 25 mg/L alkalinity.
3.0 REFERENCES
APHA, AWWA, and WPCF (1992) Standard Methods for the Examination of Water and Wastewater, 17th edition, eds. L.S. Clesceri, A.E. Greenberg, and R.R. Trussell, American Public Health Association, Washington, D.C.
EPA (1986) Quality Criteria for Water, EPA 440/5-86-001, Office of Water, Washington D.C.
Hach (1988) Digital Titrator Model 16900-01 Manual, Hach Company, Loveland, Colorado.
Sawyer, C.N. P.L. McCarty and G.F. Parkin (1994) Chemistry for Environmental Engineering, 4th edition, McGraw-Hill, Inc, New York, New York.

Alkalinity MeasurementStatus: Active
Date: 5/31/2008Page 11 of 238
4.0 APPENDIX A
STANDARD OPERATING PROCEDUREField Summary
Alkalinity Measurement
Equipment Operation & Preparation
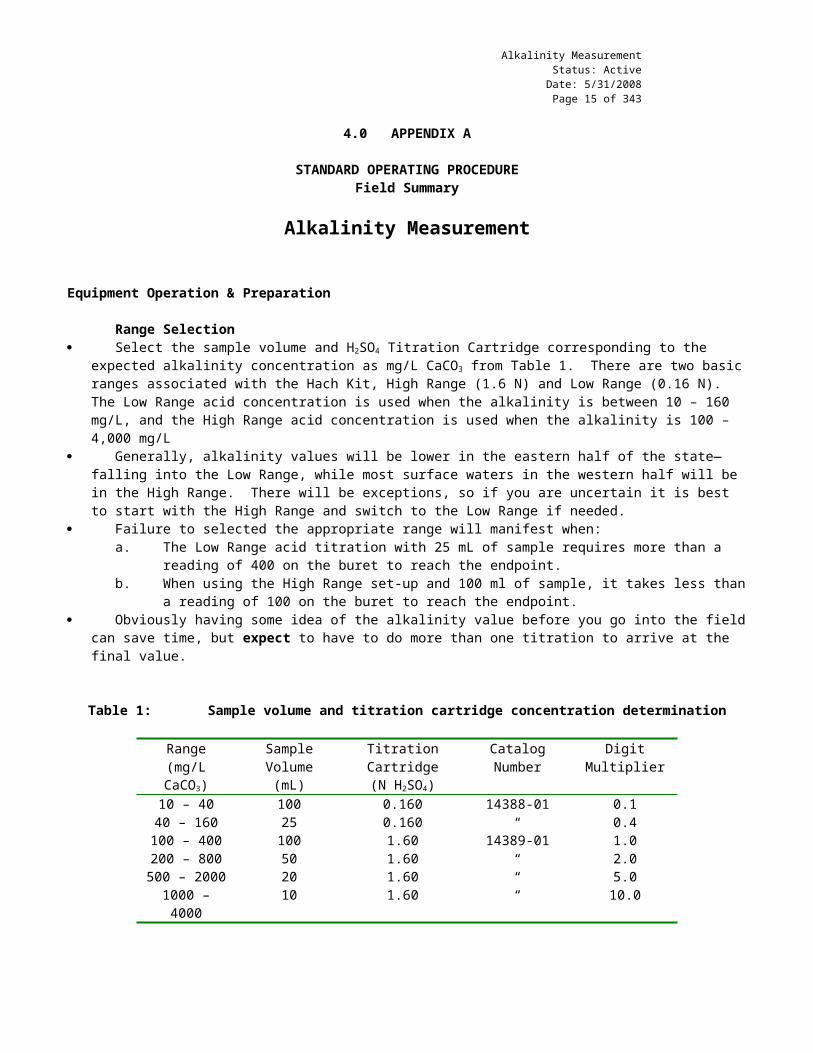
Range Selection Select the sample volume and H2SO4 Titration Cartridge corresponding to the expected alkalinity concentration as
mg/L CaCO3 from Table 1. There are two basic ranges associated with the Hach Kit, High Range (1.6 N) and Low Range (0.16 N). The Low Range acid concentration is used when the alkalinity is between 10 – 160 mg/L, and the High Range acid concentration is used when the alkalinity is 100 – 4,000 mg/L
Generally, alkalinity values will be lower in the eastern half of the state—falling into the Low Range, while most surface waters in the western half will be in the High Range. There will be exceptions, so if you are uncertain it is best to start with the High Range and switch to the Low Range if needed.
Failure to selected the appropriate range will manifest when:a. The Low Range acid titration with 25 mL of sample requires more than a reading of 400 on the buret to reach
the endpoint.b. When using the High Range set-up and 100 ml of sample, it takes less than a reading of 100 on the buret to
reach the endpoint. Obviously having some idea of the alkalinity value before you go into the field can save time, but expect to have to do
more than one titration to arrive at the final value.
Table 1: Sample volume and titration cartridge concentration determination
Range(mg/L CaCO3)
Sample Volume(mL)
Titration Cartridge(N H2SO4)
Catalog Number Digit Multiplier
10 – 40 100 0.160 14388-01 0.140 – 160 25 0.160 “ 0.4100 – 400 100 1.60 14389-01 1.0200 – 800 50 1.60 “ 2.0500 – 2000 20 1.60 “ 5.01000 – 4000 10 1.60 “ 10.0
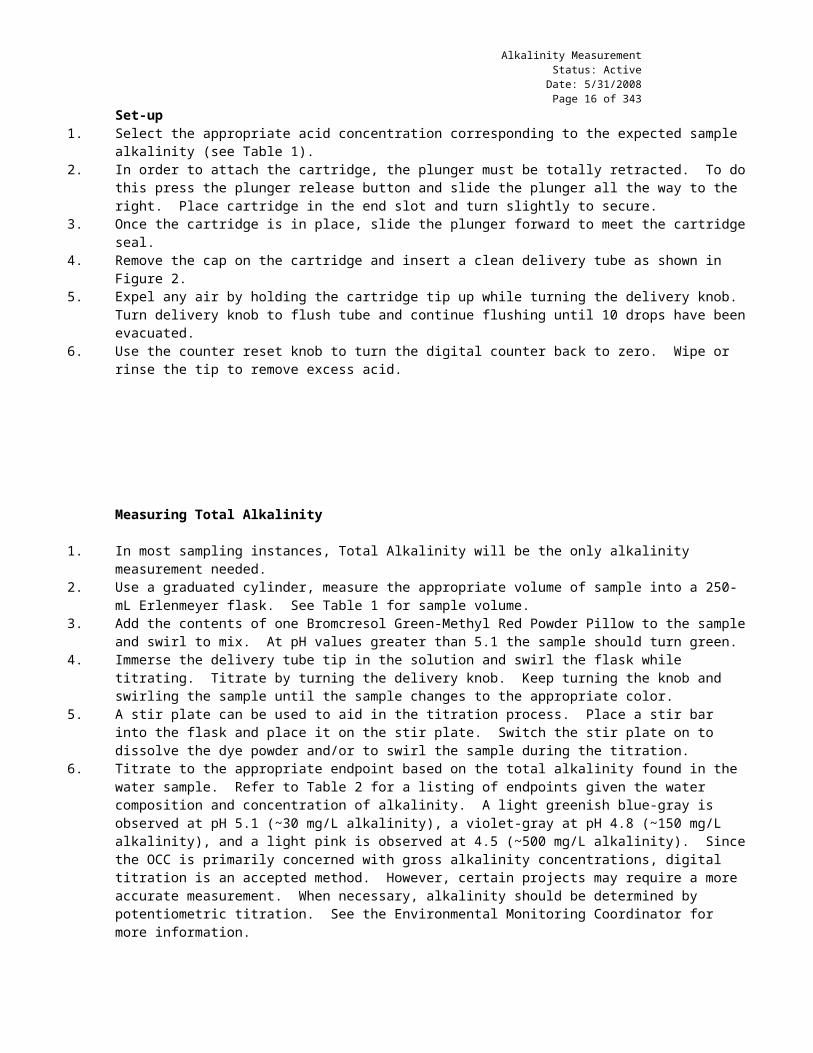
Set-up1. Select the appropriate acid concentration corresponding to the expected sample alkalinity (see Table 1).2. In order to attach the cartridge, the plunger must be totally retracted. To do this press the plunger release button and
slide the plunger all the way to the right. Place cartridge in the end slot and turn slightly to secure.3. Once the cartridge is in place, slide the plunger forward to meet the cartridge seal.4. Remove the cap on the cartridge and insert a clean delivery tube as shown in Figure 2.5. Expel any air by holding the cartridge tip up while turning the delivery knob. Turn delivery knob to flush tube and
continue flushing until 10 drops have been evacuated.6. Use the counter reset knob to turn the digital counter back to zero. Wipe or rinse the tip to remove excess acid.

Alkalinity MeasurementStatus: Active
Date: 5/31/2008Page 12 of 238
Measuring Total Alkalinity
1. In most sampling instances, Total Alkalinity will be the only alkalinity measurement needed.2. Use a graduated cylinder, measure the appropriate volume of sample into a 250-mL Erlenmeyer flask. See Table 1 for
sample volume.3. Add the contents of one Bromcresol Green-Methyl Red Powder Pillow to the sample and swirl to mix. At pH values
greater than 5.1 the sample should turn green.4. Immerse the delivery tube tip in the solution and swirl the flask while titrating. Titrate by turning the delivery knob.
Keep turning the knob and swirling the sample until the sample changes to the appropriate color. 5. A stir plate can be used to aid in the titration process. Place a stir bar into the flask and place it on the stir plate.
Switch the stir plate on to dissolve the dye powder and/or to swirl the sample during the titration.6. Titrate to the appropriate endpoint based on the total alkalinity found in the water sample. Refer to Table 2 for a
listing of endpoints given the water composition and concentration of alkalinity. A light greenish blue-gray is observed at pH 5.1 (~30 mg/L alkalinity), a violet-gray at pH 4.8 (~150 mg/L alkalinity), and a light pink is observed at 4.5 (~500 mg/L alkalinity). Since the OCC is primarily concerned with gross alkalinity concentrations, digital titration is an accepted method. However, certain projects may require a more accurate measurement. When necessary, alkalinity should be determined by potentiometric titration. See the Environmental Monitoring Coordinator for more information.
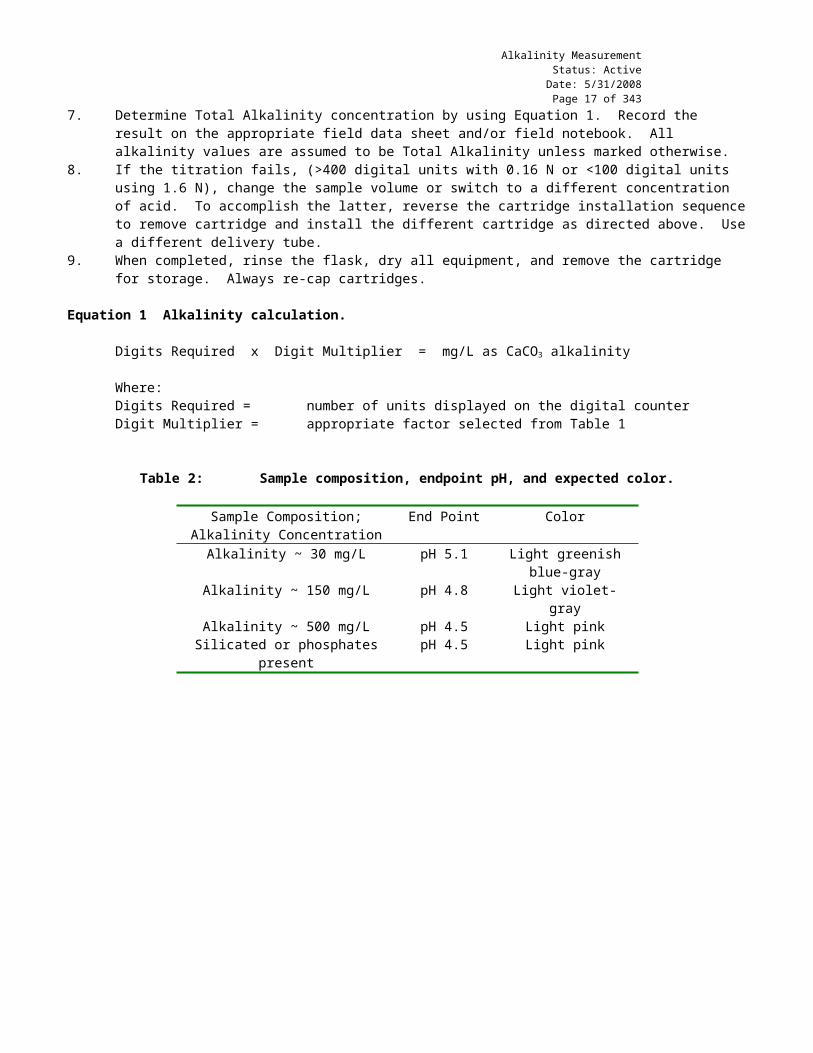
7. Determine Total Alkalinity concentration by using Equation 1. Record the result on the appropriate field data sheet and/or field notebook. All alkalinity values are assumed to be Total Alkalinity unless marked otherwise.
8. If the titration fails, (>400 digital units with 0.16 N or <100 digital units using 1.6 N), change the sample volume or switch to a different concentration of acid. To accomplish the latter, reverse the cartridge installation sequence to remove cartridge and install the different cartridge as directed above. Use a different delivery tube.
9. When completed, rinse the flask, dry all equipment, and remove the cartridge for storage. Always re-cap cartridges.
Equation 1 Alkalinity calculation.
Digits Required x Digit Multiplier = mg/L as CaCO3 alkalinity
Where:Digits Required = number of units displayed on the digital counterDigit Multiplier = appropriate factor selected from Table 1
Table 2: Sample composition, endpoint pH, and expected color.
Sample Composition; Alkalinity Concentration
End Point Color
Alkalinity ~ 30 mg/L pH 5.1 Light greenish blue-grayAlkalinity ~ 150 mg/L pH 4.8 Light violet-grayAlkalinity ~ 500 mg/L pH 4.5 Light pink
Silicated or phosphates present pH 4.5 Light pink

OKLAHOMA CONSERVATION COMMISSIONWATER QUALITY DIVISION
STANDARD OPERATING PROCEDURE
AUTOMATED WATER SAMPLER
(ISCO 6700 and 6712)
and
BUBBLER MODULE
(ISCO 730)

1.0 PROCEDURAL SECTION
1.1 Scope and ApplicationAutosamplers may be used to collect water samples at regular intervals or to sample water only during elevated flow events (i.e., during or after rainfall). The OCC uses autosamplers for both purposes. All OCC autosamplers are operated in flow-weighted composite mode. The attached bubbler module monitors a stream’s water level and flow rate in order to control the sampling intervals. Flow-weighted sampling ensures that more samples are collected during high flow events, which is when nutrient concentrations are highest due to surface runoff and erosion (nonpoint source (NPS) pollution). This allows a more complete, accurate calculation of the total load of certain nutrients in a particular stream reach. Automated sampling equipment is preferred during high flow events because manually collecting samples during or after storms may be difficult and dangerous.
1.2 Summary of MethodAfter an autosampler is installed at a particular site, it must be programmed so that water will be collected at a regular interval (based on time or flow) or so that collection will be initiated at a certain elevated water level and then continued at a regular interval. In order to program the sampler so that a particular stream is accurately represented as water levels increase or decrease, it is necessary to develop a rating curve. The rating curve is developed from Manning’s Equation calculations utilizing data collected from surveying a stream’s cross-section and longitudinal profile. If there is a USGS site near the autosampler site that is not above or below a major tributary, it is preferable to use the rating curves developed by the USGS for that reach of the stream, due to increased accuracy.
All OCC samples are “composite” and “flow-weighted;” that is, all samples are emptied into a single jug instead of being kept separate, and the frequency of sample collection is based on flow rate. Regular-interval samples must be retrieved at least once a week, and storm-water samples must be retrieved within 24 hours (or within a reasonable time to allow delivery of the sample to the laboratory within the holding period for the parameters to be analyzed). Refer to project QAPPs for specific parameters and holding times. Water samples (on ice) are mailed to the Oklahoma Department of Agriculture, Food and Forestry (ODAFF) laboratory to be analyzed for nutrients weekly. Maintenance and upkeep of the sampler includes charging the battery regularly, replacing the desiccant as needed, cleaning any debris from the screen and tubing, replacing the pump tubing when it becomes worn, and replacing intake and bubbler tubing as needed.
1.3 Health and Safety WarningsConcentrated sulfuric acid 10.8M (60%) is used to acidify most samples. Care must be taken when handling this caustic liquid.
1.4 CautionsCare must be taken when handling concentrated sulfuric acid. If the acid contacts the skin, rinse affected area thoroughly with water.
1.5 InterferenceTubing on the autosamplers may become worn, torn, algae-covered, or clogged, and animals often chew holes in the tubing. All tubing must be checked often to insure proper sampling and data collection. Bubbler tubing especially should be checked regularly, since the sampler will display false readings if there are holes or leaks. Batteries used to operate the autosampler and bubbler module may lose their charge and result in incomplete data collection. Proper battery maintenance and frequent charging should reduce the occurrence of battery failure. The autosampler should be turned off when temperatures are at or below freezing to prevent damage to the apparatus.
1.6 Personnel QualificationField personnel must be trained and evaluated on use of equipment prior to collecting samples or data. Use of the equipment is subject to approval by the QA Officer. Training will be done through dry run exercises in the laboratory and field to familiarize field personnel with operation/collection, calibration and maintenance. Investigators must be familiar with the SOP document and autosampler manual.
1.7 Apparatus & MaterialsThe ISCO automated water sampler has the following basic components: programmable operation and memory, water level recorder, sample collection pump, tubing, and sample bottle. A bubbler module (ISCO 730) is also used with this autosampler.
For each weekly site visit, it is advisable to have everything that could possibly be needed to keep the sampler running (i.e., parts such as hosing, intake strainers, etc.). In addition, the following must be brought to the site:
A fully charged marine battery 1 liter collection bottles

Splitter churns, bring both large and small size Dessicant Preservation acid (sulfuric) along with a measuring and dispensing device for the acid Ice Coolers to contain samples Bottle labeling marker Rapid Transfer Device (for data collection in the field)
1.8 Instrument/Method CalibrationThe autosampler/bubbler should be initially calibrated according to the appropriate manual. The unit should then be calibrated weekly. Calibration with regard to correct discharge reading simply consists of programming the sampler to the correct level (either by checking with an instantaneous discharge measurement or checking the USGS real time data). In addition, the sampler has a prompt that will allow calibration of the volume of the delivered sample (15ml). This should be done each week after retrieving the water sample.
1.9 Equipment Operation & Preparation
1.9.1 Installation of the Sampler
1. Investigate the site to consider the width of the channel and the composition of the streambed. Stream bed and bank stability are among the most important considerations for successful long-term autosampler operation. Bridges or armored banks tend to have the best areas for autosampler placement since channels at these locations are generally stable and do not migrate laterally. Also, these areas often offer stable instream habitat (i.e., bedrock and/or cobble), which facilitates the mixing of a sample at the intake placement. If such an area is not an option, areas with stable banks and stable channels should be chosen with suitable flow habitat available within 25-40 feet of the autosampler.
2. Install the sampler in the stream or as close as possible without risk of losing the sampler to eroding banks, debris, etc. Several types of installation can be used (e.g., anchored to post in streambed or attached to wing wall under bridge, etc.); however, the sampler must remain in a level, upright position. The sampler may need to be placed on an elevated platform and within a secure container (e.g., gun safe, barrel, etc.).
3. Judging from the size of the watershed, the restriction of the stream channel, and the perennial or intermittent status of the stream, select an appropriate spot to anchor the intake nozzle and bubbler tube in the stream. If possible, the intake nozzle and the bubbler tube of the sampler need to be in direct flow and facing upstream, parallel to the flow of the stream. To insure that the tubes remain correctly oriented in the stream, tether them to a post which is secured in the stream.
4. Regular window screen should be positioned over the opening of the intake nozzle, leaving an inch of space between the screen and the opening. The edge of the screen needs to be tacked down to seal off all openings under the screen. This keeps trash from plugging the opening and keeps bugs and snails out.
5. Connect the intake nozzle to the sampler unit with the appropriate size tubing to securely seal onto the autosampler and intake fittings. Tubing used for intake must have walls thick and rigid enough to resist collapse during pumping cycles. ISCO supplies tubing of the appropriate thickness but may be substituted with tubing from a local hardware store provided the tubing resists collapse. Make sure that the tubing runs continuously downhill from the sampler to the intake nozzle. In order to protect the tubing from damage by wildlife, enclose both the bubbler tubing and the suction tubing in PVC pipe or other tough material which runs from the sampling site to the sampler unit.
6. Install and program the bubbler module. Rating curves can be acquired through collecting discharges over a period of time or through USGS gauge station data.
1.9.2 Operating the Sampler and Collecting Samples
Initial operation:1. Remove the autosampler cover to access the pump and control section. Then remove the protective lid over the
control panel. Place the 10-liter sample jug inside the sampler base, and add 2 ml of 10.8M (60%) sulfuric acid to the jug.
2. Settings : The sample volume should be set according to the application. The volume will be constant for each pump cycle regardless of the flow of the stream or sampling interval. A true flow-weighted composite comes from collecting a constant volume at a preset discharge interval. For example, 15 ml of sample will be pulled after every 10,000 cubic feet of water has passed the sampler. Thus, the higher the discharge rate, the more often the sampler pulls a sample. This represents the entire hydrograph for a week as a true composite.
3. A continuous flow-weighted composite autosampler should be programmed to collect a relatively small volume (15 ml) and the collection interval set accordingly to ensure an adequate volume at the end of the sampling period (approximately 2000ml is necessary to rinse and fill a sample bottle). An example follows:

If a stream is at and expected to remain near 25 cfs, then the following calculations will allow the programmer to set the autosampler to ensure an adequate sample volume.
25 cf/s X 3600s/hr X 24hr/day X 7 day/week = 15,120,000 cf/week
2000ml/15 ml = 133 samples
15,120,000/133 = 113,684 cf/sample
So an interval of 113,684 cf will yield a final sample volume of 2000 ml after 7 days.
4. Test the sampler by initiating the sampling program in the main menu screen. Choose to activate the sampler with no delay to start-up. The first sample should be collected within a few seconds and the autosampler should begin a countdown to the next sample (e.g. 113,684 cf). If the sampler does not activate, check the battery, the fuse, and/or the wiring.
5. Replace the lid over the control panel and the cover. The ISCO should be ready for sampling.
Retrieval of sample and resetting for new sample:1. Pause sampling cycle. Plug in the Rapid Transfer Device (RTD) so that data can be downloaded (data retrieval may take a
while, so it is advantageous to start this immediately). 2. Remove the autosampler cover to access the pump and control section. Then remove the protective lid over the sample
jug. Remove the sample jug from the autosampler base. If the sample jug is too full or not full enough (a total sample of at least 2000 ml is necessary), adjust the suction line length switch and/or the volume selection switch for the next sampling cycle.
3. If the volume in the autosampler jug is less than about 2500 ml, cap the autosampler jug and mix the water in the jug. Then, use the sample water to rinse the collection bottle three times, and add the sample (about 1000 ml) to the collection bottle. If the volume in the autosampler jug is greater than about 2500 ml, add contents of the autosampler jug to a clean splitter churn (use either the small or large splitter churn, depending on sample volume in the autosampler jug), mix, rinse, and fill the necessary sample bottles for shipment to the laboratory. Remaining water should be discarded and the autosampler jug cleaned.
4. Add 2 ml of 10.8M (60%) sulfuric acid to the clean sampler jug and place it back into the autosampler base. 5. Replace the battery with a fully charged battery.6. After the download of data onto the RTD is complete, reset the autosampler by disconnecting the bubbler module, turning
the autosampler off and back on, and reconnecting the bubbler module. Enter “Yes” when asked if it is OK if old data is lost. Proceed through programming steps according to the manual and confirm that the discharge readings are accurate.
7. Replace the lid over the control panel and the cover. Resume sampling. 8. Follow maintenance steps (see Section 1.9.3). 9. Ice down the newly collected sample. If shipment is not possible that day, refrigerate and hold the samples overnight and
ship the next day. 10. To ship the samples:
Place bottles inside a plastic bag and seal. Put another plastic bag inside styrofoam ice chest and add some ice. Place the first bag with bottles on top of the ice and put more ice on top of this bag. Pull up the second bag (outside bag) and seal it over the bag of bottles. Stuff the top of bag into ice chest and close lid. Secure the lid and entire ice chest with strapping tape and attach label.
If there is rain:In the event of increased flow (rain), an employee must visit the autosampler to collect water before the end of the week. Storm-water samples should be retrieved within 24 hours. Increased flow during the week will obviously fill the bottle at an increased rate. The programming calculation (above) at higher flow can be used to predict needed visits to ensure that the autosampler bottle does not fill prematurely and cause the sampling to cease. A sample should be taken from the autosampler bottle utilizing a splitter churn, following the protocol described above for retrieving a sample and resetting for a new sample. This should be repeated as many times as necessary during the week, with all samples being stored at less than 4 C until the end of the week. It is acceptable to adjust the sample interval before the end of the week, provided that a sample is collected following the protocol above, the autosampler bottle is emptied after collection,

and the instructions for compositing multiple samples (below) are followed during each visit. Care must be taken to composite all samples based on discharge volumes.
At the end of the week, all samples collected during the week will be combined based on the proportion of total flow for the entire sampling period (described below) in a clean, sample-rinsed churn, and a single sample will be aliquotted and submitted to the lab for analysis. If three samples were retrieved from the sampler on three different days, each sample would represent a portion of the total flow. This proportion of total flow will be determined from the data report gathered from the sampler during the final visit.
Compositing multiple samples collected at varying flow intervals: If the sample retrieved on the first visit represented 20% of the total flow, then a sample volume equivalent to 20% of the total volume desired in the churn should be added. The equivalent proportions of sample should be added from each sample.
For example, if three visits were made to collect samples, the sample volume retrieved at each visit would be 1000ml. Once the data from the autosampler is viewed, the total discharge volume for each sampling period is determined. A hypothetical situation may include three samples with corresponding discharge volumes equaling 1,000,000 cf, 2,000,000 cf and 1,000,000 cf, for a total discharge volume of 4,000,000 cf. In this scenario, the 2,000,000 cf represents 50% of the total flow. Since a total of nearly 2000ml is needed to rinse and fill a 1000ml bottle, 1000ml of the sample representing 50% of the flow should be added to the churn. The other two samples each represent 25% of the total discharge, so simple proportion calculations dictate that 500ml of each of these samples be added for a total of 2000ml in the churn. From this composite, a sample bottle should be rinsed, filled, and shipped to the lab following the shipping instructions listed above. This procedure will ensure that all samples submitted to the lab are true flow-weighted, composite samples.
Refer to project QAPPs for specific parameters and holding times.
1.9.3 Maintenance
To prevent malfunctions, weekly maintenance visits are necessary to check batteries, pumps, tubing, sample intakes, and desiccant levels.
1. Check battery water level. If level is low add distilled water. The battery should function for approximately one week before needing to be charged, depending on distance from water and the slope that the water must travel up. The rule of thumb for battery usage is to use the largest marine battery (measured in reserve) that can be handled by the operator. If the sampler is placed higher than 18-20 feet above or more than 35 feet horizontally from the intake, an additional battery may be necessary. The two battery system is employed by connecting the batteries in parallel (positive post to positive post and negative post to negative post) with two short cables. The result is still a 12 volt system with twice the reserve. The batteries can then be connected to the sampler with the typical power cord, making sure to connect the positive terminal with the positive clamp.
2. The pump tube must be replaced approximately every 1,000,000 revolutions (follow the directions in the instruction manual). The autosampler will display the message “Warning! Replace Pump Tube” after 1,000,000 revolutions, but the tube may need to be replaced before or after that time (inspect it regularly for wear). Only ISCO 6712 pump tubing can be used. Reset the count to zero after replacing the pump tube so that correct tallying can resume.
3. Remove any debris or trash from around the suction line and bubbler tubing in the stream. If the intake and/or exhaust tubes are plugged up, they need to be cleared by flushing water through them. This can be done by filling a bottle with water from the stream, attaching it to the stopper, and squeezing the water through the tubes. Be sure water flushes out of both tubes easily. Place a finger over one tube opening and flush water out the other tube and then vice versa. If flushing does not clear the tube, use a small wire or flexible drill to ream out the tubes. Then, try flushing the residue with water. This can be accomplished by detaching the tube hose at the sampler after the tubing passes through the peristaltic pump. This will allow water to be pumped outside the sampler house for thorough flushing.
4. Periodically, the screen over the intake tube should be cleaned off and checked for holes. When dirty, the screen should be brushed with a wire brush. Replace the screen if necessary.
5. Inspect the desiccant indicator on the lower right hand corner of the control panel and the bubbler module desiccant. If blue, the desiccant is okay. If pink or white the desiccant needs to be changed. Follow the instructions in the owner’s manual. The bubbler module desiccant can be recharged. The autosampler desiccant is bagged and is discarded.

1.10 Sample CollectionWater samples should be collected in direct flow. Care should be taken to avoid collection of any surface scum. The splitter churn and all sample bottles should be rinsed thoroughly before being filled. The sampler jug should be cleaned after retrieval of samples.
1.11 Sample Handling & PreservationSamples must be acidified in order to prevent changes in the water chemistry during the time between actual sampling and analyzing the sample in the lab. Two ml of 60% 18M sulfuric acid should be added to the sample bottle before sampling begins.
1.12 Sample Preparation and AnalysisWater samples (on ice) are mailed to the Oklahoma Department of Agriculture, Food and Forestry (ODAFF) laboratory to be analyzed for nutrients (ammonia, TKN, nitrite, nitrate, total phosphorus, and orthophosphorus) each week.
1.13 TroubleshootingSee instruction manuals.
1.14 Data Acquisition, Calculation & Data ReductionData must be downloaded at least weekly. The 581 Rapid Transfer Device (RTD) is plugged into the appropriate port during the time of collection and data is downloaded. This procedure is outlined in the manual. Upon reprogramming of the sampler (including modifying an existing program), all data will be lost. This should reduce data stored in sampler memory and reduce the time required for data to transfer from the sampler to the RTD.
The RTD is connected to a PC upon returning to the office. Specialized software (ISCO Textlink) allows the importation of data into an excel spreadsheet which is forwarded via email or CD to the OCC Data Manager. A data summary report is attached to any site data and forwarded to ensure the correct autosampler data is attached by site and date. All data is entered into STORET after being received at the water quality office.
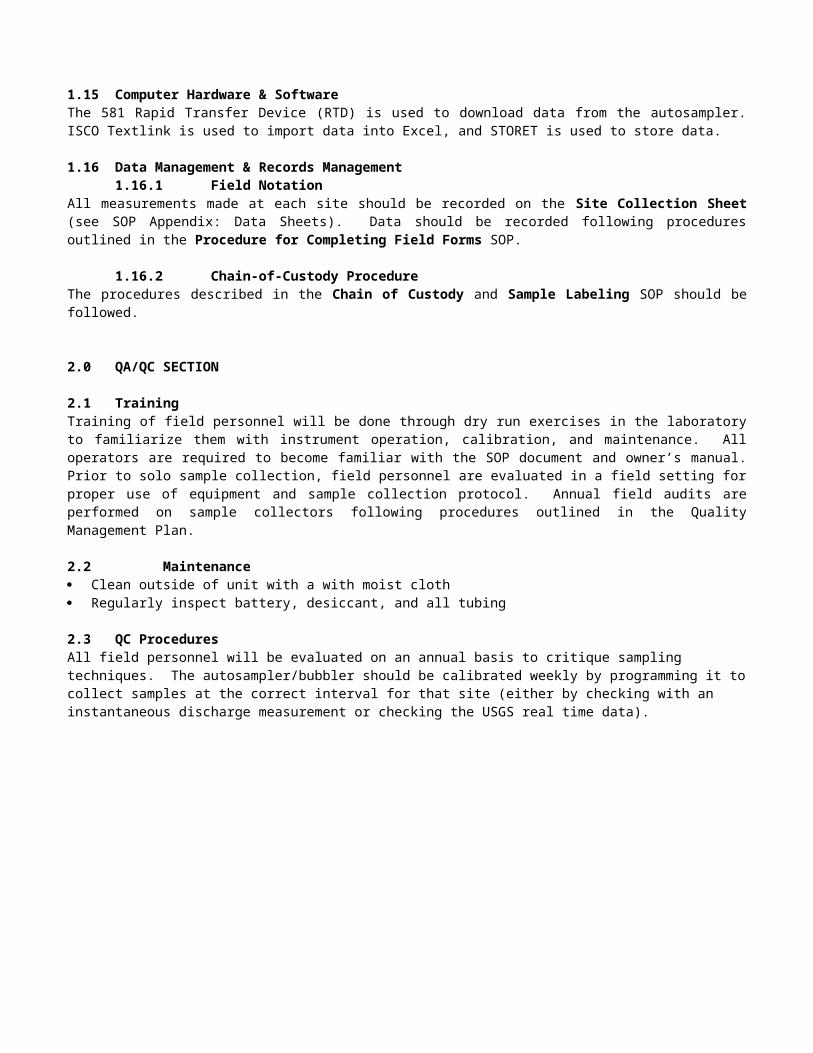
1.15 Computer Hardware & SoftwareThe 581 Rapid Transfer Device (RTD) is used to download data from the autosampler. ISCO Textlink is used to import data into Excel, and STORET is used to store data.
1.16 Data Management & Records Management1.16.1 Field Notation
All measurements made at each site should be recorded on the Site Collection Sheet (see SOP Appendix: Data Sheets). Data should be recorded following procedures outlined in the Procedure for Completing Field Forms SOP.
1.16.2 Chain-of-Custody ProcedureThe procedures described in the Chain of Custody and Sample Labeling SOP should be followed.
2.0 QA/QC SECTION
2.1 TrainingTraining of field personnel will be done through dry run exercises in the laboratory to familiarize them with instrument operation, calibration, and maintenance. All operators are required to become familiar with the SOP document and owner’s manual. Prior to solo sample collection, field personnel are evaluated in a field setting for proper use of equipment and sample collection protocol. Annual field audits are performed on sample collectors following procedures outlined in the Quality Management Plan.
2.2 Maintenance Clean outside of unit with a with moist cloth Regularly inspect battery, desiccant, and all tubing
2.3 QC ProceduresAll field personnel will be evaluated on an annual basis to critique sampling techniques. The autosampler/bubbler should be calibrated weekly by programming it to collect samples at the correct interval for that site (either by checking with an instantaneous discharge measurement or checking the USGS real time data).
Chain of CustodyStatus: Active
Date: 07/13/2006Page 20 of 238
OKLAHOMA CONSERVATION COMMISSIONWATER QUALITY DIVISION
STANDARD OPERATING PROCEDURE
CHAIN OF CUSTODY AND SAMPLE LABELING
Chain of CustodyStatus: Active
Date: 07/13/2006Page 21 of 238
1.0 PROCEDURAL SECTION
1.1 Scope and ApplicationIn order to insure the integrity of collected samples, all samples must be accurately labeled and accompanied by a Chain of Custody form. From a legal viewpoint, non- or incompletely labeled samples, which are not accompanied by a Chain of Custody form, are invalid. From a practical point of view, it is very easy for a laboratory or a sample handler to misidentify samples that are not clearly labeled. In addition, the Chain of Custody form allows all parties to have the same knowledge of where the samples came from and what needs to be done to them.
1.2 Summary of MethodA Chain of Custody form ensures that the samples are collected, transferred, stored, analyzed, and destroyed only by authorized personnel. Every person that collects, analyzes, or takes responsibility for the samples must sign and date the manifest form. In order to maintain the integrity of the sample it is necessary to be able to trace the possession and handling of the sample. The form includes the project name, samplers, site name, WBID #, the site date and time, the parameters to be analyzed, the number of containers, and any comments or remarks. The manifest tracks the samples from the point of collection through analysis. The document is then filed to serve as a record and a reference.
1.2.1 Definitions WBID # waterbody identification number Possession5 A sample is considered to be under a person’s custody if it is in the individual’s physical possession,
in the individual’s sight, secured in a tamper-proof way by that individual, or is secured in an area restricted to authorized personnel.
1.3 Health and Safety WarningsNone
1.4 CautionsNone
1.5 Interference Illegible writing Insufficient pressure rendering the “pink” or “yellow” copies difficult to read
1.6 Personnel QualificationField personnel must be trained and evaluated on proper labeling and use of the Chain of Custody forms. Use of the manifest is subject to approval by the QA Officer and/or the Environmental Monitoring Coordinator. Training will be done through dry run exercises to familiarize field personnel with proper use.
1.7 Apparatus & Materials Chain of Custody form Waterproof ink, ball point pen
1.8 Procedure
1.8.1 Sample labeling:Every sample collected must be labeled with a minimum of the following information:
site name waterbody identification number (WBID #) site date site time (The “site time” is when initial activities began at the site.) preservatives used lead investigator’s name
5 Text taken directly or in part from Standard Methods (APHA, AWWA, WPCF, 1992).

Chain of CustodyStatus: Active
Date: 07/13/2006Page 22 of 238
The label should be written on the sample bottle at the time of collection. A permanent marker, such as a sharpie, should be used. Write all the information on the side of the bottle. In addition, include site name, WBID #, site date and time, and parameters to be analyzed (or as much as possible) on the shoulder of the bottle. This is important because text written on the sides of the bottle tends to get rubbed-off during transport.
1.8.2 Chain of Custody FormsThere is one Chain of Custody form for all parameters collected, see Figure 1. Obtain the Chain of Custody form from the Data Manager or from a designated location. Fill out the necessary information in the logbook. The Chain of Custody Check-Out Form in the logbook requires the following information:
DATE DISTRIBUTED: Record the date the forms were takenNAME: Fill in the name of the person taking the forms. If they are being signed out for someone else,
include the name of the person who .the forms are being checked out for.
COC # ASSIGNED: Record the Chain of Custody form number (lower right) for all forms taken.
The Chain of Custody form requires specific information; fill in the following items:
PROJECT: Record the name of project and Task number.SAMPLERS: The form should be signed by the lead investigator and all other sample collectors should at
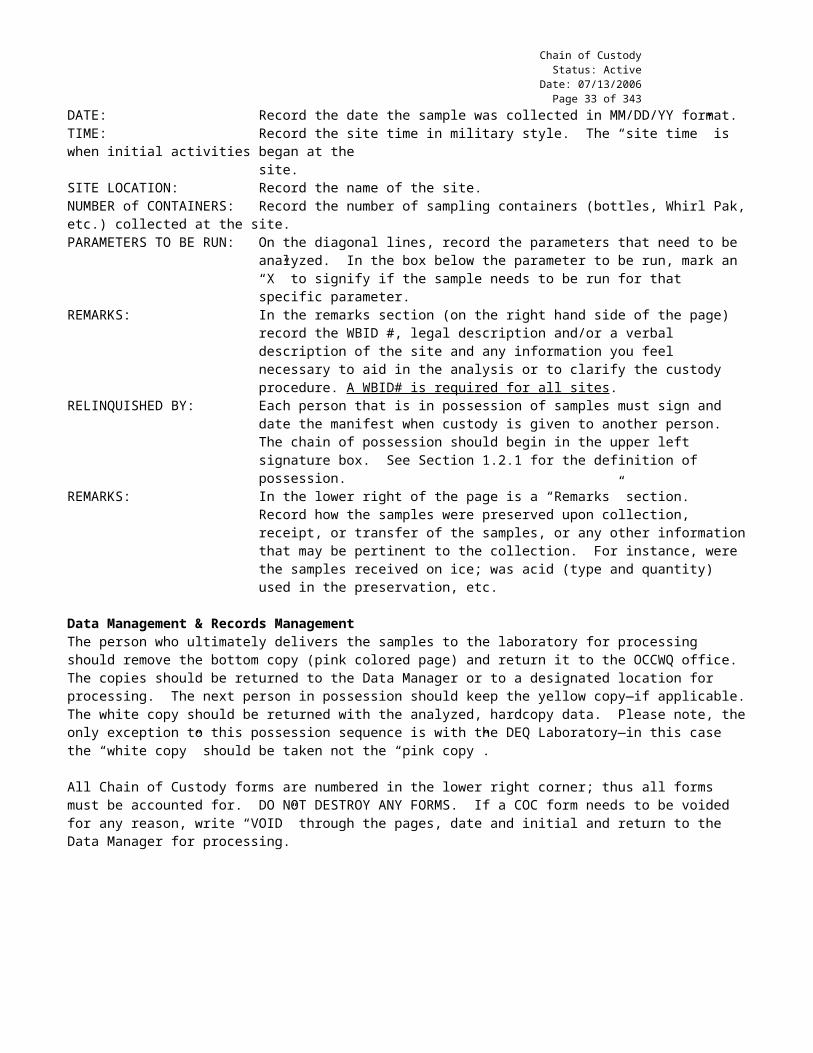
the very least be listed.SITE #: This field is left blank to allow the lab to record the laboratory tracking or log number.DATE: Record the date the sample was collected in MM/DD/YY format.TIME: Record the site time in military style. The “site time” is when initial activities began at the
site.SITE LOCATION: Record the name of the site.NUMBER of CONTAINERS: Record the number of sampling containers (bottles, Whirl Pak, etc.) collected at the site.PARAMETERS TO BE RUN: On the diagonal lines, record the parameters that need to be analyzed. In the box below the
parameter to be run, mark an “X” to signify if the sample needs to be run for that specific parameter.
REMARKS: In the remarks section (on the right hand side of the page) record the WBID # and any information you feel necessary to aid in the analysis or to clarify the custody procedure. A WBID # is required for all sites.
RELINQUISHED BY: Each person that is in possession of samples must sign and date the manifest when custody is given to another person. The chain of possession should begin in the upper left signature box. See Section 1.2.1 for the definition of possession.
REMARKS: In the lower right of the page is a “Remarks” section. Record how the samples were preserved upon collection, receipt, or transfer of the samples, or any other information that may be pertinent to the collection. For instance, were the samples received on ice; was acid (type and quantity) used in the preservation, etc.
1.9 Data Management & Records ManagementThe person who ultimately delivers the samples to the laboratory for processing should remove the bottom copy (pink colored page) and return it to the OCCWQ office. The copies should be returned to the Data Manager or to a designated location for processing. The next person in possession should keep the yellow copy—if necessary. The white copy should be returned with the analyzed, hardcopy data. Please note, the only exception to this possession sequence is with the DEQ Laboratory—in this case the “white copy” should be taken not the “pink copy”.
All Chain of Custody forms are numbered in the lower right corner; thus all forms must be accounted for. DO NOT DESTROY ANY FORMS. If a COC form needs to be voided for any reason, “VOID” through the pages, date and initial and return to the Data Manager for processing.

Chain of CustodyStatus: Active
Date: 07/13/2006Page 23 of 238
2.0 QA/QC SECTION
2.1 TrainingTraining of field personnel will be done through dry run exercises in the laboratory to familiarize them with the proper procedures. All operators are required to become familiar with the SOP documents. Prior to solo sample collection, field personnel are evaluated in a field setting for proper use of equipment and sample collection protocol. Annual field audits are performed on sample collectors following procedures outlined in the Quality Management Plan.
2.2 MaintenanceNot applicable
2.3 QC ProceduresNot applicable
3.0 REFERENCES
APHA, AWWA, and WPCF (1992) Standard Methods for the Examination of Water and Wastewater, 17th edition, eds. L.S. Clesceri, A.E. Greenberg, and R.R. Trussell, American Public Health Association, Washington, D.C.

Chain of CustodyStatus: Active
Date: 07/13/2006Page 24 of 238
4.0 APPENDIX A
STANDARD OPERATING PROCEDUREField Summary
CHAIN OF CUSTODY AND SAMPLE LABELING
Procedure
Sample labelingEvery sample collected must be labeled with a minimum of the following information:
site name waterbody identification number (WBID #) site date site time in military format. (The “site time” is when initial activities began at the site.) preservatives used lead investigator’s name
The labels should be written at the time of sampling. A permanent marker, such as a sharpie, should be used to write directly on the bottle. Write all the information on the side of the bottle. In addition, include site name, WBID #, site date and time, and parameters to be analyzed (or as much as possible) on the shoulder of the bottle. This is important because text written on the sides of the bottle tends to get rubbed-off during transport.
Chain of Custody formsThere is one Chain of Custody form for all parameters collected, see Figure 1. Obtain the Chain of Custody form from the Data Manager or from a designated location. Fill out the necessary information in the logbook. The Chain of Custody Check-Out Form in the logbook requires the following information:
DATE DISTRIBUTED: Record the date the forms were takenNAME: Fill in the name of the person taking the forms. If they are being signed out for someone else,
include the name of the person whom the forms are being checked out for.
COC # ASSIGNED: Record the Chain of Custody form number (lower right) for all forms taken.
The Chain of Custody form requires specific information; fill in the following items:
PROJECT: Record the name of project and Task number.SAMPLERS: The form should be signed by the lead investigator and all other sample collectors should at
the very least be listed.SITE #: This field is left blank to allow the lab to record a laboratory tracking or lab log number.DATE: Record the date the sample was collected in MM/DD/YY format.TIME: Record the site time in military style. The “site time” is when initial activities began at the
site.SITE LOCATION: Record the name of the site.NUMBER of CONTAINERS: Record the number of sampling containers (bottles, Whirl Pak, etc.) collected at the site.PARAMETERS TO BE RUN: On the diagonal lines, record the parameters that need to be analyzed. In the box below the
parameter to be run, mark an “X” to signify if the sample needs to be run for that specific parameter.
REMARKS: In the remarks section (on the right hand side of the page) record the WBID #, legal description and/or a verbal description of the site and any information you feel necessary to aid in the analysis or to clarify the custody procedure. A WBID# is required for all sites.
RELINQUISHED BY: Each person that is in possession of samples must sign and date the manifest when custody is given to another person. The chain of possession should begin in the upper left signature box. See Section 1.2.1 for the definition of possession.
REMARKS: In the lower right of the page is a “Remarks” section. Record how the samples were preserved upon collection, receipt, or transfer of the samples, or any other information that

Chain of CustodyStatus: Active
Date: 07/13/2006Page 25 of 238
may be pertinent to the collection. For instance, were the samples received on ice; was acid (type and quantity) used in the preservation, etc.
Data Management & Records ManagementThe person who ultimately delivers the samples to the laboratory for processing should remove the bottom copy (pink colored page) and return it to the OCCWQ office. The copies should be returned to the Data Manager or to a designated location for processing. The next person in possession should keep the yellow copy—if applicable. The white copy should be returned with the analyzed, hardcopy data. Please note, the only exception to this possession sequence is with the DEQ Laboratory—in this case the “white copy” should be taken not the “pink copy”.
All Chain of Custody forms are numbered in the lower right corner; thus all forms must be accounted for. DO NOT DESTROY ANY FORMS. If a COC form needs to be voided for any reason, write “VOID” through the pages, date and initial and return to the Data Manager for processing.

Chain of CustodyStatus: Active
Date: 07/13/2006Page 26 of 238
4.1 APPENDIX B
CHAIN OF CUSTODY AND SAMPLE LABELING
Sample Chain of Custody form. The column headings are self-evident for the most part. The “Site Number” refers to a laboratory tracking or lab log number. The “Comments” column is the location designated for the WBID #. Any other pertinent information can be recorded in the “Remarks” section on the lower right portion of the form.
WBID # (or legal)
Laboratory Number (assigned by the lab)
Laboratory Number(assigned by the lab)
Other pertinent information

Specific ConductanceStatus: Active
Date: 07/13/2006Page 27 of 238
OKLAHOMA CONSERVATION COMMISSIONWATER QUALITY DIVISION
STANDARD OPERATING PROCEDURE
SPECIFIC CONDUCTANCE MEASUREMENT(YSI MODEL 30)

Specific ConductanceStatus: Active
Date: 07/13/2006Page 28 of 238
1.0 PROCEDURAL SECTION
1.1 Scope and Application6
Conductivity is a numerical expression of the ability of an aqueous solution to carry an electrical current. This ability depends on the presence of ions, their total concentration, mobility, valence, and relative concentrations, and on the temperature of measurement. Solutions of most inorganic acids, bases, and salts are relatively good conductors while organic compounds that do not dissociate are poor conductors. A measure of the ability of water to conduct an electrical current as measured using a 1-cm cell and expressed in units of electrical conductance, i.e., siemens (µS or µmho) at 25C. Specific conductance is related to the type and concentration of ions in solution and can be used for approximating the total dissolved solids (TDS) content of water by testing its capacity to carry an electrical current. For comparison, the specific conductance of seawater is approximately 50,000 µS, which is equivalent to a TDS concentration of about 35,000 milligrams per liter (mg/l).
Physical measurement of conductivity is measured in terms of resistance. Customarily conductivity is reported as micromhos per centimeter (μmhos/cm). The SI unit is siemens (S) and is reported as millisiemens per meter (mS/cm) (1 Siemens = 1 mhos).
1.2 Summary of MethodConductivity can be measured in a conductivity cell connected to a Wheatstone bridge circuit, which allows measurement of the electrical resistance provided by the cell. For more information see Standard Methods (APHA, AWWA, WPCF, 1995). The field meters provide a reading that is equivalent to the commonly accepted method (Wheatstone bridge circuit) corrected to 25o C.
1.2.1 Definitions Conductivity A measurement of the conductive material in the liquid sample without regard to
temperature. Specific Conductance Temperature compensated conductivity which automatically adjusts the reading to a
calculated value which would have been read if the sample had been at 25oC Siemens (S) The reciprocal of ohm in the International System of Units (SI) Mhos The reciprocal of ohm in English units
1.3 Health and Safety WarningsNone
1.4 CautionsCheck the temperature sensor to make sure it is reading accurately. A 1o C difference could result in upwards of a 3% change.
1.5 Interference Organic compounds (e.g. petroleum products) are poor conductors; avoid contacting oil films with the conductivity
probe. Submerge probe below vent hole. The electrode chamber should be free of trapped air. Ideally the cell should be at least ¼ inch away from any other object Electronic fields and stray currents caused by stirrer motors, heaters, etc. can interfere with measurements.
1.6 Personnel QualificationField personal must be trained and evaluated on the use of equipment prior to collecting samples or data. Use of the equipment is subject to approval by the QA Officer and/or the Environmental Monitoring Coordinator. Training will be done through dry run exercises in the laboratory and field to familiarize field personnel with operation/collection, calibration, and maintenance. Investigators must be familiar with the SOP document and owner’s manual, when applicable.
6 Text was taken directly or in part from Standard Methods (APHA, AWWA, WPCF, 1995) and Sawyer et al. (1994).

Specific ConductanceStatus: Active
Date: 07/13/2006Page 29 of 238
1.7 Apparatus & Materials The YSI Model 30 conductivity meters
1.8 Instrument/Method CalibrationThese meters should be checked against conductivity standards each quarter following procedures specified by the QA officer . Values will be recorded in the equipment logbook. Consult the QA Officer for instructions on solving identified QA/QC problems.
The YSI 30 can be calibrated following procedures in the owner’s manual. However, according to YSI—“System calibration is rarely required because of the factory calibration”. Again, consult the QA Officer before taking specific steps to correct QA/QC problems.
1.9 Equipment Operation & PreparationYSI Model 30 Conductivity Meter
1. The Model 30 is powered by 6 AA alkaline batteries. A new set will provide approximately 100 hours of continuous operation. Before going to the field, switch meter ON using ON/OFF key and check for battery strength. If the display reads LOW BAT, the batteries must be replaced.
2. Set the meter to read “Specific Conductance”. Press the MODE button so that the large numbers on the display are followed by uS or mS and the oC by the temperature value is flashing. For OCC purposes, measurements should be temperature compensated (e.g. Specific Conductance mode).
1.10 Sample Collection1. Rinse the electrode with deionized water to remove impurities. Shake or air-dry.2. Place probe in water to be measured. The probe must be completely immersed past the temperature sensor. If
sampling a stream, insure that the probe is placed in flowing water (non-stagnant). Bubbles can become trapped inside of internal gap, which will result in erroneous values. To avoid this situation, shake probe after immersion to dislodge air bubbles.
3. Wait until the temperature reading has stabilized (very important).4. After the display has stabilized, record the conductivity value and note the units of measurement (μS/cm or mS/cm).
Record the measurement on the “Sampling Site” sheet. The data value should be recorded in uS (1 mS = 1000 uS).5. Rinse the electrode between samples and after the last measurement with D.I. water.6. If meter gives an error reading in near-freezing temperatures, collect an additional 100 ml of water in a clean, sample-
rinsed container. Warm the sample slightly in a vehicle and then read conductivity
1.11 Sample Handling & PreservationMeasurement should be performed in situ unless an error reading is obtained in near-freezing temperatures, as stated in 1.10.6. However, if measurement is preformed in the laboratory, collect samples in clean glass or HDPE plastic containers with zero headspace. Place samples on ice.
1.12 Sample Preparation and AnalysisSamples should be analyzed within 28 days of collection.
1.13 TroubleshootingSee owner’s manuals for the appropriate meter.
1.14 Data Acquisition, Calculation & Data ReductionNot applicable
1.15 Computer Hardware & SoftwareNot applicable
1.16 Data Management & Records Management
1.16.1 Field NotationAll field calibration and calibration checks should be recorded on the Sampling Episode Sheet (see SOP Appendix: Data Sheets). All measurements made at each site should be recorded on the Site Collection Sheet (see SOP
Specific ConductanceStatus: Active
Date: 07/13/2006Page 30 of 238
Appendix: Data Sheets). Data should be recorded following procedures outlined in the Procedure for Completing Field Data Sheets SOP.
1.16.2 Chain of Custody ProcedureConductivity should be measured in the field; therefore no laboratory Chain of Custody form is required. However, if the laboratory is going to measure conductivity, then follow the procedures described in the Chain of Custody and Sample Labeling SOP.
2.0 QA/QC SECTION
2.1 TrainingTraining of field personal will be done through dry run exercises in the laboratory and/or field to familiarize them with instrument operation, calibration and maintenance. Investigators must be familiar with the SOP documents and owner’s manual.
2.2 Maintenance The YSI 30 is waterproof, but the unit should not be submerged. Clean outside of unit with a moist cloth. Store the electrode in the chamber on the upper left side of the unit. The YSI 30 has specific cleaning instructions located on pg 25 of the owner’s manual..2.3 QC ProceduresThese meters should be calibrated/checked against conductivity standards each quarter following procedures as directed by the QA officer at a QA and meter calibration session. Values will be recorded in the equipment logbook. Consult the QA Officer for instructions on solving identified QA/QC problems.
The YSI 30 can be calibrated following procedures in the owner’s manual. However, according to YSI—“System calibration is rarely required because of the factory calibration”. Again, consult the QA Officer before taking specific steps to correct QA/QC problems.
The collection of QA samples should follow the procedure specified in the Preparation of Spike, Duplicate, and Blank Samples for Routine QA SOP. Results will be recorded in the field notebook.
3.0 REFERENCES
APHA, AWWA, and WPCF (1995) Standard Methods for the Examination of Water and Wastewater, 19th edition, eds. L.S. Clesceri, A.E. Greenberg, and R.R. Trussell, American Public Health Association, Washington, D.C.
Sawyer, C.N. P.L. McCarty and G.F. Parkin (1994) Chemistry for Environmental Engineering, 4th edition, McGraw-Hill, Inc, New York, New York.

Specific ConductanceStatus: Active
Date: 07/13/2006Page 31 of 238
4.0 APPENDIX A
STANDARD OPERATING PROCEDUREField Summary
Conductivity Measurement
Equipment Operation & PreparationYSI Model 30 Conductivity Meter
1. The Model 30 is powered by 6 AA alkaline batteries. A new set will provide approximately 100 hours of continuous operation. Before going to the field, switch meter on using ON/OFF key and check for battery strength. If the display reads LOW BAT, the batteries must be replaced.
2. Set the meter to read “Specific Conductance”. Press the MODE button so that the large numbers on the display are followed by uS or mS and the oC by the temperature value is flashing. For OCC purposes, measurements should be temperature compensated (e.g. Specific Conductance mode).
Sample Collection1. Rinse the electrode with deionized water to remove impurities. Shake or air-dry.2. Place probe in water to be measured. The probe must be completely immersed past the temperature sensor. If
sampling a stream, insure that the probe is placed in flowing water (non-stagnant). Bubbles can become trapped inside of internal gap, which will result in erroneous values. To avoid this situation, shake probe after immersion to dislodge air bubbles.
3. Wait until the temperature reading has stabilized (very important).4. After the display has stabilized, record the conductivity value and note the units of measurement (μS/cm or mS/cm).
Record the measurement on the “Sampling Site” sheet. The data value should be recorded in uS (1 mS = 1000 uS).5. Rinse the electrode between samples and after the last measurement with D.I. water.6. If meter gives an error reading in near-freezing temperatures, collect an additional 100 ml of water in a clean, sample-
rinsed container. Warm the sample slightly in a vehicle and then read conductivity7. Turn the meter off.

Data ReceiptStatus: Active
Date: 07/13/2006Page: 32 of 238
OKLAHOMA CONSERVATION COMMISSIONWATER QUALITY DIVISION
STANDARD OPERATING PROCEDURE
DATA RECEIPT

Data ReceiptStatus: Active
Date: 07/13/2006Page: 33 of 238
1.0 PROCEDURAL SECTION
1.1 Scope and ApplicationIn order to maintain data accountability, a set procedure is established for the receipt, logging, and review of field and laboratory data.
1.2 Procedure1. Data is received via mail or deposited in Office Manager’s “In Box”.2. The Office Manager (Ann Craven) will stamp the data “Received” and forward it to the Data Manager (Margaret
Blevins) for processing.3. The Data Manager organizes the data in a useful manner, assigns a sample tracking number or “SAMPLEID” to each
collection, and performs the initial Quality Assurance review, which is QA1. The QA1 process includes checking and verifying data for completeness, appropriateness, adequacy, and conformity to established operating procedures.
4. The Data Manager enters lab and taxonomy results into the WQ database in an electronic manner.5. The Data Entry Technician then enters the remaining field data sheets into the WQ database and performs a review of the
lab and taxonomy results for errors. This completes the internal Quality Assurance review known as QA2. 6. The Data Manager performs additional Quality Assurance in the form of spot checks on the data that was entered by the
Data Technician, which is QA3. 7. The Data Technician performs additional Quality Assurance in the form of spots check on the data that was entered by
the Data Manager, which is also QA3.8. The Data Manager performs additional random reviews of the data and attempts to identify problems, and develop
appropriate solutions to glaring inconsistencies and mistakes. The Data Manager obtains assistance from the Quality Assurance Officer and/or Assistant Director in addressing these issues.

Decontamination for ANS Status: Active
Date: 5/31/2008Page 34 of 238
OKLAHOMA CONSERVATION COMMISSIONWATER QUALITY DIVISION
STANDARD OPERATING PROCEDURE
DECONTAMINATION FOR
AQUATIC NUISANCE SPECIES (ANS)

Decontamination for ANS Status: Active
Date: 5/31/2008Page 35 of 238
1.0 PROCEDURAL SECTION
1.1 Scope and ApplicationThe establishment and spread of aquatic nuisance species in Oklahoma, such as zebra mussels and golden algae, is a concern requiring the attention of all field oriented facets of water quality management in the state. Aquatic nuisance species have the potential to outcompete native aquatic species, posing a threat to the overall balance of aquatic ecosystems, as well as having an economic impact on the state of Oklahoma and, in some cases, presenting a public health risk. Proactive measures are necessary to prevent establishment and/or further spread of these nuisance species.
1.2 Summary of MethodThe goal of the Oklahoma Aquatic Nuisance Species (ANS) Management Plan initiated by the Oklahoma Department of Wildlife Conservation is to “minimize the harmful ecological, economic, and social impact of ANS through prevention and management of introduction, population growth, and dispersal of ANS into, within, and from Oklahoma.” The Oklahoma Conservation Commission is an active partner in achieving this goal and as such will follow the guidelines in this document to reduce the likelihood of spreading ANS to uninfected waters. At present, the focus of these decontamination procedures will be to prevent the spread of zebra mussels, since its occurrence is well documented in the state. Other ANS distributions and priorities will be provided by the ODWC as well as training in recognizing these species at a later date.
Current zebra mussel distribution is given here:
WATERBODY STATUS OF CONTAMINATIONConfirmed / Suspected
Dardanelle (AR) C El Dorado (KS) C Oologah C Kaw Res C Keystone S Ft. Gibson S Lynn Lane C Chaney Res (KS) C Ark River nav. channel C Verdigris River C Webber’s Falls C Grand C RS Kerr S Eucha S Spavinaw S Eufaula SAfton (KS) CWinfield City (KS) CMarion (KS) C
Decontamination procedures will be implemented at the completion of sampling which has occurred in waterbodies known or suspected to contain any ANS. Sampling downstream of a waterbody known to be infected with any ANS will also require decontamination, since downstream waters will be considered suspect.
Before sampling, inspect all equipment for ANS. If multiple sites will be visited in a short period, plan to sample uninfected waters first, then waters suspected of ANS presence, and finally waters with confirmed ANS presence. Decontamination will only be required when water temperatures are at least 5 C.
If equipment, such as a boat, waders, seines, or nets, has been in potentially infected waters for less than one hour, decontamination will be less intensive than when equipment has been exposed for longer periods of time. Sampling in 1st and 2nd order streams will only require this same, less intensive level of decontamination, regardless of the length of time equipment has been in the water. In addition, if sampling will be continued in infected waters immediately, only the basic

Decontamination for ANS Status: Active
Date: 5/31/2008Page 36 of 238
level of decontamination will be required between sample sites. The basic level of decontamination, to be used in these cases, is as follows:
All field equipment, including the boat, must be visually inspected. Thoroughly examine treads of boots/waders and other spots which may trap ANS inconspicuously. Any ANS observed on equipment must be removed and killed.
All small field equipment (buckets, nets, waders) must be cleaned by soaking in or scrubbing with a disinfectant solution, such as 50% ethanol or full strength white vinegar, or hot, soapy water. In general, soaking should be for 3-5 minutes, followed by thorough rinsing. Seines can be left rolled for cleaning if at least 3 minutes of high-pressure hot, soapy water is used for cleaning, followed by thorough rinsing. If possible, air dry equipment for at least 2 days prior to reuse (again, plan sampling so that contaminated waters are visited last, after uninfected waters).
Boat hulls and trailers which contact suspect or contaminated water should be sprayed with a disinfectant solution, such as 50% ethanol or full strength white vinegar, and power-washed at a car wash. Particular attention should be given to any areas where water may linger and to any crevices or motor areas where juvenile mussels or macrophytes may be trapped. Boat engine cooling water should be flushed thoroughly to remove any potentially contaminated water.
When equipment has been in known or potentially infected waters larger than 1st or 2nd order for longer than one hour, more intensive decontamination will be required, in addition to the basic procedures described above:
Hard surfaces on boat, buckets, waders, and any other equipment must be scrubbed with a brush to dislodge any veligers or algal cells and power-washed with hot, soapy water. All equipment must be air-dried for at least 2 days prior to reuse.
Spray the inside surfaces of boat with disinfectant solution and let air-dry for at least 2 days. Examine the underside of the boat trailer and fenders if these contacted water. Contaminants may become lodged
around axels. Power wash these areas.
1.3 Health and Safety WarningsUse care when spraying disinfectant solution. Protect eyes, and thoroughly wash eyes if contact with solution occurs.
1.4 CautionsThorough examination and cleaning of all equipment must be performed to prevent the spread of ANS. Always schedule trips to waters suspected or known to be infected AFTER sampling uninfected areas. Allow time for equipment to be decontaminated and dry before sampling in uninfected waters again.
1.5 InterferenceNone.
1.6 Personnel QualificationField personnel must be trained and evaluated on ANS identification and decontamination techniques. Decontamination techniques are subject to approval by the QA Officer and/or the Environmental Monitoring Coordinator. Training will be done through supervised exercises in the field to familiarize field personnel with procedures and techniques.
1.7 Apparatus & Materials
50% ethanol or full strength white vinegar (5% acetic acid), enough for spraying and/or soaking equipment Scrub brush Quarters for car wash
1.8 Instrument/Method CalibrationNot applicable.
1.9 Equipment Operation & Preparation Not applicable.
1.10 Sample Collection Not applicable.
Decontamination for ANS Status: Active
Date: 5/31/2008Page 37 of 238
1.11 Sample Handling & PreservationNot Applicable.
1.12 Sample Preparation and Analysis Not Applicable.
1.13 TroubleshootingConsult an experienced staff member or professional.
1.14 Data Acquisition, Calculation & Data ReductionNot applicable.
1.15 Computer Hardware & SoftwareNot applicable.
1.16 Data Management & Records ManagementAll decontamination procedures performed should be recorded in the Field Notebook (see SOP: Field Data Sheets). If any ANS are observed, record the species observed and number of each species. Report any observed ANS to the senior technical writer for reporting to the ODWC for tracking of ANS distributions in the state.
2.0 QA/QC SECTION
2.1 TrainingAll field staff are required to become familiar with the SOP documents and proper procedures. Field staff will be required to participate in trainings conducted by the ODWC in fulfillment of ANS program goals. Annual field audits are performed on sample collectors to ensure proper use of decontamination procedures.
2.2 MaintenanceNot applicable.
2.3 QC ProceduresThe field personnel are evaluated on an annual basis to critique sampling and decontamination techniques.

Decontamination for ANS Status: Active
Date: 5/31/2008Page 38 of 238
4.0 APPENDIX A
STANDARD OPERATING PROCEDUREField Summary
Decontamination Period: When water temperature > 5 C. Decontamination Area: Waterbodies with confirmed or suspected ANS presence, or waterbodies downstream
of these (ODWC will provide locations if not indicated in this SOP) with particular emphasis on zebra mussels.
Health and Safety WarningsUse care with disinfectant solution, especially to avoid eye contact.
CautionsThorough examination and cleaning of all equipment must be performed to prevent the spread of ANS. Always schedule trips to waters suspected or known to be infected AFTER sampling uninfected areas. Allow time for equipment to be decontaminated and dry before sampling in uninfected waters again.
InterferenceNone.
Personnel QualificationField personal must be trained and evaluated on decontamination techniques. Training will be done through dry run exercises in the field to familiarize field personnel with procedures and techniques.
Apparatus & Materials 50% ethanol or full strength white vinegar (5% acetic acid), enough for spraying and/or soaking equipment Scrub brush Quarters for car wash
MethodBasic decontamination:Use when o equipment has been in potentially infected waters for less than one hour; o sampling in 1st and 2nd order streams, regardless of time in water; o sampling will be continued in infected or potentially infected waters immediately after current sampling.
All field equipment, including the boat, must be visually inspected. Thoroughly examine treads of boots/waders and other spots which may trap ANS inconspicuously. Any ANS observed on equipment must be removed and killed.
All small field equipment (buckets, nets, waders) must be cleaned by soaking in or scrubbing with a disinfectant solution, such as 50% ethanol or full strength white vinegar, or hot, soapy water. In general, soaking should be for 3-5 minutes, followed by thorough rinsing. Seines can be left rolled for cleaning if at least 3 minutes of high-pressure hot, soapy water is used for cleaning, followed by thorough rinsing. If possible, air dry equipment for at least 2 days prior to reuse (again, plan sampling so that contaminated waters are visited last, after uninfected waters).
Boat hulls and trailers which contact suspect or contaminated water should be sprayed with a disinfectant solution, such as 50% ethanol or full strength white vinegar, and power-washed at a car wash. Particular attention should be given to any areas where water may linger and to any crevices or motor areas where juvenile mussels or macrophytes may be trapped. Boat engine cooling water should be flushed thoroughly to remove any potentially contaminated water.
Additional decontamination:Use in addition to the basic procedures described above when equipment has been in known or potentially infected waters (larger than 1st or 2nd order) for longer than one hour.
Hard surfaces on boat, buckets, waders, and any other equipment must be scrubbed with a brush to dislodge any veligers or algal cells and power-washed with hot, soapy water. All equipment must be air-dried for at least 2 days prior to reuse.

Decontamination for ANS Status: Active
Date: 5/31/2008Page 39 of 238
Spray the inside surfaces of boat with disinfectant solution and let air-dry for at least 2 days. Examine the underside of the boat trailer and fenders if these contacted water. Contaminants may become lodged
around axels. Power wash these areas.
Data Management & Records ManagementAll decontamination procedures performed should be recorded in the Field Notebook (see SOP: Field Data Sheets). If any ANS are observed, record the species observed and number of each species. Report any observed ANS to the senior technical writer, who will report it to the ODWC for tracking of ANS distribution in the state.
Depth Integrated SamplerStatus: Active
Date: 07/13/2006Page 40 of 238
OKLAHOMA CONSERVATION COMMISSIONWATER QUALITY DIVISION
STANDARD OPERATING PROCEDURE
DEPTH INTEGRATED SAMPLER
(SET-UP & USE OF THE US-DH76)

Depth Integrated SamplerStatus: Active
Date: 07/13/2006Page 41 of 238
1.0 PROCEDURAL SECTION
1.1 Scope and ApplicationThe theory behind using a depth-integrated sampler instead of collecting a grab sample is that the quality of water moving down a channel during a high flow event is not homogeneous. There is often a moving blanket of more concentrated suspended solids near the bottom, and it is important that this water be sampled. Another factor, which may be as important, is the horizontal distribution of water quality. Because of depth differences, eddies, and other currents, water quality is often not horizontally homogeneous.
1.2 Summary of MethodThe general idea behind the use of a depth integrated sampler is that it allows water from the stream to pass slowly into the collecting bottle as you lower it down to the bottom of the stream and as you raise it back to the surface. If you lower and raise it at a constant speed, it will have collected equal amounts of water from any given depth. By following this procedure, you will get a water sample that accurately represents the average water quality of the water column where the sampler was lowered, thus correcting for any differences in water quality from top to bottom of the stream. To correct for differences in water quality from side to side in the stream, you must take several vertical samples along a bridge. These samples should be taken so that all of the water is represented in equal proportions to its flow in the stream. This means that the sample stations should be evenly spaced along the bridge and the sampler must be lowered and raised at the same speed at each station. If this is done the sample taken from the deepest part of the river will have the largest volume and samples taken from more shallow sections will be proportionately smaller.
1.3 Health and Safety WarningsWatch for large floating debris (e.g. trees/limbs) that could snag the sampler and pull it out of your hands resulting in rope burns or worse. DO NOT ATTACH THE SAMPLER TO YOUR PERSON.
1.4 CautionsIt's important that the bottle still be partially empty when you bring it to the surface. This lets you know that the bottle didn't fill up somewhere underwater and prevented water from the whole water column from being sampled evenly.
1.5 InterferencesNone
1.6 Personnel QualificationField personal must be trained and evaluated on use of equipment prior to collecting samples or data. Use of the equipment is subject to approval by the QA Officer and/or the Environmental Monitoring Coordinator. Training will be done through dry run exercises in the laboratory and field to familiarize field personnel with operation/collection, calibration and maintenance. Investigators must be familiar with the SOP documents and owner’s manual, when applicable.
1.7 Apparatus & MaterialsDepth integrated sampler US-DH76
1.8 Instrument/Method CalibrationNone
1.9 Equipment Operation & PreparationBefore a runoff event occurs wash and clean all sampling equipment being careful that no residue of sediment or detergent remains on the sampler insert bottles, the rubber gasket, or the intake nozzles. Also check the rubber gasket for cracks and defects.
In the field, mark the stations where you will take vertical profiles on the side of the bridge according to the following guidelines.For streams <10 meters wide place 3 to 5 marks on the bridge that will divide the stream into 4 to 6 equal sections. For streams >10 meters wide place 6 to 10 marks on the side of the bridge.

Depth Integrated SamplerStatus: Active
Date: 07/13/2006Page 42 of 238
1.10 Sample Collection1. Place the glass bottle insert into the sampler. Make sure the lip of the bottle seats evenly on the rubber gasket.2. Select the appropriate nozzle size depending on the flow of the stream. If the stream stage is up and the velocity is high
then a smaller nozzle size should be selected and vice versa. 3. Screw the nozzle into the hole at the front end of sampler.4. Attach and secure the sampler-hanging bracket at the top of sampler.5. Rig up and secure the suspension line or cable to the sampler hanging bracket and suspend the sampler over the side of
the bridge.6. At the deepest cross section site, lower the sampler to the surface of the water just to where the fin on the sampler barely
touches the water. Do not submerge the sampler until it has aligned itself with the nozzle pointing upstream.7. Look out for logs and brush floating downstream. If something large is about to snag the sampler, you need to raise it out
of the way and start over.8. Once aligned with the current, lower the sampler at a uniform rate of speed until it touches the bottom of the stream and
then raise the sampler at a uniform rate of speed to the surface.9. Observe the sampler bottle after taking it out of the sampler. In order to avoid overfilling, make sure the sampler bottle is
not more than ¾ full.10. If the bottle is overfilled, discard the sample and start over using a smaller nozzle opening and/or lowering and raising the
sampler at a faster rate of speed.11. Once a proper sample is collected pour it into a splitter churn or larger bottle.12. Repeat the process at all of the other cross section sites along the bridge. Be very careful to raise and lower the sampler
at the same speed at all sites. Pour each of the collected samples into the same splitter churn or large bottle.13. After all of the samples have been collected, use the splitter churn to portion out the sample into all of the bottles
necessary for the lab analysis. 14. If more sample volume is required, it will be obtained after sampling all of the stations on the bridge. Lower the sampler
from each station twice instead of once. This will double the volume.
1.11 Sample Handling & PreservationDepending on the parameters to be collected (nutrients, metals, pesticides, inorganics, etc.), preserve and handle the sample according to the appropriate SOP. Refer to the instructions in the SOP manual.
1.12 Sample Preparation and AnalysisFor most parameters, the analytical laboratory will be responsible for sample preparation and analysis.
1.13 TroubleshootingNone
1.14 Data Acquisition, Calculation & Data ReductionNone
1.15 Computer Hardware & SoftwareNone
1.16 Data Management & Records Management
1.16.1 Field NotationData should be recorded following procedures outlined in the SOP manual. A detailed description of the sampling locations should be recorded on the Site Collection Sheet (see SOP Appendix: Data Sheets) and in the Field Notebook along with a description of the sample composite method used.
1.16.2 Chain of Custody ProcedureThe handling of Chain of Custody forms should follow the procedures described in the Chain of Custody and Sample Labeling SOP.
Depth Integrated SamplerStatus: Active
Date: 07/13/2006Page 43 of 238
2.0 QA/QC SECTION
2.1 TrainingTraining of field personnel will be done through hands-on exercises in the field to familiarize them with instrument operation, calibration, and maintenance. Investigators must be familiar with the SOP document and owner’s manual, when applicable.
2.2 Maintenance Sampling bottles should be cleaned thoroughly after use and stored to prevent contamination Sampling line should be rinsed and dried prior to storage
2.3 QC ProceduresNone

Depth Integrated SamplerStatus: Active
Date: 07/13/2006Page 44 of 238
4.0 APPENDIX A
STANDARD OPERATING PROCEDUREField Summary
DEPTH INTEGRATED SAMPLER
Sample PreparationBefore a runoff event occurs, wash and clean all sampling equipment, being careful that no residue of sediment or detergent remains on the sampler insert bottles, the rubber gasket, or the intake nozzles. Also, check the rubber gasket for cracks and defects.
In the field, before a runoff event occurs, permanently mark the stations where you will take vertical profiles on the side of the bridge according to the following guidelines.For streams <10 meters wide place 3 to 5 marks on the bridge that will divide the stream into 4 to 6 equal sections. For streams >10 meters wide place 6 to 10 marks on the side of the bridge.
Sample Collection1. Place the glass bottle insert into the sampler. Make sure the lip of the bottle seats evenly on the rubber gasket.2. Select the appropriate nozzle size depending on the flow of the stream. If the stream stage is up and the velocity is high,
then a smaller nozzle size should be selected and vice versa. 3. Screw the nozzle into the hole at the front end of sampler.4. Attach and secure the sampler-hanging bracket at the top of sampler.5. Rig up and secure the suspension line or cable to the sampler hanging bracket and suspend the sampler over the side of the
bridge.6. At the deepest sampling station, lower the sampler to the surface of the water just to where the fin on the sampler barely
touches the water. Do not submerge the sampler until it has aligned itself with the nozzle pointing upstream.7. Look out for logs and brush floating downstream. If something large is about to snag the sampler, you need to raise it out
of the way and start over.8. Once aligned with the current, lower the sampler at a uniform rate of speed until it touches the bottom of the stream and
then raise the sampler at a uniform rate of speed to the surface.9. Observe the sampler bottle after taking it out of the sampler. In order to avoid overfilling, make sure the sampler bottle is
not more than ¾ full.10. If the bottle is overfilled, discard the sample and start over using a smaller nozzle opening and/or lowering and raising the
sampler at a faster rate of speed.11. Once a proper sample is collected, pour it into a splitter churn or larger bottle.12. Repeat the process at all of the other sampling stations along the bridge—all samples must be collected at the same speed.
Pour all samples into the same splitter churn or large bottle. 13. After all of the samples have been collected, use the splitter churn to portion out the sample into all of the bottles necessary
for the lab analysis. 14. If more sample volume is required then will be obtained after sampling all of the stations on the bridge, lower the sampler
from each station twice instead of once. This will double the volume.
Dissolved OxygenStatus: Active
Date: 07/13/2006Page 45 of 238
OKLAHOMA CONSERVATION COMMISSIONWATER QUALITY DIVISION
STANDARD OPERATING PROCEDURE
DISSOLVED OXYGEN MEASUREMENT
(YSI MODELS 55 & 550A)

Dissolved OxygenStatus: Active
Date: 07/13/2006Page 46 of 238
1.0 PROCEDURAL SECTION
1.1 Scope and ApplicationThe measure of dissolved oxygen (DO) is an expression of the soluble oxygen concentration in terms of mass per unit volume (e.g. mg/L). In theory, at any given temperature, altitude, PO2, and ionic strength the concentration of oxygen can be calculated based on Henry’s law. However, in the aquatic environment, the DO concentration is influenced by physical, chemical, and biological factors. Subsequently, the measurement of DO should be conducted under field conditions. If DO values fall outside of a specified range, predawn measurements will be collected.
1.2 Summary of Method1
The DO probe is composed of two solid metal (Au and Ag) electrodes, an electrolyte solution (KCl) and oxygen selective membrane (Teflon). The electrodes are immersed in the electrolyte solution and separated from the test solution by the membrane. The membrane allows oxygen and some other gases to pass across the membrane, which reacts with the anode resulting in an electrical current. Oxygen passes across the membrane at a rate proportional to the pressure difference. Oxygen is consumed at the cathode, thus the oxygen pressure inside the membrane is zero. The rate of oxygen transfer across the membrane is proportional to the absolute pressure outside the membrane (more oxygen, more pressure, more current, higher DO reading). In summary, the diffusion current is measured, which is linearly proportional to concentration of dissolved oxygen (Csuros, 1994).
1.2.1 DefinitionsNone
1.3 Health and Safety WarningsNone
1.4 Cautions Dissolved oxygen is particularly dependent on temperature (varies 4-6%/each degree C); therefore, make sure the
temperature reading is accurate. Dissolved oxygen is dependent on altitude. A change of 1000 ft can result in a 3% reading error; therefore, identify the
altitude of the sampling location.
1.5 Interference Any coating (oily or slimy fluids) of the membrane will affect reading. Aerobic and anaerobic slimes are important
because they may consume or produce oxygen, which influences the electrode sensor. The following gases are known to interfere with oxygen measurement; hydrogen sulfide, sulfur dioxide, the halogens (H2,
Cl2, F2…), neon, nitrous acid (YSI information).
1.6 Personnel QualificationField personnel must be trained and evaluated on use of equipment prior to collecting samples or data. Use of the equipment is subject to approval by the QA Officer and/or the Environmental Monitoring Coordinator. Training will be done through dry run exercises in the laboratory and field to familiarize field personnel with operation/collection, calibration and maintenance. Investigators must be familiar with the SOP document and owner’s manual, when applicable.
1.7 Apparatus & Materials YSI Model 55 YSI Model 550A YSI Model series 5700 DO probes
1.8 Instrument/Method CalibrationCalibration of the meter should occur prior to initial sample collection. Allow the probe to warm-up and stabilize for 15 to 30 minutes—this will vary depending on the model. Calibration checks should be conducted prior to additional collections or at least every 4 hours. If the calibration check is greater than 5% of the theoretical result, the meter should be re-calibrated. A calibration should be completed at a temperature that is as close as possible to the sample temperature. (For the Model 55, calibrate within ±10o C of the sample temperature.) Results of the calibration check should be recorded on the appropriate field data sheet and/or field notebook.
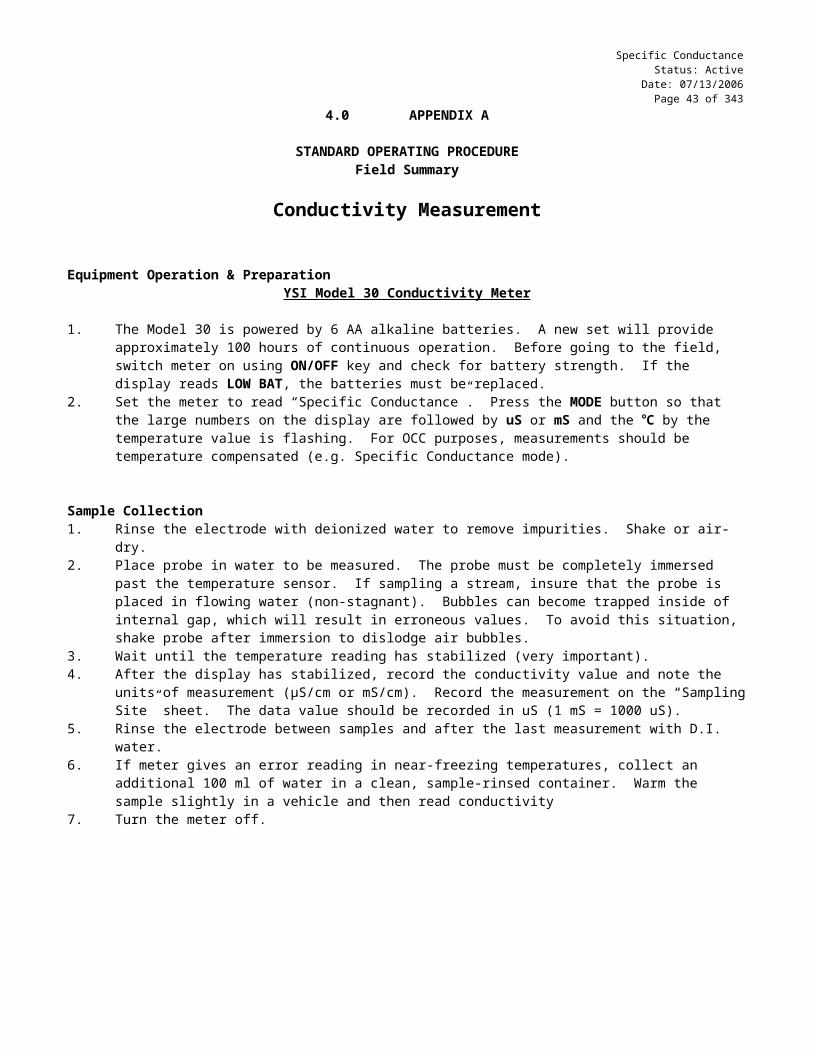
Dissolved OxygenStatus: Active
Date: 07/13/2006Page 47 of 238
Calibration of the meter requires the altitude of the region in which samples are taken, along with the salinity of the water. There are three basic techniques for calibration—Winkler titration, air-saturated water, and water-saturated air. The water-saturated air method is recommended by YSI.
Probe Preparation:For all meter models the preparation of the probe is similar.1. Check the integrity of the membrane. Look for air bubbles, wrinkles, or desiccated membrane. Change membrane and
fluid if needed; refer to owner’s manual.2. Membrane life depends on usage. The average replacement interval is two to four weeks.3. Place probe in air saturated with water. Use a humidity chamber (plastic screw cap bottle) with a few drops of water, or
use the probe holder and a moist sponge (add 6-8 drops of distilled water to sponge).
YSI Models 55 & 550A
1. Ensure that the prepared probe is inserted into the calibration chamber with a damp sponge.2. Turn the meter on by pressing ON/OFF. 3. Use two fingers to press and release the arrow keys (▲▼) keys at the same time.4. Enter the local altitude in hundreds of feet by using the arrow keys (e.g. 12 = 1200 ft). When the proper altitude appears,
press ENTER.5. Press the ENTER key to move to the salinity compensation procedure. Enter the approximate salinity of the water. You
can enter 0 – 40 part per thousand (ppt). Use the arrow keys to increase or decrease the salinity, then press enter. For fresh water enter “0”.
1.9 Sample Collection:YSI Models 55 & 550A
1. Water samples should be measured from mid-channel, at about 1 foot depth, from a pooled but not stagnant area. Raising and lowering the probe about 1 ft per second can provide manual stirring. Care should be taken to avoid any surface scum. The probe can be submerged completely. This model of meter has a non-detachable probe.
2. Allow sufficient time for the probe to stabilize with the sample temperature. If the probe was calibrated under ambient temperature conditions, this step is not required.
3. Allow a few minutes for the dissolved oxygen to stabilize.4. Record the result on the appropriate field data sheet and/or field notebook.5. Rinse electrode and replace in humidity chamber.6. Leave meter on until the last site is sampled for the day. This will avoid the need for recalibration.
Special conditions requiring additional data:From June 1 through September 31, pre-dawn DO measurements must be collected if:
DO exceeds 130% saturation when sampled from hours 0900-1300 DO exceeds 140% saturation when sampled from hours 1300-1800 DO exceeds 130% saturation when sampled from hours 1800 to sundown DO is less than 50% saturation when sampled after 0900 but before sundown
Pre-dawn measurements must be conducted between 0300 and dawn. Two people must collect this data for safety reasons. Data should be recorded on a site collection sheet with comments to explain the circumstances of the activity.
1.10 Sample Handling & PreservationMeasurement must be performed in the field.
1.11 Sample Preparation and AnalysisThere is no holding time for DO; it should be measured immediately.
1.12 TroubleshootingSee owner’s manuals for the appropriate meter
1.13 Data Acquisition, Calculation & Data ReductionNot applicable

Dissolved OxygenStatus: Active
Date: 07/13/2006Page 48 of 238
1.14 Computer Hardware & SoftwareNot applicable
1.15 Data Management & Records Management
1.15.1 Field NotationAll field calibration and calibration checks should be recorded on the Sampling Episode Sheet (see SOP Appendix: Data Sheets). All DO measurements made at each site should be recorded on the Procedure for Completing Field Data Sheets SOP.
1.15.2 Chain of Custody ProcedureDissolved oxygen should be measured in the field; therefore, no Chain of Custody form is required. However, if the laboratory is going to measure Dissolved Oxygen, then follow the procedures described in the Chain of Custody and Sample Labeling SOP.
2.0 QA/QC SECTION
2.1 TrainingTraining of field personnel will be done through dry run exercises in the laboratory to familiarize them with instrument operation, calibration, and maintenance. All operators are required to become familiar with the SOP document and owner’s manual. Prior to solo sample collection, field personnel are evaluated in a field setting for proper use of equipment and sample collection protocol. Annual field audits are performed on sample collectors following procedures outlined in the Quality Management Plan.
2.2 Maintenance The unit is splash proof, but not waterproof, do not submerge. Clean outside of unit with a moist cloth. Store probe in humidity chamber to prevent membrane dehydration. Avoid touching membrane-- do not wipe clean. Membrane life depends on usage. The average replacement interval is 2 – 4 weeks. Change O-ring if it is worn or loose. Refer to the appropriate owner’s manual for cleaning and recharging electrode procedures.
2.3 QC ProceduresThese meters should be checked and calibrated against Winkler titration each quarter following procedures as directed by the QA officer at a QA and meter calibration session. Values will be recorded in the equipment logbook.
The collection of QA samples should follow the procedure specified in the Preparation of Spike, Duplicate, and Blank Samples for Routine QA SOP. Results will be recorded in the field notebook.
3.0 REFERENCES
Csuros, M., (1994) Environmental Sampling and Analysis for Technicians, Lewis Publishers, Boca Raton.
YSI Owner’s Manuals for Models: 51B, 54ARC/54ABP, 57 and 55, Yellow Springs Instruments Co. Inc., Yellow Springs Ohio.

Dissolved OxygenStatus: Active
Date: 07/13/2006Page 49 of 238
4.0 APPENDIX A
STANDARD OPERATING PROCEDUREField Summary
DO Measurement
Instrument/Method CalibrationCalibration of the meter should occur prior to initial sample collection. Calibration checks should be conducted prior to additional collections or at least every 4 hours. If the calibration check is greater than 5% of the theoretical result, the meter should be re-calibrated. A calibration should be completed at a temperature which is as close as possible to the sample temperature. Results of the calibration check should be recorded on the appropriate field data sheet and/or field notebook.
Calibration of the meter requires the altitude of the region in which samples are taken, along with the salinity of the water. There are three basic techniques for calibration—Winkler titration, air-saturated water, and water saturated air. The water-saturated air method is recommended by YSI.
Probe Preparation:For all meter models the preparation of the probe is similar.1. Check the integrity of the membrane. Look for air bubbles, wrinkles, or desiccated membrane. Change membrane and
fluid if needed; refer to owner’s manual.2. Place probe in air saturated with water. Use a humidity chamber (plastic screw cap bottle) with a few drops of water, or in
the probe holder on the YSI Model 55 and a moist sponge (add 6-8 drops of distilled water to sponge).
YSI Models 55 & 550A
1. Ensure that the prepared probe is inserted into the calibration chamber with a damp sponge.2. Turn the meter on by pressing ON/OFF. 3. Use two fingers to press and release the arrow keys (▲▼) keys at the same time.4. Enter the local altitude in hundreds of feet by using the arrow keys (e.g. 12 = 1200 ft). When the proper altitude appears,
press ENTER.5. Press the ENTER key to move to the salinity compensation procedure. Enter the approximate salinity of the water. You
can enter 0 – 40 part per thousand (ppt). Use the arrow keys to increase or decrease the salinity, then press enter. For fresh water enter “0”.
Sample Collection:YSI Models 55 & 550A
1. Water samples should be measured from mid-channel, at about 1 foot depth, from a pooled but not stagnant area. Manual stirring can be provided by raising and lowering the probe about 1 ft per second. Care should be taken to avoid any surface scum. The probe can be submerged completely. This model of meter has a non-detachable probe.
2. Allow sufficient time for the probe to stabilize with the sample temperature. If the probe was calibrated under ambient temperature conditions, this step is not required.
3. Allow a few minutes for the dissolved oxygen to stabilize.4. Record the result on the appropriate field data sheet and/or field notebook.5. Rinse electrode and replace in humidity chamber.6. Leave meter on until the last site is sampled for the day. This will avoid the need for re-calibration.
Special conditions requiring additional data:From June 1 through September 31, pre-dawn DO measurements must be collected if:
DO exceeds 130% saturation when sampled from hours 0900-1300 DO exceeds 140% saturation when sampled from hours 1300-1800 DO exceeds 130% saturation when sampled from hours 1800 to sundown DO is less than 50% saturation when sampled after 0900 but before sundown
Pre-dawn measurements must be conducted between 0300 and dawn. Two people must collect this data for safety reasons. Data should be recorded on a site collection sheet with comments to explain the circumstances of the activity.

Dissolved OxygenStatus: Active
Date: 07/13/2006Page 50 of 238
Maintenance Unit is splash proof, but not waterproof, do not submerge unit. Clean outside of unit with a moist cloth. Store probe in humidity chamber to prevent membrane dehydration. Avoid touching membrane-- do not wipe clean. Membrane life depends on usage. The average replacement interval is 2 – 4 weeks. Change O-ring if it is worn or loose. Refer to the appropriate owner’s manual for cleaning and recharging electrode procedures.

Dissolved OxygenStatus: Active
Date: 07/13/2006Page 51 of 238
Table ISolubility of Oxygen in Fresh Water
TEMP Mg/L DO TEMP Mg/L DO0 14.60 23 8.561 14.19 24 8.402 13.81 25 8.243 13.44 26 8.094 13.09 27 7.955 12.75 28 7.816 12.43 29 7.677 12.12 30 7.548 11.83 31 7.419 11.55 32 7.2810 11.27 33 7.1611 11.01 34 7.0512 10.76 35 6.9313 10.52 36 6.8214 10.29 37 6.7115 10.07 38 6.6116 9.85 39 6.5117 9.65 40 6.4118 9.45 41 6.3119 9.26 42 6.2220 9.07 43 6.1321 8.90 44 6.0422 8.72 45 5.95
Table II (below) shows the correction factor that should be used to correct the calibration value for the effects of atmospheric pressure or altitude. Find true atmospheric pressure in the left-hand column and read across to the right hand column to determine the correction factor. (Note that "true" atmospheric pressure is as read on a barometer. Weather Bureau reporting of atmospheric pressure is corrected to sea level.) If atmospheric pressure is unknown, the local altitude may be substituted. Select the altitude in the center column and read across to the right hand column for the correction factor.
Table IICorrection for Atmospheric Pressure (YSI)
Tem
pera
ture
(C)
Oxy
gen
solu
bilit
y (m
g/l)
Tem
pera
ture
(C)
Oxy
gen
solu
bilit
y (m
g/l)
Alti
tude
(ft)
Cor
rect
ion
Fact
or
Alti
tude
(ft)
Cor
rect
ion
Fact
or
Tem
pera
ture
(C)
Oxy
gen
solu
bilit
y (m
g/l)
Tem
pera
ture
(C)
Oxy
gen
solu
bilit
y (m
g/l)
Alti
tude
(ft)
Cor
rect
ion
Fact
or
Alti
tude
(ft)
Cor
rect
ion
Fact
or
0 14.60 23 8.56 0 1.00 2200 0.92 12 10.76 35 6.93 1100 0.96 3400 0.881 14.19 24 8.40 100 1.00 2300 0.92 13 10.52 36 6.82 1200 0.96 3500 0.882 13.81 25 8.24 200 0.99 2400 0.92 14 10.29 37 6.71 1300 0.95 3600 0.883 13.44 26 8.09 250 0.99 2500 0.91 15 10.07 38 6.61 1400 0.95 3700 0.874 13.09 27 7.95 300 0.99 2600 0.91 16 9.85 39 6.51 1500 0.95 3800 0.875 12.75 28 7.81 400 0.98 2700 0.91 17 9.65 40 6.41 1600 0.94 3900 0.876 12.43 29 7.67 500 0.98 2800 0.90 18 9.45 41 6.31 1700 0.94 4000 0.867 12.12 30 7.54 600 0.98 2900 0.90 19 9.26 42 6.22 1800 0.94 4100 0.868 11.83 31 7.41 700 0.97 3000 0.90 20 9.07 43 6.13 1900 0.93 4200 0.869 11.55 32 7.28 800 0.97 3100 0.89 21 8.90 44 6.04 2000 0.93 4300 0.8510 11.27 33 7.16 900 0.97 3200 0.89 22 8.72 45 5.95 2100 0.93 4400 0.8511 11.01 34 7.05 1000 0.96 3300 0.89

Equipment, Supplies, and OrderingStatus: Active
Date: 07/13/2006Page 52 of 238
OKLAHOMA CONSERVATION COMMISSIONWATER QUALITY DIVISION
STANDARD OPERATING PROCEDURE
EQUIPMENT, SUPPLIES, AND ORDERING

Equipment, Supplies, and OrderingStatus: Active
Date: 07/13/2006Page 53 of 238
1.0 PROCEDURAL SECTION
1.1 Scope and ApplicationIn order to monitor water quality, all field personnel must have the necessary equipment, supplies and spare parts on hand as there will not often be time to obtain these materials when monitoring begins. It is the responsibility of each person working for OCC Water Quality to make sure he or she has the necessary equipment and supplies available.
1.2 PolicyThis SOP covers the tracking of equipment, the general list of necessary supplies, and the procedure for ordering.
1.2.1 Equipment TrackingAs a state agency, OCC-WQ is required to keep accurate records on the equipment that is purchased. All equipment must be tracked and readily located for annual inventory. Equipment that is not in service, obsolete, or non-functioning cannot be disposed of or given away without prior authorization from the Comptroller (Steve Coffman).
All non-consumable items (i.e. items >$300) require a State/OCC identification tag and tracking number. This is a metallic label with a series of numbers that is used by the Comptroller for accounting purposes. Items <$300 do not need to have an OCC identification number assigned to them. If you are not sure if you need an OCC number, check with the Office Manager (Ann Craven).
All field and office personnel will have a list of equipment assigned to them. This includes meters, field equipment, office furniture, computers and other items. On the list will be a description of the item and the OCC tracking number.
If you receive new equipment or field meters, you must obtain a “WQ tracking number” from the Office Manager. This is a temporary number that is used by the Water Quality Office to track equipment before an OCC number is available. State/OCC number usually takes several weeks to months to arrive in the WQ Office.
1.2.2 Field Personnel SuppliesWater quality sampling requires a basic cache of supplies and spare parts. Located in Appendix A is a basic inventory list; however, it is not intended to be all encompassing. Each person is responsible for maintaining his or her supply inventory.
1.2.3 Ordering SuppliesMost of the equipment and supplies ordered by the WQ program are on state contract. Therefore, all purchases need to be made through vendors that have secured the contract. In order to minimize the confusion, all orders should be placed with Jeanette Lamb or Jerry Carr. In memo format, provide Jeanette or Jerry with a specific list of the items needed, quantity desired, and catalogue numbers if available. Please allow several weeks for delivery—plan ahead, some items may take months.
For items that are used regularly, batteries, field paper, pH standards, alkalinity kit supplies and bottles, check in the laboratory and/or storeroom for stockpiles. These items are ordered in bulk and should be available without having to wait. When these items become low, contact Jeanette so that more can be ordered. If you pick up bottles, check with your compatriots to see if they need any also.
All orders are subject to approval. Do not make any purchases without prior authorization.

Equipment, Supplies, and OrderingStatus: Active
Date: 07/13/2006Page 54 of 238
4.0 Appendix A
Inventory ListFor Basic Water Quality Sampling
D.O Meter and Probe (1) spare batteries (2) electrode filling solution (1 oz.) spare membranes (5) scissors (1) if meter uses non-precut membranes screwdriver to set "0" and open meter case (1) if required carrying case (1) manual (1)
pH Meter and Probe (1) spare battery (1) electrode storage solution (at least 8 oz.) electrode filling solution (if required 2 oz.) carrying case (1) manual (1)_____ spare probe (1)_____ 4, 7, & 10 buffers (8 ounce each)
Conductivity Meter and Probe (1) spare batteries (2) conductivity standards (47&447 us)(at least 8 oz) carrying case (1) manual (1) screwdriver to open case (1) if needed
Alkalinity Test Kit (1) digital titrator (1) droppers (5) 125 or 250 ml Erlenmeyer flasks (3) bromcresol green-methyl red indicator (25) extra batteries for stirrer (2) acid syringe -.1600N (3) acid syringe 1.60N (3) magnetic stirrer (1) magnetic stirbars (2) 100 ml graduated cylinder (2) brush for cylinder and flasks (1) manual (1) carrying case (1)
Flow Meter and Probe wading rod (1) field data sheets, waterproof (10) clipboard (1) pencil (2) carrying case (1) manual (1) screwdriver to open case (1)

Equipment, Supplies, and OrderingStatus: Active
Date: 07/13/2006Page 55 of 238
spare batteries (2) Turbidity Meter Gelx standards (3) measuring vials (2) meter manual (1) screwdriver to open case (1) spare batteries (2)
½ gallon sample bottles (25 or enough as required)
Bacteria Sample Bottles (enough as required)
_____ Ice Chest(s) (at least 1 ~ 50 qt size)
Sulfuric Acid for preservation (at least 100 mls)
2 ml Disposable Droppers (15 or enough as needed)
Safety Goggles (1)
Churn Splitter - 3-5 liter (1 if needed)
_____ Spike Solution Ampoules (4 each if required by project QAPP) calcium 10,000 mg/l as CaCo3 10 ml ampoule sulfate 2,500 mg/l 10 ml ampoule chloride 12,500 mg/l 2 ml ampoule ammonia 50 mg/l 10 ml ampoule phosphate 25 mg/l 10 ml ampoule nitrate 250 mg/l 10 ml ampoule 1000 mL graduated cylinder
Milli-Q or equivalent water (1 gallon or more)
Indelible Marking Pen (sharpie) (2)
Field Notebook (1)
Towels, paper or cloth (several)
Hip Chain
_____ Chest Waders
Camera
100 Meter Long Tape Measure
Depth Integrated Sampler (BOMB)
Rope and Winch
Safety Equipment_____ safety light_____ safety cones_____ safety vest_____ life vest

Equipment, Supplies, and OrderingStatus: Active
Date: 07/13/2006Page 56 of 238
_____ safety sign (Workers ahead)

Field Data SheetsStatus: Active
Date: 07/13/2006Page 57 of 238
OKLAHOMA CONSERVATION COMMISSIONWATER QUALITY DIVISION
STANDARD OPERATING PROCEDURE
PROCEDURE FOR COMPLETING FIELD DATA SHEETS
(FIELD NOTEBOOKS, SAMPLING EPISODE SHEETS, & SITE COLLECTION SHEETS)

Field Data SheetsStatus: Active
Date: 07/13/2006Page 58 of 238
1.0 PROCEDURAL SECTION
1.1 Scope and ApplicationThe purpose for field notation is three-fold. First, the collection of relevant information is necessary for incorporation into the Water Quality Database Management System. Second, consistent data records reduce confusion and provide better consistency. Third, routine collection and strict documentation are essential for proper QA/QC procedures. The objective of this SOP is to describe the procedures for filling out the Field Notebook, the Sampling Episode Sheet, and the Site Collection Sheet.
1.2 Summary of MethodField observations and data will be recorded using a combination of formats including a Field Notebook, Sampling Episode Sheet, and a Site Collection Sheet. The Field Notebook will be used as a daily log of activities, including what parameters were collected, locations that were sampled, and any miscellaneous observations or occurrences. The Sampling Episode Sheet will be used to coordinate and track the collection of data at several sites during one sampling event. The Site Collection Sheet will be used to record all relevant information conducted at a specific location.
1.2.1 DefinitionsField Notebook: Multiple page, permanently hardbound logbook used to track daily activities and
record miscellaneous information.
Sampling Episode Sheet: Single page field data sheet used to act as a title or coordinating page for several individual sampling events under one project or QA event.
Site Collection Sheet: Single page field data sheet filled out at each sampling location. All activities and observations relevant to the particular site are recorded on this sheet.
1.3 Health and Safety WarningsNot applicable
1.4 CautionsNot applicable
1.5 Interferences Poor penmanship Runny ink Non-waterproof paper Incomplete documentation
1.6 Personnel QualificationField investigators must be trained and evaluated by the Quality Assurance Officer and/or the Environmental Monitoring Coordinator on the proper procedure for recording field information. Investigators must be familiar with the appropriate SOP documents, where applicable.
1.7 Apparatus & Materials Field data sheets—on water resistant paper Waterproof ink pen
1.8 ProcedureBecause all of the information observed in the field is important and helpful in the analysis and evaluation of data, field data sheets and field notebooks need to be filled out in a format that is clear, concise, and consistent. Proper recording reduces the chance of transcription errors and provides additional information to the technical writer. For all field data sheets, DO NOT LEAVE ANY SPACES BLANK. Use a dash line or “x” to signify that the measurement was not applicable or not measured. This will distinguish between data not observed from information that was unintentionally omitted. Additionally, DO NOT use a dash line to reflect a zero result.

Field Data SheetsStatus: Active
Date: 07/13/2006Page 59 of 238
The procedures for the Field Notebook and the two field data sheets are discussed in this section.
1.8.1 Field NotebookThe role of the Field Notebook has changed from the primary source of data recording to a tracking document. The purpose for the Field Notebook is to provide a log of activities conducted by the field personnel. A written record of the tasks conducted or activities performed in a permanently bound journal will meet the needs of data tracking and quality control objects.
Notebook Specifications: A standard field/transit book with the following specifications: approximately 7.5” length x 4.5” wide; hardbound cover;
water resistant, high-grade paper pages; and a spine bound with waterproof thread.
In the center of the spine of the book, the month and year the book was started along with the month and year of the last entry (when finished) should be recorded. At the base of the spine the field technician’s initials should be recorded.
On the cover of the book, the name of the field technician, the date of the first entry and last entry (when finished), and an office telephone number should be written in permanent ink.
The inside cover should be filled out to include an appropriate address (OCC or field office) and telephone number(s). A business card can be affixed to the cover with transparent tape—the tape should seal the card completely. In addition, other important numbers should be recorded for easy reference. The following numbers should be included, but not limited to:
DEQ Pollution Hotline: (800) 522-0206Corporation Commission: (405) 521-2426Department of Agriculture: (405) 521-3864
In the back of the notebook, a listing of source and cause code numbers should be attached. These numbers will be needed for filling out the Site Collection Sheet. In addition, the tables that show the solubility of oxygen should be attached.
Instructions for Filling Out the Field Notebook Daily entries of field activities should be made using waterproof ink. For each entry, include the date (MM/DD/YY) and
time started (24-hour), followed by a brief description (1-2 lines) of the activities performed, along with a general location description (include the legal description and county at a minimum). When miscellaneous information is recorded, such as a pollution complaint or other observation, include a detailed description and a legal location.
Any corrections should be made by striking through the incorrect information with a single line. Record the date and initials of the person making the correction.
The Field Notebook should aid the field investigator as well as provide a record of activities. Any relevant or important information should be included in the Field Notebook. The level of detail beyond the requirements is up to the discretion of the field personnel—more information is always advantageous.
When a Field Notebook is full, it should be submitted to the Data Manager to be archived.
1.8.2 Sampling Episode SheetThe Sampling Episode Sheet acts as the coordinating page for an entire sampling event or for sampling conducted under one set of QA data samples. For instance, an individual project with six sampling locations visited on the same day would have one Sampling Episode Sheet. In contrast, a larger sampling project that has numerous data sites may require several days to sample or several teams of technicians. If this is the case, a Sampling Episode Sheet will be filled out for each day of sampling. The purpose for the Sampling Episode Sheet is to coordinate all the information on a central page. From this page a sampling event can be tracked. In addition, important QA/QC information is recorded in one central location and can be easily located in the database.
A copy of the Sampling Episode Sheet form is found in the SOP Appendix: Data Sheets.
The following bullets will describe how the sheet should be completed.
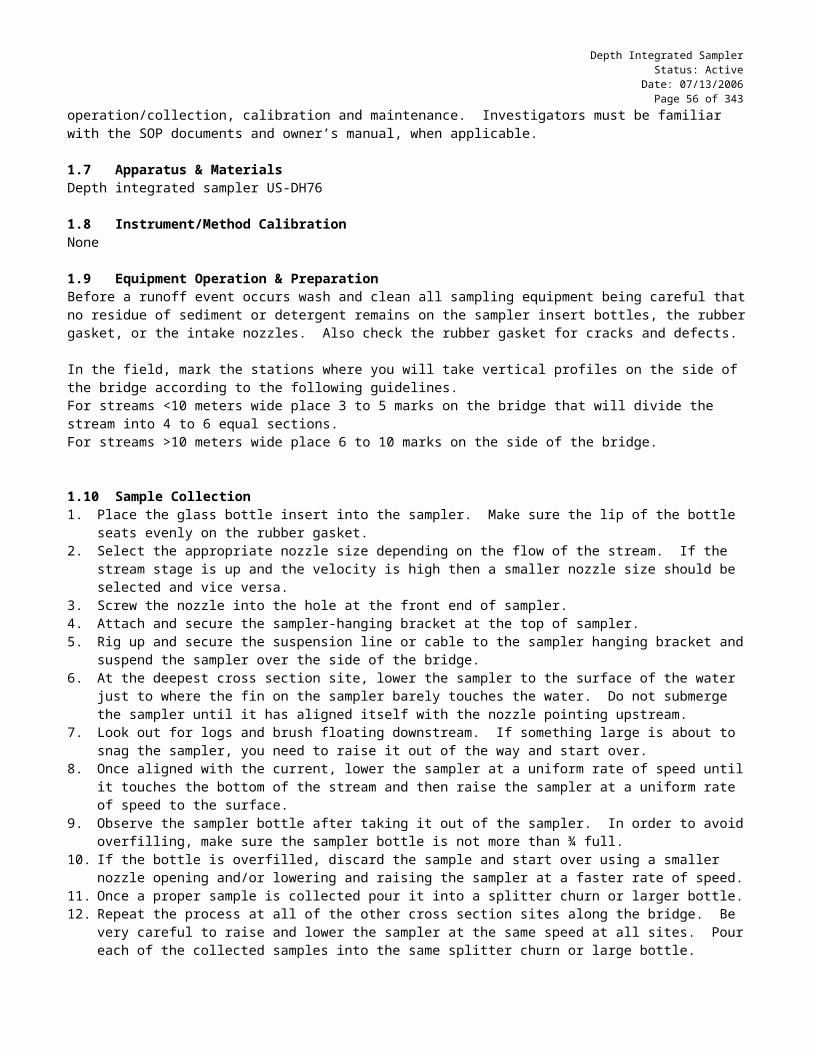
Field Data SheetsStatus: Active
Date: 07/13/2006Page 60 of 238
DATA SHEET HEADER INFORMATION: TASK #/PROJECT: Record the OCC-WQ task number and project name. SITE DATE: Record the site date in MM/DD/YR format. SAMPLING CREW LEADER: Record the name of the person who is in charge of the collection
activities and will be responsible for data custody and reporting. Questions regarding the data will be directed to this person.
SITES (NAME & WBID): Record the names of ALL sites that are visited during this sampling event. If there are five locations, all five site names and water body identification numbers (WBID #) should be recorded.
QA/QC INFORMATION: QA/QC SAMPLES COLLECTED: Circle Yes or No if QA/QC samples were collected. If Yes, the
appropriate fields should be completed as further explained below (see FIELD QA/QC READINGS). Please note that if a sampling event is over a two-day period, the site information is to be completed on both Sampling Episode Sheets. However, the Field QA/QC Readings need to be completed on the Sampling Episode Sheet from the day the QA/QC was collected.
SITE NAME: Record the name of the site selected for QA/QC. WBID #: Record the waterbody identification number of the site selected for
QA/QC. SITE DATE: Record the site data in MM/DD/YY format, which is also recorded on
the Site Collection Sheet. SITE TIME: Record the site time in military format, which is also recorded on the Site
Collection Sheet The “site time” is when initial activities began at the site.
FIELD QA/QC READINGS: Field QA/QC values are recorded in this section to evaluate the field meters and the quality of the field collected data. There are four columns, BLANK, DUP, SPLIT, and REPLICATE. “XXXX” indicates that no result should be recorded for that parameter. Complete the meter readings on the Sampling Episode Sheet corresponding with the day the QA/QC was collected; otherwise, cross out the section on non-QA/QC days.
BLANK: A blank is a sample of de-ionized water (analyte-free) used to evaluate the baseline reading of field meters/analyses. For OCC’s purposes, blanks are only applicable for field meters/analyses requiring a reuse of sample vessels thus necessitating cleansing between sites to avoid cross contamination and bias of readings. Therefore, a blank should be evaluated for the turbidity, alkalinity, and hardness procedures; all other field data are collected in-situ and meters are allowed to equilibrate until measurement drift is minimal.
DUP SPLIT: Duplicate samples are collected to evaluate analyst repeatability (precision) in field measurements. Sufficient sample water is procured and then mixed in a splitter churn. Duplicate (split) samples are obtained in clean vessels and measurements made for conductivity and pH being careful to adequately wash probes with the relevant sample water before each measurement. Turbidity, alkalinity, and hardness duplicates simply require repetition of their procedures by aliquotting water from the splitter churn. Care should be taken to ensure adequate homogenization and vessel cleansing between aliquots.
REPLICATE: A replicate is one or more samples/measurements taken in different locations (width or length) or at different times. Replicate samples are designed to estimate the spatial and/or temporal in-stream variation affording assessment of the representativeness of a single grab sample or measurement. Spatial replicates are preferred. Procure replicate measurements at least 50 m from the original sampling site in an area of similar habitat. If within reasonable walking distance an area of similar habitat is unavailable, move upstream or laterally within the same habitat and obtain replicates from an undisturbed area. In all cases, care must be taken to ensure replicates are taken from areas of similar habitat. Indicate whether the replicate is spatial or temporal (i.e., different locations or same location different time) by circling the appropriate term on the Sampling Episode Sheet.

Field Data SheetsStatus: Active
Date: 07/13/2006Page 61 of 238
DO / DO % SAT: No Dissolved Oxygen or DO % Saturation measurements should be entered for the Blank or DUP SPLIT. Record the DO and DO % SAT values observed at the replicate location.
TURB: A sample of DI water should be measured and recorded. This will evaluate the meter as well as the vial used in the reading. Two aliquots from the splitter-churn should be measured and recorded: one constitutes the sample reading on the Sight Collection Sheet and the other is recorded as the duplicate measurement under the DUP SPLIT column. Measure and record the turbidity at the replicate location under the Replicate column.
ALK: A sample of DI water should be measured and recorded. This will evaluate the equipment as well as technician technique. Two aliquots from the splitter-churn should be measured and recorded: one constitutes the sample reading on the Site Collection Sheet and the other is recorded as the duplicate measurement under the DUP SPLIT columns. Measure and record the alkalinity at the replicate location under the Replicate column.
HARDNESS: A sample of DI water should be measured and recorded. This will evaluate the equipment as well as technician technique. Two aliquots from the splitter-churn should be measured and recorded: one constitutes the sample reading on the Site Collection Sheet and the other is recorded as the duplicate measurement under the DUP SPLIT columns. Measure and record the hardness at the replicate location under the Replicate column.
COND: Two aliquots from the splitter-churn should be procured in clean vessels and then measured and recorded under the DUP SPLIT columns separating the measurements by a slash mark. Measure and record the conductivity at the replicate location under the Replicate column.
pH: Two aliquots from the splitter-churn should be procured in clean vessels and then measured and recorded under the DUP SPLIT columns Separating the measurements by a slash mark Measure and record the pH at the replicate location under the Replicate column.
CALIBRATION CHECK: To monitor the performance of the meters over the sampling episode, regular checks, on at least four-hour intervals, should be conducted to confirm meter calibration and proper functioning status.
pH: Readings on the pH meter should be compared to buffer standards. The readings should be recorded in the appropriate blanks (4, 7, 10). If the reading varies greater than 0.05 pH units from the buffer standard, then the meter should be recalibrated. Circle if the meter was recalibrated.
TURB: The turbidity meter should be compared to the gel standards. The gel standards should be calibrated each quarter at the calibration session. Record the calibrated value for each gel standard next to the appropriate NTU value (~5, ~50, ~500) in the “Calib GELEX” column. This value should be written on the cap of the gelex. Read the gel standards and record the values under the “Initial” column. If the initial reading is greater than 5% of calibrated value, then the unit and gel standards may need to be recalibrated. Clean the outside of the gel standards and inspect for scratches or other factors that may influence the reading. Consult the Quality Assurance Officer and/or the Environmental Monitoring Coordinator if the problem cannot be resolved. Do not recalibrate the unit using the gel standards. Record the reading of the gel standards again after all the samples have been read or at the end of the sampling episode.
DO: The DO reading taken in the humidity chamber should be compared with the theoretical DO based on PO2, altitude, and temperature (oC). The observed reading and the calculated theoretical DO should be recorded at four-hour intervals. Use the temperature and altitude of the sampling location for calculating the theoretical DO; consult the DO tables for the expected value (Appendix 4.1). The humidity chamber should not be subject to interference; thus, the measured and theoretical values should be very similar. If values differ by more than 0.5 mg/L or 5% (whichever is less), consult the Quality Assurance Officer and/or the Environmental Monitoring Coordinator.
TEMP: Temperature is an extremely important measurement for appropriate meter function. Conductivity, DO, and pH meters all depend on accurate temperature readings and will vary significantly with small changes in temperature. On four-hour intervals, the temperature readings for each of the meters should be recorded. The comparison should be made in situ; allow enough time for the meters to equilibrate. If a meter varies from the other meters by more than 2o C, consult the Quality Assurance Officer and/or the Environmental Monitoring Coordinator immediately. Some meters can be adjusted to a

Field Data SheetsStatus: Active
Date: 07/13/2006Page 62 of 238
specific temperature value by calibrating the meter with an accurate temperature reading. Another meter can be used as a standard or use the field thermometer. However, care should be taken when assuming one meter is more accurate than another. Consult the owner’s manual for temperature calibration. Temperature readings from the meters should be compared with an accurate (NTIS traceable) thermometer at the quarterly QA session. Most temperature calibrations will be performed by the manufacturer.
FIELD & MISCELLANEOUS COMMENTS: WQ EQUIPMENT ID: Each meter will be given a three-digit WQ (water quality) meter ID number. This
number should be etched on the meter housing. If your meter does not have a WQ#, contact the Quality Assurance Officer and/or the Environmental Monitoring Coordinator immediately. Record these numbers in the blanks provided. These numbers will be used to track the performance of the meter.
COMMENTS: In this section, record any important information observed during the sampling episode. For instance, general weather conditions in the vicinity of the sample location over the past week or so, and major changes in land use need to be recorded. In addition, any information pertaining to QA/QC procedures must be reported. Particular problems associated with a meter, corrective actions performed, calibrations, and any other information deemed important should be recorded. Use the back of the sheet if necessary.
1.8.3 Site Collection SheetThe Site Collection Sheet is the field data sheet for a specific sampling location. A Site Collection Sheet will be completed for every location visited. The purpose for the Site Collection Sheet is to organize all the information on one central page and to generate consistent observations in the field. If a site is visited but no collection is made, at a minimum the header information of the Site Collection Sheet should be completed, as well as site conditions, and it is important to record detailed comments as to why no collection was made at that site.
A copy of the form is found in the SOP Appendix: Data Sheets.
The following bullets will describe how the sheet should be completed.
DATA SHEET HEADER INFORMATION: SITE NAME: Record the stream name from the USGS 7-1/2' map name. If a county map, soil
map, or other map has a different name, the USGS 7-1/2' map takes precedence. If there is not an official name on the USGS map, refer to the site as the Unnamed Trib. to the XYZ (nearest named creek) Creek.
WBID #: Record the Waterbody Identification number. LEGAL/COUNTY: Record the legal description down to at least 1/8 section including county of site. DATE: Record the sight date in MM/DD/YR format. COC #: Record the Chain of Custody form number for each of the corresponding data
collections. TIME: Record the site time in military format. The “site time” is when initial activities
began at the site. INVESTIGATORS: Record the names of all people involved with this
sampling event; the “crew leader” (the person responsible for data custody and reporting) should be circled on the form. It is appropriate to use initials for investigators employed by the Water Quality Division.
FIELD OBSERVATIONS:
Completed Site Activities: This section is very important as it allows the Data Manager to properly identify and track all the activities completed at each site. For instance, if flow was measured using a flow meter, fish were collected, and a long habitat assessment conducted, these three activities will be checked as completed activities. It is important to note that for each site activity completed a

Field Data SheetsStatus: Active
Date: 07/13/2006Page 63 of 238
corresponding field data sheet will be included, which is further discussed in the Data Management & Records Management section, as there are exceptions to the rule.
WATER QUALITY SAMPLES Check here if water samples are collected for submittal to a lab for analysis.
COLLECTION CODE If Water Quality Samples are checked, a collection code must be recorded based upon the type of water sample that was collected. For example, if it was a grab sample write 010, if it was a width/depth intergraded sample, record 020. Refer to the Appendix for a complete listing of codes.
BACTERIA COLLECTION Check here if water was collected using sterile containers for bacterial analysis.
FLOW Check here if flow was measured by one of the methods provided: Estimated (EST), Semi-Submergible Object/Timed(SS OBJ/TIMED), or Flow Meter (Metered).
AMBIENT TOXICITY Check here if water quality samples were collected under EPA SOPs and forwarded to EPA for toxicity testing.
BUG COLLECTION Check here if benthic macroinvertebrates were collected along with the associated habitat assessment.
FISH COLLECTION Check here if fish were collected via shocking and/or seining along with the associated habitat assessment.
HABITAT ASSESSMENT (LONG/ABBRV) Check here if an In-Stream Habitat Assessment is performed. Circle which form, either the long or the abbreviated, was used during the assessment.
PERIPHYTOMETERS Check here if periphytometers are used for measurement of the(DEPLOYMENT/RETRIEVAL) autotrophic community. Circle if it was the deployment or the
retrieval event. PHOTOS Check here if photos are taken for any reason. OTHER Record any other activities performed, including but not limited
to: priority pollutants, SPMDs, bioassay, sediment and pesticides. Use the comments section if necessary to properly define the additional activity performed.
Stream Site Observations:Circle the number in front of each observation that is applicable. Be sure to discuss the rationale for circling each observation in the comments section and record the approximate stream length affected for each observation circled.
TOTAL LENGTH OF…: Record the length of stream evaluated that was used in the observation process in meters.
1. NOT APPLICABLE: Although stream site observations are generally always applicable, circle if the observations do not apply to this site.
2. CLEAN: Circle if the site is free from observable anthropogenic (or natural) pollution or excessive detritus; e.g. no observable trash, foam, oil, excessive algae, etc…
3. MANURE IN STREAM: Circle if animal manure is observed in the stream or riparian area. In the comment section, be sure to identify the number of cow flops or quantity of waste observed.
4. UNSIGHTLY APPEAR: Circle if water color is unusual, excessively turbid, or otherwise odd in appearance.
5. FOAM/SCUM: Circle if there is a presence of floating foam or heavy scum. 6. FLOATING DETRITUS: Circle if there are large or excessive amounts of “naturally” occurring debris
(leaves, woody debris etc…). 7. TRASH: Circle if anthropogenic litter (cans, plastics, tires, large household items, etc...) is
observed either floating or submerged or on the bank and riparian zone.8. SIGNIFICANT ALGAE: Circle if algae >0.5 cm thick when measured perpendicular to the substrate or
visible greenish plankton is observed.9. FISH KILL: Circle if a fish kill is observed. Report observation to the Monitoring
Coordinator.
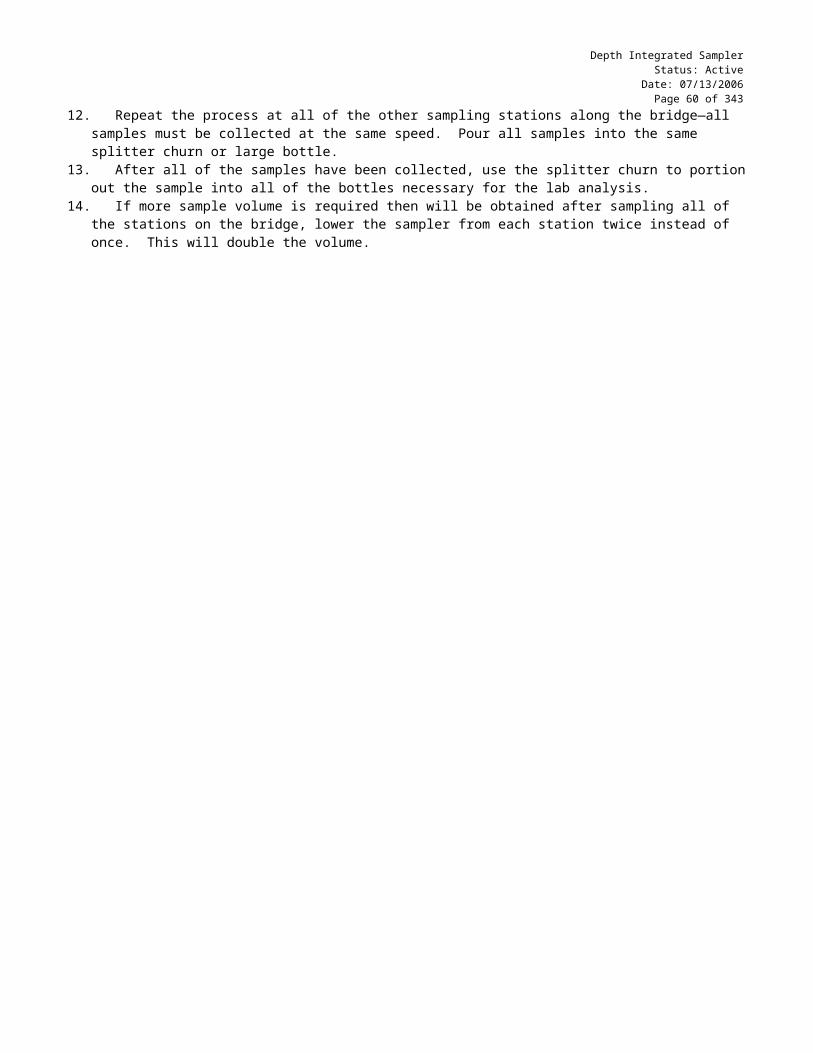
Field Data SheetsStatus: Active
Date: 07/13/2006Page 64 of 238
10. DEAD ANIMAL(S): Circle if dead animals, other than fish, are observed in the creek or in the bank-full channel.
11. IRON PRECIPITATES: Circle if there are significant quantities of iron oxyhydroxides due to iron precipitation commonly associated with acid mine drainage.
12. SILTATION: Circle if there is fine sediment buildup in the form of banks and bars and/or the substrate is embedded in fine sediment.
13. FLOW ALTERATION: Circle if the flow path has been modified or altered in some way—channelized, dammed, or other.
14. HABITAT ALTERATION: Circle if the in-stream or riparian zone habitat has been adversely changed/modified.
15. OIL FILM/GREASE: Circle if an oil sheen or petroleum products are observed; do not confuse with iron bacteria. Iron bacteria sheens will break into jagged or rough edged pieces when stirred with a stick/finger, while oil film/grease will not break apart but remain a coagulate sheen that flows with the stirring device.
16. OFFENSIVE ODOR: Circle if the smell of the creek is particularly fetid or foul smelling.17. EXOTIC SPECIES: Circle when unusual, unacceptable, and/or unexpected exotic species (e.g., zebra
mussels) are observed and there is an associated and severe impact on the habitat or aquatic community, record observed species in the comments section. Consult with the Senior Biologist before using as a Source Code in the 319 Assessment Report.
Site Conditions:Record information relevant to the particular site you are collecting.
WIND DIRECTION: Direction refers to the compass location that the wind is blowing from. For example, when the wind is blowing from the north, headed in a southerly direction, the wind is out of the north or a north wind. Mark the direction to the nearest secondary compass direction (N, NE, E, SE, S, SW, W, NW, etc.).
AIR TEMP: Record the air temperature only in degrees Celsius. The reading should be made with a dry thermometer in the shade.
Canopy Cover:Canopy cover refers the amount of shading or light interception that is occurring in the general location where the sample is being collected. Canopy cover should be estimated based on the actual shading conditions at the time of collection—this may vary seasonally with the presence or absence of leaves. The intent of this measurement is to be able to correlate the amount of light reaching the water surface, and it is also relevant for DO observations. Circle the appropriate number; select ONLY ONE.
1. SPARSE: No cover to partial shade; >0 - 10% canopy cover.2. MODERATE: Some amount of shade; >10 - 40% canopy cover.3. SIGNIFICANT: Sizable amount of shade; >40 - 60% canopy cover.4. DENSE: Dense shade; >60% canopy cover.5. TOTAL DARKNESS: Sample taken at night or in a cave.
Wind Speed:The Beaufort number is a more appropriate qualitative method for measuring wind speed when quantitative methods are unavailable. The scale is based on easily observable factors. Estimates should be made based on observing factors (e.g. leaves and small trees) that are located in adjacent riparian zone below the first terrace. Circle only one number.
Beaufort Number Description Characteristic Speed (mph)1 Calm smoke rises straight up < 12 Slight; smoke drift wind shown by smoke drift 1 – 33 Light; felt on face wind felt on face 4 – 74 Leaves; twigs move flag extends; leaves in motion 8 – 125 Branches move dust & paper blown in wind; small branches move 13 – 186 Small trees sway small trees sway 19 – 247 Other umbrellas are difficult to use and a stronger >24

Field Data SheetsStatus: Active
Date: 07/13/2006Page 65 of 238
Weather:Refers to the general weather conditions observed at the time of sampling. Circle ONLY ONE of the appropriate numbers, whichever most clearly describes the weather condition for that site.
1. FAIR SKIES: Circle if skies are clear or cloudy with no obvious indicators of foul weather.2. OVERCAST Circle if skies are cloudy with the indication of foul weather3. HAZE: Circle if there is a mixture of dust, smoke, or vapor that obscures visibility.4. FOG: Circle if there is a cloud-like mass of condensed water vapor.5. DRIZZLE: Circle if there is light rain or mist.6. INTERMIT’NT RAIN: Circle if there are reoccurring periods of rain of varying intensity. 7. RAIN: Circle if there is a consistent shower of rain.8. HEAVY RAIN: Circle if there is a consistent shower of rain of significant intensity—
downpour/thunder storm.9. SNOW/SLEET/ICE: Circle if it is snowing, sleeting, hailing, or freezing rain. 10. CAVE: Circle if the collection site is in a cave.
Periphyton Information:This is a qualitative assessment of a small section of a stream intended to provide insight into nutrient enrichment by observing a component of its primary productivity. Circle the appropriate number if applicable for the site.
Periphyton Density: Indicates the presence and type of periphyton in the stream. Circle the appropriate description for each type: “absent”, “sparse”, “moderate”, or “abundant”:
1. ABSENT: Circle if there is no observable algae.2. SPARSE: Circle if there is a thin film of algae that cannot be measured by holding a ruler
perpendicular to the surface of the substrate.3. MODERATE: Circle if there is a “moderate” film of algae; the thickness of the attached algae
does not exceed 5 mm.4. ABUNDANT: Circle if there is an “abundant” film of algae; the thickness of the attached algae
exceeds 5 mm.
Macroperiphyton In Stream: Refers to the aerial percent of the substrate that is covered with readily visible, green, filamentous algae (e.g. Cladophora, Lemnia, filamentous green algae, etc…), not brown colored periphyton (diatoms, etc…). Circle the approximate percent of the substrate that is covered by this type of algae. (Macroperiphyton has no accepted taxonomic or scientific meaning; it is a descriptive term used by OCC-WQ.).
Macroperiphyton Type: If a percentage value >0 was circled in the Macroperiphyton section, then a type of periphyton must be circled. Record whether the general type and relative dominance of the periphyton community is “Common” or “Present.”
NON-CLADOPHORA all algae other than Cladophora CLADOPHORA green, coarse, not slick to the touch AQUATIC MOSS true moss, true leaves and stems present
1--- COMMON frequently observed 2--- PRESENT occasionally observed
Habitat Observed: Circle the periphyton habitat observed when the previous two observations were made (density and % coverage). Circle only one: 1-riffle (includes runs and glides), 2-pool, or 3-both.

Field Data SheetsStatus: Active
Date: 07/13/2006Page 66 of 238
Physical/Chemical Data:This information should be recorded as dictated by the QAPP, collection activity, and field conditions.
DO: Both the amount of Dissolved Oxygen in mg/L (ppm) and the Percent Saturation must be recorded for each area as follows:
RUN: DO should be measured in a run above a riffle for general stream water quality sampling efforts.
RIFFLE: DO is sampled in a riffle when fish are collected. Otherwise, it’s the second choice of instream habitat in which WQ sample event DO should be measured.
POOL TOP: DO is sampled at the pool top when fish are collected. Otherwise, it’s the third choice of instream habitat in which WQ sample event DO should be measured.
POOL BOTTOM: DO is sampled at the pool bottom when fish are collected if water is greater than one half meter deep.
TURB: Using a turbidimeter, record the value in NTU (nephelometric turbidity units). ALK: Using an alkalinity titrator and appropriate multiplier, record the value in mg/L as
CaCO3. WATER TEMP: Using the DO meter, record the temperature in oC. CONDUCTIVITY: Using the conductivity meter, record the conductivity in uS. pH: Using the pH meter, record the pH in SU. TURBIDITY CAUSE: Indicate whether the cause of turbidity is related to “Organic” or “Inorganic”
matter. “Organic” refers to planktonic algae (usually indicated by green color), bacteria, etc…, while “inorganic” refers to clay and larger sized particles imparting a muddy appearance or hue to the water (particularly evident after runoff events).
Flow Information:Circle the appropriate description of stream flow. Circle if flow is an applicable measurement, or if flow is not applicable “X” out the section.
Stream Stage: Circle ONLY ONE:
1. DRY: Circle if there is no observable water in the stream bed (no pools), stream appears to be completely dry or devoid of standing water.
2. NO FLOW: Circle if there is no measurable flow in the stream; pools are present, but no running water; or it is moving via the subsurface.
3. TRACE: Circle if there is slight movement of water is detected, but it is too slow to measure accurately with a semi-submergible object.
4. LOW: Circle if flow is below the seasonal base flow level.5. BASE: Circle if flow is at the approximate base flow level.6. SLIGHTLY ELEV: Circle if flow is above the seasonal base flow, but less than 1 inch above the norm.7. ELEVATED: Circle if flow is above the seasonal base flow level (greater than 1 inch, 2.54 cm).8. ELEV/NO FLOW: Circle if water is above the seasonal base level, but no flow is observed.9. HIGH FLOW: Circle if flow is well above the seasonal base flow level (e.g. storm water runoff).
Stage Qualifier:Circle ONLY ONE:
1. STABLE: Circle if there is no immediately anticipated change in the flow.2. RISING: Circle if flow stage is increasing.3. FALLING: Circle if flow stage is decreasing.4. UNKNOWN: Circle if the flow stage is unascertained or not determined.
Discharge: Refers to stream discharge or volume of water per unit time (volumetric flow). Flow is recorded in cubic feet per second (CFS).
DISCHARGE: If a flow meter is used, a Flow Meter Data Sheet must be turned in. Calculation of flow will be performed by the database based on the information recorded on the flow sheet; therefore, it is not necessary to enter a value for discharge. However, if the flow is estimated or measured by the semi-submergible object method, a discharge value must be recorded.

Field Data SheetsStatus: Active
Date: 07/13/2006Page 67 of 238
GAUGE HEIGHT: Record the OCC WQ staff gauge height if applicable. This value must be recorded if a staff gauge is installed at a site and no flow meter reading was taken due to high water or storm event.
Observed Landuse/Source of Impact:In this section, record the landuse in the immediate vicinity of the sampling location. In general this refers to the visual distance (400 M) around the sampling point. Other significant landuses observed in the watershed should be recorded in the comments section. Information recorded in this section may be used in the 319 Assessment report. The field personnel can enter up to six (6) different landuse codes. Use the comment section if more space is needed.
Landuse Code: Record the source code in the blanks provided. The appendix has a listing of the source codes as listed in the 305 (b) guidance. If “natural” conditions are observed in the riparian area record “0000”, or if the source is unknown record “9000”. For all other landuses enter the source code. If you are uncertain, make a note in the comments section.
Landuse Qualifier:Estimate the degree of impact associated with the immediate land use by circling the appropriate number.
1 Circle if there is no visible impact; no observed effect on the beneficial uses. 2 Circle if there is probable impact; some effect on the beneficial uses—assumed. 3 Circle if there is definite impact; an obvious effect on the beneficial uses.
Comments:Use this section to compliment the specific information requested above. Add any observations you feel important or relevant to the data collection or for characterizing the site. If unable to perform sampling due to dry or no flow conditions (for benthic macroinvertebrates only), indicate such in comments and include whether it is a “scheduled water collection” or “scheduled benthic macro collection”. Circle yes (Y) to indicate if additional notes were made on the back of the page.
1.9 Data Management & Records Management
1.9.1 DataOrganizationAll of the field data sheets should be organized in a consistent manner prior to submission. For each sampling location, all of the field data sheets clipped together (e.g. with a paper clip or binder clip) with the appropriate Site Collection Sheet. If an activity is performed and completed at a site, the corresponding Site Activity on the Site Collection Sheet will be checked (e.g. √ or X). For instance, if flow was measured using a flow meter, fish were collected, and a long habitat assessment conducted, all three forms should be grouped with the specific Site Collection Sheet and these three Site Activities will be checked on the Site Collection Sheet as completed activities. It is important to note that if an activity was not performed or was incomplete, do not check that activity, as the Site Activities on the Site Collection Sheet are for completed activities only. Thus, in this example, Site Collection Sheet will be followed with a Flow Meter Sheet, Fish Collection Sheet, and Stream Habitat Assessment Sheet. All of the Site Collection Sheets with corresponding data sheets are then organized in date/time order. All of the grouped Site Collection Data Sheets should be clipped together (e.g. with a paper clip or binder clip) with that day’s Sampling Episode Sheet on top. If any samples are sent to a lab for processing (e.g. water quality samples, fish collection, etc.) the pink copy or a Xerox copy of the Chain of Custody form(s) should be the last document for that Sampling Episode event.
Once all the information has been recorded on the appropriate sheets and the sheets properly organized, they should be submitted to the Office Manager (Ann Cravens) to be “Received” and forwarded to the Data Manager (Margaret Blevins) for processing and data entry.
1.9.2 Chain of Custody ProcedureThe handling of Chain of Custody forms should follow the procedures described in the Chain of Custody and Sample Labeling SOP.

Field Data SheetsStatus: Active
Date: 07/13/2006Page 68 of 238
2.0 QA/QC SECTION
2.1 TrainingAll field investigators will be trained to familiarize them with proper procedures used in recording field data. All field investigators are required to become familiar with the SOP documents. Prior to solo sample collection, field investigators are evaluated in a field setting for proper data recording techniques. Annual field audits are performed on field investigators to verify that the appropriate procedures outlined in the Quality Management Plan are being followed. The Data Manager should be consulted for issues regarding confusion over field data sheet completion.
2.2 MaintenanceAll field investigators will be responsible for maintaining a “clean” set of the most recent and up-to-date field data sheets so that legible copies can be maintained without smudges or smearing or printing off the sheet.
2.3 QC ProceduresThe data collection process will be evaluated by the Data Manager and/or Data Technician with every data submission (QA2). If glaring mistakes are observed, the data management personnel will reject the data submission and/or consult the Quality Assurance Officer and/or the Environmental Monitoring Coordinator. Less obvious mistakes will be flagged and forwarded to the Quality Assurance Officer for appropriate action and resolution. The Field Notebook will be scrutinized and evaluated by the Quality Assurance Officer at the quarterly calibration and maintenance session.
3.0 REFERENCES
APHA, AWWA, and WPCF (1992) Standard Methods for the Examination of Water and Wastewater, 15th edition, eds. L.S. Clesceri, A.E. Greenberg, and R.R. Trussell, American Public Health Association, Washington, D.C.
Csuros, M. (1994) Environmental Sampling and Analysis for Technicians, Lewis Publishers, Boca Raton.

Field Data SheetsStatus: Active
Date: 07/13/2006Page 69 of 238
4.0 APPENDIX
4.1 Dissolved Oxygen tables
Table 1: Solubility of Oxygen in Fresh WaterTEMP (oC) mg/L DO TEMP (oC) mg/L DO
0 14.60 23 8.561 14.19 24 8.402 13.81 25 8.243 13.44 26 8.094 13.09 27 7.955 12.75 28 7.816 12.43 29 7.677 12.12 30 7.548 11.83 31 7.419 11.55 32 7.2810 11.27 33 7.1611 11.01 34 7.0512 10.76 35 6.9313 10.52 36 6.8214 10.29 37 6.7115 10.07 38 6.6116 9.85 39 6.5117 9.65 40 6.4118 9.45 41 6.3119 9.26 42 6.2220 9.07 43 6.1321 8.90 44 6.0422 8.72 45 5.95

Field Data SheetsStatus: Active
Date: 07/13/2006Page 70 of 238
Table 2 shows the correction factor that should be used to correct the calibration value for the effects of atmospheric pressure or altitude. Find true atmospheric pressure in the left-hand column and read across to the right hand column to determine the correction factor. (Note that "true" atmospheric pressure is as read on a barometer. Weather Bureau reporting of atmospheric pressure is corrected to sea level.). If atmospheric pressure is unknown, the local altitude may be substituted. Select the altitude in the center column and read across to the right hand column for the correction factor.
Table 2: Correction For Atmospheric Pressure (YSI) ATMOSPH PRESS
(mmHg)ALTITUDE
(ft)CORRECTION
FACTOR775 540 1.02760 0 1.00745 542 0.98730 1094 0.96714 1688 0.94699 2274 0.92684 2864 0.90669 3466 0.88654 4082 0.86638 4756 0.84623 5403 0.82608 6065 0.80593 6744 0.78578 7440 0.76562 8204 0.74547 8939 0.72532 9694 0.70517 10472 0.68502 11273 0.66

Field Data SheetsStatus: Active
Date: 07/13/2006Page 71 of 238
4.2 Source Codes from the Waterbody System
0100 Industrial Point Sources0110 Major Industrial Point Sources0120 Minor Industrial Point Sources0200 Municipal Point Sources0210 Major Municipal Point Sources0220 Minor Municipal Point Sources0230 Package Plants (Small Flows)0400 Combined Sewer Overflow0900 Domestic Wastewater Lagoon1000 Agriculture1100 Nonirrigated Crop Production1200 Irrigated Crop Production1300 Specialty Crop Production (e.g., horticulture,
citrus, nuts, fruits)1400 Pastureland1500 Rangeland1510 Riparian Grazing*1520 Upland Grazing*1600 Animal Operations*1620 Concentrated Animal Feeding Operations
(permitted, point source)*1640 Confined Animal Feeding Operations
(NPS)*1700 Aquaculture1800 Off-farm Animal Holding/Management
Area*1900 Manure Lagoons2000 Silviculture2100 Harvesting, Restoration, Residue
Management2200 Forest Management (e.g., pumped drainage,
fertilization, pesticide application)*2300 Logging Road Construction/Maintenance2400 Silvicultural Point Sources3000 Construction3100 Highway/Road/Bridge Construction3200 Land Development4000 Urban Runoff/Storm Sewers4100 Nonindustrial Permitted4200 Industrial Permitted4300 Other Urban Runoff
5000 Resource Extraction5100 Surface Mining5200 Subsurface Mining5300 Placer Mining5400 Dredge Mining5500 Petroleum Activities5600 Mill Tailings5700 Mine Tailings5800 Acid Mine Drainage6000 Land Disposal6100 Sludge6200 Wastewater6300 Landfills6400 Industrial Land Treatment6500 Onsite Wastewater Systems (Septic Tanks)6600 Hazardous Waste6700 Septage Disposal7000 Hydromodification7100 Channelization7200 Dredging7300 Dam Construction7350 Upstream Impoundment7400 Flow Regulations/Modification7550 Habitat Modification (other than
Hydromod)*7600 Removal of Riparian Vegetation7700 Streambank Modification/Destabilization7800 Drainage/Filling of Wetlands7900 Marinas8100 Atmospheric Deposition8200 Waste Storage/Storage Tank Leaks8300 Highway Maintenance and Runoff8400 Spills8500 Contaminated Sediments8600 Natural Sources8700 Recreational Activities8900 Salt Storage Sites8910 Groundwater Loadings8920 Groundwater Withdrawal8950 Other*9000 Unknown Source
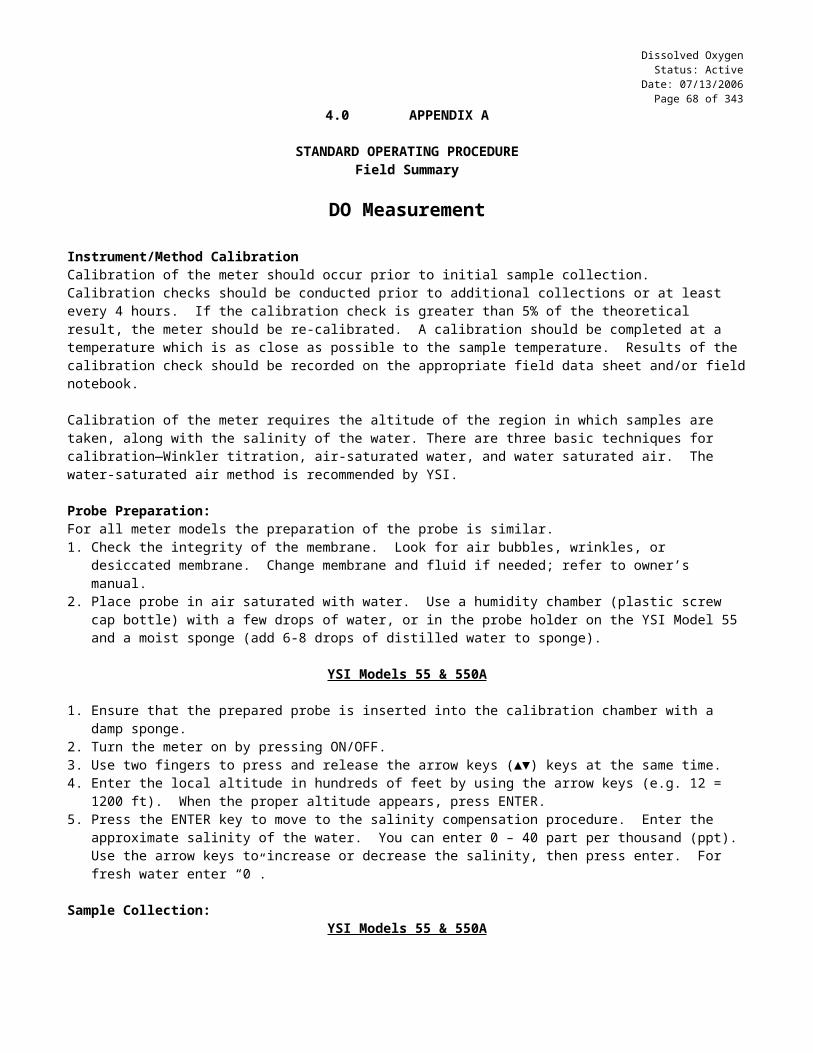
4.3 Sample Collection type code numbers
CODE NUMBER
SAMPLE COLLECTION
TYPE
GEAR TYPE DESCRIPTION
010 Grab Sample Sample container Sample taken at one location in the waterbody without necessarily accounting for spatial or temporal
influences. One point in time. (Refer to SOP IIA-01)020 Width/Depth Integrated Depth intergraded
sampler e.g. bombA composite sample taken that accounts for spatial
variability along the vertical and horizontal axis. (Refer to SOP. (Refer to SOP IA-06)
030 Time Interval—manual Sample container A composite sample manually collected based on a predetermined time interval. (Refer to the QAPP)
031 Time Interval—automated
Automated sampler A composite sample automatically collected based on a predetermined time interval. (Refer to the QAPP)
040 Discharge Interval—manual
Sample container A composite sample manually collected based on a predetermined a discharge value(s). (Refer to the
QAPP)041 Discharge Interval—
automated Automated sampler A composite sample automatically collected based on
a predetermined a discharge value(s). (Refer to the QAPP)
050 Time/Discharge Automated sampler A composite sample automatically collected based on a set time period and accounting for discharge
variability. (Refer to the QAPP)060 Width Interval Depth specific
sampler (Van Dorn, Kemmerer)
A composite sample collected at a predetermined point(s) along the width of a waterbody at a specific
depth. (Refer to the QAPP)070 Depth Interval Depth specific
sampler (Van Dorn, Kemmerer)
A composite sample collected at a specific depth in the waterbody. (Refer to the QAPP)
080 Single Stage Sample Stage Sampler A sample that is collected when the waterbody stage reaches a predetermined height. (Refer to the QAPP)
081 Multiple Stage Sample Stage Sampler A composite sample collected at 2 or more predetermined levels. (Refer to the QAPP)
090 Point/Pipe Sample Sample container A sample that is collected at a specific point, pipe or well where spatial variability is limited. (Refer to the
QAPP)100 Not assigned NA

Fish Collection Status: Active
Date: 07/13/2006Page 73 of 238
OKLAHOMA CONSERVATION COMMISSIONWATER QUALITY DIVISION
STANDARD OPERATING PROCEDURE
FISH COLLECTION(Seining and Electrofishing)

Fish Collection Status: Active
Date: 07/13/2006Page 74 of 238
1.0 PROCEDURAL SECTION
1.1 Scope and Application7,8
Fish assemblage monitoring is an integral component of the Oklahoma Conservation Commission’s Water Quality program. Assessment of the fish assemblage measures the structure and function of the ichthyofaunal community to evaluate the integrity of a stream.
1.2 Summary of MethodThe collection of fish follows a modified version of the EPA Rapid Bioassessment Protocol V (EPA, 1989) supplemented by other documents. Specific techniques for, and relative advantages of seining and electrofishing vary considerably according to stream type and conductivity. The specifics are discussed in detail in Fisheries Techniques (edited by L.A. Nielsen and D.L. Johnson and published by the American Fisheries Society 1983).
The collection of fish involves the use of two collection methods, seining and electroshocking. The combination of methods was selected in order to produce a representative fish collection. Variations of habitat, type of fish, and water chemistry dictate the use of different collection techniques. In general, each stream is sampled for a distance of 400 m. Seine height is dictated by water depth, and length is determined by width of the water being sampled. If possible, the seine should be 15-25% longer than the width of the waterbody being sampled and about 25% higher than the depth of the water. The seine is hauled with the current because fish tend to orient towards the current.
Electrofishing involves the use of a backpack shocker that consists of a trailing stainless steel cable electrode and ring electrode mounted on the end of a fiberglass pole. The shocking team consists of at least two people. One carries and operates the shocker while the other(s) net stunned fish. The shocker is most useful where a seine cannot be used effectively in areas such as brush piles, rootwads, and cobble substrates. The forward electrode is gradually passed back and forth as the team walks downstream. As fish are stunned, they usually roll over and become more visible, allowing the netters to see and capture them. In waters of high conductivity (> 1000 μS/cm) electroshocking is rendered ineffective due to the highly conductive nature of the water. Under these conditions, only seining is conducted.
In general, all fish are placed in 10% formalin immediately after capture. However, if larger fish (> 100 g) can be positively identified in the field, they are returned to the water in a location where recapture is unlikely. All large fish released are photographed on print film. A representative photograph is taken when large numbers of one fish species is collected and released. Collected organisms are identified to species by an experienced taxonomist.
1.2.1 Definitions Summer Collection Period: June 1 to September 15.
1.3 Health and Safety Warnings Primary responsibility for safety while electroshocking rests with the team leader. All crew members should receive training in First Aid and CPR. Electro-fishing units have a high voltage output and may
deliver dangerous electrical shock. Electric shock can cause heart fibrillations and/or death. While electrofishing, avoid contact with water unless sufficiently insulated against electric shock. Use chest waders with
non-slip soles and water-tight rubber gloves that cover to the elbow. If they become wet inside, stop fishing until thoroughly dry.
Avoid contact with anode at all times. At no time while electrofishing should a crewmember reach into the water for any reason.
The electrofishing equipment provided is equipped with a 45 degree tilt switch which interrupts the current. Do not make any modifications to the electrofishing unit, which would make it impossible to turn off the electricity.
General safety guidelines should be observed. If waders or gloves develop leaks, leave the water immediately. Avoid operating electrofishing equipment near people, pets or livestock. Discontinue any activity in streams during thunderstorms or heavy rain. Rest if crew becomes fatigued.
Decision to use electrofishing equipment will depend on size of site, flow, conductivity and turbidity. If the specific conductivity is below 10 uS or > 1000ms; if the flow is too high; if the site is too deep; if the water is too turbid to assure
7 Text taken directly or in part from “Rapid Bioassessment Protocols for Use in Wadeable Stream and Rivers, 2nd Edition”, US EPA 841-B-99-002 July 1999
8 Text taken directly or in part from Dan Butler, Senior Biologist, Oklahoma Conservation Commission (2000)

Fish Collection Status: Active
Date: 07/13/2006Page 75 of 238
safe footing or locate stunned fish, the crew may consider using the seine only or determine that site cannot be sampled. This is a safety decision.
Formalin is a carcinogen and can also cause permanent damage to mucous membranes and eyes. Care must be taken when placing fish in formalin so that the fish does not flop around and splash formalin onto people near the jar. Proper precautions should be taken when handling formalin.
o Protective gloves and eyewear should be worno Avoid inhalation of vapors
FAILURE TO OBSERVE SAFETY PROCEDURES WILL RESULT IN DISCIPLINARY ACTIONS INCLUDING PROBATION AND DISMISSAL.
1.4 Cautions Do not collect fish without the permission of the Environmental Monitoring Coordinator.
1.5 Interference Electrofishing with the backpack shocker is not effective in waters with specific conductance over 1000 to 1200 uS Electrofishing using the boat shocker is not effective in waters with specific conductance over 1700 uS.
1.6 Personnel QualificationField personal must be trained and evaluated on sample collection techniques. Sample collection is subject to approval by the QA Officer and/or the Environmental Monitoring Coordinator. Training will be done through dry run exercises in the field to familiarize field personnel with procedures and techniques.
1.7 Apparatus & Materials
ClothingRubber Gloves as many pairs as the shocking crew consists ofWaders as many pairs as the shocking crew consists of, although everyone is responsible for their
own wadersGoggles for use in mixing formalin
DocumentationField data sheets Sampling Episode Sheet, Site Collection Sheet, Flow Meter Sheet and Fish CollectionWaterproof paper for labels inside jarPencils labelingSharpie pen for labeling jarExtra white paper used for a background for fish picturesClipboardCameraTwo rolls print filmTape measure to record lengths of released fish if desired
Chemicals10% buffered formalin
ShockerSmith Root LR24 backpack shocker ElectrodeBattery
Nets4 x 10, 6 x 30, and 4 x 30 seines and any other seines that are preferred by the crew leader. All seines should be ¼
inch mesh.Dip nets to collect shocked fish with
ContainersWide mouth 1-gallon jars, at least 4 per site

Fish Collection Status: Active
Date: 07/13/2006Page 76 of 238
1 or 2 liter graduated cylinder for mixing 10% formalin (37% formaldehyde)Whirl-Paks for putting special fish in
InstrumentsDO meter pH meter Conductivity meter Turbidity meter Alkalinity test kitFlow meter
1.8 Instrument/Method CalibrationRefer to the appropriate SOP and/or owners manual.
1.9 Preparation 1,2
A representative stream reach is selected and measured such that primary physical features are included in the reach (riffles, runs, and pools)
The reach should be located away from the influences of major tributaries and bridge/road crossings. In general, each stream is sampled for a distance of 400 m.
Seining
Seine height is dictated by water depth, and length is determined by width of the water being sampled. If possible, the seine should be 15-25% longer than the width of the waterbody being sampled and about 25% higher than the depth of the water. The amount of obstructions in the stream will often preclude the use of longer seines however. When this situation occurs, the crew leader will decide on the most effective combination of seines. OCC utilizes 4 and 6 foot seines in 10, 20, and 30-foot lengths. This will allow the center of the net to form a bag behind the operators where the fish are more likely to stay in the net. The seine is hauled with the current because fish tend to orient towards the current.
Electrofishing
The shocker consists of a trailing stainless steel cable electrode and either a ring or diamond electrode mounted on the end of a fiberglass pole. Under most conditions, both the ring and diamond electrodes can be used at the same time. In waters of extremely low conductivity (<40 uS). The ring should be used. In waters of high conductivity (>500 uS) only the diamond should be used. In very deep water where the ring seems to be ineffective the diamond electrode may offer better results.
The shocking team consists of at least two people. One carries and operates the shocker while the other(s) net stunned fish.
The shocker is most useful where a seine cannot be used effectively in areas such as brush piles, rootwads, and cobble substrates.
In waters of high conductivity (>1000 μS/cm) electroshocking is ineffective, due to the highly conductive nature of the water. Under these conditions, only seining is conducted.
1.10 Sample CollectionSeining
1. The seine should be manually pulled through the water. Since fish tend to orient towards the current, the direction of the seine haul should generally be with (in the same direction of) the current.
2. The lead line should be kept on the bottom, and in front of the float line.3. If there are many obstructions on the bottom, the lead line will become caught or bounce and most fish will escape
underneath the bottom of the net. If this happens use a smaller net that allows you to avoid obstructions or go to electroshocking.
4. The brailes of the net should be used to disturb the area under any undercut banks or beds of macrophytes near the edge, in order to scare fish hiding under cover out towards the middle of the net.
5. Under ideal conditions the net should be pulled through the water in the manner described above for about 10 meters and dragged out of the water on a gradually sloping pre-selected beach. The person pulling the seine on the side of the stream

Fish Collection Status: Active
Date: 07/13/2006Page 77 of 238
opposite the beach should swing ahead of the other person so that the seine is pulled out on the beach stretched over the same distance it was stretched in the stream.
6. If the stream does not have gradually sloping banks, the dip method should be used. This method consists of sweeping around and through the area to be sampled, keeping a wide bag and moving the lead line as much under the undercut bank as possible. Use the brailes to probe repeatedly as far as possible into the undercut area working towards each other until the brailes overlap. The seine should then be swiftly stretched and lifted vertically from the water. An alternative method of retrieving fish under these conditions is to slowly turn the brailes to wind the net up once they have overlapped to form an enclosure. This may entangle the fish with the net and allow them to be lifted out of the water with the rolled up net.
Shocking
1. Before operating or assisting with the shocker, READ AND UNDERSTAND THE MANUALS for the generator and the shocker. Starting procedures, safety procedures and troubleshooting are well documented in these manuals and are not spelled out in this text. The manuals can be obtained from the equipment file in the main office.
2. Collection begins at a shallow riffle or other physical barrier at the downstream limit of the reach, and terminates at a similar barrier at the upstream end of the reach.
3. In general, fish collection procedures commence at the downstream barrier and proceeds in an upstream direction; however, this is up to the discretion of the Crew Leader.
4. A minimum of two people is required for electrofishing.5. The forward electrode should be gradually passed back and forth over the stream width, including brush piles and
rootwads. As fish are stunned, they will usually roll over and become more visible, allowing the netter(s) to see and capture them.
6. In very dense brush or root cover, fish often sense the presence of the team before they are close enough to be stunned and then retreat so deeply into cover that it is impossible to net them when they are stunned. It is often better in situations such as these to insert the electrode into the brush before it is turned on, give the fish a minute or so to get used to the new situation and then turn the current on. Many fish will be much closer to the edge of brushpile when they are stunned in this manner.
1.11 Sample Handling & Preservation1. Fish collected by seining and electroshocking should be kept in separate jars and labeled as to what method was used to
capture them. This will make the methods independent if desired for analysis.2. Label each jar. Using a pencil, write the date, WBID #, collection time, stream name, number of jars composing one
sample, county, legal location, and crew leader’s name on a piece of ~2 x 3 inch waterproof paper and place one label into every jar of fish from each site. Write the same information on the front of each jar using a wax pencil or an indelible marking pen.
3. In general all fish should be placed in 10% formalin immediately after capture. There are a few exceptions made for larger fish (>100 gms or 0.25 lbs), which can be positively identified in the field.
a. If all team members agree on the identification of such a fish, it can be returned to the water far enough away that recapture is unlikely.
b. All large fish released must be documented on the Fish Collection Sheet. This includes fish such as gars, all types of carpsuckers, black bass, any white bass in water where yellow bass or striped/white hybrids may be found, all buffalo, all redhorse, and any other unusual fish. Please note, the golden and black redhorse cannot be told apart without counting lateral line scales and pelvic rays. Unless this information is recorded on the Fish Collection Sheet, the fish must be brought in for identification, or recorded as Moxostoma sp. Similar notes must be taken when releasing other fish that can be difficult to tell apart in the field such as the river and shorthead redhorses or any of the buffalos.
c. All large fish released must be photographed on print film. It is important to take photos and label them so that they will be identifiable 5 to 7 years from now. Be sure to follow the Photodocumentation SOP. The photos are data, and should be labeled as to the ID of the fish in the picture, the date, WBID #, site time, stream name, county, and legal location of the site. One copy should be kept in the Crew Leader’s files, and one should be forwarded to the Data Manager. In addition, a Photo Log Sheet (see SOP Appendix: Data Sheets) should be filled out.
2. When preserving fish much larger than 0.3 to 5 kg (0.5 to 10 lbs), the fish should be sliced open along the lower rib inorder to allow the formalin to penetrate the body cavity fast enough to prevent decay. A slit through the ribs is preferred to a belly slit to facilitate counting belly scales in the lab.
3. Formalin is a carcinogen and can also cause permanent damage to mucous membranes and eyes. Care must be taken when placing fish in formalin so that the fish does not flop around and splash formalin onto people near the jar. The fish should

Fish Collection Status: Active
Date: 07/13/2006Page 78 of 238
be put into the jar with the lid tilted open away from the operator so that the lid shields the face and body of the operator. Flood any skin exposed to formalin with plenty of water as soon as possible. If it gets in your eyes, flood the eyes with water immediately and go to the doctor immediately after that.
4. Fill out a Chain of Custody Form.5. The Crew Leader is responsible for transferring the samples to the Fish Sample Custodian (Brooks Tramell).
1.12 Sample Preparation and AnalysisNot applicable
1.13 TroubleshootingConsult owners’ manuals and/or the Environmental Monitoring Coordinator
1.14 Data Acquisition, Calculation & Data ReductionNot applicable
1.15 Computer Hardware & SoftwareNot applicable
1.16 Data Management & Records Management
1.16.1 Field NotationAll measurements and observations made at each site should be recorded on the Site Collection Sheet (see SOP Appendix: Data Sheets); include all physical and chemical information including DO for runs, riffles, pool top, and pool bottom—when available. Data should be recorded following procedures outlined in the Procedure for Completing Field Data Sheets SOP. A Flow Meter Data Sheet (see SOP Appendix: Data Sheets) should also be filled out; see the Flow Measurement for Wadable Streams SOP. It is mandatory to follow the procedures outlined in the Photodocumentation SOP and complete a Photo Log Sheet (see SOP Appendix: Data Sheets).
1.16.2 Fish Collection Sheet:All observations should be recorded on the Fish Collection Sheet (see SOP Appendix: Data Sheets).
The following bullets will describe how the Fish Collection Sheet should be completed.
DATA SHEET HEADER INFORMATION: SITE NAME: Record the stream name from the USGS 7-1/2' map name. If a county map, soil
map, or other map has a different name, the USGS 7-1/2' map takes precedence. If a stream is unnamed on the USGS map, but named on another map, use that name, but write the name of the map in parentheses beside the stream name.
WBID #: Record the Water Body Identification number. LEAD INVESTIGATOR: Record the name of the person responsible for data custody and reporting DATE: Record the date in MM/DD/YY format. TIME: Record the site time in military format. The “site time” is when initial activities
began at the site. The site time should be the same on all forms associated with this site.
COLLECTION INFORMATION:
For each collection method used, fill in the appropriate specifications. For the backpack and boat-mounted shockers, indicate: SHOCKING TIME Record the amount of time spent shocking in seconds VOLT/AMPS Record the voltage and amperage on the shocker PULSES/SECOND Record the pulses per second setting on the shocker (measure of wave frequency) %DUTY CYCLE % of on time; product of pulse width and frequency (the actual time the current is
being delivered) REACH LENGTH Length of stream used in the fish collection
For the boat-mounted shocker only, also indicate: LOW RANGE or HIGH RANGE

Fish Collection Status: Active
Date: 07/13/2006Page 79 of 238
HANDHELD or UMBRELLA ARRAY PROBE.
If a seine is used, indicate: SEINING TIME Record the amount of time spent seining in minutes SEINE TYPE/SIZE Record the size and type of seines used
FISH IDENTIFIED & RELEASED: SPECIES Record the genus and species of the fish released or the common name if the
species can be definitely identified later based on that common name COUNT Record the number of individual organisms released
o SHOCK Number released during the shocking efforto SEINE Number released during the seining effort
COMMENTS Record any information that was used to help in the identification process PHOTO ID # Record the film identification number that corresponds to OCCWQ photo tracking
system. It is mandatory to follow the procedure outlined in the Photodocumentation SOP.
1.16.2 Habitat FormAt all sites where fish are collected, a stream habitat evaluation must be performed. It does not have to be done on the same day as the fish are collected, but should be done before major floods change the habitat. Refer to the Habitat Assessment SOP.
1.16.3 Chain of Custody ProcedureCollection of fish requires the use of a Chain of Custody form (COC). . The handling of COC should follow the procedures described in the Chain of Custody and Sample Labeling SOP. The manifest is routed as follows:
1. Fish samples are collected in the field and the COC is completed and signed by the field personnel involved with collection.
2. Samples are submitted to the Fish Data Custodian and the person receiving the samples signs the COC.3. Processed samples are sent to the taxonomist for identification. The taxonomist must sign the COC.4. After identification, taxonomic identification sheets will be forwarded with a copy of the signed COC to the
Data Manager. The COC form returned from the laboratory will include the laboratory tracking or log number(s) used to reference the identification sheet.
2.0 QA/QC SECTION
2.1 TrainingTraining of field personnel will be done through dry run exercises in the laboratory and field to familiarize them with instrument operation, use, calibration and maintenance. All samplers should read Fisheries Techniques (edited by L.A. Nielsen and D.L. Johnson and published by the American Fisheries Society 1983) prior to collecting fish. All operators are required to become familiar with the SOP documents. Prior to solo sample collection, field personnel are evaluated in a field setting for proper use of equipment and sample collection protocol. Annual field audits are performed on sample collectors following procedures outlined in the Quality Management Plan.
2.2 Maintenance Maintain the shocking equipment per the owners manual instructions Seines should be stored dry and tangle-free
2.3 QC ProceduresTemporal replicate samples should be collected at a frequency of 10% of collection effort. Thus, for every 10 collections, one site should be selected and resampled over the same reach at a different time but within the same hydrologic period (i.e., not across major seasonal change such that rainfall and temperature are significantly different between the samples). Replicate sampling within four weeks is preferred.

Fish Collection Status: Active
Date: 07/13/2006Page 80 of 238
3.0 REFERENCES
EPA, (1999) Rapid Bioassessment Protocols for Use in Wadeable Streams and Rivers, 2nd Edition, EPA 841-B-99-002, Office of Water, Washington, D.C.
Butler, D., (1999) Personal Communication, Senior Biologist, Oklahoma Conservation Commission, Oklahoma City, OK.
Nielsen, L.A. and D.L. Johnson, (1983) Fisheries Techniques, American Fisheries Society.
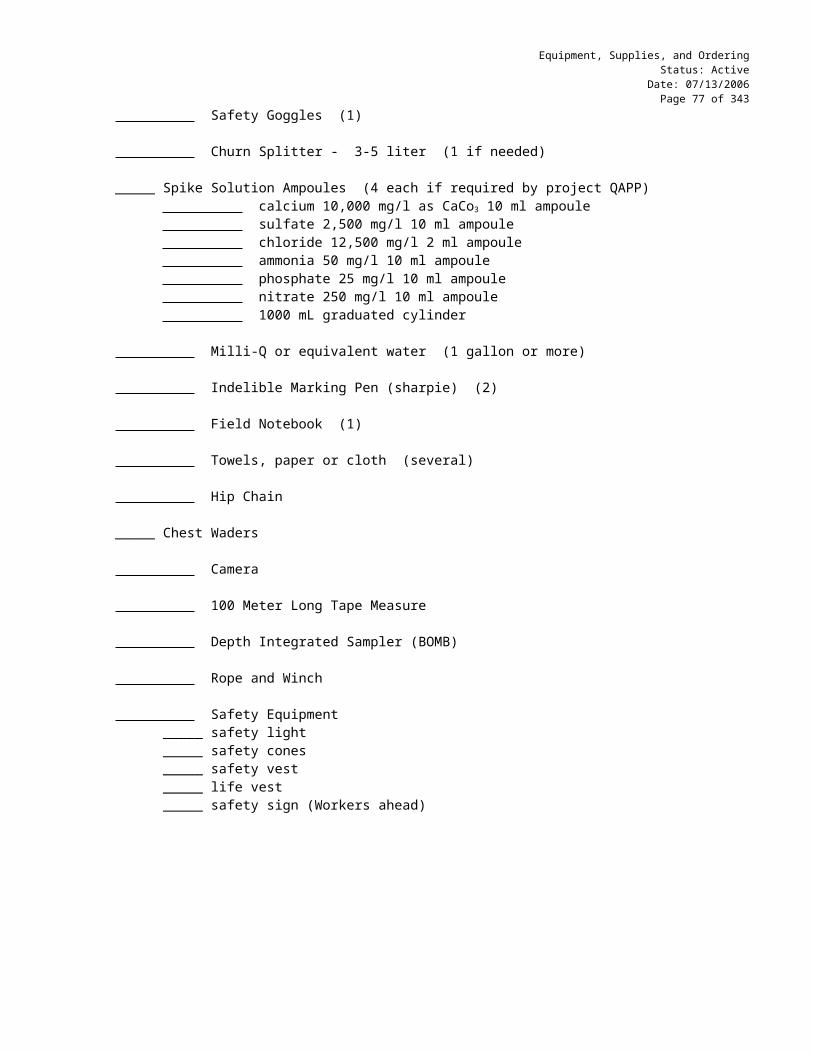
Fish Collection Status: Active
Date: 07/13/2006Page 81 of 238
4.0 APPENDIX A
STANDARD OPERATING PROCEDUREField Summary
Summer Collection Period: June 1 to September 15.
Health and Safety Warnings Primary responsibility for safety while electroshocking rests with the team leader. All crew members should receive training in First Aid and CPR. Electro-fishing units have a high voltage output and may
deliver dangerous electrical shock. Electric shock can cause heart fibrillations and/or death. While electrofishing, avoid contact with water unless sufficiently insulated against electric shock. Use chest waders with
non-slip soles and water-tight rubber gloves that cover to the elbow. If they become wet inside, stop fishing until thoroughly dry.
Avoid contact with anode at all times. At no time while electrofishing should a crewmember reach into the water for any reason.
The electrofishing equipment provided is equipped with a 45 degree tilt switch which interrupts the current. Do not make any modifications to the electrofishing unit, which would make it impossible to turn off the electricity.
General safety guidelines should be observed. If waders or gloves develop leaks, leave the water immediately. Avoid operating electrofishing equipment near people, pets or livestock. Discontinue any activity in streams during thunderstorms or heavy rain. Rest if crew becomes fatigued.
Decision to use electrofishing equipment will depend on size of site, flow, conductivity and turbidity. If the specific conductivity is below 10 uS or > 1000ms ; if the flow is too high; if the site is too deep; if the water is too turbid to assure safe footing or locate stunned fish, the crew may consider using the seine only or determine that site cannot be sampled. This is a safety decision.
Formalin is a carcinogen and can also cause permanent damage to mucous membranes and eyes. Care must be taken when placing fish in formalin so that the fish does not flop around and splash formalin onto people near the jar. Proper precautions should be taken when handling formalin.
o Protective gloves and eyewear should be worno Avoid inhalation of vapors
FAILURE TO OBSERVE SAFETY PROCEDURES WILL RESULT IN DISCIPLINARY ACTIONS INCLUDING PROBATION AND DISMISSAL.
Cautions Do not collect fish without the permission of the Environmental Monitoring Coordinator.
Interference Electrofishing with the backpack shocker is not effective in waters with specific conductance over 1000 to 1200 uS Electrofishing using the boat shocker is not effective in waters with specific conductance over 1700 uS.
Personnel QualificationField personal must be trained and evaluated on sample collection techniques. Sample collection is subject to approval by the QA Officer and/or the Environmental Monitoring Coordinator. Training will be done through dry run exercises in the field to familiarize field personnel with procedures and techniques.
Apparatus & MaterialsClothing
Rubber Gloves as many pairs as the shocking crew consists ofWaders as many pairs as the shocking crew consists of, although everyone is responsible for their
own wadersGoggles for use in mixing formalin
DocumentationField data sheets Sampling Episode Sheet, Site Collection Sheet, Flow Meter Sheet and Fish Collection
SheetWaterproof paper for labels inside jar

Fish Collection Status: Active
Date: 07/13/2006Page 82 of 238
Pencils labelingSharpie pen for labeling jarExtra white paper used for a background for fish picturesClipboardCameraTwo rolls print filmTape measure to record lengths of released fish if desired
ChemicalsGasoline/oil mix for generatorExtra two stroke oil10% buffered formalin
ShockerSmith Root LR24 backpack shocker ElectrodeBattery
Nets4 x 10, 6 x 30, and 4 x 30 seines and any other seines that are preferred by the crew leader. All seines should be ¼
inch mesh.Dip nets to collect shocked fish with
ContainersWide mouth 1-gallon jars, at least 4 per site1 or 2 liter graduated cylinder for mixing 10% formalin (37% formaldehyde)Whirl-Paks for putting special fish in
InstrumentsDO meter pH meter Conductivity meter Turbidity meter Alkalinity test kitFlow meter
Preparation 1,2
A representative stream reach is selected and measured such that primary physical features are included in the reach (riffles, runs, and pools).
The reach should be located away from the influences of major tributaries and bridge/road crossings. In general, each stream is sampled for a distance of 400 m.
Seining
Seine height is dictated by water depth, and length is determined by width of the water being sampled. If possible, the seine should be 15-25% longer than the width of the waterbody being sampled and about 25% higher than the depth of the water. The amount of obstructions in the stream will often preclude the use of longer seines however. When this situation occurs, the crew leader will decide on the most effective combination of seines. OCC utilizes 4 and 6 foot seines in 10, 20, and 30-foot lengths. This will allow the center of the net to form a bag behind the operators where the fish are more likely to stay in the net. The seine is hauled with the current because fish tend to orient towards the current.
Electrofishing
The shocker consists of a trailing stainless steel cable electrode and either a ring or diamond electrode mounted on the end of a fiberglass pole. Under most conditions, both the ring and diamond electrodes can be used at the same time. In waters of extremely low conductivity (<40 uS). The ring should be used. In waters of high conductivity (>500 uS) only the

Fish Collection Status: Active
Date: 07/13/2006Page 83 of 238
diamond should be used. In very deep water where the ring seems to be ineffective the diamond electrode may offer better results.
The shocking team consists of at least two people. One carries and operates the shocker while the other(s) net stunned fish.
The shocker is most useful where a seine cannot be used effectively in areas such as brush piles, rootwads, and cobble substrates.
In waters of high conductivity (>1000 μS/cm) electroshocking is ineffective, due to the highly conductive nature of the water. Under these conditions, only seining is conducted.
Sample CollectionSeining
The seine should be manually pulled through the water. Since fish tend to orient towards to current, the direction of the seine haul should generally be with (in the same direction of) the current.
The lead line should be kept on the bottom, and in front of the float line. If there are many obstructions on the bottom, the lead line will become caught or bounce, and most fish will escape
underneath the bottom of the net. If this happens use a smaller net that allows you to avoid obstructions or go to electroshocking.
The brailes of the net should be used to disturb the area under any undercut banks or beds of macrophytes near the edge, in order to scare fish hiding under cover out towards the middle of the net.
Under ideal conditions the net should be pulled through the water in the manner described above for about 10 meters and dragged out of the water on a gradually sloping pre-selected beach. The person pulling the seine on the side of the stream opposite the beach should swing ahead of the other person so that the seine is pulled out on the beach stretched over the same distance it was stretched in the stream.
If the stream does not have gradually sloping banks, the dip method should be used. This method consists of sweeping around and through the area to be sampled, keeping a wide bag and moving the lead line as much under the undercut bank as possible. Use the brailes to probe repeatedly as far as possible into the undercut area working towards each other until the brailes overlap. The seine should then be swiftly stretched and lifted vertically from the water. An alternative method of retrieving fish under these conditions is to slowly turn the brailes to wind the net up once they have overlapped to form an enclosure. This may entangle the fish with the net and allow them to be lifted out of the water with the rolled up net.
Shocking
Before operating or assisting with the shocker, READ AND UNDERSTAND THE MANUALS for the generator and the shocker. Starting procedures, safety procedures and troubleshooting are well documented in these manuals and are not spelled out in this text. The manuals can be obtained from the equipment file in the main office.
Collection begins at a shallow riffle or other physical barrier at the downstream limit of the reach, and terminates at a similar barrier at the upstream end of the reach.
In general, fish collection procedures commence at the downstream barrier and proceeds in an upstream direction; however, this is up to the discretion of the Crew Leader.
A minimum of two people is required for electrofishing. The forward electrode should be gradually passed back and forth over the stream width, including brush piles and
rootwads. As fish are stunned, they will usually roll over and become more visible, allowing the netter(s) to see and capture them.
In very dense brush or root cover, fish often sense the presence of the team before they are close enough to be stunned and then retreat so deeply into cover that it is impossible to net them when they are stunned. It is often better in situations such as these to insert the electrode into the brush before it is turned on, give the fish a minute or so to get used to the new situation and then turn the current on. Many fish will be much closer to the edge of brushpile when they are stunned in this manner.
Sample Handling & Preservation Fish collected by seining and electroshocking should be kept in separate jars and labeled as to what method was used to
capture them. This will make the methods independent if desired for analysis. Label each jar. Using a pencil, write the date, WBID #, collection time, stream name, number of jars composing one
sample, county, legal location, and crew leader’s name on a piece of ~2 x 3 inch waterproof paper and place one label into every jar of fish from each site. Write the same information on the front of each jar using a wax pencil or an indelible marking pen.
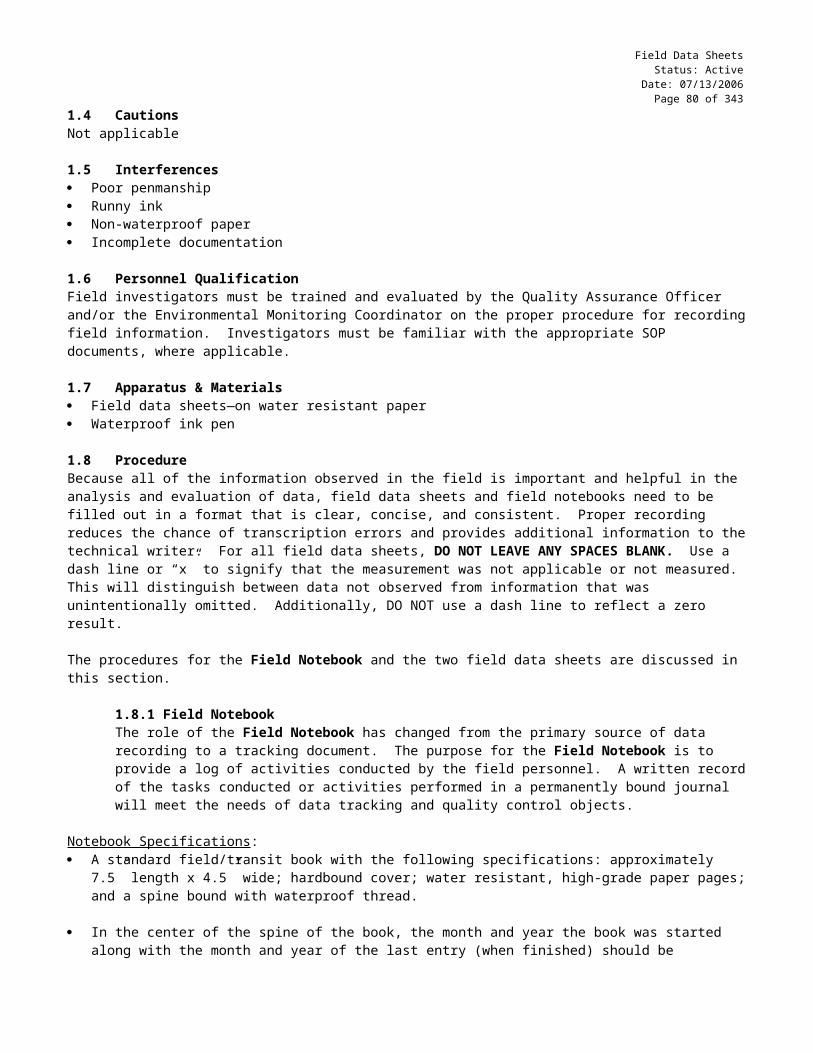
Fish Collection Status: Active
Date: 07/13/2006Page 84 of 238
In general all fish should be placed in 10% formalin immediately after capture. There are a few exceptions made for larger fish (>100 gms or 0.25 lbs), which can be positively identified in the field.
a. If all team members agree on the identification of such a fish, it can be returned to the water far enough away that recapture is unlikely.
b. All large fish released must be documented on the Fish Collection Sheet. This includes fish such as gars, all types of carpsuckers, black bass, any white bass in water where yellow bass or striped/white hybrids may be found, all buffalo, all redhorse, and any other unusual fish. Please note, the golden and black redhorse cannot be told apart without counting lateral line scales and pelvic rays. Unless this information is recorded on the Fish Collection Sheet, the fish must be brought in for identification, or recorded as Moxostoma sp. Similar notes must be taken when releasing other fish that can be difficult to tell apart in the field such as the river and shorthead redhorses or any of the buffalos.
c. All large fish released must be photographed on print film. It is important to take photos and label them so that they will be identifiable 5 to 7 years from now. The photos are data, and should be labeled as to the ID of the fish in the picture, the date, WBID #, site time, stream name, county, and legal location of the site. One copy should be kept in the Crew Leader’s files, and one should be forwarded to the Data Manager.
When preserving fish much larger than 0.3 to 5 kg (0.5 to 10 lbs), the fish should be sliced open along the lower rib in order to allow the formalin to penetrate the body cavity fast enough to prevent decay. A slit through the ribs is preferred to a belly slit to facilitate counting belly scales in the lab.
Formalin is a carcinogen and can also cause permanent damage to mucous membranes and eyes. Care must be taken when placing fish in formalin so that the fish does not flop around and splash formalin onto people near the jar. The fish should be put into the jar with the lid tilted open away from the operator so that the lid shields the face and body of the operator. Flood any skin exposed to formalin with plenty of water as soon as possible. If it gets in your eyes, flood the eyes with water immediately and go to the doctor immediately after that.
Fill out a Chain of Custody Form. The Crew Leader is responsible for transferring the samples to the Fish Sample Custodian (Brooks Tramell).
Data Management & Records Management
Field NotationAll measurements and observations made at each site should be recorded on the Site Collection Sheet; include all physical and chemical information including DO for runs, riffles, pool top and pool bottom—when available. A Flow Meter Data Sheet and Photo Log Sheet should also be filled out. A Fish Collection Sheet must be completed as described below:
DATA SHEET HEADER INFORMATION: SITE NAME: Record the stream named from the USGS 7-1/2' map name. If a county map, soil
map, or other map has a different name, the USGS 7-1/2' map takes precedence. If a stream is unnamed on the USGS map, but named on another map, use that name, but write the name of the map in parentheses beside the stream name.
WBID #: Record the Water Body Identification number. LEAD INVESTIGATOR: Record the name of the person responsible for data custody and reporting DATE: Record the site data in MM/DD/YR format. TIME: Record the site time in military format. The “site time” is when initial activities
began at the site. The site time should be the same on all forms associated with this site.
COLLECTION INFORMATION:For each collection method used, fill in the appropriate specifications. For the backpack and boat-mounted shockers, indicate:
SHOCKING TIME Record the amount of time spent shocking in seconds VOLT/AMPS Record the voltage and amperage on the shocker PULSES/SECOND Record the pulses per second setting on the shocker (measure of wave frequency) %DUTY CYCLE % of on time; product of pulse width and frequency (the actual time the current is
being delivered) REACH LENGTH Length of stream used in the fish collection.
For the boat-mounted shocker only, also indicate: LOW RANGE or HIGH RANGE

Fish Collection Status: Active
Date: 07/13/2006Page 85 of 238
HANDHELD or UMBRELLA ARRAY PROBE.
If a seine is used, indicate: SEINING TIME Record the amount of time spent seining in minutes SEINE TYPE/SIZE Record the size and type of seines used
FISH IDENTIFIED & RELEASED: SPECIES Record the genus and species of the fish released or the common name if the
species can be definitely identified later based on that common name COUNT Record the number of individual organisms released
o SHOCK number released during the shocking efforto SEINE number released during the seining effort
COMMENTS Record any information that was used to help in the identification process PHOTO ID # Record the film identification number that corresponds to OCCWQ photo tracking
system. It is mandatory to follow the procedure outlined in Photodocumentation SOP.
Habitat FormAt all sites where fish are collected, a stream habitat evaluation must be performed. It does not have to be done on the same day as the fish are collected, but should be done before major floods change the habitat. Refer to the Habitat Assessment SOP.
Chain of Custody ProcedureCollection of fish requires the use of a Chain of Custody form (COC). The handling of the COC should follow the procedures described in the Chain of Custody and Sample Labeling SOP. The manifest is routed as follows:
Fish samples are collected in the field and the COC is completed and signed by the field personnel involved with collection.
Samples are submitted to the Fish Data Custodian and the person receiving the samples signs the COC. Processed samples are sent to the taxonomist for identification. The taxonomist must sign the COC. After identification, taxonomic identification sheets will be forwarded with a copy of the signed COC to the Data
Manager. The COC form returned from the laboratory will include the laboratory tracking or log numbers used to reference the identification sheet.

Flow MeterStatus: Active
Date: 07/13/2006Page 86 of 238
OKLAHOMA CONSERVATION COMMISSIONWATER QUALITY DIVISION
STANDARD OPERATING PROCEDURE
FLOW MEASUREMENT(METER METHOD)
(Marsh-McBirney Flo-Mate 2000)
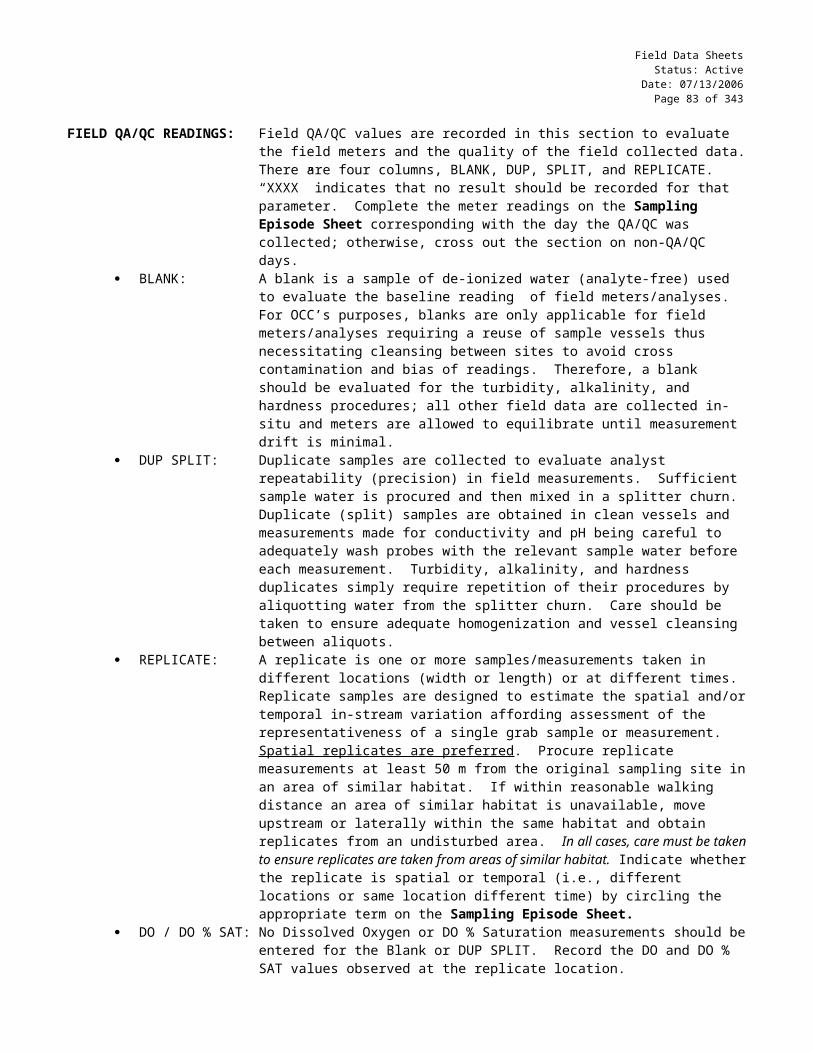
Flow MeterStatus: Active
Date: 07/13/2006Page 87 of 238
1.0 PROCEDURAL SECTION
1.1 Scope and Application9
The flow meter measures water velocity in terms of distance travel per unit time (e.g. ft/s). Determining velocity is necessary to calculate discharge, which is the measure of the volume of water per unit time. Flow can be measured by a variety of techniques, but for consistency and accuracy purposes, flow will be ideally measured using the Marsh-McBirney Model 2000 Flo-Mate.
1.2 Summary of Method1
The Flo-Mate measures flow using the Faraday Principle: as a conductor moves through and cuts the lines of magnetic flux, a voltage is produced. The magnitude of the generated voltage is directly proportional to the velocity at which the conductor moves through the magnetic field. The Flo-Mate measures velocity in one direction from an electromagnetic sensor placed in a conductive liquid such as water. In other words, the flow meter measures velocity through changes in the magnetic field about the sensor as caused by the flow of water. The velocity measurement is displayed digitally as distance/unit time.
1.2.1 DefinitionsFlow = volume/timerC: time constant filtering modeFPA: fixed point averaging mode
1.3 Health and Safety WarningsFlow should not be measured by wading in the stream if the velocity is high or the stage is deep. Wearing waders can be dangerous in the event they fill with water. Also, common sense should prevail when measuring flow by oneself.
1.4 Cautions The case that holds the electronics and the sensor bulb are susceptible to jolting and rough handling. Treat with care. The electrode must be kept free from nonconductive coating such as oil and grease. To prevent damage, do not over tighten the thumbscrew on the sensor.
1.5 Interference Nonconductive compounds, such as oil and grease, will interfere with the function of the unit. Make sure the electrode is
clean prior to and during use. Wash with soap and water as needed. Water moving less than the instrument detection method (0.05 ft/sec)
1.6 Personnel QualificationField personal must be trained and evaluated on use of equipment prior to collecting samples or data. Use of the equipment is subject to approval by the QA Officer and/or the Environmental Monitoring Coordinator. Training will be done through dry run exercises in the laboratory and field to familiarize field personnel with operation/collection, calibration and maintenance. Investigators must be familiar with the SOP documents and owner’s manual, when applicable.
1.7 Apparatus & Materials Marsh-McBirney Flo-Mate Model 2000 Operator should always have a spare set of batteries.
1.8 Instrument/Method Calibration1
Refer to Figure 1 for a description of the key pad functions.
Before each sampling trip, the meter should be checked to see if it is reading 0.0 under zero discharge (“Zero Check”). To do this, first clean sensor with soap and water. Place sensor (attached to wading rod for stability) in a five-gallon bucket as near center as possible and at least three inches from any side or bottom. Wait ten minutes to insure that the water is absolutely still before starting measurement. Follow the directions listed below.
1.8.1 Meter Calibration:1. Turn on the meter by pressing ON/C button2. Use a filter value of 15 seconds.
9 Text taken directly or in part from Marsh-McBirney, Flo-Mate 2000 Instruction Manual, December 1994

Flow MeterStatus: Active
Date: 07/13/2006Page 88 of 238
3. Press the STO and RCL keys at the same time and a 3 will appear on the display.4. Reduce this figure to zero with the down arrow key “▼”. (You must press the arrow key within five seconds of
the time that the 3 is displayed or you will get an error message “ERR 3”. If this occurs, press the OFF key and start over.)
5. After you have reduced the value to zero, a 32 will be displayed.6. The unit will automatically drop to zero, at which time the meter is zeroed. (Zero stability is ±0.05 ft/sec.)
Figure 1: Key function summary (Marsh-McBirney, 1994)
1.9 Equipment Operation & Preparation 1
1.9.1 Meter Set-up
1.9.1a BatteriesThe Model 2000 operates on 2 D batteries for 25 – 30 hours (alkaline battery). Before going to the field, check for low battery flag "LOW BAT". The length of time the batteries will last after the flag appears can vary from 15 minutes to 1 hour, depending on temperature and battery type. The unit will shut down when the voltage drops too low.
1.9.1b Sensor MountingThe sensor can be attached to different size poles with the universal sensor mount (see owner’s manual). When a standard wading rod is used, a “double-ended hanger” is attached. Mounting instruction are as follows:
1. Insert the mounting shaft on the universal mount into the hole at the back of the sensor. 2. Seat the thumbscrew in the groove on the shaft.3. Hand tighten the thumbscrew. DO NOT OVER-TIGHTEN. (The sensor does not need to be tightly
attached, excessive force on the thumbscrew could damage the sensor. Also, since the sensor should be removed during transport, it will be put on and taken off frequently.)

Flow MeterStatus: Active
Date: 07/13/2006Page 89 of 238
1.9.1c Wading RodBoth metric and English standard wading rods are available. For the OCC activities, the measurements will be made using a rod with increments marked in feet. The wading rod is a top adjusting model, which makes it much easier to use. To move the rod up or down, press the small rubber mount at the top of the rod handle and slide the smaller of the two rods up or down.
Two accepted methods for determining velocities are as follows: Measure the velocity at 60% of the depth (from the top) and use this as the mean Measure the velocity at 20% and 80% of the depth (from the top). Use the average of these velocities as the
mean.
The purpose of the top setting wading rod is to conveniently set the sensor at 20%, 60%, or 80% of the total depth. The total depth can be measured using the gauge rod. The rod is divided into feet and tenths of feet (not inches). Each single mark represents 0.10 ft, each double mark represents 0.50 ft, and each triple mark represents 1.00 ft.
The wading rod is designed to facilitate the determination of the correct sensor depth as shown in the following examples (Refer to Figure2):
To calculate 60% of depth from the top:
1. Determine depth of segment to be measured using the gradations on the wading rod (e.g. 2.7 ft)2. Slide smaller rod up until the "2" on the rod lines up with the “7” on the rod handle.
To calculate 80% of depth from the top:
1. Determine depth of segment to be measured (e.g. 2.7 feet)2. Divide depth by 2 = 1.353. Slide small rod until "1" on the rod lines up with the 3.5 on the rod handle.
To calculate 20% of the depth from the top:
1. Determine depth of segment to be measured (e.g. 2.7 feet)2. Multiply depth by 2 = 5.4 feet3. Slide small rod until "5" on the rod lines up with the 4 on the rod handle.
Using the 60% method by itself to determine velocity is probably the least accurate option because it assumes that there is consistent flow throughout the depth profile. However, in shallow waters, this is an acceptable method because it may not be practical to measure velocity at other depths. Therefore, for OCC purposes, the selection of the method depends on the depth of the water column.
1. If the depth is less than 1.5 feet, the velocity should be measured at 60% of the profile from the surface. 2. If the depth is greater than 1.5 feet, the velocity should be measured at 20% and 80% of the profile from the
surface and averaged.

Flow MeterStatus: Active
Date: 07/13/2006Page 90 of 238
Figure 2: Top setting wading rod. The position of the rod and the depth corresponds to the examples presented above.
1.10 Sample Collection
1.10.1 Meter SettingObtaining accurate flow measurements is more a function of physical technique rather than instrument operation. The physical situation at each stream will be unique; therefore, it is not possible to describe what to do under every set of circumstances. The following instructions are presented as guidelines but you will have to exercise considerable judgment in the field to obtain good results.
The flow around a sensor is not stable and will jump around a bit. In order to dampen this tendency the meter can be adjusted to either filter the reading (time constant filtering - rC) or average the reading (fixed point averaging - FPA). By filtering the reading, the meter only reads every so many seconds, as specified by the user. The other setting averages the signal over some period, as specified by the user. Either method can be used; however, for the greatest accuracy, the averaged reading method is best. To move between these two measurement modes press the up and down (▲▼) arrow keys at the same time. The rC filter period can be set from 2-30 seconds while the averaging period (FPA) can be set from 2-120 seconds. The period can be changed using the up and down arrow keys. For the FPA setting an average of 15 seconds should be adequate.

Flow MeterStatus: Active
Date: 07/13/2006Page 91 of 238
1.10.2 Site Selection and PreparationThe portion of the stream where flow is to be measured should be as uniform as possible. The ideal shape is a rectangle, which can be found under some cement bridges. Avoid stagnant areas or those with irregular bottoms, obvious turbulence (e.g., riffles), standing waves, or strongly sloping bottoms. For small streams, the narrowest portions are generally best as velocities will be higher and fewer measurements will be required.
The stream should be divided into a number of segments. The more segments, the more accurate the results. Divide the stream so that each segment accounts for 5% of the wetted stream width. Using this method, if one measure is inaccurate it will not significantly affect the overall result. In any case, an attempt should be made to measure flow at least every foot when the width is ~20 feet with a minimum of twenty measurements. If the stream is extremely narrow, the flow should not be measured at increments less than 0.5 feet.
In many streams, the first foot or so of stream is very shallow and stagnant. There are two approaches to dealing with this problem. The first is to ignore the shallow portion while the second involves averaging the depth and velocity between the bank and the first sample point. The best approach is to take the first measurement at the closest point where depth and flow are adequate. Any stream area closer to the shore than one-half the segment width from this point is ignored.
1.10.3 Measurement Procedure1. Turn meter on by pressing ON/C key.2. Set to FPA mode with a 15 second averaging period3. Stretch a graduated string or tape from bank to bank on the stream cross section to be sampled.4. Divide the distance into equal segments so that each segment account for 5% of the stream5. Place the wading rod at the first interval with the sensor pointed upstream directly into the current. Stand behind
and to the side of the wading rod.6. Measure depth7. Adjust wading height based on water depth. (<1.5 ft take reading at 60% of depth; >1.5 ft take readings at 20%
and 80% of depth)8. Press ON/C to clear/restart the measurement.9. Hold the rod steady while the reading is being measured. The length of averaging time is measured by a
horizontal time bar (dashed line under the velocity output—labeled “PERIOD”. The time bar reflects the amount of time left until the display is updated.
10. Once the period has ended, record the value on the flow data sheet (see instructions below), or store the reading for later transcription.
1.11 Sample Handling & PreservationNot applicable
1.12 Sample Preparation and AnalysisNot applicable
1.13 TroubleshootingSee owner’s manuals for the various error codes
1.14 Data Acquisition, Calculation & Data ReductionNot applicable
1.15 Computer Hardware & SoftwareNot applicable
1.16 Data Management & Records Management
1.16.1 Field NotationAll field calibration and calibration checks should be recorded on the Sampling Episode Sheet (see SOP Appendix: Data Sheets). All velocity measurements made at each site should be recorded on the Site Collection Sheet (see SOP Appendix: Data Sheets). Data should be recorded following procedures outlined in the Procedures for

Flow MeterStatus: Active
Date: 07/13/2006Page 92 of 238
Completing Field Data Sheets SOP. In addition, a Flow Meter Data Sheet (see SOP Appendix: Data Sheets) must be filled out for each site.
1.16.2 Instructions for completing Flow Meter Data SheetThe following bullets will describe how the sheet should be filled out:
DATA SHEET HEADER INFORMATION: SITE NAME: Record the stream named from the USGS 7-1/2' map name. If a county map, soil
map, or other map has a different name, the USGS 7-1/2' map takes precedence. If a stream is unnamed on the USGS map, but named on another map, use that name, but write the name of the reference map in parentheses beside the stream name.
WBID #: Waterbody identification number. LEAD INVESTIGATOR: The person in charge of data handling and custody. DATE: Record the site date in MM/DD/YR format. TIME: Record the site time in military format. The “site time” is when initial activities
began at the site.
FIELD INFORMATION: DIST FROM START: “Distance From the Starting Point”. Record the distance point from the edge of
the stream. In the first row, mark EOS (Edge of Stream). In the subsequent rows, record the distance in feet between each measurement point. The final reading should be EOS.
WIDTH: Record the width of the segment measured in feet. In the first row, mark “0” Record the unit of measure between each measurement point.
TOT DEPTH: “Total Depth” Record the total depth for the point of measurement in feet. VELOCITY: Record the velocity as measured by the flow meter AVE VEL: “Average Velocity” is calculated by the database—no need to record anything in
this space. Average velocity is determined when the flow measurement was made at more than one observed depth.
AREA DIS: “Area Discharge” is calculated by the database—no need to record anything in this space. The area of the segment measured is calculated based on the depth, and distance.
DISCHARGE: Discharge is calculated by the database—no need to record anything in this space. This cell refers to the discharge of the specific segment where the velocity was measured.
GAUGE HEIGHT: At some sites, staff gauges have been installed. Record the gauge height, if applicable. During high flow events, when velocity readings cannot be taken safely, record the staff gauge height on the Site Collection Sheet. There is no need to turn in a Flow Meter Data Sheet.
CREST HEIGHT: If applicable, the peak staff gauge height will be taken based on the measurement of a crest gauge. This information should be recorded as often as required in the QAPP or as instructed by the Monitoring Coordinator.
1.16.2 Chain of Custody ProcedureNot applicable

Flow MeterStatus: Active
Date: 07/13/2006Page 93 of 238
2.0 QA/QC SECTION
2.1 TrainingTraining of field personnel will be done through dry run exercises in the laboratory to familiarize them with instrument operation, calibration, and maintenance. All operators are required to become familiar with the SOP document and owner’s manual. Prior to solo sample collection, field personnel are evaluated in a field setting for proper use of equipment and sample collection protocol. Annual field audits are performed on sample collectors following procedures outlined in the Quality Management Plan.
2.2 Maintenance Unit is waterproof, but do not submerge it Clean outside of unit with a moist cloth Clean sensor with soap and water when noisy reading are observed. Do not use hydrocarbon solvents Protect the unit and sensor from excessive jostling; it should travel in the cab of the vehicle.
2.3 QC ProceduresThe meter should be zeroed prior to each sampling episode.
3.0 REFERENCES
Marsh-McBirney, (1994), “Installation and Operations Manual, Model 200” Fredrick Maryland.

Flow MeterStatus: Active
Date: 07/13/2006Page 94 of 238
4.0 APPENDIX A
STANDARD OPERATING PROCEDUREField Summary
Flow Measurement
INSTRUMENT CALIBRATIONThe Marsh-McBirney Model 2000 should be zeroed prior to each sampling episode.
1. Turn on the meter by pressing ON/C button2. Use a filter value of 15 seconds.3. Press the STO and RCL keys at the same time and a 3 will appear on the display.4. Reduce this figure to zero with the down arrow key “▼”. (You must press the arrow key within five seconds of the
time that the 3 is displayed or you will get an error message “ERR 3”. If this occurs, press the OFF key & start over.)5. After you have reduced the value to zero, a 32 will be displayed.6. The unit will automatically drop to zero, at which time the meter is zeroed. (Zero stability is ±0.05 ft/sec.)
EQUIPMENT OPERATION & PREPARATION
BatteriesThe Model 2000 operates on 2 D batteries for 25 – 30 hours (alkaline battery).
Sensor Mounting1. Insert the mounting shaft on the universal mount into the hole at the back of the sensor. 2. Seat the thumbscrew in the groove on the shaft.3. Hand tighten the thumbscrew. DO NOT OVER-TIGHTEN. (The sensor does not need to be tightly attached;
excessive force on the thumbscrew could damage the sensor. Also, since the sensor should be removed during transport, it will be put on and taken off frequently.)
Wading RodFor the OCC activities, the measurements will be made using a rod with increments marked in feet. The wading rod is a top adjusting model, which makes it much easier to use. To move the rod up or down, press the small rubber mount at the top of the rod handle and slide the smaller of the two rods up or down.
The purpose of the top setting wading rod is to conveniently set the sensor at 20%, 60%, or 80% of the total depth. The total depth can be measured using the gauge rod. The rod is divided into feet and tenths of feet (not inches). Each single mark represents 0.10 ft, each double mark represents 0.50 ft, and each triple mark represents 1.00 ft.
Two OCC accepted methods for determining velocities are as follows: Depth < 1.5 ft: Measure the velocity at 60% of the depth (from the top) and use this as the mean. Depth > 1.5 ft: Measure the velocity at 20% and 80% of the depth (from the top). Use the average of these
velocities as the mean.
60% of depth from the top: Determine depth of segment to be measured using the gradations on the wading rod (e.g. 2.7 ft) Slide smaller rod up until the "2" on the rod lines up with the “7” on the rod handle.
80% of depth from the top: Determine depth of segment to be measured (e.g. 2.7 feet) Divide depth by 2 = 1.35 Slide small rod until "1" on the rod lines up with the 3.5 on the rod handle.
20% of the depth from the top: Determine depth of segment to be measured (e.g. 2.7 feet) Multiply depth by 2 = 5.4 feet Slide small rod until "5" on the rod lines up with the 4 on the rod handle.

Flow MeterStatus: Active
Date: 07/13/2006Page 95 of 238
MEASUREMENT PROCEDURE1 Turn meter on by pressing ON/C key.2 Set to FPA mode with a 15 second averaging period3 Stretch a graduated string from bank to bank on the stream cross section to be sampled.4 Divide the distance into equal segments so that each segment account for 5% of the stream5 Place the wading rod at the first interval with sensor pointed upstream directly into the current. Stand behind and to
the side of the wading rod.6 Measure depth7 Adjust wading height based on water depth. (<1.5 ft take reading at 60% of depth; >1.5 ft take readings at 20% and
80% of depth)8 Press ON/C to restart the measurement.9 Hold the rod steady while the reading is being measured. The length of averaging time is measured by a horizontal
time bar (dashed line under the velocity output (labeled “PERIOD”). The time bar reflects the amount of time left until the display is updated.
10 Once the period has ended, record the value on the flow data sheet (see instructions below), or store the reading for later transcription.
INSTRUCTIONS FOR COMPLETING FLOW DATA SHEET:
DATA SHEET HEADER INFORMATION: SITE NAME: Record the stream named from the USGS 7-1/2' map name. If a county map, soil
map, or other map has a different name, the USGS 7-1/2' map takes precedence. If a stream is unnamed on the USGS map, but named on another map, use that name, but write the name of the reference map in parentheses beside the stream name.
WBID #: Waterbody identification number. LEAD INVESTIGATOR: The person in charge of data handling and custody. DATE: Record the site date in MM/DD/YR format. TIME: Record the site time in military format. The “site time” is when initial activities
began at the site.
FIELD INFORMATION: DIST FROM START: “Distance From the Starting Point”. Record the distance point from the edge of
the stream. In the first row, mark EOS (Edge of Stream). In the subsequent rows, record the distance in feet between each measurement point. The final reading should be EOS.
WIDTH: Record the width of the segment measured in feet. In the first row, mark “0” Record the unit of measure between each measurement point.
TOT DEPTH: “Total Depth” Record the total depth for the point of measurement in feet. VELOCITY: Record the velocity as measured by the flow meter AVE VEL: “Average Velocity” is calculated by the database—no need to record anything in
this space. Average velocity is determined when the flow measurement was made at more than one observed depth.
AREA DIS: “Area Discharge” is calculated by the database—no need to record anything in this space. The area of the segment measured is calculated based on the depth, and distance.
DISCHARGE: Discharge is calculated by the database—no need to record anything in this space. This cell refers to the discharge of the specific segment where the velocity was measured.
GAUGE HEIGHT: At some sites, staff gauges have been installed. Record the gauge height, if applicable. During high flow events, when velocity readings cannot be taken safely, record the staff gauge height on the Site Collection Sheet. There is no need to turn in a Flow Meter Data Sheet.
CREST HEIGHT: If applicable, the peak staff gauge height will be taken based on the measurement of a crest gauge. This information should be recorded as often as required in the QAPP or as instructed by the Monitoring Coordinator.

Flow MeterStatus: Active
Date: 07/13/2006Page 96 of 238
MAINTENANCE Unit is waterproof, but do not submerge it. Clean outside of unit with a moist cloth. Clean sensor with soap and water when noisy reading are observed. Do not use hydrocarbon solvents. Protect the unit and sensor from excessive jostling; it should travel in the cab of the vehicle.
Figure 1: Key function summary (Marsh-McBirney, 1994)

Flow—Timed SSOStatus: Active
Date: 07/13/2006 Page 97 of 238
OKLAHOMA CONSERVATION COMMISSIONWATER QUALITY DIVISION
STANDARD OPERATING PROCEDURE
FLOW MEASUREMENT(SEMI-SUBMERGIBLE OBJECT METHOD)

Flow—Timed SSOStatus: Active
Date: 07/13/2006 Page 98 of 238
1.0 PROCEDURAL SECTION
1.1 Scope and ApplicationFlow affects everything from the concentration of various substances in the water to the distribution of habitats and organisms throughout the stream. Many of the collections and procedures require a measurement of flow.
1.2 Summary of Method10
This procedure describes a way to calculate flow without using a flow meter. Flow = volume / time. In most cases it is impossible to measure the volume of water in a stream directly. Since volume is a product of length and cross sectional area, flow = (length x cross sectional area) / time, and since velocity is a measure of length (or distance) / time, flow = velocity x cross sectional area. To calculate flow, the velocity of the water and the cross sectional area of the stream’s channel will be measured.
1.2.1 Definitions1
Discharge: The volume of water moving past a point in a unit of time Float: Item used to measure the amount of time to travel a known distance Flow: The volume of water that passes a point in the stream in a unit of time:
flow = volume / time Velocity: Speed of water moving past a given point: velocity = length (distance) / time Volume: Amount of water in the stream: volume = length x cross sectional area
1.3 Health and Safety Warnings Avoid deep or swift water without proper safety devices (e.g. personal flotation devices, etc).
1.4 Cautions Flow should not be measured by wading in the stream if the velocity is high or the stage is deep. Wearing waders can be
dangerous in the event they fill with water. Common sense should prevail. When possible use a float that will be partially submerged in the water. It will give a more accurate indication of the
velocity of the water and will be less subject to wind resistance. Choose a straight section of stream free of turbulence, eddies, slack backwater areas, and obstacles like boulders and
woody debris. In shallow water a smaller float may be necessary.
1.5 Interference Obstacles that catch the float Wind that blows the float on top of the water Eddies and backwater areas where the flow is not consistent
1.6 Personnel QualificationField personnel must be trained and evaluated on flow measurement technique. Flow measurement is subject to approval by the QA Officer and/or the Environmental Monitoring Coordinator. Training will be done through dry run exercises in the field to familiarize field personnel with procedures and techniques. Blue Thumb volunteers will have a staff member present when measuring flow.
1.7 Apparatus & Materials Pencils Clipboard Flow Measurement Data Sheet Tape measure Visible float (orange, floating key chain, tennis ball, rubber ducky, etc.) Stopwatch Calculator Improvised stadia rod marked in 0.1 of feet1.8 Instrument/Method CalibrationNot applicable
10 Text taken directly or in part from The Streamkeeper’s Field Guide, 1996.

Flow—Timed SSOStatus: Active
Date: 07/13/2006 Page 99 of 238
1.9 Preparation
1.9.1 Improvised Stadia RodUse a 2 meter section of PVC pipe or a wooden dowel or metal rod (such as rebar). Mark 0.1 foot intervals, with major divisions at each 0.5 and 1.0 foot mark. This rod can be used to read depth measurements in feet and tenths of feet at the same time.
1.9.2 FloatUse an orange peel, a water soaked block of wood or other natural material that sinks at least half way, is visible from shore, will not be moved by wind, is expendable and non polluting (e.g. not ping pong balls and plastic jugs) (USDA Forrest Service general technical report RM-45) unless the float is readily and routinely retrievable.
1.9.3 Site DataYou will need the official site name, the WBID #, and the legal location.
1.10 Measurement
1.10.1 Velocity Choose a section of run that is as straight and uniform in width as possible and is free of turbulence, eddies, slack
backwater areas, and obstacles like boulders and woody debris. The section should be shallow enough to wade across safely. In general, the length of the section should be about three times the width; however, do not sacrifice the other conditions if this is not possible. A ten foot or even shorter distance will work.
Mark the start and finish lines in some manner. Measure the length (distance) of the stream section you have chosen. Record this distance on the data sheet.
Person #1 wades in the stream above the upstream starting line with the float in hand. Person #2 wades in the stream below the downstream finish line. Person #3, if available, stands on the bank next to the finish line, stopwatch and clipboard in hand. If there are only 2 people, the one at the finish line holds the stopwatch.
Person #1 drops the float on the surface, upstream from the starting line. As the float passes the starting line, person #1 signals, “Go!” and person #2 starts the stopwatch. (It is more accurate to start the float this way than trying to drop it exactly at the starting line.)
When the float crosses the finish line, person #2 signals, “Stop!” or stops the stopwatch, catches the float, and records the time in seconds that it took the float to travel the measured distance.
Discard any trials in which the float gets caught in debris, rocks, or eddies. Because the velocity of the water varies across the width of the stream, repeat this process several times, sending the
float down different flow paths. Starting at one side of the stream, send the float down progressively farther from the bank, at one or two foot intervals until you reach the other side. This way you will be able to sample the full range of velocities that occur across the width of the stream.
1.10.2 Cross Sectional Area Stretch a tape measure across the stream at the starting point of the velocity float trials. The tape measure should be
perpendicular to stream flow and just above the surface of the water. The first person holds the “0” point on the tape measure even with one wetted edge of the stream. A second person on the opposite bank holds the tape measure level, taut, and even with the other edge. Someone is prepared to record information on the data sheet.
Another person, measuring rod in hand, starts six inches from the wetted edge and moves along the tape measure at one- foot intervals. The rod is used to measure the depth of the water (distance from the water surface to the stream bottom) at the mid-point of each one-foot interval. (The first and last measurements are made six inches from the edges.) The in-stream person calls out these measurements to the person on the bank who records them on the data sheet. Note: if the stream is wider than 20 feet, measure depths at two-foot intervals and start and end 1-foot from the bank.
If measured at one-foot intervals, each depth is roughly equivalent to the area of a one-foot-wide section of the stream. The sum of these areas (or depths) is the total cross-sectional area of the stream at the point measured. The mid-point depth is used because it is a better approximation of the area of the one-foot-wide section than the depth at the beginning or end of the section.
Repeat steps 1-3 at the mid-point between the start and finish lines (Cross Section 2) and at the finish line (Cross Section 3.)

Flow—Timed SSOStatus: Active
Date: 07/13/2006 Page 100 of 238
Calculate the flow using the instructions on the data sheet and in Section 1.14 of this document.
1.11 Sample Handling & PreservationNot applicable
1.12 Sample Preparation and AnalysisNot applicable
1.13 TroubleshootingConsult with the QA Officer or the Environmental Monitoring Coordinator
1.14 Data Acquisition, Calculation & Data Reduction
1.14.1 Average Surface Velocity Average the time (in seconds) in the Velocity Float Trials. Divide the distance between the start and finish lines (in feet) by the average time. Record this number as the average surface velocity.
1.14.2 Cross Sectional Area Sum the depth measurements (in feet) for each cross section. Average the sums for the three cross sections. Multiply the average cross sectional area by the interval between depth measurements. (Did you measure depth every
one foot? Did you measure every two feet?)
1.14.3 Corrected Surface Velocity Multiply the Average Surface Velocity by 0.85.
1.14.4 Flow Calculation Multiply the Corrected Surface Velocity by the Average Cross Sectional Area. The results will be in cubic feet per
second (CFS).
1.15 Computer Hardware & SoftwareNot applicable
1.16 Data Management & Records Management
1.16.1 Field NotationData should be recorded following procedures outlined in the Procedure for Completing Field Data Sheets SOP. If the Data is going to be submitted to OCC-Water Quality, a Site Collection Sheet must be completed with the final flow value reported in CFS.
1.16.2 Timed Flow Measurement Data SheetAll measurements should be recorded on the Timed Flow Measurement Data Sheet (see SOP Appendix: Data Sheets).
The following bullets will describe how the sheet should be filled out:
SITE INFORMATION SITE NAME: Record the stream name from the USGS 7-1/2' map name. If a county map, soil
map, or other map has a different name, the USGS 7-1/2' map takes precedence. If a stream is unnamed on the USGS map, but named on another map, use that name, but write the name of the map in parentheses beside the stream name.
WBID #: Record the Water Body Identification number. LEAD INVESTIGATOR: The person responsible for data custody and reporting. DATE: Record the site date in MM/DD/YR format. TIME: Record the site time in military format. The “site time” is when initial activities

Flow—Timed SSOStatus: Active
Date: 07/13/2006 Page 101 of 238
began at the site. The site time should be the same on all forms associated with this site.
SURFACE VELOCITY (refer to section 1.14.1)
CROSS SECTIONAL AREA (refer to section 1.14.2)
CORRECTED SURFACE VELOCITY (refer to section 1.14.3)
COMMENTS
1.16.3 Chain-of-Custody ProcedureNot applicable
2.0 QA/QC SECTION
2.1 TrainingTraining will be done through dry run exercises in the field to familiarize field personnel with procedures and techniques. All operators are required to become familiar with the SOP document. Prior to solo flow measurement, field personnel are evaluated in a field setting for proper use of equipment and flow measurement protocol. Annual field audits are performed on flow measurers following procedures outlined in the Quality Management Plan.
2.2 MaintenanceNot applicable
2.3 QC ProceduresIf the float is delayed or stopped by an eddy or snag more than once, then the site selected is inappropriate; identify a new measurement location.
Field personnel will be checked annually by measuring flow using this method, immediately followed by measuring flow using a flow meter at the same location.
3.0 REFERENCES
Murdoch, Tom and Martha Cheo, (1996) The Streamkeeper’s Field Guide: Watershed Inventory and Stream Monitoring Methods, The Adopt-A-Stream Foundation, Everett, WA.
USDA Forrest Service general technical report RM-45

Flow—Timed SSOStatus: Active
Date: 07/13/2006 Page 102 of 238
4.0 APPENDIX A
STANDARD OPERATING PROCEDUREField Summary
Flow Measurement Using a Semi-Submergible Object
Preparation
Prepare a rod to make depth measurements. Gather possible floats of an assortment of sizes and densities including a fresh piece of citrus fruit.
Equipment Pencils Clipboard Flow Measurement Data Sheet Tape measure Visible floats (orange, floating key chain, tennis ball, rubber ducky, etc.) Stopwatch Depth measurement rod Calculator
Flow Measurement1. Choose an appropriate run three times as long as it is wide.2. Mark a “Start” line and a “Finish” line on the bank and measure the distance between them. Record the distance.3. Choose an appropriate float for the conditions.4. Drop the float into the water above the start line. Start timing (in seconds) the float when it crosses the “Start” line. Stop
timing the float when it crosses the “Finish” line. Retrieve the float. Record the time.5. Discard any trials in which the float gets caught in debris, rocks, or eddies.6. Repeat this process sending the float down different flow paths across the width of the stream.
Cross Sectional Area1. Stretch a measuring tape across the “Start” line. The tape should be perpendicular to the stream flow and just above the
surface of the water.2. Starting six inches from the edge of the stream, measure the depth (in feet) of the water at one-foot intervals. If the stream
is wider than 20 feet, measure at two-foot intervals. Record these depths on the data sheet. 3. Repeat this process at the mid-point between the “Start” and “Finish” lines.4. Repeat this process at the “Finish” line.
Calculations1. Average the times (sec).2. Divide the distance between the start and finish lines (ft) by average time (sec) to get average surface velocity (ft/sec).3. Sum the depth measurements (ft) for each cross section.4. Average the sums (ft).5. Multiply average cross sectional sum by the interval between depth measurements to get average cross sectional area.
(Did you measure depth every one foot? Did you measure every two feet?)6. Multiply the average surface velocity by 0.8 to get corrected surface velocity.7. Multiply corrected surface velocity by the average cross sectional area to get flow (cubic feet per second).
Field NotationAll measurements made at each site should be recorded on the Timed Flow Measurement Data Sheet. Data should be recorded following procedures outlined in the Procedure for Completing Field Forms SOP. If the Data is going to be submitted to OCC-Water Quality, a Site Collection Sheet must be filled-out with the final flow value reported in CFS.

Flow—Timed SSOStatus: Active
Date: 07/13/2006 Page 103 of 238
Timed Flow Measurement Data Sheet:
SITE INFORMATION SITE NAME: Use the USGS 7-1/2’ map name. If a county map, soil map, or other map has a
different name, the USGS 7-1/2' map takes precedence. If a stream is unnamed on the USGS map, but named on another map, use that name, but write the name of the map in parentheses beside the stream name.
WBID #: Record the Water Body Identification number. LEAD INVESTIGATOR: The person responsible for data custody and reporting. DATE: Record double digit month, day and year (MM/DD/YR). TIME: Record the starting time of all activities that occurred at this location. The site
time should be the same on all forms associated with this site. Use military form.
SURFACE VELOCITY (refer to section 1.14.1)
CROSS SECTIONAL AREA (refer to section 1.14.2)
CORRECTED SURFACE VELOCITY (refer to section 1.14.3)

Habitat AssessmentStatus: Active
Date: 07/13/2006Page 104 of 238
OKLAHOMA CONSERVATION COMMISSIONWATER QUALITY DIVISION
STANDARD OPERATING PROCEDURE
HABITAT ASSESSMENT

Habitat AssessmentStatus: Active
Date: 07/13/2006Page 105 of 238
1.0 PROCEDURAL SECTION
1.1 Scope and Application11,12
An evaluation of habitat quality is critical to any assessment of ecological integrity. For OCC purposes “habitat assessment” measures the quality of the in stream and riparian zone habitat that influences the structure and function of the lotic aquatic community. Habitat directly influences the biotic community and can be used to discern the source of impairment. The habitat parameters evaluated during this process are related to the overall aquatic life use and are potential sources of limitations to the aquatic biota. Habitat, as structured by in-stream and surrounding topographical features, is a major determinant of the aquatic community potential. Both the quality and quantity of available habitat affect the structure and composition of resident biological communities.
1.2 Summary of MethodThe habitat assessment procedure follow a modified version of the EPA Rapid Bioassessment Protocol V (EPA 1999) supplemented by other documents. The habitat assessment was designed to assess the physical habitat available to support the biological community. The assessment is based on particular parameters grouped into three principal categories. The first group represents parameters on the microscale habitat, for example bottom substrate, cover, and flow. The second group of parameters is designed to assess the macroscale habitat such as channel morphology, sediment deposition, and sinuosity. The third grouping evaluates the riparian and bank structure; for example, bank stability, vegetation, and streamside cover. A quantitative value or weight is assigned to each parameter so that biologically significant factors can be emphasized. These weighting values are then adjusted based on the quality of the parameter. Scores are then assigned as an evaluation of in-stream and riparian conditions. Habitat assessments are conducted on a 400 m reach of stream. Measurements/scoring for each parameter are made on 20 m intervals.
1.2.1 DefinitionsLeft Bank The bank of the stream that is on the left while facing downstream.
1.3 Health and Safety Warnings
1.4 Cautions Record all measurements in meters
1.5 Interference
1.6 Personnel QualificationField personal must be trained and evaluated on assessment techniques. Habitat assessment evaluation is subject to approval by the QA Officer and/or the Environmental Monitoring Coordinator. Training will be done through dry run and supervised exercises in the field to familiarize field personnel with procedures and techniques.
1.7 Apparatus & Materials field data sheets clip board wading rod (graduated in 0.1 m units) hip chain GPS unit
1.8 Instrument/Method Calibrationnone
11 Text taken directly or in part from “Rapid Bioassessment Protocols for Use in Wadeable Stream and Rivers, 2nd Edition”, US EPA 841-B-99-002 July 1999
12 Text taken directly or in part from Dan Butler, Senior Biologist, Oklahoma Conservation Commission (2000)

Habitat AssessmentStatus: Active
Date: 07/13/2006Page 106 of 238
1.9 Preparation
A representative stream reach is selected and measured such that primary physical features are included in the reach (riffles, runs, and pools).
The reach should be located away from the influences of major tributaries and bridge/road crossings.
1.10 Sample CollectionThe stream habitat assessments follows a modified version of the EPA Rapid Bioassessment Protocol V (EPA 1999) supplemented by other documents. The habitat assessment was designed to assess the physical habitat available to support a biological community. The assessment is based on particular parameters as they are observed in the field. A quantitative value or weight is recorded for each parameter at set intervals along the stream segment. The information is weighted and complied to generate an overall score
Interpretation of the assessment parameters in the field can be somewhat subjective; thus it is imperative that the field technician be properly trained in quantitative evaluation. The following paragraphs describe the items of importance, but this information is meaningless without prior instruction.
The Stream Habitat Assessment Sheet is divided into 17 general columns some of which are further subdivided. In total, there are 47 cells, for a given distance of stream reach, that require data input. The following paragraphs will explain each grouping and subgrouping as presented on the field data sheet.
Instructions for filling out the Stream Habitat Assessment Sheet
SITE INFORMATION: SITE NAME: Record the stream named from the USGS 7-1/2' map name. If a county map, soil
map, or other map has a different name, the USGS 7-1/2' map takes precedence. If a stream is unnamed on the USGS map, but named on another map, use that name, but write the name of the map in parentheses beside the stream name.
WBID #: Record the Water Body Identification number. SITE DATE: Record the site data in MM/DD/YR format START POINT: Provide a GPS lat/long and a brief written description of the starting point (first
observation), including obvious features such as bridges. SITE TIME: Record the site time in military format. The “site time” is when initial activities
began at the site. END POINT: Provide a GPS lat/long and a brief written description of the ending point (last
observation). SINUOSITY: Stream length/valley length. This can be assessed in the field or from aerial
photographs. USGS topographic maps should not be used. INVESTIGATORS: All people involved with the sampling should be recorded; the “crew leader” (the
person responsible for data custody and reporting) should be circled on the form. DIRECTION: Record if the assessment was done upstream or downstream from the starting
point.
Distance (DIST)In general, each stream reach is sampled for a distance of 400 m. A stream must be assessed a minimum of 30 times its average width or 400 meters; whichever is greater. Under most circumstances the 400 m reach is divided into twenty-20 m segments. Depending on the QAPP, the measurement interval can be lengthened or shortened.
If measuring 100 or 50 meter segments, use a rangefinder to select an easily visible landmark such as a large tree or rock 100 meters along the segment. If the stream bends before a full reading can be made, measure the distance to the bend and then measure the remaining distance after going around the bend.
If measuring 10 or 20 meter segments use a hipchain. Attach the string to a fixed object at the starting point and start measuring the distance while moving along the reach.
Depth

Habitat AssessmentStatus: Active
Date: 07/13/2006Page 107 of 238
The column “DEPTH” is divided into 3 subcolumns (L1/4, C, R1/4). In general, the depth of water is measured in meters to the nearest 0.1 m. The stream is divided into 3 segments: left ¼, right ¼, and center. The left bank of the stream is on left hand side while looking downstream.
The left 1/4 (L1/4) is the depth of water midway between the center of the stream and the left bank. Center (C) Right 1/4 (R1/4) is the depth of water midway between the center of the stream and the right bank.
If any of the above measurements falls on a point bar, the depth will be recorded as 0. If the stream consists of one wide channel and one narrower channel separated by an island, take 2 depth measurements in the wide channel and one in the narrow channel.
Width The column “WIDTH” is divided into 2 subcolumns (WTR and BNK). The width measurement takes into account the width of the wetted surface or water, and the width of the lower bank to the nearest 1 m.
The width of the water (WTR) refers to the water’s edge to water’s edge, or a perpendicular section across the wetted surface. If there are vegetated “island” areas in the stream, subtract out these areas from the wetted width and make note of this.
The width of the bank (BNK) refers to the lower bank as it extends from the water's edge at summer low flow to the top of the normal high water line. The normal high water line is usually marked by the beginning of well-established perennial vegetation. Below this line will be gravel and bare soil. There may be a sparse covering of annual vegetation below this line. The lower bank width is the distance between the tops of the left and right lower banks.
SubstrateThe “SUBSTRATE” column is divided into 8 subcategories (Si&C, SND, GVL, CBL, BLD, BRK, POM, and HPC). The substrate measurement characterizes the physical benthic material. Substrate is evaluated from the water’s edge on one side to the water’s edge on the other side of the stream at the transect. The substrate is characterized based on component categories: silt and clay, sand, gravel, cobble, boulder, bedrock, particulate organic matter and/or hardpan clay. Record the fraction of each category as a percent of total. The total of all substrate components should add up to 100 percent. The categories include the following:
Si&C Loose silt and clay (not gritty between the fingers) SND Sand or rock particles smaller than ladybug size (gritty between the fingers); 0.1 to 2mm median diameter. GVL Gravel rocks ladybug to tennisball size; rocks from 2 mm to 50 mm median diameter. CBL Cobble rocks tennis ball to basketball size; rocks from 50 mm to 250 mm median diameter. BLD Boulder rocks basketball to car size; rocks > 250mm median diameter. BRK Bedrock; rock area greater than a car in size POM Particulate organic matter; rotten leaves and fragments of stick and logs. HPC Hardpan clay; firm, consolidated fine substrate.
Habitat TypeThe HABITAT TYPE column is subdivided into 4 additional columns (RIF, PL, RUN, or DRY). Check the cell that is most applicable to the habitat type present at the transect. If there are two obvious habitat types at the cross section being measured, check both boxes. An example is when a backwater pool is encountered beside a run or riffle.
A riffle (RIF) is defined as any sudden downward change in the level of the streambed such that the surface of the water become disrupted by small waves and usually makes a sound.
A pool (PL) has a smooth surface with no or very little current and can be deep or shallow. A run (RU) has an obvious current, may be deep or shallow and often has a surface that may be slightly broken, but
does not make any noise. Check dry (DR) if the stream has no water in it at the point being measured.
In-Stream Cover % AreaThe IN-STREAM COVER % AREA column is divided into 9 subcolumns (UCB, LWD, SWD, RTS, BRL, SAV, EAV, TV, and CB&G). This category attempts to quantify the amount of cover present for fish in the section of stream you walked from the previous station to the present one. For example, if the section was 20 meters long and averaged 6 meters wide, its area would be 120 m2. A submerged log about 3 m long by 0.5 m wide would offer 1.5 m2 cover, and you would note that the LWD (large woody debris) category offered 1.5/120 or 1.3 percent cover. Waterwillow, an emergent aquatic macrophyte, might be growing in shallow water along the edge of the stream. If both edges had a zone about 1 meter wide where it grows, there

Habitat AssessmentStatus: Active
Date: 07/13/2006Page 108 of 238
would be (1 meter) (20 meters) (2 sides)=40m2 of emergent aquatic vegetation (EAV) in the 120m2 section of stream and you would check 40/120 or 33 percent in the EAV column. Note that the totals of the percent cover columns for each row will rarely add up to 100 percent and may often be 0 percent. These columns may sum to a value greater than 100%.
The categories are:
UCB Undercut Banks LWD Large Woody Debris—woody debris in the water > 10 cm. in diameter. SWD Small Woody Debris—woody debris in the water <= 10 cm. in diameter. RTS Roots—these are submerged root wads of trees. If single or occasional roots are encountered, count them in
one of the woody debris categories. BRL Bedrock Ledges—underwater bedrock ledges not forming part of an undercut bank. SAV Submerged Aquatic Vegetation. EAV Emergent Aquatic Vegetation. TV Terrestrial vegetation that is currently underwater. An example would be tree branches or grass leaves that
are actually hanging down into the stream. CBG Cobble, Boulder, and Gravel. This is an estimate of the percent coverage of cobble and boulder in the 20-
meter section. It may not be the same number as the percent composition of cobble and boulder in the cross section where you estimated substrate since they represent different areas.
Percent Embeddedness1 (EMB)The degree to which boulders and cobble have been surrounded by fine sediment indicates suitability of the stream substrate as habitat. Embeddedness is evaluated by visual observation of the degree to which larger particles have been surrounded by sediment. This quantifies the amount of silt, clay, and sand that has been deposited in riffles. Percent embeddedness should be recorded only when in a run or riffle. Record the percent embeddedness by looking only at the transect.
If there is no fine material surrounding the cobble and gravel found in the riffles, and there is at least some free space under the rocks, that is 0 percent embedded. If the free space under the rocks is filled but the sides are untouched, count that as 5 percent embedded. As the level of fines rises up the cobble sides, estimate the percentage of the total height of the cobbles that is covered. This is the embeddedness estimate. An obvious “embeddedness line” is often distinctly observed on the side of a rock when it is removed from the water.
Percent Canopy Cover (CAN)At each measuring station, estimate the percent canopy cover directly over the water in the previous segment. It can range from 0 to 100 percent, but if any “sky” is observed directly overhead, the estimate should be less than 100 percent.
Point Bar (Pt) If a recently formed (unstable) point bar is present, that is, it has no or little vegetation, put a check in this box.
Deposition and Scouring (D+S)1
These parameters relate to the destruction of in-stream habitat. Characteristics to observe are scoured substrate and degree of siltation in pools and riffles. If there is evidence of scouring (smooth, clean bedrock or hardpan play) or deposition (loose, shifting bottoms of fine sand or silt or filled in pools) in the previous segment surveyed, check this box.
Percent Bank Vegetative Cover (BV)Record an estimate of the percent of total area on both banks over the entire 20 m reach that is protected from erosion by well-established, perennial vegetation. Soil does not have to be covered as long as it is stable.
Dominant Vegetation (DV)Place an S (shrub), T (tree), or G (grasses and forbs) in the box indicating which type of vegetation is most dominant on the banks in terms of percent of ground protected over the entire 20 m reach. For our purposes, shrubs are any woody plant whose trunk and branches are <= 10 cm in diameter. If the vegetation is mixed but each of the three groups contribute at least 20% of the total put an M in the box.
Percent Eroded BanksThe “% ERODED BK” column is divided into 2 subcolumns (LEFT and RIGHT). Record the average % of streambank that is actively eroding for both the left bank and the right bank of the stream segment. Measure from the edge of the lower bank to

Habitat AssessmentStatus: Active
Date: 07/13/2006Page 109 of 238
the edge of the upper bank. The upper bank is usually the edge of the flood plain. The left bank is refers to the left side of the bank while looking in a downstream direction.
Average Height of the Eroding BanksThe “HT ERODED BK” column is divided into 2 subcolumns (LEFT and RIGHT). Record the average height of the eroding banks on either side of the stream segment for the entire 20 m reach. Measure from the edge of the lower bank to the edge of the upper bank.
Average SlopeThe “o SLOPE BANK” column is divided into 2 subcolumns (LEFT and RIGHT). Record the average slope of the bank (in degrees) over the entire 20 m reach. That is, a vertical bank would be 90o while all other estimates would be less than 90o. Measurements are taken from the edge of the lower bank to the edge of the upper bank.
Riparian Zone WidthThe “RIP WIDTH” column is divided into 2 subcolumns (LEFT and RIGHT). Record the average width of the riparian vegetation for each side of the stream along the entire 20 m reach. The riparian zone, for OCC purposes, extends from the top of the upper bank outwards from the stream. The riparian zone ends where the unmanaged (i.e. not plowed or mowed) portion of land ends. In other words, the riparian zone stops where pasture or crop management begins.
Riparian vegetation is typically bottomland hardwood forest when in a natural state, but mixtures of trees and herbaceous plants are frequently encountered. These will vary from a fairly dense forest with sparse grasses to land that is mostly pasture with a few scattered trees. For consistency, forest and pasture have been defined below: Pasture: If woody shrub and sapling growth can be controlled using a 6' brushhog and a medium size tractor in between the larger trees, the land will be labeled pasture and may or may not be included in the riparian zone. Forest: If the large trees are so dense that a tractor and mower of this size cannot be used for brush control, the land
should be labeled as forest and included in the riparian zone.
Riparian ConditionThe “RIP CONDITION” column is divided into 2 subcolumns (LEFT and RIGHT). Natural riparian vegetation is typically bottomland hardwood forest, but when disturbances have been or are present there will be varying amounts of herbaceous plants and bare soil also. For this column the decision must be made as to whether the majority of the land in the riparian zone, on either side of the stream, is pasture (grassland) or forest. Refer to the definitions presented in the Riparian Width section.
In addition to the habitat type, there is a determination of how much soil is exposed. In grassy areas, this is a straightforward determination and is done by estimating the average % of bare soil observed within the 20-meter riparian zone in question. Forest, while not expected to have grasses & forbs covering the ground, is expected to have a layer of spongy duff composed of organic matter in various states of decay covering the soil. This layer is usually covered by an accumulation of recently fallen leaves or annual herbaceous vegetation that have not started to decay. The top layer of leaves and/or vegetation will have to be moved out of the way to determine if the duff layer is present. Soil not covered by duff should be counted as bare. Estimate the % bare soil exposed in forest while walking the area in question.
The riparian zone on both sides of the stream should be placed in one of the following categories.
1A STABLE FOREST <1% bare soil exposed1B MODERATELY USED FOREST 1-10% of surface is bare soil1C HEAVILY USED FOREST >10% of surface is bare soil2A GOOD CONDITION GRASSLAND <1% bare soil exposed2B FAIR CONDITION GRASSLAND 1-5% bare soil exposed2C POOR CONDITION GRASSLAND >5 <20% bare soil exposed2D BAD CONDITION GRASSLAND >20% bare soil exposedW WETLAND at least 5 meters of riparian area depth appear to be wetland
based on the presence of standing water or saturated soil after at least a week of dry conditions, or dominance by sedges, rushes, button bush or willow
CattleThe CATTLE column is divided into 4 subcolumns (%TRAM, #CP, TRAIL, & CLASS TRAILS). This category attempts to identify the impact cattle are having on the habitat:

Habitat AssessmentStatus: Active
Date: 07/13/2006Page 110 of 238
%TRAM: Percent of land trampled. This is an estimate of land where livestock trampling is evident within one meter either way of the transect. In other words, you are looking at a 2-meter wide strip that runs from the top of the right upper bank across the stream to the top of the left upper bank.
#CP: This is the number of cow pies in a 2 meters wide transect. TRAIL:This is the number of livestock trails on both banks that reach the stream over the
entire 20 meter segment. A single trail that crosses the stream and goes up the other side counts as two trails.
CLASS TRAILS: Each cowtrail should be placed in one of the following classes and the class of each trail recorded in this column. There should be as many numbers listed as there were cow trails identified. Separate each number by a comma.
1. < 0.75 m wide2. ≥0.75 < 1.5 m wide3. ≥ 1.5 < 2.5 m wide4. ≥ 2.5 m
CommentsIf a road is contributing excess sediment to the stream, or a pipe is discharging to the stream or there is a dump present or any other thing which you deem to be significant is present, record it in the comment block at the end of the page.
1.11 Sample Handling & PreservationNot applicable
1.12 Sample Preparation and AnalysisNot applicable
1.13 TroubleshootingConsult the Environmental Monitoring Coordinator
1.14 Data Acquisition, Calculation & Data ReductionNot applicable
1.15 Computer Hardware & SoftwareNot applicable
1.16 Data Management & Records Management
1.16.1 Field NotationAll measurements and observations made at each site should be recorded on the Stream Habitat Assessment Sheet (see SOP Appendix: Data Sheets). A Site Collection Sheet (see SOP Appendix: Data Sheets) should also be filled out; include all physical and chemical information if required by the QAPP or instructed by the Monitoring Coordinator. In addition, flow measurement should be recorded on the Flow Meter Data Sheet or Timed Flow Data Sheet (see SOP Appendix: Data Sheets) if applicable; see the Flow Measurement SOP. Data should be recorded following procedures outlined in the Procedure for Completing Field Data Sheets SOP.
1.16.2 Chain of Custody ProcedureNot applicable.
2.0 QA/QC SECTION

Habitat AssessmentStatus: Active
Date: 07/13/2006Page 111 of 238
2.1 TrainingTraining of field personnel will be done through dry run exercises in the laboratory and field to familiarize them with instrument operation, use, calibration and maintenance. All samplers should read Rapid Bioassessment Protocols for Use in Wadeable Streams and Rivers, 2 nd Edition (EPA, 1999) prior to performing a habitat assessment. All operators are required to become familiar with the SOP documents. Prior to solo assessment, field personnel must be evaluated in a field setting for proper use of equipment and sample collection protocol. Annual field audits and training exercises are performed on sample collectors following procedures outlined in the Quality Management Plan.
2.2 MaintenanceEquipment should be kept in working order
2.3 QC ProceduresIf required by the QAPP, replicate samples will be collected.
3.0 REFERENCES
EPA, (1999) Rapid Bioassessment Protocols for Use in Wadeable Streams and Rivers, 2nd Edition, EPA 841-B-99-002, Office of Water, Washington, D.C.
Butler, D., (1999) Personal Communication, Senor Biologist, Oklahoma Conservation Commission, Oklahoma City, OK.
Nielsen, L.A. and D.L. Johnson, (1983) Fisheries Techniques, American Fisheries Society.
4.0 APPENDIX A

Habitat AssessmentStatus: Active
Date: 07/13/2006Page 112 of 238
STANDARD OPERATING PROCEDUREField Summary
Apparatus and Materials field data sheets clip board wading rod (graduated in 0.1 m units) hip chain GPS unit
Preparation A representative stream reach is selected and measured such that primary physical features are included in the reach
(riffles, runs, and pools). The reach should be located away from the influences of major tributaries and bridge/road crossings.
Sample CollectionAll measurements and observations made at each site should be recorded on the Stream Habitat Assessment Sheet (see SOP Appendix: Data Sheets). A Site Collection Sheet (see SOP Appendix: Data Sheets) should also be filled out; include all physical and chemical information if required by the QAPP or instructed by the Monitoring Coordinator. In addition, flow measurement should be recorded on the Flow Meter Data Sheet (see SOP Appendix: Data Sheets) if applicable.
Instructions for filling out the Stream Habitat Assessment Sheet:
SITE INFORMATION: SITE NAME: Record the stream name from the USGS 7-1/2' map name. If a county map, soil
map, or other map has a different name, the USGS 7-1/2' map takes precedence. If a stream is unnamed on the USGS map, but named on another map, use that name, but write the name of the map in parentheses beside the stream name.
WBID #: Record the Water Body Identification number. SITE DATE: Record the site date in MM/DD/YR format START POINT: Provide a GPS lat/long and a brief written description of the starting point (first
observation). SITE TIME: Record the start time in military format. The “site time” is when initial activities
began at the site.. END POINT: Provide a GPS lat/long and a brief written description of the ending point (last
observation). SINUOSITY: Stream length/valley length. This can be assessed in the field or from aerial
photographs. USGS topographic maps should not be used. INVESTIGATORS: All people involved with the sampling should be recorded; the “crew leader” (the
person responsible for data custody and reporting) should be circled on the form. DIRECTION: Record if the assessment was done upstream or downstream from the starting
point.
Distance (DIST)In general, each stream reach is sampled for a distance of 400 m. A stream must be assessed a minimum of 30 times its average width or 400 meters; whichever is greater. Under most circumstances the 400 m reach is divided into twenty-20 m segments. Depending on the QAPP, the measurement interval can be lengthened or shortened.
If measuring 100 or 50 meter segments, use a rangefinder to select an easily visible landmark such as a large tree or rock 100 meters along the segment. If the stream bends before a full reading can be made, measure the distance to the bend and then measure the remaining distance after going around the bend.
If measuring 10 or 20 meter segments use a hipchain. Attach the string to a fixed object at the starting point and start measuring the distance while moving along the reach.
Depth

Habitat AssessmentStatus: Active
Date: 07/13/2006Page 113 of 238
In general, the depth of water is measured in meters to the nearest 0.1 m. The stream is divided into 3 segments: left ¼, right ¼, and center. The left bank of the stream is on left hand side while looking downstream.
o The left 1/4 (L1/4) is the depth of water midway between the center of the stream and the left bank. o Center (C) o Right 1/4 (R1/4) is the depth of water midway between the center of the stream and the right bank.
Width The width measurement takes into account the width of the wetted surface or water, and the width of the lower bank to the nearest 1 m.
o The width of the water (WTR) refers to the water’s edge to water’s edge, or a perpendicular section across the wetted surface.
o The width of the bank (BNK) refers to the lower bank as it extends from the water's edge at summer low flow to the top of the normal high water line. The normal high water line is usually marked by the beginning of well-established perennial vegetation. Below this line will be gravel and bare soil. There may be a sparse covering of annual vegetation below this line. The lower bank width is the distance between the tops of the left and right lower banks.
SubstrateThe substrate measurement characterizes the physical benthic material. Substrate is evaluated from the water’s edge on one side to the water’s edge on the other side of the stream. Record the fraction of each category as a percent of total. The total of all substrate components should add up to 100 percent. The categories include the following:
o Si&C Loose silt and clay.o SND Sand or rock particles; 0.1 to 2mm.o GVL Gravel; rocks from 2 mm to 50 mm.o CBL Cobble; rocks from 50 mm to 250 mm.o BLD Boulder; rocks > 250mm.o BRK Bedrocko POM Particulate organic matter--rotten leaves and fragments of stick and logs.o HPC Hardpan clay
Habitat TypeCheck the cell that is most applicable to the habitat type present at the station. If there are two obvious habitat types at the cross section being measured, check both boxes. An example is when a backwater pool is encountered beside a run or riffle.
o A riffle (RIF) is defined as any sudden downward change in the level of the streambed such that the surface of the water become disrupted by small waves and usually makes a sound.
o A pool (PL) has a smooth surface with no or very little current and can be deep or shallow. o A run (RU) has an obvious current, may be deep or shallow and often has a surface that may be slightly
broken, but does not make any noise. o Check dry (DR) if the stream has no water in it at the point being measured. .
In-Stream Cover % AreaThis category attempts to quantify the amount of cover present for fish in the section of stream you walked from the previous station to the present one. For example, if the section was 20 meters long and averaged 6 meters wide, its area would be 120 m2. A submerged log about 3 m long by 0.5 m wide would offer 1.5 m2 cover, and you would note that the LWD (large woody debris) category offered 1.5/120 or 1.3 percent cover. Waterwillow, an emergent aquatic macrophyte, might be growing in shallow water along the edge of the stream. If both edges had a zone about 1 meter wide where it grows, there would be (1 meter) (20 meters) (2 sides)=40m2 of emergent aquatic vegetation (EAV) in the 120m2 section of stream and you would check 40/120 or 33 percent in the EAV column. Note that the totals of the percent cover columns for each row will rarely add up to 100 percent and may often be 0 percent.
The categories are:o UCB Undercut Bankso LWD Large Woody Debris—woody debris in the water > 10 cm. in diameter.o SWD Small Woody Debris—woody debris in the water <= 10 cm. in diameter.

Habitat AssessmentStatus: Active
Date: 07/13/2006Page 114 of 238
o RTS Roots—these are submerged root wads of trees. If single or occasional roots are encountered, count them in one of the woody debris categories.
o BRL Bedrock Ledges—underwater bedrock ledges not forming part of an undercut bank.o SAV Submerged Aquatic Vegetation.o EAV Emergent Aquatic Vegetation.o TV Terrestrial vegetation that is currently underwater. An example would be tree branches or grass
leaves that are actually hanging down into the stream.o CBG Cobble, Boulder, and Gravel. This is an estimate of the percent coverage of cobble and boulder in
the 20-meter section. It may not be the same number as the percent composition of cobble and boulder in the cross section where you estimated substrate since they represent different areas.
Percent Embeddedness (EMB)Embeddedness is evaluated by visual observation of the degree to which larger particles have been surrounded by sediment.
If there is no fine material surrounding the cobble and gravel found in the riffles, and there is at least some free space under the rocks, that is 0 percent embedded. If the free space under the rocks is filled but the sides are untouched, count that as 5 percent embedded. As the level of fines rises up the cobble sides, estimate the percentage of the total height of the cobbles that is covered. This is the embeddedness estimate. An obvious “embeddedness line” is often distinctly observed on the side of a rock when it is removed from the water.
Percent Canopy Cover (CAN)At each measuring station, estimate the percent canopy cover in the previous segment. It can range from 0 to 100 percent, but if any “sky” is observed directly overhead, the estimate should be less than 100 percent.
Point Bar (Pt) If a recently formed point bar is present, that is, it has no or little vegetation, put a check in this box.
Deposition and Scouring (D+S)Characteristics to observe are scoured substrate and degree of siltation in pools and riffles. If there is evidence of scouring (smooth, clean bedrock or hardpan play) or deposition (loose, shifting bottoms of fine sand or silt or filled in pools) in the previous segment surveyed, check this box.
Percent Bank Vegetative Cover (BV)Record an estimate of the total area on both banks that is protected from erosion by well-established, perennial vegetation. Soil does not have to be covered as long as it is stable.
Dominant Vegetation (DV)Place an S (shrub), T (tree), or G (grasses and forbs) in the box indicating which type of vegetation is most dominant on the banks in terms of percent of ground protected. For our purposes, shrubs are any woody plant whose trunk and branches are <= 10 cm in diameter. If the vegetation is mixed but each of the three groups contribute at least 20% of the total put an M in the box.
Percent Eroded Banks (% ERODED BK)Record the average % of streambank that is actively eroding for both the left bank and the right bank of the stream segment. Measure from the edge of the lower bank to the edge of the upper bank. The upper bank is usually the edge of the flood plain. The left bank is refers to the left side of the bank while looking in a downstream direction.
Average Height of the Eroding Banks (HT ERODED)Record the average height of the eroding banks on either side of the stream segment. Measure from the edge of the lower bank to the edge of the upper bank.
Average Slope (SLOPE BANK)Record the average slope of the bank in degrees. That is, a vertical bank would be 90o while all other estimates would be less than 90o. Measurements are taken from the edge of the lower bank to the edge of the upper bank.

Habitat AssessmentStatus: Active
Date: 07/13/2006Page 115 of 238
Riparian Zone Width (RIP WIDTH)Record the average width of the riparian vegetation for each side of the stream. The riparian zone, for OCC purposes, extends from the top of the upper bank outwards from the stream. The riparian zone ends where the unmanaged (i.e. not plowed or mowed) portion of land ends. In other words, the riparian zone stops where pasture or crop management begins.
Mixtures of trees and herbaceous plants are frequently encountered. These will vary from a fairly dense forest with sparse grasses to land that is mostly pasture with a few scattered trees. For consistency, forest and pasture have been defined below:
Pasture: If woody shrub and sapling growth can be controlled using a 6' brushhog and a medium size tractor in between the larger trees, the land will be labeled pasture and may or may not be included in the riparian zone.
Forest: If the large trees are so dense that a tractor and mower of this size cannot be used for brush control, the land should be labeled as forest and included in the riparian zone.
Riparian Condition (RIP CONDITION)For this column the decision must be made as to whether the majority of the land in the riparian zone, on either side of the stream, is pasture (grassland) or forest. Refer to the definitions presented in the Riparian Width section.
In addition to the habitat type, there is a determination of how much soil is exposed. In grassy areas, this is a straightforward determination and is done by estimating the average % of bare soil observed within the 20-meter riparian zone in question. Forest, while not expected to have grasses & forbs covering the ground, is expected to have a layer of spongy duff composed of organic matter in various states of decay covering the soil. This layer is usually covered by an accumulation of recently fallen leaves or annual herbaceous vegetation that have not started to decay. The top layer of leaves and/or vegetation will have to be moved out of the way to determine if the duff layer is present. Soil not covered by duff should be counted as bare. Estimate the % bare soil exposed in forest while walking the area in question.
The riparian zone on both sides of the stream should be placed in one of the following categories. 1A STABLE FOREST <1% bare soil exposed1B MODERATELY USED FOREST 1-10% of surface is bare soil1C HEAVILY USED FOREST >10% of surface is bare soil2A GOOD CONDITION GRASSLAND <1% bare soil exposed2B FAIR CONDITION GRASSLAND 1-5% bare soil exposed2C POOR CONDITION GRASSLAND >5 <20% bare soil exposed2D BAD CONDITION GRASSLAND >20% bare soil exposedW WETLAND at least 5 meters of riparian area depth appear to be wetland
based on the presence of standing water or saturated soil after at least a week of dry conditions, or dominance by sedges, rushes, button bush or willow
CattleThis category attempts to identify the impact cattle are having on the habitat.
%TRAM: Percent of land trampled. This is an estimate of land where livestock trampling is evident within one meter either way of the transect. In other words, you are looking at a 2-meter wide strip that runs from the top of the right upper bank across the stream to the top of the left upper bank. #CP: This is the number of cow pies in a 2 meters wide transect. TRAIL:This is the number of livestock trails on both banks that reach the stream over the entire 20 meter segment. A single trail that crosses the stream and goes up the other side counts as two trails. CLASS TRAILS: Each cowtrail should be placed in one of the following classes and the class of each trail recorded in this column. There should be as many numbers listed as there were cow trails identified. Separate each number by a comma.
1. < 0.75 m wide2. ≥0.75 < 1.5 m wide3. ≥ 1.5 < 2.5 m wide4. ≥ 2.5 m
CommentsIf a road is contributing excess sediment to the stream, or a pipe is discharging to the stream or there is a dump present or any other thing which you deem to be significant is present, record it in the comment block at the end of the page.

HardnessStatus: Active
Date: 06/12/2009Page 116 of 238
OKLAHOMA CONSERVATION COMMISSIONWATER QUALITY DIVISION
STANDARD OPERATING PROCEDURE
HARDNESS MEASUREMENT
(Hach Digital Titrator Model 16900-01)

HardnessStatus: Active
Date: 06/12/2009Page 117 of 238
1.0 PROCEDURAL SECTION
1.1 Scope and Application1
Hardness of water is a measure of the total concentration of the calcium and magnesium ions expressed as calcium carbonate. The most important impact of hardness on fish and other aquatic life appears to be the affect the presence of these ions has on the other more toxic metals such as lead, cadmium, chromium and zinc. Generally, the harder the water, the lower the toxicity of other metals to aquatic life. In hard water, some of the metal ions form insoluble precipitates and drop out of solution and are not available to be taken in by the organism. Large amounts of hardness are undesirable mostly for economic or aesthetic reasons. If a stream or river is a drinking water source, hardness can present problems in the water treatment process.
1.2 Summary of MethodCalcium and magnesium ions in the sample are sequestered upon the addition of disodium ethylenediamine tetraacetate (Na2EDTA). The end point of the reaction is detected by means of Eriochrome Black T indicator, which has a red color in the presence of calcium and magnesium and a blue color when the cations are sequestered.
In this procedure, a water sample is buffered to pH 10.1 and indicator is then added to the buffered sample. The indicator, when added to a solution containing Ca and Mg ions turns red. EDTA, the titrant, complexes with Mg and Ca cations, removing them from association with the indicator. When all the Mg and Ca ions are complexed with EDTA, the indicator will turn blue.
1.2.1 Definitions Hardness = Ca+ (as CaCO3) + Mg+ (as CaCO3)
Hardness (mg/L) is reported as the total concentration of the calcium and magnesium ions expressed as calcium carbonate (CaCo3).
1.3 Health and Safety WarningsProtective clothing and eye protection is required during the titration process, since the reagents are eye irritants. If a drop gets in your eye, flush thoroughly with whatever water is available. Do not wait until you can get to a source of pure water if none is immediately available.
1.4 CautionsMake sure all air bubbles are removed from the delivery tube prior to sample reading.
1.5 Interference13
Some transition and heavy metals complex the indicator and prevent the color change at the end point. This test has a slow titration time relative to the alkalinity test. Extremely cold samples may be even slower to
change colors, so titrate cold samples more slowly to allow extra time for change.
1.6 Personnel QualificationField personnel must be trained and evaluated on use of equipment prior to collecting samples or data. Use of the equipment is subject to approval by the QA Officer and/or the Environmental Monitoring Coordinator. Training will be done through dry run exercises in the laboratory and field to familiarize field personnel with operation/collection, calibration, and maintenance. Investigators must be familiar with the SOP document and owner’s manual, when applicable.
1.7 Apparatus & Materials Hach Digital Titrator Model 16900-01 0.800 M EDTA and 0.080 M EDTA Titration Cartridges 250 mL Erlenmyer flask 100 mL graduated cylinder Hardness 1 Buffer ManVer 2 Hardness Indicator Powder Pillows Deionized water for necessary dilution 1.9 Instrument/Method Calibration
See QC Section 2.3.
13 Text taken directly or in part from Hach 1988

HardnessStatus: Active
Date: 06/12/2009Page 118 of 238
1.9 Equipment Operation & Preparation 4
1.9.1 Range Selection Select the sample volume corresponding to the expected hardness concentration as mg/L CaCO3 from Table 1.
A list of hardness values for sites in each area of the state should be maintained as reference for expected values. You may have to do more than one titration to arrive at the final value, but having some idea of the hardness value before you go into the field can save time. Failure to select the appropriate volume will manifest when:
a. The titration with 100 mL of sample requires more than a reading of 400 on the titrator to reach the endpoint.b. The titration with 50 mL of sample takes less than a reading of 100 on the titrator to reach the endpoint.
Table 1. Sample volume and titration cartridge concentration determinationRange
(mg/L CaCO3)Sample Volume
(mL)Titration Cartridge
(M EDTA)Catalog Number Digit Multiplier
10-40 100 0.080 14364-01 0.140-160 25 0.080 " 0.4
100 – 400 100 0.800 14399-01 1.0200 – 800 50 0.800 " 2.0500 – 2000 20 0.800 " 5.01000 – 4000 10 0.800 " 10.0
1.9.2 Set-up3. Attach the EDTA titration cartridge to the titrator. In order to attach the cartridge, the plunger must be totally retracted. To do this, press the plunger release button and slide the plunger all the way to the right. Place cartridge in the end slot and turn slightly to secure.2. Once the cartridge is in place, slide the plunger forward to meet the cartridge seal.3. Remove the cap on the cartridge and insert a clean delivery tube as shown in Figure 2.4. Expel any air by holding the cartridge tip up while turning the delivery knob. Turn delivery knob to flush tube and continue flushing until 10 drops have been evacuated.5. Use the counter reset knob to turn the digital counter back to zero. Wipe or rinse the tip to remove excess acid.
1.9.3 Measuring Total Hardness10. Use a graduated cylinder to measure the appropriate volume of sample into a 250-mL Erlenmeyer flask. See
Table 1 for sample volume. If a sample volume of less than 100 mL is required (i.e. 50, 25, 20, or 10 mL), add DI water to the flask to bring the total volume to 100 mL.
2. Add 2 ml of Hardness 1 Buffer Solution to the sample and swirl to mix. 3. Add contents of one ManVer 2 Hardness Indicator Powder Pillow to flask and swirl to mix.4. Immerse the delivery tube tip in the solution and swirl the flask while titrating with EDTA. Titrate by turning the delivery knob. Keep turning the knob and swirling the sample until the sample changes from red to pure blue. The reaction will be slow, so swirl thoroughly after each addition of EDTA to allow time for color change. (If in the lab, a stir plate can be used to aid in the titration process. Place a stir bar into the flask and place it on the stir plate. Switch the stir plate on to dissolve the dye powder and/or to swirl the sample during the titration.)5. Determine Total Hardness concentration by using the following equation:
Digits Required x Digit Multiplier = mg/L as CaCO3 Where:
Digits Required = number of units displayed on the titrator’s digital counterDigit Multiplier = appropriate factor selected from Table 1
Record the result on the appropriate field data sheet and/or field notebook. 6. If the titration fails, change the sample volume and repeat the process. 7. When completed, rinse the flask, dry all equipment, and remove the cartridge for storage. Always re-cap
cartridges.
Figure 1. Hach Digital Titrator with component description (Hach, 1988).

HardnessStatus: Active
Date: 06/12/2009Page 119 of 238
Figure 2. Hach Digital Cartridge with Delivery tube (Hach, 1988).
1.10 Sample CollectionWater samples should be collected from mid channel, from a pooled but not stagnant area. Care should be taken to avoid collection of any surface scum.
1.11 Sample Handling & PreservationMeasurement should be performed in the field at the time of collection. However, if measurement is preformed in the laboratory or at a later date, collect the samples in clean glass or HDPE plastic container with zero headspace. Place samples on ice. Avoid excessive agitation or prolonged exposure to air.
1.12 Sample Preparation and AnalysisThere is 7 day holding time on hardness if stored at 4 °C and acidified to pH 2 with concentrated nitric acid (Hach 1988), but it is recommended that the samples be read as soon as possible after collection, within 24 hours. Neutralize acidified sample to pH 7 with ammonium hydroxide before testing.
1.13 TroubleshootingSee owner’s manuals. 1.14 Data Acquisition, Calculation & Data ReductionNot applicable.

HardnessStatus: Active
Date: 06/12/2009Page 120 of 238
1.15 Computer Hardware & SoftwareNot applicable.
1.16 Data Management & Records Management
1.16.1 Field NotationAll hardness measurements made at each site should be recorded on the Site Collection Sheet (see SOP Appendix: Data Sheets). Data should be recorded following procedures outlined in the Procedure for Completing Field Data Sheets SOP.
1.16.2 Chain of Custody ProcedureHardness should be measured in the field; therefore, no Chain of Custody form is required. However, if the laboratory is going to measure hardness, then follow the procedures described in the Chain of Custody and Sample Labeling SOP.
2.0 QA/QC SECTION
2.4 TrainingTraining of field personnel will be done through dry run exercises in the laboratory to familiarize them with instrument operation, calibration, and maintenance. All operators are required to become familiar with the SOP documents and owner’s manual. Prior to solo sample collection, field personnel are evaluated in a field setting for proper use of equipment and sample collection protocol. Annual field audits are performed on sample collectors following procedures outlined in the Quality Management Plan.
2.5 Maintenance Clean outside of unit with a with moist cloth Cap all cartridges Keep glassware clean
2.6 QC ProceduresThe digital titrator should be checked and calibrated against standards each quarter as directed by the QA officer at a QA and meter calibration session. Values will be recorded in the equipment logbook.
The collection of QA samples should follow the procedure specified in the Preparation of Spike, Duplicate, and Blank Samples for Routine QA SOP. Results will be recorded in the field notebook.
2.3.1 Accuracy Check (Sample Spike) To verify analytical technique, use 20 mL of the Calcium Standard Solution, 1000-mg/L as CaCO3. Perform the procedure as described above. This solution will read 1000 mg/L. Perform this accuracy check when interferences are suspected. 1. Snap the neck off a Hardness Voluette Ampule Standard, 10,000-mg/L as CaCO3. 2. Use a pipette to add 0.1 mL of standard to the sample titrated in step 4. Resume titration back to the same end point. Record the number of digits required. 3. Repeat, using two more additions of 0.1 mL. Titrate to the end point after each addition. 4. Each 0.1 mL addition of standard should require 10 additional digits of 0.800 M titrant.
3.0 REFERENCES
Hach (1988) Digital Titrator Model 16900-01 Manual, Hach Company, Loveland, Colorado.

HardnessStatus: Active
Date: 06/12/2009Page 121 of 238
4.0 APPENDIX ASTANDARD OPERATING PROCEDURE
Field Summary
Hardness Measurement
Equipment Operation & Preparation
Range Selection Select the sample volume corresponding to the expected hardness concentration as mg/L CaCO3 from Table 1.
A list of hardness values for sites in each area of the state should be maintained as reference for expected values. You may have to do more than one titration to arrive at the final value, but having some idea of the hardness value before you go into the field can save time.
Failure to select the appropriate volume will manifest when:a. The titration with 100 mL of sample requires more than a reading of 400 to reach the endpoint.b. The titration with 50 ml of sample takes less than a reading of 100 to reach the endpoint.
Table 1. Sample volume and titration cartridge concentration determinationRange
(mg/L CaCO3)Sample Volume
(mL)Titration Cartridge
(M EDTA)Catalog Number Digit Multiplier
10-40 100 0.080 14364-01 0.140-160 25 0.080 " 0.4
100 – 400 100 0.800 14399-01 1.0200 – 800 50 0.800 " 2.0500 – 2000 20 0.800 " 5.01000 – 4000 10 0.800 " 10.0
Set-up1. Attach the EDTA titration cartridge to the titrator. In order to attach the cartridge, the plunger must be totally retracted.
To do this, press the plunger release button and slide the plunger all the way to the right. Place cartridge in the end slot and turn slightly to secure.
2. Once the cartridge is in place, slide the plunger forward to meet the cartridge seal.3. Remove the cap on the cartridge and insert a clean delivery tube as shown in Figure 2.4. Expel any air by holding the cartridge tip up while turning the delivery knob. Turn delivery knob to flush tube and continue flushing until 10 drops have been evacuated.5. Use the counter reset knob to turn the digital counter back to zero. Wipe or rinse the tip to remove excess acid.
Measuring Total Hardness1. Use a graduated cylinder to measure the appropriate volume of sample into a 250-mL Erlenmeyer flask. See
Table 1 for sample volume. If a sample volume of less than 100 mL is required (i.e. 50, 25, 20, or 10 mL), add DI water to the flask to bring the total volume to 100 mL.
2. Add 2 ml of Hardness 1 Buffer Solution to the sample and swirl to mix. 3. Add contents of one ManVer 2 Hardness Indicator Powder Pillow to flask and swirl to mix.4. Immerse the delivery tube tip in the solution and swirl the flask while titrating with EDTA. Titrate by turning the
delivery knob. Keep turning the knob and swirling the sample until the sample changes from red to pure blue. The reaction will be slow, so swirl thoroughly after each addition of EDTA to allow time for color change. Extremely cold samples may be even slower to change colors, so titrate cold samples more slowly to allow extra time for change.
5. Determine Total Hardness concentration by using the following equation: Digits Required x Digit Multiplier = mg/L as CaCO3
Where:Digits Required = number of units displayed on the titrator’s digital counterDigit Multiplier = appropriate factor selected from Table 1
Record the result on the appropriate field data sheet and/or field notebook. 6. If the titration fails, change the sample volume and repeat the process.

HardnessStatus: Active
Date: 06/12/2009Page 122 of 238
7. When completed, rinse the flask, dry all equipment, and remove the cartridge for storage. Always re-cap cartridges.

Inorganic & Bacteria Sample CollectionStatus: Active
Date: 07/13/2006Page 123 of 238
OKLAHOMA CONSERVATION COMMISSIONWATER QUALITY DIVISION
STANDARD OPERATING PROCEDURE
INORGANIC AND BACTERIA SAMPLE COLLECTION

Inorganic & Bacteria Sample CollectionStatus: Active
Date: 07/13/2006Page 124 of 238
1.0 PROCEDURAL SECTION
1.1 Scope and Application14
Collection of surface water samples for data analysis is a critical component of an effective water quality program. The manner in which water samples are collected has a direct impact on the quality of the data. The object is to collect an aliquot small enough in volume to be transported conveniently and handled in the laboratory while still accurately representing the material being sampled.
1.2 Summary of MethodThis procedure describes the proper way to collect and preserve surface water samples for inorganic and bacteria analysis. Inorganic analysis includes: ortho-phosphorus, total phosphorus, chloride, sulfate (most anions), nitrate, nitrite, ammonia, most cations (metals; Al, Ca, Mg, Fe, Mn, etc.), total suspended solids, total dissolved solids, acidity, and others. Bacteria analysis, which is conducted only during the recreational period from April through September, commonly includes Escherichia coli, enterococcus, fecal streptococcus, and others.
1.2.1 Definitions1
Grab Samples: A sample collected at a particular place and time, representing the composition of the source at that place and time.
Composite Samples: A mixture of grab samples taken at various time intervals or at different locations. Integrated Samples: A mixture of grab samples collected from different points simultaneously or as nearly as
possible.
1.3 Health and Safety Warnings Acid is used to preserve some samples. Proper eyewear, gloves, and protective clothing should be worn to prevent injury. Avoid sample collection in deep or swift water without proper safety devices (e.g. flotation devices etc).
1.4 Cautions15
Use only new sample containers/bottles. Certified clean bottles may be needed for certain analyses; refer to the Quality Assurance Project Plan.
Use only new, sterile sample containers for bacteria samples. Prior to sampling, keep sample bottles capped to prevent dust and dirt from entering the container. Always rinse sample containers at least three times with sample water prior to collecting an aliquot. This does not apply
for bacteria collections; make the grab sample without rinsing the container. Collect enough sample volume to run the appropriate laboratory analysis. If sampling from a boat, collect from the bow, away and upwind/upstream of gasoline and the outboard motor. Avoid sampling near dams, piers or bridges because of the unnatural influence these structures introduce (e.g. eddies),
which affect the accuracy of the sample. When sampling at a bridge site it is preferable to sample on the upstream side—make sure water is flowing.
When preserving samples be cognizant of air born dust and other contaminants.
1.5 Interference Dirty bottles (inside and out) Contaminated preservative Contaminated pipettes Preservation conditions—too warm or cold for bacterial samples Dust, precipitation and other atmospheric contaminants
1.6 Personnel QualificationField personal must be trained and evaluated on sample collection technique. Sample collection is subject to approval by the QA Officer and/or the Environmental Monitoring Coordinator. Training will be done through dry run exercises in the laboratory and field to familiarize field personnel with procedures and techniques.
1.7 Apparatus & Materials New high-density polyethylene (HDPE) bottle, along with caps containing a polyethylene liner to prevent leakage. For
bacteria sample collection use new, sterile containers—obtained from the laboratory. For critical measurement of ortho-
14 Text taken directly or in part from Standard Methods (APHA, AWWA, WPCF, 1995).15 Portion may have been taken directly or in part from Csuros, 1994.

Inorganic & Bacteria Sample CollectionStatus: Active
Date: 07/13/2006Page 125 of 238
phosphate, trace metals, and/or priority pollutants, certified clean bottles are required. Furthermore, protocol may require the use of Teflon containers in certain circumstances.
Preservation acids (sulfuric, nitric, and/or hydrochloric) along with a measuring and dispensing device for the acid. Ice (depending on the sample collected). Coolers to contain samples. Bottle labeling marker.
1.8 Instrument/Method CalibrationNot applicable
1.9 Preparation
Sample containers should not interfere with the chemical analysis of the sample. In general, plastic containers are best for sampling inorganic constituents. Unless specified in the QAPP, new bottles that are immediately capped upon purchase are suitable for routine water collection. For some projects, certified clean bottles may be required or bottle washing may be necessary. Consult with the QA Officer prior to sample collection.
Some projects’ QAPPs may require bottle washing. The cleaning procedure varies depending on the sample analysis.
Physical Properties and Mineral Analysis Wash bottles and caps with hot soapy water (Liquinox phosphorus-free soap) and rinse thoroughly with tap water. Rinse bottles and caps with DI water 3 to 5 times. Drain, dry and store tightly capped until used.
Nutrients Wash bottles and caps with hot soapy water (Liquinox phosphorus-free soap) and rinse thoroughly with tap water. Soak bottles and caps in 1:1 HCl (1 part acid to 1 DI part water) for 10 minutes. Rinse bottles and caps with DI water 3 to 5 times. Drain, dry and store tightly capped until used.
Metals Wash bottles and caps with hot soapy water (Liquinox phosphorus-free soap) and rinse thoroughly with tap water. Rinse bottles with 1:1 HCl, followed by tap water rinse. Soak bottles and caps in 1:1 HNO3 for 10 minutes. Rinse bottles and caps with DI water 3 to 5 times. Drain, dry and store tightly capped until used.
1.10 Sample Collection
1.10.1 Inorganic Grab Sample1. If possible, collect from the site with the least contamination first and the most contamination last.2. Use new HDPE bottles along with caps that have a plastic foam liner to prevent leakage. Typically, a 2 L volume
will be sufficient for each set of parameters run. In other words, 2 L for physical properties (TSS, TDS, SO4-2, Cl,
acidity, etc.), 2 L for nutrients, and 2 L for metals is enough for laboratory analysis and laboratory QA procedures. Depending on the method, 3780 mL (1 gallon) of sample may be required for TKN or BOD analysis. Check with the Environmental Monitoring Coordinator and/or the contracted laboratory for specific volume requirements.
3. Label the bottle using a permanent marker. Include site name, site date and time, WBID #, sample type, investigator initials, and preservation method. Refer to the Chain of Custody and Sample Labeling SOP for more instructions.
4. Rinse the cap and bottle three times with stream water from the same part of the waterbody that will be sampled. (Vigorously shake the bottle with the rinse water inside.)
5. Take care to sample away from any sediment that may have been stirred up when collecting rinse water or making other measurements, hold the sample bottle underwater so that the mouth of the bottle is approximately 6" inches underwater—whenever possible. Invert the bottle so the neck is upright and pointing towards the water flow. Take care not to collect any surface scum. If the surface scum looks significant (i.e. floating oil and grease, a dense bloom of floating blue-green algae, etc.) be sure to note this in the field notes on the “Sampling Site” sheet.

Inorganic & Bacteria Sample CollectionStatus: Active
Date: 07/13/2006Page 126 of 238
6. If the waterbody is too shallow to hold a bottle underwater without stirring up sediment, then collect water in another clean sample container and pour it into the bottle. You may have to collect several small portions to fill one bottle. Pour the sample immediately after collection so that the solids do not have time to settle out.
7. When collecting parameters that are directly influenced by interactions with the atmosphere (pH alkalinity and some metal species), fill the bottle until no air space is left and seal the cap tightly. Check for air bubbles.
8. When collecting samples for nutrients or metals leave approximately 1% headspace (10 mL in a 1L bottle) for the addition of acid preservative. Mix thoroughly.
9. When collecting for physical and chemical parameters that do not require preservation, leave roughly 1% headspace.
10. Check with Quality Assurance Project Plan or Environmental Monitoring Coordinator for specific instructions on the total number of samples to collect over the duration of the project.
1.10.2 Inorganic Composite Sample16
1. Assemble sample-processing equipment and supplies on a clean work surface.2. Place all prelabeled bottles within easy reach of the churn spigot.3. Using a clean splitter-churn, rinse it with sample water.4. Pour the samples to be composited into the churn. There should be at least 1 - 2 L extra volume than required to
fill the sample bottles.5. Churn the composite sample at a uniform rate by raising and lowering the disk inside the churn splitter with
smooth, even strokes.a. When churning, the disk should touch bottom on every stroke, and the stroke length should be as long as
possible without breaking water surface. Do not break the surface of the water.b. The churning rate should be about 9 inches per second (in/s). If the churning rate is significantly greater
than 9 in/s, or if the disk breaks the surface of the water, excessive air is introduced into the sample and could affect dissolved gases, bicarbonate, pH, and other characteristics of the sample.
c. Inadequate churning can result in withdrawal of non-representative samples.6. Pre-mix the composite sample by churning for about 10 strokes to uniformly disperse suspended material before
subsampling.7. Pre-mix the composite sample by churning for about 10 strokes to uniformly disperse suspended material before
subsampling.8. Withdraw the subsamples.
a. Withdraw an adequate volume of sample water for the field rinse while continuing to churn.b. Fill the sample bottle(s) by dispensing through the spigotc. The first subsample withdrawn from the churn should be the largest volume required.d. Do not interrupt the churning/subsampling process, if possible. If an interruption occurs, reestablish the
churning rate and remix the sample by churning ten strokes before resuming subsampling.e. As the volume of composite sample in the churn decreases, adjust the stroke length to maintain a churning
rate of about 9 in/s and avoid breaking the surface of the water being sampled.9. Check with Quality Assurance Project Plan or Environmental Monitoring Coordinator for specific instructions on
the total number of samples to collect over the duration of the project.
1.10.3 Bacteria Sample Collection3
1. Open a sterile, approved sampling container (“Bact-T” bottle); grasp the bottle near the base, with hand and arm on downstream side of bottle.
2. Without rinsing, plunge the bottle opening downward, below the water surface. Allow the bottle to fill with the opening pointed slightly upward into the current.
3. Fill to with ±10 mL of the 100 mL line or “EPA line” marked on the side of the bottle. Remove the bottle with the opening pointed upward from the water and tightly cap.
4. For most collections, fill two containers at each site. Check with Quality Assurance Project Plan or Environmental Monitoring Coordinator for specific instructions on the number of samples to collect.
5. Fill a third bottle with DI water to serve as the temperature blank. Check the temperature periodically to make sure the samples are between 6 – 9oC. Only one temperature blank is needed per sampling episode.
6. Place samples in a protective container, and store up-right (containers are leaky).
16 Taken directly or in part from USGS (1999) National Field Manual for the Collection of Water-Quality Data Techniques of Water-Resources Investigations, Book 9, Handbooks for Water-Resources Investigations, United States Geologic Survey, Office of Water

Inorganic & Bacteria Sample CollectionStatus: Active
Date: 07/13/2006Page 127 of 238
7. Put on ice immediately; do not submerge in ice water and; drain water from cooler as necessary.8. Avoid direct contact with ice and sunlight.9. Check with Quality Assurance Project Plan or Environmental Monitoring Coordinator for specific instructions on
the total number of samples to collect over the duration of the project. Bacteria is only collected during the recreational season from April through September.
1.11 Sample Handling & Preservation
1.11.1 Sample FiltrationSome samples may need to be filtered depending on laboratory protocols and/or the objectives of the project. For instance, field filtration of samples is required when samples are collected for USGS and certain metal and nutrient analysis. Results from filtered samples have a different meaning than results from unfiltered samples (e.g. Dissolved Metals: Those metals dissolved in an unacidified sample that passes through a 0.45-μM membrane filter—represents soluble metals. Total Metals: The concentration of metals determined from an unfiltered sample after rigorous digestion—represents dissolved and particulate metals.).
Filtration is done in the field using a 12 volt peristaltic pump, a battery, and a 120 mm filtering manifold. The correct filter to use is a 142 mm, 0.45µm pore size cellulose-nitrate filter. A 1µm glass fiber pre-filter may be used to speed up filtration of turbid samples but is not required.
Setup of the filtering apparatus is simple. The pump can turn in either direction so it is not important which end of the tubing is hooked up to the filter manifold. The free end of the tubing becomes the intake tube which is placed into raw sample water, the outlet is connected to the top of the filter manifold. The pump is then turned on and set to rotate in the direction that draws water in the intake and forces it through the filter. Filtered water emerges at the other side of the manifold.
Filters should be placed in the manifold according to the instructions that come with the manifold.
Procedure:1. With filter in manifold, flush 200 mLs de-ionized water through tubing and filter. This rinses the detergent
out of the filter and rinses the remains of the last sample out of the tubing and manifold.2. Next, flush about 200 mLs of raw sample water through the system. This flushes the de-ionized water out of
the system. As this initial batch of filtered sample water comes through the filter it should be caught and used to rinse out the three bottles to be filled with filtered water.
3. After the first 200 mLs is purged and the bottles rinsed, collect a sample.4. If the filter plugs up before the bottles are all filled, the pump will need to be turned off and a new filter
installed. If this happens, the new filter can be rinsed with sample water rather than de-ionized water; however this water must be discarded.
5. Fill sample bottles following the procedure for the parameters of interest. Preservative must be added after the sample has been filtered—if required.
1.11.2 Sample Preservation Refer to Table 1 for specific preservation requirements. Metal samples should be preserved to a pH <2 using HNO3 or if metal speciation is of concern use HCl. Most nutrient samples are preserved to a pH <2 with H2SO4. When acidifying samples, try to add equivalent amounts to each bottle (including blank) to maintain consistency.
Use best professional judgment with selecting acid volume. Usually 1-2 mL/L should be sufficient, but certain waters may require more or less depending on alkalinity. (e.g. in general, eastern Oklahoma waters tend to be less alkaline, while western Oklahoma waters tend to have higher alkalinity. Groundwater, mine seeps and water from limestone outcrops tend to have elevated alkalinity levels.)
Other physical and chemical sample bottles should be stored and delivered on ice or at 4o C. Bacteria samples should not be allowed to float in ice water. In addition, care should be taken that other samples
be kept on fresh ice—not in ice water.
1.12 Sample Preparation and AnalysisRefer to Table 1 for specific preparation requirements and holding times.

Inorganic & Bacteria Sample CollectionStatus: Active
Date: 07/13/2006Page 128 of 238
1.13 TroubleshootingConsult with the Environmental Monitoring Coordinator.
1.14 Data Acquisition, Calculation & Data ReductionNot applicable
1.15 Computer Hardware & SoftwareNot applicable
1.16 Data Management & Records Management1.16.1 Field NotationAll QA samples need to be recorded on the Sampling Episode Sheet (see SOP Appendix: Data Sheets); including blank, split, replicate and spike information. All measurements made at each site should be recorded on the Site Collection Sheet (see SOP Appendix: Data Sheets). Data should be recorded following procedures outlined in the Procedure for Completing Field Data Sheets SOP.
1.16.2 Chain of Custody ProcedureCollection of inorganic sample requires the use of a Chain of Custody form. The handling of COC should follow the procedures described in the Chain of Custody and Sample Labeling SOP.
Table 1: Recommendation for sampling and preservation of samples17
PARAMETER SAMPLE VOLUME
(approximate, mL)
CONTAINER(plastic-glass)
PRETREATMENT/PRESERVATIVE
HOLDING TIMES(recommended1 /regulatory/OCC)
Acidity 100 P, G Ice (4o C) 24 hr/14 days/14 daysAlkalinity In situ (200) P, G Ice (4o C) Stat /14 days/Stat Ammonia 500 P, G Ice (4o C); H2SO4 pH <2 7 days/28 days /28 daysBacteria (E. Coli, fecal coliform & Enterococcus)
2-100 P, G Ice (4o C) 6 hrs/24 hrs/48 hr1
Bromide 100 P, G None required 28 days /28 days /28 daysChloride 100 P, G None required 28 days /28 days /28 daysColor 100 P, G Ice (4o C) 48 hrs /48 hrs /48 hrsConductance, Specific In situ (500) P, G Ice (4o C) Stat /28 days/StatFluoride 300 P None required 28 days /28 days /28 daysHardness 100 P, G Ice (4o C) or (HNO3 pH <2)2 6 mnths/6 mnths /6 mnthsMetals, dissolved 200 P, G Filter 0.45 μm; HNO3 pH <2 6 mnths/6 mnths /6 mnthsMetals, total 200 P, G HNO3 pH <2 6 mnths/6 mnths /6 mnthsNitrate 100 P, G Ice (4o C) 48 hrs/48 hrs/48 hrsNitrate + Nitrite 200 P, G Ice (4o C); H2SO4 pH <2 28 days/28 days/28 daysNitrite 100 P, G Ice (4o C) 48 hrs/48 hrs/48 hrsOrganic nitrogen, TKN 1000 P, G Ice (4o C); H2SO4 pH <2 7 days/28 days/7 daysOxygen (probe) In situ - - Stat/NA/StatOxygen (Winkler) 300 BOD bottle Fix on site, store in dark 8 hrs/8 hrs/8hrspH In situ - - Stat/Stat/StatPhosphorus, ortho 100 P, G Ice (4o C) 48 hrs/48 hrs/48 hrsPhosphorus, total 100 P, G Ice (4o C); H2SO4 pH <2 28 days/28 days/28 daysSettleable Solids 500 P, G Ice (4o C) 48 hrs/48 hrs/48 hrsSulfate 100 P, G Ice (4o C) 28 days/28 days/8 daysSolids, total dissolved 200 P, G Ice (4o C) 7 days/7 days/7 daysSolids, total suspended 200 P, G Ice (4o C) 7 days/7 days/7 daysTemperature In situ - - Stat/Stat/StatTurbidity In situ P, G Ice (4o C) Stat/48 hrs/StatIn situ = in the waterbody Stat = immediately NA = not available 1 = For standard violation 6 hr holding time is required; for OCC purposes 24 hr is preferred but 48 hrs is acceptable2 = use HNO3 only if Ca and Mg hardness is being determined via the AA
17 Adapted from EPA (1983),“Methods for Chemical Analysis of Water and Wastes”.

Inorganic & Bacteria Sample CollectionStatus: Active
Date: 07/13/2006Page 129 of 238
2.0 QA/QC SECTION
2.1 TrainingTraining of field personnel will be done through dry run exercises in the laboratory to familiarize them with instrument operation, calibration and maintenance. All operators are required to become familiar with the SOP documents. Prior to solo sample collection, field personnel are evaluated in a field setting for proper use of equipment and sample collection protocol. Annual field audits are performed on sample collectors following procedures outlined in the Quality Management Plan.
2.2 MaintenanceNot applicable
2.3 QC ProceduresA set of QA samples will be collected for every sampling episode or one set per 20 sampling sites (5%). The QA samples will include at a minimum Field Blanks, and Field Splits. If required by the QAPP, Field Spikes and/or Field replicates will be collected. Depending on the parameters being sampled, the volume of sample may vary. Check with the contracted laboratory for the required volume. For most sampling events, a 1 L sample should be sufficient for each grouping of parameters collected. That is, a 1 L blank is needed for physical properties, for nutrients, and for metals (if collected). An additional 2-3 one L bottles are required for splits, replicates, and spikes (if collected), respectively. Field blanks will consist of nano-pure deionized water, while the splits, replicates, and spikes will be taken from the stream sampling location.
3.0 REFERENCES
APHA, AWWA, and WPCF (1995) Standard Methods for the Examination of Water and Wastewater, 19th edition, eds. L.S. Clesceri, A.E. Greenberg, and R.R. Trussell, American Public Health Association, Washington, D.C.
EPA (1983) Methods for Chemical Analysis of Water and Wastes, US Environmental Protection Agency, Environmental Monitoring and Support Laboratory, Cincinnati, OH.
Csuros, M. (1994) Environmental Sampling and Analysis for Technicians, Lewis Publishers, Ann Arbor Michigan.
USGS (1999) National Field Manual for the Collection of Water-Quality Data Techniques of Water-Resources Investigations, Book 9, Handbooks for Water-Resources Investigations, United States Geologic Survey, Office of Water, Washington, D.C.

Inorganic & Bacteria Sample CollectionStatus: Active
Date: 07/13/2006Page 130 of 238
4.0 APPENDIX A
STANDARD OPERATING PROCEDUREField Summary
Inorganic Sample CollectionSample Collection
Inorganic Grab Sample1. If possible, collect from the site with the least contamination first and the most contamination last.2. Use new HDPE bottles along with caps that have a plastic foam liner to prevent leakage. Typically, a 2 L volume will
be sufficient for each set of parameters run. In other words, 2 L for physical properties (TSS, TDS, Ortho-P, SO4-2,
Cl-, acidity, etc.), 2 L for nutrients, and 2 L for metals is enough for laboratory analysis and laboratory QA procedures. Depending on the method, 3780 mL (1 gallon) of sample may be required for TKN or BOD analysis. Check with the Environmental Monitoring Coordinator and/or the contracted laboratory for specific volume requirements.
3. Label the bottle using a permanent marker. Include site name, sight date and time, WBID #, sample type, and preservation method. Refer to the Chain of Custody and Sample Labeling SOP for more instructions.
4. Rinse the cap and bottle three times with stream water from the same part of the waterbody that will be sampled. (Vigorously shake the bottle with the rinse water inside.)
5. Take care to sample away from any sediment that may have been stirred up when collecting rinse water or making other measurements, hold the sample bottle underwater so that the mouth of the bottle is approximately 6" inches underwater—whenever possible. Invert the bottle so the neck is upright and pointing towards the water flow. Take care not to collect any surface scum. If the surface scum looks significant (i.e. floating oil and grease, a dense bloom of floating blue-green algae, etc.) be sure to note this in the field notes on the “Sampling Site” sheet.
6. If the waterbody is too shallow to hold a bottle underwater without stirring up sediment, then collect water in another clean sample container and pour it into the bottle. You may have to collect several small portions to fill one bottle. Pour the sample immediately after collection so that the solids do not have time to settle out.
7. When collecting parameters that are directly influenced by interactions with the atmosphere (pH alkalinity and some metal species), fill the bottle until no air space is left and seal the cap tightly. Check for air bubbles.
8. When collecting samples for nutrients or metals leave approximately 1% headspace (10 mL in a 1L bottle) for the addition of acid preservative. Mix thoroughly.
9. When collecting for physical and chemical parameters that do not require preservation, leave roughly 1% headspace.10. Check with Quality Assurance Project Plan or Environmental Monitoring Coordinator for specific instructions on the
total number of samples to collect over the duration of the project.
Inorganic Composite Sample18
1. Assemble sample-processing equipment and supplies on a clean work surface.2. Place all prelabeled bottles within easy reach of the churn spigot.3. Using a clean splitter-churn, rinse with sample water4. Pour the samples to be composited into the “tank”. There should be at least 1 - 2 L extra volume than required to fill
the sample bottles.5. Churn the composite sample at a uniform rate by raising and lowering the disk inside the churn splitter with smooth,
even strokes.a. When churning, the disk should touch bottom on every stroke, and the stroke length should be as long as
possible without breaking water surface. Do not break the surface of the water.b. The churning rate should be about 9 inches per second (in/s). If the churning rate is significantly greater
than 9 in/s, or if the disk breaks the surface of the water, excessive air is introduced into the sample and could affect dissolved gases, bicarbonate, pH, and other characteristics of the sample.
c. Inadequate churning can result in withdrawal of non-representative samples.6. Pre-mix the composite sample by churning for about 10 strokes to uniformly disperse suspended material before
subsampling.7. Withdraw the subsamples.
a. Withdraw an adequate volume of sample water for the field rinse while continuing to churn.
18 Taken directly or in part from USGS (1999) National Field Manual for the Collection of Water-Quality Data Techniques of Water-Resources Investigations, Book 9, Handbooks for Water-Resources Investigations, United States Geologic Survey, Office of Water

Inorganic & Bacteria Sample CollectionStatus: Active
Date: 07/13/2006Page 131 of 238
b. Fill the sample bottle(s) by dispensing through the spigot.
c. The first subsample withdrawn from the churn should be the largest volume required.d. Do not interrupt the churning/subsampling process, if possible. If an interruption occurs, reestablish the
churning rate and remix the sample by churning ten strokes before resuming subsampling.e. As the volume of composite sample in the churn decreases, adjust the stroke length to maintain a churning
rate of about 9 in/s and avoid breaking the surface of the water being sampled.8. Check with Quality Assurance Project Plan or Environmental Monitoring Coordinator for specific instructions on the
total number of samples to collect over the duration of the project.
Bacteria Sample Collection3
1. Open a sterile, approved sampling container (“Bact-T” bottle); grasp the bottle near the base, with hand and arm on downstream side of bottle.
2. Without rinsing, plunge the bottle opening downward, below the water surface. Allow the bottle to fill with the opening pointed slightly upward into the current.
3. Fill to with ±10 mL of the 100 mL line or “EPA line” marked on the side of the bottle. Remove the bottle with the opening pointed upward from the water and tightly cap.
4. For most collections, fill two containers at each site. Check with Quality Assurance Project Plan or Environmental Monitoring Coordinator for specific instructions on the number of samples to collect.
5. Fill a third bottle with DI water to serve as the temperature blank. Check the temperature periodically to make sure the samples are between 6 – 9oC. Only one temperature blank is needed per sampling episode.
6. Place samples in a protective container, and store up-right (containers are leaky). 7. Put on ice immediately; do not submerge in ice water and drain water from the cooler periodically.8. Avoid direct contact with ice and sunlight.9. Check with Quality Assurance Project Plan or Environmental Monitoring Coordinator for specific instructions on the
total number of samples to collect over the duration of the project. Bacteria is only collected during the recreational season from April through September.
Sample Handling & PreservationSample Filtration
Some samples may need to be filtered depending on laboratory protocols and/or the objectives of the project. For instance, field filtration of samples is required when samples are collected for USGS and certain metal and nutrient analysis. Results from filtered samples have a different meaning than results from unfiltered samples (e.g. Dissolved Metals: Those metals dissolved in an unacidified sample that passes through a 0.45-μM membrane filter—represents soluble metals. Total Metals: The concentration of metals determined from an unfiltered sample after rigorous digestion—represents dissolved and particulate metals).
Filtration is done in the field using a 12 volt peristaltic pump, a battery, and a 120 mm filtering manifold. The correct filter to use is a 142 mm, 0.45µm pore size cellulose-nitrate filter. A 1µm glass fiber pre-filter may be used to speed up filtration of turbid samples but is not required.
Setup of the filtering apparatus is simple. The pump can turn in either direction so it is not important which end of the tubing is hooked up to the filter manifold. The free end of the tubing becomes the intake tube which is placed into raw sample water, the outlet is connected to the top of the filter manifold. The pump is then turned on and set to rotate in the direction that draws water in the intake and forces it through the filter. Filtered water emerges at the other side of the manifold.
Filters should be placed in the manifold according to the instructions that come with the manifold.
Procedure:1. With filter in manifold, flush 200 mLs de-ionized water through tubing and filter. This rinses the detergent out of the
filter and rinses the remains of the last sample out of the tubing and manifold.2. Next, flush about 200 mLs of raw sample water through the system. This flushes the de-ionized water out of the
system. As this initial batch of filtered sample water comes through the filter it should be caught and used to rinse out the three bottles to be filled with filtered water.
3. After the first 200 mLs is purged and the bottles rinsed, collect a sample.
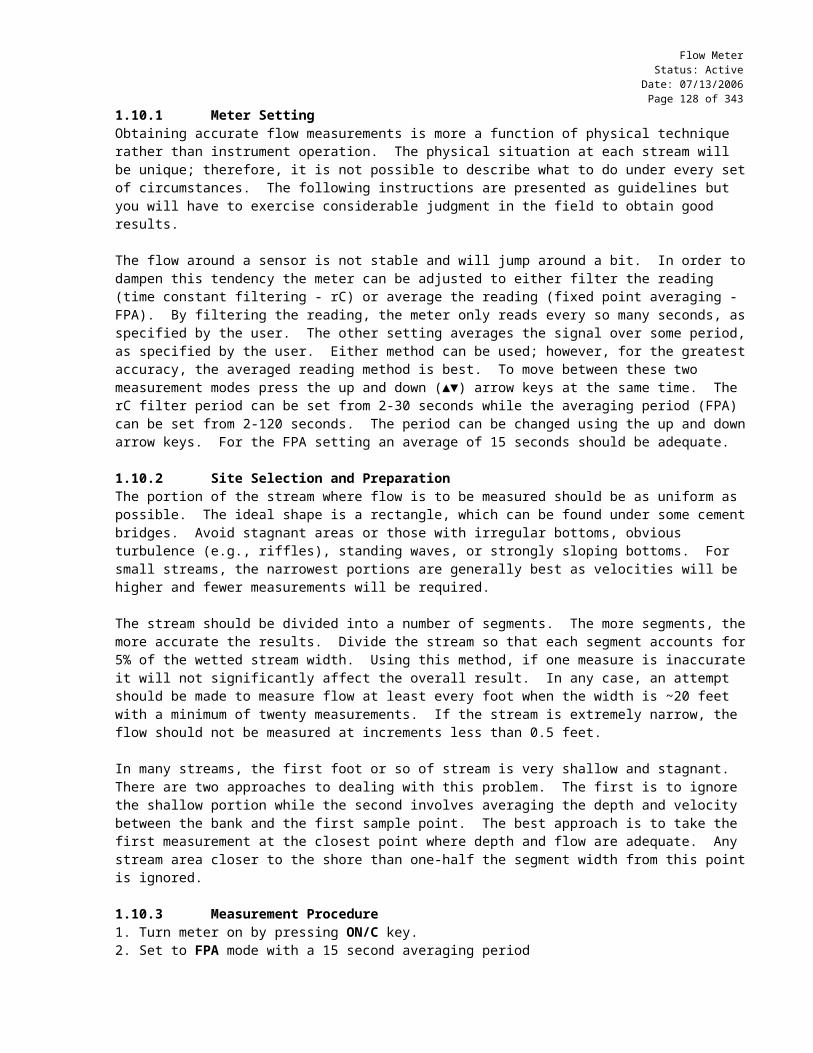
Inorganic & Bacteria Sample CollectionStatus: Active
Date: 07/13/2006Page 132 of 238
4. If the filter plugs up before the bottles are all filled, the pump will need to be turned off and a new filter installed. If this happens, the new filter can be rinsed with sample water rather than de-ionized water; however this water must be discarded.
5. Fill sample bottles following the procedure for the parameters of interest. Preservative must be added after the sample has been filtered—if required.
Sample Preservation Refer to Table 1 for specific preservation requirements. Metal samples should be preserved to a pH <2 using HNO3 or if metal speciation is of concern use HCl. Most nutrient samples are preserved to a pH <2 with H2SO4. When acidifying samples, try to add equivalent amounts to each bottle (including blank) to maintain consistency.
Use best professional judgment with selecting acid volume. Usually 1-2 mL/L should be sufficient, but certain waters may require more or less depending on alkalinity.
Other physical and chemical sample bottles should be stored and delivered on ice or at 4o C. Bacteria samples should not be allowed to float in ice water. In addition, care should be taken that other samples
be kept on fresh ice—not in ice water.

Inorganic & Bacteria Sample CollectionStatus: Active
Date: 07/13/2006Page 133 of 238
Table 1: Recommendation for sampling and preservation of samples19
PARAMETER SAMPLE VOLUME
(approximate, mL)
CONTAINER(plastic-glass)
PRETREATMENT/PRESERVATIVE
HOLDING TIMES(recommended1 /regulatory/OCC)
Acidity 100 P, G Ice (4o C) 24 hr/14 days/14 daysAlkalinity In situ (200) P, G Ice (4o C) Stat /14 days/Stat Ammonia 500 P, G Ice (4o C); H2SO4 pH <2 7 days/28 days /28 daysBacteria (E. Coli, fecal coliform & Enterococcus)
2-100 P, G Ice (4o C) 6 hrs/24 hrs/48 hr1
Bromide 100 P, G None required 28 days /28 days /28 daysChloride 100 P, G None required 28 days /28 days /28 daysColor 100 P, G Ice (4o C) 48 hrs /48 hrs /48 hrsConductance, Specific In situ (500) P, G Ice (4o C) Stat /28 days/StatFluoride 300 P None required 28 days /28 days /28 daysHardness 100 P, G Ice (4o C) or (HNO3 pH <2)2 6 mnths/6 mnths /6 mnthsMetals, dissolved 200 P, G Filter 0.45 μm; HNO3 pH <2 6 mnths/6 mnths /6 mnthsMetals, total 200 P, G HNO3 pH <2 6 mnths/6 mnths /6 mnthsNitrate 100 P, G Ice (4o C) 48 hrs/48 hrs/48 hrsNitrate + Nitrite 200 P, G Ice (4o C); H2SO4 pH <2 28 days/28 days/28 daysNitrite 100 P, G Ice (4o C) 48 hrs/48 hrs/48 hrsOrganic nitrogen, TKN 1000 P, G Ice (4o C); H2SO4 pH <2 7 days/28 days/7 daysOxygen (probe) In situ - - Stat/NA/StatOxygen (Winkler) 300 BOD bottle Fix on site, store in dark 8 hrs/8 hrs/8hrspH In situ - - Stat/Stat/StatPhosphorus, ortho 100 P, G Ice (4o C) 48 hrs/48 hrs/48 hrsPhosphorus, total 100 P, G Ice (4o C); H2SO4 pH <2 28 days/28 days/28 daysSettleable Solids 500 P, G Ice (4o C) 48 hrs/48 hrs/48 hrsSulfate 100 P, G Ice (4o C) 28 days/28 days/8 daysSolids, total dissolved 200 P, G Ice (4o C) 7 days/7 days/7 daysSolids, total suspended 200 P, G Ice (4o C) 7 days/7 days/7 daysTemperature In situ - - Stat/Stat/StatTurbidity In situ P, G Ice (4o C) Stat/48 hrs/StatIn situ = in the waterbodyStat = immediatelyNA = not available 1 = For standard violation 6 hr holding time is required; for OCC purposes 24 hr is preferred but 48 hrs is acceptable2 = use HNO3 only if Ca and Mg hardness is being determined via the AA
TroubleshootingConsult with the Environmental Monitoring Coordinator.
19 Adapted from EPA (1983),“Methods for Chemical Analysis of Water and Wastes”.

Macroinvertebrate Status: Active
Date: 07/13/2006Page 134 of 238
OKLAHOMA CONSERVATION COMMISSIONWATER QUALITY DIVISION
STANDARD OPERATING PROCEDURE
MACROINVERTEBRATE COLLECTION,SUBSAMPLING, AND PICKING

Macroinvertebrate Status: Active
Date: 07/13/2006Page 135 of 238
1.0 PROCEDURAL SECTION
1.1 Scope and Application20,21
Most free flowing water bodies, with acceptable water quality and habitat conditions, support diverse macroinvertebrate communities in which there are a reasonably balanced distribution of species among the total number of individuals present. Macroinvertebrate community responses to environmental perturbations are useful in assessing water quality and habitat impacts. The composition and density of macroinvertebrate communities in flowing water are reasonably stable from year to year. However, seasonal fluctuation associated with life-cycle dynamics of individual species may result in extreme variation at specific sites within any calendar year. Assessing the impact of pollution generally involves comparison of macroinvertebrate communities and their habitats at sites influenced by pollution with those collected from adjacent unaffected sites.
Macroinvertebrate collections, for purposes of stream assessment, are made from the community that requires or prefers flowing (lotic) water. Reasons why this community type is sampled rather than various lentic communities include:
1. The flowing water community is routinely exposed to the average water quality of the stream;2. The metrics used to analyze the macroinvertebrate community of streams were designed for the flowing
water community;3. The database of pollution tolerance of macroinvertebrates found in Oklahoma is much larger for lotic
communities; and4. The organisms most sensitive to water quality degradation tend to live in flowing water.
Due to these factors, the flowing water community is more suitable for assessing the condition of a stream, than by looking at the pool community where more tolerant organisms are found regardless of the stream’s water quality.
Lotic communities require a substrate of some type to attach to. The most common substrates of this type include rocky riffles, streamside rootmasses, and woody debris. Where possible, a rocky riffle should be sampled, but if it is not present, or is of dubious quality, if rocky riffles cannot be found at all streams of a given ecoregion, both of the other two alternate habitats should be sampled. At present, it appears that the streamside rootmasses are superior to woody debris but until that is definitely established, both should be sampled. The sampling methodology for the three habitat types is included in this SOP.
Invertebrate communities are constantly changing throughout the year as species emerge and new species hatch. Consequently, it is not possible to infer water quality from the invertebrate community of a stream by comparing it to a reference stream community that was collected at a different time of year. The springtime communities are especially unstable as many of the insects that over-winter as larvae begin to emerge. By summertime however, the insects that only have one generation per year have mostly emerged and the insects left are ones that hatch repeatedly throughout the summer. This means that collections made during different times of the summer tend to be the same in lieu of water quality differences. This period of the summer when collections from different streams can be compared to each other is termed the Summer Index Period.
Fall is also a poor time to collect to be used for comparing the water quality of different streams. Many insects lay eggs in the summer, which do not hatch until the water temperature cools down. As these insects hatch and grow large enough to see, they start appearing in collections. Since they hatch at different times and grow at different rates, collections can be very different if they are sampled at different times in the fall.
Wintertime communities, on the other hand, tend to be stable. Very few insects emerge in the wintertime and Oklahoma streams stay warm enough that the invertebrates in them remain actively growing. The wintertime period in which macroinvertebrate collections from different streams can be compared to each other is called the Winter Index Period.
1.2 Summary of MethodA modified version of EPA Rapid Bioassessment Protocol (RBPs) was adopted for macroinvertebrate collections. As stated above, the collection methods are geared toward assessing communities that require or prefer flowing water. Lotic
20 Text taken directly or in part from Standard Methods (APHA, AWWA, WPCF, 1995).
21 Text taken directly or in part from Dan Butler, Senior Biologist, Oklahoma Conservation Commission (2000)

Macroinvertebrate Status: Active
Date: 07/13/2006Page 136 of 238
communities require a substrate of some type to attach to. The most common substrates encountered are rocky riffles, streamside vegetation, and woody debris. All three substrates can be sampled (when available) to provide an accurate representation of the various communities in the stream. A combination of collection techniques is used for each habitat. Organisms collected from these habitats are subsampled and sent to a professional macroinvertebrate taxonomist and enumerated to genus level, when possible.
1.2.1 Definitions Riffle: Any sudden downward change in the level of the streambed such that the surface
of the water becomes disrupted by small waves. A riffle substrate must be composed of gravel, or cobble from 1" to 12" in the longest dimension; substrates of bedrock or tight clay are not considered suitable.
Streamside Vegetation: Any streamside vegetation which offers fine structure for invertebrates to dwell within or upon that receives suitable flow. Most habitat is located along undercut banks where fine roots of riparian vegetation are hanging in the water.
Woody Debris: Any dead wood with or without bark located in the stream with suitable current flowing over it.
Summer Index Period: July 1 to September 15. Winter Index Period: January 1 to March 15
1.3 Health and Safety Warnings Proper precautions should be taken when handling 100% ethanol.
o Flammableo Intoxicanto Eye irritant
1.4 Cautions Stream stage must not be greater than 3 cm (~1 inch) above base flow during the collection. Collections must be done in flowing water. In no case should the mason jar be filled more than 3/4 full of loose sample. There should always be enough room in the jar to have at least 5 cm (~2 inch) of free ethanol over the sample.
1.5 InterferenceNone
1.6 Personnel QualificationField personal must be trained and evaluated on sample collection technique. Sample collection is subject to approval by the QA Officer and/or the Environmental Monitoring Coordinator. Training will be done through dry run exercises in the laboratory and field to familiarize field personnel with procedures and techniques.
1.7 Apparatus & Materials Absolute ethanol (200 proof; ~100%) Clean quart size mason jars New mason jar lids Pencil & indelible marker 1 m2 kick net composed of number 30 nylon mesh Handheld dip net composed of #30 size nylon mesh
1.8 Instrument/Method CalibrationNot applicable
1.9 Preparation
Determine if flow conditions are suitable for collection. Samples must be collected in flowing water no greater than 3 cm (~1 inch) above the seasonal base flow. After a high flow event, 5 – 7 days should lapse before a collection is made to allow the benthic organisms to return to the preferred substrate. Furthermore, collection should be delayed for two weeks after a stream has gone from no flow (interrupted, or dry conditions) to base flow conditions.

Macroinvertebrate Status: Active
Date: 07/13/2006Page 137 of 238
1.10 Sample CollectionThere are three possible habitat types for collection. The methods for each are described below.
1.10.1 Collection of Benthic Macroinvertebrates from Rocky Riffles Suitable Substrate - A riffle is defined as any sudden downward change in the level of the streambed such that the
surface of the water becomes disrupted by small waves. For this collection method the substrate of the riffle must be composed of gravel, or cobble from 1" to 12" in the longest dimension. Riffles with substrates of bedrock or tight clay are not suitable.
Where to Sample the Riffle - Three 1 m2 areas of the riffle must be sampled. They can be square, rectangular or trapezoidal so long as each area equals 1 m2 in area. One should be in the fastest part of the riffle where the largest rocks and the smallest amount of interstitial sediment will generally be found. The second should be in the slowest part of the riffle, often near the edge of the stream where the smallest rocks and the greatest amount of interstitial sediment will be found. The third sample should be in an area intermediate between the first two
Method of Collecting the Sample - Support a 1 m2 kick net composed of a double layer of fiberglass window screen or a net of number 30 mesh in such a way that any organisms dislodged from the substrate will be carried into it by the current. The bottom of the net should be tight against the bottom of the stream and the current must be sufficient to insure that dense organisms such as small mollusks will be carried into the net from the sampling area. There is no definite cutoff for stream velocity in the sampling area, but if possible, riffles with average velocities of 1 foot/second or greater are preferred and should be chosen if possible.
By kicking the substrate, vigorously agitate the substrate of a 1 m2 area of the bed of the riffle immediately upstream of the net until all rocks and sediment to a depth of at least five inches have been thoroughly disturbed. Organisms living between and upon the rocks will have been dislodged and carried into the net by the current. Any rocks too large to kick should be brushed by hand on all surfaces. This can be done using your hands or with the aid of a brush. If a brush is used, you must be very careful to clean it after each site to prevent contamination of the next sample with invertebrates from the previous site. Continue agitation and brushing until it can be seen that the area being sampled is producing no new detritus, organisms, or fine sediment.
At this point, rinse leaves, sticks and other large debris caught in the net in the current in a manner such that organisms on them are carried into the net. When the volume of the sample is reduced so that three 1 m2 samples will loosely fill a 1-quart mason jar three fourths (3/4) full or less, remove all of the material from the net and place it in the mason jar. In no case should the mason jar be filled more than 3/4 full of loose sample. Add 100% ethanol to the jar until the sample is covered and there is free ethanol on top of the sample. There should always be enough room in the jar to have at least 5 cm (2 inches) of free ethanol over the sample.
Label the sample appropriately following the instructions presented in section 1.11 Sample Handling & Preservation.
1.10.2 Collection of Macroinvertebrates from Streamside Vegetation Suitable Substrate - Any streamside vegetation in current that offers fine structure for invertebrates to dwell within
or upon is suitable. The vegetation being sampled must be in the current so that it offers suitable habitat for organisms which collect drifting particles or which need flowing water for other reasons. This habitat will often be found along the undercut banks of runs and bends where the fine roots of grasses, sedges, and trees, such as willow and sycamore, hang in the water.
Method of Collecting the Sample - This type of sample should be collected with a dip net made of #30 size mesh material. The net should be placed around or immediately downstream of the vegetation being sampled. The organisms can be dislodged from the roots either by vigorously shaking the net around the roots or by shaking the roots by hand while the roots are inside the net.
Where and How Long to Sample - Sampling should continue for 3 minutes of actual root shaking. Do not count the time that elapses between sampling areas. Be careful to only sample roots in current. Usually, only one or two sides of a given rootmass are in current. Be careful not to sample the backside of a rootmass that is in still water.
At this point, rinse leaves, sticks and other large debris caught in the net so that organisms are not lost. When the volume of the sample is reduced so that it will loosely fill a 1-quart mason jar three fourths (3/4) full or less, remove all of the

Macroinvertebrate Status: Active
Date: 07/13/2006Page 138 of 238
material from the net and place it in the mason jar. In no case should the mason jar be filled more than 3/4 full of loose sample. Add 100% ethanol to the jar until the sample is covered and there is free ethanol on top of the sample. There should always be enough room in the jar to have at least 5 cm (2 inches) of free ethanol over the sample. Label the sample appropriately following the instructions presented in section 1.11 Sample Handling & Preservation.
1.10.3 Collection of Macroinvertebrates from Woody Debris Suitable Substrate - Any dead wood with or without bark in the stream is suitable as long as it is in current fast
enough to offer suitable habitat for organisms which collect drifting particles or which need flowing water for other reasons. The final sample should consist of organisms collected from an even mixture of wood of all sizes and in all stages of decay.
Method of Collecting the Sample - This type of sample should be collected with a dip net made of #30 size mesh material. The net should be placed around or immediately downstream of the debris being sampled. The organisms can be dislodged from the debris either by vigorously shaking the net around the woody debris or by shaking the debris by hand while the debris is inside the net. Large logs that are too big to shake should be brushed or rubbed vigorously by hand while the net is held immediately downstream.
Where and How Long to Sample - Sample for total of 5 minutes counting only the time that debris is actually being agitated. Include as many types of debris in the sample as possible. These types often include wood that is very rotten and spongy with or without bark, wood that is fairly solid which has loose and rotten bark, wood that is solid with firmly attached bark and any combination of these states. They should range in size from 1/4" to about 8" in diameter.
After sampling, rinse leaves, sticks and other large debris caught in the net so that organisms are not lost. When the volume of the sample is reduced so that it will loosely fill a 1-quart mason jar three fourths (3/4) full or less, remove all of the material from the net and place it in the mason jar. In no case should the mason jar be filled more than 3/4 full of loose sample. Add 100% ethanol to the jar until the sample is covered and there is free ethanol on top of the sample. There should always be enough room in the jar to have at least 5 cm (2 inches) of free ethanol over the sample.
Label the sample appropriately following the instructions presented in section 1.11 Sample Handling & Preservation.
1.11 Sample Handling & Preservation1. Pack the Mason Jar Properly. In no case should the mason jar be filled more than 3/4 full of loose sample. Add 100%
ethanol to the jar until the sample is covered and there is free ethanol on top of the sample. There should always be enough room in the jar to have at least 5 cm (2 inches) of free ethanol over the sample.
2. Label the Sample. The mason jar should be labeled on the lid using a fine tip permanent ink marker (Sharpie) as described below. In addition, a small sheet of paper (approximately 2" x 2") should be filled out with the same information written in pencil and placed in the jar.
Jar Lid & Sample InsertSite Date
Stream NameWaterbody ID #
Site TimeLegal Description
CountyType of sample (riffle, woody, vegetation)
Sampler’s Initials
3. Complete the Chain of Custody Form (COC). Follow the instructions in the Chain of Custody and Sample Labeling SOP. A new COC should be completed for each collection episode. Each substrate collection (riffle, woody, vegetation) should occupy a separate line on the COC. There should be only one box of samples per COC, i.e., one box, one COC.
4. Transfer samples to the Macroinvertebrate Sample Custodian. Correctly labeled macroinvertebrate samples, along with a Chain of Custody form (COC), should be transferred to the Macroinvertebrate Sample Custodian (Brooks Tramell) for subsampling. The box should be conspicuously labeled with COC number. Once the samples have been received and the COC signed, the field sampler should make a photocopy of the COC for their records.

Macroinvertebrate Status: Active
Date: 07/13/2006Page 139 of 238
1.12 Sample Preparation and AnalysisIn some instances it may be necessary to drain the liquid from the sample and add fresh 100% ethanol. This is necessary when the sample contains a large amount of algae or other material with high water content or material that will rapidly become rancid. This will help preserve the morphological integrity of the invertebrates and greatly aid in taxonomic identification.
1.12.1 Subsampling and Picking of Macroinvertebrates from field Collected SamplesThe waterbody assessment procedure utilized by OCC requires that a random sample of macroinvertebrates be collected, identified and enumerated, from the portion of the waterbody being assessed. In order to make this test cost effective it is not possible to identify more than about 150 organisms from each site. This procedure describes the procedure used to subsample a field-collected sample, which may contain 200-10,000 organisms.
1. Obtain the Field Sample to be Subsampled. The field collected macroinvertebrate samples and the original COC will be transferred to the individual(s) designated to complete the macroinvertebrate subsampling and picking. At this time a copy of the COC (signed by the subsampling designee) will be sent to the Data Manager.
The sample will come from the field in 1-quart mason jars preserved with 100% ethanol. Mason jar lids have a sealing compound that is not particularly resilient. Care must be taken so that the lids are not damaged when they are opened or resealed. If a lid is damaged it must be replaced with a new one. Keep a fresh supply of lids handy in case this happens. If you use a new lid, label it exactly the same as the one that was originally used.
Samples will be subsampled/picked in the order assigned on the Chain of Custody form.
2. Decant Ethanol. Without shaking or disturbing the contents, pour the liquid from the sample through a sieve made of #30 or finer screen. Save the ethanol to preserve the unused portion of the sample.
3. Rinse Sample. At this point, any silt, clay or fine sand in the sample should be GENTLY rinsed out of the sample. Be careful not to break off any of the delicate appendages that are used for identification of the animals. The sample will be easier to process if any large pieces of leaf, bark, stones, etc., are discarded. Any material to be discarded must first be carefully rinsed within the sieve.
4. Prepare Sample for Picking. Spread the sample out in a rectangular tray/pan that is divided into 28 sections of equal area. The size and shape of the divisions are not important so long as they are all equal in size. A pan with a white background may facilitate the collection since there will be a contrast between the organisms and the pan.
A clear glass pan or baking dish can be effectively used by creating a grid system on the bottom of the pan using a permanent marker. Each square should be numbered (1-28), and a sheet of white paper can be glued or taped over the outside bottom of the pan. If very many samples will be subsampled it will be worth your time to construct a divider for the tray similar in construction to an ice cube tray divider. This will not only demarcate the subsampling squares, but it will also prevent animals from drifting from one square to another during subsampling.
5. Remove Large Pieces of Detritus and Sediment. Large leaves and big pieces of wood and bark should be removed. Be VERY CAREFUL to pick all macroinvertebrates off of them before discarding. At this stage, any debris removed must be viewed through a magnifying lense to ensure the removal of all small invertebrates. At this point, the material remaining in the dish should consist of a mixture of sand, fine gravel, small organic detritus, pieces of leaves < 1-2 cm wide, fine roots, algae and macroinvertebrates.
6. Spread the Sample Out. All detritus and sediment should be as uniformly distributed over the bottom of the dish as possible.
7. Visually Estimate Invertebrate Density of the Sample. Determine if the sample must be subdivided. The decision will be based on two requirements: (1) individual squares MUST have AT LEAST 3 animals in them (providing the entire sample has at least 100 animals total), and (2) each square can have absolutely NO MORE THAN 25 animals. Simulid (blackfly) larvae are not to be counted as individuals for this purpose. That is, the density estimate should be independent of any blackfly larvae present. The goal is to have roughly 10 TO 20 ANIMALS PER SQUARE. This is a compromise between the statistical ideal of very few organisms per square and ease of subsampling where the entire sample is picked from one square. If you estimate that there are less than 200 animals in the entire sample, you should process the entire sample.

Macroinvertebrate Status: Active
Date: 07/13/2006Page 140 of 238
The purpose of this estimate is to make the sample statistically valid. Fewer than 80 animals does not provide a good representation of the population to draw conclusions from, and more than 130 animals biases the sample making it appear that that stream has more taxa, that it really does. A total of 100 invertebrates is the absolute minimum number of individual invertebrates to pick from a sample, except when a sample contains fewer than 100. Although 80 is the minimum number of individuals for statistical analysis, it is imperative that a cushion is incorporated to allow for the potential difference in the sub-samplers count and the final count by the taxonomist. Often invertebrates are tossed out by the taxonomist due to an inability to identify individuals caused by missing or damaged body parts or other various reasons.
8. Subdivide the Sample. If each square is estimated to have more than 50 animals, it is important to grossly subdivide the sample prior to picking. For instance, divide the sample in half or quarters depending on the animal density. Ideally, 10 to 20 animals per square is desirable.
For dividing in fourths, cut the sample into top and bottom halves and then into right and left halves. After dividing the sample, the four portions should appear as equal as possible in terms of the amount of detritus and sediment present. Choose one quarter by random means. For instance, flip a coin to select either the top half or the bottom half, and then flipping the coin again to select either the right or left side of the first half selected. If the sample is not too dense, that is the selected quarter has a density of 10 to 20 animals per square, then no additional subdivision is necessary. If the number of invertebrates is still too dense, divide the remaining portion in half and select one half by flipping the coin again. Continue dividing the sample until the density appears to fall in the correct range.
9. Return the Unselected Portion(s) to the Mason Jar. Return the unselected portion(s) of the sample to the original mason jar and add the reserved alcohol. Be very careful to remove the entire portion of unselected subsample. A proportionately high density of small macroinvertebrates can remain hidden in the sediment and detritus.
10. Fill the Tray About 1 to 2 cm Deep With Water. Add enough tap water to fill the tray to a depth of 1–2 cm (~0.5 to 0.75 inches) or the depth necessary to cover all sample material (debris and invertebrates). The water aids in the subsampling process. The organisms and individual pieces of detritus do not clump together as when they are dry. If the water is run into the tray very slowly, the remaining leaves and large pieces of detritus can be rinsed and discarded.
11. Distribute the Sample Evenly. Make sure that all materials in the tray are evenly distributed, especially the gravel and leaves. This is most easily accomplished by gently homogenizing the sample mixture by hand in the tray and distributing the mixture evenly over the entire pan. If a divider is to be used, place it in the tray now. Once the sample has been distributed, do not move the pan. Jostling can cause the organisms to move outside of their designated square. This could lead to a sampling bias.
12. Fill Out the Subsampling/Picking Log Book. Complete the Log Book information
Picker’s Name. The name of the person doing the subsampling and picking should be printed legibly. Date Subsampled and Picked. The date of subsampling and picking should be recorded in MM/DD/YY
format. Site Name. The name of the site as it is written on the sample jar. WBID # The waterbody identification number on the sample jar. Site Date. The date the sample was collected. Site Time. Record the site time in military format on the sample container. The “site
time” is when initial activities began at the site.
Sample Type. Type of sample “Woody”, “Vegetation”, or “Riffle”
13. Fill Out Macroinvertebrate Picking Data Sheet.Complete the Macroinvertebrate Picking Data Sheet (see SOP Appendix: Data Sheets) as described below:
SITE / SUBSAMPLING INFORMATION Picking Date. The date of subsampling and picking should be recorded in MM/DD/YY format. Site Name. The name of the site as it is written on the sample jar.

Macroinvertebrate Status: Active
Date: 07/13/2006Page 141 of 238
WBID #. The waterbody identification number on the sample jar Picker. The name of the person subsampling / picking. Site Date. The date the sample was collected. COC #. Lab Log #. Site Time. Record the site time in military format. The “site time” is when initial activities began at the site. Sample Type. Type of sample “Woody”, “Vegetation”, or “Riffle” Sample Description. Exclusive of invertebrates, estimate the composition of the sample according to the
following list: silt and clay, sand, fine gravel (<2mm), coarse gravel (>2mm), woody debris (twigs, bark, roots, etc.), whole leaves, rotted pieces of leaves, filamentous algae, and unidentifiable organic material. Record the percentage of each type.
Proportion Picked. Record the fraction of the sample that was placed into the tray for sampling –e.g. 1/2, 1/4, or 1/8 of the original mason jar sample. This is important because the density calculations depend on this number.
Square # / # Organisms. List the number of the square that was picked on the lab notebook along with the number of organisms that were picked from that square.
Total Number of Organisms. Record the sum total of organisms from all squares picked. This number is not used in the calculation of the IBI scores, but provides an estimate of the total number of organisms.
INFORMATION TO INCLUDE SAMPLE NOTEBOOK PAGESubsampling Date 11/18/99
Site Date 07/16/99Stream Name Griever Creek
Site Time 13:30Legal Description & County E 9 T22N R15W, Major County
WBID # OK620920-01-0130gCOC # COC# 1772
Sampling Type Riffle kick
Sample Description 40%fine gravel 10% film. algae 30% well rotted leaves
10% whole leaves
5% woody debris
5% coarse gravel
Amount of Sample Picked ¼ of the original sample was prepared for picking
Squares Picked Square # 1 12 3 23 28 10# of animals found in each square # picked 15 27 10 18 8 24
Subsampler’s name John Hassell
14. Randomly Select Squares. Using some method to generate a series of random numbers (random number generator or number table), select at least 6 squares. The random number generators found on most pocket calculators or the Excel spreadsheet function will give a series of three digit numbers—usually >0 but <1. For OCC purpose, use only the last two numbers. Starting with the first random number generated, record all numbers between 01 and 28 until there are 6. These numbers represent the numbered squares to pick. Picking must follow the order in which the number were generated.
15. Confine the Organisms to the Selected Square. Place rectangles or squares constructed of clear plastic or other material that are the same or greater height as the water in each square. This will keep the organisms from drifting out of the squares during the picking process. If a large piece of detritus (leaves, roots, algae masses) crosses the boundary of two or more squares, it may be sliced along the edge of the square so it is contained with the boundary of the selected square.
If there are any organisms that cross square boundaries, do not cut them. Place them in the square in which their head is already lying.

Macroinvertebrate Status: Active
Date: 07/13/2006Page 142 of 238
16. Pick All the Invertebrates Out of the First Square Selected. Locate and collect all the organisms in the selected square. Keep track of the number of non-blackfly organisms picked. Place the organisms picked in a scintillation vial that is filled up to the neck with 70-100% ethanol. If any large organisms (that are too big to fit in the vial with the other organisms) are picked such as crayfish or hellgrammites, place them in a separate vial. If there is some question if something is an organism or if it is a Simulid (blackfly), place it in the vial but DO NOT COUNT it as part of the total. Pickers should be trained to identify blackfly larval forms—if the picker cannot identify blackflies, they should not be subsampling without further training.
When all of the organisms are picked out of the square, record the number of non-blackflies that were picked from that square under the number of that square in the lab book. See example page listed above.
17. Continue to Pick Squares Until 100 Organisms Have Been Collected. Using the random number list, continue to select squares until 100 (non-blackfly) animals have been collected. Once a square has been started, all of the animals must be collected from that square. A subsample will typically have 100-130 organisms / vial. If there are more than 130, the sample was not properly subdivided. If the sample has more than 150 organisms in it, it must be mixed back in with the rest of the “unpicked sample” and re-picked. If the finished invertebrate sample has less than 100 organisms in it and there is unpicked sample available, add all of the picked sample (debris and invertebrates) back to the unpicked sample portion and begin the process again with the full sample . The ONLY time that it is acceptable to have a sample with less than 100 organisms is when the entire mason jar of material has been picked. All other samples containing less than 100 invertebrates will be rejected as data with bad QA/QC.
18. Label the Vial(s). Using a pencil and a fine point permanent ink marker, label the vial. The top and side of the vial should both be labeled.
The vial should be labeled IN PENCIL with the following information: Stream name WBID # Site date Site time Legal location and County Type of sample (riffle, woody, vegetation) Number of vials for this sample (e.g. 1 of x, where x = total number vials for one site (mason jar))
The cap should be labeled IN PERMANENT INK with the following information: Stream name WBID # Site date Time Type of collection Number of vials for this sample
Scintillation Vial Scintillation Vial Cap
Griever CreekMajor County
E9 T22N R15W
Riffle
1 of 2
J Hassell
07/16/99
07/16/99Griever Creek620920010130g
13:30
Riffle1 of 2
620920010130g13:30

Macroinvertebrate Status: Active
Date: 07/13/2006Page 143 of 238
Figure 1: Example label for bug picking sample.
19. Place Clear Tape Over the Label. To protect the pencil-written label from wear, place clear tape (scotch tape) over the writing.
20. Transfer Picked Samples to the Taxonomist. Once macroinvertebrate samples have been picked and placed in a properly labeled scintillation vials, the vials and the original COC will be transferred to the laboratory for taxonomic identification. At this point, a copy of the COC should be forwarded to the DataManager with the signature of the taxonomist. The original COC will be returned to the Data Manager by the taxonomist or laboratory custodian.
21. Archive Remaining Sample. The remainder of the field collected macroinvertebrate samples (un-picked) should be delivered to Brooks Tramell or designee for archive purposes. The COC number should be conspicuously labeled on the end of the box.
1.13 TroubleshootingConsult with the Environmental Monitoring Coordinator
1.14 Data Acquisition, Calculation & Data ReductionNot applicable
1.15 Computer Hardware & SoftwareNot applicable
1.16 Data Management & Records Management
1.16.1 Field NotationA duplicate sample should be collected and noted on the Sampling Episode Sheet (see SOP Appendix: Data Sheets). All measurements and observations made at each site should be recorded on the Site Collection Sheet (see SOP Appendix: Data Sheets). Data should be recorded following procedures outlined in the Procedure for Completing Field Data Sheets SOP.
1.16.2 Habitat FormRegardless of the habitat sampled, a Macroinvertebrate Habitat Assessment Sheet (see SOP Appendix: Data Sheets) must be filled out at each collection site.
The following bullets describe how to fill out the Macroinvertebrate Habitat Sheet:
DATA SHEET HEADER INFORMATION: SITE NAME: Record the stream name from the USGS 7-1/2' map name. If a county map, soil
map, or other map has a different name, the USGS 7-1/2' map takes precedence. If a stream is unnamed on the USGS map, but named on another map, use that name, but write the name of the map in parentheses beside the stream name.
WBID #: Record the Water Body Identification number. LEAD INVESTIGATOR: Record the name of the person responsible for data custody and reporting DATE: Record the site date in MM/DD/YR format TIME: Record the site time in military format. The “site time” is when initial activities
began at the site. The site time should be the same on all forms associated with this site.
The form is broken into three columns, one for each habitat type (riffle, streamside vegetation and woody debris). Fill out the appropriate information for each habitat type collected. If one or two of the three sample types are not collected, write "not collected" above the habitat type.
RIFFLE % of SAMPLE COLLECTED Usually all of the sample collected will fit in a one quart mason jar (3/4 full). If
the sample will not fit, even after removing leaves, rocks, and sticks, without

Macroinvertebrate Status: Active
Date: 07/13/2006Page 144 of 238
overfilling the jar, mix the sample until all the components (algae, leaves, twigs, rocks, sand, etc.) appear to be uniformly mixed and discard enough of it so that the remainder will fit without over packing the jar. Write down the % of sample you estimate that you have placed in the jar
UNIT of EFFORT: Refers to the area of riffle sampled. Three 1 M2 samples should be collected. Record the area sampled.
CPOM in SAMPLE: “Coarse Particulate Organic Matter” Refers to the % of sample composed of partially or well rotted plant material not counting the substrate being sampled. This should mostly be composed of leaf material. Do not count freshly fallen leaves that have not started to rot. Circle the appropriate number.
1. Absent 0%2. Sparse > 0% but < 5%3. Moderate 5% to 25%4. Abundant > 25%
EMBEDDEDNESS: This quantifies the amount of silt, clay and sand that has been DEPOSITED IN RIFFLES. If there is no fine material surrounding the cobble and gravel of riffles, and there is at least some free space under the rocks, that is 0 percent embedded. If the free space under the rocks is filled but the sides are untouched, count that as 5 percent embedded. As the level of fines rises up the cobble sides, estimate the percentage of the total height of the cobbles that is covered. This is the embeddedness estimate. You can often see this line quite distinctly if you lift the rocks out of the water.
SUBSTRATE TYPE & %: This is an approximate classification of the riffle substrate where the collection is being made. Estimate the proportion each type comprises of the entire substrate. The total of all substrate components should add up to 100%.
1. Silt & Clay Refers to loose particles < 0.05 mm. 1. Sand Refers to particles 0.1 to 2 mm is size.2. Gravel Refers to particles 2 to 50 mm is size.3. Cobble Refers to particles 50 to 250 mm is size.4. Boulder Refers to particles >250 mm is size.5. Bedrock Refers to rock that is attached to the earth's crust. If a rock can be moved by any
means, it is not bedrock.6. Hard Pan Clay Refers to a smooth (relatively) surface of clayey material, firm to hard, that is
moderately resistant to erosion, and provides stable habitat.
SUBSTRATE ROUGHNESS: Refers to the roughness of the rocks in the riffle. If you can easily assign the riffle to one of these categories by a visual estimate of the roughness no scraping is necessary. If you are not sure, pick up a typical rock and scrape it with a pocketknife. Circle the appropriate number.
1. Low >75% of the visible periphyton is removed when scraped with a pocketknife or spatula.
2. Moderate 25 to 75% of the visible periphyton is removed when scraped with a pocketknife or spatula.
3. High <25% of the visible periphyton is removed when scraped with a pocketknife or spatula.
VELOCITY TYPICAL MAX: This is an estimate of the average velocity of the habitat sampled in the fastest part of the stream. In a riffle this would be the thalweg. This velocity can be estimated using a floating object and a watch. Circle the appropriate number.
1. Low (0.2-0.5 FPS; 0.061-0.15 MPS) FTS = feet/second; MPS = meters/second2. Moderate (0.5-1 FPS; 0.152-0.305 MPS)3. High (>1 FPS; 0.305 MPS)

Macroinvertebrate Status: Active
Date: 07/13/2006Page 145 of 238
PERIPHYTON (Non-CLADOPHORA): Refers to the aerial percent of the substrate sampled which is covered withall algae other than Cladophora. Circle the appropriate number.
1. Sparse When rocks, bedrock, limbs, trash, etc., are free of attached algae or have only a thin film of greenish or brownish algae that cannot be measured by holding a ruler perpendicular to the surface of the submerged object.
2. Moderate When the submerged surfaces have a slight fuzzy or blanketed appearance. The thickness of the attached algae does not exceed 5mm.
3. Abundant Submerged surfaces have a definite fuzzy or blanketed (covered with gelatinous mat) appearance. The thickness of attached growth exceeds 5mm.
CLADOPHORA: Refers to the aerial percent of the substrate sampled which is covered with Cladophora. Circle the appropriate number.
1. Absent 0%2. Sparse > 0% but < 5%3. Moderate 5% to 25%4. Abundant > 25%
AQUATIC MOSS: Refers to the aerial percent of the substrate sampled which is covered with aquatic moss. Circle the appropriate number.
1. Absent 0%2. Sparse > 0% but < 5%3. Moderate 5% to 25%4. Abundant > 25%
STREAMSIDE VEGETATION % of SAMPLE COLLECTED Usually all of the sample collected will fit in a one quart mason jar. If the sample
will not fit, even after removing leaves and sticks, without overfilling the jar, mix the sample until all the components (algae, leaves, twigs, rocks, sand, etc.) appear to be uniformly mixed and discard enough of it so that the remainder will fit without over packing the jar. Write down the % of the total sample that is placed in the jar
UNIT of EFFORT: Refers to the amount of time the vegetation was agitated. The collection should proceed for 3 minutes. Record the actual time of collection in minutes.
CPOM in SAMPLE: “Coarse Particulate Organic Matter” Refers to the % of sample composed of partially or well rotted plant material not counting the substrate being sampled. This should mostly be composed of leaf material. Do not count freshly fallen leaves that have not started to rot. Circle the appropriate number.
1. Absent 0%2. Sparse > 0% but < 5%3. Moderate 5% to 25%4. Abundant > 25%
PRESENCE: Refers to the amount of suitable streamside vegetation or woody debris habitat present in the stream. Circle the appropriate number.
1. Occasional Indicates that you must walk more than 50 meters to get a good 3-minute sample.2. Common Indicates that you must walk 10 to 50 meters to get your sample.3. Abundant Indicates that a good sample can be collected in less than 10 meters of stream.
TYPE: Refers to the type of streamside vegetation sampled. Circle all thatmakes up at least ¼ of the total habitat sampled.
1. Grass-like Leaves Leaves of aquatic or semi aquatic grasses & sedges which have been hanging in the water long enough to develop a periphyton and/or slime coat.
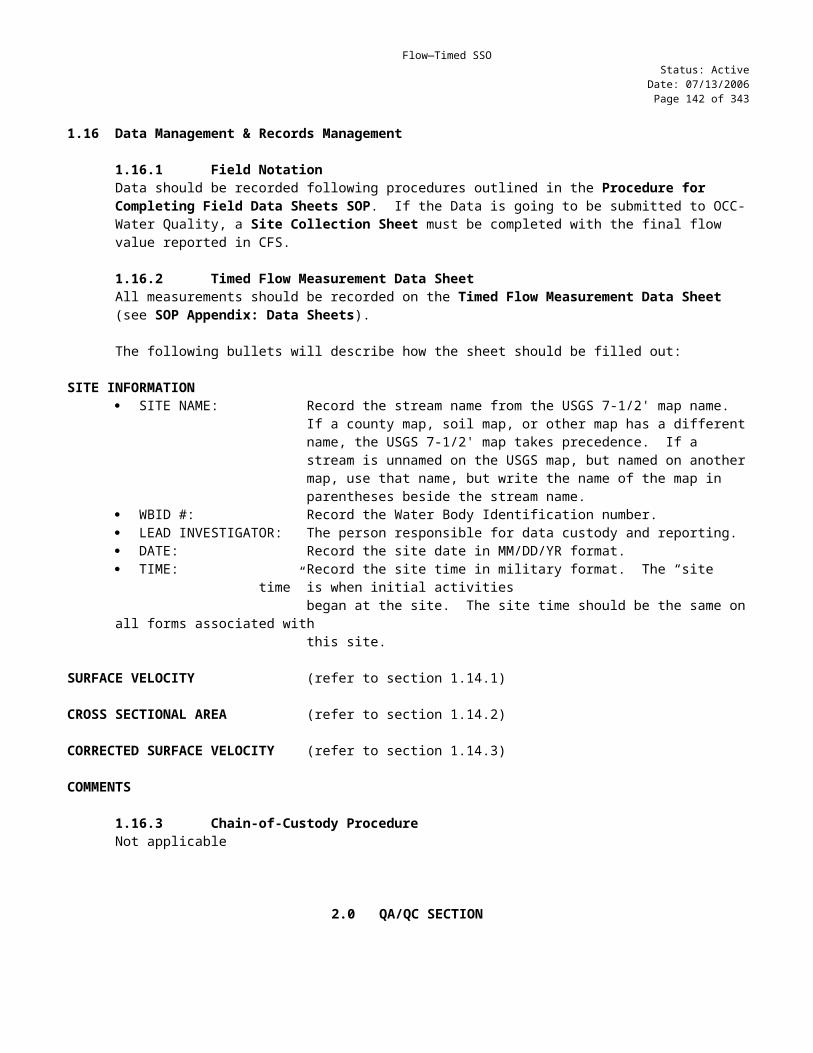
Macroinvertebrate Status: Active
Date: 07/13/2006Page 146 of 238
2. Fine Roots Root masses where most of the roots are <2 mm in diameter.3. Coarse Roots Root masses where most of the roots are >2 mm but <6 mm in diameter.4. Ludwigia Stems Stream macrophyte, known as water willow—not suitable habitat.
VELOCITY TYPICAL MAX: This is an estimate of the average velocity of the habitat sampled in the fastest part of the stream. For streamside vegetation it would be on the outside (streamside)edge of the rootmass. This velocity can be estimated using a floating object and a watch.
1. Low 0.2 to 0.5 ft/sec2. Medium 0.5 to 1.0 ft/sec3. High >1.0 ft/sec.
PERIPHYTON (Non-CLADOPHORA): Refers to the aerial percent of the substrate sampled which is covered withall algae other than Cladophora. Circle the appropriate number.
1. Sparse When rocks, bedrock, limbs, trash, etc., are free of attached algae or have only a thin film of greenish or brownish algae that cannot be measured by holding a ruler perpendicular to the surface of the submerged object.
2. Moderate When the submerged surfaces have a slight fuzzy or blanketed appearance. The thickness of the attached algae does not exceed 5mm.
3. Abundant Submerged surfaces have a definite fuzzy or blanketed (covered with gelatinous mat) appearance. The thickness of attached growth exceeds 5mm.
CLADOPHORA: Refers to the aerial percent of the substrate sampled which is covered with Cladophora. Circle the appropriate number.
1. Absent 0%2. Sparse > 0% but < 5%3. Moderate 5% to 25%4. Abundant > 25%
WOODY DEBRIS % of SAMPLE COLLECTED Usually all of the sample collected will fit in a one quart mason jar. If the sample
will not fit, even after removing leaves and sticks, without overfilling the jar, mix the sample until all the components (algae, leaves, twigs, rocks, sand, etc.) appear to be uniformly mixed and discard enough of it so that the remainder will fit without over packing the jar. Write down the % of sample you estimate that you have placed in the jar
UNIT of EFFORT: Refers to the amount of time the vegetation was agitated. The collection should proceed for 3 minutes. Record the actual time of collection in minutes.
CPOM in SAMPLE: “Coarse Particulate Organic Matter” Refers to the % of sample composed of partially or well rotted plant material not counting the substrate being sampled. This should mostly be composed of leaf material. Do not count freshly fallen leaves that have not started to rot. Circle the appropriate number.
1. Absent 0%2. Sparse > 0% but < 5%3. Moderate 5% to 25%4. Abundant > 25%
PRESENCE: Refers to the amount of suitable streamside vegetation or woody debris habitat present in the stream. Circle the appropriate number.
1. Occasional Indicates that you must walk more than 50 meters to get a good 3-minute sample.2. Common Indicates that you must walk 10 to 50 meters to get your sample.3. Abundant Indicates that a good sample can be collected in less than 10 meters of stream.

Macroinvertebrate Status: Active
Date: 07/13/2006Page 147 of 238
SIZE: Refers to the average diameter of the woody debris sampled. Check all lines where that size class makes up at least 1/4 of the habitat sampled.
1. Small 0.6 to 2.0 cm2. Medium 2.0 to 7.5 cm3. Large >7.5 cm
STATE OF DECAY: Refers to the state of decay of the woody debris sampled. Circle all that apply where debris of this type makes up at least ¼ of the habitat sampled. All of these categories may or may not have bark on them. These categories are determined by firmly pressing your thumbnail into the wood (not bark) of the debris sampled perpendicular to the grain. The depth of the indentation, if any, that remains when your thumbnail is removed is measured to determine the state of decay.
1. Low Indentation is 0 to 0.5 mm deep2. Moderate Indentation is 0.5 to 2 mm deep3. High Indentation is > 2 mm deep
VELOCITY TYPICAL MAX: This is an estimate of the average velocity of the habitat sampled in the fastest part of the stream. For woody debris, it would be the average velocity of the water passing over the sides of the wood. This velocity can be estimated using a floating object and a watch.
1. Low 0.2 to 0.5 ft/sec2. Medium 0.5 to 1.0 ft/sec3. High >1.0 ft/sec.
PERIPHYTON (Non-CLADOPHORA): Refers to the aerial percent of the substrate sampled which is covered withall algae other than Cladophora. Circle the appropriate number.
1. Sparse When rocks, bedrock, limbs, trash, etc., are free of attached algae or have only a thin film of greenish or brownish algae that cannot be measured by holding a ruler perpendicular to the surface of the submerged object.
2. Moderate When the submerged surfaces have a slight fuzzy or blanketed appearance. The thickness of the attached algae does not exceed 5mm.
3. Abundant Submerged surfaces have a definite fuzzy or blanketed (covered with gelatinous mat) appearance. The thickness of attached growth exceeds 5mm.
CLADOPHORA: Refers to the aerial percent of the substrate sampled which is covered with Cladophora. Circle the appropriate number.
1. Absent 0%2. Sparse > 0% but < 5%3. Moderate 5% to 25%4. Abundant > 25%
COMMENTS Record any useful information that provides insight to the sample collection process, conditions, or miscellaneous information. Circle Y if comments are written on the back of the form.
1.16.3 Chain of Custody ProcedureCollection of inorganic sample requires the use of a Chain of Custody form (COC). The handling of COC should follow the procedures described in the Chain of Custody and Sample Labeling SOP. The manifest is routed as follows:
1. Macroinvertebrate samples are collected in the field and the COC is completed and signed by the field personnel involved with collection.
2. Samples are submitted to the Macroinvertebrate Sample Custodian. That person signs the COC and forwards a copy to Data Manager or logs the information on the web page.
3. Samples are assigned to subsampling/picking personnel for processing. They must sign the COC. 4. Processed samples are sent to the taxonomist for identification. The taxonomist must sign the COC. The
person who sends the samples to the taxonomist, forwards a copy of the COC to the Data Manager.

Macroinvertebrate Status: Active
Date: 07/13/2006Page 148 of 238
5. After identification, the taxonomic identification sheets will be forwarded with the signed COC to the Data Manager. The laboratory will include the laboratory tracking or log numbers used to reference the identification sheet.
2.0 QA/QC SECTION
2.1 TrainingTraining of field personnel will be done through dry run exercises in the laboratory to familiarize them with instrument operation, calibration and maintenance. All operators are required to become familiar with the SOP documents. Prior to solo sample collection, subsampling or picking, personnel are evaluated in for proper use of equipment and sample collection protocol. Annual audits are performed on sample collectors following procedures outlined in the Quality Management Plan.
2.2 MaintenanceNot applicable
2.3 QC ProceduresA set of field QA samples will be collected for every sampling episode or one set per 10 sampling sites (10%). The QA samples will include at a minimum a Field Replicate. Spatial replicates should be obtained by implementing the aforementioned sampling procedures upstream of the sampling site being careful to sample with equal effort a similar composition of habitat to the original sampling site. If required by the QAPP, Field Splits will be collected. Subsampling and picking QA/QC is the responsibility of the contracted facility. The OCC will evaluate QA/QC procedures through blind checks and spot inspections.
3.0 REFERENCES
APHA, AWWA, and WPCF (1995) Standard Methods for the Examination of Water and Wastewater, 19th edition, eds. L.S. Clesceri, A.E. Greenberg, and R.R. Trussell, American Public Health Association, Washington, D.C.
Butler, D., (1999) Personal Communication, Senior Biologist, Oklahoma Conservation Commission, Oklahoma City, OK.

Macroinvertebrate Status: Active
Date: 07/13/2006Page 149 of 238
4.0 APPENDIX A
STANDARD OPERATING PROCEDUREField Summary
Summary of MethodA modified version of EPA Rapid Bioassessment Protocol (RBPs) was adopted for macroinvertebrate collections. As stated above, the collection methods are geared toward assessing communities that require or prefer flowing water. Lotic communities require a substrate of some type to attach to. The most common substrates encountered are rocky riffles, streamside vegetation, and woody debris. All three substrates can be sampled (when available) to provide an accurate representation of the various communities in the stream. A combination of collection techniques is used for each habitat. Organisms collected from these habitats are subsampled and sent to a professional macroinvertebrate taxonomist and enumerated to genus level, when possible.
Definitions Riffle: Any sudden downward change in the level of the streambed such that the surface of the
water becomes disrupted by small waves. A riffle substrate must be composed of gravel, or cobble from 1" to 12" in the longest dimension; substrates of bedrock or tight clay are not considered suitable.
Streamside Vegetation: Any streamside vegetation which offers fine structure for invertebrates to dwell within or upon that receives suitable flow. Most habitat is located along undercut banks where fine roots of riparian vegetation are hanging in the water.
Woody Debris: Any dead wood with or without bark located in the stream with suitable current flowing over it.
Summer Index Period: July 1 to September 15. Winter Index Period: January 1 to March 15
Health and Safety Warnings Proper precautions should be taken when handling 100% ethanol.
Cautions In no case should the mason jar be filled more than 3/4 full of loose sample. There should always be enough room in the jar to have at least 5 cm (~2 inch) of free ethanol over the sample. Collections must be done in flowing water Stream stage must not be greater than 3 cm (~1 inch) above base flow during collection.
Collection of Benthic Macroinvertebrates from Rocky Riffles
Suitable Substrate - A riffle is defined as any sudden downward change in the level of the streambed such that the surface of the water becomes disrupted by small waves. For this collection method the substrate of the riffle must be composed of gravel, or cobble from 1" to 12" in the longest dimension. Riffles with substrates of bedrock or tight clay are not suitable.
Where to Sample the Riffle - Three 1 m2 areas of the riffle must be sampled. They can be square, rectangular or trapezoidal so long as each area equals 1 m2 in area. One should be in the fastest part of the riffle where the largest rocks and the smallest amount of interstitial sediment will generally be found. The second should be in the slowest part of the riffle, often near the edge of the stream where the smallest rocks and the greatest amount of interstitial sediment will be found. The third sample should be in an area intermediate between the first two
Method of Collecting the Sample - Support a 1 m2 kick net composed of a double layer of fiberglass window screen or a net of number 30 mesh in such a way that any organisms dislodged from the substrate will be carried into it by the current. The bottom of the net should be tight against the bottom of the stream and the current must be sufficient to insure that dense organisms such as small mollusks will be carried into the net from the sampling area. There is no definite cutoff for stream velocity in the sampling area, but if possible, riffles with average velocities of 1 foot/second or greater are preferred and should be chosen if possible.
Macroinvertebrate Status: Active
Date: 07/13/2006Page 150 of 238
By kicking the substrate, vigorously agitate the substrate of a 1 m2 area of the bed of the riffle immediately upstream of the riffle until all rocks and sediment to a depth of at least five inches have been thoroughly scraped against each other. Organisms living between and upon the rocks will have been dislodged and carried into the net by the current. Any rocks too large to kick should be brushed by hand on all surfaces. This can be done using your hands or with the aid of a brush. If a brush is used, you must be very careful to clean it after each site to prevent contamination of the next sample with invertebrates from the previous site. Continue agitation and brushing until it can be seen that the area being sampled is producing no new detritus, organisms, or fine sediment.
At this point, rinse leaves, sticks and other large debris caught in the net in the current in a manner such that organisms on them are carried into the net. When the volume of the sample is reduced so that three 1 m2 samples will loosely fill a 1 quart mason jar three fourths (3/4) full or less, remove all of the material from the net and place it in the mason jar. In no case should the mason jar be filled more than 3/4 full of loose sample. Add 100% ethanol to the jar until the sample is covered and there is free ethanol on top of the sample. There should always be enough room in the jar to have at least 2 inches (5 cm) of free ethanol over the sample.
Label the sample appropriately following the instructions presented in section 1.11 Sample Handling & Preservation.
Collection of Macroinvertebrates from Streamside Vegetation
Suitable Substrate - Any streamside vegetation in current that offers fine structure for invertebrates to dwell within or upon is suitable. The vegetation being sampled must be in the current so that it offers suitable habitat for organisms which collect drifting particles or which need flowing water for other reasons. This habitat will often be found along the undercut banks of runs and bends where the fine roots of grasses, sedges, and trees, such as willow and sycamore, hang in the water.
Method of Collecting the Sample - This type of sample should be collected with a dip net made of #30 size mesh material. The net should be placed around or immediately downstream of the vegetation being sampled. The organisms can be dislodged from the roots either by vigorously shaking the net around the roots or by shaking the roots by hand while the roots are inside the net.
Where and How Long to Sample - Sampling should continue for 3 minutes of actual root shaking. Do not count the time that elapses between sampling areas. Be careful to only sample roots in current. Usually, only one or two sides of a given rootmass are in current. Be careful not to sample the backside of a rootmass that is in still water.
At this point, rinse leaves, sticks and other large debris caught in the net so that organisms are not lost. When the volume of the sample is reduced so that it will loosely fill a 1-quart mason jar three fourths (3/4) full or less, remove all of the material from the net and place it in the mason jar. In no case should the mason jar be filled more than 3/4 full of loose sample. Add 100% ethanol to the jar until the sample is covered and there is free ethanol on top of the sample. There should always be enough room in the jar to have at least 2 inches (5 cm) of free ethanol over the sample.
Label the sample appropriately following the instructions presented in section 1.11 Sample Handling & Preservation.
Collection of Macroinvertebrates from Woody Debris
Suitable Substrate - Any dead wood with or without bark in the stream is suitable as long as it is in current fast enough to offer suitable habitat for organisms which collect drifting particles or which need flowing water for other reasons. The final sample should consist of organisms collected from an even mixture of wood of all sizes and in all stages of decay.
Method of Collecting the Sample - This type of sample should be collected with a dip net made of #30 size mesh material. The net should be placed around or immediately downstream of the debris being sampled. The organisms can be dislodged from the debris either by vigorously shaking the net around the woody debris or by shaking the debris by hand while the debris is inside the net. Large logs that are too big to shake should be brushed or rubbed vigorously by hand while the net is held immediately downstream.
Where and How Long to Sample - Sample for total of 5 minutes counting only the time that debris is actually being agitated. Include as many types of debris in the sample as possible. These types often include wood that is very rotten and

Macroinvertebrate Status: Active
Date: 07/13/2006Page 151 of 238
spongy with or without bark, wood that is fairly solid which has loose and rotten bark, wood that is solid with firmly attached bark and any combination of these states. They should range in size from 1/4" to about 8" in diameter.
After sampling, rinse leaves, sticks and other large debris caught in the net so that organisms are not lost. When the volume of the sample is reduced so that it will loosely fill a 1-quart mason jar three fourths (3/4) full or less, remove all of the material from the net and place it in the mason jar. In no case should the mason jar be filled more than 3/4 full of loose sample. Add 100% ethanol to the jar until the sample is covered and there is free ethanol on top of the sample. There should always be enough room in the jar to have at least 2 inches (5 cm) of free ethanol over the sample.
Label the sample appropriately following the instructions presented in section 1.11 Sample Handling & Preservation.
Sample Handling & Preservation
1. Pack the Mason Jar Properly. In no case should the mason jar be filled more than 3/4 full of loose sample. Add 100% ethanol to the jar until the sample is covered and there is free ethanol on top of the sample. There should always be enough room in the jar to have at least 2 inches (5 cm) of free ethanol over the sample.
2. Label the Sample. The mason jar should be labeled on the lid using a fine tip permanent ink marker (Sharpie) as described below. In addition, a small sheet of paper (approx 2" x 2") should be filled out with the same information written in pencil and placed in the jar.
Jar Lid & Sample InsertSite Date
Stream NameWaterbody ID #
Site TimeLegal Description
CountyType of sample (riffle, woody, vegetation)
Sampler’s Initials
3. Complete the Chain of Custody. Follow the instructions in the Chain of Custody and Sample Labeling SOP. A new COC should be completed for each collection episode. Each substrate collection (riffle, woody, vegetation) should occupy a separate line on the COC. There should be only one box of samples per COC, i.e., one box, one COC.
4. Transfer samples to the Macroinvertebrate Sample Custodian. Correctly labeled macroinvertebrate samples, along with a Chain of Custody form, should be transferred to the Macroinvertebrate Sample Custodian (Brooks Tramell) for subsampling. The box should be conspicuously labeled with Chain of Custody number. Once the samples have been received and the Chain of Custody signed, the field sampler should make a photocopy of the Chain of Custody form for their records.
5. A duplicate sample should be collected and noted on the Sampling Episode Sheet (see SOP Appendix: Data Sheets). All measurements and observations made at each site should be recorded on the Site Collection Sheet and on the Macroinvertebrate Habitat Sheet.
Instructions for filling out the Macroinvertebrate Habitat Sheet
DATA SHEET HEADER INFORMATION: SITE NAME: Record the stream named from the USGS 7-1/2' map name. If a county
map, soil map, or other map has a different name, the USGS 7-1/2' map takes precedence. If a stream is unnamed on the USGS map, but named on another map, use that name, but write the name of the map in parentheses beside the stream name.
WBID #: Record the Water Body Identification number. LEAD INVESTIGATOR: Record the name of the person responsible for data custody and reporting

Macroinvertebrate Status: Active
Date: 07/13/2006Page 152 of 238
DATE: Record the site data in MM/DD/YR format TIME: Record the site time in military format. The “site time” is when initial
activities began at the site. The site time should be the same on all formsassociated with this site.
The form is broken into three columns, one for each habitat type (riffle, streamside vegetation and woody debris). Fill out the appropriate information for each habitat type collected. If one or two of the three sample types are not collected, write "not collected" above the habitat type.
RIFFLE % of SAMPLE COLLECTED Usually all of the sample collected will fit in a one quart mason jar (3/4 full). If
the sample will not fit, even after removing leaves, rocks, and sticks, without overfilling the jar, mix the sample until all the components (algae, leaves, twigs, rocks, sand, etc.) appear to be uniformly mixed and discard enough of it so that the remainder will fit without over packing the jar. Write down the % of sample you estimate that you have placed in the jar
UNIT of EFFORT: Refers to the area of riffle sampled. Three 1 M2 samples should be collected. Record the area sampled.
CPOM in SAMPLE: “Coarse Particulate Organic Matter” Refers to the % of sample composed of partially or well rotted plant material not counting the substrate being sampled. This should mostly be composed of leaf material. Do not count freshly fallen leaves that have not started to rot. Circle the appropriate number.
1. Absent 0%2. Sparse > 0% but < 5%3. Moderate 5% to 25%4. Abundant > 25%
EMBEDDEDNESS: This quantifies the amount of silt, clay and sand that has been DEPOSITED IN RIFFLES. If there is no fine material surrounding the cobble and gravel of riffles, and there is at least some free space under the rocks, that is 0 percent embedded. If the free space under the rocks is filled but the sides are untouched, count that as 5 percent embedded. As the level of fines rises up the cobble sides, estimate the percentage of the total height of the cobbles that is covered. This is the embeddedness estimate. You can often see this line quite distinctly if you lift the rocks out of the water.
SUBSTRATE TYPE & %: This is an approximate classification of the riffle substrate where the collection is being made. Estimate the proportion each type comprises of the entire substrate. The total of all substrate components should add up to 100%.
1. Silt & Clay Refers to loose particles < 0.05 mm. 2. Sand Refers to particles 0.1 to 2 mm is size.3. Gravel Refers to particles 2 to 50 mm is size.4. Cobble Refers to particles 50 to 250 mm is size.5. Boulder Refers to particles >250 mm is size.6. Bedrock Refers to rock that is attached to the earth's crust. If a rock can be moved
by any means, it is not bedrock.7. Hard Pan Clay Refers to a smooth (relatively) surface of clayey material, firm to hard,
that is moderately resistant to erosion, and provides stable habitat.
SUBSTRATE ROUGHNESS: Refers to the roughness of the rocks in the riffle. If you can easily assign the riffle to one of these categories by a visual estimate of the roughness no scraping is necessary. If you are not sure, pick up a typical rock and scrape it with a pocketknife. Circle the appropriate number.
1. Low >75% of the visible periphyton is removed when scraped with a pocketknife or

Macroinvertebrate Status: Active
Date: 07/13/2006Page 153 of 238
spatula.2. Moderate 25 to 75% of the visible periphyton is removed when scraped with a pocketknife
or spatula.3. High <25% of the visible periphyton is removed when scraped with a pocketknife or
spatula.
VELOCITY TYPICAL MAX: This is an estimate of the average velocity of the habitat sampled in the fastest part of the stream. In a riffle this would be the thalweg. This velocity can be estimated using a floating object and a watch. Circle the appropriate number.
1. Low (0.2-0.5 FPS; 0.061-0.15 MPS) FTS = feet/second; MPS = meters/second2. Moderate (0.5-1 FPS; 0.152-0.305 MPS)3. High (>1 FPS; 0.305 MPS)
PERIPHYTON (Non-CLADOPHORA): Refers to the aerial percent of the substrate sampled which is covered withall algae other than Cladophora. Circle the appropriate number.
1. Sparse When rocks, bedrock, limbs, trash, etc., are free of attached algae or have only a thin film of greenish or brownish algae that cannot be measured by holding a ruler perpendicular to the surface of the submerged object.
2. Moderate When the submerged surfaces have a slight fuzzy or blanketed appearance. The thickness of the attached algae does not exceed 5mm.
3. Abundant Submerged surfaces have a definite fuzzy or blanketed (covered with gelatinous mat) appearance. The thickness of attached growth exceeds 5mm.
CLADOPHORA: Refers to the aerial percent of the substrate sampled which is covered with Cladophora. Circle the appropriate number.
1. Absent 0%2. Sparse > 0% but < 5%3. Moderate 5% to 25%4. Abundant > 25%
AQUATIC MOSS: Refers to the aerial percent of the substrate sampled which is covered with aquatic moss. Circle the appropriate number.
1. Absent 0%2. Sparse > 0% but < 5%3. Moderate 5% to 25%4. Abundant > 25%
STREAMSIDE VEGETATION % of SAMPLE COLLECTED Usually all of the sample collected will fit in a one quart mason jar. If the sample
will not fit, even after removing leaves and sticks, without overfilling the jar, mix the sample until all the components (algae, leaves, twigs, rocks, sand, etc.) appear to be uniformly mixed and discard enough of it so that the remainder will fit without over packing the jar. Write down the % of the total sample that is placed in the jar
UNIT of EFFORT: Refers to the amount of time the vegetation was agitated. The collection should proceed for 3 minutes. Record the actual time of collection in minutes.
CPOM in SAMPLE: “Coarse Particulate Organic Matter” Refers to the % of sample composed of partially or well rotted plant material not counting the substrate being sampled. This should mostly be composed of leaf material. Do not count freshly fallen leaves that have not started to rot. Circle the appropriate number.
1. Absent 0%2. Sparse > 0% but < 5%3. Moderate 5% to 25%4. Abundant > 25%

Macroinvertebrate Status: Active
Date: 07/13/2006Page 154 of 238
PRESENCE: Refers to the amount of suitable streamside vegetation or woody debris habitat present in the stream. Circle the appropriate number.
1. Occasional Indicates that you must walk more than 50 meters to get a good 3-minute sample.2. Common Indicates that you must walk 10 to 50 meters to get your sample.3. Abundant Indicates that a good sample can be collected in less than 10 meters of stream.
TYPE: Refers to the type of streamside vegetation sampled. Circle all that makes up at least ¼ of the total habitat sampled.
1. Grass-like Leaves Leaves of aquatic or semi aquatic grasses & sedges which have been hanging in the water long enough to develop a periphyton and/or slime coat.
2. Fine Roots Root masses where most of the roots are <2 mm in diameter.3. Coarse Roots Root masses where most of the roots are >2 mm but <6 mm in diameter.4. Ludwigia Stems Stream macrophyte, known as water willow—not suitable habitat.
VELOCITY TYPICAL MAX: This is an estimate of the average velocity of the habitat sampled in the fastest part of the stream. For streamside vegetation it would be on the outside (streamside) edge of the rootmass. This velocity can be estimated using a floating object and a watch.
1. Low 0.2 to 0.5 ft/sec2. Medium 0.5 to 1.0 ft/sec3. High >1.0 ft/sec.
PERIPHYTON (Non-CLADOPHORA): Refers to the aerial percent of the substrate sampled which is covered withall algae other than Cladophora. Circle the appropriate number.
1. Sparse When rocks, bedrock, limbs, trash, etc., are free of attached algae or have only a thin film of greenish or brownish algae that cannot be measured by holding a ruler perpendicular to the surface of the submerged object.
2. Moderate When the submerged surfaces have a slight fuzzy or blanketed appearance. The thickness of the attached algae does not exceed 5mm.
3. Abundant Submerged surfaces have a definite fuzzy or blanketed (covered with gelatinous mat) appearance. The thickness of attached growth exceeds 5mm.
CLADOPHORA: Refers to the aerial percent of the substrate sampled which is covered with Cladophora. Circle the appropriate number.
1. Absent 0%2. Sparse > 0% but < 5%3. Moderate 5% to 25%4. Abundant > 25%
WOODY DEBRIS % of SAMPLE COLLECTED Usually all of the sample collected will fit in a one quart mason jar. If the sample
will not fit, even after removing leaves and sticks, without overfilling the jar, mix the sample until all the components (algae, leaves, twigs, rocks, sand, etc.) appear to be uniformly mixed and discard enough of it so that the remainder will fit without over packing the jar. Write down the % of sample you estimate that you have placed in the jar
UNIT of EFFORT: Refers to the amount of time the vegetation was agitated. The collection should proceed for 3 minutes. Record the actual time of collection in minutes.
CPOM in SAMPLE: “Coarse Particulate Organic Matter” Refers to the % of sample composed of partially or well rotted plant material not counting the substrate being sampled. This should mostly be composed of leaf material. Do not count freshly fallen leaves that have not started to rot. Circle the appropriate number.
1. Absent 0%2. Sparse > 0% but < 5%

Macroinvertebrate Status: Active
Date: 07/13/2006Page 155 of 238
3. Moderate 5% to 25%4. Abundant > 25%
PRESENCE: Refers to the amount of suitable streamside vegetation or woody debris habitat present in the stream. Circle the appropriate number.
1. Occasional Indicates that you must walk more than 50 meters to get a good 3-minute sample.2. Common Indicates that you must walk 10 to 50 meters to get your sample.3. Abundant Indicates that a good sample can be collected in less than 10 meters of stream.
SIZE: Refers to the average diameter of the woody debris sampled. Check all lines where that size class makes up at least 1/4 of the habitat sampled.
1. Small 0.6 to 2.0 cm2. Medium 2.0 to 7.5 cm3. Large >7.5 cm
STATE OF DECAY: Refers to the state of decay of the woody debris sampled. Circle all that apply where debris of this type makes up at least ¼ of the habitat sampled. All of these categories may or may not have bark on them. These categories are determined by firmly pressing your thumbnail into the wood (not bark) of the debris sampled perpendicular to the grain. The depth of the indentation, if any, that remains when your thumbnail is removed is measured to determine the state of decay.
1. Low Indentation is 0 to 0.5 mm deep2. Moderate Indentation is 0.5 to 2 mm deep3. High Indentation is > 2 mm deep
VELOCITY TYPICAL MAX: This is an estimate of the average velocity of the habitat sampled in the fastest part of the stream. For woody debris, it would be the average velocity of the water passing over the sides of the wood. This velocity can be estimated using a floating object and a watch.
1. Low 0.2 to 0.5 ft/sec2. Medium 0.5 to 1.0 ft/sec3. High >1.0 ft/sec.
PERIPHYTON (Non-CLADOPHORA): Refers to the aerial percent of the substrate sampled which is covered withall algae other than Cladophora. Circle the appropriate number.
1. Sparse When rocks, bedrock, limbs, trash, etc., are free of attached algae or have only a thin film of greenish or brownish algae that cannot be measured by holding a ruler perpendicular to the surface of the submerged object.
2. Moderate When the submerged surfaces have a slight fuzzy or blanketed appearance. The thickness of the attached algae does not exceed 5mm.
3. Abundant Submerged surfaces have a definite fuzzy or blanketed (covered with gelatinous mat) appearance. The thickness of attached growth exceeds 5mm.
CLADOPHORA: Refers to the aerial percent of the substrate sampled which is covered with Cladophora. Circle the appropriate number.
1. Absent 0%2. Sparse > 0% but < 5%3. Moderate 5% to 25%4. Abundant > 25%
COMMENTS Record any useful information that provides insight to the sample collection process, conditions, or miscellaneous information. Circle Y if comments are written on the back of the form.
Macroinvertebrate Status: Active
Date: 07/13/2006Page 156 of 238
4.0 APPENDIX B
STANDARD OPERATING PROCEDURESubsampling and Picking Summary
Subsampling and Picking of Macroinvertebrates from field Collected SamplesThe waterbody assessment procedure utilized by OCC requires that a random sample of macroinvertebrates be collected, identified and enumerated, from the portion of the waterbody being assessed. In order to make this test cost effective it is not possible to identify more than about 150 organisms from each site. This procedure describes the procedure used to subsample a field-collected sample, which may contain 200-10,000 organisms.
1. Obtain the Field Sample to be Subsampled. The field collected macroinvertebrate samples and the original Chani of Custody will be transferred to the individual(s) designated to complete the macroinvertebrate subsampling and picking. At this time a copy of the Chain of Custody (signed by the subsampling designee) will be sent to the Data Manager.
The sample will come from the field in 1-quart mason jars preserved with 100% ethanol. Mason jar lids have a sealing compound that is not particularly resilient. Care must be taken so that the lids are not damaged when they are opened or resealed. If a lid is damaged it must be replaced with a new one. Keep a fresh supply of lids handy in case this happens. If you use a new lid, label it exactly the same as the one that was originally used.
Samples will be subsampled/picked in the order assigned on the Chain of Custody form.
2. Decant Ethanol. Without shaking or disturbing the contents, pour the liquid from the sample through a sieve made of #30 or finer screen. Save the ethanol to preserve the unused portion of the sample.
3. Rinse Sample. At this point, any silt, clay or fine sand in the sample should be GENTLY rinsed out of the sample. Be careful not to break off any of the delicate appendages that are used for identification of the animals. The sample will be easier to process if any large pieces of leaf, bark, stones, etc, are washed carefully and discarded.
4. Prepare Sample for Picking. Spread the selected portion out in a rectangular tray/pan that is divided into 28 sections of equal area. The size and shape of the divisions are not important so long as they are all equal in size. A pan with a white background may facilitate the collection since there will be a contrast between organism and the pan.
A clear glass pan or baking dish can be effectively used by creating a grid system on the bottom of the pan using a permanent marker. Each square should be numbered (1-28), and a sheet of white paper can be glued or taped over the outside bottom of the pan. If very many samples will be subsampled it will be worth your time to construct a divider for the tray similar in construction to an ice cube tray divider. This will not only demarcate the subsampling squares, but it will also prevent animals from drifting from one square to another during subsampling.
5. Remove Large Pieces of Detritus and Sediment. Large leaves and big pieces of wood and bark should be removed. Be VERY CAREFUL to pick all macroinvertebrates off of them before discarding. At this point, the material remaining in the dish should consist of a mixture of sand, fine gravel, small organic detritus, pieces of leaves < 1-2 cm wide, fine roots, algae and macroinvertebrates.
6. Spread Sample Out. All detritus and sediment should be as uniformly distributed over the bottom of the dish as possible.
7. Visually Estimate Invertebrate Density of the Sample. Determine if the sample must be subdivided. The decision will be based on two requirements: (1) individual squares MUST have AT LEAST 3 animals in them (providing the entire sample has at least 100 animals total), and (2) each square can have absolutely NO MORE THAN 25 animals. Simulid (blackfly) larvae are not to be counted as individuals for this purpose. That is, the density estimate should be independent of any blackfly larvae present. The goal is to have roughly 10 TO 20 ANIMALS PER SQUARE. This is a compromise between the statistical ideal of very few organisms per square and ease of subsampling where the entire sample is picked from one square. If you estimate that there are less than 200 animals in the entire sample, you should process the entire sample.

Macroinvertebrate Status: Active
Date: 07/13/2006Page 157 of 238
The purpose of this estimate is to make the sample statistically valid. Fewer than 80 animals does not provide a good representation of the population to draw conclusions from, and more than 130 animals biases the sample making it appear that that stream has more taxa, that it really does. Correctly estimating densities is something that can only be done with experience, do not become discouraged.
8. Subdivide the Sample. If each square is estimated to have more than 25 animals, it is important to grossly subdivide the sample prior to picking. For instance, divide the sample in half or quarters depending on the animal density. Ideally 10 to 20 animals per square is desirable.
For dividing in fourths, cut the sample into top and bottom halves and then into right and left halves. After dividing the sample, the four portions should appear as equal as possible in terms of the amount of detritus and sediment present. Choose one quarter by random means. For instance, flip a coin to select either the top half or the bottom half, and then flipping the coin again to select either the right or left side of the first half selected. If the sample is not too dense, that is the selected quarter has a density of 10 to 20 animals per square, then no additional subdivision is necessary. If the number of invertebrates is still too dense, divide the remaining portion in half and select one half by flipping the coin again. Continue dividing the sample until the density appears to fall in the correct range.
9. Return the Unselected Portion(s) to the Mason Jar. Return the unselected portion(s) of the sample to the original mason jar and add the reserved alcohol. Be very careful to remove the entire portion of unselected subsample. A proportionately high density of small macroinvertebrates can remain hidden in the sediment and detritus. .
10. Fill the Tray About 1 to 2 cm Deep With Water. Add enough tap water to fill the tray to a depth of 1–2 cm (~0.5 to 0.75 inches). The water aids in the subsampling process. The organisms and individual pieces of detritus do not clump together as when they are dry. If the water is run into the tray very slowly, the remaining leaves and large pieces of detritus can be rinsed and discarded.
11. Distribute the Sample Evenly. Make sure that all materials in the tray are evenly distributed, especially the gravel and leaves. If a divider is to be used, place it in the tray now. Once the sample has been distributed, do not move the pan. Jostling can cause the organisms to move outside of their designated square. This could lead to a sampling bias.
12. Fill Out the Laboratory Notebook. o Stream Information. Record the date of subsampling, the site date and time, stream name, waterbody
identification number (WBID #), legal description, Chain of Custody form number (COC#), and sample type (woody, vegetation, riffle).
o Estimate the Composition of the Sample. Exclusive of invertebrates, estimate the composition of the sample according to the following list: silt and clay, sand, fine gravel (<2mm), course gravel (>2mm), woody debris (twigs, bark, roots, etc.), whole leaves, rotted pieces of leaves, filamentous algae, and unidentifiable organic material. Record the percentage of each fraction.
o Record the Fraction of the Sample That Was Picked. Record the fraction of the sample that was placed into the tray for sampling –e.g. 1/2, 1/4, or 1/8 of the original mason jar sample. This is important because the density calculations depend on this number.
o List Each of the Squares That Was Picked. List the number of the square that was picked on the lab notebook along with the number of organisms that were picked from that square.

Macroinvertebrate Status: Active
Date: 07/13/2006Page 158 of 238
INFORMATION TO INCLUDE SAMPLE NOTEBOOK PAGESubsampling Date 11/18/99
Site Date 07/16/99Stream Name Griever Creek
Site Time 13:10Legal Description & County E 9 T22N R15W, Major County
WBID # OK620920-01-0130gCOC # COC# 1772
Sampling Type Riffle kick
Sample Description 40%fine gravel 10% film. algae 30% well rotted leaves
10% whole leaves
5% woody debris
5% coarse gravel
Amount of Sample Picked ¼ of the original sample was prepared for picking
Squares Picked Square # 1 12 3 23 28 10# of animals found in each square # picked 15 27 10 18 8 24
Subsampler’s name John Hassell
13. Randomly Select 6 Squares. Using some method to generate a series of random numbers (random number generator or number table), select at least 6. The random number generators found on most pocket calculators or the Excel spreadsheet function will give a series of three digit numbers—usually >0 but <1. For OCC purpose, use only the last two numbers. Starting with the first random number generated, record all numbers between 01 and 28 until there are 6. These numbers represent the numbered squares to pick. Picking must follow the order in which the number were generated.
14. Confine the Organisms to the Selected Square. Place rectangles or squares constructed of clear plastic or other material that are the same or greater height as the water in each square. This will keep the organisms from drifting out of the squares during the picking process. If a large piece of detritus (leaves, roots, algae masses) crosses the boundary of two or more squares, it may be sliced along the edge of the square so it is contained with the boundary of the selected square.
If there are any organisms that cross square boundaries, do not cut them. Place them in the square in which their head is already lying.
15. Pick All the Invertebrates Out of the First Square Selected. Locate and collect all the organisms in the selected square. Keep track of the number of non-blackfly organisms picked. Place the organisms picked in a scintillation vial that is filled up to the neck with 70-100% ethanol. If any large organisms (that are too big to fit in the vial with the other organisms) are picked such as crayfish or hellgrammites, place them in a separate vial. If there is some question if something is an organism or if it is a Simulid (blackfly), place it in the vial but DO NOT COUNT it as part of the total. Pickers should be trained to identify blackfly larval forms—if the picker cannot identify blackflies, they should not be subsampling without further training.
When all of the organisms are picked out of the square, record the number of non-blackflies that were picked from that square under the number of that square in the lab book. See example page listed above.
16. Continue to Pick Squares Until 100 Organisms Have Been Collected. Using the random number list, continue to select squares until 100 (non-blackfly) animals have been collected. Once a square has been started, all of the animals must be collected from that square. A subsample will typically have 100-130 organisms / vial. If there are more than this, the sample was not properly subdivided. If the sample has more than 150 organisms in it, it must be mixed back in with the rest of the “unpicked sample” and re-picked. If the finished invertebrate sample has less than 80 organisms

Macroinvertebrate Status: Active
Date: 07/13/2006Page 159 of 238
in it and there is unpicked sample available, another tray full of sample must be picked. The ONLY time that it is acceptable to have a sample with less than 100 organisms is when the entire mason jar of material has been picked. All other samples containing less than 100 invertebrates will be rejected as data with bad QA/QC.
17. Label the Vial(s). Using a pencil and a fine point permanent ink marker label the vial. The top and side of the vial should both be labeled.
The vial should be labeled in pencil with the following information:o Stream nameo WBID #o Legal location and Countyo Site Timeo Site Date o Type of sampleo Number of vials for this sample (e.g. 1 of x, where x = total number vials for one site (mason jar))
The cap should be labeled in permanent ink with the following information:o Stream nameo Site timeo WBID #o Sitte Date o Type of collectiono Number of vials for this sample
Scintillation Vial Scintillation Vial CapFigure 1: Example label for bug picking sample.
18. Place Clear Tape Over the Label. To protect the label from the ethanol, place clear tape (scotch tape) over the writing (pencil).
19. Transfer Picked Samples to the Taxonomist. Once macroinvertebrate samples have been picked and placed in a properly labeled scintillation vials, the vials and the original Chain of Custody form will be transferred to the laboratory for taxonomic identification. The original Chain of Custody form should be returned to the Data Manager with the signature of the taxonomist or laboratory custodian.
20. Archive Remaining Sample. The remainder of the field collected macroinvertebrate samples (un-picked) should be delivered to Brooks Tramell for archive purposes. The Chain of Custody form number should be conspicuously labeled on the outside of the box.
Griever CreekMajor County
E9 T22N R15W
Riffle
1 of 2
J Hassell
07/16/99
07/16/99Griever Creek620920010130g
13:10
Riffle1 of 2
620920010130g13:10

PeriphytometersStatus: Inactive
Date: 07/13/2006Page 160 of 238
OKLAHOMA CONSERVATION COMMISSIONWATER QUALITY DIVISION
STANDARD OPERATING PROCEDURE
PERIPHYTOMETERS AND PROCESSING FORCHLOROPHYLL-a MEASUREMENT

PeriphytometersStatus: Inactive
Date: 07/13/2006Page 161 of 238
1.0 PROCEDURAL SECTION
1.1 Scope and Application22
Microorganisms growing on stones, woody debris, aquatic macrophytes, and other submerged surfaces often result from water pollution and are collectively termed periphyton. Periphyton refers to a group of organisms, which include the zoogleal and filamentous bacteria, attached protozoa, rotifers, and algae, and the free-living microorganisms that swim, creep, or lodge among the attached forms. Periphyton is a useful evaluation measurement because the abundance and composition of the periphyton community at a given location is related to the water quality at that point. The periphyton itself is often the undesired component of a stream; the pollutant is the cause.
1.2 Summary of MethodThe use of periphyton in assessing water quality is hindered by the lack of suitable natural habitat occupying proper conditions with a known history. To compensate for these limitations, an artificial substrate (2.5 inch glass rods) is deployed with a known area, known light exposure, known current exposure, and for a set period of time. The periphyton that grows on the substrate is collected and quantified using a chlorophyll-a and phaeophyton evaluation processes. Chlorophyll-a concentration is directly related to the amount of periphyton. Higher periphyton growth rate equates to higher stream productivity. High productivity can be an indication of excessive nutrient levels.
1.2.1 Definitions Periphyton: refers to a group of organisms, which include the zoogleal and filamentous bacteria,
attached protozoa, rotifers, and algae, and the free-living microorganisms that swim, creep, or lodge among the attached forms.
1.3 Health and Safety Warnings Proper laboratory procedures should be followed during the processing of periphyton samples. Goggles should be worn
when the tissue grinder is used and when the glass rod are being cut. Processing should occur in a well-ventilated area due to acetone fumes.
Safety glasses and gloves should be worn when snapping glass rods during periphytometer construction
1.4 CautionsNone
1.5 Interference Macroinvertebrate infestations and grazing may occur which will bias the results. Stonerollers (when present) must be excluded because of their ability to graze periphyton. Intervening rains may cause flooding or changes in stage, which will bias the collection. Drifting clumps of algae may become lodged on periphytometer. Shading may be caused by drifting debris.
1.6 Personnel QualificationField personnel must be trained and evaluated on the use of equipment prior to collecting samples or data. Use of the equipment is subject to approval by the QA Officer and/or the Environmental Monitoring Coordinator. Training will be done through dry run exercises in the laboratory and field to familiarize field personnel with operation/collection, calibration and maintenance. Investigators must be familiar with the SOP document and owner’s manual, when applicable.
1.7 Apparatus & Materials
1.7.1 Materials needed for manufacture of periphytometers: 8 mm diameter solid glass rod soft iron wire 15 gauge, 18 gauge, and 22 gauge glue suitable to bind wire to glass underwater for >2 weeks (liphatic epoxy resin) abrasive wheel: 60-100 grit assorted wire cutters and pliers for bending wire caliper to measure tenths of millimeters files to nick glass rod for breaking
22 Text taken directly or in part from Standard Methods (APHA, AWWA, WPCF, 1992).

PeriphytometersStatus: Inactive
Date: 07/13/2006Page 162 of 238
board with pre-drilled holes to hold 8 mm glass rod in a vertical position with one end exposed.
1.7.2 Materials needed for sample collection and sample preparation: ice 100 mL Whirl Paks 47 mm Whatman G F/C filters or equivalent a Millipore type filtering apparatus 100 mL graduated cylinder 1000 mL graduated cylinder filter forceps stainless steel spatula tissue grinder MgCO3 buffered 9 to 1 acetone water as per Standard Methods/with squeeze bottle 1 quart (1 L) HDPE bottle wire cutters monofilament fishing line or other thin, sturdy line 16 x 125 mm screw cap test tubes
1.8 Instrument/Method CalibrationNot applicable
1.9 Equipment Operation & Preparation
1.9.1 Manufacture of Periphytometers1. Refer to Figure 1 for a visual description of periphytometer.2. Using a file to etch the glass, break the rod into 2½" (63.5 mm) pieces. The break should be clean and
straight across the rod. Wear gloves and safety glasses during this process to prevent injury. If a long (>2 mm) flake of glass comes off one side of the rod, reject the entire rod.
3. Using light pressure, grind one end of the rod using the abrasive wheel so that the end is approximately flat and the entire surface is roughened.
4. Repeat steps 1 and 2 until you have sufficient rods. Ten rods will be deployed at each sampling site. 5. Bend the 18 gauge soft iron wire into loops or eyes such that they will stand up by themselves. Manufacture
as many loops as you have rods.6. Place the rods in the wooden holder with the roughened side up and glue the loops to the rods so an eyelet is
formed.7. After the glue has dried, clean up any that has run down the sides of the rods.8. Bend the 15 gauge wire into "T" shaped forms that have a loop on all ends. The two ends of the "T" should
be about 7 to 9 cm apart and the leg of the T can be any length from 1 to 7 cm.9. Using the 22 gauge wire attach a rod to each end of the "T" by forming a loop about 1½ cm long. The
periphytometer is now complete.
1.9.2 Placement of Periphytometers In Stream
1.9.2a Requirements of Stream Site1. No shading from trees or bushes on bank.2. A pool that lies immediately below a riffle. The pool should not be stagnant (water should be entering
and leaving pool) but should be calm (flow should be less than 0.1 ft/sec.). 3. The pool should be so deep that the periphytometer does not touch the bottom of the pool.4. Weather conditions such that there have been no high flow events for the 2 days preceding incubation and
during the 2 weeks of periphytometer incubation. All periphytometers should be placed so that they will remain at a uniform depth for the two-week incubation period. In order to insure this, do not place periphytometers in a stream that is above the normal base flow level. There will usually be some sort of line demarcating the zone at the air/water interface where mosses and semi-aquatic algae grow. A periphyton line near the bank is a useful indicator. If the line is submerged more than 2 cm, the stream is above base flow conditions—do not deploy.

PeriphytometersStatus: Inactive
Date: 07/13/2006Page 163 of 238
1.9.2b Placement of Periphytometers1. Using monofilament fishing line, suspend 10 periphytometers at each site. Locate a pool immediately below
a riffle so that the top of the glass rod lies between 2 to 5 cm below the water surface. Check to see that the line suspending the periphytometer is not more than slightly deflected from vertical by any current, or measure flow to be sure it is <0.1 ft/sec. The periphytometer should be in very slow flowing (not stagnant) water and should not be in an eddy.
2. The periphytometer should be suspended from something that will not shade it. Things such as wires or fences across streams and dead tree branches lying in the stream usually make a suitable support. If nothing like this can be found, the periphytometer can be suspended from a section of dead branch that is floating in the water and anchored to the shore or something upstream. It should be tied in such a manner that it cannot drift into a shady or fast flowing area of the stream and it should be 1 inch or less in diameter so as not to shade the periphytometer.
3. During a group of deployments select one set of periphytometers to split and use as a duplicate. The set of periphytometers selected should have 8 or more acceptable rods for processing. Randomly divide the rods in half. One half will represent the sample the other will be used as a duplicate.
4. Complete the applicable portion of the Periphyton Sheet along with the Episode and Site Collection Field Data Sheets. On the Periphyton Sheet be sure to include a detailed description of the deployment site so that someone unfamiliar with the area could retrieve the samplers. This should include the name of the road with the nearest bridge, the property owner’s name (if known), direction and distance from the nearest bridge, any permanent physical landmarks that could be used as icons. The Episode, Site Collection, and Periphyton Sheets will be filled out more completely when the periphytometers are collected.
1.10 Sample Collection (Retrieval of Periphytometers)1. After 14 days collect the periphytometers.2. Record site information. Fill-in the appropriate information on the Sampling Episode, Site Collection, and
Periphyton Sheets. Be sure to include: the time and date of retrieval, and physical chemical data (DO, pH, Conductivity, Alkalinity, and temperature).
3. Collect 1 quart (~1 L) of stream water in a clean HDPE plastic container. This sample is used to measure chlorophyll in the water column.
4. Label 4 oz (115 mL) Whirl Paks with indelible ink (Sharpie or Bic pen) before collecting periphytometers (while they are still dry). The label should include a waterbody ID number, a site name, site date and time, and name of sampler.
5. Very gently, so as not to dislodge any loosely attached periphyton, lift the periphytometers out of the water in order to inspect for amount of growth and grazing.
6. Determine if the periphytometer is suitable for analysis. Each rod is treated as a separate sample.Selection criteria for periphytometers
a) The periphytometers should be completely immersed in water between 2 - 5 cm below surface;b) Floating debris (plastic bags, leaves, etc.) should not cover any part of the periphytometer;c) The periphytometers should not have been subjected to a high flow event. This is defined as a rise
in the water level of two feet or more for more than 24 hours;d) The periphytometers should not have >10% of the surface area scraped clean by any means. This
includes grazing and physical abrasion; ande) Select the periphytometers with the most uniform and the heaviest algal growth.
7. Collect as many as 5 periphytometers, but if fewer than 5 are acceptable, collect as many as possible. 8. For each usable periphytometer, suspend it over the opening of a Whirl Pak that contains about 25-35 mL of stream
water. If the measurement is critical and the variation between rods warrants it, use reconstituted bioassay water of the appropriate hardness, well water, or non-chlorinated drinking water instead of stream water. Clip the wire that holds the rod onto the hanger device allowing the rod to fall into the Whirl Pak without touching the sides of the bag above the water line.
9. Seal the Whirl Pak, and lay it flat on ice for transport.10. Periphytometers need to be processed within 48 hours.

PeriphytometersStatus: Inactive
Date: 07/13/2006Page 164 of 238
1.11 Sample Handling & Preservation Periphytometers should be transported in Whirl Paks containing about 25-35 mL of stream water or, if required,
reconstituted bioassay water, well water, or non-chlorinated drinking water. Sealed Whirl Paks should be kept flat, in the dark, and on ice.
Extraction procedure should be done in dim light. Extract tubes should be immediately placed in the dark at <-20oC.
1.12 Sample Preparation and Analysis
1.12.1 Processing of Periphytometers1. Open the Whirl-Pak, being careful not to slop water out of the top of the bag.2. Remove the periphyton from the glass by rubbing the sides of the bag against the rod until all visible algae is
removed. There may be a small amount of algae in rough areas on the ends of the rods that does not come off. This is acceptable. If the periphyton is particularly resistant to physical abrasion, a razor blade can be use to scrape the material.
3. Pour the water from the Whirl Pak into a 100 ml graduated cylinder. Use caution not to drop the glass rod into the cylinder.
4. Rinse the inside of the bag with DI or well water into the graduated cylinder.5. Measure the amount of periphyton suspension (periphyton and water) in a graduated cylinder. Record this
information on the Periphyton Sheet as “Total Volume”.6. Pour the suspension into the filtering apparatus fitted with a vacuum pump and Whatman GF/C filter paper.
Prior to filling the filter cup, gently, but thoroughly agitate the suspension so that a representative sample is being filtered. Repeat this process with subsequent pourings.
7. Filter 10 – 15 mL of sample, it is not necessary to filter the entire amount in the graduated cylinder. However, all liquid poured into the filter cup must be filtered because larger chunks of periphyton may settle; thus biasing the sample. If the filter clogs up before the entire amount is filtered, you must start again with a new sample volume. Rinse the sides of the filter cup with DI water. Record the volume that was filtered on the Periphyton Sheet as “Filtered Volume”. Calculate the percent of the sample that was filtered by dividing the Filtered Volume by the Total Volume. (In some cases, it is not good to filter a great deal of the suspension. If there is a lot of chlorophyll on the rods, and it’s all filtered, the absorbance of the final sample will be too high to get a good reading. The final absorbance in the extract solution should be > 0.1 and < 1.0; this is light green to medium green in the extract tube.
8. After filtering, carefully lift off the filter paper containing the periphyton and fold it into quarters with the algae on the inside. Place this into the tissue grinder.
9. Pour 1 mL of acetone solution over the folded filter and macerate it with a small stainless steel spatula, then add 3 more mL using the additional acetone solution to rinse the spatula.
10. Grind the sample until it appears to be completely homogenized. More acetone may be added as necessary to facilitate grinding, but the final volume should be minimized to facilitate the spectrophotometer reading.
11. Pour the acetone solution containing the ground sample into a 16 125 mm screw cap test tube. Use a few more mL of acetone solution to rinse out the tissue grinder into the test tube. Try to keep the total volume of extract solution to 10 mL as this will make measurement of the extract volume easier. Minimizing the extract volume will also concentrate the chlorophyll so that the final absorption will be higher if there was not much algae in the sample.
12. Steep samples in the dark at 4 C for a minimum of two hours. 13. Extracted samples in acetone solution should be frozen (below –20o C) after steeping. Frozen samples can be
stored for up to 6 months at this temperature. It is very important to keep the samples in the dark, as light will rapidly degrade free chlorophyll.
14. Frozen samples can be submitted to an analytical laboratory for analysis.
1.12.2 Processing of Stream SampleThe quart sample of stream water, representing the water column, is treated similarly to the periphytometers. Sample processing and analysis follows the methods described below with the following exceptions.1. Pour the quart sample into a 1000 mL graduate cylinder and record total volume.2. Pour the suspension into the filtering apparatus fitted with a vacuum pump and Whatman GF/C filter paper.
Prior to filling the filter cup, gently, but thoroughly agitate the suspension so that a representative sample is being filtered. Repeat this process with subsequent pourings.

PeriphytometersStatus: Inactive
Date: 07/13/2006Page 165 of 238
3. Filter the entire amount of sample unless it is excessively turbid or loaded with phytoplankton. Record the volume that was filtered on the Periphyton Sheet as “Filtered Volume”.
4. Follow steps 7 – 13 listed above.
1.13 Troubleshooting Consult an experienced staff member or professional.
1.14 Data Acquisition, Calculation & Data ReductionUsing the corrected values (or uncorrected if your machine won’t measure absorption at 750 nm), calculate chlorophyll-a and phaeophyton-a as follows:
Chlorophyll-a, mg/L = 26.7 (664 665) V 1
V2
Phaeophyton-a, mg/L = 26.7 1.7(665) 664] V 1
V2
Where: V1 = volume of extract in mL;V2 = volume of sample in liters;664 = optical density of 90% acetone extract before acidification; and665 = optical density of 90% acetone extract after acidification.
1.15 Computer Hardware & SoftwareNot applicable
1.16 Data Management & Records Management
1.16.1 Field NotationA Sampling Episode Sheet should be filled out for each day or deployment of periphytometers. A Site Collection and Periphyton Sheet (see SOP Appendix: Data Sheets) should also be filled out for each site sampled. For more information, refer to the procedures outlined in the Procedure for Completing Field Data Sheets SOP. A separate Site Collection Sheet will be filled out for the deployment and retrieval visits. Be sure to mark/circle the appropriate activity on the Site Collection Sheet. However, only one Periphyton Sheet will be used for both the deployment and the retrieval visits. This data sheet should be submitted with the rest of the paperwork associated with the retrieval site.
The Periphyton Sheet is divided into Data Sheet Header, Site, Field, and Processing Information sections. Each of these are described below.
DATA SHEET HEADER INFORMATION: SITE NAME: Record the stream name from the USGS 7-1/2' map name. If a county map, soil
map, or other map has a different name, the USGS 7-1/2' map takes precedence. If a stream is unnamed on the USGS map, but named on another map, use that name, but write the name of the map in parentheses beside the stream name.
WBID #: Record the Waterbody Identification Number. LEGAL/COUNTY: Record legal description down to 1/8 section including county of site. INVESTIGATORS: Record all samplers for deployment and retrieval.
SITE INFORMATION: DATE: Record the site date for the deployment and retrieval visits in
MM/DD/YY format. TIME: Record the site time for the deployment and retrieval visits in military format.
The “site time” is when initial activities began at the site.
FIELD INFORMATION:

PeriphytometersStatus: Inactive
Date: 07/13/2006Page 166 of 238
Days since last rain >0.5 in For the deployment and retrieval visits, record the number of days since there was a significant rain (>0.5 inches). Flow is particularly important for accurate periphyton results.
Describe periphyton… For the in situ periphyton, briefly describe the appearance and color. Periphyton condition should not change drastically within the two-week deployment period, but provide a general description from both site visits.
Algal strands > 1.25"? Circle “yes” if there are strands of periphyton greater than 1.25" long or “no” for otherwise.
If yes, where? Describe the location where the strands are observed (pools, riffles, both or other).
PROCESSING INFORMATION: Rod # Designated periphyton rod number or description. Include information about the
stream water column sample. Total Volume Measure the amount of periphyton suspension (periphyton and water) in a
graduated cylinder. Record this information on the Periphyton Sheet as “Total Volume”.
Filtered Volume The amount of periphyton liquid suspension that passed through the filter is the “Filter Volume”.
% Filtered Calculate the percent of the sample that was filtered by dividing the Filtered Volume by the Total Volume.
Water Column
1.16.2 Chain of Custody ProcedureProcessed periphyton samples that are analyzed at a laboratory requires the use of a Chain of Custody form. The handling of COC should follow the procedures described in the Chain of Custody and Sample Labeling SOP.
2.0 QA/QC SECTION
2.1 TrainingTraining of field personnel will be done through dry run exercises in the laboratory to familiarize them with instrument operation, calibration, and maintenance. All operators are required to become familiar with the SOP document and proper procedures. Prior to solo sample collection, field personnel are evaluated in a field setting for proper use of equipment and sample collection protocol. Annual field audits are performed on sample collectors following procedures outlined in the Quality Management Plan.
2.2 Maintenance Clean the grinder thoroughly when finished Periphytometers can be reused. The rods must be thoroughly cleaned to remove any chlorophyll or spores that may
remain on the glass rod and supporting wire. Scrub vigorously and soak in a weak acid solution.
2.3 QC ProceduresThe field personnel are evaluated on an annual basis to critique sampling techniques and to assure proper deployment.
A duplicate set of periphytometers (10 rods) is deployed for every 10 sites evaluated. If less than 10 sites a day are established, a duplicate is deployed at least once during a sampling episode.
3.0 REFERENCES
APHA, AWWA, and WPCF (1992) Standard Methods for the Examination of Water and Wastewater, 17th edition, eds. L.S. Clesceri, A.E. Greenberg, and R.R. Trussell, American Public Health Association, Washington, D.C.

PeriphytometersStatus: Inactive
Date: 07/13/2006Page 167 of 238
4.0 APPENDIX A
STANDARD OPERATING PROCEDUREField Summary
Periphytometers
4.1 Equipment Operation & Preparation 4.1.2 Placement of Periphytometers In Stream
4.1.2a Requirements of Stream Site1. No shading from trees or bushes on bank.2. A pool that lies immediately below a riffle. The pool should not be stagnant (water should be entering and
leaving pool) but should be calm (flow should be less than 0.1 ft/sec.). 3. Pool depth should be at least 4" deep.4. Weather conditions such that there have been no high flow events for the 2 days preceding incubation and
during the 2 weeks of periphytometer incubation. All periphytometers should be placed so that they will remain at a uniform depth for the two-week incubation period. In order to insure this, do not place periphytometers in a stream that is above the normal base flow level. There will usually be some sort of line demarcating the zone at the air/water interface where mosses and semi-aquatic algae grow. If this line is submerged, the stream is above base flow conditions—do not deploy.
4.1.2b Placement of Periphytometers1. Suspend 10 periphytometers at each site. Locate a pool immediately below a riffle so that the top of the
substrate surface lies between 2.5 to 3.5 cm below the water surface. Check to see that the line suspending the periphytometer is not more than slightly deflected from vertical by any current, or measure flow to be sure it is <0.1 ft/sec. The periphytometer should be in very slow flowing (not stagnant) water and should not be in an eddy.
2. The periphytometer should be suspended from something that will not shade it. Things such as wires or fences across streams and dead tree branches lying in the stream usually make a suitable support. If nothing like this can be found, the periphytometer can be suspended from a section of dead branch that is floating in the water and anchored to the shore or something upstream. It should be tied in such a manner that it cannot drift into a shady or fast flowing area of the stream and it should be 1 inch or less in diameter so as not to shade the periphytometer.
3. Remember to perform duplicate measurements every 10 samples. If less than 10 samples a day are collected, one duplicate should be deployed for each day of sampling.
4. Fill-out the applicable portion of the Periphyton Sheet along with the Sampling Episode and Site Collection Sheets. On the Periphyton Sheet be sure in include a detailed description of the deployment site so that someone unfamiliar with the area could retrieve the samplers. This should include the name of the road with the nearest bridge, the property owner’s name (if known), direction and distance from the nearest bridge, any permanent physical landmarks that could be used as icons. The Sampling Episode, Site Collection, and Periphyton Sheets will be filled out more completely when the periphytometers are collected.
4.2 Sample Collection (Retrieval of Periphytometers)1. After 14 days collect the periphytometers.2. Record site information. Fill in the appropriate information on the Sampling Episode, Site Collection, and Periphyton
Sheets. Be sure to include: time and data of retrieval, and physical chemical data (DO, pH, Conductivity, Alkalinity.3. Collect 1 quart (~1 L) of stream water in a clean HDPE plastic container. This sample is used to represent chlorophyll in
the water column. 4. Label 4 oz (115 mL) Whirl Paks with indelible ink (Sharpie pen) before collecting periphytometers (while they are still
dry). The label should include a waterbody ID number, a site name, site date and time, and name of sampler.
PeriphytometersStatus: Inactive
Date: 07/13/2006Page 168 of 238
5. Very gently, so as not to dislodge any loosely attached periphyton, lift the periphytometers out of the water in order to inspect for amount of growth and grazing.
6. Determine if the periphytometer is suitable for analysis. Each rod is treated as a separate sample.Selection criteria for periphytometers
a) The periphytometer should be completely immersed in water between 2 - 5 cm below surface;b) The periphytometer should not be covered by floating debris (plastic bags, leaves, etc.);c) The periphytometer should not have been subjected to a high flow event. This is defined as a rise in
the water level of two feet or more for more than 24 hours;
f) The periphytometer should not have >10% of the surface area scraped clean by any means. This includes grazing and physical abrasion; and
g) Select the periphytometers with the most uniform and the heaviest algal growth.
7. Collect as many as 5 periphytometers, but if fewer than 5 are acceptable, collect as many as possible. 8. For each usable periphytometer, suspend it over the opening of a Whirl Pak that contains about 25-35 mL of stream water.
If the measurement is critical and the variation between rods warrants it, use reconstituted bioassay water of the appropriate hardness, well water, or non-chlorinated drinking water instead of stream water. Clip the wire that holds the rod onto the hanger device allowing it to fall into the Whirl Pak without touching the sides of the bag above the water line.
9. Seal the Whirl Pak, and lay it flat on ice for transport.10. Periphytometers need to be processed within 48 hours, so make sure they are delivered to the OCC office within that time.
4.3 Sample Handling & PreservationPeriphytometers should be transported in Whirl Paks containing about 25-35 mL of stream water or, if required, reconstituted bioassay water, well water, or non-chlorinated drinking water. Sealed Whirl Paks should be kept flat, in the dark, and on ice.
4.4 Sample Preparation and Analysis (Processing of Periphytometers)1. The quart sample of stream water, representing the water column, is treated just as if it was a periphytometer. Sample
processing and analysis follows the methods described below.2. Open the Whirl Pak, being careful not to slop water out of the top of the bag.3. Remove the periphyton from the glass by rubbing the sides of the bag against the rod until all visible algae is removed.
There may be a small amount of algae in rough areas on the ends of the rods that does not come off. This is acceptable. If the periphyton is particularly resistant to physical abrasion, a razor blade can be use to scrape the material.
4. Measure the amount of periphyton suspension (periphyton and water) in a graduated cylinder. Record this information on the Periphyton Sheet as “Total Volume”.
5. Pour the suspension into the filtering apparatus fitted with a vacuum pump and Whatman GF/C filter paper. Prior to filling the filter cup, gently but thoroughly agitate the suspension so that a representative sample is being filtered. Repeat this process with subsequent pourings.
6. Filter until the entire amount in the graduated cylinder has been processed or until the filter becomes completely clogged. Any liquid in the filter cup must be filtered because larger chunks of periphyton may settle, thus biasing the sample. Record the volume that was filtered on the Periphyton Sheet as “Filtered Volume”. If the filter clogs up before the entire amount is filtered, record the unfiltered volume on the Periphyton Sheet as “Remaining Volume”. Calculate the percent of the sample that was filtered by dividing the Filtered Volume by the Total Volume.
7. After filtering, carefully lift off the filter paper containing the periphyton and fold it into quarters with the algae on the inside. Place this into the tissue grinder.
8. Pour 1 mL of acetone solution over the folded filter and macerate it with a small stainless steel spatula, then add 3 more mL using the additional acetone solution to rinse the spatula.
9. Grind the sample until it appears to be completely homogenized.10. Pour the acetone solution containing the ground sample into a 16 125 mm screw cap test tube. Use a few more mL of
acetone solution to rinse out the tissue grinder into the test tube. Try to keep the total volume of extract solution under 10 mL as this will make measurement of the extract volume easier. Minimizing the extract volume will also concentrate the chlorophyll so that the final absorption will be higher if there was a minimal amount of algae in the sample.
11. Steep in the dark at 4 C for a minimum of two hours. 12. Extracted samples in acetone solution should be frozen (-20o C) after steeping. Frozen samples can be stored for up to 6
months at this temperature. It is very important to keep the samples in the dark, as light will rapidly degrade free chlorophyll.
13. Frozen samples can be submitted to an analytical laboratory for analysis, or the steeped extract can follow accepted spectrophotometric analytical methods as outlined below.
PeriphytometersStatus: Inactive
Date: 07/13/2006Page 169 of 238
4.5 Data Management & Records Management
4.5.1 Field and Processing NotationA Sampling Episode Sheet should be completed for each day or deployment of periphytometers. A Site Collection Sheet and Periphyton Sheet should also be completed for each site sampled. The same field data sheets will used after the two week sampling period. For more information, refer to the procedures outlined in the Procedure for Completing Field Data Sheets SOP.
The Periphyton Sheet is divided into Data Sheet Header, Site, Field, and Processing Information sections. Each of these are described below.
DATA SHEET HEADER INFORMATION: SITE NAME: Record the stream name from the USGS 7-1/2' map name. If a county map, soil
map, or other map has a different name, the USGS 7-1/2' map takes precedence. If a stream is unnamed on the USGS map, but named on another map, use that name, but write the name of the map in parentheses beside the stream name.
WBID #: Record the Waterbody Identification Number. LEGAL/COUNTY: Record legal description down to 1/8 section including county of site. INVESTIGATORS: Record all samplers for deployment and retrieval.
SITE INFORMATION: DATE: For the deployment and retrieval visits, record double digit month, day, and year
(MM/DD/YY). TIME: Record the site time for the deployment and retrieval visits in military format.
The “site time” is when initial activities began at the site.FIELD INFORMATION:
Days since last rain >0.5 in For the deployment and retrieval visits, record the number of days since there was a significant rain (>0.5 inches). Flow is particularly important for accurate periphyton results.
Describe periphyton… For the in situ periphyton, briefly describe the appearance and color. Periphyton condition should not change drastically within the two-week deployment period, but provide a general description from both site visits.
Algal strands > 1.25"? Circle “yes” if there are strands of periphyton greater than 1.25" long or “no” for otherwise.
If yes, where? Describe the location where the strands are observed (pools, riffles, both or other).
PROCESSING INFORMATION: # Rods Scraped Record the number of rods scraped for each periphytometer. Total Volume Measure the amount of periphyton suspension (periphyton and water) in a
graduated cylinder. Record this information on the Periphyton Sheet as “Total Volume”.
Filtered Volume The amount of periphyton liquid suspension that passed through the filter is the “Filter Volume”.
% Filtered Calculate the percent of the sample that was filtered by dividing the Filtered Volume by the Total Volume.
Water Column
4.5.2 Chain of Custody ProcedureProcessed periphyton samples that are analyzed at a laboratory requires the use of a Chain of Custody form. The handling of COC should follow the procedures described in the Chain of Custody and Sample Labeling SOP.

pH MeasurementStatus: Active
Date: 07/13/2006Page 170 of 238
OKLAHOMA CONSERVATION COMMISSIONWATER QUALITY DIVISION
STANDARD OPERATING PROCEDURE
pH MEASUREMENT
(YSI MODEL 60)

pH MeasurementStatus: Active
Date: 07/13/2006Page 171 of 238
1.0 PROCEDURAL SECTION
1.1 Scope and Application23
The measure of pH is an expression of the hydrogen-ion concentration in terms of its negative log. At any given temperature the intensity of the acidic or basic character of a solution is indicated by pH. The measurement of pH assumes that the molar concentration of [H+] equals [OH-] in pure water; which serves as the basis of the pH scale (0-14).
1.2 Summary of Method1
Use of the term pH assumes that the activity of the hydrogen ion is being considered. When pH is measured using a probe, the hydrogen activity is being measured, not actually the molar concentration. Activity is measured by potentiometric measurement using a standard hydrogen electrode and a reference electrode. For a more complete discussion of the potentiometric measurement, refer to Standard Method 4500 (APHA et al., 1992).
1.2.1 DefinitionspH = -log [H] where [H] = hydrogen ion concentration (mols/L)
1.3 Health and Safety Warnings Buffer solutions contain chemicals that should be treated with respect. Avoid inhalation, skin contact, eye contact or
ingestion. o Inhalation may cause severe irritation and be harmful. o Skin contact may cause irritation and prolonged or repeated exposure may cause dermatitis. o Eye contact may cause irritation or conjunctivitis. o Ingest may cause nausea, vomiting and diarrhea.
1.4 Cautions2
Do not store the probe dry or in DI water Make sure the automatic temperature compensation probe is working correctly and the temperature sensor is immersed in
the sample/buffer. Allow the sensors time to stabilize with regard to temperature before reading—at least 60 seconds After “long term” storage in pH 4 buffer/KCl solution (probe storage solution), place the pH sensor in pH 7 buffer and
allow to acclimate before calibrating (5 to 10 minutes)
1.5 InterferenceThe use of a standard probe with automatic temperature compensation is relatively free from interference from color, turbidity, oxidants, reductants and/or high salinity. However, at a pH> 10 sodium error may be a concern (APHA et al., 1992).
1.6 Personnel QualificationField personal must be trained and evaluated on the use of equipment prior to collecting samples or data. Use of the equipment is subject to approval by the QA Officer and/or the Environmental Monitoring Coordinator. Training will be done through dry run exercises in the laboratory and field to familiarize field personnel with operation/collection, calibration and maintenance. Investigators must be familiar with the SOP document and owner’s manual, when applicable.
1.7 Apparatus & Materials YSI Model 60
1.8 Instrument Calibration24
Calibration of the meter should occur prior to initial sample collection. Calibration checks should be conducted every four hours to confirm calibration. If the calibration check results in a reading that is greater than 0.05 pH units above the selected standard expected reading, the meter should be re-calibrated. Note, pH readings vary with temperature. Standard buffers are “calibrated” at 25o C; readings taken at different temperatures will vary according to Appendix B. For example, a pH of 7 at 20oC will read 7.02 rather than 7.00 (at 25oC). Take this into consideration when field assessing the accuracy of the unit. A calibration check should consist of a measurement of one or more known standards (buffers). Results of the calibration check should be recorded on the Sampling Episode Sheet.
23 Text taken directly or in part from Standard Methods (APHA, AWA, WPCF, 1992) and Sawyer et al. (1994).24 Text taken directly or in part from YSI Operations Manual (1996).

pH MeasurementStatus: Active
Date: 07/13/2006Page 172 of 238
The meter must be calibrated before making pH measurements. Calibration may be performed at 1, 2, or 3 points. For OCC purposes the meter calibration meter should involve at least a two-point bracket calibration. That is, one buffer is above the expected sample range and one buffer is below. For example, if the expected pH is 6, then the meter should be calibrated using pH 4 and 7 buffers. A 3-point calibration with a pH 10 buffer does not increase the accuracy of this measurement because the sample (pH 6) is not within this higher range. However, a 3-point calibration assures maximum accuracy when the pH of the media to be monitored cannot be anticipated. Therefore, a 3-point calibration is recommended if the anticipated pH values are going to be above and below a pH of 7.
Meter Calibration:
1. Turn the meter on by pressing ON/OFF2. Rinse the probe with DI water.3. If the probe was stored in storage solution, place the probe in pH 7 solution and allow to acclimate before calibrating
(5 to 10 minutes)4. Place 30 to 35 mL of pH buffer in the provided 100 mL graduated cylinder. Make sure the temperature sensor is
immersed.(Note that the first calibration point must be either pH 7 or pH 6.86.)
5. Enter the calibration menu by pressing the up and down arrows at the same time (▲▼). The display will show CAL and STAND at the bottom and 7.00 in the middle.
(Note: the Model 60 automatically accounts for the change in pH observed with changes in temperature; however, the pH values displayed during calibration will vary accordingly. For example, a pH of 7 at 20oC will read 7.02 rather than 7.00 (at 25oC). Refer to the Appendix for a listing of pH values with respect to temperature changes.)
6. Press the ENTER key. The decimal point on 7.00 will start flashing7. When the decimal point stops flashing the reading is stable (no change > 0.01 pH units in 10 seconds). Press and hold
ENTER until SAVE is displayed.8. For the next calibration point, rinse the graduated cylinder with DI water and add 30- 35 mL of pH 4 or 10 buffer
solution.9. Rinse and then immerse the probe into the next buffer solution –make sure the temperature sensor is immersed. Press
the ENTER key. The unit will automatically sense the pH buffer and the value will appear on the screen. For the pH 4 buffer the decimal point to the left will flash (.4.00). For the pH 10 buffer the decimal to the right will flash (10.0.0).
10. When the reading is stable, the decimal point will stop flashing. Press and hold the ENTER key until SAVE appears.11. Repeat steps 8 through 10 for a 3-point calibration or press MODE to return to normal operations
1.9 Equipment Operation & Preparation 2
1. The Model 60 operates on 6 AA-cell batteries. Before going to the field, switch meter on using ON/OFF key and check for battery strength. If display reads "LOW BAT", the batteries must be replaced. Batteries should last approximately 100 hours.
2. If the probe has dehydrated (left outside of the storage solution), soak for 30 minutes in a 50% pH 4 buffer/50% 1.5M KCl solution or the probe storage solution. After calibrating, the probe should be placed in “Probe Transport Chamber” located on the side of the meter. A
round sponge should be place inside the chamber and 6-8 drops of tap water (not DI) should be added. The wet sponge creates a humid environment that prevents the probe from desiccating. The transport chamber is NOT intended for long-term storage.
1.10 Sample Collection1. pH should be measured in the middle of the channel, from a pooled but non-stagnant area. 2. After calibrating, remove the probe from storage chamber and place the probe in the sample/stream. Shake gentle to
remove any trapped air bubbles and wait for the reading to stabilize (~60 seconds). The probe is designed to be completely immersed. Make sure the temperature sensor is submerged.
3. Record value on the field data sheet after it has stabilized (no change >0.01 pH units in 10 seconds). Rinse electrode and place in the storage chamber. Check a known buffer solution close to the expected value to verify calibration. If the reported value is within
±0.05 pH units, rinse and measure sample, otherwise recalibrate. Calibration checks should be conducted at least every 4 hours. Record the result on the appropriate field data sheet.
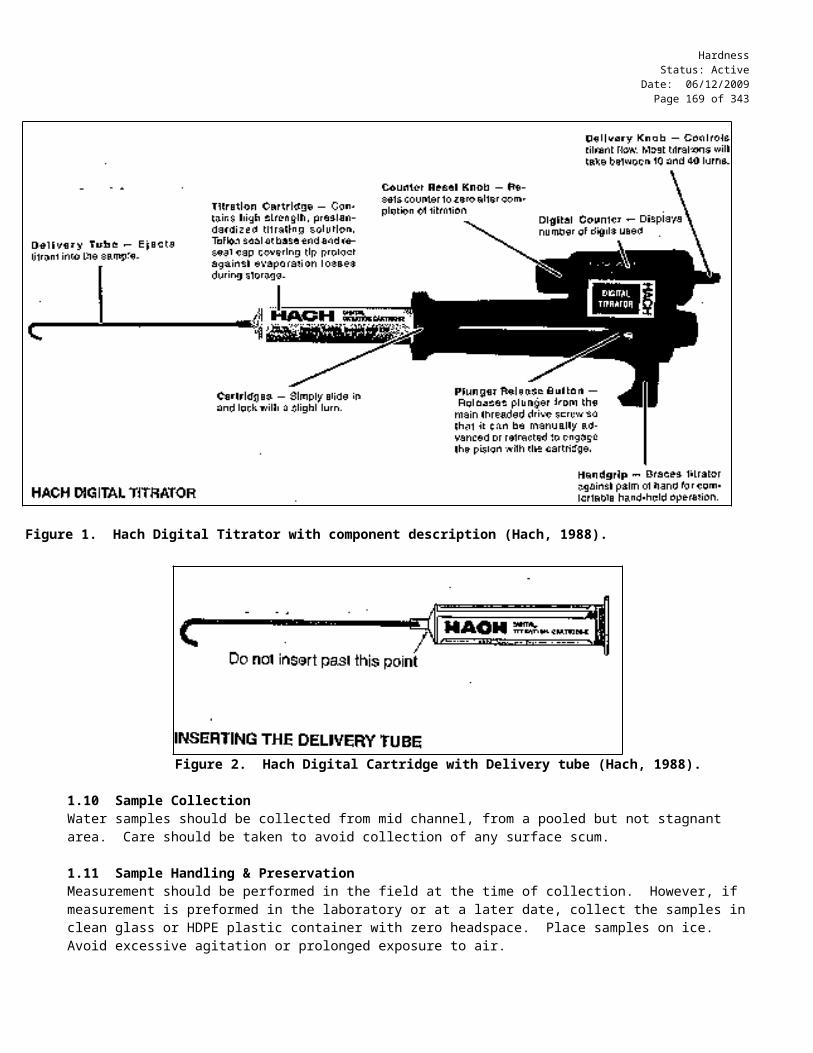
pH MeasurementStatus: Active
Date: 07/13/2006Page 173 of 238
After the final measurement for the day has been made, turn the unit off and return the probe to pH 4/KCl storage solution.
1.11 Sample Handling & PreservationMeasurement should be performed in situ. However, if measurement is preformed in the laboratory, collect samples in clean glass or HDPE plastic container with zero headspace. Place samples on ice.
1.12 Sample Preparation and AnalysisThere is no holding time for pH; it should be measured immediately.
1.13 TroubleshootingSee owner’s manuals for the appropriate meter
1.14 Data Acquisition, Calculation & Data ReductionNot applicable
1.15 Computer Hardware & SoftwareNot applicable
1.16 Data Management & Records Management
1.16.1 Field NotationAll field calibration and calibration checks should be recorded on the Sampling Episode Sheet (see SOP Appendix: Data Sheets). All pH measurements made at each site should be recorded on the Site Collection Sheet (see SOP Appendix: Data Sheets). Data should be recorded following procedures outlined in the Procedure for Completing Field Data Sheets SOP.
1.16.2 Chain of Custody ProcedurepH should be measured in the field; therefore no Chain of Custody form is required. However, if the laboratory is going to measure pH, then follow the procedures described in the Chain of Custody SOP and Sample Labeling SOP.

pH MeasurementStatus: Active
Date: 07/13/2006Page 174 of 238
2.0 QA/QC SECTION
2.1 TrainingTraining of field personnel will be done through dry run exercises in the laboratory to familiarize them with instrument operation, calibration, and maintenance. All operators are required to become familiar with the SOP document and owner’s manual. Prior to solo sample collection, field personnel are evaluated in a field setting for proper use of equipment and sample collection protocol. Annual field audits are performed on sample collectors following procedures outlined in the Quality Management Plan.
2.2 Maintenance The unit is waterproof; however, the unit should not be submerged. Clean outside of unit with a moist cloth For long-term storage (>7 days) the probe should be stored in probe storage solution (pH 5 buffer/KCl solution). This will
prevent probe dehydration— never store in DI water Avoid touching glass bulb. Refer to the owner’s manual for cleaning and recharging electrode procedures.
2.3 QC ProceduresThese meters should be check and calibrated against standards each quarter following procedures as directed by the QA officer at a QA and meter calibration session. Values will be recorded in the equipment logbook.
The collection of QA samples should follow the procedure specified in the Preparation of Spike, Duplicate, and Blank Samples for Routine QA SOP. Results will be recorded in the field notebook.
3.0 REFERENCES
APHA, AWWA, and WPCF (1992) Standard Methods for the Examination of Water and Wastewater, 17th edition, eds. L.S. Clesceri, A.E. Greenberg, and R.R. Trussell, American Public Health Association, Washington, D.C.
YSI (199), “Operations Manual for the pH/Temperature Meter Model 60”, YSI incorporated, Yellow Springs, Ohio.
Sawyer, C.N. P.L. McCarty and G.F. Parkin (1994) Chemistry for Environmental Engineering, 4th edition, McGraw-Hill, Inc, New York, New York.

pH MeasurementStatus: Active
Date: 07/13/2006Page 175 of 238
4.0 APPENDIX A
STANDARD OPERATING PROCEDUREField Summary
pH Measurement
Instrument/Method CalibrationCalibration of the meter should occur prior to initial sample collection. Calibration checks should be conducted prior to additional collections at approximately 4 hour intervals. If the calibration check is greater that 0.05 pH units, the meter should be re-calibrated. A calibration check should consist of a measurement of a known standard (buffer). Select a buffer that is close to the actual field condition. Results of the calibration check should be recorded on the appropriate field data sheet.
Calibration of the meter should involve at least a two-point bracket calibration. That is, one buffer is above the expected sample range and one buffer is below. For example, if the expected pH is 6, then the meter should be calibrated using pH 4 and 7 buffers.
Meter Calibration2
1. Determine if a 2 or 3-point calibration is needed and which buffers are to be used (4, 7, 10).2. Immerse probe in pH 7 buffer. Be sure that the temperature sensor is submerged.3. Press ▲▼ keys simultaneously to enter calibration menu.4. Press ENTER. The pH value of the buffer will be displayed. When the decimal point stops flashing, press ENTER
again.5. Place probe in next solution (4 or 10, order does not matter).6. Press ENTER. The pH of the buffer will be displayed and decimal point will flash.7. When the decimal point stops flashing press and hold ENTER until the display reads SAVE.8. Repeat steps 5-7 for a third buffer if needed.9. At the end of calibration, pres MODE and rinse sensor to begin pH measurements.
Sample Collection1. pH should be measured in the middle of the channel, from a pooled but not stagnant area. 2. After calibrating, remove the probe from storage chamber and place the probe in the sample/stream. Shake gentle to
remove any trapped air bubbles and wait for the reading to stabilize (~60 seconds). The probe is designed to be completely immersed. Make sure the temperature sensor is submerged.
3. Record value on the field data sheet after it has stabilized (no change >0.01 pH units in 10 seconds). 4. Rinse electrode and place in the storage chamber.5. Check a known buffer solution close to the expected value to verify calibration. If the reported value is within ±0.05
pH units, rinse and measure sample, otherwise recalibrate. Calibration checks should be conducted at least every 4 hours. Record the result on the appropriate field data sheet.
6. After the final measurement for the day has been made, turn the unit off and return the probe to pH 4/KCl storage solution.

pH MeasurementStatus: Active
Date: 07/13/2006Page 176 of 238
4.1 APPENDIX B
pH Buffer Values2
The following table is a list of the YSI pH buffer solutions at various temperatures
TEMPERATURE (oC) pH 4 pH 7 pH 100 4.01 7.13 10.345 4.00 7.10 10.2610 4.00 7.07 10.1915 4.00 7.05 10.1220 4.00 7.02 10.0625 4.01 7.00 10.0030 4.01 6.99 9.9435 4.02 6.98 9.9040 4.03 6.97 9.8550 4.06 6.97 9.78

BMP Photodocumentation Status: Active
06/12/2009 Page 177 of 238
OKLAHOMA CONSERVATION COMMISSION
WATER QUALITY DIVISION
STANDARD OPERATING PROCEDURE
PHOTODOCUMENTATION
FOR BEST MANAGEMENT PRACTICES

BMP Photodocumentation Status: Active
06/12/2009 Page 178 of 238
1.0 PROCEDURAL SECTION
1.1 Scope and ApplicationPhotographs provide qualitative and potentially quantitative records of condition at a particular location at a particular moment in time. Photos may enhance a physical description as well as allow documentation of site conditions that might influence water quality, such as an extreme algae bloom, a flood, streambank erosion, or sediment deposition. Potential sources of pollution in a stream, such as cattle in the water or a pipe discharging a substance, can also be recorded. In all of these instances, photos are data and as such need to be carefully collected and archived. However, photographs taken to document unique conditions, events, or phenomena such as those described above do not necessarily need to follow the rigid requirements of repeat photography, which is the focus of this SOP.
The goal of repeat photography is to visually document a constant view as items within that view change (Hall 2001a). Changes tracked by repeat photography can be quite useful in determining the effects of a certain land practice on an area across time. When implementation of best management practices (BMPs) occurs, it is important to use repeat photography to document both 1) the installation of a BMP, and 2) the effects of the BMP over time. Photos can be used to compare a site before and after installation of a BMP and to compare a site with a certain BMP to another site without the BMP.
1.2 Summary of MethodRepeat photography creates an exact method for tracking physical changes at a location of interest. By carefully mapping the layout of the study site and keeping detailed records of distances from marked camera locations to marked photo points, the procedure will allow precise replication of photographs through time. The photographic record can then be used to measure effects of BMPs on local resources and determine whether they have resulted in the desired outcome.
When taking a series of photos over time, any variation in procedure between photos (differing light or weather conditions, seasonal changes, or even a slightly different camera angle) introduces differences that reduce the comparability of photos. The primary objective of this protocol is to minimize these differences, thereby promoting more exact duplication of photos over time so that the effect of BMPs can be documented. The only noticeable difference between photos should be the change due to the BMP (e.g., growth of riparian vegetation after exclusion fencing).
1.3 Health and Safety WarningsObtain permission to access a property from the landowner prior to photographing an area. Be aware of inclement weather in the field.
1.4 CautionsMost camera and GPS units are weather resistant but not submersible. Consult product manuals for exact specifications and tolerances. Cameras and GPS units should be protected from extreme temperatures and weather conditions.
1.5 InterferenceLens covers, smudges, or fingers on the camera lens, autofocus window, or light sensor will result in reduced picture quality. Other interferences include weak batteries, incorrect camera settings, or variation in camera settings between photos. Poorly labeled maps of the reference points and photo points will reduce precision of repeat photography attempts. Differing distances of camera to a reference point through time will limit or prohibit meaningful comparison of photos. Failure to record adequate and legible information during photodocumentation events (especially the initial visit) will result in inability to adequately reproduce photos through time. Establishing camera locations in areas which are certain to change through time (e.g., stream edge or thalweg) will limit or prevent relocation for subsequent photos. Failure to include an item of known dimension (e.g., meter stick, t-post, ball cap) in photos may limit or prevent comparison and any quantitative analysis (e.g., depth of vegetation) due to lack of scale. Large variability in time of day and season between repeat photos may limit or preclude comparisons, especially for practices that promote vegetative cover/establishment. Variability in light angle, cloud cover, background, shadows, and other contrasts between photos may limit or prevent meaningful comparisons between photos over time.
1.6 Personnel QualificationAll personnel using methods outlined in this SOP should be trained during an in-house short course or tutored by personnel who have completed the training and conducted photodocumentation.
1.7 Apparatus & Materials

BMP Photodocumentation Status: Active
06/12/2009 Page 179 of 238The following equipment and reference material should be used:
Digital camera Photo log book / data sheets Reference binder with map and/or aerial photos of site layout and copies of previous photos Batteries Memory card GPS unit Yardstick or other reference tool Measuring tape Operating manual for camera Laser range finder (optional) Compass (if no GPS unit)
1.8 Instrument/Method CalibrationNone.
1.9 Equipment OperationIf there are any questions or problems concerning equipment used, consult the owner’s manual.
1.10 Data CollectionThese methods follow those established by Hall (2001a) and CARCD (2001).
1.10.1 Equipment PreparationCamera:All photos should be taken using a digital camera of at least 6 mega pixels. Before taking photos, personnel must ensure that the camera is set up and used in accordance with the following standards:
1. Ensure that the camera date and time are correct.2. Set camera output to highest resolution JPEG image possible (i.e., large image, finest quality). Most cameras will
show JPEG image quality settings of something like “low”, “fine” and “superfine”. This is not to be confused with image size such as “small”, “medium”, and “large”, which relate to the pixel dimensions of the image. For most cameras, the setting should be “large” (3072 X 2304) and “superfine” (“S”).
3. Set shooting mode to “auto”.4. If zoom is used, do not go beyond the optical zoom range (indicated somewhere on the camera body; e.g., “4X
optical zoom”). Do not use digital zooming! Most cameras will zoom up to the optical zoom and then pause before continuing with digital “zoom”. Digital “zoom” is nothing more than an internal enlargement of the picture at a fixed resolution. You can perform the same action in post-processing on the computer. If possible, turn the digital zoom off.
5. Include in the photo something of known size for scale (e.g., meter stick, t-post, ball cap).6. Frame photographs so that no more than 25% of the photo height will be occupied by the sky. Try to maintain a level
(horizontal) camera view.
GPS Unit:1. Set unit to report coordinates in decimal degrees (i.e., no minutes, seconds)2. Set unit so WAAS is enabled.3. Set the unit so that the location is acquired in 3D and is averaged.4. Try to achieve a location accuracy of 5 meters or less (if possible).
1.10.2 Initial VisitDefinitions:
Photo point – the location of the camera/photographer; this should be a fixed, easily located pointReference point – a fixed object within the frame of the photograph; the object should berelatively immovable and permanent
1) Determine the desired subject to be photographed for change or comparison through time. Photos of BMPs should be taken prior to installation and just after installation to record conditions before any improvement has occurred. Photos should be representative of local conditions but also be taken where change is likely to be evident. For example, an area of

BMP Photodocumentation Status: Active
06/12/2009 Page 180 of 238
bare soil is likely to recover and show more improvement than a thick grassy area after implementing pasture management practices. Be aware of the goals of the project and capture images that clearly demonstrate progress towards achieving those goals.
2) Select permanent features or landmarks to use as photo points and reference points in every photo so that the exact location can be revisited and photographed from the same perspective. A photo point on an eroding streambank or highly unstable slope is a poor choice as it will change over time. Ridgelines, barns, large trees, and rock outcroppings are relatively immovable, unchanging items that make good reference points. An elevated shot from a bridge, cliff, peak, etc. may be instrumental in conveying the full dimensions of the particular BMP.
3) Create a site map that indicates measurements and bearings from each photo point (camera location) to the corresponding reference points (fixed objects in the photo). A sketch of the property, a topographic map, or an aerial photo can be used. Mark the location of every photo point on the sketch, map, and/or photo. Also, record any special camera settings that were used (e.g., zoom magnification). Always assume that the person selecting and photodocumenting the sites during the first visit will not be the person rephotographing the area in the future. Ensure legibility!
4) Record details for each photo taken on side 2 of “Photographic Site Description and Location” data sheet:a) Locate the photo point using a GPS receiver. Once a fixed photo point (camera location) is determined, enter
coordinates on the data sheet, side 2. b) Measure the distance and determine compass bearings (azimuth) from photo point to reference point so future
photographers can accurately rephotograph the area. Once this distance has been determined, it must be maintained to ensure photo comparability through time. Record the distances and bearings of photo points and reference points on the data sheet, side 2. A description of the area on this form is essential for reorientation in the future.
c) Record information for each photo separately on the information sheet. Some info may remain the same. For example, multiple photos may be taken while standing at photo point “1”, but each may be slightly variable (e.g., facing north versus east; zoomed in versus out; focus on tank versus fence; etc.).
5) Organize pictures, data sheets, maps, and other information in a field binder that can be carried to the site for easy reference when rephotographing the area. Print a copy of each photo taken, clearly labeled, along with a copy of the corresponding data sheet(s), and place in binder.
1.10.3 Return Visit1) Review field binders frequently to plan for effective return visits to document progress of BMPs. Plan to take repeat
photos in the same season and at about the same time of day as the original photos, unless the purpose of the photo is to show differences due to season change.
2) Locate the site using the information in the field binder and a GPS receiver. Make sure to use the photograph field binder info to replicate the picture setting exactly as the initial visit photo. Ensure standard camera setup according to Section 1.10.1 and the field binder info sheet (e.g., optical zoom setting).
3) Make every attempt to reproduce conditions in the original photo. Most importantly, make certain that pictures are taken at the same distance and bearing from the photo points to reference points, as delineated on the initial visit field sheet.
4) Fill in return visit field sheet. Comments on the field sheet should include all pertinent information that will allow personnel to relocate photo stations and duplicate the time and place of the photos. Comments could include: any unusual conditions or circumstances, additional location information such as a sketch map, an added focus or subject, the use of zoom, etc. Record information for each photo separately on the back of the “Photographic Site Description and Location” data sheet. If any of the photo points or reference points change, indicate these changes in the comments section of the data sheet and sketch changed locations on site map/photo.
1.11 TroubleshootingSome cameras reset all settings when batteries are changed. Pay attention to battery power so that a battery change does not cause problems in tracking exposure numbers. Also, make sure that there is sufficient memory on the photo card to store all photos.
The same distance between the photo point and the reference point for all subsequent photography of that particular sample is imperative in order for any analysis of change to be possible. Always measure the distance from the photo point to a reference point and record it on the data sheet.
Variability in time of day and season can be reduced by taking repeat photographs on or near the same dates at or near the same time of day. Establishing fixed dates to photograph vegetation is especially crucial to account for seasonal changes.

BMP Photodocumentation Status: Active
06/12/2009 Page 181 of 238
1.12 Data Handling & Preservation / Data StorageDownloading Photos:Before downloading photos for the first time, you will need to create a folder directory to store them. Create a folder for each project (e.g., Spavinaw); within this create a folder for each year (e.g., 2009); within each year, create the following folders: “BMPs”, “Monitoring”, “Education”, and “Other”.
Download photos as desired, but ensure software does not manipulate image resolution or format. Some proprietary software that comes with digital cameras has default download parameters set that are not acceptable. To standardize the method, it is best to download photos manually via the following procedure:
1. Connect camera to computer via USB cable. Turn camera on.2. Click on “My Computer” and look for a listing of your particular camera (e.g., “Canon PowerShot A570 IS”).3. Double click on the camera listing and search the folder(s) for the photos.4. Select all photos, click on “edit”, “copy”, and then paste in the appropriate folder as indicated above.
Renaming Photos:Photo names are one of the most essential steps in the download and archiving process. Names must contain accurate and sufficient information to be readily searchable. Upon download to the appropriate folder, rename each picture in accordance with the most applicable of the following formats:
1. If the photos were taken on a property to show BMP effectiveness: year.month, BMP type, photo sheet number (abbreviated project name plus the contract number with no spaces or
dashes), photo numberExamples: 2009.4_pond_beaty20_1 2009.10_ripfence_IR55008_5
2. If the photos were taken at an event:year.month, event description, project name, photo number
Examples: 2009.4_ farmtour_beaty_1 2009.10_earthday_grand_33. If the photos were taken to document an unusual event (flood, algae bloom, etc.):
year.month, event description, project name, photo numberExamples: 2009.4_flood_beaty_1 2009.12_bridgeout_ncan_2
For items 2 and 3, above, it is not necessary to fill out a site sheet.
You can rename files as a batch by following these steps:1. Open “My computer” and access the folder containing the photos.2. Click on “View” and select “details.”3. Sort photos by current name by clicking on “name,” ensuring that photos are in chronological order.4. Left click on first photo, push and hold shift key, and left click on last photo in the series you wish to batch rename.5. Point cursor over first photo and right click.6. Click “rename” and input the desired name. 7. Photos should now be renamed with the desired name plus a number in parentheses indicating the correct
chronological order.
General:Scan the “Photographic Site Description and Location” data sheets into pdf format, or take a photo of the data sheets, and archive the file in the appropriate folder with the associated pictures. If photos were taken that need to be filed into two different folders, for example, BMPs and education, put a copy of the data sheet into each folder so that the info contained on the sheet is always kept with the photos. Print out one copy of each photo and the data sheet(s), and place in the appropriate binder for future reference.
At least quarterly, copy project photo directories of original images to CD and submit to the Data Manager on disc . Digital images will be maintained in a photo file on the server.
Never replace the original image! Always work on a copy of the image when editing, reformatting, or resizing.
1.13 Computer Hardware & Software

BMP Photodocumentation Status: Active
06/12/2009 Page 182 of 238Electronic copies of digital images will be submitted on compact disk, DVD, or downloaded directly onto the data manager’s hard drive. Images will then be stored on the water quality server and backed up weekly.
1.14 Data Management & Records ManagementA log of the pictures taken should be recorded in the photo data sheet. These will be submitted electronically whenever photos are submitted. In addition, hard copies of the data sheets will be kept in a binder for reference during return visits.
2.0 QA/QC SECTION
2.1 TrainingAll those photodocumenting BMPs will attend an in-house short course training session on the procedure.
2.2 Maintenance Most cameras and GPS units are weather resistant but not submersible. Do not submerge units. Refer to the operation
manuals to determine whether additional precautions are necessary. Clean outside of units with a soft, dry cloth, removing dirt or sand from weather resistant seals.
2.3 QC Procedures Not applicable.
3.0 REFERENCES
CARCD (California Association of Resource Conservation Districts). 2001. “Photodocumentation Procedure,” in Guidelines for Citizen Monitoring: Products of the 2000-2001 Technical Advisory Council on Citizen Monitoring. State Water Resources Control Board.
Hall, Frederick C. 2001a. Photo point monitoring handbook: part A—field procedures. Gen. Tech. Rep. PNW-GTR-526. Portland, OR: U.S. Department of Agriculture, Forest Service, Pacific Northwest Research Station. 48 p. 2 parts.
Hall, Frederick C. 2001b. Photo point monitoring handbook: part B—concepts and analysis. Gen. Tech. Rep. PNW-GTR-526. Portland, OR: U.S. Department of Agriculture, Forest Service, Pacific Northwest Research Station. 86 p. 2 parts.
BMP Photodocumentation Status: Active
06/12/2009 Page 183 of 238
4.0 APPENDIX A
STANDARD OPERATING PROCEDURERepeat Photography--Field Summary
Photo point – the location of the camera/photographer; this should be a fixed, easily located pointReference point – a fixed object within the frame of the photograph; the object should be relatively immovable and permanent
Initial Site Visit:1) Determine the desired subject to be photographed for comparison through time based on goals of the project.2) Select a permanent feature or landmark to use as a reference point in every photo, as well as easily located photo points.3) Create a site map that indicates locations of photo points and reference points AND / OR mark the locations on an aerial photo or preprinted map of the property. 4) Record details for each photo taken on “Photographic Site Description and Location” data sheet:
a) Using a GPS receiver, enter coordinates of the photo point (camera location) on the data sheet. b) Measure the distance and determine compass bearings from photo points to reference points and record on the data sheet.c) Record info for every photo taken on the data sheet, including special settings used (e.g., optical zoom).
5) Organize pictures, data sheets, maps, and other information in a field binder that can be carried to the site for easy reference when rephotographing the area.
Return Visit:1) Review field binders frequently to plan for effective return visits to document progress of BMPs. Plan to take repeat photos in the
same season and at about the same time of day as the original photos. 2) Locate the site using the information in the field binder and a GPS receiver. Make sure to use the photograph field binder info to
replicate the picture setting exactly as the initial visit photo. Standard camera set up should be used, along with any special settings used to take original photo.
3) Make every attempt to reproduce conditions in the original photo (e.g., repeat distance and bearing from the photo points to the reference points).
4) Fill in return visit data sheet. If any of the photo points or reference points change, indicate these changes in the comments section of the data sheet and sketch changed locations on site map/photo. Record info for every photo taken on the back of the data sheet, including special settings used (i.e., optical zoom).
Downloading Photos:Download photos to preloaded folders on hard drive (e.g., C:\Spavinaw\2009\BMPs\). Users may download manually via the following procedure: 1) connect camera to computer via USB cable (camera must be on), 2) click on “My Computer” and look for a listing of your particular camera, 3) search the folder(s) for the photos, and 4) select all photos, click on “edit”, “copy”, and then paste in the appropriate folder.
Renaming Photos:Upon download to the appropriate folder, rename each picture in accordance with the most applicable of the following format examples: BMPs example: 2009.10_ripfence_IR15_5; Education example: 2009.4_farmtour_beaty_1; Unusual event example: 2009.12_bridgeout_ncan_2
General:Scan the “Photographic Site Description and Location” data sheets into pdf format, or take a photo of the data sheets, and archive in the appropriate folder with the associated pictures. Print out one copy of each photo, and place in the appropriate binder along with the data sheet(s) for future reference.

BMP Photodocumentation Status: Active
06/12/2009 Page 184 of 238
4.1 APPENDIX B: FORMS

Photo Sheet # _____________
PHOTOGRAPHIC SITE DESCRIPTION AND LOCATION
Project __________________________________ County ______________________________
Location Name / Description____________________________________
Legal description of property ___________________________________
GPS Coordinates of each photo point:
Comments:
Sketch property below or attach an aerial photo or a topographic map of the property. Mark general locations of photo points and number them. If there are any changes from earlier visits, indicate these clearly and describe in the comments section above.

Project ___________________________________ Location Name _______________________________________________
Photo #
Photo Point
#Date
(mo/da/year)
Description of Photo Point
(place where photographer is standing)
(Ex: large willow tree, SW corner of fence)
Description of Reference
Point (fixed object within
photo)(Ex: barn, boulder, osage orange tree)
Subject of Photo(what is being photographed)
(Ex: riparian area, pasture, heavy use area, etc.)
Compass Bearing to
Subject (direction
facing when take photo)
Distance from
Photo Point to
Reference Point
Comments (include
photographer name)

Photodocumentation for MonitoringStatus: Active
Date: 07/13/2006Page 187 of 238
OKLAHOMA CONSERVATION COMMISSIONWATER QUALITY DIVISION
STANDARD OPERATING PROCEDURE
PHOTODOCUMENTATIONTO SUPPORT WATER QUALITY MONITORING

Photodocumentation for MonitoringStatus: Active
Date: 07/13/2006Page 188 of 238
1.0 PROCEDURAL SECTION
1.1 Scope and ApplicationEnvironmental monitoring can be reinforced through documentation of specific circumstances at sites with photography. Photographs create a record by preserving a moment in time and enhance a physical description. In the case of biological collections, the number of specimens that must be kept can be decreased by carefully photographing the organism and releasing it. Storage of photographs requires less processing and uses less space.
1.3 Summary of MethodPictures of fish, sites, land use practices, sampling methods, and problems at sites will be documented photographically. The photographs will be stored both on disc and on the OCC server for use in reports and presentations.
1.3 Health and Safety WarningsNone
1.4 CautionsMost units are weather resistant but not submersible. However, not all cameras are weather resistant. Refer to the camera manual for additional information. Generally, however, cameras should be protected from extreme temperatures and weather conditions.
1.5 InterferenceLens covers, smudges, or fingers on the camera lens, auto focus window, or light sensor will result in reduced picture quality. Other interferences include old batteries, incorrect camera settings, or extreme light conditions may affect the quality of photographs.
1.6 Personnel QualificationAll personnel will be evaluated on method during the field audit.
1.7 Apparatus & MaterialsThe following equipment and reference material should be used.
Camera Batteries Memory card Operating manual for camera
1.8 Instrument/Method CalibrationNone
1.9 Equipment OperationYou will be using a digital 35 mm camera. If you have any questions, consult your owner’s manual.
1.10 Sample CollectionSetup
1. Ensure camera date and time are correct.2. Set shooting mode to “auto”.3. Set camera output to highest resolution JPEG image possible (i.e., largest image size, finest quality). Once you select
this, the setting should remain until you change it or the camera gets reset for some reason. For most cameras, the setting should be “large” (3072X2304) and “superfine” (“S”).
E.g., Olympus Stylus 1030SW:1) power on2) ensure “auto” mode is selected3) press the “OK/FUNC” button; select “10M” (i.e., image size of 3648X2736) and then “FINE"

Photodocumentation for MonitoringStatus: Active
Date: 07/13/2006Page 189 of 238
Taking photos (General)1. Compile a site description sheet with the following:
2. Photograph the site description sheet (ensure legibility).3. Take photos (be sure to include something of known size for scale).4. Repeat procedure at each creek monitored.
Taking photos (Fish Collection)1. Compile a site description sheet with the following:
2. Photograph the site description sheet (ensure legibility).3. Take an upstream and a downstream photo at the start point of the collection activities (be sure to include something
of known size for scale).4. Take a photo of each individual fish as necessary and include a backdrop including the site name, WBID# and date
(can use the same sheet used as the site identifier).5. Take an upstream and a downstream photo at the end point of the collection activities (be sure to include something of
known size for scale).Repeat procedure at each creek monitored.
1.11 TroubleshootingSome cameras reset all settings when batteries are changed. Pay attention to battery power so that a battery change does not cause problems in tracking exposure numbers. Also, make sure that there is sufficient memory on the photo card to store all photos.
1.12 Sample Handling & Preservation/Data StorageSetup
Before downloading photos for the first time, you will need to create a folder directory to store them on your harddrive. Create a folder for each project and, within each of these folders, create the following folders: Fish Collection, General. The following are examples of project folder names to be used:
1. Rotating Basin Year 82. Probabilistic Year 93. Spavinaw 2009; Honey Ck 2009; North Canadian 20094. CREP 2009
Downloading photosTo standardize the method, it is best to download photos manually via the following procedure:
1. Turn on camera and select “play” mode.2. Connect camera to computer via USB cable provided with your camera and wait for computer to connect
with it. For the Olympus, push “OK/FUNC” to enter PC mode, then push “OK/FUNC” once more.3. Click on “My Computer” and look for a listing of your particular camera (e.g., “Canon PowerShot A570
IS”). For the Olympus, you will look for “removable disk”.4. Double click on the camera listing and search the folder(s) for the photos. For the Olympus, drill down
through the two folders to the pictures.5. Select all photos, click on “edit”, “copy”, and then paste in the appropriate folder as indicated above.
Renaming photosPhoto names are one of the most essential steps in the download and archiving process. It is essential to rename photos according to the following nomenclature: site name_county_last letter of the WBID.
E.g., SkeletonCkLower_Logan_F; CimarronREast_Cimarron_G
CREEK NAMEWBIDDATE
CREEK NAMEWBIDDATE

Photodocumentation for MonitoringStatus: Active
Date: 07/13/2006Page 190 of 238
You can rename files in a batch, instead of one at a time, by following these steps:
1. Open “My computer” and access the folder containing the photos2. Click on “View” and select “details”.3. Sort photos by current name by clicking on “name”, ensuring that photos are in chronological order.4. Left click on first photo, push and hold shift key, and left click on last photo in the series you wish to batch
rename.5. Point cursor over first photo and right click.6. Click “rename” and input the desired name.7. Ensure photos are named in the correct chronological order.
Data storage/submittalPhoto files should be stored in duplicate, one on your hard drive and the second on CD, or on two separate CDs. Keep photos grouped by project, i.e., “Rotating Year 6”, “Rotating Year 8”, etc., with each project stored on a separate, clearly labeled CD. Data should be added to a CD until it is almost full or until no more photos from that particular project need to be stored. At least quarterly, one copy of each photo should be submitted to the senior technical writer on CD, labeled with the project name. The second copy should remain in your records. Digital images will be maintained in a photo file on the OCC server.
1.13 Computer Hardware & SoftwareElectronic copies of digital images will be submitted on compact disk and then downloaded directly onto the OCC server. Images will then be stored on the water quality server and backed up weekly.
1.14 Data Management & Records ManagementNever replace the original image! Always work on a copy of the image when editing, reformatting, or resizing. Maintain a copy of all photos in your records.
2.0 QA/QC SECTION
2.1 TrainingAll users will be evaluated on procedures during the field audit.
2.2 Maintenance Most cameras are weather resistant, but not submersible, do not submerge unit. Refer to the camera operation manual to
determine whether additional cautions are necessary. Clean outside of unit with a with soft, dry cloth, removing dirt or sand from weather resistant seals. Replace batteries as needed.
2.3 QC Procedures Not applicable

Photodocumentation for MonitoringStatus: Active
Date: 07/13/2006Page 191 of 238
4.0 APPENDIX A
STANDARD OPERATING PROCEDUREField Summary
Scope and ApplicationSubject matter for photodocumentation consists of the following:
Site: upstream and downstream pictures taken twice each year, once in summer and once in winter Land use practices adjacent to the site taken both when sampling is initiated and when there are significant changes
in land use. These changes include crop rotation, building, channel alterations, and other factors that might affect water quality.
Sampling methods Problems/complaints Fish: Be sure scales can be counted and appropriate fins can be seen. For fish, lay fish on paper that already
represents site name, county, site date and time, WBID #, and the type of fish. Lay ruler on paper for scaling purposes. Take pictures of all species released (e.g. 1 green sunfish picture out of 75 caught) and every rare individual (e.g. 3 bowfin pictures for 3 bowfins caught).
Sample CollectionIn-Field:Make sure to check “Photodocumentation” on the site collection sheet. Repeat procedure at each creek monitored
Setup
1. Ensure camera date and time are correct.2. Set shooting mode to “auto”.3. Set camera output to highest resolution JPEG image possible (i.e., largest image size, finest quality). Once you select
this, the setting should remain until you change it or the camera gets reset for some reason. For most cameras, the setting should be “large” (3072X2304) and “superfine” (“S”).
E.g., Olympus Stylus 1030SW:1) power on2) ensure “auto” mode is selected3) press the “OK/FUNC” button; select “10M” (i.e., image size of 3648X2736) and then “FINE".
Taking photos (General)
1. Compile a site description sheet with the following:
2. Photograph the site description sheet (ensure legibility).3. Take photos (be sure to include something of known size for scale).4. Repeat procedure at each creek monitored.
Taking photos (Fish Collection)
1. Compile a site description sheet with the following:
2. Photograph the site description sheet (ensure legibility).3. Take an upstream and a downstream photo at the start point of the collection activities (be sure to include something
of known size for scale).4. Take a photo of each individual fish as necessary and include a backdrop including the site name, WBID# and date
(can use the same sheet used as the site identifier).5. Take an upstream and a downstream photo at the end point of the collection activities (be sure to include something of
known size for scale).
CREEK NAMEWBIDDATE
CREEK NAMEWBIDDATE
Photodocumentation for MonitoringStatus: Active
Date: 07/13/2006Page 192 of 238
Office:
Setup
Before downloading photos for the first time, you will need to create a folder directory to store them on your harddrive. Create a folder for each project and within each of these folders create the following folders: Fish Collection, General. The following are examples of project folder names to be used:
1. Rotating Basin Year 82. Probabilistic Year 93. Spavinaw 2009; Honey Ck 2009; North Canadian 20094. CREP 2009
Downloading photos
To standardize the method, it is best to download photos manually via the following procedure:1. Turn on camera and select “play” mode.2. Connect camera to computer via USB cable provided with your camera and wait for computer to connect with it. For
the Olympus, push “OK/FUNC” to enter PC mode, then push “OK/FUNC” once more.3. Click on “My Computer” and look for a listing of your particular camera (e.g., “Canon PowerShot A570 IS”). For the
Olympus, you will look for “removable disk”.4. Double click on the camera listing and search the folder(s) for the photos. For the Olympus, drill down through the
two folders to the pictures.5. Select all photos, click on “edit”, “copy”, and then paste in the appropriate folder as indicated above.
Renaming photos
Photo names are one of the most essential steps in the download and archiving process. It is essential to rename photos according to the following nomenclature: site name_county_last letter of the WBID.
E.g., SkeletonCkLower_Logan_F; CimarronREast_Cimarron_G
You can rename files in a batch, instead of one at a time, by following these steps:
1. Open “My computer” and access the folder containing the photos.2. Click on “View” and select “details”.3. Sort photos by current name by clicking on “name”, ensuring that photos are in chronological order.4. Left click on first photo, push and hold shift key, and left click on last photo in the series you wish to batch rename.5. Point cursor over first photo and right click.6. Click “rename” and input the desired name.7. Ensure photos are named in the correct chronological order.
Data storage/submittal
Photo files should be stored in duplicate, one on your hard drive and the second on CD, or on two separate CDs. Keep photos grouped by project, i.e., “Rotating Year 6”, “Rotating Year 8”, etc., with each project stored on a separate, clearly labeled CD. Data should be added to a CD until it is almost full or until no more photos from that particular project need to be stored.
At least quarterly, one copy of each photo should be submitted to the senior technical writer on CD, labeled with the project name. The second copy should remain in your records. Digital images will be maintained in a photo file on the OCC server.

Reagent Shelf-lifeStatus: Active
Date: 07/13/2006Page 193 of 238
OKLAHOMA CONSERVATION COMMISSIONWATER QUALITY DIVISION
STANDARD OPERATING PROCEDURE
REAGENTS AND STANDARDS SHELF-LIFE

Reagent Shelf-lifeStatus: Active
Date: 07/13/2006Page 194 of 238
1.0 PROCEDURAL SECTION
1.1 Scope and ApplicationReagents and standards used in the analysis of environmental samples do not have an infinite life. Almost all of these substances will degrade beyond an acceptable level after—after which they should be disposed of properly. The difficult part is trying to discern what this period is. Some reagents have a listed shelf-life which makes this easy to discern; however, many do not have a listed expiration date.
1.2 Procedure1. All reagents and standards containers should be labeled with the date received.
2. All of the containers should be re-dated when first opened.
3. The Q.A. Officer will determine the shelf-life of reagents and standards which are not labeled by the manufacturer.
4. Many standards and reagents have different shelf lives after opening than they do when unopened. Also, high temperature, or exposure to light or humidity may shorten shelf life. Store chemicals according to accepted practices or as specified by the manufacturer.
5. No reagent or standard shall be used after the expiration date.
6. Any reagent or standard that takes on a different appearance, such as a color change or the presence of particulate matter, should be discarded.
7. All reagents and standards should be disposed of in an appropriate manner. If you have questions, consult the Material Safety Data Sheet (MSDS) or the analytical laboratory (e.g. the DEQ Laboratory).

Spikes, Duplicates, BlanksStatus: Active
Date: 07/13/2006Page 195 of 238
OKLAHOMA CONSERVATION COMMISSIONWATER QUALITY DIVISION
STANDARD OPERATING PROCEDURE
SPIKE, DUPLICATE, REPLICATE AND BLANK SAMPLES/ MEASUREMENTS FOR ROUTINE QA

Spikes, Duplicates & BlanksStatus: Active
Date: 07/13/2006Page 196 of 238
1.0 PROCEDURAL SECTION
1.1 Scope and ApplicationTo implement QA/QC procedures, specific samples/measurements must be obtained that provide for direct measurement of investigator/method precision, accuracy, and bias. To this end, spikes, duplicates, replicates, and blanks are collected/produced as a percentage of sampling effort in accordance with data quality objectives as outlined in specific project QAPPs. Generally, OCC collects blank, duplicate, and replicate samples/measurements at a rate of 10 percent of sampling effort or for each separate sampling episode, whichever effort is greatest.
1.2 Summary of Method
1.2.1 Definitions and Synopsis
QA/QC SAMPLES COLLECTED BLANK: Refers to a sample of de-ionized water (analyte-free). The blank is collected in the field by
first rinsing a sample bottle 3X with blank water and then filling. The blank is then preserved, documented, and transported under the same conditions as the samples. Assuming the purity of the blank water from the lab, the field blank allows assessment of contamination during sampling, preservation, and transportation that will be assumed for all samples during the sampling episode.
SPLIT/DUP: A split or duplicate sample refers to a grab sample that is homogenized in a splitter-churn (split) and the sample and duplicate samples (splits) subsequently obtained. The two samples, although obtained separately, should theoretically be equivalent in analytical results. Refer to section 1.10.2, Inorganic Composite Sample in the Inorganic Sampling SOP for specific details. The split or duplicate allows determination of precision in sampling procedure (i.e., field technician error).
REPLICATE: A replicate is one or more grab samples taken in different locations (width or length) or at different times. Spatial replicates are preferred. Procure replicate measurements/samples at least 50 m from the original sampling site in an area of similar habitat. If within reasonable walking distance an area of similar habitat is unavailable, move upstream or laterally within the same habitat and obtain replicates from an undisturbed area. In all cases, care must be taken to ensure replicates are taken from areas of similar habitat. Indicate whether the replicate is spatial or temporal in the comments section of the Sampling Episode Sheet. Replicate samples are designed to estimate the spatial and/or temporal in-stream variation affording assessment of the representativeness of a single grab sample or measurement.
SPIKE: A spike refers to the addition of a known amount and concentration of analyte to a sample. The purpose of a spike is to measure the performance of the complete analytical system. Spikes are only performed as directed by individual project QAPPs.
FIELD QA/QC READINGS COND, pH: Duplicate and replicate readings for these parameters must be obtained and recorded
appropriately. For duplicates, obtain two samples from the splitter churn post homogenization in clean, sample rinsed containers and read the values from each being careful to rinse the probe between readings. You may use the same samples for both parameters, however, start with conductivity and then proceed with pH. Record the values separated by a “;” under the “SPLIT/DUP heading for the relevant parameter. Obtain replicate readings in-situ in an undisturbed and most applicable portion of the area chosen for replicate samples (outlined above)
DO: Because duplicate DO readings are theoretically impossible, additional readings of DO should only be collected for replicate samples. Obtain replicate readings in-situ in an undisturbed and most applicable portion of the area chosen for replicate samples (outlined above)
TURB, ALK, Duplicate and replicate readings for these parameters must be obtained and recorded HARDNESS: appropriately. Obtain aliquots from the splitter churn post homogenization, analyzing once
for the parameter value to be recorded on the Site Collection Sheet and the second time for the “SPLIT/DUP” recorded on the Sampling Episode Sheet. An alternative is to use

Spikes, Duplicates & BlanksStatus: Active
Date: 07/13/2006Page 197 of 238
water from the “duplicate” and “sample” jugs, which have already been obtained from the splitter churn. In any case, care should be taken to rinse glassware accordingly between duplicate and sample analyses. A procedural blank using de-ionized water should also be performed and results recorded accordingly.
1.3 Health and Safety WarningsNot applicable
1.4 CautionsNot applicable
1.5 InterferencesNot applicable
1.6 Personnel QualificationField personnel must be trained and evaluated by the Quality Assurance Officer and/or the Environmental Monitoring Coordinator on the proper procedure. Training will be done through dry run exercises in the laboratory and field to familiarize field personnel with operation/collection, calibration, and maintenance. Investigators must be familiar with the appropriate SOP documents, when applicable.
1.7 Apparatus & Materials
1.8 ProcedureFor each sampling episode or at a cumulative frequency of 10% for sites sampled, field personnel should select a site to perform the QA activities outlined below. Sites should be selected for QA that will limit error or measurement variability to procedural/analytical phenomenon and not biases due to highly variable or exceptionally extreme physical conditions present at the site.
1.8.1 Preparation or Measurement of Blank SamplesShortly before leaving for the field, obtain high quality, deionized reagent water from the lab or equivalent and pertinent source. This water should be kept in a polyethylene bottle which has been rinsed 3 times in tap water and 3 times in deionized water.
In the field at the site chosen for QA activities, label sample bottles in the same manner as you would for a sample (i.e. date, Acidified or not), but write "field blank" where you would normally write the name of the stream; rinse the bottles 3X with a volume of deionized water equivalent to that with which you would rinse stream bottles; fill the sample bottles with deionized water. Add the correct amount and type of acid to the “acidified” sample, and cap both the bottles tightly and place in the ice chest with the other sample bottles. The blanks should experience the same treatment as all the other samples in terms of storage and transport.
For field blank measurements, conduct the turbidity, alkalinity, and hardness procedures using reagent grade water.
1.8.2 Preparation or Measurement of Split/Duplicate SamplesPrepare the sample bottles, labeling one for preservation on ice and once for preservation with acid. Label a second set of bottles exactly as the first set, but write "DUPLICATE" in the space under the stream name. Label another clean jug “duplicate field”. Procure grab samples with the five jugs according to procedures outlined for “inorganic grab samples” in the “Inorganic and Bacteria Sample Collection” SOP earlier in the document. Return and proceed with procedures outlined for “inorganic composite sample” in the “Inorganic and Bacteria Sample Collection” SOP.
To obtain relevant duplicate field measurements for turbidity, alkalinity, and hardness, obtain aliquots from the splitter churn post homogenization, analyzing once for the parameter value to be recorded on the Site Collection Sheet and the second time for the “SPLIT/DUP” value recorded on the Sampling Episode Sheet. An alternative is to use water from the “duplicate” and “sample” jugs, which have already been obtained from the splitter churn if the investigator ensures that there will be sufficient water remaining the for laboratory analysis. In any case, care should be taken to rinse glassware accordingly between duplicate and sample analyses. For conductivity and pH, obtain two samples from the splitter churn, after homogenization, in clean, sample rinsed containers and read the values from each being careful to rinse the probe between readings. You may use the same samples for both parameters; however, start with
Spikes, Duplicates & BlanksStatus: Active
Date: 07/13/2006Page 198 of 238
conductivity and then proceed with pH. Record the values separated by a “;” under the “SPLIT/DUP heading for the relevant parameter.
1.8.3 Preparation or Measurement of Replicate SamplesPrepare the sample bottles, labeling one for preservation on ice and one for preservation with acid in the same manner as the original sample jugs, but add “replicate” to the label. Procure grab samples with the prepared jugs according to procedures outlined for “inorganic grab samples” in the “Inorganic and Bacteria Sample Collection” SOP earlier in the document. Spatial replicates are preferred. To accomplish this, procure replicate measurements/samples at least 50 m from the original sampling site in an area of similar habitat. If within reasonable walking distance an area of similar habitat is unavailable, move upstream or laterally within the same habitat from which the original samples were procured and obtain replicates (in this case “temporal”) from an undisturbed area. In all cases, care must be taken to ensure replicates are taken from areas of similar habitat. Indicate whether the replicate is “spatial” or “temporal” in the comments section of the Sampling Episode Sheet.
To obtain replicate field measurements, obtain DO, Temperature, Turbidity, Alkalinity, Hardness, Conductivity, and pH measurements at the replicate location in accordance with procedures outlined in the respective SOPs. Record values in the appropriate space provided on the Sampling Episode Sheet.
1.8.4 Preparation of Spiked SamplesA spiked sample is one to which a known amount of analyte will be added or “spiked”. Generally, spikes of several analytes are added to a single sample of stream water to allow for determination of recovery efficiency and matrix interference. In order to calculate the recovery efficiency the following information must be recorded and sent to the Data Manager along with the field data: a) volume of stream or lake water in sample, b) volume of each spike solution added to sample, c) concentration of each spike solution and the units thereof, d) date, waterbody name, waterbody number of stream spiked
1.8.4a Procedure for Spiking a Nutrient Sample1. Put approximately 600 ml of sample water into a 1000 ml Class A graduated cylinder.2. Add 10 ml of a 500 mg/liter NO3-N to cylinder. Add 10 ml of a 150 mg/liter NH4+-N to cylinder.
Add 10 ml of a 25 mg/liter PO43+-P to cylinder.
3. Bring cylinder up to the 1000 ml line with sample water.4. Gently swirl cylinder so that no spike solution remains on the upper part of the cylinder, pour the
solution back and forth from the cylinder to the bottle two times.5. Add the correct amount and type of acid to the bottle.6. Cap the bottle tightly.7. Write "spike" under the waterbody name on the bottle.8. Record the volume of sample water and volume and concentration of each spike solution in your
Field notebook under the entry for the waterbody you are working on.
1.8.4b Procedure for Spiking the Non-acidified Sample1. Use the same procedure as for spiking the nutrient sample except add: 10 ml 12,500 mg/liter
Chloride, 10 ml 2,500 mg/liter Sulfate as SO4, 10 ml 10,000 mg/liter Calcium as CaCO3
2. Do not acidify this sample.
1.8.5 Wrap upA complete QA site activity should result in 8 sample jugs: one “acid” and one “ice” sample; one “acid” and one “ice” duplicate; one “acid” and one “ice” replicate; and one “acid” and one “ice” blank. These samples should be listed separately on the Chain of Custody form so that four lines on the form will be used. Each line will list 2 containers and have the same waterbody number but should state whether the sample is regular, split, replicate. The blank sample is the same but will not have a waterbody number. A complete set of QA field measurements includes the following parameters: sample DO and replicate DO; sample turbidity, duplicate turbidity, replicate turbidity, and blank turbidity; sample alkalinity, duplicate alkalinity, replicate alkalinity, and blank alkalinity; sample hardness, duplicate hardness, replicate hardness, and blank hardness; sample conductivity, duplicate conductivity, and replicate conductivity; sample pH, duplicate pH, and replicate pH. Quasi duplicate temperature readings are obtained at the initiation and closing of sampling activities and at the requisite four hour calibration checks. These reading should be recorded on the Sampling Episode Sheet.

Spikes, Duplicates & BlanksStatus: Active
Date: 07/13/2006Page 199 of 238
1.9 Data Management and Records ManagementRecord all data on the Sampling Episode Sheet (see SOP Appendix: Data Sheets). Refer to the Procedures for Completing Field Data Sheets SOP.
2.0 QA/QC SECTION
2.1 TrainingField personal must be trained and evaluated by the Quality Assurance Officer and/or the Environmental Monitoring Coordinator on the proper procedure. Training will be done through dry run exercises in the laboratory and field to familiarize field personnel with operation/collection, calibration, and maintenance. Investigators must be familiar with the appropriate SOP documents, when applicable.
2.2 MaintenanceNot applicable
2.3 QC Procedures
TemperatureStatus: Active
Date: 07/13/2006Page 200 of 238
OKLAHOMA CONSERVATION COMMISSIONWATER QUALITY DIVISION
STANDARD OPERATING PROCEDURE
TEMPERATURE MEASUREMENT
(ELECTRONIC TEMPERATURE SENSOR & THERMOMETER)
TemperatureStatus: Active
Date: 07/13/2006Page 201 of 238
1.0 PROCEDURAL SECTION
1.1 Scope and Application25
Temperature readings are used in the study of saturation and stability with respect to calcium carbonate, in the calculation of salinity, and determination of theoretical oxygen solubility and several other calculations. In limnological studies, water temperature as a function of depth is often required. Elevated temperatures resulting from discharges of heated water may have significant ecological effects as related to state standards.
1.2 Summary of MethodTemperature measurements should be made with any electronic temperature sensor or mercury-filled Celsius thermometer.
1.2.1 DefinitionsConversion of Fahrenheit to Celsius
oC = 5/9(oF – 32)
1.3 Health and Safety WarningsAvoid contact with mercury if glass thermometer is broken. Follow the appropriate procedures to clean-up the spill.
1.4 CautionsNone
1.5 InterferencesNone
1.6 Personnel QualificationField personal must be trained and evaluated on the use of equipment prior to collecting samples or data. Use of equipment is subject to the approval by the QA Officer and/or the Environmental Monitoring Coordinator. Training will be done through dry run exercises in the laboratory and field to familiarize field personnel with operation/collection, calibration, and maintenance. Investigators must be familiar with the SOP documents and manuals, when applicable.
1.7 Apparatus & Materials Electronic measurement using one of several meters (pH, conductivity, or dissolved oxygen meters) Hand held thermometer
1.8 Instrument/Method CalibrationThe field collector should select one meter to make electronic measurements and use that meter to make all temperature readings. Preferable the dissolved oxygen meter should be used for temperature readings. This meter, along with all other meters, should be calibrated against a National Institute of Standards and Technology (NIST) certified thermometer (or to one that is traceable to a NIST thermometer) each quarter following procedures as directed by the QA officer at a QA and meter calibration session. Values will be recorded in the equipment logbook.
1.9 Equipment Operation & PreparationFollow the instructions for the particular meter used for temperature measurement.
1.10 Sample CollectionElectronic Temperature Sensor:
Temperature is measured in stream at a depth of one foot in mid-channel or, if the stream is less than one foot deep, at a depth midway between surface and bottom. After placing the probe in water, allow at least one minute for equilibrium to occur; switch meter to temperature mark. Read temperature in oC to the nearest 0.01.
Hand Held Thermometer:
25 Text was taken directly or in part from Standard Methods (APHA, AWWA, WPCF, 1992).

TemperatureStatus: Active
Date: 07/13/2006Page 202 of 238
If stream is wadeable, hold thermometer by its top under water in mid-channel for at least one minute to allow it to equilibrate with the water. Position the thermometer so the scale can be read and without removing it from the water. Read the temperature in C to the nearest 0.5
1.11 Sample Handling & PreservationSample must be measured in situ.
1.12 Sample Preparation and AnalysisNone
1.13 TroubleshootingRefer to the owner’s manual for the appropriate meter.
1.14 Data Acquisition, Calculation & Data ReductionNone
1.15 Computer Hardware & SoftwareNone
1.16 Data Management & Records Management
1.16.1 Field Notation of DataAll field calibration and calibration checks should be recorded on the Sampling Episode Sheet (see SOP Appendix: Data Sheets). All measurements made at each site should be recorded on the Site Collection Sheet (see SOP Appendix: Data Sheets). Data should be recorded following procedures outlined in the Instructions for Recording Field Information SOP.
1.16.2 Chain of Custody ProcedureTemperature must be read in the field; therefore no Chain of Custody form is required.
2.0 QA/QC SECTION
2.1 TrainingTraining of field personnel will be done through dry run exercises in the laboratory and/or field to familiarize them with instrument operation, calibration and maintenance. Investigators must be familiar with the SOP document and owner’s manual for the meter used.
2.2 Maintenance Maintenance of the electronic temperature sensor should follow procedures outlined for the individual meter. Handheld mercury thermometers should be kept clean and in a protective case.
2.3 QC ProceduresThese meters should be calibrated against NIST certified thermometers each quarter following procedures as directed by the QA officer at a QA and meter calibration session. Values will be recorded in the equipment logbook.
3.0 REFERENCES
APHA, AWWA, and WPCF (1992) Standard Methods for the Examination of Water and Wastewater, 17th edition, eds. L.S. Clesceri, A.E. Greenberg, and R.R. Trussell, American Public Health Association, Washington, D.C.

TemperatureStatus: Active
Date: 07/13/2006Page 203 of 238
4.0 APPENDIX A
STANDARD OPERATING PROCEDUREField Summary
Temperature
Instrument/Method CalibrationThe field collector should select one meter to make electronic measurements and use that meter to make all temperature readings for reported data. Preferable the dissolved oxygen meter should be used for temperature readings. This meter, along with all other meters, should be calibrated against a National Institute of Standards and Technology (NIST) certified thermometer each quarter following procedures as directed by the QA officer at a QA and meter calibration session. Values will be recorded in the equipment logbook.
Sample Collection--In Stream
Electronic Temperature Sensor:
Temperature is measured in stream at a depth of one foot in mid-channel or, if stream is less than one foot deep, at adepth midway between surface and bottom. After placing probe in water, allow at least one minute for probe to equilibrate with water temperature. Read temperature in C to the nearest 0.01o.
Hand Held Thermometer:
If stream is wadeable, hold thermometer by its top under water in mid channel for at least one minute to allow it to equilibrate with the water. Position the thermometer so the scale can be read and without removing it from the water read the temperature in C to the nearest 0.5o.

Turbidity MeasurementStatus: Active
Date: 07/13/2006Page 204 of 238
OKLAHOMA CONSERVATION COMMISSIONWATER QUALITY DIVISION
STANDARD OPERATING PROCEDURE
TURBIDITY MEASUREMENT
(HACH MODEL 2100P)

Turbidity MeasurementStatus: Active
Date: 07/13/2006Page 205 of 238
1.0 PROCEDURAL SECTION
1.1 Scope and Application26
Turbidity is a measurement of the clarity of water, which is an optical property that interferes with the straight transmission of a light beam through a water sample. Turbidity is caused by suspended matter, (clay, silt, organic particles, and inorganic matter) soluble colored organic compounds, planktonic and microorganism (APHA et al., 1995). The Hach model 2100P measures turbidity from 0.01 to 1000 Nephelometric turbidity units (NTU) and operates under the nephelometric principle of turbidity measurement.
1.2 Summary of Method1
The principle of this method is based on a comparison of the intensity of light scattered by the sample under defined conditions with the intensity of the light scattered by a reference (APHA et al., 1995). The greater the scattering or absorption of light, the more turbidity. Turbidity is determined by measuring the intensity of light scattered at 90o of the light path (APHA et al., 1992). The intensity of light scattered is reported in NTU.
1.2.1 DefinitionsNTU Nephelometric turbidity unitsGelex standards gel standards used for checking the over all accuracy of the meter
1.3 Health and Safety WarningsNone
1.4 Cautions2
Always cap cell to prevent spillage of sample in unit. When measuring, place the unit on a level stationary surface—do not hold in hand. Use only clean sample cells free from scratches. Avoid measurement in direct sun light. Make sure cold samples do not “fog” the cell. Avoid settling of sample prior to measurement. Keep sample compartment lid closed to prevent dust and dirt from entering.
1.5 Interference1
Dirty sample cells, scratches, air bubbles, and vibrations will bias the sample. Rapidly settling coarse sediment will also influence the reading. Water color due to dissolved substances or “true color” will bias the reading by absorbing light, resulting in a lower turbidity reading (APHA et al., 1995). Further, zooplankton in cells can cause unstable readings.
1.6 Personnel QualificationField personal must be trained and evaluated on use of equipment prior to collecting samples or data. Use of the equipment is subject to approval by the QA Officer and/or the Environmental Monitoring Coordinator. Training will be done through dry run exercises in the laboratory and field to familiarize field personnel with operation/collection, calibration and maintenance. Investigators must be familiar with the SOP documents and owner’s manual, when applicable.
1.7 Apparatus & Materials Hach Portable Turbidimeter Model 2100P 3 Gelex standards calibrated and/or optically marked sample cells
1.8 Instrument/Method Calibration27
Read the Gelex standards before initial sample collection. Calibration checks should be conducted prior to additional collections at approximately 4 hour intervals. If the calibration check is greater that 5% of the Gelex standard, the meter probably needs to be re-calibrated. DO NOT use the Gelex standards to recalibrate the unit. If no reason for the erroneous values can be determined, consult the QA Officer. Samples can be collected and preserved in the dark at 4o C for laboratory analysis (48 hour holding period). The meter should be calibrated at the quarterly QA session. Meter Calibration:Use for the quarterly calibration day.
26 Text taken directly or in part from Standard Methods (APHA, AWWA, WPCF, 1995).27 Text taken directly or in part from Cole-Parmer Operating Instructions (1996).

Turbidity MeasurementStatus: Active
Date: 07/13/2006Page 206 of 238
1. Obtain standard grade formalin series (<0.1, 20, 100, 800) from Hach Company and implement as outlined in the instructions provided.2. Using four matched sample cells, fill with the each with the appropriate stock standard (0, 20, 100, 800 NTU).3. Insert the blank or 0 NTU standard into the cell compartment. Align the orientation mark on cell with the mark on the
front of the cell compartment. Close the lid.4. Press the power button I/O.5. Press the CAL button. The CAL and S0 icons will be displayed and “0” will flash. 6. Press the READ button. The blank can be forced to zero by pressing the “→” rather than reading the dilution water. The
display will show “S0 NTU” and “↑” key must be pressed to continue with the next standard. If the blank is not forced to zero, the display screen will automatically move to the next standard.
7. The display screen will show S1 and 20 NTU with the 1 flashing.8. Agitate and insert the 20 NTU standard into the cell compartment. Align the orientation mark on cell with the mark on the
front of the cell compartment. Close the lid.9. Press the READ button.10. The display screen will show S2 and 100 NTU with the 2 flashing.11. Agitate and insert the 100 NTU standard into the cell compartment. Align the orientation mark on cell with the mark on
the front of the cell compartment. Close the lid.12. Press the READ button.13. The display screen will show S3 and 800 NTU with the 3 flashing.14. Agitate and insert the 800 NTU standard into the cell compartment. Align the orientation mark on cell with the mark on
the front of the cell compartment. Close the lid.15. Press the READ button.16. Press the CAL button to accept the calibration. The instrument will return to the measurement mode automatically.
1.9 Equipment Operation & Preparation 2
1. The Model 2100P operates on 4 AA-cell batteries. Before going to the field, switch the meter on using I/O power key and check for battery strength. If no reading occurs or if there is a battery symbol flashing in the lower left-hand side of the screen, change all 4 batteries.
2. Clean the sample collection cell; look for scratches or any other factors that may influence light scattering or absorption.
1.10 Sample Collection2
1. Read the Gelex standards prior to reading water samples. Record the Gelex values on the Sampling Episode Sheet. Values should not deviate by more than 5%. 2. Water samples should be collected from mid channel, from a pooled but not stagnant area. Care should be taken to avoid collection of any surface scum. 3. Fill the sample cell to the line with approximately 15-mL of sample.4. Cap the sample cell. Clean the outside of the cell with a soft, lint-free cloth to remove fingerprints and water spots.5. Apply a thin film of silicone oil. Wipe with a soft, lint-free cloth to obtain an even film over the entire surface.6. Press I/O button. Place on flat, steady surface.7. Put the sample cell in the instrument cell compartment so the white diamond or assigned orientation mark aligns with the
raised mark in front of the cell compartment. Close the cover.8. Select manual or automatic range by pressing the RANGE key. The display will show “AUTO RNG” when the
instrument is in the automatic range selection.9. Select signal averaging mode by pressing the SIGNAL AVERAGE key. The display will show “SIG AVG” when the
instrument is using averaging. Use signal average mode if the sample causes a noisy signal (display changes constantly).10. Press READ. The display will show “- - - - NTU” then the turbidity value in NTU. Record the turbidity after the lamp
symbol in the lower left corner of the screen turns off. Record value on the Site Collection Sheet.
1.10.1 Operational Notes1. Air bubbles in the sample will cause false high readings. Before covering the cell with the light shield, observe the sample
in its cell. If finely divided air bubbles are present, refer to the owner’s manual. The Hach owner’s manual provides 4 methods for removing air bubbles. The vacuum method is the preferred option. Letting the sample stand for a period time is not recommended because particles may settle, resulting in a biased reading.
2. If a water sample being tested is supersaturated with oxygen, air bubbles may appear on the sides of the sample cell in sufficient numbers to prevent turbidity measurement. This problem can be corrected by placing one drop of membrane-filtered Triton X-100 Solution in the cell before filling with the water sample.

Turbidity MeasurementStatus: Active
Date: 07/13/2006Page 207 of 238
3. When measuring high amounts of turbidity, it may be necessary to dilute the sample in order to bring it within the range of the instrument. If the sample is extremely turbid or highly colored, the meter may read less than the actual amount of turbidity present. When a sample appears to contain more turbidity than the meter reads, the sample should be diluted with another portion of sample. Diluting with distilled or deionized water may dissolve some of the turbidity. The re-measured turbidity of the diluted sample should then be multiplied by the dilution factor to obtain the turbidity of the original sample. If the accuracy of the reading is still questionable, further dilutions should be conducted.
4. Condensation on the outside of the sample cell may occur under certain humidity and temperature conditions. Condensation will interfere with the sample reading. Let the sample equilibrate to the ambient air temperature for a short period. Use a dry, lint free cloth to wipe the moisture from the outside of the cell. Avoid settling and significant temperature changes; read the sample as soon as possible. Mix the sample thoroughly before measurement.
1.11 Sample Handling & PreservationMeasurement should be performed in situ. However, if measurement is preformed in the laboratory, collect samples in clean glass or HDPE plastic container with zero headspace. Place samples on ice and keep in the dark.
1.12 Sample Preparation and AnalysisThere is a 48 hour holding time for turbidity; it should be measured as soon as possible.
1.13 TroubleshootingIf the initial reading of the Gelex standards is greater than 5% of calibrated value, then the unit and gel standards may need to be recalibrated. Clean the outside of the gel standards and inspect for scratches or other factors that may influence the reading. Consult the QA officer if the problem cannot be resolved. Do not recalibrate the unit using the gel standards. Record the reading of the gel standards again after all the samples have been read.
For other error messages or problems, refer to the owner’s manual
1.14 Data Acquisition, Calculation & Data ReductionNot applicable
1.15 Computer Hardware & SoftwareNot applicable
1.16 Data Management & Records Management
1.16.1 Field NotationAll field calibration and calibration checks should be recorded on the Sampling Episode Sheet (see SOP Appendix: Data Sheets). All turbidity measurements made at each site should be recorded on the Site Collection Sheet (see SOP Appendix: Data Sheets). Data should be recorded following procedures outlined in the Procedures for Completing Field Information SOP.
1.16.2 Chain of Custody ProcedureTurbidity should be measured in the field; therefore, no Chain of Custody form is required. However, if the laboratory is going to measure pH, then follow the procedures described in the Chain of Custody and Sample Labeling SOP.
Turbidity MeasurementStatus: Active
Date: 07/13/2006Page 208 of 238
2.0 QA/QC SECTION
2.1 TrainingTraining of field personnel will be done through dry run exercises in the laboratory to familiarize them with instrument operation, calibration and maintenance. All operators are required to become familiar with the SOP documents and owner’s manual. Prior to solo sample collection, field personnel are evaluated in a field setting for proper use of equipment and sample collection protocol. Annual field audits are performed on sample collectors following procedures outlined in the Quality Management Plan.
2.2 Maintenance The unit is not waterproof, avoid getting it wet--do not submerge unit Keep the unit as clean as possible. Clean outside of unit with a moist cloth. Avoid prolonged exposure to direct sunlight and ultraviolet light. Wash sample cells with non-abrasive laboratory detergent and rinse with DI water. If the cell becomes iron stained, acid
wash using HCl. Replace sample cells as needed when they become scratched or stained. Batteries will last for approximately 180 to 300 tests depending on the measurement mode selected. Do not leave batteries
stored in the unit for prolonged periods (> 1 month).
2.3 QC ProceduresThese meters should be check and calibrated against standards each quarter following procedure as directed by the QA officer at a QA and meter calibration session. Values will be recorded in the equipment logbook. Each quarter the meters will be calibrated with primary formazin standards (<0.1, 20, 100, and 800). At that time, the Gelex standards will be assigned calibration values. The sampling cells will also be calibrated to find the lowest turbidity reading for that cell, and also for calibrating multiple calibration cells with each other.
The collection of QA samples should follow the procedure specified in the Preparation of Spike, Duplicate, and Blank Samples for Routine QA SOP. Results will be recorded in the field notebook.
3.0 REFERENCES
APHA, AWWA, and WPCF (1995) Standard Methods for the Examination of Water and Wastewater, 19th edition, eds. L.S. Clesceri, A.E. Greenberg, and R.R. Trussell, American Public Health Association, Washington, D.C.
Hach (1996), “Portable Turbidimeter Model 2100P Instrument and Procedure Manual”, Hach Company, Loveland Colorado.

Turbidity MeasurementStatus: Active
Date: 07/13/2006Page 209 of 238
4.0 APPENDIX A
STANDARD OPERATING PROCEDUREField Summary
Turbidity Measurement
Instrument/Method CalibrationRead the Gelex standards prior to initial sample collection. Calibration checks should be conducted prior to additional collections at approximately 4 hour intervals. If the calibration check is greater that 5% of the Gelex standard, the meter probably needs to be recalibrated. DO NOT use the Gelex standards to recalibrate the unit. If no reason for the erroneous values can be determined, consult the QA Officer. Samples can be collected for laboratory analysis (48 hour holding period).
Equipment Operation & Preparation The Model 2100P operates on 4 AA-cell batteries. Before going to the field, switch meter on using I/O power key and
check for battery strength. If no reading occurs or if there is a battery symbol flashing in the lower left-hand side of the screen, change all 4 batteries.
Clean the sample collection cell, look for scratches or any other factors which may influence light scattering or absorption.
Sample Collection Read the Gelex standards prior to reading water samples. Record the Gelex values on the Sampling Episode Sheet.
Values should not deviate by more than 5%. Water samples should be collected from mid channel, from a pooled but not stagnant area. Care should be taken to avoid
collection of any surface scum. Fill the sample cell to the line with approximately 15-mL of sample. Cap the sample cell. Clean the outside of the cell with a soft, lint-free cloth to remove fingerprints and water spots. Apply a thin film of silicone oil. Wipe with a soft, lint-free cloth to obtain an even film over the entire surface. Press I/O button. Place on flat, steady surface. Put the sample cell in the instrument cell compartment so the white diamond or orientation mark aligns with the raised
mark in front of the cell compartment. Close the cover. Select manual or automatic range by pressing the RANGE key. The display will show “AUTO RNG” when the
instrument is in the automatic range selection Select signal averaging mode by pressing the SIGNAL AVERAGE key. The display will show “SIG AVG” when the
instrument is using averaging. Use signal average mode if the sample causes a noisy signal (display changes constantly). Press READ. The display will show “- - - - NTU” then the turbidity value in NTU. Record the turbidity after the lamp
symbol in the lower left corner of the screen turns off. Record value on the Site Collection Sheet.
Operational Notes Air bubbles in the sample will cause false high readings. Before covering the cell with the light shield, observe the sample
in its cell. If finely divided air bubbles are present, consult the owner’s manual. The Hach owner’s manual provides 4 methods for removing air bubbles. The vacuum method is the preferred option. Letting the sample stand for a period time is not recommended because the particles may settle, resulting in a biased reading.
If the water sample being tested is supersaturated with oxygen, air bubbles may appear on the sides of the sample cell in sufficient numbers to prevent turbidity measurement. This problem can be corrected by placing one drop of membrane-filtered Triton X-100 Solution in the cell before filling with the water sample.
When measuring high amounts of turbidity, it may be necessary to dilute the sample in order to bring it within the range of the instrument. If the sample is extremely turbid or highly colored, the meter may read less than the actual amount of turbidity present. When a sample appears to contain more turbidity than the meter reads, the sample should be diluted with another portion of sample that has been filtered. Diluting with distilled or deionized water may dissolve some of the turbidity. The re-measured turbidity of the diluted sample should then be multiplied by the dilution factor to obtain the turbidity of the original sample. If the accuracy of the reading is still questionable, further dilutions should be conducted.
Condensation on the outside of the sample cell may occur under certain humidity and temperature conditions. Condensation will interfere with the sample reading. Let the sample equilibrate to the ambient air temperature for a short period. Use a dry, lint free cloth to wipe the moisture from the outside of the cell. Avoid settling and significant temperature changes; read the sample as soon as possible. Mix the sample thoroughly before measurement.
Vehicle Use & MaintenanceStatus: Active
Date: 07/13/2006Page: 210 of 238
OKLAHOMA CONSERVATION COMMISSIONWATER QUALITY DIVISION
STANDARD OPERATING PROCEDURE
VEHICLE USE AND MAINTENANCE

Vehicle Use & MaintenanceStatus: Active
Date: 07/13/2006Page: 211 of 238
1.0 PROCEDURAL SECTION
1.1 Scope and ApplicationAll vehicles in the water quality fleet have an individual staff member responsible for its maintenance. Other individuals using the vehicles must follow a set of guidelines to facilitate the process. This document will serve as guidance to those responsible for the care of OCCWQ vehicles and their proper usage.
1.2 PolicyThis SOP addresses the vehicle driving policy and the maintenance and upkeep of Water Quality vehicles.
1.2.1 Driving Policya. vehicle check-out sheetb. fuelingc. insurance d. accident reportse. acceptable vehicle usage
1.2.1a Vehicle Check-Out Drivers must be employed by the Oklahoma Conservation Commission and possess a valid Oklahoma driver’s
license. Any vehicle may be checked-out for use; however, some vehicles are regularly used by certain individuals. You
must check with that individual before taking the vehicle. Refer to Appendix 3 for a copy of the pre-assigned vehicles list.
Vehicular check-out policy is as follows:i. Check out the vehicle by signing your initials to the schedule, as maintained by OCCWQ Executive
Secretary.ii. On the date reserved, obtain the keys and vehicle book
iii. Record the following information in the vehicle book: Date Driver Odometer starting and ending mileage Total miles traveled Travel location Number of people traveling Purpose for travel
iv. Return book at the end of the trip.
1.2.1b Fueling Fuel can only be purchased using a COMDATA card that has been assigned to the vehicle to be driven. This card
should be located on the key chain. This credit card is not transferable and must be used only with the vehicle bearing the number imprinted on the card. The credit card will guarantee the service station, oil company, and the driver that each sales slip will have all the necessary information for immediate processing and prompt payment.
Not all service stations will honor the COMDATA card. The driver should clear this card with the attendant before pumping gas.
After fueling, follow the instructions provided by the attendant. You will need to enter the pin number for the vehicle and the vehicle mileage.
It is not necessary to keep the receipt of the transaction Record the expense in the vehicle book
1.2.1c Vehicle Insurance The office of Public Affairs, Risk Management Division, will provide liability insurance for all State Motor Pool
vehicles. Protection is provided to the State of Oklahoma and state employees for any liability resulting from accidents arising out of the use of a state-owned vehicle. The insurance will pay all sums that the State or the driver becomes legally obligated to pay (see Appendix 1 for a copy of the policy). Also, the insurance will cover the three NRCS vehicles on loan to the Water Quality Division.
The State does not provide for any type of medical insurance for the state driver or any passengers in the vehicle.

Vehicle Use & MaintenanceStatus: Active
Date: 07/13/2006Page: 212 of 238
The State does not provide for the loss of personal property by fire or theft. Risk Management does insure the loss of State property in transit.
1.2.1d Accident Reports In case of an accident follow the procedure listed below:
i. Call an ambulance if necessaryii. Call the police to report the accident
iii. Fill out a written report. The report form is the Risk Management Accident Reporting Form (see Appendix 2).
iv. Call the State Motor Pool immediately at (405)521-2204v. Call Risk Management and give Risk Management’s phone number (405)521-4999 to the other parties
involved. Risk Management must be contacted within 24 hours.vi. Contact the Oklahoma Conservation Commission.
You must fill out the Risk Management Accident form even if no other vehicle is involved. The completed form must be turned in to the State Motor Pool.
1.2.1e Vehicle Usage All drivers of Motor Pool Vehicles must possess a valid driver’s license. Motor Pool vehicles may only be used for State business—no personal use. Drivers must obey all traffic laws. The use of cell phones is only permitted while the vehicle is safely and legally parked on the side of the road Drivers and passengers must wear seatbelts at all times while the vehicle is in motion. No unauthorized individual may be permitted to drive a State vehicle. Passengers must be state or district employees or directly associated with an authorized program activity such as a
training program or a program volunteer. Drivers are not allowed to pick-up hitchhikers. Failure to comply with these requirements will be taken into consideration in determining whether an employee is
within the scope of employment for purposes of tort liability for motor vehicle accidents. Employees acting within the scope of their employment will ordinarily not be liable for damages in such cases.
1.2.2 Vehicle Maintenance Policy a. Care and Maintenanceb. Repairing Damagec. Vehicle Mileage
1.2.2a Care and Maintenancei. Vehicles should be clean and not cluttered with equipment and trash. Clean trash and equipment out of the
vehicle daily; wash the vehicles monthly or as needed. Never leave vehicle with less than ¼ of a tank of fuel.ii. The maintenance schedule in the owner’s manual should be followed to maintain optimum vehicle performance
and efficiency. This includes but is not limited too: Engine oil and filter changes Tire and wheel rotation Replacing spark plugs and wires Belt inspection and replacement
iii. All maintenance items will be carried out regularly and recorded in the maintenance log located in the front of all vehicle logbooks (attachment). Responsible parties for all vehicles stationed in or near the Oklahoma City metro or at District Offices must call the State Motor Pool at (405) 521-2206 to get prior authorization for any maintenance work. This includes oil changes, car washes and any repairs. Try to do this where the COMDATA card is honored.
iv. Always obtain an estimate for the service to be performed before having the work started.v. Call the State Motor Pool to obtain a purchase order number, and make sure the number is written on the
invoice.vi. Make sure the invoice is mailed to the State Motor Pool, 3301 North Santa Fe, Oklahoma City, Oklahoma
73118.vii. Vehicle logbooks are to be kept with the vehicles with entries made promptly.

Vehicle Use & MaintenanceStatus: Active
Date: 07/13/2006Page: 213 of 238
1.2.2b Repairing Damage i. Emergency repairs must be reported to the Motor Pool on the day the emergency occurs. Call the Motor Pool
(521-2206) and get prior authorization for any repair. If the emergency is after hours, it must be reported on the first working day following the emergency.
ii. If the vehicle is damaged and repair work is needed, repairs should be made promptly. If the vehicle is not drivable, call a local car dealership or garage and have the vehicle towed in, the wrecker service will bill motor pool for this service. Have the garage evaluate the vehicle's condition and make a repair estimate. Call the motor pool at (405)521-2206 with this estimate to obtain a purchase order for this repair. To obtain a purchase order you will need the following information:
Vendor's name, address, and telephone number Vehicle number Quantity and cost of each item used Labor time and charge No state sales tax is to be charged
iii. Direct all invoices and sales slips to State Motor Pool, 3301 North Santa Fe, Oklahoma City, Oklahoma, 73118.
1.2.2c Vehicle Mileage i. Vehicle mileage will be reported to the OCCWQ Executive Secretary (Ann Craven) on the last working day of
the month.ii. Mileage will be recorded in the vehicle maintenance log with every use of the vehicle.

Vehicle Use & MaintenanceStatus: Active
Date: 07/13/2006Page: 214 of 238
Appendix 1: Vehicle Insurance

Vehicle Use & MaintenanceStatus: Active
Date: 07/13/2006Page: 215 of 238
Appendix 2: Vehicle Accident Form

Vehicle Use & MaintenanceStatus: Active
Date: 07/13/2006Page: 216 of 238

Vehicle Use & MaintenanceStatus: Active
Date: 07/13/2006Page: 217 of 238

Vehicle Use & MaintenanceStatus: Active
Date: 07/13/2006Page: 218 of 238

Vehicle Use & MaintenanceStatus: Active
Date: 07/13/2006Page: 219 of 238
Appendix 3 Vehicle Use Agreement Form
I understand the vehicle policy presented in this SOP and agree to follow the procedures specified.Signature Date
_______________________________________________ _____________
_______________________________________________ _____________
_______________________________________________ _____________
_______________________________________________ _____________
_______________________________________________ _____________
_______________________________________________ _____________
_______________________________________________ _____________
_______________________________________________ _____________
_______________________________________________ _____________
_______________________________________________ _____________
_______________________________________________ _____________
_______________________________________________ _____________
_______________________________________________ _____________
_______________________________________________ _____________
_______________________________________________ _____________
_______________________________________________ _____________
_______________________________________________ _____________
_______________________________________________ _____________
_______________________________________________ _____________
_______________________________________________ _____________
_______________________________________________ _____________
_______________________________________________ _____________
_______________________________________________ _____________
_______________________________________________ _____________
_______________________________________________ _____________

Vehicle Use & MaintenanceStatus: Active
Date: 07/13/2006Page: 220 of 238
YEAR MAKERESPONSIBLE
TAG # LOCATIONMOTOR
VEHICLE I.D. #PARTY POOL #
2007 Dodge Dakota, Silver, 4 door 4x4 Ed Crall 1-33116 Weatherford 80-182 1D7HW28P675248752003 Dodge Dakota (Atlantic Blue) Monty Ramming 1-29166 Ft. Cobb 80-940 1D7HG32X03S2983472008 Dodge Dakota (Silver) 4x4, 4dr Marti Mefford 1-34474 Jay 80-228 1D3HW38K3856372062008 Dodge Ram , Black, 4 door, 4x4 Gina Levesque 1-34536 Tahlequah 80-267 1D3HV13T2937413382007 Dodge Dakota, Red, 4 door 4x4, V-8 Jill Ashbrener 1-33117 Jay 80-183 1D7HW28P87S248762006 Ford Taurus SE (White) Kevin Gustavson 1-27237 Tulsa 05-789 1FAFP53236A2538382008 Toyota Camry (Hybrid) Lt. Green WQ Office 1-34459 OKC 05-051 4T1BB46K59U0830872003 Honda Civic (Hybrid) Tan WQ Office 1-29149 OKC 05-580 JHMES966X3S0033712008 Dodge Dakota (Stone White) 4x4, 4dr Trampas Tripp 1-32991 Jay 80-229 1D3HW38K08S6387482009 Chevy Silverado, White, 4dr 4x4 Jeanette Lamb 11088 OKC 80-281 1GCEK19019Z2287052008 Dodge Dakota (Silver) 4x4, 4dr Leonard Moore 1-34472 Bristow 80-232 1D3HW38K1856372052004 Chevy, 4 door, 4x4, Pewter Brooks Tramell 1-20998 OKC 80-971 1GCEK19V34E3373102009 Chevy Silverado, Gray Stone, 4dr 4x4 Brooks Tramell 11089 OKC 80-280 1GCEK19089Z2282472007 Chevy Silverado, L. Blue, 4 door 4x4 Wes Shockley 1-33043 Bristow 80-137 1GCEK19097E5575302008 Dodge Dakota (Silver) 4x4, 4dr Daniel Franke 1-34468 Jay 80-237 1D3HW38KX856372042007 Chevy Colorado, Maroon, 4 door 4x4 Debi Carnott 1-33079 Geary 80-149 1GCDT19ES782366702007 Chevy Silverado, Pewter, 4 door 4x4 Jason Ramming 1-33029 Hinton 80-134 IGCEK19097E5545942009 Chevy Silverado, Blue Granite, 4dr 4x4 Jerry Carr 11087 OKC 80-282 1GCEK19029Z2274152005 Dodge Ram 1500, 4x4, White, 4 door Tashina Mitchell 1-27950 Stilwell 80-021 1D7HU18PX5J6358772009 Honda CRV (Ice-Blue) Cheryl Cheadle 10609 Bristow 80-272 5J6RE38379L0075602009 Chevy Silverado, Deep Ruby, 4dr 4x4 Kim Shaw 11090 OKC 80-279 1GCEK1901972267132008 Dodge Dakota (Silver) 4x4, 4dr Bullit Farris 1-34473 Tahlequah 80-227 1D3HW38K88S6372032007 Dodge Dakota, Blue, 4 door 4x4 Jean Lemmon 1-33118 Bristow 80-184 1D7HW28K47S2428772008 Dodge Dakota (Silver) 4x4, 4dr Ashley Rhea 1-34464 Tahlequah 80-240 1D3HW38K68S6372022008 Dodge Dakota (Black) 4x4, 4dr Jerry Starkey 1-32995 Jay 80-231 1D3HW38K58S6372071997 Ford F350 XL, 1 Ton Wagoner Co. CD 1-11411 Wagoner OWN 3FEKF38G3VMA357831995 Ford F350 XL, 1 Ton 4x4 w/c/c Grady Co. CD 1-18918 Chickasha OWN 2FDKF38C8SCA69472

Winkler TitrationStatus: Active
Date: 07/13/2006Page 221 of 238
OKLAHOMA CONSERVATION COMMISSIONWATER QUALITY DIVISION
STANDARD OPERATING PROCEDURE
WINKLER TITRATION FOR DISSOLVED OXYGEN
(HACH METHOD 8229)

Winkler TitrationStatus: Active
Date: 07/13/2006Page 222 of 238
1.0 PROCEDURAL SECTION
1.1 Scope and ApplicationThis method is used during the quarterly QA/QC session as a check of the accuracy (bias) of the field dissolved oxygen meters.
1.2 Summary of MethodThe manganous ion reacts with dissolved oxygen present in an alkaline solution to manganese (IV) oxide hydroxide flocculent. Azide is added to suppress any inference from nitrite. The solution is acidified and the manganese (IV) floc is reduced by iodide to produce free iodine as I3
- in proportion to the oxygen concentration. The liberated iodine is then titrated to the starch-iodine end point with sodium thiosulfate. This summary was taken directly from Hach (1992).
1.2.1 DefinitionsPowder Pillows pre-measured amounts of reagents in plastic pillow-like containers
1.3 Health and Safety WarningsRubber gloves and safety glasses should be worn during the procedure. The chemicals used during this procedure are eye and skin irritants. Do not eat or smoke around these chemicals—Azide is a Kreb’s cycle poison at low concentrations.
1.4 CautionsNone
1.5 InterferenceNitrite interference is eliminated when Azide reagents are used. Other reducing or oxidizing substances may act as inferences.
1.6 Personnel QualificationPersonnel should be trained in the proper use of burets, pipets, graduated cylinders, and indicator solutions. The QA Officer is responsible for approving personnel to perform this procedure.
1.7 Apparatus & Materials
REAGENTS QUANTITY/TEST HACH CATALOGUE NUMBERAlkaline Iodine-Azide Powder Pillows 1 pillow 1072-68Manganous Sulfate Powder Pillows 1 pillow 1071-68Sodium Thiosulfate Standard (0.0250 N) varies w/ titration 24093-16Starch Indicator Solution 2 mL 349-37Sulfamic Acid Powder Pillow 1 pillow 1073-99Iodate-Iodide Standard Solution (0.00125 N)1 200 mL 401-11
1: The Iodate-Iodide Standard Solution (0.00125 N) is used for determining the quality of the Sodium Thiosulfate Standard. This reagent is only needed when the strength of the Sodium Thiosulfate Standard is being evaluated.
EQUIPMENT QUANTITY/EXPERIMENT
HACH CATALOGUE NUMBER
300-mL BOD bottle with stopper 3 621-0025-mL Buret, (Nalgene Class B)1 1 14059-40250-mL graduated cylinder (Class B)2 1 508-46250-mL Erlenmeyer flask 3 505-46Powder pillow clippers 1 968-00Buret clamp, double 1 328-00Support Stand 1 563-00
1: Although a Class A buret is mentioned in the Hach procedure, a plastic Class B was selected for safety, economics, and lack of consequential difference in accuracy. The Class A burets have a tolerance of ±0.03 ml vs. ±0.06 ml for Class B.
2: A Class B graduated cylinder was selected because the difference between the Class A and Class B cylinders was within the tolerance limits (Class A ±0.8 ml. vs. Class B ±1.4 mL) of the experiment.

Winkler TitrationStatus: Active
Date: 07/13/2006Page 223 of 238
1.8 Procedure (Hach, 1992)For technical assistance, call Hach at (800) 227-4224.
1. Collect water sample in a clean 300-mL BOD bottle with glass stopper. The water sample must be collected to minimize aeration of sample during bottle filling. If water being tested is not near saturation, collect the sample away from air water interface.
2. Add the contents of one Manganous Sulfate Powder Pillow and one Alkaline Iodide-Azide Reagent Powder Pillow.3. Immediately insert the stopper so that no air is trapped in the bottle. Invert several times to mix. A flocculent
precipitate with form. It will be orange-brown if oxygen is present and white if oxygen is absent.4. Wait until the floc has settled. Invert the bottle again several times and wait until is has settled a second time.
Allowing the floc to settle twice assures complete reaction. Results will not be affected if the floc does not settle.5. Remove the stopper and add the contents of one Sulfamic Acid Powder Pillow. Replace the stopper without trapping
air in the bottle and invert several times to mix. The floc will dissolve and leave a yellow color if oxygen is present. (One mL of concentrated H2SO4 can be substituted for one Sulfamic Acid Powder Pillow.)
6. Measure 200 mL of the prepared sample in a graduated cylinder7. Pour the contents of the graduated cylinder into a 250-mL Erlenmeyer flask.8. Fill a 25-mL buret to the zero mark with 0.025 N Sodium Thiosulfate Solution9. Titrate the sample with the 0.025 N Sodium Thiosulfate Solution until the solution turns a pale yellow color.10. Add two dropperfuls of starch indicator (2 mL) and swirl to mix.11. Continue to titrate until the solution changes from dark blue to colorless.12. Record the final mL value for 0.025 N Sodium Thiosulfate Solution. Determine the mg/L DO:
1 mL titrant = 1 mg/L DO
1.9 Data Management & Records Management
1.9.1 Data NotationResult of the Winkler titration should be recorded on the QA Officer’s data sheet. This information will be used to check the meter values recorded by the field personnel.
1.9.2 Chain of Custody ProcedureNot Applicable.

Winkler TitrationStatus: Active
Date: 07/13/2006Page 224 of 238
2.0 QA/QC SECTION
2.1 TrainingThe QA Officer will assign and/or train personnel to conduct the Winkler titration. The experimenter must be familiar with the procedure described in the Hach Method 8229 (Hach, 1992). The experimenter must demonstrate proficiency prior to conducting the test during the quarterly QA session.
2.2 MaintenanceIt is the experimenter’s responsibility to ensure the reagents are available and not expired, the glass ware is clean and intact, and that all of the appropriate items necessary to conduct the experiment are available.
2.3 QC ProceduresThe strength of the Sodium Thiosulfate Solution should be checked at least once a year until it expires. An iodate-iodide standard solution can be used as a check. Hach sells a 0.00125 N solution, which is equivalent to 10 mg/L as DO.
1. Measure 200 mL of 0.00125 N Iodate-Iodide Standard Solution. Pour into a 250-erlenmeyer flask.2. Add the contents of one Sulfamic Acid Powder Pillow.3. Fill a 25-mL buret to the zero mark with 0.025 N Sodium Thiosulfate Solution.4. Titrate the sample with 0.025 N Sodium Thiosulfate Solution until the solution turns colorless.5. The volume of the titrant should be 10 mL. If it is greater than 10.5 mL, the titrant should be discarded and new
Sodium Thiosulfate Solution should be purchased.
3.0 REFERENCES
Hach (1992) Water Analysis Handbook, Hach Company, Loveland Colorado pp.455-457.

APPENDIX: DATA SHEETSPage 225 of 238
SOP APPENDIX:DATA SHEETS

APPENDIX: DATA SHEETSPage 226 of 238

APPENDIX: DATA SHEETSPage 227 of 238

APPENDIX: DATA SHEETSPage 228 of 238
APPENDIX: DATA SHEETSPage 229 of 238

APPENDIX: DATA SHEETSPage 230 of 238

APPENDIX: DATA SHEETSPage 231 of 238

APPENDIX: DATA SHEETSPage 232 of 238

APPENDIX: DATA SHEETSPage 233 of 238

APPENDIX: DATA SHEETSPage 234 of 238
APPENDIX: DATA SHEETSPage 235 of 238

APPENDIX: DATA SHEETSPage 236 of 238