appendix 6 summary of useability - sax institute
TRANSCRIPT
Wellbeing indicators across the life cycle
Appendix 6
Summary of useability
2 | APPENDIX 6 —SUMMARY OF USEABILITY | SAX INSTITUTE
Contents Domain: Economic .................................................................................................................................................................................... 3
Domain: Home .......................................................................................................................................................................................... 5
Domain: Health ......................................................................................................................................................................................... 6
Domain: Empowerment............................................................................................................................................................................ 9
Domain: Education and skills ................................................................................................................................................................. 10
Domain: Social and community ............................................................................................................................................................ 11
Domain: Safety ........................................................................................................................................................................................ 13
Domain: Health – Children ..................................................................................................................................................................... 14
Domain: Safety – Children ..................................................................................................................................................................... 16
Domain: Education and skills – Children .............................................................................................................................................. 17
Domain: Economic – Children ................................................................................................................................................................ 18
Domain: Social and community – Children .......................................................................................................................................... 19
Domain: Health – Youth ......................................................................................................................................................................... 20
Domain: Social and community – Youth .............................................................................................................................................. 24
Domain: Safety – Youth .......................................................................................................................................................................... 25
Domain: Economic – Youth .................................................................................................................................................................... 26
Domain: Economic – Older adults ......................................................................................................................................................... 27
Domain: Social and community – Older adults ................................................................................................................................... 28
Domain: Education and skills - Older adults ........................................................................................................................................ 29
Domain: Home – Older adults ............................................................................................................................................................... 30
Domain: Health – Older adults .............................................................................................................................................................. 31
APPENDIX 6 —SUMMARY OF USEABILITY | SAX INSTITUTE | 3
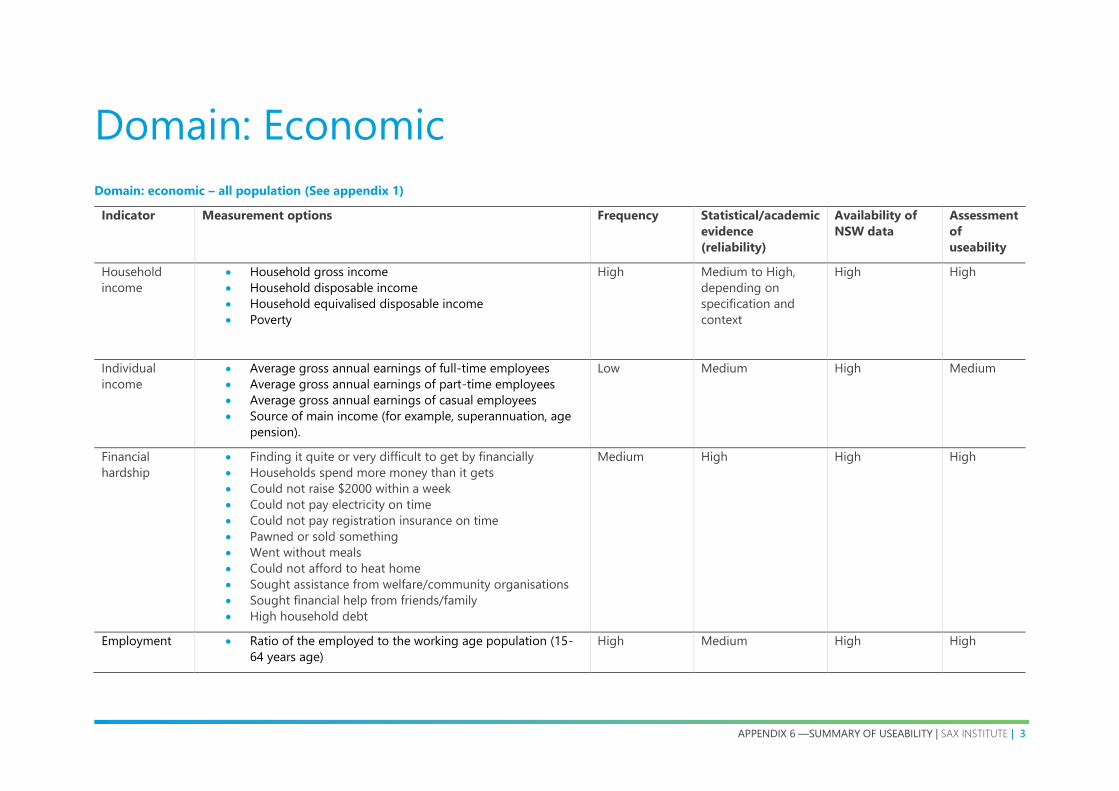
Domain: Economic
Domain: economic – all population (See appendix 1)
Indicator Measurement options Frequency Statistical/academic
evidence
(reliability)
Availability of
NSW data
Assessment
of
useability
Household
income
• Household gross income
• Household disposable income
• Household equivalised disposable income
• Poverty
High Medium to High,
depending on
specification and
context
High High
Individual
income
• Average gross annual earnings of full-time employees
• Average gross annual earnings of part-time employees
• Average gross annual earnings of casual employees
• Source of main income (for example, superannuation, age
pension).
Low Medium High Medium
Financial
hardship
• Finding it quite or very difficult to get by financially
• Households spend more money than it gets
• Could not raise $2000 within a week
• Could not pay electricity on time
• Could not pay registration insurance on time
• Pawned or sold something
• Went without meals
• Could not afford to heat home
• Sought assistance from welfare/community organisations
• Sought financial help from friends/family
• High household debt
Medium High High High
Employment • Ratio of the employed to the working age population (15-
64 years age)
High Medium High High

4 | APPENDIX 6 —SUMMARY OF USEABILITY | SAX INSTITUTE
• For older people
• Employment rates for older people
Unemployment • Unemployment rate / Ratio of the employed to the working
age population (15-64)
• Long term unemployment rate (Those who have been
unemployed for one year or more over the labour force of
the same age)
• Probability of becoming unemployed (The annual inflow
into unemployment)
High High High High
Working hours
(or health
domain)
• Percentage of employees working more than a specific
threshold in a week (for example 50 hours).
Low Medium High Medium
Job satisfaction • Self-reported satisfaction with work
• Satisfaction with component of jobs such as:
• (pay hours of work, future prospect such as promotion
and job security, difficulty of the job,
• job content such as interest, prestige and independence
and interpersonal relationships (with co-workers and with
management).
Low Medium High Medium
Household
Wealth
• Net household financial wealth/net worth per capita
• Median wealth per household, including pension wealth
Medium Medium High Medium
Inflation rate • Inflation rate (as measured by the Consumer Prices Index) Low Medium High Medium
APPENDIX 6 —SUMMARY OF USEABILITY | SAX INSTITUTE | 5
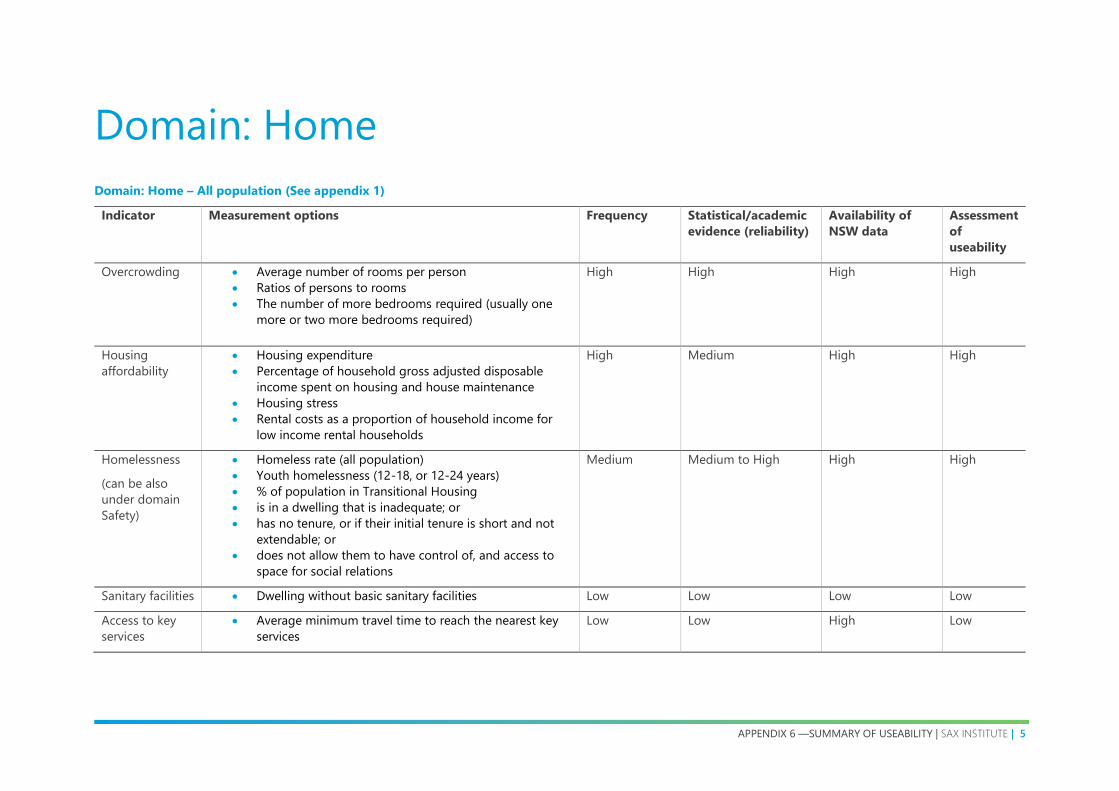
Domain: Home
Domain: Home – All population (See appendix 1)
Indicator Measurement options Frequency Statistical/academic
evidence (reliability)
Availability of
NSW data
Assessment
of
useability
Overcrowding • Average number of rooms per person
• Ratios of persons to rooms
• The number of more bedrooms required (usually one
more or two more bedrooms required)
High High High High
Housing
affordability
• Housing expenditure
• Percentage of household gross adjusted disposable
income spent on housing and house maintenance
• Housing stress
• Rental costs as a proportion of household income for
low income rental households
High Medium High High
Homelessness
(can be also
under domain
Safety)
• Homeless rate (all population)
• Youth homelessness (12-18, or 12-24 years)
• % of population in Transitional Housing
• is in a dwelling that is inadequate; or
• has no tenure, or if their initial tenure is short and not
extendable; or
• does not allow them to have control of, and access to
space for social relations
Medium Medium to High High High
Sanitary facilities • Dwelling without basic sanitary facilities Low Low Low Low
Access to key
services
• Average minimum travel time to reach the nearest key
services
Low Low High Low
6 | APPENDIX 6 —SUMMARY OF USEABILITY | SAX INSTITUTE
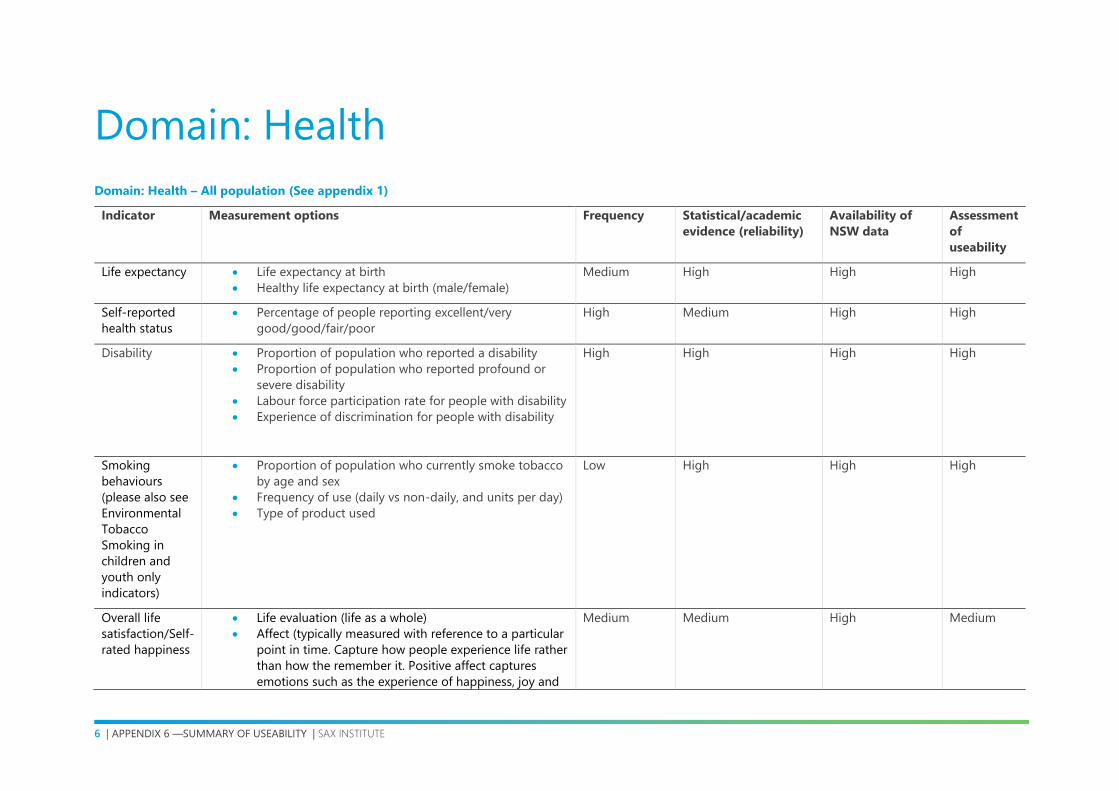
Domain: Health
Domain: Health – All population (See appendix 1)
Indicator Measurement options Frequency Statistical/academic
evidence (reliability)
Availability of
NSW data
Assessment
of
useability
Life expectancy • Life expectancy at birth
• Healthy life expectancy at birth (male/female)
Medium High High High
Self-reported
health status
• Percentage of people reporting excellent/very
good/good/fair/poor
High Medium High High
Disability • Proportion of population who reported a disability
• Proportion of population who reported profound or
severe disability
• Labour force participation rate for people with disability
• Experience of discrimination for people with disability
High High High High
Smoking
behaviours
(please also see
Environmental
Tobacco
Smoking in
children and
youth only
indicators)
• Proportion of population who currently smoke tobacco
by age and sex
• Frequency of use (daily vs non-daily, and units per day)
• Type of product used
Low High High High
Overall life
satisfaction/Self-
rated happiness
• Life evaluation (life as a whole)
• Affect (typically measured with reference to a particular
point in time. Capture how people experience life rather
than how the remember it. Positive affect captures
emotions such as the experience of happiness, joy and
Medium Medium High Medium

APPENDIX 6 —SUMMARY OF USEABILITY | SAX INSTITUTE | 7
contentment. Negative affect comprises the experience
of unpleasant emotional states such as sadness, anger,
fear and anxiety.
• Eudaimonia (good psychological functioning,
flourishing)
Mental Health • Mental health: been a nervous person, felt so down,
been a happy person etc.
• SF 36: mental health, vitality, emotional role functioning
• Levels of psychological distress: measured by the
Kessler 10 (K10) scale
• Prevalence of mental disorders among young people
aged 16–24 years
• Health service (GP, hospitalisation, community health
service) use for mental health problems
• Diagnosed with serious illness - Depression or anxiety
• Takes prescription medication for - Depression or
anxiety
• Depression / Anxiety
Medium High High High
Leisure activities
(sports
participation)
(can be also
under Social
and Community
domain)
• Participation in 30 mins of moderate intensity sport,
once per week
Medium Medium High Medium
Time devoted to
leisure and
personal care
(can be also
under Social
and Community
domain)
• Time use for recreation and leisure as time or % of total
time
Low Medium High Medium

8 | APPENDIX 6 —SUMMARY OF USEABILITY | SAX INSTITUTE
Exposure to air
pollution
• Annual exposure to fine particulate matter (PM) air
pollution
• Average air quality index for capital cities
Low High Medium – possibly
admin data
Medium
Climatic
variability and
climatic change
• CO2 emmissions from motor vehicles, industry and
agriculture
• Greenhouse gas (GHG) emissions
Low Medium Medium – possibly
admin data
Medium
Waste from
households that
is recycled
• Solid waste/capita
• Sewage/capita
• Harzardous waste
Low Low Medium – possibly
admin data
Low

APPENDIX 6 —SUMMARY OF USEABILITY | SAX INSTITUTE | 9
Domain: Empowerment
Domain: Empowerment – All population (See appendix 1)
Indicator Measurement options Frequency Statistical/academic
evidence (reliability)
Availability of
NSW data
Assessment
of
useability
Voter turn-out
• Number of votes cased over the voting-age
population
• Number of votes casted over the population
registered to vote
• Number of spoilt ballots?
Medium Medium High Medium

10 | APPENDIX 6 —SUMMARY OF USEABILITY | SAX INSTITUTE
Domain: Education and skills
Domain: Education and skills – All population (See appendix 1)
Indicator Measurement options Frequency Statistical/academic
evidence (reliability)
Availability of
NSW data
Assessment
of
useability
Educational
attainment
• Percentage of adults with at least upper secondary
education
• Proportion of people aged 25-64 years with a vocational
or higher education qualification
• Mean Years of Schooling (UNDP uses this indicator as
an HDI component)
• The average number of completed years of education of
a country’s population, excluding years spent repeating
individual grades for the population aged 25 years and
older.
• % of older people who completed Year 12
• % of older people who completed Year 10
High Medium High High
Student’s
cognitive skills
• Programme for International Student Assessment (PISA)
mean score for reading, mathematics and science
• NAPLAN– Literacy and Numeracy
• International Mathematics and Science Study (TIMMS)
and Progress in International Reading Literacy Study
(PIRLS)
• Australian Early Development Index (AEDI) and
Australian Early Development Census (AEDC) –
Language and Cognitive Skills component
High Medium High High
Those not in
education,
employment or
training (NEET)
• The percentage of the population of a given age group
and gender who is not employed and not involved in
further education or training.
Low Medium High Medium

APPENDIX 6 —SUMMARY OF USEABILITY | SAX INSTITUTE | 11
Domain: Social and community
Domain: Social and community – All population (See appendix 1)
Indicator Measurement options Frequency Statistical/academic
evidence (reliability)
Availability of
NSW data
Assessment
of
useability
Trust in
Government
• % of population in certain age group who report
trust in government (local/federal?)/the
parliament/politicians/the judicial system
Low Medium High Medium
Perceived social
network support
• Percentage of people who have relatives or friends
they can count on
• Percentage of people who report having to lean
on in times of trouble / someone to confide in
High Medium High High
Relationship with
partner
• % of population who report satisfied with their
partner
Low Medium High Medium
Feelings of
loneliness
• % of population who report often feeling lonely Low Medium High Medium
Volunteering
(more than once
in the last 12
months)
• % of population who volunteer Medium High High High
Feeling of sense of
belonging to their
neighbourhood
• % of population who feel belong to their
community/neighbourhood
Low Medium Medium Medium
Engagement with
/ participation in
• % people attending events such as fetes, shows,
festivals or other community events
Low Medium High Medium
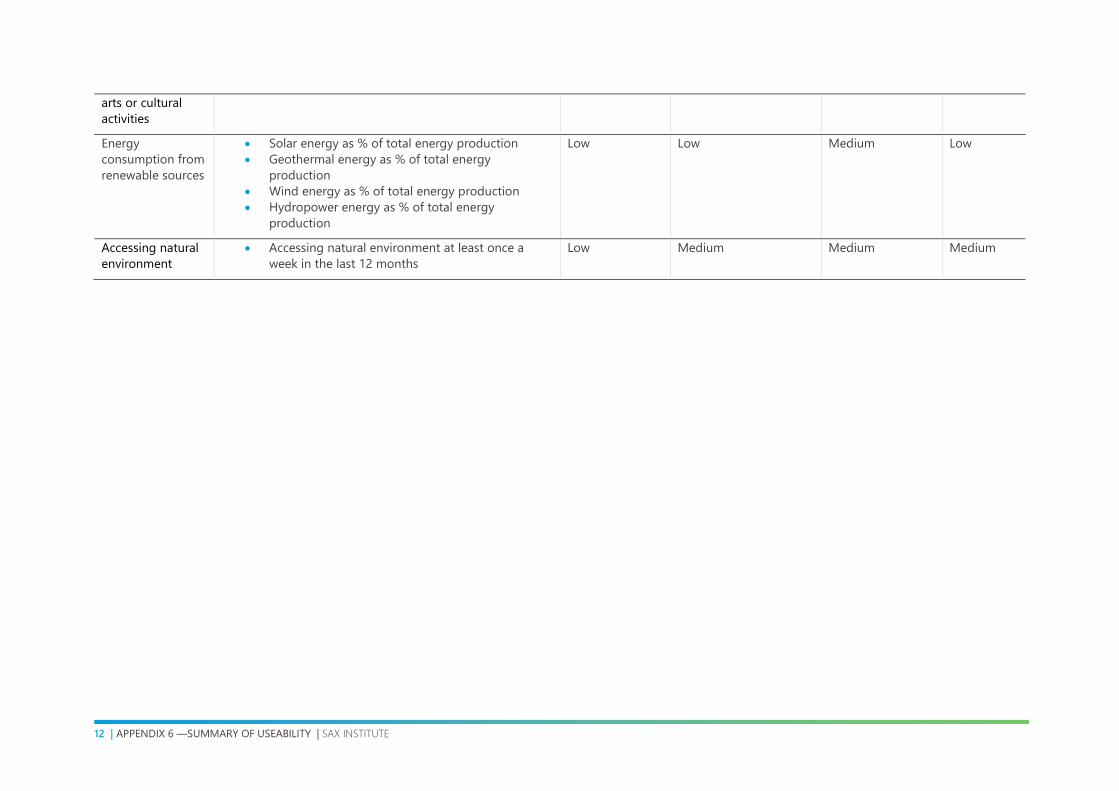
12 | APPENDIX 6 —SUMMARY OF USEABILITY | SAX INSTITUTE
arts or cultural
activities
Energy
consumption from
renewable sources
• Solar energy as % of total energy production
• Geothermal energy as % of total energy
production
• Wind energy as % of total energy production
• Hydropower energy as % of total energy
production
Low Low Medium Low
Accessing natural
environment
• Accessing natural environment at least once a
week in the last 12 months
Low Medium Medium Medium

APPENDIX 6 —SUMMARY OF USEABILITY | SAX INSTITUTE | 13
Domain: Safety
Domain: Safety – All population (See appendix 1)
Indicator Measurement options Frequency Statistical/academic
evidence (reliability)
Availability of
NSW data
Assessment
of
useability
Self-reported
victimization
• The percentage of people who declare that they
have been victim of an assault crime in the last 12
months. The data presented here are drawn from
the Gallup World Poll.
• Physical assault victimisation rate
• Malicious property damage victimisation
Low Medium High Medium
Crimes against
people
• Crimes against the person (per 1,000 adults)
• The number of police-recorded intentional
homicides reported each year, per 100,000 people
• Death due to assaults
Low Medium Medium Medium
Feeling
fairly/very safe
• % of population (demographic?) who report feeling
safe walking alone after dark
Low Medium High Medium

14 | APPENDIX 6 —SUMMARY OF USEABILITY | SAX INSTITUTE
Domain: Health – Children
Domain: Health – Children (See appendix 2)
Indicator Measurement options Frequency Statistical/academic
evidence
(reliability)
Availability of
NSW data
Assessment
of
useability
Smoking in
pregnancy
• Rate of women smoking during pregnancy Low High High High
Birthweight • Proportion of live born infants of low birthweight
• Low birth weight
Low High High High
Breastfeeding • Proportion of infants exclusively breastfed at 4 months of
age
• Increased rate of breastfeeding
Low High High High
Alcohol and drug
use in pregnancy
• Proportion of pregnant women with self-reported
substance use during pregnancy
• Proportion of women with a positive toxicology screen
during pregnancy
Low High Medium Medium
Immunisation
• Rate of immunisation (per/1000 children) Low High High High
Parental
substance use
(alcohol and illicit
drugs)
• % of parents engaging in risky and high risk drinking
patterns
• % of parents with self-reported substance use
Low High High High
Injuries
• Age-specific death rates from all injuries for children
aged 0-4, 5-9 and 10-14 years
• Decreased rate of unintentional injury
High High Medium High
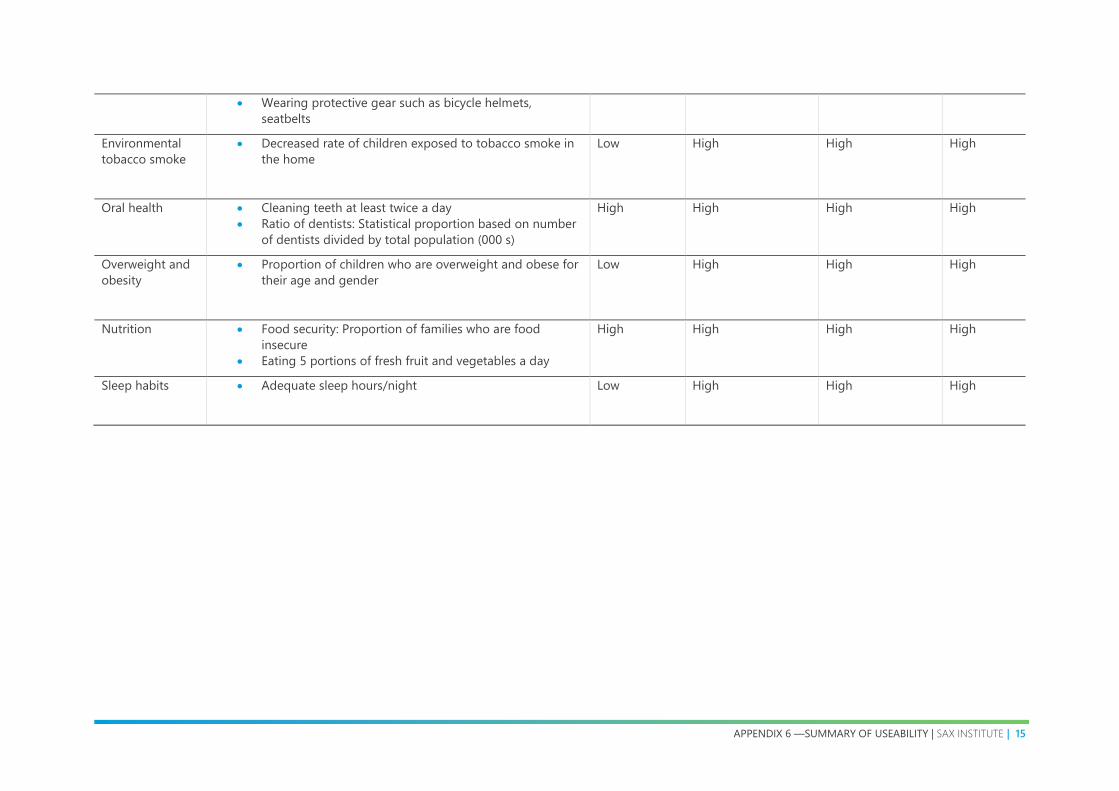
APPENDIX 6 —SUMMARY OF USEABILITY | SAX INSTITUTE | 15
• Wearing protective gear such as bicycle helmets,
seatbelts
Environmental
tobacco smoke
• Decreased rate of children exposed to tobacco smoke in
the home
Low High High High
Oral health • Cleaning teeth at least twice a day
• Ratio of dentists: Statistical proportion based on number
of dentists divided by total population (000 s)
High High High High
Overweight and
obesity
• Proportion of children who are overweight and obese for
their age and gender
Low High High High
Nutrition
• Food security: Proportion of families who are food
insecure
• Eating 5 portions of fresh fruit and vegetables a day
High High High High
Sleep habits • Adequate sleep hours/night
Low High High High

16 | APPENDIX 6 —SUMMARY OF USEABILITY | SAX INSTITUTE
Domain: Safety – Children
Domain: Safety – Children (See appendix 2)
Indicator Measurement options Frequency Statistical/academic
evidence
(reliability)
Availability of
NSW data
Assessment
of useability
Child abuse and
neglect
• Rate of children who were the subject of child
protection substantiation in a given year
• Child protection: Decreased rate of re-notifications to
child protection
Low, possibly
due to lack of
data
High High High
Safe schools • safe from bullying, discrimination, crime
• % of children having been bullied
Medium Medium Low Medium

APPENDIX 6 —SUMMARY OF USEABILITY | SAX INSTITUTE | 17
Domain: Education and skills – Children
Domain: Education and skills – Children (See appendix 2)
Indicator Measurement options Frequency Statistical/academic
evidence
(reliability)
Availability of
NSW data
Assessment
of
useability
Parental
education
• Highest level of education attained by the parent/s or
carers
High Medium High High
Cognitive/
developmental
resources (books,
phone, internet,
magazines,
newspapers)
• Proportion of dependent children aged 0–15 living in
household with no internet access
Low High High High
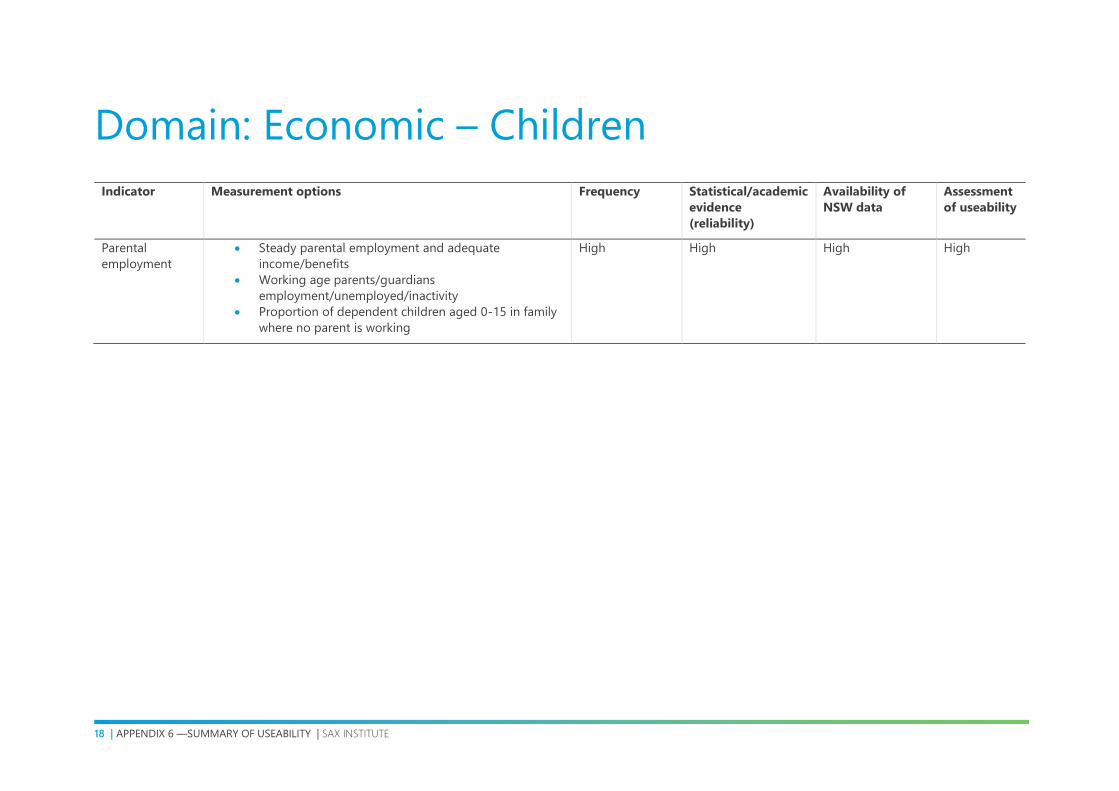
18 | APPENDIX 6 —SUMMARY OF USEABILITY | SAX INSTITUTE
Domain: Economic – Children
Indicator Measurement options Frequency Statistical/academic
evidence
(reliability)
Availability of
NSW data
Assessment
of useability
Parental
employment
• Steady parental employment and adequate
income/benefits
• Working age parents/guardians
employment/unemployed/inactivity
• Proportion of dependent children aged 0-15 in family
where no parent is working
High High High High
APPENDIX 6 —SUMMARY OF USEABILITY | SAX INSTITUTE | 19
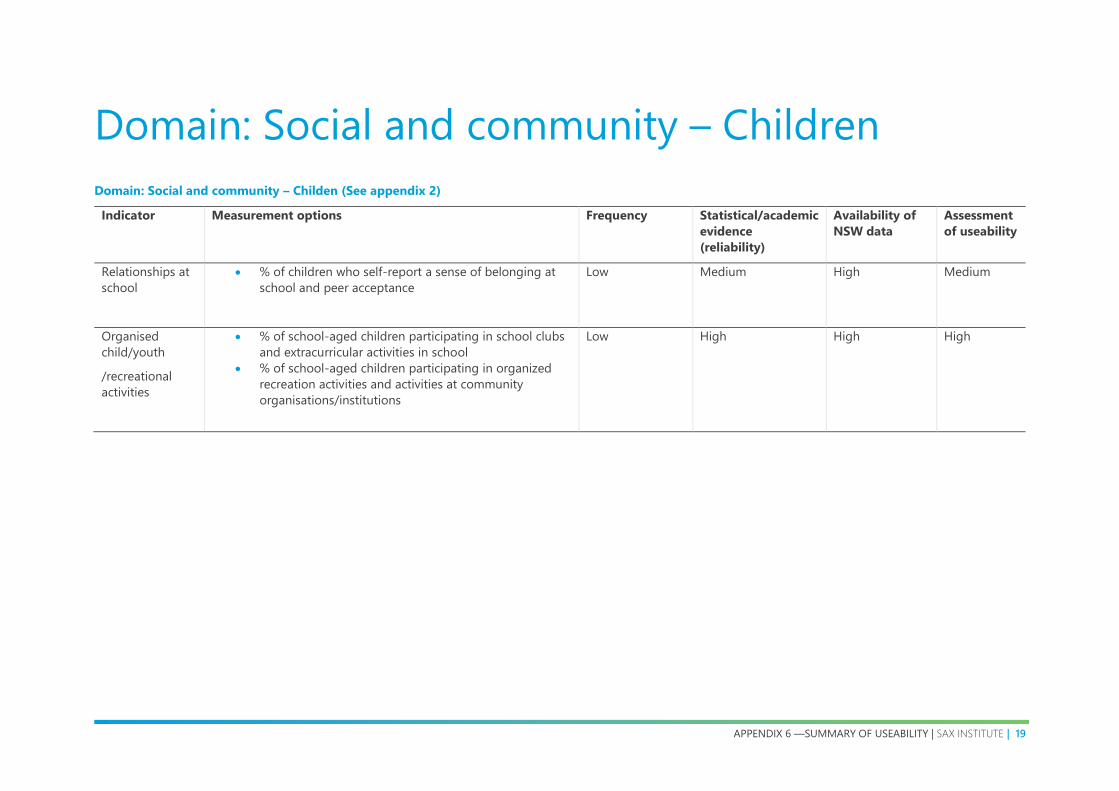
Domain: Social and community – Children
Domain: Social and community – Childen (See appendix 2)
Indicator Measurement options Frequency Statistical/academic
evidence
(reliability)
Availability of
NSW data
Assessment
of useability
Relationships at
school
• % of children who self-report a sense of belonging at
school and peer acceptance
Low Medium High Medium
Organised
child/youth
/recreational
activities
• % of school-aged children participating in school clubs
and extracurricular activities in school
• % of school-aged children participating in organized
recreation activities and activities at community
organisations/institutions
Low High High High
20 | APPENDIX 6 —SUMMARY OF USEABILITY | SAX INSTITUTE
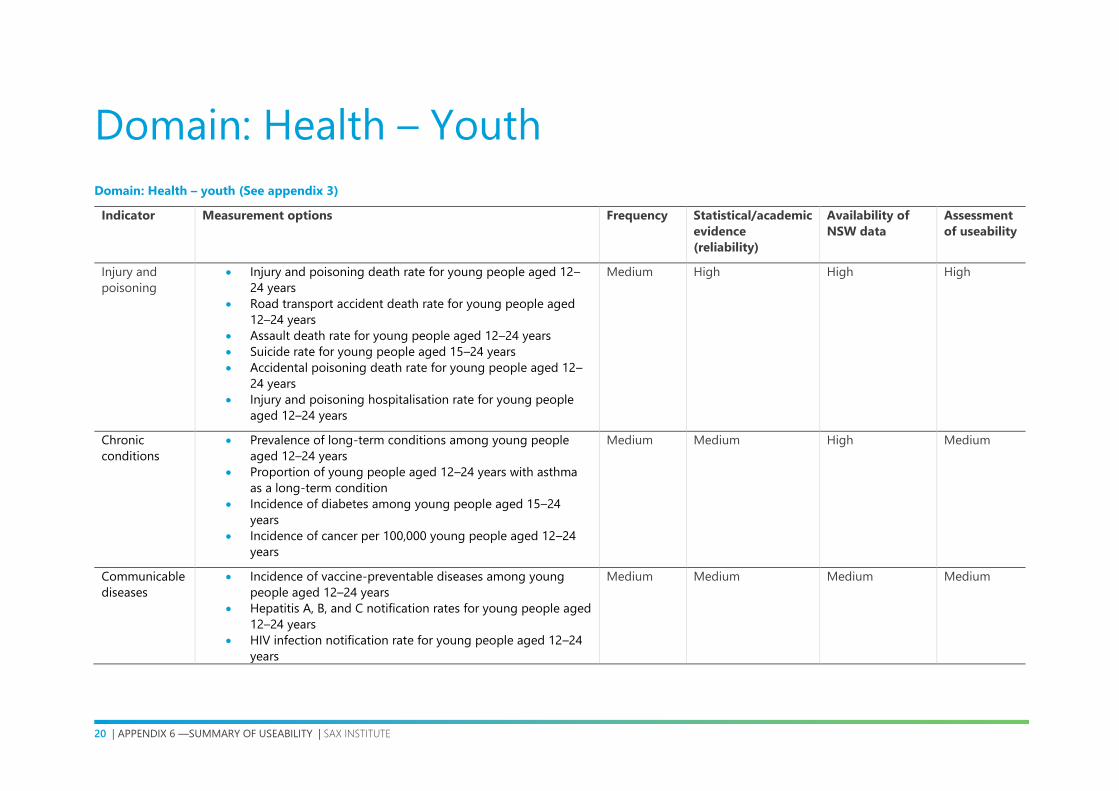
Domain: Health – Youth
Domain: Health – youth (See appendix 3)
Indicator Measurement options Frequency Statistical/academic
evidence
(reliability)
Availability of
NSW data
Assessment
of useability
Injury and
poisoning
• Injury and poisoning death rate for young people aged 12–
24 years
• Road transport accident death rate for young people aged
12–24 years
• Assault death rate for young people aged 12–24 years
• Suicide rate for young people aged 15–24 years
• Accidental poisoning death rate for young people aged 12–
24 years
• Injury and poisoning hospitalisation rate for young people
aged 12–24 years
Medium High High High
Chronic
conditions
• Prevalence of long-term conditions among young people
aged 12–24 years
• Proportion of young people aged 12–24 years with asthma
as a long-term condition
• Incidence of diabetes among young people aged 15–24
years
• Incidence of cancer per 100,000 young people aged 12–24
years
Medium Medium High Medium
Communicable
diseases
• Incidence of vaccine-preventable diseases among young
people aged 12–24 years
• Hepatitis A, B, and C notification rates for young people aged
12–24 years
• HIV infection notification rate for young people aged 12–24
years
Medium Medium Medium Medium

APPENDIX 6 —SUMMARY OF USEABILITY | SAX INSTITUTE | 21
• Incidence of notifiable sexually transmissible infections
among young people aged 12–24 years
Oral health
• Proportion of young people aged 12 and 15 years decay-free
• Mean number of decayed, missing or filled teeth (DMFT) at
12 and 15 years
• A statistical proportion based on the number of dentists,
divided by the total population (000s)
High High High High
Overweight
and obesity
• Proportion of young people who are overweight or obese Medium Medium High Medium
Nutrition • Proportion of young people aged 12–24 years meeting
Australian Dietary Guidelines
Medium Medium High Medium
Sun protection • Proportion of young people aged 12–24 years using sun
protection
Medium
Medium Medium Medium
Substance use
• Reported rate for substance use disorders for young people
aged 16–24 years
• Proportion of young people aged 12–24 years who are daily
smokers
• Proportion of young people aged 12–24 years who drink at
risky or high-risk levels in the short or long term
• Proportion of young people aged 12–24 years who had used
an illicit drug within the last 12 months
Medium High High High
Sexual and
reproductive
health
• Proportion of young people in Year 10 and Year 12 who have
had sexual intercourse
• Age-specific birth rate for 15–19-year-old women
• Teenage pregnancies: Proportion of females aged 15–19 with
at least one child ever born
High High High High
Parental health
and disability
• Proportion of parents rating their health as ‘fair’ or ‘poor’
• Proportion of young people aged 15–24 years living with a
parent with disability
• Proportion of youth aged 15–19 living in households where
someone needs assistance with core activities
High Medium High High

22 | APPENDIX 6 —SUMMARY OF USEABILITY | SAX INSTITUTE
Environmental
tobacco smoke
• Proportion of households with a young person aged 12–17
years where a household member smoked inside the home
Medium High High High
Potentially
preventable
hospitalisations
• Potentially preventable hospitalisation rate for young people
aged 12–24 years
Medium Medium High Medium
Survival for
melanoma of
the skin
• Five-year relative survival rate for melanoma of the skin for
young people aged 12–24 years
Medium Medium High Medium
Cervical cancer
• Cervical screening rates among women aged 20–24 years
• Cervical cancer vaccination rates among women aged 12–24
years
Medium Medium High Medium
Appropriate
use of
antibiotics
• Proportion of upper respiratory tract infections managed for
which oral antibiotics were prescribed
Medium Low High Medium
Delivery by
caesarean
section
• Caesarean sections as a proportion of all deliveries for young
women aged 15–24 years who gave birth
Medium Medium High Medium
General
practice
consultations
• Rate of general practice encounters for young people aged
12–24 years
• Ration of GPs: A statistical proportion based on the number
of General Practitioners (GPs), divided by the total population
(000s)
• Ratio of Dentists: A statistical proportion based on the
number of dentists, divided by the total population (000s)
High Medium High High

APPENDIX 6 —SUMMARY OF USEABILITY | SAX INSTITUTE | 23
Emergency
department
waiting times
• Proportion of patients aged 12–24 years who are treated
within national benchmarks for waiting times across triage
categories in public hospital emergency departments
Medium Medium High Medium
Adverse events
treated in
hospital
• Proportion of hospitalisations for young people aged 12–24
years where an adverse event was treated and/or occurred
Medium Low High Medium

24 | APPENDIX 6 —SUMMARY OF USEABILITY | SAX INSTITUTE
Domain: Social and community – Youth
Domain: Social and community – Youth (See appendix 3)
Indicator Measurement options Frequency Statistical/academic
evidence
(reliability)
Availability of
NSW data
Assessment
of useability
Family
functioning -
Note about this,
useability
medium but the
data is not
available
• Not clear Medium Medium Low Medium

APPENDIX 6 —SUMMARY OF USEABILITY | SAX INSTITUTE | 25
Domain: Safety – Youth
Domain: Safety – Youth (See appendix 3)
Indicator Measurement options Frequency Statistical/academic
evidence
(reliability)
Availability of
NSW data
Assessment
of useability
School
relationships
and bullying -
Note about
this, useability
medium but
the data is not
available
• Not clear
Medium High Low Medium
Child
protection
• Rate of young people aged 12–17 years who were the
subject of a substantiation of a child protection
notification received in a given year
• Rate of young people aged 12–17 years who are the
subject of care and protection orders
Medium High High High
26 | APPENDIX 6 —SUMMARY OF USEABILITY | SAX INSTITUTE
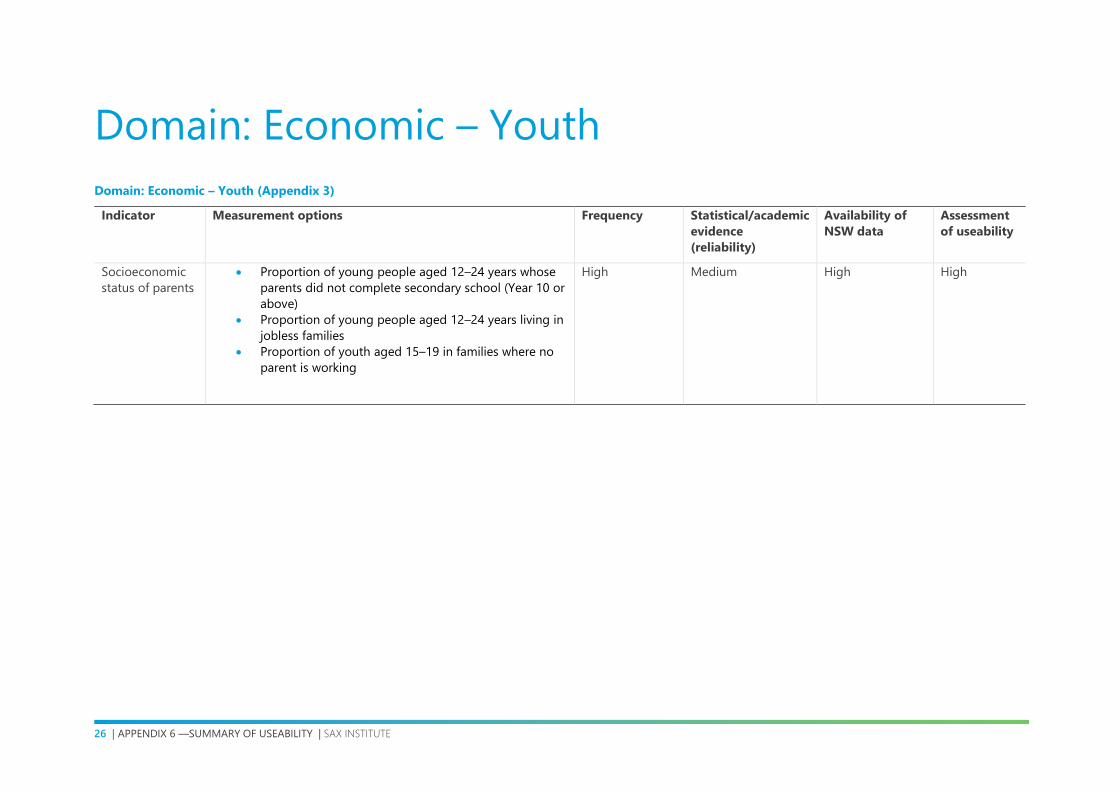
Domain: Economic – Youth
Domain: Economic – Youth (Appendix 3)
Indicator Measurement options Frequency Statistical/academic
evidence
(reliability)
Availability of
NSW data
Assessment
of useability
Socioeconomic
status of parents
• Proportion of young people aged 12–24 years whose
parents did not complete secondary school (Year 10 or
above)
• Proportion of young people aged 12–24 years living in
jobless families
• Proportion of youth aged 15–19 in families where no
parent is working
High Medium High High

APPENDIX 6 —SUMMARY OF USEABILITY | SAX INSTITUTE | 27
Domain: Economic – Older adults
Domain: Economic – Older adults (See appendix 4)
Indicator Measurement options Frequency Statistical/academic
evidence
(reliability)
Availability of
NSW data
Assessment
of useability
Underemployment • % of older people working fewer hours than desired Low Medium High Medium

28 | APPENDIX 6 —SUMMARY OF USEABILITY | SAX INSTITUTE
Domain: Social and community – Older adults
Domain: Social and community – Older adults (See appendix 4)
Indicator Measurement options Frequency Statistical/academic
evidence
(reliability)
Availability of
NSW data
Assessment
of useability
Caring duties • % of older people who provided care to children who
were not their grandchildren
• % of older people who provided care to children who
were their grandchildren
• % of older people who provided care to their children
and/or grandchildren (daily and several days a week).
• % of older people providing care to others
High Medium High High
Access to
transportation
(or domain can
also be Safety)
• % of older people who had no access to car
• % of older people who access public transport (bus,
ferry, rail or taxi)
High Medium High High
APPENDIX 6 —SUMMARY OF USEABILITY | SAX INSTITUTE | 29
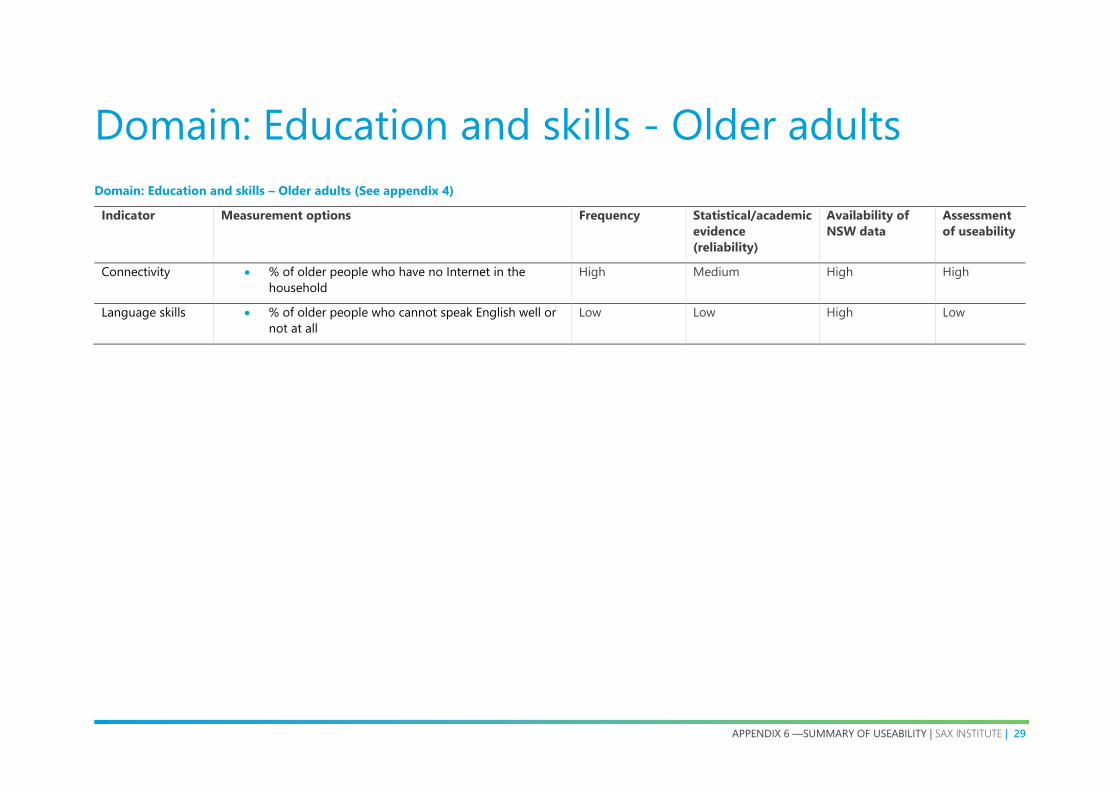
Domain: Education and skills - Older adults
Domain: Education and skills – Older adults (See appendix 4)
Indicator Measurement options Frequency Statistical/academic
evidence
(reliability)
Availability of
NSW data
Assessment
of useability
Connectivity • % of older people who have no Internet in the
household
High Medium High High
Language skills • % of older people who cannot speak English well or
not at all
Low Low High Low
30 | APPENDIX 6 —SUMMARY OF USEABILITY | SAX INSTITUTE
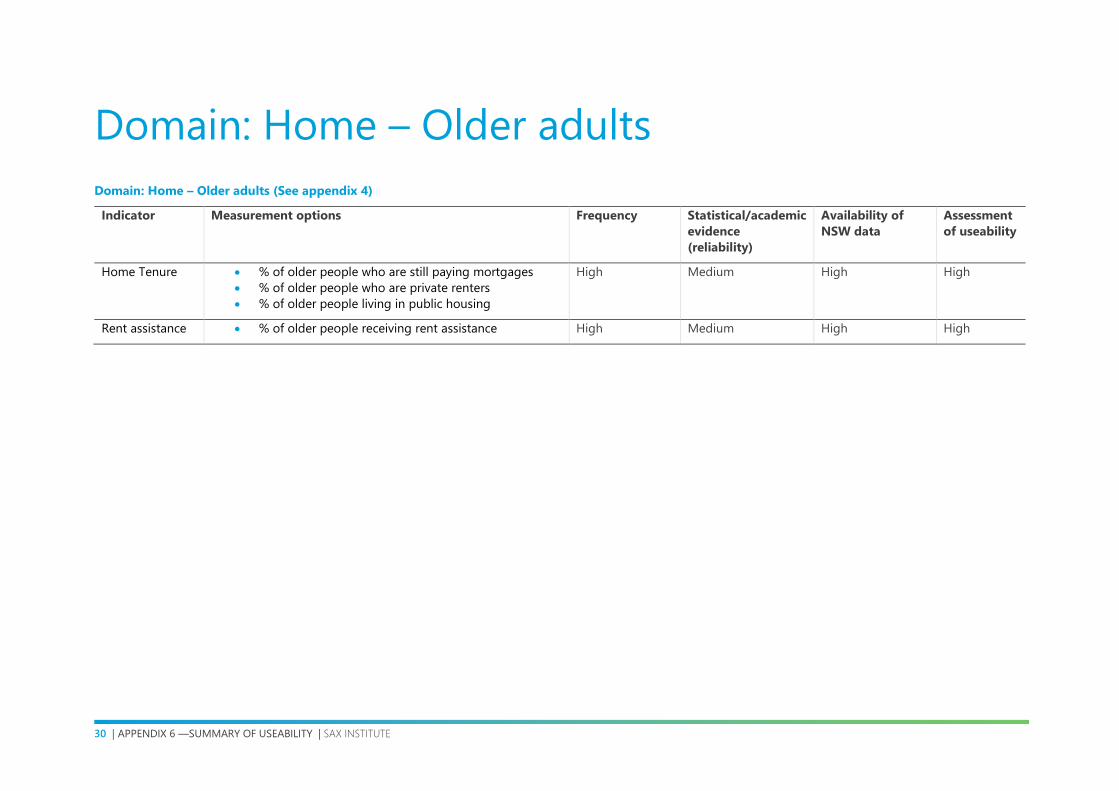
Domain: Home – Older adults
Domain: Home – Older adults (See appendix 4)
Indicator Measurement options Frequency Statistical/academic
evidence
(reliability)
Availability of
NSW data
Assessment
of useability
Home Tenure • % of older people who are still paying mortgages
• % of older people who are private renters
• % of older people living in public housing
High Medium High High
Rent assistance • % of older people receiving rent assistance High Medium High High
APPENDIX 6 —SUMMARY OF USEABILITY | SAX INSTITUTE | 31
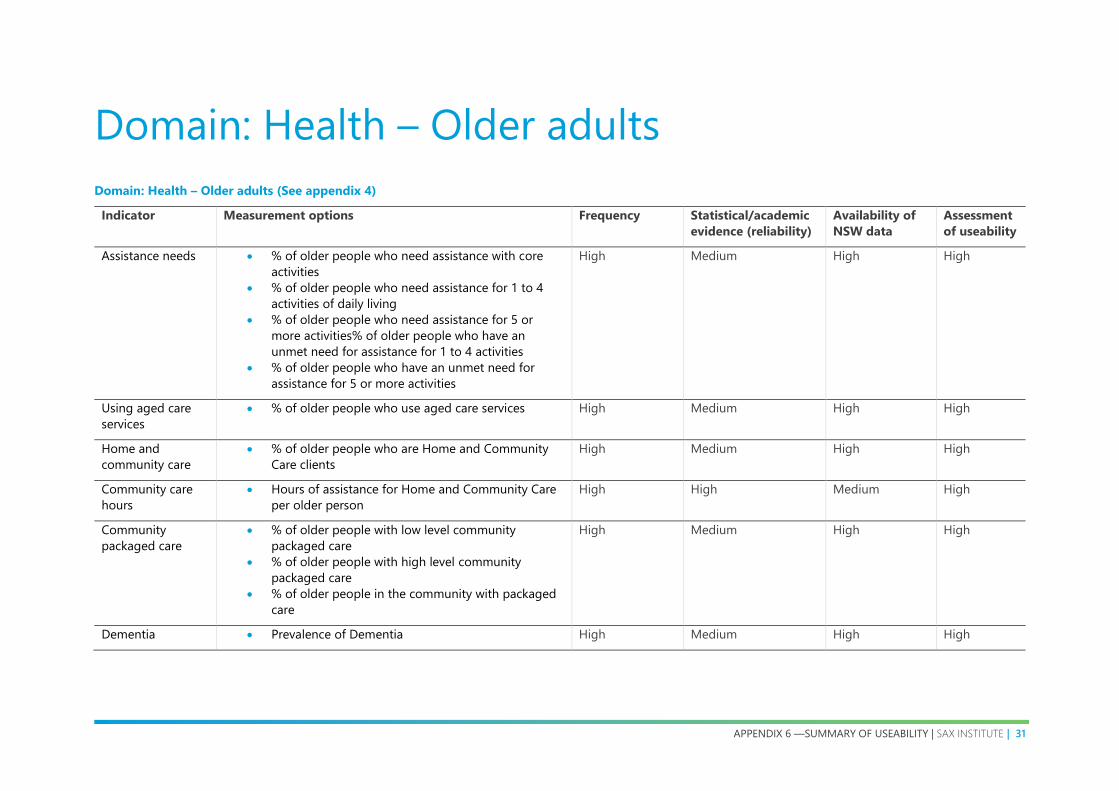
Domain: Health – Older adults
Domain: Health – Older adults (See appendix 4)
Indicator Measurement options Frequency Statistical/academic
evidence (reliability)
Availability of
NSW data
Assessment
of useability
Assistance needs • % of older people who need assistance with core
activities
• % of older people who need assistance for 1 to 4
activities of daily living
• % of older people who need assistance for 5 or
more activities% of older people who have an
unmet need for assistance for 1 to 4 activities
• % of older people who have an unmet need for
assistance for 5 or more activities
High Medium High High
Using aged care
services
• % of older people who use aged care services High Medium High High
Home and
community care
• % of older people who are Home and Community
Care clients
High Medium High High
Community care
hours
• Hours of assistance for Home and Community Care
per older person
High High Medium High
Community
packaged care
• % of older people with low level community
packaged care
• % of older people with high level community
packaged care
• % of older people in the community with packaged
care
High Medium High High
Dementia • Prevalence of Dementia High Medium High High