appendix 9. airspeed calibrations -...
TRANSCRIPT
8/14/03 AC 23-8B Appendix 9
APPENDIX 9. AIRSPEED CALIBRATIONS
Page A9-1
AC 23-8B 8/14/03 Appendix 9
APPENDIX 9. AIRSPEED CALIBRATIONS INTRODUCTION The airspeed and altimeter systems on an aircraft depend upon accurate measurements of ambient static pressure and total pitot pressure. Static and pitot pressures are sensed by the pitot static tube, which gives true readings in an undisturbed freestream when aligned with the flow streamlines; however, when attached to the aircraft, which generates a pressure when flying, the pitot and the static reading will be affected by the aircraft pressure field and the flow angularity. The errors, caused by the pressure field and by flow angularity are called position errors due to the sign and magnitude of the errors, which are a function of the position of the pitot-static probe on the aircraft. The position errors are a function of aircraft angle of attack and Mach number and are determined from flight test. In this text, corrections are used rather than errors. Normally, errors are subtracted and corrections are added with the result that the position error corrections (PEC) are added to the aircraft pitot-static data to get the ambient conditions of static and pitot pressures. The ambient static pressure is defined as PSref and the ambient pitot pressure is defined as PPref. The position error correction of the static source SP∆ is defined as
CSASrefS PPP /−=∆ and the position error correction for the pitot pressure is defined as PP∆
CPAefp PPP /Pr −=∆ The total position error correction for a pitot static system to be used for an airspeed system is where dP∆
SPd PPP ∆−∆=∆ GENERAL DISCUSSION OF THE VARIOUS FLIGHT TEST TECHNIQUES Each of the flight test techniques (FTT's) that are described in this appendix have certain limitations and instrumentation accuracy criteria that must be considered prior to selecting a flight test technique. The trailing bomb method only calibrates the aircraft static source. The bomb must be stable when flying below and behind the aircraft, any oscillations will make the reference static pressure invalid. At high speeds the bomb tends to rise up into the wake of the aircraft, which causes bomb oscillations; therefore, the trailing bomb has an upper airspeed limit. The trailing bomb is useful for most speeds up to approximately 200 knots and is particularly useful for helicopters. In addition, the trailing bomb can also be used down to stall speeds. The trailing bomb deployed behind and below helicopters tends to keep the bomb and the attaching tube clear of the tail rotor; however, care must be taken when expanding the speed envelope. The trailing cone method is capable of a much higher speed range than the trailing bomb and is a favorite method with the large aircraft manufacturers. The trailing cone method only calibrates the aircraft static pressure system.
Page A9-2
8/14/03 AC 23-8B Appendix 9
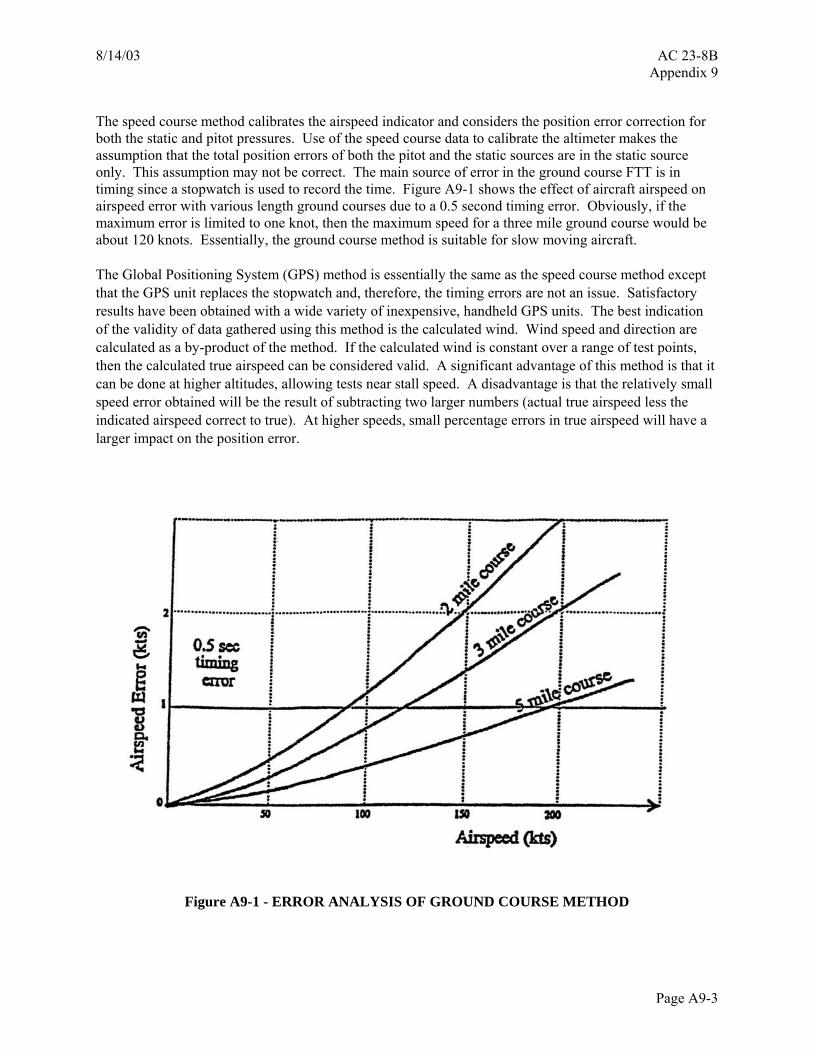
The speed course method calibrates the airspeed indicator and considers the position error correction for both the static and pitot pressures. Use of the speed course data to calibrate the altimeter makes the assumption that the total position errors of both the pitot and the static sources are in the static source only. This assumption may not be correct. The main source of error in the ground course FTT is in timing since a stopwatch is used to record the time. Figure A9-1 shows the effect of aircraft airspeed on airspeed error with various length ground courses due to a 0.5 second timing error. Obviously, if the maximum error is limited to one knot, then the maximum speed for a three mile ground course would be about 120 knots. Essentially, the ground course method is suitable for slow moving aircraft. The Global Positioning System (GPS) method is essentially the same as the speed course method except that the GPS unit replaces the stopwatch and, therefore, the timing errors are not an issue. Satisfactory results have been obtained with a wide variety of inexpensive, handheld GPS units. The best indication of the validity of data gathered using this method is the calculated wind. Wind speed and direction are calculated as a by-product of the method. If the calculated wind is constant over a range of test points, then the calculated true airspeed can be considered valid. A significant advantage of this method is that it can be done at higher altitudes, allowing tests near stall speed. A disadvantage is that the relatively small speed error obtained will be the result of subtracting two larger numbers (actual true airspeed less the indicated airspeed correct to true). At higher speeds, small percentage errors in true airspeed will have a larger impact on the position error.
Figure A9-1 - ERROR ANALYSIS OF GROUND COURSE METHOD
Page A9-3
AC 23-8B 8/14/03 Appendix 9
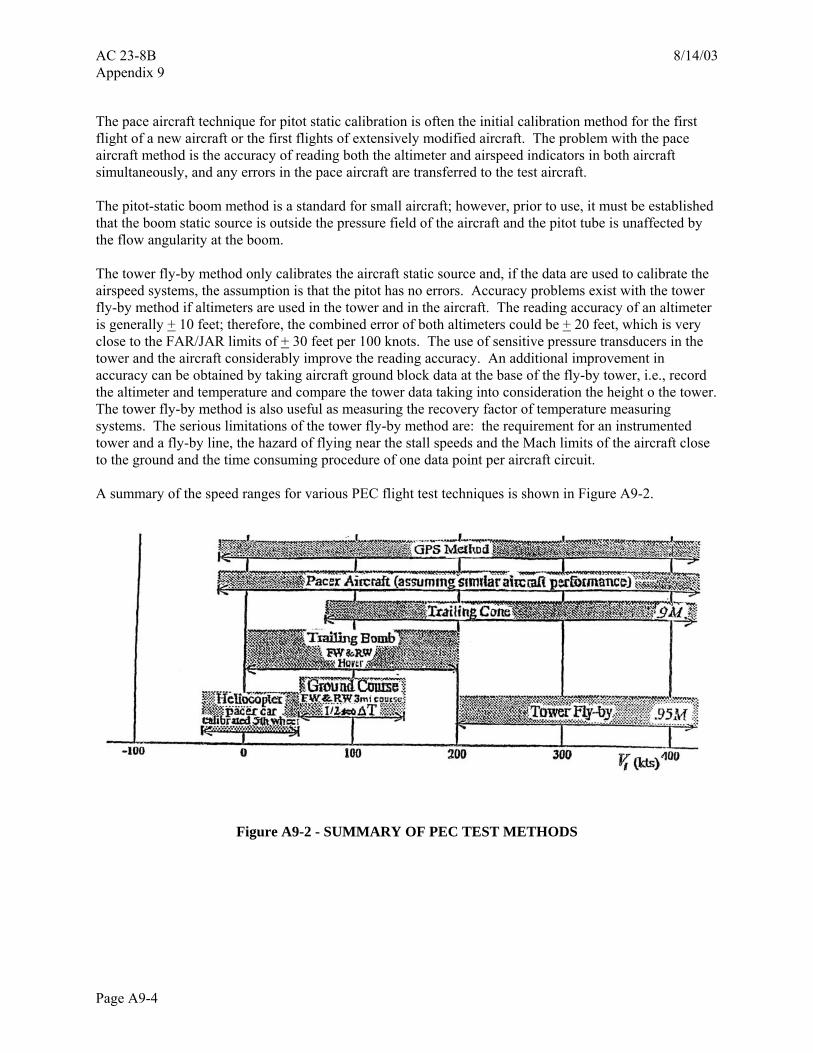
The pace aircraft technique for pitot static calibration is often the initial calibration method for the first flight of a new aircraft or the first flights of extensively modified aircraft. The problem with the pace aircraft method is the accuracy of reading both the altimeter and airspeed indicators in both aircraft simultaneously, and any errors in the pace aircraft are transferred to the test aircraft. The pitot-static boom method is a standard for small aircraft; however, prior to use, it must be established that the boom static source is outside the pressure field of the aircraft and the pitot tube is unaffected by the flow angularity at the boom. The tower fly-by method only calibrates the aircraft static source and, if the data are used to calibrate the airspeed systems, the assumption is that the pitot has no errors. Accuracy problems exist with the tower fly-by method if altimeters are used in the tower and in the aircraft. The reading accuracy of an altimeter is generally + 10 feet; therefore, the combined error of both altimeters could be + 20 feet, which is very close to the FAR/JAR limits of + 30 feet per 100 knots. The use of sensitive pressure transducers in the tower and the aircraft considerably improve the reading accuracy. An additional improvement in accuracy can be obtained by taking aircraft ground block data at the base of the fly-by tower, i.e., record the altimeter and temperature and compare the tower data taking into consideration the height o the tower. The tower fly-by method is also useful as measuring the recovery factor of temperature measuring systems. The serious limitations of the tower fly-by method are: the requirement for an instrumented tower and a fly-by line, the hazard of flying near the stall speeds and the Mach limits of the aircraft close to the ground and the time consuming procedure of one data point per aircraft circuit. A summary of the speed ranges for various PEC flight test techniques is shown in Figure A9-2.
Figure A9-2 - SUMMARY OF PEC TEST METHODS
Page A9-4
8/14/03 AC 23-8B Appendix 9
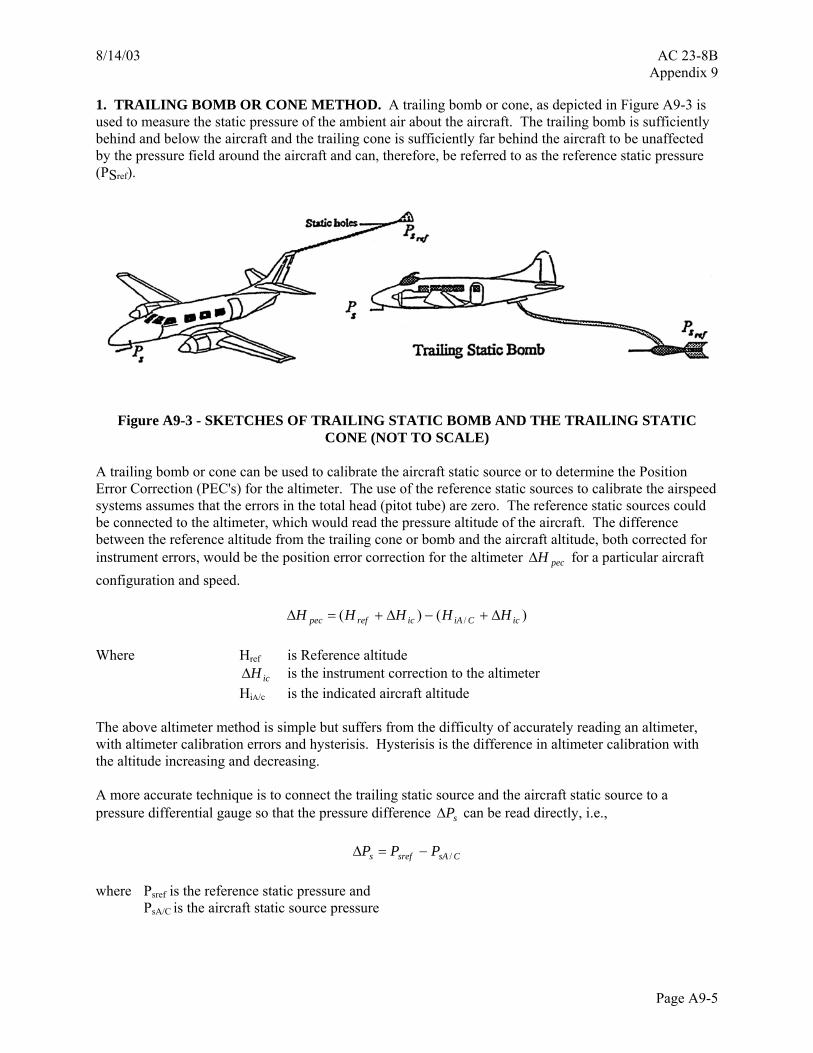
1. TRAILING BOMB OR CONE METHOD. A trailing bomb or cone, as depicted in Figure A9-3 is used to measure the static pressure of the ambient air about the aircraft. The trailing bomb is sufficiently behind and below the aircraft and the trailing cone is sufficiently far behind the aircraft to be unaffected by the pressure field around the aircraft and can, therefore, be referred to as the reference static pressure (PSref).
Figure A9-3 - SKETCHES OF TRAILING STATIC BOMB AND THE TRAILING STATIC CONE (NOT TO SCALE)
A trailing bomb or cone can be used to calibrate the aircraft static source or to determine the Position Error Correction (PEC's) for the altimeter. The use of the reference static sources to calibrate the airspeed systems assumes that the errors in the total head (pitot tube) are zero. The reference static sources could be connected to the altimeter, which would read the pressure altitude of the aircraft. The difference between the reference altitude from the trailing cone or bomb and the aircraft altitude, both corrected for instrument errors, would be the position error correction for the altimeter pecH∆ for a particular aircraft configuration and speed.
)()( / icCiAicrefpec HHHHH ∆+−∆+=∆ Where Href is Reference altitude is the instrument correction to the altimeter icH∆ HiA/c is the indicated aircraft altitude The above altimeter method is simple but suffers from the difficulty of accurately reading an altimeter, with altimeter calibration errors and hysterisis. Hysterisis is the difference in altimeter calibration with the altitude increasing and decreasing. A more accurate technique is to connect the trailing static source and the aircraft static source to a pressure differential gauge so that the pressure difference sP∆ can be read directly, i.e.,
CsAsrefs PPP /−=∆ where Psref is the reference static pressure and PsA/C is the aircraft static source pressure
Page A9-5
AC 23-8B 8/14/03 Appendix 9
Note that the ( ) as expressed above is a correction which must be added to the aircraft static pressure (P
SP∆S) to get the reference static pressure. The ( sP∆ ) data in lb/ft2 can be converted to data in feet
by the use of the pressure static equation: pecH∆
gP
HorHgP SpecpecS ρ
ρ∆
−=∆∆−=∆
Units in lb/ftSP∆ 2
H in ft ρ in slugs/ft3
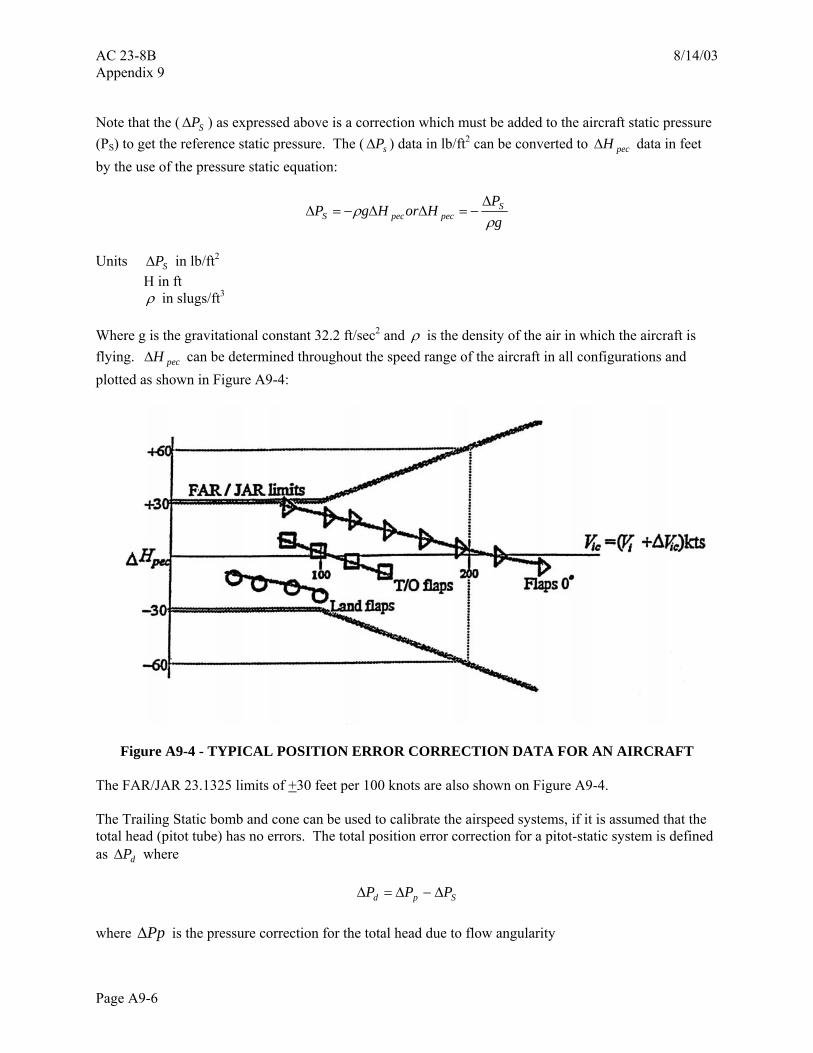
Where g is the gravitational constant 32.2 ft/sec2 and ρ is the density of the air in which the aircraft is flying. can be determined throughout the speed range of the aircraft in all configurations and plotted as shown in Figure A9-4:
pecH∆
Figure A9-4 - TYPICAL POSITION ERROR CORRECTION DATA FOR AN AIRCRAFT
The FAR/JAR 23.1325 limits of +30 feet per 100 knots are also shown on Figure A9-4. The Trailing Static bomb and cone can be used to calibrate the airspeed systems, if it is assumed that the total head (pitot tube) has no errors. The total position error correction for a pitot-static system is defined as where dP∆
Spd PPP ∆−∆=∆ where is the pressure correction for the total head due to flow angularity Pp∆
Page A9-6
8/14/03 AC 23-8B Appendix 9
CPAPp PPPref /−=∆
If is assumed to zero, then PP∆
⎟⎟⎠
⎞⎜⎜⎝
⎛+++−⎟
⎟⎠
⎞⎜⎜⎝
⎛+++=∆−=∆
4041
21
4041
21 42
242
2 icicic
CCCSd
MMV
MMVPP ρορο
where Vc and Vic are in ft/sec. For low speed aircraft that fly at speeds of less than 200 knots and at altitudes less than 10,000 feet, the compressibility corrections can be ignored and the above equation reduces to:
( )22
21
iccoSd VVPP −=∆−=∆ ρ
Where Vic is the indicated airspeed of the aircraft corrected for instrument errors and Vc is the calibrated airspeed corrected for instrument and position errors.
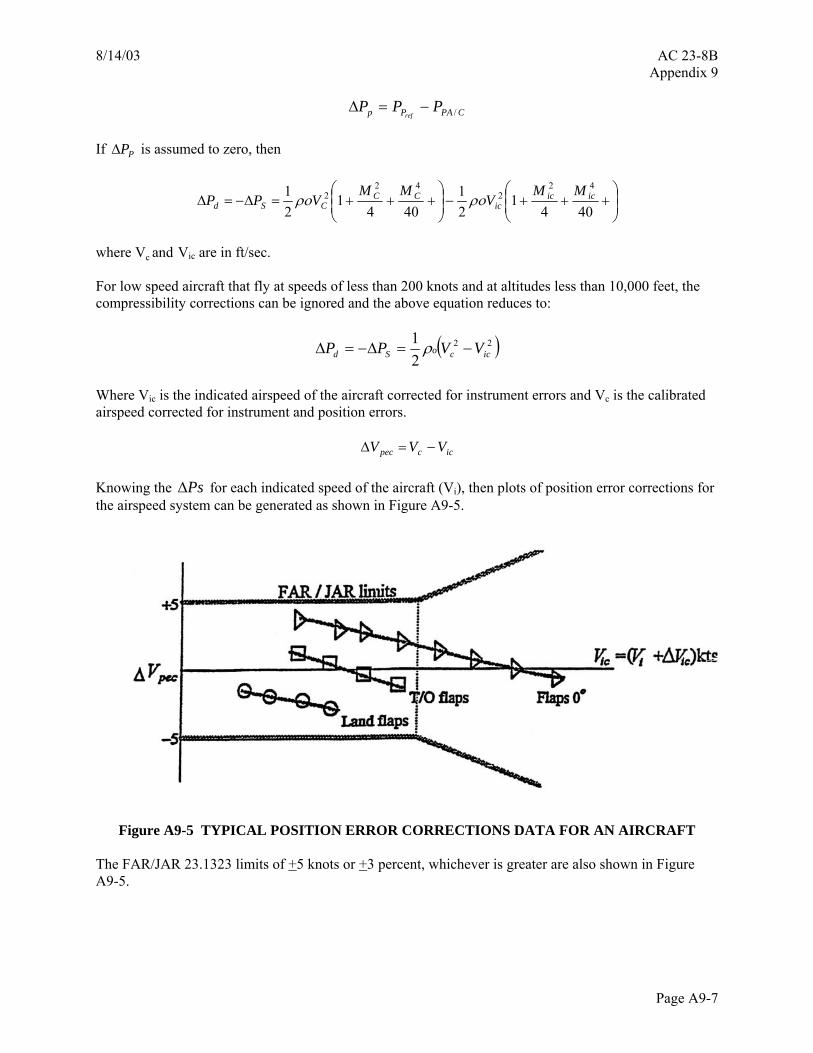
iccpec VVV −=∆ Knowing the for each indicated speed of the aircraft (VPs∆ i), then plots of position error corrections for the airspeed system can be generated as shown in Figure A9-5.
Figure A9-5 TYPICAL POSITION ERROR CORRECTIONS DATA FOR AN AIRCRAFT The FAR/JAR 23.1323 limits of +5 knots or +3 percent, whichever is greater are also shown in Figure A9-5.
Page A9-7
AC 23-8B 8/14/03 Appendix 9
a. Test Conditions.
(1) Air Quality. Smooth, stable air is needed for calibrating the airspeed indicating system using a trailing bomb or trailing cone. (2) Weight and C.G. Same as speed course method. See paragraph 2a(2) of this appendix. (3) Speed Range. The calibration should range from 1.2 VSTALL to VMO/VNE or maximum level flight speed, whichever is greater. If the trailing bomb becomes unstable at high airspeed, the higher airspeed range may be calibrated using another accepted method; that is, trailing cone or pace method. (4) Use of Bomb. Care should be exercised in deploying the bomb and flying the test to ensure that no structural damage or control interference is caused by the bomb or the cable. At higher speeds, the bomb may become unstable and porpoise or oscillate. A means for a quick release of the trailing bomb should be provided, in the event an emergency arises. Flight tests using a bomb should be conducted over open (unpopulated) areas. (5) Free Stream Air. The bomb hose should be of adequate length to assure bomb operations in free stream air. This should include consideration of all airplane test configurations that could possibly impart body interference upon the bomb. It will usually require that the bomb be at least one-half wing span away from the airplane. (6) Qualifications For Use. Under stabilized flight conditions at constant airspeed and altitude, trailing cones and airspeed bombs are considered excellent airspeed reference systems. See paragraph 17b of this AC for additional discussion.
b. Test Procedures.
(1) Stabilize airplane in level flight approximately 30 seconds just above stall with flaps and gear retracted. Record data. (2) Repeat step (1) at sufficient increments to provide an adequate calibration curve for each of the configurations.
c. Data Acquisition. Data to be recorded at each test point:
Altimeter Method Pressure Differential Method 1. Airplane Airspeed (Vi) 1. Airplane Airspeed (Vi) 2. Airplane indicated altitude (HiA/C) 2. Airplane indicated altitude (HiA/C) 3. Trailing Cone/Bomb altitude (Hiref) 3. Pressure Differential CSASrefS PPP /−=∆ 4. Flap position 4. Flap position 5. Landing gear position 5. Landing gear position 6. Fuel used 6. Fuel used
Page A9-8
8/14/03 AC 23-8B Appendix 9
d. Data Analysis. The data are analyzed according to the methods and equations presented above. The data could be presented in the form as shown in Figures A9-3 and A9-4. Data that fall outside the FAR/JAR limits fail the airworthiness codes.
2. SPEED COURSE METHOD. The speed course method consists of using a ground reference to determine variations between indicated airspeed and ground speed of the airplane. An accurately measured ground course is required. The course distance should be selected to be compatible with the airspeeds being flown. Excessively long times to traverse the course will degrade the test results. Generally, airspeeds above 250 knots should be flown over a 5-mile course. Below 100 knots, limit the course to 1 mile. Perpendicular "end lines" (roads, powerlines, etcetera) should be long enough to allow for drift and accurate sighting of end line passage. A one-second error at 200k is 6k on a 2-mile course.
a. Test Conditions.
(1) Air Quality. The air should be as smooth as possible with a minimum of turbulence and wind. The wind velocity, while conducting the test, should not exceed approximately 10 knots. (2) Weight and C.G. Airspeed calibrations are usually not c.g. sensitive but may be weight sensitive, especially at low airspeeds (higher angles-of-attack). Initial airspeed calibration tests should be conducted with the airplane loaded at or near maximum takeoff gross weight. Additional tests should be conducted at near minimum weight and at low airspeeds to spot check the maximum weight airspeed calibration results. If differences exist, an airspeed system calibration should be accomplished at minimum weight. (3) Altitude. When using a visual reference on the airplane for timing, the altitude throughout the test run should be as low as practical but should be maintained at least one and one-half wing spans above the highest ground elevation so that the airplane remains out of ground effect. When conditions permit using the airplane shadow for timing, speed course altitudes of 500-2000 feet AGL can be used. All run pairs should be conducted at the same altitude. (4) Speed Range. The speed should range from 1.3 VS1 to the maximum level flight speed, to extrapolate to VD. (5) Run Direction. Reciprocal runs should be made at each speed to eliminate wind effects, and the ground speed obtained in each direction should be averaged to eliminate wind effects. Do not average the time flown in each direction. (6) Heading. The heading should be maintained constant and parallel to the speed course throughout the run, allowing the airplane to "drift," if necessary, so that the effect of crosswinds can be eliminated. (7) Configuration. The airspeed system should be calibrated in each landing gear and wing flap configuration required in §§ 23.45 through 23.77. This normally consists of gear up/flaps up, gear up/flaps takeoff and gear down/flaps down.
Page A9-9
AC 23-8B 8/14/03 Appendix 9
b. Test Procedures.
(1) Stabilize airplane in level flight at test speed, with gear and flaps in the desired configuration, prior to entering the speed course. (2) Maintain constant speed, altitude, and heading through speed course. Record data. (3) Repeat steps (1) and (2) of this paragraph on the reciprocal speed run. (4) Repeat steps (1) through (3) of this paragraph at sufficient increments (minimum of five) to provide an adequate calibration curve for each of the configurations.
c. Data Acquisition and Reduction. Data to be recorded during each run:
(1) Time to make run; (2) Pressure altitude; (3) Total air temperature (airplane indicator) corrected to static air temperature (SAT); (4) Indicated airspeed; (5) Wing flap position; (6) Landing gear position; and (7) Direction of run.
d. Sample Speed Course Data Reduction (Refer to Table A9-1).
Speed = Distance Time 1 Knot = 6076.1 feet/nautical mile = 1.6878 feet/second 3600 second/hour Ground Speed = 10560 = .5925 (10560) = 132.8 knots (1.6878)(47.1) 47.1 GSAVG (TAS) = 132.8 + 125.6 = 129.2 knots 2
Sample Speed Course Data and Data Reduction. a. Weight C.G. b. Course Distance 10,560 Ft. c. Pressure Altitude 1,600 Ft. (Altimeter set to 1013 m.b.)
Page A9-10
8/14/03 AC 23-8B Appendix 9
Fl
ap P
ositi
on
Deg
rees
Gea
r Pos
ition
(U
p or
Dow
n)
Tim
e Se
cond
s
I.A.S
. (K
nots
)
Pres
sure
Alti
tude
Fe
et
SAT.
D
egre
es F
ahre
nhei
t
Gro
und
Spee
d*
Knot
s
Aver
age
Gro
und
Spee
d Kn
ots
Fact
or**
Cal
ibra
ted
Air S
peed
Kn
ots
Aver
age
I.A.S
. Kn
ots
Airs
peed
Sys
tem
Inst
rum
ent
Posi
tion
0 Fixed 47.1 128.0 1610 55 132.8 129.2 0.975 126.0 128.5 2.5 1 1.5 49.8 129.0 1600 55 125.6 44.5 135.0 1600 55 140.5 136.7 0.975 133.3 136 2.7 0 2.7 47.1 137.0 1600 55 132.8
40.5 148.0 1600 55 154.2 149.3 0.975 145.6 148 2.4 -1 3.4 43.3 148.0 1600 55 144.3
* Ground Speed = (Seconds) Time
(Ft) Distance Course C × C = 0.5925 for course speed in kts
or use: C = 0.6818 for M.P.H.
** Factor = chart) F from read(or Hg.)(In.PressureObserved16.4/ O=ρρeTemperaturObserved7.559 +o
TABLE A9-1 - SAMPLE SPEED COURSE DATA AND DATA REDUCTION
(1) Density Altitude. TAS is greater than CAS if density altitude is above sea level. For density altitudes below 5000 feet and calibrated airspeeds below 200 knots, it is considered acceptable to use the term CAS = EAS = TAS ρ ρ/ o . In this case, density altitude is obtained from figure A7-4 in Appendix 7. At 1600 ft. pressure altitude and SAT 55 °F, we read a density altitude of about 1700 feet. This density altitude intercepts ρ ρ/ o at a value of .975. CAS = 129.2 (0.975) = 126.0 knots.
AVERAGE GS ERROR (TAS) CAS IAS System = Instrument + Position 129.2 126.0 128.5 +2.5 +1 +1.5 (CAS-IAS) Vinst Vpos
(2) Required Accuracy. Instrument error is determined by applying standard pitot and static pressures to the airspeed instrument and developing a calibration curve. IAS corrected for +1 instrument error = 127.5 knots. The position of the static source is causing +1.5 error.
Page A9-11
AC 23-8B 8/14/03 Appendix 9
Section 23.1323(b) requires the system error, including position error, but excluding instrument error, not to exceed 3 percent of CAS or 5 knots, whichever is greater, in the designated speed range. (3) Compressibility. For many years CAS was used for design airspeeds. However, as speeds and altitudes increased, a compressibility correction became necessary because airflow produces a total pressure on the pitot head that is greater than if the flow were incompressible. We now use EAS as a basis for design airspeeds (§ 23.235). Values of CAS versus EAS may be calculated or you may use the chart in Appendix 7, figure A7-5, to convert knots CAS to EAS.
3. GPS METHOD. The Global Positioning System (GPS) method consists of using a GPS unit to determine ground speed, which is then used to calculate true airspeed. Any commercial GPS unit can be used that produces consistent results. Once true airspeed is calculated, the data reduction is nearly identical to the speed course method described previously. One difference is that the scale altitude correction factor (∆Vc the difference between CAS and EAS as shown in figure A7-5) may be significant at higher altitudes and speeds that may be flown with this method. Specifically, you will solve the following equation for (∆Vpec):
Vi + ∆Vic + ∆Vpec + ∆Vc = Vtrue* σ And then, assuming that all of the pitot-static error is in the static port, you may calculate the altitude position, error, ∆Hpec, as described in the Trailing Bomb/Cone Method.
a. Test Conditions.
(1) Air Quality. The air should be as smooth as possible with a minimum of turbulence. The wind velocity and direction must be constant for this method to give correct results. (2) Weight and C.G. Same as the speed course method.
(3) Altitude. The altitude is not critical, but it should be chosen where the air is smooth and the winds are constant. (4) Speed Range. Any speed at which the aircraft can be stabilized in level flight (see Figure A9-2). (5) Runs . Three runs per airspeed are required to calculate one true airspeed. The three runs must be done at the same indicated speed and altitude on different headings. The headings should be 60 to 120 degrees apart. _____ (6) Configuration. Same as the speed course method.
Page A9-12
8/14/03 AC 23-8B Appendix 9
b. Test Procedures.
(1) Stabilize the airplane in steady level flight at the desired test speed configuration. Record the indicated airspeed, pressure altitude (29.92 set), outside air temperature and configuration of the aircraft.
(a) Record both ground track and ground speed from the GPS unit once the values are stable (this can take up to 10 seconds after stabilizing).
(b) Turn 60 to 120 degrees either direction and record the new ground track and speed
once restabilized at the same airspeed and altitude on the new heading. Minor variations in altitude (up to 100 feet) are much preferred to any variation in airspeed from the initial value. A one knot change in indicated airspeed will cause at least a one knot change in true airspeed, but 100 feet of altitude only causes on the order of 1/2 of 1 percent change in the density ratio, σ.
(c) Turn another 60 to 120 degrees in the same direction and record a third set of ground
track and speeds. (2) Once you have three sets of ground track and speed for a given indicated airspeed and configuration, repeat steps (1)(a) through (1)(c) above at sufficient increments, to provide an adequate calibration curve for each of the configurations.
Page A9-13
AC 23-8B 8/14/03 Appendix 9
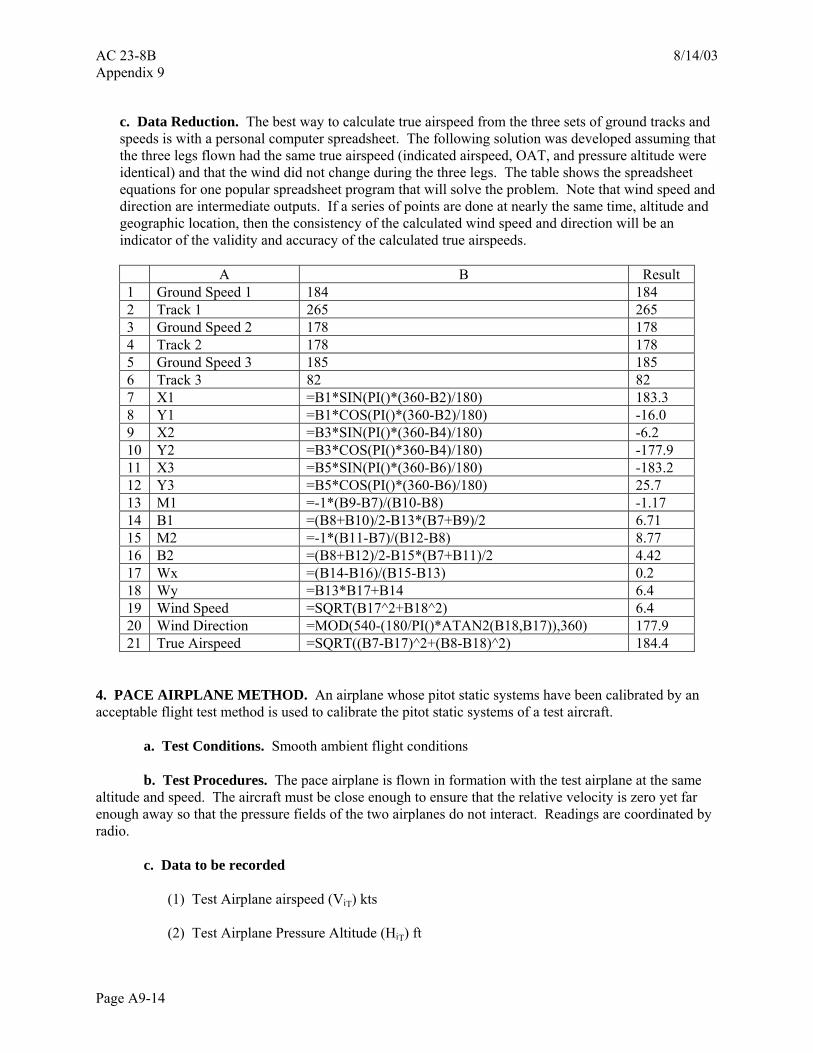
c. Data Reduction. The best way to calculate true airspeed from the three sets of ground tracks and speeds is with a personal computer spreadsheet. The following solution was developed assuming that the three legs flown had the same true airspeed (indicated airspeed, OAT, and pressure altitude were identical) and that the wind did not change during the three legs. The table shows the spreadsheet equations for one popular spreadsheet program that will solve the problem. Note that wind speed and direction are intermediate outputs. If a series of points are done at nearly the same time, altitude and geographic location, then the consistency of the calculated wind speed and direction will be an indicator of the validity and accuracy of the calculated true airspeeds. A B Result 1 Ground Speed 1 184 184 2 Track 1 265 265 3 Ground Speed 2 178 178 4 Track 2 178 178 5 Ground Speed 3 185 185 6 Track 3 82 82 7 X1 =B1*SIN(PI()*(360-B2)/180) 183.3 8 Y1 =B1*COS(PI()*(360-B2)/180) -16.0 9 X2 =B3*SIN(PI()*(360-B4)/180) -6.2 10 Y2 =B3*COS(PI()*360-B4)/180) -177.9 11 X3 =B5*SIN(PI()*(360-B6)/180) -183.2 12 Y3 =B5*COS(PI()*(360-B6)/180) 25.7 13 M1 =-1*(B9-B7)/(B10-B8) -1.17 14 B1 =(B8+B10)/2-B13*(B7+B9)/2 6.71 15 M2 =-1*(B11-B7)/(B12-B8) 8.77 16 B2 =(B8+B12)/2-B15*(B7+B11)/2 4.42 17 Wx =(B14-B16)/(B15-B13) 0.2 18 Wy =B13*B17+B14 6.4 19 Wind Speed =SQRT(B17^2+B18^2) 6.4 20 Wind Direction =MOD(540-(180/PI()*ATAN2(B18,B17)),360) 177.9 21 True Airspeed =SQRT((B7-B17)^2+(B8-B18)^2) 184.4
4. PACE AIRPLANE METHOD. An airplane whose pitot static systems have been calibrated by an acceptable flight test method is used to calibrate the pitot static systems of a test aircraft.
a. Test Conditions. Smooth ambient flight conditions b. Test Procedures. The pace airplane is flown in formation with the test airplane at the same
altitude and speed. The aircraft must be close enough to ensure that the relative velocity is zero yet far enough away so that the pressure fields of the two airplanes do not interact. Readings are coordinated by radio.
c. Data to be recorded
(1) Test Airplane airspeed (ViT) kts
(2) Test Airplane Pressure Altitude (HiT) ft
Page A9-14
8/14/03 AC 23-8B Appendix 9
(3) Pace Airplane airspeed (Vip) kts
(4) Pace Airplane Pressure Altitude (Hip) ft (5) Configuration for both airplanes (6) Fuel used in both airplanes
d. Data Reduction. Correct all the instrument readings for instrument errors and the pace aircraft readings for the known position error.
ktsVVVVVV icTiTpecicpippecT )()( ∆+−∆+∆+=∆
ftHHHHHH icTiTpecicpippecT )()( ∆+−∆+∆+=∆
Calculate and for all data points in each configuration and plot in a manner similar to Figure A9-4 and Figure A9-5.
pecTV∆ pecTH∆
5. PITOT-STATIC BOOM DATA. If a flight test Pitot-Static boom is mounted on an airplane such that the pitot tube (total head) is not affected by flow angularity and the static source is outside the pressure field of the aircraft, then it can be assumed that the boom data is without position errors. The boom data can then be taken as the pace data. The Pitot-Static boom should be calibrated for high alpha and high speed.
a. Test Conditions. Smooth ambient flight conditions b. Test Procedures. The nose or wing-mounted boom is flown in formation with the test
airplane at the same altitude and speed. The aircraft must be close enough to ensure that the relative velocity is zero yet far enough away so that the pressure fields of the two airplanes do not interact. Readings are coordinated by radio.
c. Data to be recorded
(1) Test Airplane airspeed (ViT) kts
(2) Test Airplane Pressure Altitude (HiT) ft
(3) Nose or wing-mounted boom airspeed (Vip) kts
(4) Nose or wing-mounted boom Pressure Altitude (Hip) ft (5) Configuration for both airplanes (6) Fuel used in both airplanes
Page A9-15
AC 23-8B 8/14/03 Appendix 9
d. Data Reduction.
)()( icTiTpecicBiBpect VVVVVV ∆+−∆+∆+=∆ kts
)()( icTiTpecicBiBpect HHVHHH ∆+−∆+∆+=∆ kts ft
pecTV∆ and are calculated throughout the speed range in each configuration and plotted as shown in figures 3 and 4.
pecTH∆
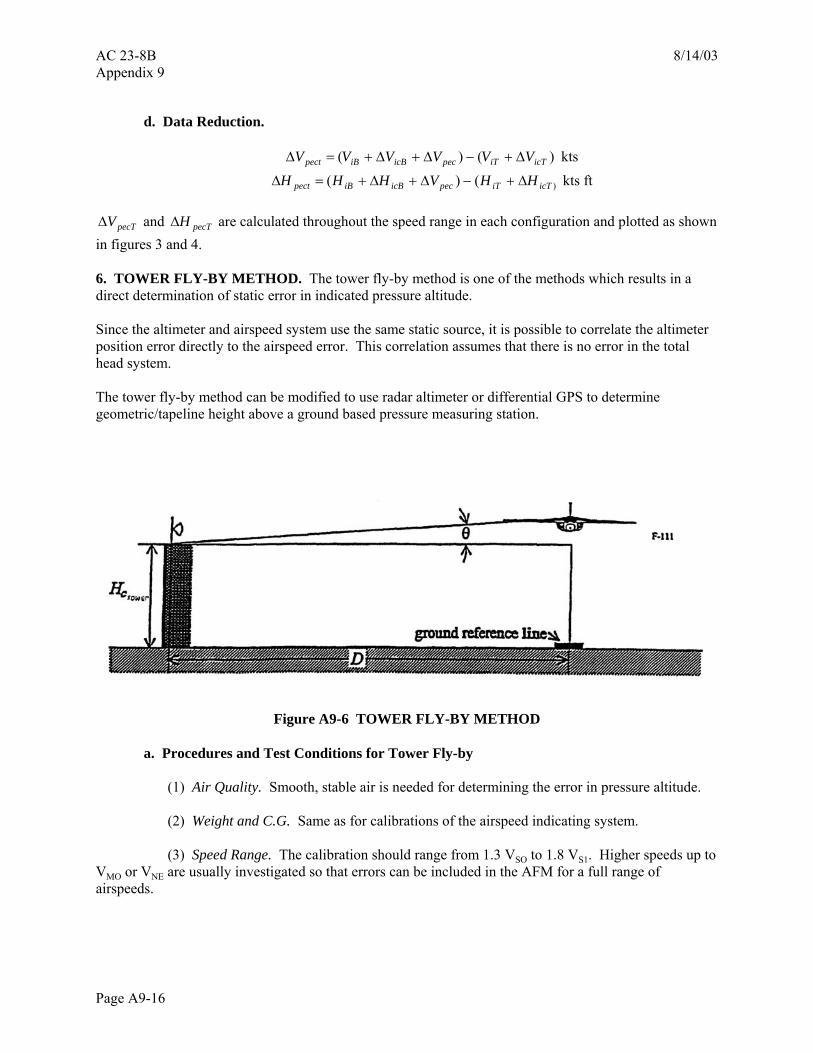
6. TOWER FLY-BY METHOD. The tower fly-by method is one of the methods which results in a direct determination of static error in indicated pressure altitude. Since the altimeter and airspeed system use the same static source, it is possible to correlate the altimeter position error directly to the airspeed error. This correlation assumes that there is no error in the total head system. The tower fly-by method can be modified to use radar altimeter or differential GPS to determine geometric/tapeline height above a ground based pressure measuring station.
Figure A9-6 TOWER FLY-BY METHOD
a. Procedures and Test Conditions for Tower Fly-by
(1) Air Quality. Smooth, stable air is needed for determining the error in pressure altitude. (2) Weight and C.G. Same as for calibrations of the airspeed indicating system. (3) Speed Range. The calibration should range from 1.3 VSO to 1.8 VS1. Higher speeds up to
VMO or VNE are usually investigated so that errors can be included in the AFM for a full range of airspeeds.
Page A9-16
8/14/03 AC 23-8B Appendix 9
(4) Test Procedures. (i) The test technique is to fly the aircraft along a ground reference line, past the tower,
in stabilized flight at a constant airspeed and at the approximate height of the tower. The primary piloting task is to maintain a constant indicated altitude during the run. The tower is equipped with a sensitive altimeter and a means of determining the relative angle (θ ) of the aircraft. The data recorded during each run are the indicated pressure altitude of the tower, (Hitower), the angle (θ ), and the aircraft's indicated pressure altitude, airspeed and temperature (HiA/C, ViA/C, and TiA/C) as it passes the tower. Note that the tower altimeter must be at the zero grid line position in the tower.
(ii) Repeat step (i) at various airspeeds in increments sufficient to cover the required
range at each flap setting. (5) Data Acquisition. Data to be recorded at each test point: (i) Airplane Airspeed ViA/C knots. (ii) Airplane indicated pressure attitude, HiA/C knots. (iii) Tower observer indicated pressure altitude, Hitower. (iv) Angle θ of aircraft above the tower. (v) Wing flap position. (vi) Landing gear position. (vii) Fuel used in airplane. (viii) TiA/C and Titower (6) Data Reduction. The actual pressure altitude of the aircraft is Hcref where
Hcref = (Hitower + ∆ Hictower) + D tan θ t
s
TT
Where Ts is the standard day absolute temperature at the test altitude and Tt is the test day
temperature in absolute units.
Page A9-17
AC 23-8B 8/14/03 Appendix 9
The t
s
TT
temperature correction is to convert the geometric height of the aircraft above the
reference zero grid line in the tower (D tan θ ) to a pressure height that can be added to the pressure altitude of the tower Hctower. The difference between the actual reference pressure altitude of the aircraft and the aircraft's instrument-corrected pressure altitude is the position error correction.
∆ Hpec = Hcref - (HiA/C + H∆ icA/C)
= [(Hitower + H∆ ictower) + D tan θ t
s
TT
] - (HiA/C + ∆ HicA/C)
∆ Hpec is calculated for every speed and aircraft configuration flown past the tower and the data are plotted as per Figure A9-4.
The airspeed system position error corrections can be obtained from the tower fly-by method
if it is assumed that the pitot tube (total head) errors are zero. The hydrostatic equilibrium equation states that the pressure error correction at the static
source is = -∆ sp ρ g H∆ pc and from Section 3.
2
21
cospd Vppp ρ=∆−∆=∆ ....)404
1(42
+++ cc MM 2
21
icoVρ− ....)404
1(42
+++ icic MM
Since it is assumed that 0=∆ pρ and for low speed aircraft, compressibility effects can be
ignored, then )(21 22
iccosd VVpp −=∆−=∆ ρ
The above equation is used to calculate VC at every test point, then .iccpec VVV −=∆ The
data are then plotted as per Figure A9-5. 7. GROUND RUN AIRSPEED SYSTEM CALIBRATION. The airspeed system is calibrated to show compliance with commuter category requirements of § 23.1323(c) during the accelerate-takeoff ground run, and is used to determine IAS values for various V1 and VR speeds. The airspeed system error during the accelerate-takeoff ground run may be determined using a trapped static source reference or a distance measuring unit that provides readouts of ground speed that can be converted into CAS.
a. Definitions.
(1) Ground Run System Error. System error during the accelerate-takeoff ground run is the combination of position error, instrument error, and the dynamic effects, such as lag, which may be caused by acceleration on the runway. (2) Trapped Static Source. An airtight bottle with sufficient internal volume so as to be infinite when compared to an airspeed indicator's internal changes in volume while sensing various airspeeds. The bottle should be insulated to minimize internal bottle temperature changes as testing is in progress. For short periods of time, it can be assumed that the bottle will reflect true static ambient pressure to the test indicator.
Page A9-18
8/14/03 AC 23-8B Appendix 9
(3) Production Airspeed Indicator. An airspeed indicator that conforms to the type certification design standards. The indicator should be installed in the approved instrument panel location since these tests involve the dynamic effects of the indicator that may result from acceleration. (4) Test Airspeed Indicator. A mechanical airspeed indicator with known dynamic characteristics during acceleration or an electronic transducer that can provide airspeed information. (5) Test Reference Altimeter. An altimeter that indicates the altitude of the air trapped in the bottle or local ambient static air if the valve is opened. (6) Ground Run Position Error. Ground run position error is the static-pressure error of the production static source during ground runs with any ground effects included. Any contributions to error due to the total-pressure (pitot) are ignored. (7) Instrument Error. See paragraph 302a(3)(b). (8) Dynamic Effects on Airspeed Indicator. The dynamic effects on airspeed indicators occur as a result of acceleration and rapid change in airspeed during takeoff. This causes many airspeed indicators to indicate an airspeed lower than the actual airspeed. Note: It is possible for electronic airspeed indicators driven by an air data computer to also have errors due to dynamic acceleration effects because of characteristics inherent in the basic design. (9) Distance Measuring Unit. An instrumentation system normally used to record takeoff distance measurements. One output of these systems provides the ground speed versus time as the airplane accelerates during the accelerate-takeoff ground run. Ground speed may be converted into a corresponding CAS value by applying wind and air density corrections at intervals during acceleration where the ship's airspeed indications have been recorded.
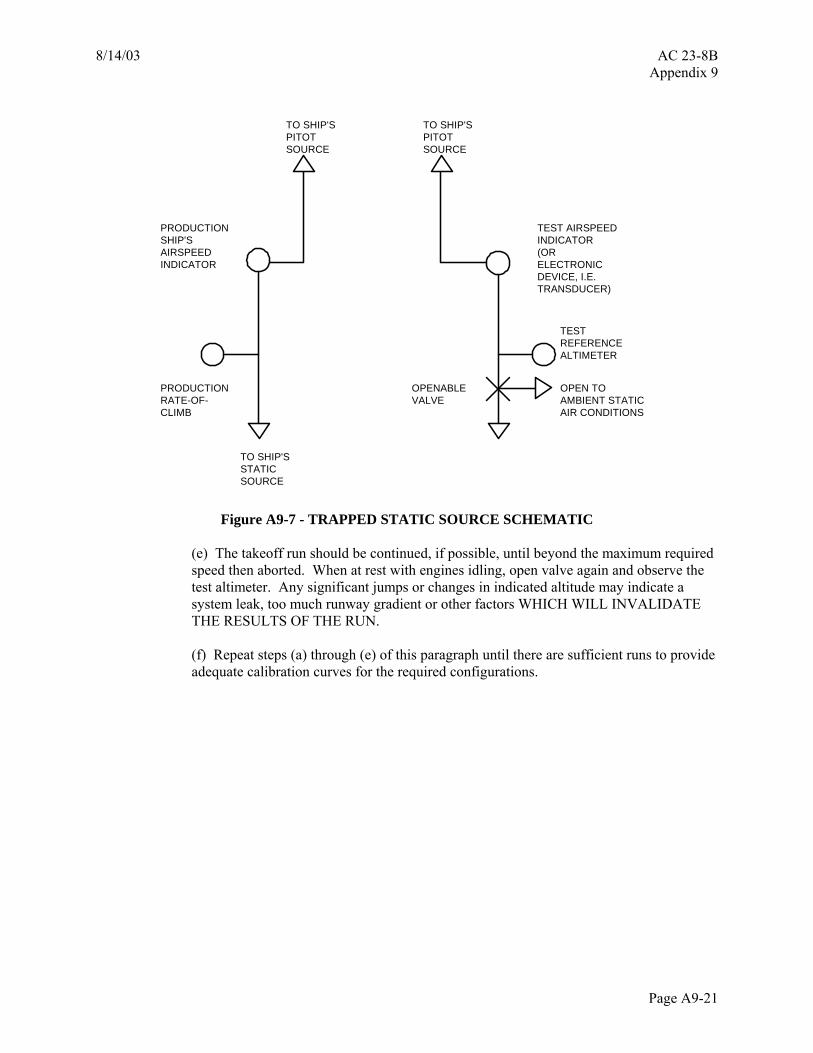
b. Trapped Static Source Method. The trapped static source method consists of comparing instantaneous readings of airspeed, as indicated on a test airspeed indicator, with readings on a production airspeed indicator while accelerating on each other. Readings may be recorded by film or video cameras for mechanical airspeed indicators or by electronic means if a transducer type device is being utilized. See Figure A9-7 for system schematic.
(1) Test Conditions.
(a) Air Quality. The surface winds should be light with a minimum of gusting. (b) Weight and C.G. Ground run calibrations are not sensitive to c.g. The dynamic effects of acceleration may be affected by weight. Test weight variations should be sufficient to account for any measurable effects due to weight. (c) Speed Range. The speeds should range from 0.8 of the minimum V1 to 1.2 times the maximum V1, unless higher values up to VR are required for expansion of takeoff data.
Page A9-19
AC 23-8B 8/14/03 Appendix 9
(d) Configuration. The airspeed system should be calibrated during the accelerate-takeoff ground run for each approved takeoff flap setting.
(2) Test Procedures.
(a) Align the airplane with the runway. (b) With idle engine power, and with the cabin door open, open the valve to expose the bottle to static ambient conditions, then close the valve. Record the test altimeter reading. (c) Close the cabin door. (d) Conduct a takeoff acceleration using normal takeoff procedures. The camera should be recording speeds from the two airspeed indicators in increments sufficient to cover the required airspeed range.
Page A9-20
8/14/03 AC 23-8B Appendix 9
TO SHIP'SPITOTSOURCE
TO SHIP'SPITOTSOURCE
PRODUCTIONSHIP'SAIRSPEEDINDICATOR
PRODUCTIONRATE-OF-CLIMB
TO SHIP'SSTATICSOURCE
TEST AIRSPEEDINDICATOR(ORELECTRONICDEVICE, I.E.TRANSDUCER)
TESTREFERENCEALTIMETER
OPEN TOAMBIENT STATICAIR CONDITIONS
OPENABLEVALVE
Figure A9-7 - TRAPPED STATIC SOURCE SCHEMATIC
(e) The takeoff run should be continued, if possible, until beyond the maximum required speed then aborted. When at rest with engines idling, open valve again and observe the test altimeter. Any significant jumps or changes in indicated altitude may indicate a system leak, too much runway gradient or other factors WHICH WILL INVALIDATE THE RESULTS OF THE RUN. (f) Repeat steps (a) through (e) of this paragraph until there are sufficient runs to provide adequate calibration curves for the required configurations.
Page A9-21
AC 23-8B 8/14/03 Appendix 9
(3) Data Acquisition and Reduction. Read the recorded data (film or video) at increments of airspeed arbitrarily selected within the required range. See Table A9-2 for a sample data reduction. Record and perform the following:
Page A9-22