appendix a - · pdf filekansas city asos wind rose 2000 – 2009 . figure 4. topeka asos...
TRANSCRIPT

APPENDIX A

Figure 1. Chanute ASOS Wind Rose 2000 – 2009

Figure 2. Goodland ASOS Wind Rose 2000 – 2009

Figure 3. Kansas City ASOS Wind Rose 2000 – 2009
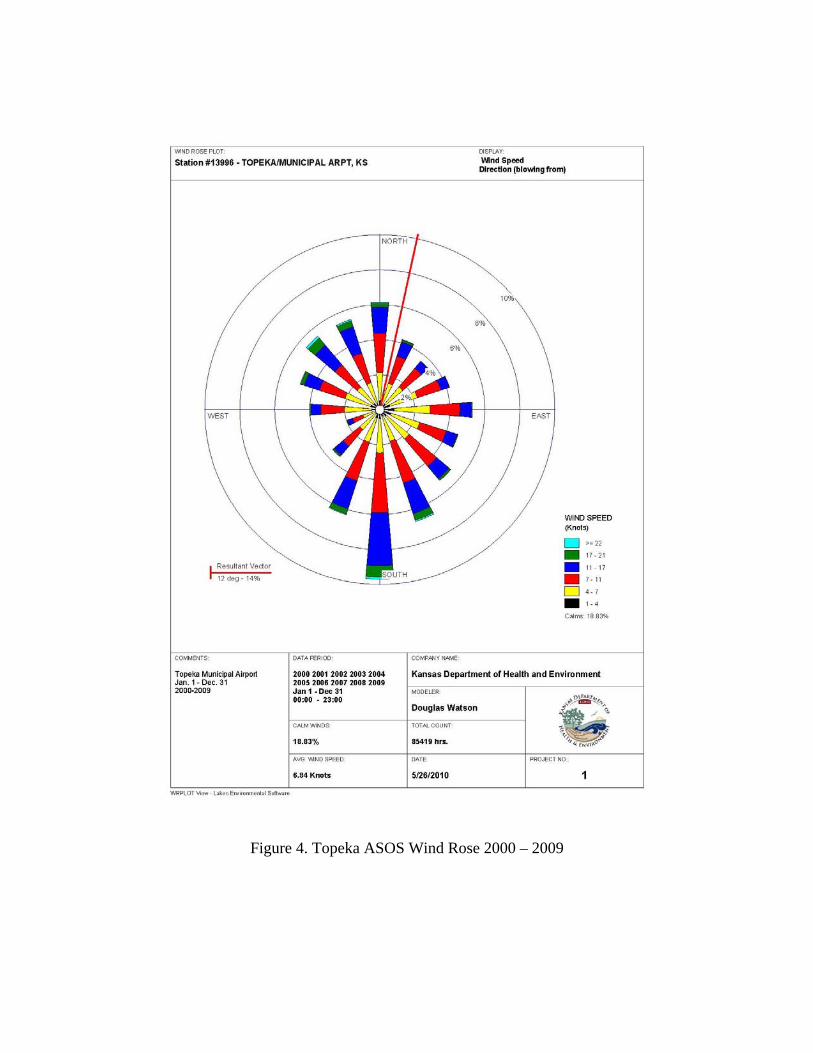
Figure 4. Topeka ASOS Wind Rose 2000 – 2009

Figure 5. Wichita ASOS Wind Rose 2000 – 2009

APPENDIX B

Kansas MSA and CSA Population Data
1-Jul-09 2000 Percent Estimate Population Change Metropolitan Statistical Area
(2000–2009)
Topeka MSA 228,692 224,551 1.84%
Manhattan MSA 123,086 108,999 12.92%
Kansas City MSA 2,067,585 1,836,038 12.61%
Wichita MSA 612,683 571,166 7.27%
Lawrence MSA 116,383 99,962 16.43%
1-Jul-09 2000 Percent Estimate Population Change Combined Statistical Area
(2000–2009) Kansas City-Overland Park-Kansas City CSA 2,136,653 1,901,070 12.39%
Wichita-Winfield CSA 646,317 607,457 6.40% http://en.wikipedia.org/wiki/Table_of_United_States_Metropolitan_Statistical_Areas http://en.wikipedia.org/wiki/Table_of_United_States_Combined_Statistical_Areas

APPENDIX C

Kansas Micropolitan Statistical Areas Population Data
1-Jul-09 2000 Percent Estimate Population Change Micropolitan Statistical Area
(2000–2009)
Atchison μSA 16,411 16,774 -2.16%
Coffeyville μSA 34,254 36,252 -5.51%
Dodge City μSA 33,692 32,458 3.80%
Emporia μSA 36,399 38,965 -6.59%
Garden City μSA 42,074 40,523 3.83%
Great Bend μSA 27,464 28,205 -2.63%
Hays μSA 27,739 27,507 0.84%
Hutchinson μSA 63,357 64,790 -2.21%
Liberal μSA 23,013 22,510 2.23%
McPherson μSA 28,866 29,554 -2.33%
Parsons μSA 21,776 22,835 -4.64%
Pittsburg μSA 38,869 38,242 1.64%
Salina μSA 60,338 59,760 0.97%
Winfield μSA 33,634 36,291 -7.32% http://en.wikipedia.org/wiki/Table_of_United_States_Micropolitan_Statistical_Areas

APPENDIX D

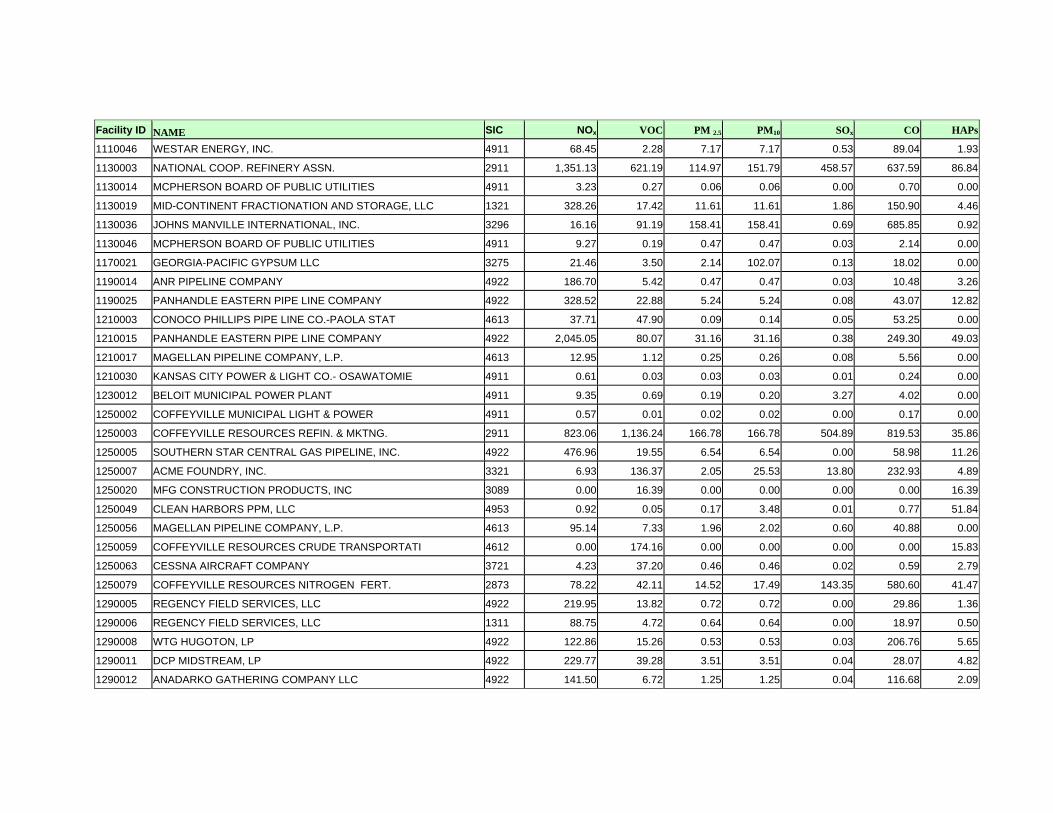
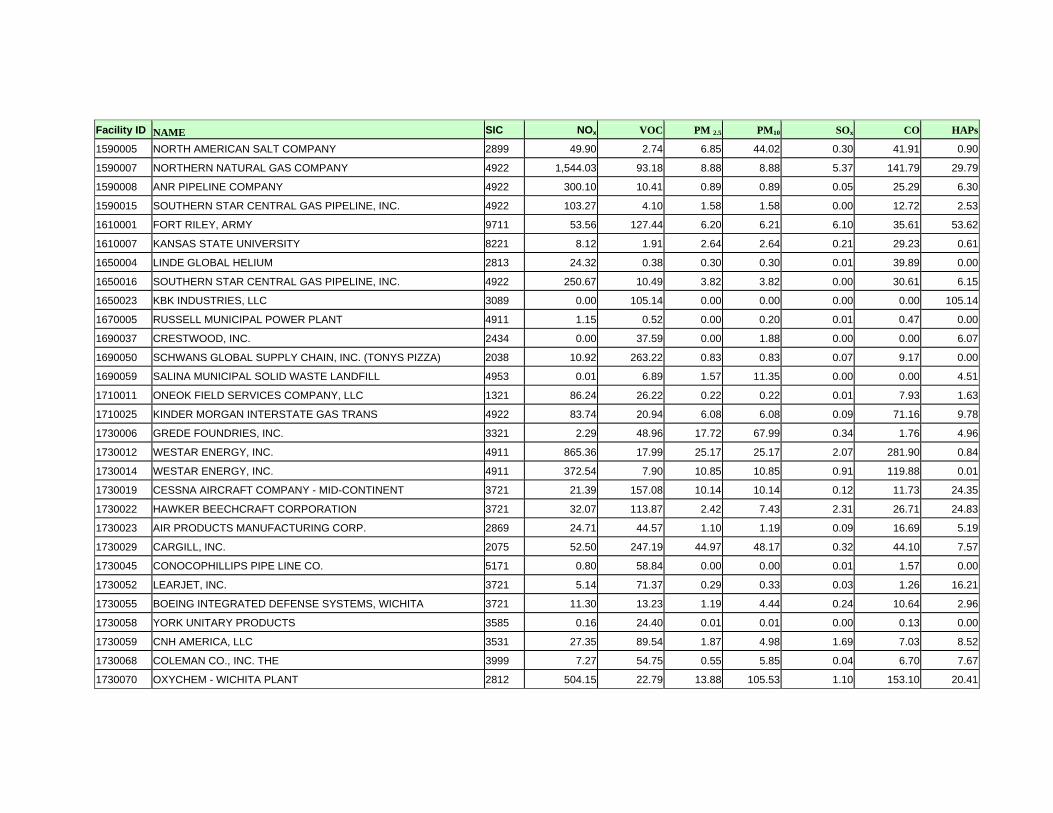
The following contains a table of the latest emission inventory for individual sources in the state and a map of Title V and PSD permitted facility source locations in the state. 2008 Title V Facility Level Emissions (tons/yr) Facility ID NAME SIC NOx VOC PM 2.5 PM10 SOx CO HAPs
0010004 SOUTHERN STAR CENTRAL GAS PIPELINE, INC. 4922 10.30 0.29 0.15 0.15 0.00 2.66 0.02
0010009 MONARCH CEMENT COMPANY (THE) 3241 1,647.35 47.51 3.63 130.67 4.72 917.66 23.68
0010042 ALLEN COUNTY LANDFILL 4953 0.37 0.68 1.32 2.14 0.13 6.86 0.60
0030009 SOUTHERN STAR CENTRAL GAS PIPELINE, INC. 4922 107.49 12.25 1.77 1.77 0.00 16.68 4.91
0030017 ASTRO TRUCK COVERS, INC. 3792 0.20 35.84 0.02 0.02 0.00 0.04 15.05
0050002 MGP INGREDIENTS, INC. 2085 61.13 78.02 9.48 114.50 12.92 70.84 10.12
0050020 BRADKEN - ATCHISON/ST. JOSEPH INC 3325 32.52 342.22 97.97 233.66 9.26 291.81 17.31
0050022 SOUTHERN STAR CENTRAL GAS PIPELINE, INC. 4922 4.48 0.07 0.02 0.02 0.00 7.34 0.04
0070016 ONEOK FIELD SERVICES COMPANY, LLC 1311 234.79 21.20 4.14 4.14 0.07 67.74 6.77
0070048 ONEOK FIELD SERVICES COMPANY, LLC 1311 202.66 67.64 1.48 1.48 0.06 93.22 6.86
0090002 MID-KANSAS ELECTRIC COMPANY LLC -GREAT BEND STATION 4911 149.50 3.84 5.31 5.31 0.40 16.76 1.53
0090031 NATURAL GAS PIPELINE COMPANY OF AMERICA 4922 633.46 45.98 6.22 6.22 0.09 137.76 9.59
0090069 GLASS KING MANUFACTURING COMPANY 3089 0.00 4.51 0.00 0.11 0.00 0.00 4.60
0090070 MCDONALD TANK & EQUIPMENT COMPANY 3089 0.00 10.85 0.00 0.00 0.00 0.00 10.85
0110014 PEERLESS PRODUCTS, INC. 3442 0.00 45.71 0.00 0.00 0.00 0.00 25.68
0150004 FRONTIER EL DORADO REFINING COMPANY 2911 1,161.35 894.49 497.41 497.42 1,529.79 643.60 49.62
0150009 AUGUSTA MUNICIPAL POWER PLANT (#1) 4911 0.00 0.00 0.00 0.00 0.00 0.00 0.00
0150010 AUGUSTA MUNICIPAL POWER PLANT (#2) 4911 6.42 0.48 0.13 0.14 0.01 2.76 0.03
0150027 SHERWIN-WILLIAMS COMPANY (THE) 2851 1.54 22.24 1.75 1.75 0.01 1.29 9.19
0150029 ENBRIDGE PIPELINES (OZARK) LLC 4612 0.00 76.54 0.00 0.00 0.00 0.00 4.75
0150041 BUTLER COUNTY SANITARY LANDFILL 4953 1.80 8.81 0.00 13.41 0.00 33.76 1.59
0210002 EMPIRE DISTRICT ELECTRIC COMPANY (THE) 4911 1,086.00 10.79 24.63 98.41 5,556.00 119.73 35.12
0210023 EVONIK-JAYHAWK FINE CHEMICALS 2869 201.05 36.78 1.14 1.14 0.33 10.42 3.36
0210026 BAGCRAFT PAPERCON 2673 0.67 15.99 0.05 0.05 0.00 0.56 0.00

Facility ID NAME SIC NOx VOC PM 2.5 PM10 SOx CO HAPs
0210028 WHEATLAND LANDFILL, L.L.C. 4953 2.98 1.07 1.28 1.43 1.16 55.82 1.16
0210043 PRESTIGE CABINETS INC. 2434 0.00 20.60 0.00 1.28 0.00 0.00 3.62
0230013 SOUTHERN STAR CENTRAL GAS PIPELINE, INC. 4922 247.66 10.38 3.77 3.77 0.00 30.20 6.07
0250015 DCP MIDSTREAM, LP 4922 217.31 45.23 1.99 1.99 0.02 154.64 2.84
0250016 DCP MIDSTREAM, LP 4922 224.62 52.84 1.76 1.76 0.04 174.45 2.73
0270001 NORTHERN NATURAL GAS COMPANY 4922 431.13 31.74 7.74 7.74 2.27 81.15 5.88
0270007 CLAY CENTER PUBLIC UTILITIES 4911 5.53 0.50 0.12 0.13 0.03 2.92 0.00
0290009 CLOUD CERAMICS (DIV. GENERAL FINANCE) 3251 14.02 2.16 0.00 42.34 26.84 48.07 10.95
0290010 NATURAL GAS PIPELINE COMPANY OF AMERICA 4922 357.86 9.47 3.35 3.35 0.39 82.67 3.30
0290028 NUSTAR PIPELINE OPERATING PARTNERSHIP L.P. 5171 0.00 111.27 0.00 0.00 0.00 0.00 6.57
0330001 ANR PIPELINE COMPANY 4922 0.18 0.03 0.00 0.00 0.00 0.08 0.00
0350012 WINFIELD MUNICIPAL POWER PLANT 4911 4.40 0.09 0.12 0.12 0.01 1.32 0.00
0350031 GE ENGINE SERVICES, INC - STROTHER SOUTH 3724 63.83 79.34 3.12 3.12 5.25 29.51 1.50
0350032 GREIF, INC. 3412 0.66 69.24 0.05 0.05 0.00 0.55 16.29
0350036 COFFEYVILLE RESOURCES CRUDE TRANSPORTATI 4612 0.00 181.18 0.00 0.00 0.00 0.00 14.23
0370031 KENDALL PACKAGING CORP. 2759 0.00 95.89 0.00 0.00 0.00 0.00 0.00
0370039 OAK GROVE LANDFILL 4953 10.19 2.61 1.37 14.89 2.13 54.56 0.66
0410008 ANR PIPELINE COMPANY 4922 578.50 18.14 1.54 1.54 0.09 28.68 10.29
0410017 WESTAR ENERGY, INC. 4911 12.79 0.08 0.26 0.26 0.14 3.28 0.00
0430001 MAGELLAN PIPELINE COMPANY, L.P. 5171 0.00 88.87 0.00 0.00 0.00 0.00 4.61
0450006 API FOILS 3497 1.30 15.61 0.10 0.23 0.01 1.09 5.34
0450013 ICL PERFORMANCE PRODUCTS, LP 2819 34.65 1.91 12.24 63.18 0.21 29.10 0.56
0450014 WESTAR ENERGY, INC. 4911 4,315.97 70.82 703.39 1,018.28 2,704.16 589.62 15.26
0450055 CHEMTRADE LOGISTICS PHOSPHORUS SPECIALTIES,LLC 2819 0.55 0.03 0.04 4.20 4.11 0.46 0.00
0470012 NATURAL GAS PIPELINE COMPANY OF AMERICA 4922 2.17 0.32 0.06 0.06 0.02 1.28 0.00
0510056 HESS SERVICES INC 3089 0.00 34.90 0.91 14.42 0.00 0.00 31.36
0530001 NATURAL GAS PIPELINE COMPANY OF AMERICA 4922 8.13 1.56 0.16 0.16 0.07 4.96 0.00
0530002 ONEOK FIELD SERVICES COMPANY, LLC 1321 69.12 338.15 13.52 17.25 1.63 74.20 23.08
0530004 ACME BRICK COMPANY 3251 4.42 0.30 0.00 10.99 8.47 15.16 6.82

Facility ID NAME SIC NOx VOC PM 2.5 PM10 SOx CO HAPs
0550009 WTG HUGOTON, LP 4922 34.19 5.30 0.40 0.40 0.03 34.15 1.25
0550023 SUNFLOWER ELECTRIC POWER CORPORATION 4911 4,514.94 5.23 57.84 138.84 1,955.73 480.80 4.60
0550024 WTG HUGOTON, LP 4922 485.49 32.44 0.18 0.18 0.09 70.78 10.00
0550026 SUNFLOWER ELECTRIC POWER CORPORATION 4911 133.79 2.08 3.24 3.24 0.27 16.67 1.96
0550043 TYSON FRESH MEATS, INC. 2011 55.62 29.73 45.47 50.72 0.48 56.73 0.94
0550054 EXXONMOBIL PRODUCTION COMPANY 1311 22.55 3.23 0.00 0.26 0.02 14.83 1.41
0550055 PALMER MANUFACTURING AND TANK, INC. 3443 0.00 59.04 0.00 3.75 0.00 0.00 48.08
0550062 WESTERN PLAINS REGIONAL LANDFILL 4953 0.02 1.16 0.63 4.80 0.00 0.11 0.61
0550085 KINDER MORGAN INTERSTATE GAS TRANS 4922 961.26 46.42 9.45 9.45 0.18 65.29 15.26
0570001 MID-KANSAS ELECTRIC COMPANY LLC -FORT DODGE STATION 4911 365.40 13.20 18.25 18.25 1.50 201.67 4.50
0570003 KOCH NITROGEN COMPANY, LLC 2873 801.63 80.17 220.45 220.45 0.77 271.86 78.39
0570012 NATURAL GAS PIPELINE COMPANY OF AMERICA 4922 308.56 62.33 1.12 1.12 0.32 45.74 3.98
0570013 NATIONAL BEEF PACKING COMPANY, L.L.C. 2011 54.68 21.23 62.67 65.39 0.59 59.24 0.96
0570030 CARGILL MEAT SOLUTIONS 2011 13.94 1.53 53.08 53.08 51.93 23.37 0.00
0590006 OTTAWA MUNICIPAL POWER PLANT 4911 34.46 2.25 0.69 0.71 0.11 13.77 0.00
0590018 SOUTHERN STAR CENTRAL GAS PIPELINE, INC. 4922 8.65 2.80 0.62 0.38 0.00 2.28 0.00
0590022 QUEST PIPELINES (KPC), LP 4922 3.78 0.05 0.03 0.03 0.00 5.85 0.00
0590035 SCHUFF STEEL MIDWEST 3441 1.99 24.60 0.36 0.87 0.11 0.70 11.79
0670007 COLUMBIAN CHEMICALS COMPANY 2895 402.77 38.55 0.00 16.58 2,060.39 1,090.84 4.73
0670008 EXXONMOBIL PRODUCTION COMPANY 1311 201.34 13.12 5.00 5.00 0.06 37.32 7.78
0670017 PIONEER NATURAL RESOURCES USA, INC. 4922 49.10 4.98 0.78 0.78 0.03 55.99 2.77
0670023 BP AMERICA PRODUCTION COMPANY 4922 60.29 25.86 0.01 0.01 0.06 59.18 11.03
0670024 BP AMERICA PRODUCTION COMPANY 4922 41.51 19.12 0.01 0.01 0.06 58.19 12.06
0670025 DCP MIDSTREAM, LP 4922 767.52 99.59 11.71 11.71 0.14 93.61 20.18
0670026 DCP MIDSTREAM, LP 4922 206.37 22.70 2.68 2.68 0.06 187.98 2.60
0670029 SOUTHERN STAR CENTRAL GAS PIPELINE, INC. 4922 190.05 16.13 3.52 3.52 0.00 48.44 1.40
0670030 BP AMERICA PRODUCTION COMPANY 1311 331.38 23.54 2.46 2.82 0.06 41.50 11.89
0670031 SOUTHERN STAR CENTRAL GAS PIPELINE, INC. 4922 0.00 0.00 0.00 0.00 0.00 0.00 0.00
0670032 BP AMERICA PRODUCTION COMPANY 1311 901.74 65.31 6.85 7.57 0.22 132.75 36.56

Facility ID NAME SIC NOx VOC PM 2.5 PM10 SOx CO HAPs
0670035 ONEOK FIELD SERVICES COMPANY, LLC 4922 1,002.22 106.10 15.27 15.27 0.19 122.04 26.82
0670045 EXXONMOBIL PRODUCTION COMPANY 1311 21.35 3.10 0.25 0.25 0.01 14.04 1.33
0670046 EXXONMOBIL PRODUCTION COMPANY 4922 31.67 4.51 0.37 0.37 0.02 20.82 1.97
0670048 OXY USA, INC. 4922 29.84 17.21 0.00 0.00 0.00 42.63 0.00
0670049 PIONEER NATURAL RESOURCES USA, INC. 1321 671.56 157.86 9.00 9.00 4.55 632.04 42.13
0690011 SOUTHERN STAR CENTRAL GAS PIPELINE, INC. 4922 174.78 18.15 2.66 2.66 0.00 21.31 4.05
0730014 QUEST PIPELINES (KPC), LP 4922 16.69 0.22 0.14 0.14 0.00 25.81 0.00
0750006 KINDER MORGAN INTERSTATE GAS TRANS 4922 125.56 16.54 0.11 0.11 0.05 24.25 3.05
0750009 REGENCY GAS SERVICES 4922 123.85 7.62 0.40 0.40 0.00 16.81 0.76
0750012 ONEOK FIELD SERVICES COMPANY, LLC 1311 187.98 39.59 3.78 3.78 0.05 69.28 8.49
0770001 ONEOK FIELD SERVICES COMPANY, LLC 4922 600.73 23.51 9.50 9.50 0.52 73.73 14.35
0770002 ANTHONY MUNICIPAL POWER PLANT 4911 27.30 2.02 0.56 0.58 0.03 11.73 0.00
0770038 PLUMB THICKET LANDFILL 4953 0.00 3.33 1.83 17.25 0.00 0.00 1.78
0790001 SOUTHERN STAR CENTRAL GAS PIPELINE, INC. 4922 352.76 16.06 5.38 5.38 0.00 43.10 8.59
0790021 AGCO CORPORATION 3523 11.40 83.34 0.90 5.39 0.07 7.68 8.59
0790045 MID CONTINENT CABINETRY 2434 1.73 186.82 0.13 0.41 0.01 1.46 28.03
0810004 REGENCY FIELD SERVICES, LLC 4922 736.54 45.33 2.41 2.41 0.00 100.00 4.50
0810007 ONEOK FIELD SERVICES COMPANY, LLC 4922 153.26 43.16 5.21 5.21 0.16 214.61 8.44
0810012 BP AMERICA PRODUCTION COMPANY 1311 504.34 36.00 3.76 3.78 0.15 95.74 24.71
0810015 DCP MIDSTREAM, LP 4922 548.82 66.37 6.85 6.85 0.12 369.94 6.48
0870025 HAMM SANITARY LANDFILL 4953 0.00 7.20 6.10 25.22 4.41 0.00 8.54
0910010 SPX COOLING TECHNOLOGIES, INC. 3089 1.19 144.94 0.03 0.41 0.01 0.29 9.07
0910055 ROBBIE MANUFACTURING, INC. 2759 0.77 142.95 0.06 0.06 0.00 0.65 0.00
0910057 AGC FLAT GLASS NORTH AMERICA, INC. 3211 883.24 9.74 0.00 64.86 223.86 171.11 1.16
0910074 PACKAGING PRODUCTS CORPORATION, LLC 2759 0.52 101.77 0.04 0.04 0.00 0.44 0.00
0910084 VITA CRAFT CORPORATION 3469 0.00 0.00 0.00 92.03 0.00 0.00 14.50
0910117 DEFFENBAUGH INDUSTRIES, INC. 4953 11.25 28.78 4.65 5.28 8.36 205.20 12.13
0910174 KANSAS CITY POWER & LIGHT CO.-WEST GARDNER 4911 12.34 0.99 0.89 0.89 0.28 7.05 0.00
0910249 ENGINEERED AIR 3585 0.00 14.93 0.00 0.00 0.00 0.00 7.10

Facility ID NAME SIC NOx VOC PM 2.5 PM10 SOx CO HAPs
0930005 REGENCY GAS SERVICES 4922 279.65 17.21 0.91 0.91 0.00 37.97 1.71
0930008 WTG HUGOTON, LP 4922 172.01 46.51 0.67 0.67 0.05 315.19 3.45
0930010 BP AMERICA PRODUCTION COMPANY 1311 678.67 45.78 4.97 5.69 0.14 109.76 29.17
0930012 KINDER MORGAN INTERSTATE GAS TRANS 4922 671.52 27.78 0.10 0.13 0.12 72.00 7.51
0930017 REGENCY GAS SERVICES 4922 350.92 21.60 1.15 1.15 0.00 47.64 2.15
0937003 REGENCY GAS SERVICES 1321 331.31 20.39 1.08 1.08 0.00 44.98 2.03
0937055 COLORADO INTERSTATE GAS COMPANY 4922 509.27 19.28 7.76 7.76 0.09 62.01 12.60
0950002 ONEOK FIELD SERVICES COMPANY, LLC 1321 857.59 75.51 2.37 2.37 0.13 178.49 10.53
0950004 KINGMAN MUNICIPAL POWER PLANT 4911 34.45 2.45 0.96 1.03 0.01 16.49 0.31
0950023 KANSAS GAS SERVICE 4922 91.69 7.28 1.40 1.40 0.02 11.16 2.21
0950043 ONEOK FIELD SERVICES COMPANY, LLC 1311 40.83 9.74 0.36 0.36 0.01 68.66 1.31
0970009 ANR PIPELINE COMPANY 4922 659.29 19.06 1.60 1.60 0.09 28.29 11.58
0970010 NORTHERN NATURAL GAS COMPANY 4922 876.97 1,392.03 9.22 9.33 0.18 108.81 42.68
0970011 PANHANDLE EASTERN PIPE LINE COMPANY 4922 1,350.31 49.76 9.58 9.58 0.62 148.77 25.75
0970019 ONEOK FIELD SERVICES COMPANY, LLC 1311 73.17 4.97 0.64 0.64 0.02 123.17 1.04
0970024 ONEOK FIELD SERVICES COMPANY, LLC 1311 68.21 4.96 0.60 0.60 0.02 114.82 1.00
0990001 WESTAR ENERGY, INC. 4911 3.18 0.16 0.20 0.20 0.01 0.63 0.00
0990010 KANSAS ARMY AMMUNITION PLANT 3489 10.96 0.07 1.54 2.20 58.56 1.39 0.00
0990037 COLUMBIAN TECTANK 3443 3.75 110.05 10.16 12.50 0.02 1.95 8.00
0990041 GRANDVIEW PRODUCTS COMPANY, INC. 2434 0.00 150.08 0.00 0.48 0.00 0.00 39.03
1030011 SOUTHERN STAR CENTRAL GAS PIPELINE, INC. 4922 20.14 1.05 0.31 0.31 0.00 2.51 0.44
1030016 HALLMARK CARDS, INC. 2679 2.13 38.59 0.16 0.16 0.01 1.79 0.92
1030019 FBOP LEAVENWORTH 9223 5.75 8.62 0.43 0.44 0.10 4.30 0.00
1070005 KANSAS CITY POWER & LIGHT CO. 4911 10,988.30 251.74 222.38 487.72 23,375.52 1,496.31 142.16
1110006 SOUTHERN STAR CENTRAL GAS PIPELINE, INC. 4922 261.20 11.24 3.98 3.98 0.00 31.86 6.26
1110007 PANHANDLE EASTERN PIPE LINE COMPANY 4922 1,107.95 62.46 19.14 19.14 1.88 213.89 25.48
1110008 BUNGE NORTH AMERICA, INC. 2075 31.34 241.99 10.86 39.39 0.19 26.32 149.76
1110014 TYSON FRESH MEATS, INC. 2011 13.78 2.16 2.86 3.27 0.09 12.00 0.02
1110036 CAMOPLAST ROCKLAND LIMITED 3061 1.97 7.78 0.15 0.30 0.01 1.65 11.42
Facility ID NAME SIC NOx VOC PM 2.5 PM10 SOx CO HAPs
1110046 WESTAR ENERGY, INC. 4911 68.45 2.28 7.17 7.17 0.53 89.04 1.93
1130003 NATIONAL COOP. REFINERY ASSN. 2911 1,351.13 621.19 114.97 151.79 458.57 637.59 86.84
1130014 MCPHERSON BOARD OF PUBLIC UTILITIES 4911 3.23 0.27 0.06 0.06 0.00 0.70 0.00
1130019 MID-CONTINENT FRACTIONATION AND STORAGE, LLC 1321 328.26 17.42 11.61 11.61 1.86 150.90 4.46
1130036 JOHNS MANVILLE INTERNATIONAL, INC. 3296 16.16 91.19 158.41 158.41 0.69 685.85 0.92
1130046 MCPHERSON BOARD OF PUBLIC UTILITIES 4911 9.27 0.19 0.47 0.47 0.03 2.14 0.00
1170021 GEORGIA-PACIFIC GYPSUM LLC 3275 21.46 3.50 2.14 102.07 0.13 18.02 0.00
1190014 ANR PIPELINE COMPANY 4922 186.70 5.42 0.47 0.47 0.03 10.48 3.26
1190025 PANHANDLE EASTERN PIPE LINE COMPANY 4922 328.52 22.88 5.24 5.24 0.08 43.07 12.82
1210003 CONOCO PHILLIPS PIPE LINE CO.-PAOLA STAT 4613 37.71 47.90 0.09 0.14 0.05 53.25 0.00
1210015 PANHANDLE EASTERN PIPE LINE COMPANY 4922 2,045.05 80.07 31.16 31.16 0.38 249.30 49.03
1210017 MAGELLAN PIPELINE COMPANY, L.P. 4613 12.95 1.12 0.25 0.26 0.08 5.56 0.00
1210030 KANSAS CITY POWER & LIGHT CO.- OSAWATOMIE 4911 0.61 0.03 0.03 0.03 0.01 0.24 0.00
1230012 BELOIT MUNICIPAL POWER PLANT 4911 9.35 0.69 0.19 0.20 3.27 4.02 0.00
1250002 COFFEYVILLE MUNICIPAL LIGHT & POWER 4911 0.57 0.01 0.02 0.02 0.00 0.17 0.00
1250003 COFFEYVILLE RESOURCES REFIN. & MKTNG. 2911 823.06 1,136.24 166.78 166.78 504.89 819.53 35.86
1250005 SOUTHERN STAR CENTRAL GAS PIPELINE, INC. 4922 476.96 19.55 6.54 6.54 0.00 58.98 11.26
1250007 ACME FOUNDRY, INC. 3321 6.93 136.37 2.05 25.53 13.80 232.93 4.89
1250020 MFG CONSTRUCTION PRODUCTS, INC 3089 0.00 16.39 0.00 0.00 0.00 0.00 16.39
1250049 CLEAN HARBORS PPM, LLC 4953 0.92 0.05 0.17 3.48 0.01 0.77 51.84
1250056 MAGELLAN PIPELINE COMPANY, L.P. 4613 95.14 7.33 1.96 2.02 0.60 40.88 0.00
1250059 COFFEYVILLE RESOURCES CRUDE TRANSPORTATI 4612 0.00 174.16 0.00 0.00 0.00 0.00 15.83
1250063 CESSNA AIRCRAFT COMPANY 3721 4.23 37.20 0.46 0.46 0.02 0.59 2.79
1250079 COFFEYVILLE RESOURCES NITROGEN FERT. 2873 78.22 42.11 14.52 17.49 143.35 580.60 41.47
1290005 REGENCY FIELD SERVICES, LLC 4922 219.95 13.82 0.72 0.72 0.00 29.86 1.36
1290006 REGENCY FIELD SERVICES, LLC 1311 88.75 4.72 0.64 0.64 0.00 18.97 0.50
1290008 WTG HUGOTON, LP 4922 122.86 15.26 0.53 0.53 0.03 206.76 5.65
1290011 DCP MIDSTREAM, LP 4922 229.77 39.28 3.51 3.51 0.04 28.07 4.82
1290012 ANADARKO GATHERING COMPANY LLC 4922 141.50 6.72 1.25 1.25 0.04 116.68 2.09

Facility ID NAME SIC NOx VOC PM 2.5 PM10 SOx CO HAPs
1297127 COLORADO INTERSTATE GAS COMPANY 4922 481.07 14.49 1.80 1.80 0.07 39.95 7.21
1330001 ASH GROVE CEMENT COMPANY 3241 1,872.79 24.56 18.14 253.67 79.02 302.72 97.57
1330027 HBD INDUSTRIES, INC. 3444 0.32 5.05 0.02 0.02 0.00 0.27 5.03
1330028 CITY OF CHANUTE ELEC. DEPT., PLANT #3 4911 52.03 3.85 1.07 1.10 0.04 22.33 0.00
1330030 CITY OF CHANUTE ELEC. DEPT., PLANT #2 4911 11.73 0.29 0.74 0.74 0.07 2.02 0.00
1410020 KINDER MORGAN INTERSTATE GAS TRANS 4922 41.71 51.26 1.74 1.74 0.08 106.01 11.95
1410023 OSBORNE INDUSTRIES, INC. 3089 0.00 4.43 0.00 0.00 0.00 0.00 4.41
1430001 NORTHERN NATURAL GAS COMPANY 4922 152.88 7.89 3.15 3.15 1.63 39.18 0.34
1430022 DAK PLASTICS, INC. 3089 0.00 24.92 0.00 0.00 0.00 0.00 24.92
1450016 NORTHERN NATURAL GAS COMPANY 4922 121.95 3.26 2.61 2.61 1.33 32.22 0.27
1450039 HANSON ENGINEERING, L.C. 1311 0.11 0.01 0.01 0.01 6.26 0.09 0.00
1470001 COFFEYVILLE RESOURCES TERMINAL LLC 5171 9.61 118.88 0.76 0.76 0.06 6.53 8.18
1490001 WESTAR ENERGY, INC. 4911 19,818.34 264.42 581.58 1,409.08 47,934.13 4,112.25 81.09
1490012 WAMEGO MUNICIPAL POWER PLANT 4911 18.44 1.34 0.55 0.57 0.03 7.62 0.00
1490016 ANR PIPELINE COMPANY 4922 414.58 15.58 1.31 1.31 0.05 54.89 10.34
1490020 THE ONYX COLLECTION, INC. 3088 0.00 64.61 0.00 0.00 0.00 0.00 64.61
1510018 NORTHERN NATURAL GAS COMPANY 4922 34.75 16.87 1.19 1.19 0.08 8.50 1.61
1530014 SOUTHERN STAR CENTRAL GAS PIPELINE, INC. 4922 250.90 10.50 3.83 3.83 0.00 30.62 6.14
1530019 KINDER MORGAN INTERSTATE GAS TRANS 4922 23.68 30.69 1.04 1.04 0.05 63.43 7.28
1550008 PANHANDLE EASTERN PIPE LINE COMPANY 4922 2,275.75 82.13 25.08 25.08 0.40 245.68 49.30
1550009 KRAUSE CORPORATION, INC. 3523 1.11 30.33 0.00 0.33 0.00 0.00 7.76
1550011 ONEOK HYDROCARBON L.P. 1321 63.91 188.07 4.31 4.31 1.76 56.99 3.66
1550033 WESTAR ENERGY, INC. 4911 396.96 9.04 11.89 11.89 1.09 131.83 0.27
1550063 SONOCO-HUTCHINSON, LLC 2631 72.38 10.50 1.96 1.96 0.16 21.71 0.00
1550066 NUSTAR PIPELINE OPERATING PARTNERSHIP L.P. 5171 0.79 66.27 0.00 0.00 0.00 1.98 4.37
1550071 COLLINS BUS CORPORATION 3713 1.05 58.20 0.08 0.81 0.01 0.88 5.48
1550086 HAVEN STEEL PRODUCTS, INC. 3499 2.91 12.56 0.22 0.22 0.02 2.44 0.20
1550110 RENO COUNTY MUNICIPAL SOLID WASTE LANDFILL 4953 0.36 9.78 0.00 0.10 0.09 3.46 8.14
1550122 ADE-WIFCO STEEL PRODUCTS INC 3448 0.00 26.20 0.00 7.61 0.00 0.00 5.03
Facility ID NAME SIC NOx VOC PM 2.5 PM10 SOx CO HAPs
1590005 NORTH AMERICAN SALT COMPANY 2899 49.90 2.74 6.85 44.02 0.30 41.91 0.90
1590007 NORTHERN NATURAL GAS COMPANY 4922 1,544.03 93.18 8.88 8.88 5.37 141.79 29.79
1590008 ANR PIPELINE COMPANY 4922 300.10 10.41 0.89 0.89 0.05 25.29 6.30
1590015 SOUTHERN STAR CENTRAL GAS PIPELINE, INC. 4922 103.27 4.10 1.58 1.58 0.00 12.72 2.53
1610001 FORT RILEY, ARMY 9711 53.56 127.44 6.20 6.21 6.10 35.61 53.62
1610007 KANSAS STATE UNIVERSITY 8221 8.12 1.91 2.64 2.64 0.21 29.23 0.61
1650004 LINDE GLOBAL HELIUM 2813 24.32 0.38 0.30 0.30 0.01 39.89 0.00
1650016 SOUTHERN STAR CENTRAL GAS PIPELINE, INC. 4922 250.67 10.49 3.82 3.82 0.00 30.61 6.15
1650023 KBK INDUSTRIES, LLC 3089 0.00 105.14 0.00 0.00 0.00 0.00 105.14
1670005 RUSSELL MUNICIPAL POWER PLANT 4911 1.15 0.52 0.00 0.20 0.01 0.47 0.00
1690037 CRESTWOOD, INC. 2434 0.00 37.59 0.00 1.88 0.00 0.00 6.07
1690050 SCHWANS GLOBAL SUPPLY CHAIN, INC. (TONYS PIZZA) 2038 10.92 263.22 0.83 0.83 0.07 9.17 0.00
1690059 SALINA MUNICIPAL SOLID WASTE LANDFILL 4953 0.01 6.89 1.57 11.35 0.00 0.00 4.51
1710011 ONEOK FIELD SERVICES COMPANY, LLC 1321 86.24 26.22 0.22 0.22 0.01 7.93 1.63
1710025 KINDER MORGAN INTERSTATE GAS TRANS 4922 83.74 20.94 6.08 6.08 0.09 71.16 9.78
1730006 GREDE FOUNDRIES, INC. 3321 2.29 48.96 17.72 67.99 0.34 1.76 4.96
1730012 WESTAR ENERGY, INC. 4911 865.36 17.99 25.17 25.17 2.07 281.90 0.84
1730014 WESTAR ENERGY, INC. 4911 372.54 7.90 10.85 10.85 0.91 119.88 0.01
1730019 CESSNA AIRCRAFT COMPANY - MID-CONTINENT 3721 21.39 157.08 10.14 10.14 0.12 11.73 24.35
1730022 HAWKER BEECHCRAFT CORPORATION 3721 32.07 113.87 2.42 7.43 2.31 26.71 24.83
1730023 AIR PRODUCTS MANUFACTURING CORP. 2869 24.71 44.57 1.10 1.19 0.09 16.69 5.19
1730029 CARGILL, INC. 2075 52.50 247.19 44.97 48.17 0.32 44.10 7.57
1730045 CONOCOPHILLIPS PIPE LINE CO. 5171 0.80 58.84 0.00 0.00 0.01 1.57 0.00
1730052 LEARJET, INC. 3721 5.14 71.37 0.29 0.33 0.03 1.26 16.21
1730055 BOEING INTEGRATED DEFENSE SYSTEMS, WICHITA 3721 11.30 13.23 1.19 4.44 0.24 10.64 2.96
1730058 YORK UNITARY PRODUCTS 3585 0.16 24.40 0.01 0.01 0.00 0.13 0.00
1730059 CNH AMERICA, LLC 3531 27.35 89.54 1.87 4.98 1.69 7.03 8.52
1730068 COLEMAN CO., INC. THE 3999 7.27 54.75 0.55 5.85 0.04 6.70 7.67
1730070 OXYCHEM - WICHITA PLANT 2812 504.15 22.79 13.88 105.53 1.10 153.10 20.41

Facility ID NAME SIC NOx VOC PM 2.5 PM10 SOx CO HAPs
1730075 CESSNA AIRCRAFT COMPANY - PAWNEE FACILITY 3721 9.20 63.49 1.38 1.38 0.06 6.96 35.17
1730152 NEX-TECH PROCESSING, INC. 3471 1.69 19.02 0.13 0.51 0.01 1.03 8.67
1730153 COLEMAN CO., INC. THE 3499 4.82 30.18 0.58 0.86 0.03 4.96 0.00
1730155 CHANCE RIDES MFG, INC. 3599 0.00 8.51 0.00 0.00 0.00 0.00 8.51
1730165 GLOBE ENGINEERING COMPANY, INC. 3728 0.17 9.55 0.01 0.01 0.00 0.14 9.54
1730173 CUSTOM CUPBOARDS, INC. 2434 6.82 116.33 4.32 7.11 0.35 8.35 29.09
1730225 CITY OF WICHITA -DEPT. OF NATURAL RESOUR 4953 7.59 58.73 0.00 3.24 1.42 142.39 5.45
1730309 SPIRIT AEROSYSTEMS, INC. 3721 98.29 1,059.02 7.44 286.33 7.86 72.37 326.08
1750001 MID-KANSAS ELECTRIC COMPANY LLC - CIMARRON RIVER STA. 4911 89.87 2.95 4.08 4.08 0.36 45.13 3.11
1750009 ANADARKO GATHERING COMPANY LLC 4922 20.17 4.13 0.34 0.34 0.02 17.90 1.09
1750010 ANADARKO GATHERING COMPANY LLC 4922 129.77 0.45 1.06 1.06 0.03 26.31 1.56
1750012 NATIONAL BEEF PACKING COMPANY, L.L.C. 2011 61.71 21.73 64.83 67.43 40.10 65.80 1.11
1750018 DCP MIDSTREAM, LP 4922 156.23 31.86 2.56 2.56 0.05 83.51 2.65
1750021 PANHANDLE EASTERN PIPE LINE COMPANY 4922 661.22 45.80 9.27 9.27 0.13 165.76 14.49
1750046 NORTHERN NATURAL GAS COMPANY 4922 733.61 100.49 11.26 11.26 0.21 90.94 18.78
1750116 WTG HUGOTON, LP 4922 373.70 14.50 4.53 4.53 0.07 45.50 8.87
1770007 GOODYEAR TIRE & RUBBER COMPANY 3011 99.12 310.52 3.79 60.45 15.02 33.65 10.58
1770018 FRITO-LAY, INC. 2096 16.69 3.65 7.42 27.46 0.12 31.98 0.00
1770030 WESTAR ENERGY, INC. 4911 2,614.38 27.28 58.77 141.47 4,482.23 226.37 24.86
1770035 INNOVIA FILMS, INC. 2823 13.54 1,070.44 0.00 2.69 1,043.51 16.46 556.81
1770180 ROLLING MEADOWS RECYCLING & DISPOSAL FACILITY 4953 21.79 20.36 1.89 11.35 14.15 38.13 2.14
1790011 SOUTHERN STAR CENTRAL GAS PIPELINE, INC. 4922 213.59 9.09 3.26 3.26 0.00 26.09 5.24
1810018 ARCHER DANIELS MIDLAND CO. - NORTHERN SUN 2076 13.67 83.03 10.16 11.49 0.48 8.19 49.45
1830019 ARLWIN MANUFACTURING COMPANY 3089 0.00 3.95 0.00 0.00 0.00 0.00 3.80
1850003 SOUTHERN STAR CENTRAL GAS PIPELINE, INC. 4922 57.09 5.35 0.87 0.87 0.00 7.07 1.39
1890002 WTG HUGOTON, LP 4922 135.41 9.75 2.30 2.30 0.03 18.99 3.58
1890008 WTG HUGOTON, LP 4922 574.24 53.54 2.09 2.09 0.14 773.00 15.46
1890009 WTG HUGOTON, LP 4922 252.72 13.61 3.78 3.78 0.05 47.06 5.89
1890014 ANADARKO GATHERING COMPANY LLC 4922 0.00 0.00 0.00 0.00 0.00 0.00 0.00

Facility ID NAME SIC NOx VOC PM 2.5 PM10 SOx CO HAPs
1890015 ANADARKO GATHERING COMPANY LLC 4922 526.11 79.86 8.28 8.28 0.19 180.53 19.05
1890023 EXXONMOBIL PRODUCTION COMPANY 1311 10.17 0.65 0.25 0.25 0.00 1.85 0.29
1890024 EXXONMOBIL PRODUCTION COMPANY 1311 127.26 7.98 3.17 3.17 0.04 23.16 3.62
1890025 WTG HUGOTON, LP 4922 126.13 13.83 2.14 2.14 0.03 37.85 3.34
1890032 WTG HUGOTON, LP 4922 46.45 2.29 0.28 0.28 0.01 66.57 0.72
1890038 OXY USA, INC. 1311 249.98 18.77 0.06 0.06 0.04 148.63 1.38
1890044 ANADARKO GATHERING COMPANY LLC 4922 69.55 0.08 0.31 0.31 0.00 5.02 0.45
1890046 WTG HUGOTON, LP 4922 166.91 15.90 4.00 4.00 0.03 42.10 3.13
1890050 DORCHESTER MINERALS OPERATING LP 1311 44.96 15.90 0.40 0.40 0.01 69.41 1.63
1890051 ANADARKO GATHERING COMPANY LLC 4922 134.06 33.31 3.15 3.15 0.17 138.95 9.65
1890054 WTG HUGOTON, LP 4922 102.89 35.87 0.00 0.00 0.02 102.89 2.92
1890198 ANADARKO GATHERING COMPANY LLC 4922 142.89 1.75 0.26 0.26 0.02 7.94 0.79
1910019 WELLINGTON MUNICIPAL POWER PLANT 4911 0.88 0.03 0.03 0.03 0.57 0.36 0.00
1910056 WELLINGTON CITY POWER PLANT, GAS TURBINE 4911 1.90 0.03 0.10 0.10 0.01 0.44 0.00
1950011 SOUTHERN STAR CENTRAL GAS PIPELINE, INC. 4922 252.49 10.56 3.85 3.85 0.00 30.84 6.18
2010001 NATURAL GAS PIPELINE COMPANY OF AMERICA 4922 52.29 10.34 0.66 0.66 0.33 31.29 0.00
2010012 MID-KANSAS ELECTRIC COMPANY LLC -CLIFTON STATION 4911 0.28 0.01 0.00 0.01 0.02 0.07 0.00
2050037 COBALT BOATS, LLC 3732 0.00 132.32 18.53 18.53 0.00 0.00 108.73
2050045 BLUESTEM PIPELINE, LLC 1311 177.61 54.01 0.00 0.00 0.00 100.87 1.05
2050055 BLUESTEM PIPELINE, LLC 1311 66.72 46.99 0.00 0.00 0.00 78.77 6.88
2057022 LAFARGE MIDWEST, INC. 3241 1,920.65 5.58 0.00 19.97 412.39 89.01 20.24
2057039 SYSTECH ENVIRONMENTAL CORP. 4953 20.56 27.86 0.00 0.00 0.00 7.24 8.23
2090001 CERTAINTEED CORPORATION 3296 64.20 60.17 0.97 68.01 0.24 89.80 23.55
2090003 FOREST VIEW LANDFILL, LLC 4953 8.79 1.72 3.74 3.74 3.08 164.81 2.74
2090008 BOARD OF PUBLIC UTILITIES - NEARMAN 4911 3,526.37 32.25 34.35 93.68 5,992.03 269.26 16.48
2090009 AMSTED RAIL COMPANY, INC. 3462 42.28 37.35 31.46 57.12 9.32 229.61 8.95
2090010 OWENS CORNING INSULATING SYSTEMS, LLC 3296 218.67 98.75 178.13 211.07 36.31 114.70 63.00
2090039 PQ CORPORATION 2819 90.84 13.68 4.69 17.71 0.55 43.42 8.05
2090046 GENERAL MOTORS LLC 3711 37.36 934.08 3.57 29.95 0.39 14.11 37.22

Facility ID NAME SIC NOx VOC PM 2.5 PM10 SOx CO HAPs
2090048 BOARD OF PUBLIC UTILITIES - QUINDARO 4911 3,416.05 29.83 21.98 47.62 3,901.87 174.53 2.19
2090049 BOARD OF PUBLIC UTILITIES - KAW 4911 0.12 0.01 0.01 0.01 0.00 0.09 0.00
2090060 MAGELLAN PIPELINE COMPANY, L.P. 5171 11.99 212.83 0.00 24.00 0.00 32.13 10.95
2090063 SINCLAIR TRANSPORTATION COMPANY 5171 1.98 90.09 0.00 0.00 0.00 2.46 3.39
2090075 CONOCOPHILLIPS PIPE LINE - KANSAS CITY TERMINAL 5171 4.22 62.29 0.00 0.00 0.05 2.52 0.51
2090194 STERICYCLE, INC. 4953 11.09 0.44 0.82 1.39 1.18 0.01 0.00

Title V (green) and PSD (red) permitted facility source locations.
Source: KDHE Emission Inventory and Compliance database (May, 5th 2010)

APPENDIX E

Mercury Deposition Monitoring in Kansas: Network Report
Our Vision – Healthier Kansans living in safe and sustainable environments.
December 10, 2009
Kansas Department of Health and Environment Bureau of Air
1000 SW Jackson – Suite 310 Topeka, KS 66612-1366

Mercury Deposition Monitoring in Kansas: Network Report
Table of Contents
Summary of Mercury Deposition Network Development and Monitoring Introduction 1
Factors Affecting Mercury Deposition 1 National MDN Data 2 Figure 1. Total Mercury Concentration – 2008 3 Figure 2. Total Mercury Wet Deposition – 2008 3 Figure 3. Kansas Mercury Wet Deposition Network and Sites in Nebraska
and Oklahoma 4 Kansas Deposition Data for 2009 5 Table 1. Kansas Mercury Wet Deposition Data 5 Figure 4. 2008 Monthly Hg Deposition and Precipitation at KS03 6 Figure 5. 2008 Monthly Hg Deposition and Precipitation at KS24 7 Figure 6. 2008 Monthly Hg Deposition and Precipitation at KS32 8 Figure 7. 2008 Monthly Hg Deposition and Precipitation at KS04 9 Figure 8. 2008 Monthly Hg Deposition and Precipitation at KS05 10 Figure 9. 2008 Monthly Hg Deposition and Precipitation at KS99 11 . Network Cost Analysis 12 Looking Ahead 12

1
Mercury Deposition Monitoring in Kansas: Network Report
Summary of Mercury Deposition Network Development and Monitoring Introduction KSA 75-5673 requires that the Kansas Department of Health and Environment (KDHE) establish a statewide mercury deposition network consisting of at least six monitoring sites. Monitoring for a period of time long enough to determine trends (five or more years) is also specified. The network has been designed to assure compatibility with the national Mercury Deposition Network (MDN). The MDN, coordinated through the National Atmospheric Deposition Program (NADP), is designed to study and quantify the atmospheric fate and deposition of mercury. The MDN collects weekly samples of wet deposition (rain and snow) for analysis to determine total mercury. Discussion of Factors Affecting Mercury Deposition Most mercury in the atmosphere is present as elemental mercury (Hg0). Some of this mercury is converted to reactive gaseous mercury (Hg2+), which is the predominant form flushed from the atmosphere by precipitation. It is generally believed that most atmospheric Hg2+ is in the form of mercuric chloride (HgCl2). In general, concentration and deposition amounts are higher during the warmer months. Seasonal variation occurs for several reasons:
1) Higher temperatures and faster reaction rates cause more rapid chemical conversion.
2) More oxidants, such as ozone (O3) and hydroxyl ions (OH-), that can convert Hg0 to Hg2+ are present.
3) Higher concentrations of Hg0 are present in the atmosphere (due to higher emissions from increased power generation, etc.).
4) More precipitation generally occurs and flushes more mercury out of the air more efficiently.
5) The atmosphere contains particulate matter, and therefore, more mercury to be flushed.
There are three factors which affect deposition of atmospheric mercury at any given location. These are:
1) Concentration, which is affected by local, regional and global sources.
The total amount of mercury from non-local sources circulating freely in the Earth’s atmosphere at any given time constitutes the “global pool” of mercury. It is estimated that 95 per cent of the global pool is Hg0, and this mercury circulates for a period estimated at between 6 months to 2 years. Local contributions to mercury concentrations vary considerably across the planet and within the United States, depending upon the distance from the point of measurement to local and regional sources. Much of a local mercury contribution impacts local and/or regional deposition, especially if it is emitted in a reactive form (e.g., Hg2+).
2) Precipitation, which removes mercury from the atmosphere.
Precipitation essentially “flushes” mercury from the atmosphere. It is this mercury that is measured to determine our deposition data. In general, mercury concentrations appear to be higher when it

2
begins to rain or snow, and lower at the end of a precipitation event. This is most evident during periods of prolonged precipitation (i.e., over a period of several hours to several days).
3) Location with regard to proximity of local sources.
As stated above (Factor 1), local mercury concentrations vary considerably across the planet and within the United States, depending upon the distance from the point of measurement to local and regional sources. This factor also varies with wind direction, i.e., whether the sampling point is upwind or downwind of such sources at the time of sampling. In general, the closer a monitor is to a source, provided that it is downwind of that source, the higher the mercury concentration.
Atmospheric mercury concentrations also tend to be higher at positions near to and downwind of emitting sources. This is described as “local influence” with regard to higher mercury concentration and deposition measurements. These are the local contributions described above (under Factor 1) which impact local and/or regional deposition. Across Kansas, there can also be dramatic shifts in sources of the air coming in from out of state. For example, southeast Kansas is much more likely to receive tropical air from the south. Out west, flow is dominated by the flows from farther west (i.e., Pacific air, continental air, etc). This can exert a significant influence on what the atmosphere contains and what gets flushed out. Kansas sources include electrical generating units, cement kilns and mining operations. We do not yet have enough data to see whether effects of local and/or regional influences apply to Kansas, but this may become evident after several years of sampling. National Mercury Deposition Network Data The purpose of the MDN is to collect mercury deposition data over a long period of time to monitor trends in the levels of mercury deposited over the earth’s surface. Short term data analysis is difficult because of seasonal and year to year variability in precipitation amounts and mercury concentrations. Quality assurance of MDN data occurs at two levels. All data are first reviewed by the national contract laboratory for completeness and accuracy, and assigned codes for samples that were mishandled, contaminated, or affected by equipment malfunction. The final laboratory data set is then forwarded to the national MDN Program Office for final quality assurance before generation of annual concentration and deposition maps and posting to the Web. Data generated by the Kansas Mercury Deposition Network will be posted to the KDHE Web site as available and annually to a national database. Total mercury results are reported as:
1) Concentration, expressed in nanograms of mercury per liter (ng/L) of precipitation collected.
This is the amount of mercury present in the water collected by the sampler. Concentration measurements provide a long-term record of mercury levels in precipitation across the United States.
2) Total precipitation depth collected, expressed in millimeters (mm). This is the depth of snow or rain collected, which when multiplied by the concentration, gives total deposition of mercury to the surface. (See #3)
3) Deposition, expressed in micrograms of mercury per square meter (ug/m2).
This is the amount of mercury deposited by precipitation on each square meter of ground at the sampling site. The deposition numbers are important because they provide annual estimates of the amount of mercury loaded onto the surface of the earth in the vicinity of each sampling site. It is a

portion of this mercury which enters bodies of water and ultimately enters the food chain through aquatic systems.
National mercury data are summarized for each year by calculating the annual values from each site and plotting the information on a national map. The most recent national average concentration and total deposition maps (for calendar year 2008) appear in Figures 3 and 4. It is expected that all six Kansas sites will have collected enough data to appear on the 2009 maps, which are scheduled for publication by September 2010. A set of these MDN maps, dating back to 1998, can be found at http://nadp.sws.uiuc.edu/mdn/maps/ .
Figure 1
Figure 2
3

Description of the Kansas Mercury Wet Deposition Network The complete Kansas Mercury Wet Deposition Monitoring Network (KMDN) consists of six sites distributed across the state. The locations of existing and future sites in the states of Nebraska and Oklahoma were also taken into consideration to optimize regional mercury network coverage. A map of the network appears below in Figure 3.
Figure 3. Kansas Mercury Deposition Network
and sites in Nebraska and Oklahoma
4

5
Each site was chosen to meet particular criteria. Specific regional and local siting criteria must be met before any site is accepted into the national MDN. A major consideration, at both the state and national levels, was relatively even distribution of monitoring sites across Kansas. Some other considerations, especially of interest from the State’s perspective, were distance and direction to potential sources of airborne mercury, proximity to fish tissue monitoring locations, and distance to neighboring state boundaries. Mercury deposition sampling locations in the States of Oklahoma and Nebraska also affected placement of samplers in the network. Kansas Deposition Data for 2009 Sampling at all sites is performed on a weekly basis, with sample retrieval every Tuesday. Clean sample glassware is installed for collection of the next week’s sample at the time of the operator’s site visit. All samples are sent to a national contract laboratory utilized by the MDN. Sample analysis and coordination through this national cooperative research program are performed under contract. All currently available data from the KMDN appears below in Table 1. Preliminary data has been obtained through August 2009. These data sets have not been subjected to complete quality assurance procedures. The “raw” data may contain some values that could later be invalidated, but little change is expected and general conclusions can be made. The values shown are mercury deposition amounts expressed in ug/m2 per month. The annual mercury deposition maps (example in Figure 2 above) will express mercury deposition as ug/m2 per year. Monthly plots of mercury deposition at these sites in Kansas appear below as Figures 4 – 9. Table 1. Kansas Mercury Wet Deposition Data (Preliminary): Jan. – Aug. 2009 (ug/m2 per month) Site Jan. Feb. Mar. Apr. May Jun. Jul. Aug. Sep. Oct. Nov. Dec. Total
ug/m2
Sac & Fox Nation
0.05 0.13 0.86 1.68 0.57 3.79 0.88 1.32
9.3
Glen Elder
State Park 0.00 0.05 0.25 0.67 0.69 1.86 2.69 0.93
7.2
Lake Scott
State Park 0.03 0.05 0.05 1.27 0.49 0.99 1.44 1.09
5.4
Big Brutus
0.04 0.24 1.47 1.08 1.93 1.91 2.25 1.67
10.6
Cimarron National
Grassland 0.00 0.10 0.56 0.40 0.03 0.27 1.25 1.29
3.9
Coffey County
Lake 0.00 0.43 0.97 2.81 1.26 2.31 1.40 0.88
10.1
The year to date totals in the above table shows mercury deposition values with variations that we expect to see. KS03, KS04, and KS05 show higher deposition values that could be attributed to their location to possible Kansas sources as well as variations in precipitation and wind patterns. Direct conclusions can not be made as this is preliminary data and more data is needed from each site.
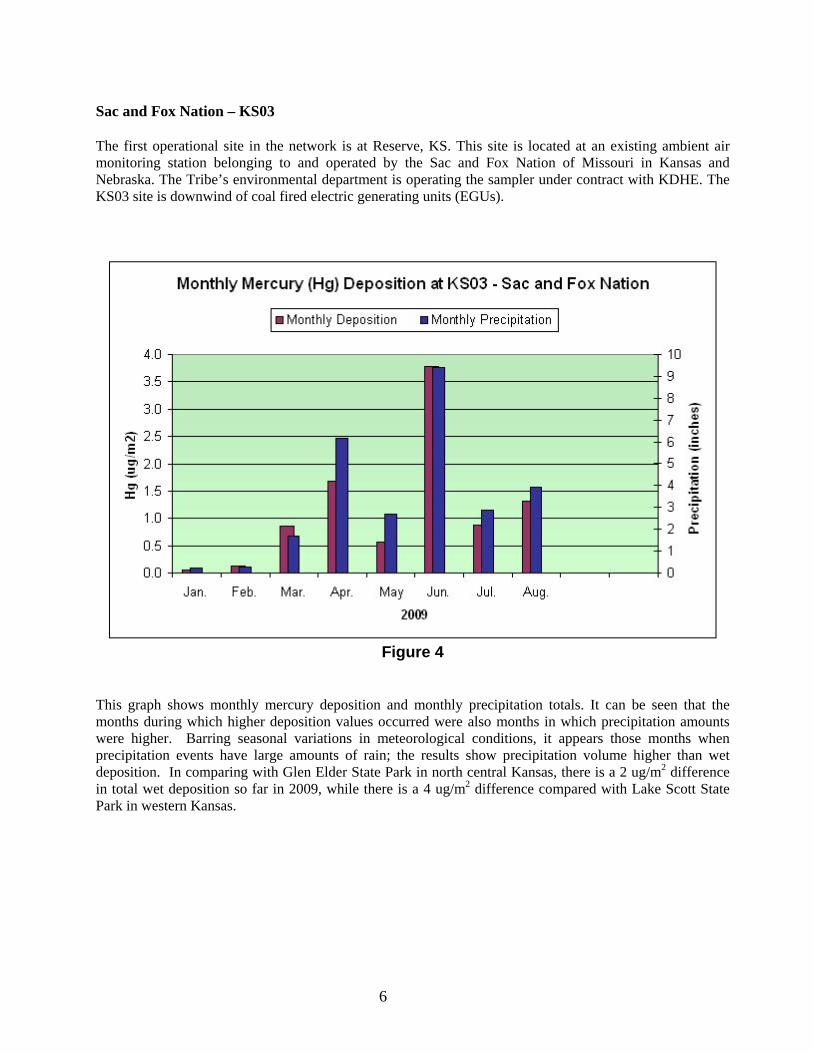
Sac and Fox Nation – KS03 The first operational site in the network is at Reserve, KS. This site is located at an existing ambient air monitoring station belonging to and operated by the Sac and Fox Nation of Missouri in Kansas and Nebraska. The Tribe’s environmental department is operating the sampler under contract with KDHE. The KS03 site is downwind of coal fired electric generating units (EGUs).
Figure 4
This graph shows monthly mercury deposition and monthly precipitation totals. It can be seen that the months during which higher deposition values occurred were also months in which precipitation amounts were higher. Barring seasonal variations in meteorological conditions, it appears those months when precipitation events have large amounts of rain; the results show precipitation volume higher than wet deposition. In comparing with Glen Elder State Park in north central Kansas, there is a 2 ug/m2 difference in total wet deposition so far in 2009, while there is a 4 ug/m2 difference compared with Lake Scott State Park in western Kansas.
6

Glen Elder State Park – KS24 The Kansas Department of Wildlife and Parks (KDWP) hosts two sites. The first site is at Glen Elder State Park, between Glen Elder and Cawker City, KS. This site fills in a gap in the north central part of the state and is in proximity to fish tissue sampling in alternate years. KS24 is operated by KDWP personnel.
Figure 5
Less seasonal variation is evident in the graph of data from the site at Glen Elder State Park (KS24) presented in Figure 5. In this case, deposition values do not consistently vary with precipitation amounts. This difference in seasonality may be due, in part, to differences in precipitation patterns and amounts from site to site across Kansas. The direction and distance to various emission sources with regard to prevailing winds may also play a significant role. In comparing with our Coffey County Lake and Big Brutus sites, where precipitation events are more abundant, Glen Elder State Park shows a total wet deposition that is noticeably less.
7
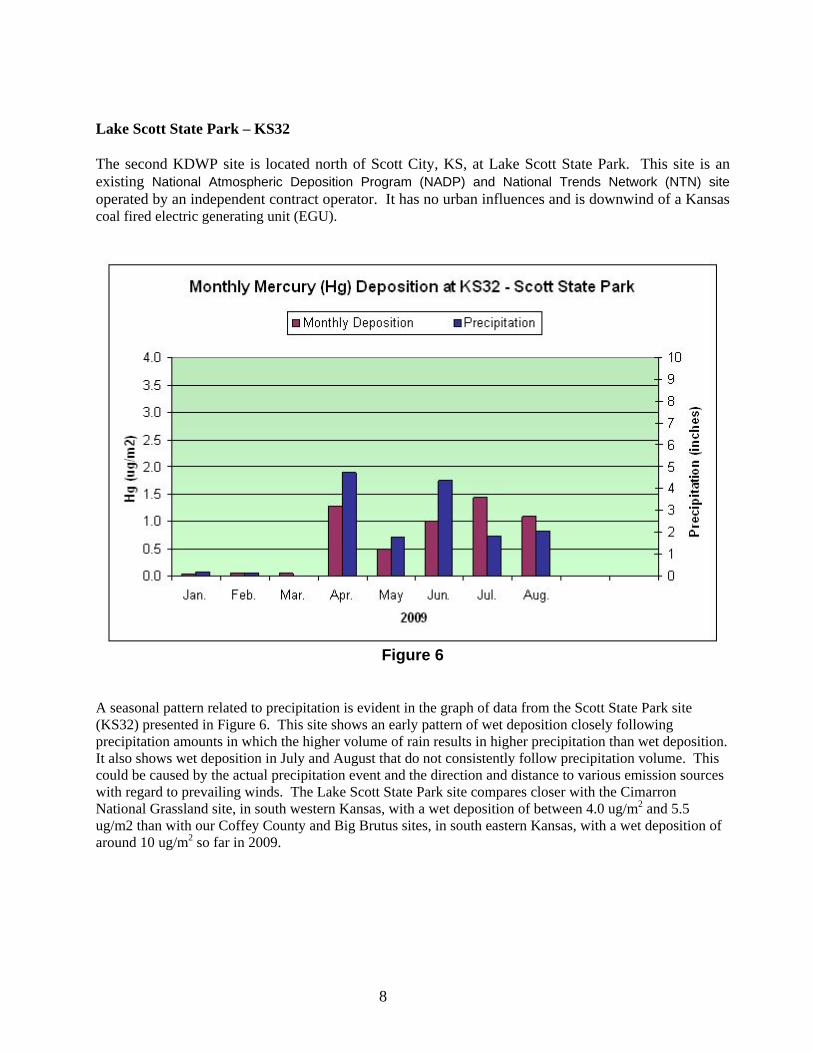
Lake Scott State Park – KS32 The second KDWP site is located north of Scott City, KS, at Lake Scott State Park. This site is an existing National Atmospheric Deposition Program (NADP) and National Trends Network (NTN) site operated by an independent contract operator. It has no urban influences and is downwind of a Kansas coal fired electric generating unit (EGU).
Figure 6
A seasonal pattern related to precipitation is evident in the graph of data from the Scott State Park site (KS32) presented in Figure 6. This site shows an early pattern of wet deposition closely following precipitation amounts in which the higher volume of rain results in higher precipitation than wet deposition. It also shows wet deposition in July and August that do not consistently follow precipitation volume. This could be caused by the actual precipitation event and the direction and distance to various emission sources with regard to prevailing winds. The Lake Scott State Park site compares closer with the Cimarron National Grassland site, in south western Kansas, with a wet deposition of between 4.0 ug/m2 and 5.5 ug/m2 than with our Coffey County and Big Brutus sites, in south eastern Kansas, with a wet deposition of around 10 ug/m2 so far in 2009.
8

Big Brutus, Inc – KS04 The fourth KMDN site is located near West Mineral, KS, at the Big Brutus Museum. This site is in proximity to an interpolated “hot spot” on national MDN maps. It is downwind of Kansas cement kilns and is hosted and operated by Big Brutus, Inc.
Figure 7 Seasonal variability is evident in the graph of data from the Big Brutus site (KS04) presented in Figure 7. It can be seen that the months during which higher deposition values occurred were also months in which precipitation amounts were higher. Barring seasonal variations in meteorological conditions, it appears those months when precipitation events have large amounts of rain; the results show precipitation volume higher than wet deposition. Consistent with our other eastern Kansas sites, the Big Brutus site shows higher wet deposition of mercury than our western sites.
9
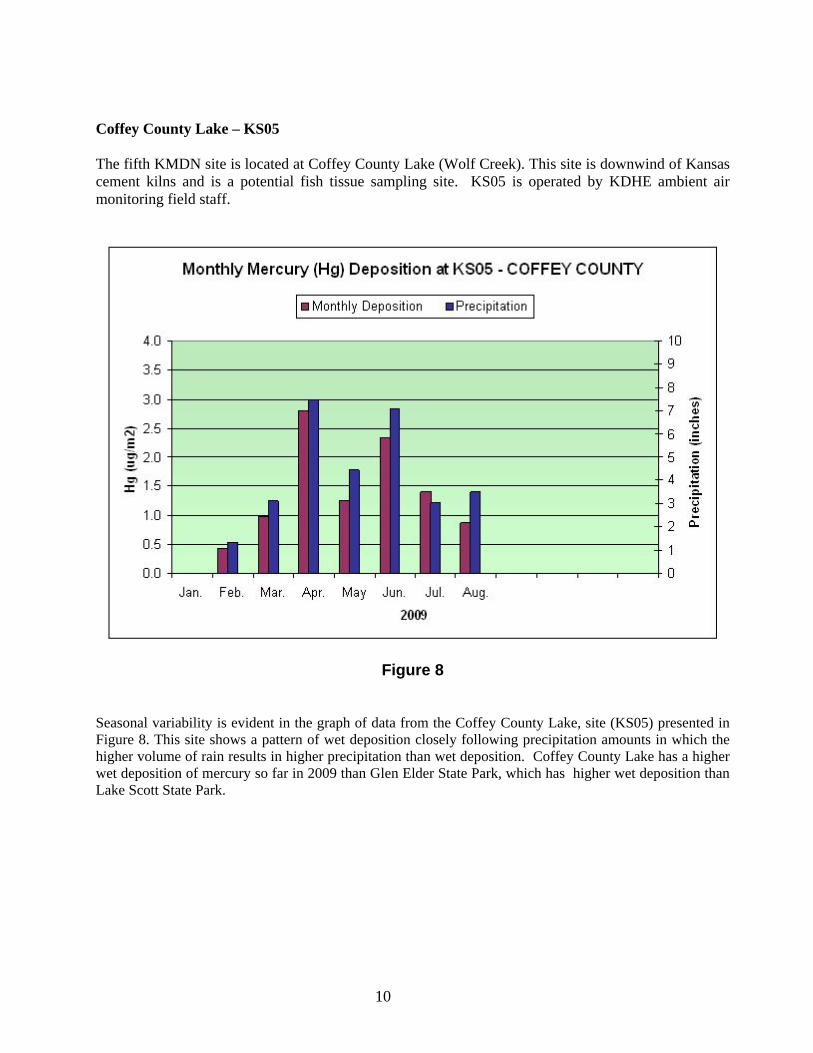
Coffey County Lake – KS05 The fifth KMDN site is located at Coffey County Lake (Wolf Creek). This site is downwind of Kansas cement kilns and is a potential fish tissue sampling site. KS05 is operated by KDHE ambient air monitoring field staff.
Figure 8 Seasonal variability is evident in the graph of data from the Coffey County Lake, site (KS05) presented in Figure 8. This site shows a pattern of wet deposition closely following precipitation amounts in which the higher volume of rain results in higher precipitation than wet deposition. Coffey County Lake has a higher wet deposition of mercury so far in 2009 than Glen Elder State Park, which has higher wet deposition than Lake Scott State Park.
10

Cimarron National Grassland – KS99 The United States Department of Agriculture hosts the sixth and final KMDN site, which is located at the Cimarron National Grassland near Elkhart, KS. This site is a remote site with no urban influences and gap fills the national network around Kansas, Oklahoma, and Colorado. KS99 is operated by personnel at the Cimarron National Grassland.
Figure 9 Less seasonal variation is evident in the graph of data from the site at Cimarron National Grassland (KS99) presented in Figure 9. In this case, deposition values do not consistently vary with precipitation amounts. This difference in seasonality may be due, in part, to differences in precipitation patterns and amounts from site to site across Kansas. Compared to the other five Kansas sites, Cimarron National Grasslands has less wet deposition of mercury so far in 2009. With the small amount of data collected, it’s hard to determine any conclusions.
11

12
Network Cost Analysis Costs associated with the KMDN are presented in Table 2 below. All costs are covered by Air Fee Fund revenues. This table is divided into a section for network development, and a section for the cost of the operation in 2009. The costs associated with network development include all capital equipment purchases as well as site preparation costs. This is the first year we had all six sites in operation, so the 2010 operating cost will be similar to the 2009 total. Table 2. Kansas Mercury Wet Deposition Network Costs Kansas Mercury Deposition Network Development Costs: June 1, 2007 – Dec. 31, 2008
Cost Category Item Description Cost Each
Qty.
Total Cost
Category Totals
Salaries and Fringes $35,537 $35,537
Equipment MDN Collector $4,748 6 $28,488
Digital Precipitation Gauge $5,640 5 $28,200
Precipitation Gauge Windscreen $640 1 $640 Communications Device (PDA) $300 6 $1,800 Total Capital Equipment $59,128
Training On-site MDN Training $1,400 1 $1,400
Total Training $1,400
Site Development Material $300 6 $1,800
Travel (Average = $0.45/mile) $0.45 6,996 $3,148
Installation of Electrical Service $1,010
Total Site Development $5,958
Total Network Development Cost $102,023
Kansas Mercury Deposition Network Operating Costs: Jan. 1, 2009 – Dec. 31, 2009
Cost Category Item Description Category Totals
Salaries and Fringes $28,909
Supplies Low toxicity antifreeze $33
Operator and Site Use Fees $22,500
Travel Travel ($0.505/mile) $254
Shipping Samples to Laboratory $15,000
Laboratory Analysis Mercury Analysis $66,432
Total Operating Cost $133,128
Looking Ahead Next year will represent the second full year of sampling across the entire KMDN. It is expected that all six Kansas sites will have collected enough data to appear on the 2009 national MDN maps, which are scheduled for publication by September 2010. After several years of data have accumulated, it should be possible to begin to evaluate trends in atmospheric mercury concentrations over Kansas. If certain sampling sites appear as “hot spots” with concentrations or deposition levels that are significantly higher than surrounding sites, possible contributing sources and atmospheric conditions will be evaluated.

APPENDIX F

Figure A.1. Correlation Matrix for 2005 O3 Measurements in Kansas

Figure A.2. Correlation Matrix for 2006 O3 Measurements in Kansas

Figure A.3. Correlation Matrix for 2007 O3 Measurements in Kansas
APPENDIX G

Figure B.1. Correlation Matrix for 2005 PM2.5 Measurements in Kansas
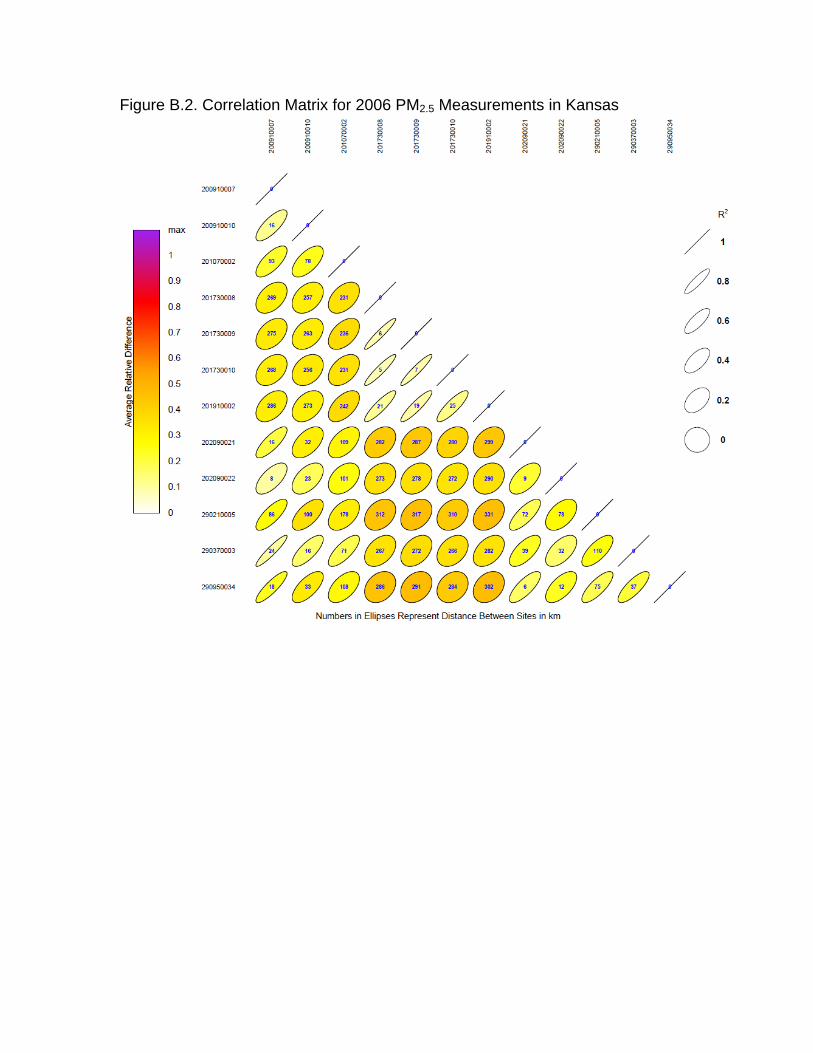
Figure B.2. Correlation Matrix for 2006 PM2.5 Measurements in Kansas

Figure B.3. Correlation Matrix for 2007 PM2.5 Measurements in Kansas

APPENDIX H

Figure A.1. Correlation Matrix for 2005 PM10 Measurements in Kansas

Figure A.2. Correlation Matrix for 2006 PM10 Measurements in Kansas

Figure A.3. Correlation Matrix for 2007 PM10 Measurements in Kansas

APPENDIX I

2005 PM2.5 Emissions Density

2005 PM10 Emission Density

2005 VOC Emissions Density

NOx Emissions Density

NH3 Emissions Density

SO2 Emissions Density

CO Emissions Density